Spray, OR
Spray Map
Spray Overview
199
TOTAL POPULATION
111
MALE POPULATION
88
FEMALE POPULATION
126.14
MALES / 100 FEMALES
79.28
FEMALES / 100 MALES
45.9
MEDIAN AGE
3.0
AVG FAMILY SIZE
2.2
AVG HOUSEHOLD SIZE
$20,473
PER CAPITA INCOME
$75,000
AVG FAMILY INCOME
$30,469
AVG HOUSEHOLD INCOME
0.42
INEQUALITY / GINI INDEX
59
LABOR FORCE [ PEOPLE ]
35.8%
PERCENT IN LABOR FORCE
10.2%
UNEMPLOYMENT RATE
Spray Zip Codes
Spray Area Codes
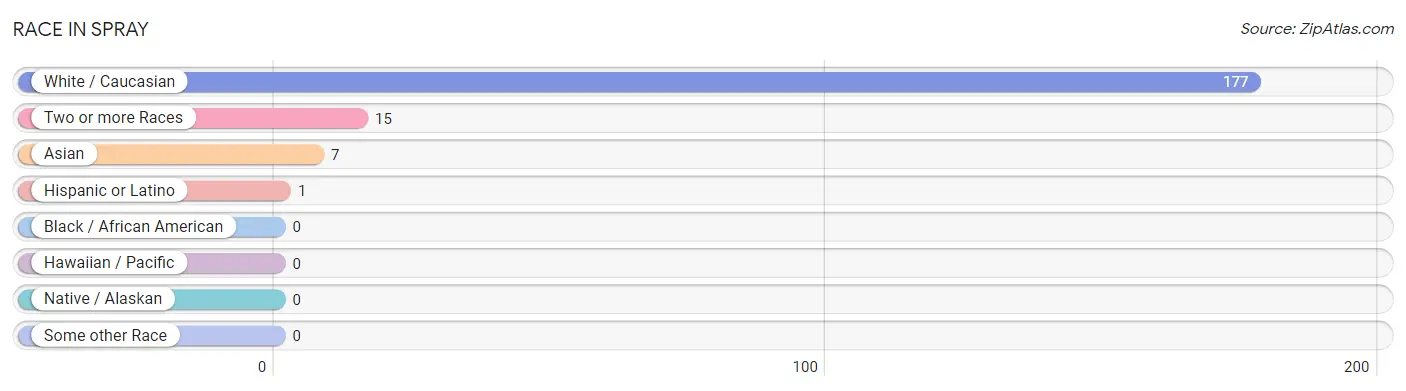
Race in Spray
The most populous races in Spray are White / Caucasian (177 | 88.9%), Two or more Races (15 | 7.5%), and Asian (7 | 3.5%).
| Race | # Population | % Population |
| Asian | 7 | 3.5% |
| Black / African American | 0 | 0.0% |
| Hawaiian / Pacific | 0 | 0.0% |
| Hispanic or Latino | 1 | 0.5% |
| Native / Alaskan | 0 | 0.0% |
| White / Caucasian | 177 | 88.9% |
| Two or more Races | 15 | 7.5% |
| Some other Race | 0 | 0.0% |
| Total | 199 | 100.0% |
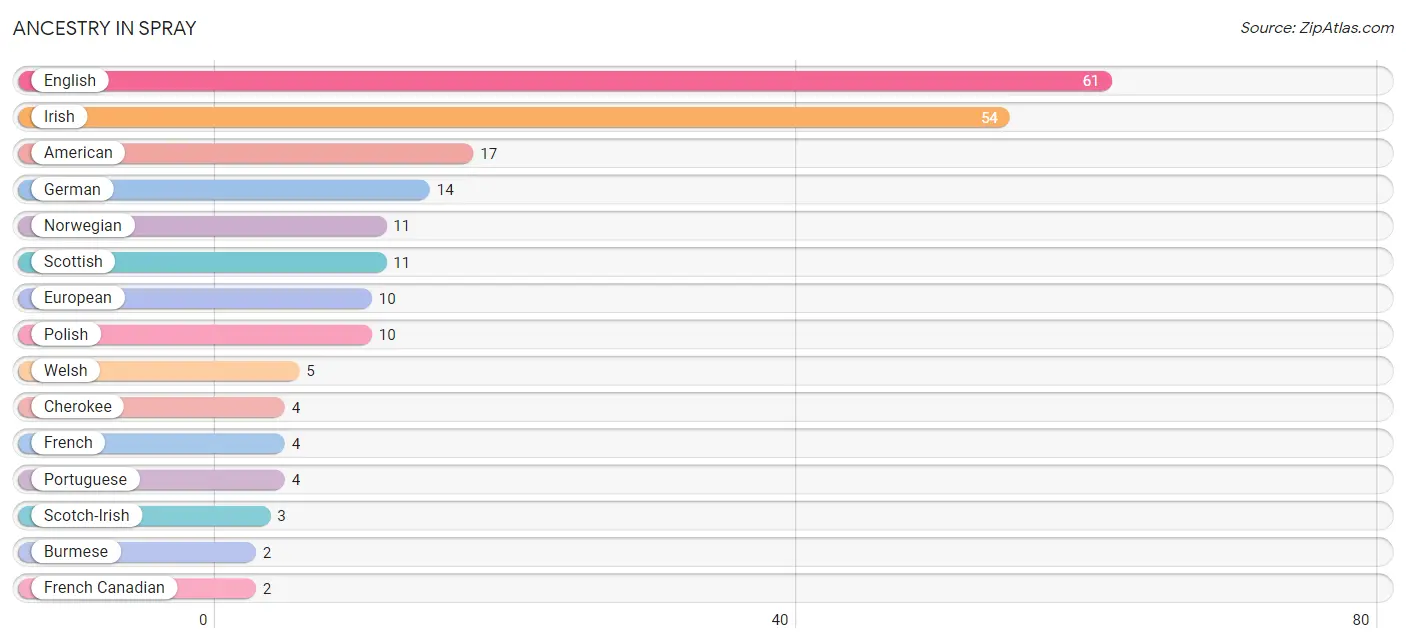
Ancestry in Spray
The most populous ancestries reported in Spray are English (61 | 30.6%), Irish (54 | 27.1%), American (17 | 8.5%), German (14 | 7.0%), and Norwegian (11 | 5.5%), together accounting for 78.9% of all Spray residents.
| Ancestry | # Population | % Population |
| American | 17 | 8.5% |
| Armenian | 1 | 0.5% |
| Brazilian | 1 | 0.5% |
| Burmese | 2 | 1.0% |
| Canadian | 1 | 0.5% |
| Cherokee | 4 | 2.0% |
| Czechoslovakian | 1 | 0.5% |
| Dutch | 1 | 0.5% |
| English | 61 | 30.6% |
| European | 10 | 5.0% |
| Filipino | 1 | 0.5% |
| French | 4 | 2.0% |
| French Canadian | 2 | 1.0% |
| German | 14 | 7.0% |
| Greek | 1 | 0.5% |
| Indian (Asian) | 1 | 0.5% |
| Irish | 54 | 27.1% |
| Israeli | 1 | 0.5% |
| Italian | 1 | 0.5% |
| Mexican | 1 | 0.5% |
| Norwegian | 11 | 5.5% |
| Pakistani | 2 | 1.0% |
| Polish | 10 | 5.0% |
| Portuguese | 4 | 2.0% |
| Russian | 1 | 0.5% |
| Scotch-Irish | 3 | 1.5% |
| Scottish | 11 | 5.5% |
| Sri Lankan | 1 | 0.5% |
| Swiss | 1 | 0.5% |
| Ukrainian | 1 | 0.5% |
| Welsh | 5 | 2.5% | View All 31 Rows |
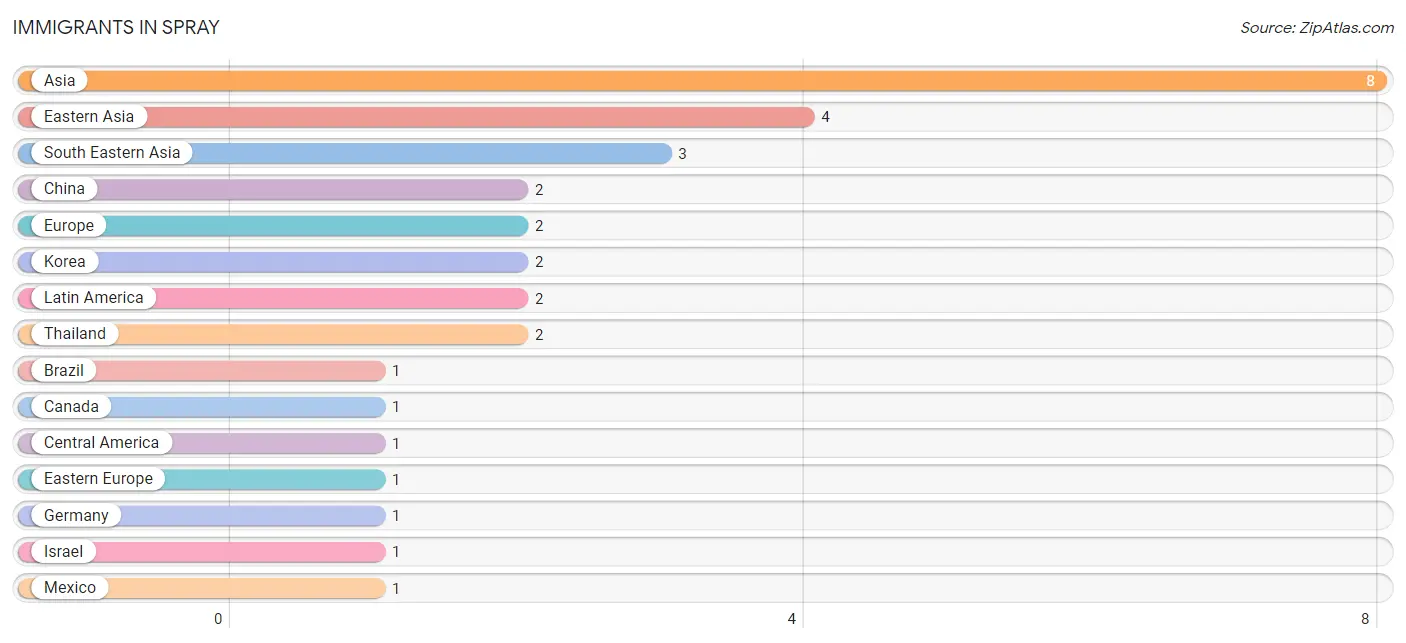
Immigrants in Spray
The most numerous immigrant groups reported in Spray came from Asia (8 | 4.0%), Eastern Asia (4 | 2.0%), South Eastern Asia (3 | 1.5%), China (2 | 1.0%), and Europe (2 | 1.0%), together accounting for 9.6% of all Spray residents.
| Immigration Origin | # Population | % Population |
| Asia | 8 | 4.0% |
| Brazil | 1 | 0.5% |
| Canada | 1 | 0.5% |
| Central America | 1 | 0.5% |
| China | 2 | 1.0% |
| Eastern Asia | 4 | 2.0% |
| Eastern Europe | 1 | 0.5% |
| Europe | 2 | 1.0% |
| Germany | 1 | 0.5% |
| Israel | 1 | 0.5% |
| Korea | 2 | 1.0% |
| Latin America | 2 | 1.0% |
| Mexico | 1 | 0.5% |
| Russia | 1 | 0.5% |
| South America | 1 | 0.5% |
| South Eastern Asia | 3 | 1.5% |
| Taiwan | 1 | 0.5% |
| Thailand | 2 | 1.0% |
| Vietnam | 1 | 0.5% |
| Western Asia | 1 | 0.5% |
| Western Europe | 1 | 0.5% | View All 21 Rows |
Sex and Age in Spray
Sex and Age in Spray
The most populous age groups in Spray are 55 to 59 Years (14 | 12.6%) for men and 60 to 64 Years (14 | 15.9%) for women.

| Age Bracket | Male | Female |
| Under 5 Years | 13 (11.7%) | 12 (13.6%) |
| 5 to 9 Years | 0 (0.0%) | 2 (2.3%) |
| 10 to 14 Years | 4 (3.6%) | 3 (3.4%) |
| 15 to 19 Years | 9 (8.1%) | 9 (10.2%) |
| 20 to 24 Years | 1 (0.9%) | 1 (1.1%) |
| 25 to 29 Years | 8 (7.2%) | 9 (10.2%) |
| 30 to 34 Years | 8 (7.2%) | 5 (5.7%) |
| 35 to 39 Years | 10 (9.0%) | 2 (2.3%) |
| 40 to 44 Years | 0 (0.0%) | 0 (0.0%) |
| 45 to 49 Years | 6 (5.4%) | 0 (0.0%) |
| 50 to 54 Years | 0 (0.0%) | 0 (0.0%) |
| 55 to 59 Years | 14 (12.6%) | 4 (4.5%) |
| 60 to 64 Years | 0 (0.0%) | 14 (15.9%) |
| 65 to 69 Years | 9 (8.1%) | 4 (4.5%) |
| 70 to 74 Years | 11 (9.9%) | 11 (12.5%) |
| 75 to 79 Years | 8 (7.2%) | 5 (5.7%) |
| 80 to 84 Years | 8 (7.2%) | 7 (8.0%) |
| 85 Years and over | 2 (1.8%) | 0 (0.0%) |
| Total | 111 (100.0%) | 88 (100.0%) |
Families and Households in Spray
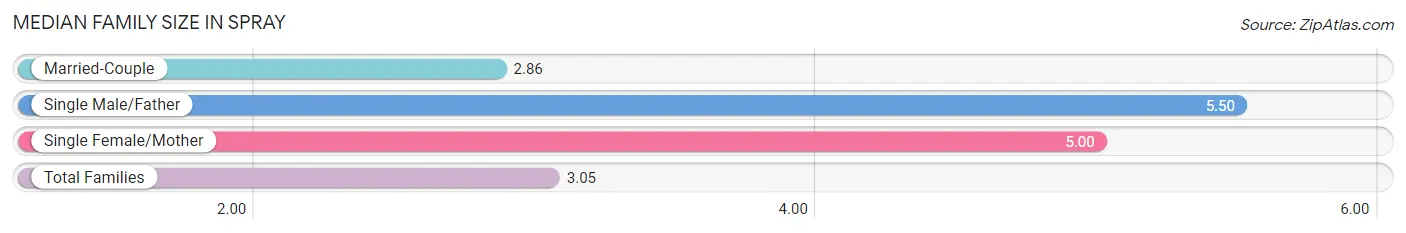
Median Family Size in Spray
The median family size in Spray is 3.05 persons per family, with single male/father families (2 | 5.3%) accounting for the largest median family size of 5.5 persons per family. On the other hand, married-couple families (35 | 92.1%) represent the smallest median family size with 2.86 persons per family.
| Family Type | # Families | Family Size |
| Married-Couple | 35 (92.1%) | 2.86 |
| Single Male/Father | 2 (5.3%) | 5.50 |
| Single Female/Mother | 1 (2.6%) | 5.00 |
| Total Families | 38 (100.0%) | 3.05 |
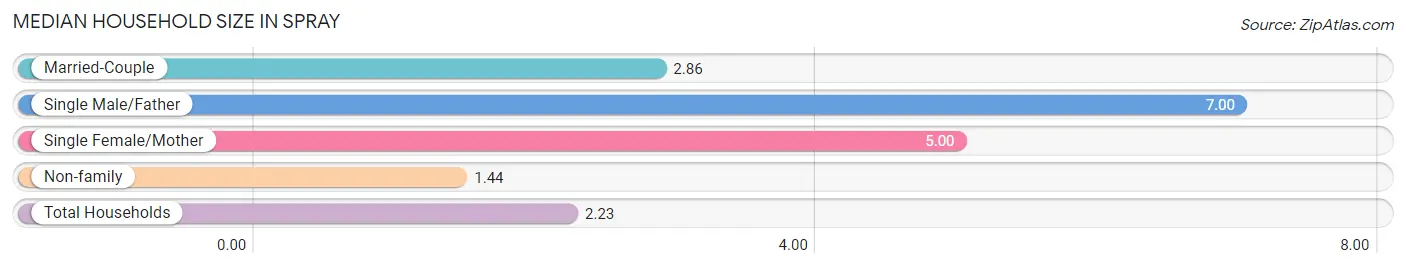
Median Household Size in Spray
The median household size in Spray is 2.23 persons per household, with single male/father households (2 | 2.5%) accounting for the largest median household size of 7 persons per household. non-family households (43 | 53.1%) represent the smallest median household size with 1.44 persons per household.
| Household Type | # Households | Household Size |
| Married-Couple | 35 (43.2%) | 2.86 |
| Single Male/Father | 2 (2.5%) | 7.00 |
| Single Female/Mother | 1 (1.2%) | 5.00 |
| Non-family | 43 (53.1%) | 1.44 |
| Total Households | 81 (100.0%) | 2.23 |
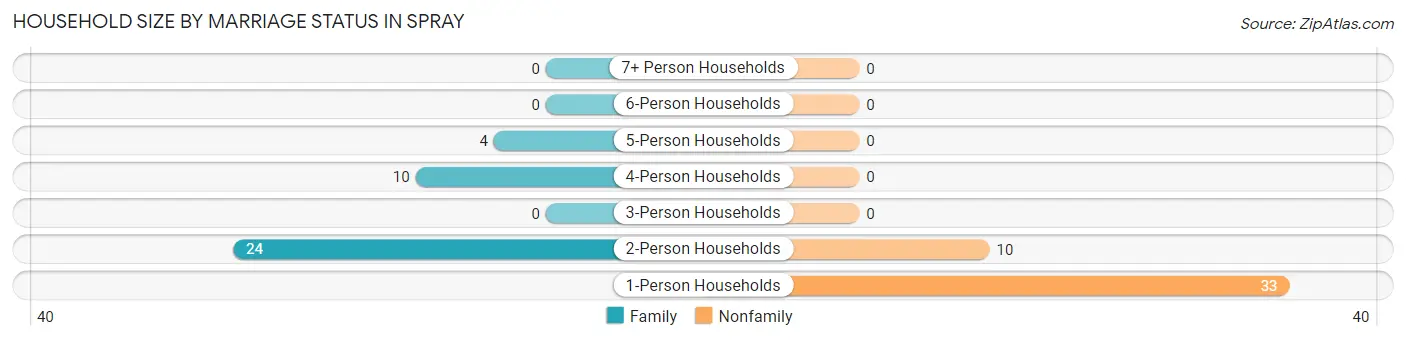
Household Size by Marriage Status in Spray
Out of a total of 81 households in Spray, 38 (46.9%) are family households, while 43 (53.1%) are nonfamily households. The most numerous type of family households are 2-person households, comprising 24, and the most common type of nonfamily households are 1-person households, comprising 33.
| Household Size | Family Households | Nonfamily Households |
| 1-Person Households | - | 33 (40.7%) |
| 2-Person Households | 24 (29.6%) | 10 (12.3%) |
| 3-Person Households | 0 (0.0%) | 0 (0.0%) |
| 4-Person Households | 10 (12.3%) | 0 (0.0%) |
| 5-Person Households | 4 (4.9%) | 0 (0.0%) |
| 6-Person Households | 0 (0.0%) | 0 (0.0%) |
| 7+ Person Households | 0 (0.0%) | 0 (0.0%) |
| Total | 38 (46.9%) | 43 (53.1%) |
Female Fertility in Spray
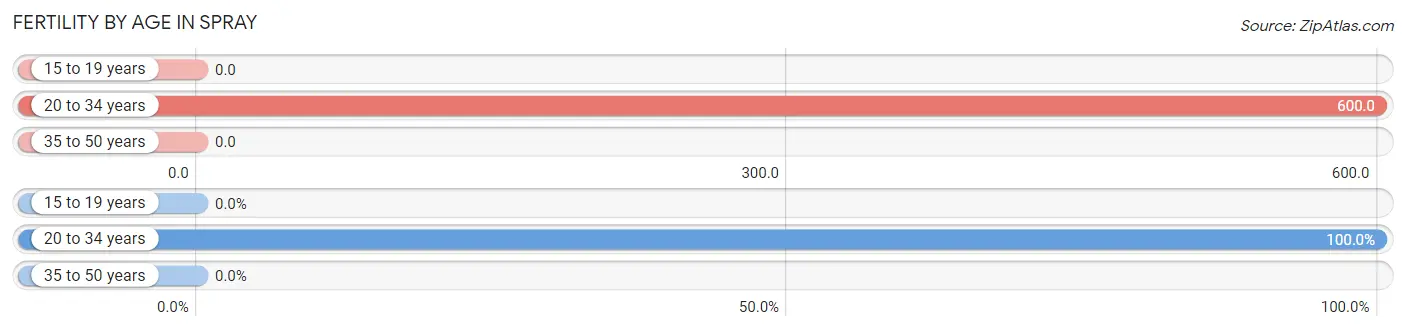
Fertility by Age in Spray
Average fertility rate in Spray is 346.0 births per 1,000 women. Women in the age bracket of 20 to 34 years have the highest fertility rate with 600.0 births per 1,000 women. Women in the age bracket of 20 to 34 years acount for 100.0% of all women with births.
| Age Bracket | Women with Births | Births / 1,000 Women |
| 15 to 19 years | 0 (0.0%) | 0.0 |
| 20 to 34 years | 9 (100.0%) | 600.0 |
| 35 to 50 years | 0 (0.0%) | 0.0 |
| Total | 9 (100.0%) | 346.0 |
Fertility by Age by Marriage Status in Spray
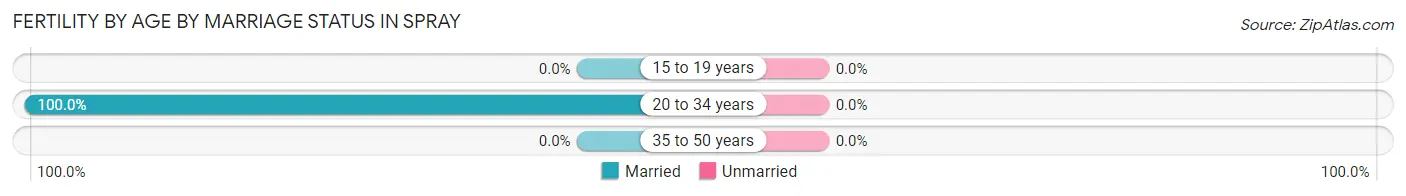
| Age Bracket | Married | Unmarried |
| 15 to 19 years | 0 (0.0%) | 0 (0.0%) |
| 20 to 34 years | 9 (100.0%) | 0 (0.0%) |
| 35 to 50 years | 0 (0.0%) | 0 (0.0%) |
| Total | 9 (100.0%) | 0 (0.0%) |
Fertility by Education in Spray
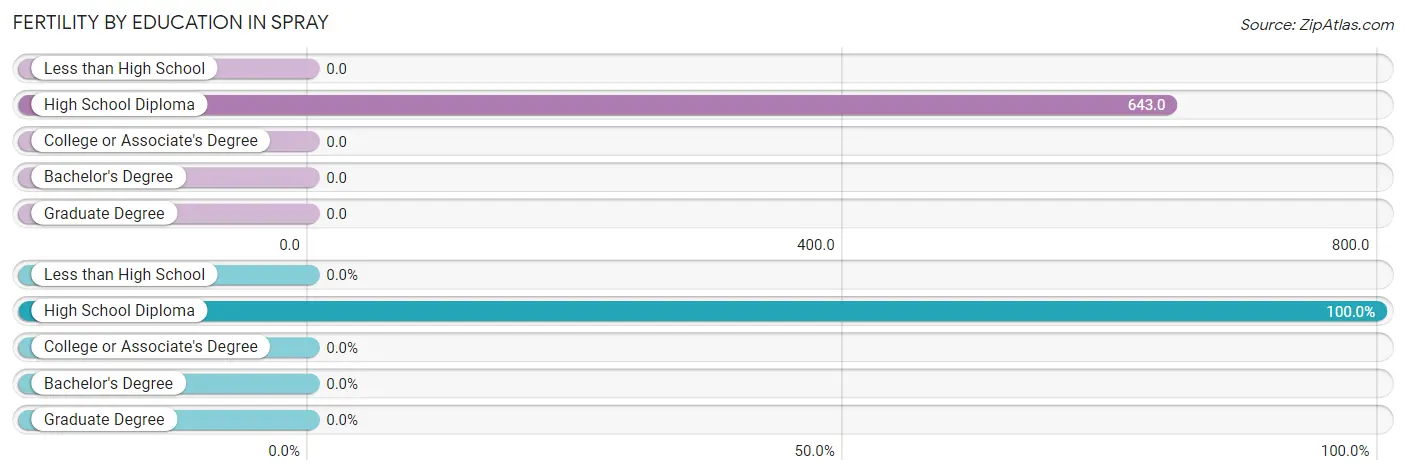
| Educational Attainment | Women with Births | Births / 1,000 Women |
| Less than High School | 0 (0.0%) | 0.0 |
| High School Diploma | 9 (100.0%) | 643.0 |
| College or Associate's Degree | 0 (0.0%) | 0.0 |
| Bachelor's Degree | 0 (0.0%) | 0.0 |
| Graduate Degree | 0 (0.0%) | 0.0 |
| Total | 9 (100.0%) | 346.0 |
Fertility by Education by Marriage Status in Spray
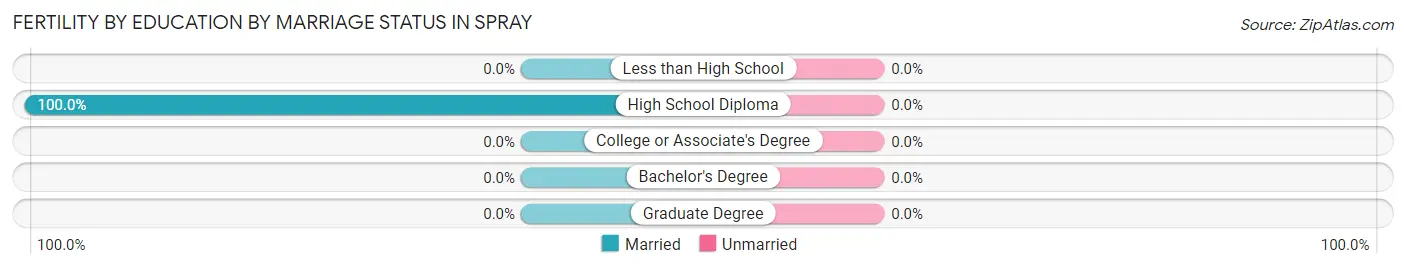
| Educational Attainment | Married | Unmarried |
| Less than High School | 0 (0.0%) | 0 (0.0%) |
| High School Diploma | 9 (100.0%) | 0 (0.0%) |
| College or Associate's Degree | 0 (0.0%) | 0 (0.0%) |
| Bachelor's Degree | 0 (0.0%) | 0 (0.0%) |
| Graduate Degree | 0 (0.0%) | 0 (0.0%) |
| Total | 9 (100.0%) | 0 (0.0%) |
Income in Spray
Income Overview in Spray
Per Capita Income in Spray is $20,473, while median incomes of families and households are $75,000 and $30,469 respectively.
| Characteristic | Number | Measure |
| Per Capita Income | 199 | $20,473 |
| Median Family Income | 38 | $75,000 |
| Mean Family Income | 38 | $77,729 |
| Median Household Income | 81 | $30,469 |
| Mean Household Income | 81 | $48,656 |
| Income Deficit | 38 | $0 |
| Wage / Income Gap (%) | 199 | 0.00% |
| Wage / Income Gap ($) | 199 | 100.00¢ per $1 |
| Gini / Inequality Index | 199 | 0.42 |
Earnings by Sex in Spray
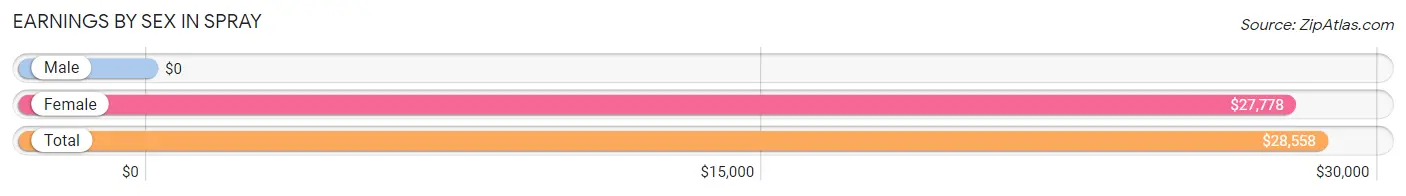
| Sex | Number | Average Earnings |
| Male | 41 (59.4%) | $0 |
| Female | 28 (40.6%) | $27,778 |
| Total | 69 (100.0%) | $28,558 |
Earnings by Sex by Income Bracket in Spray
The most common earnings brackets in Spray are $65,000 to $74,999 for men (9 | 22.0%) and $25,000 to $29,999 for women (9 | 32.1%).
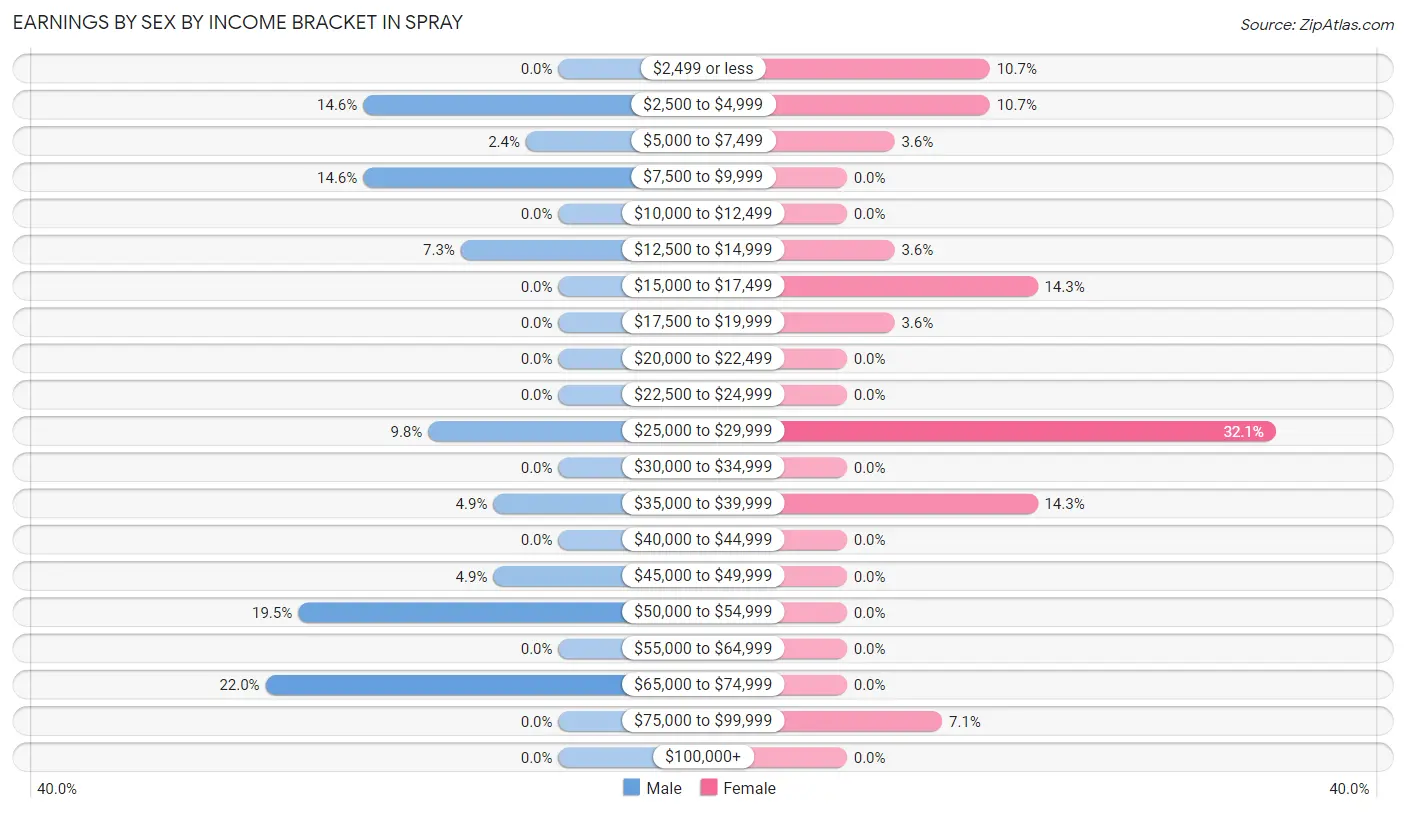
| Income | Male | Female |
| $2,499 or less | 0 (0.0%) | 3 (10.7%) |
| $2,500 to $4,999 | 6 (14.6%) | 3 (10.7%) |
| $5,000 to $7,499 | 1 (2.4%) | 1 (3.6%) |
| $7,500 to $9,999 | 6 (14.6%) | 0 (0.0%) |
| $10,000 to $12,499 | 0 (0.0%) | 0 (0.0%) |
| $12,500 to $14,999 | 3 (7.3%) | 1 (3.6%) |
| $15,000 to $17,499 | 0 (0.0%) | 4 (14.3%) |
| $17,500 to $19,999 | 0 (0.0%) | 1 (3.6%) |
| $20,000 to $22,499 | 0 (0.0%) | 0 (0.0%) |
| $22,500 to $24,999 | 0 (0.0%) | 0 (0.0%) |
| $25,000 to $29,999 | 4 (9.8%) | 9 (32.1%) |
| $30,000 to $34,999 | 0 (0.0%) | 0 (0.0%) |
| $35,000 to $39,999 | 2 (4.9%) | 4 (14.3%) |
| $40,000 to $44,999 | 0 (0.0%) | 0 (0.0%) |
| $45,000 to $49,999 | 2 (4.9%) | 0 (0.0%) |
| $50,000 to $54,999 | 8 (19.5%) | 0 (0.0%) |
| $55,000 to $64,999 | 0 (0.0%) | 0 (0.0%) |
| $65,000 to $74,999 | 9 (22.0%) | 0 (0.0%) |
| $75,000 to $99,999 | 0 (0.0%) | 2 (7.1%) |
| $100,000+ | 0 (0.0%) | 0 (0.0%) |
| Total | 41 (100.0%) | 28 (100.0%) |
Earnings by Sex by Educational Attainment in Spray
Average earnings in Spray are $41,250 for men and $28,333 for women, a difference of 31.3%. Men with an educational attainment of college or associate's degree enjoy the highest average annual earnings of $43,750, while those with college or associate's degree education earn the least with $43,750. Women with an educational attainment of high school diploma earn the most with the average annual earnings of $28,056, while those with high school diploma education have the smallest earnings of $28,056.
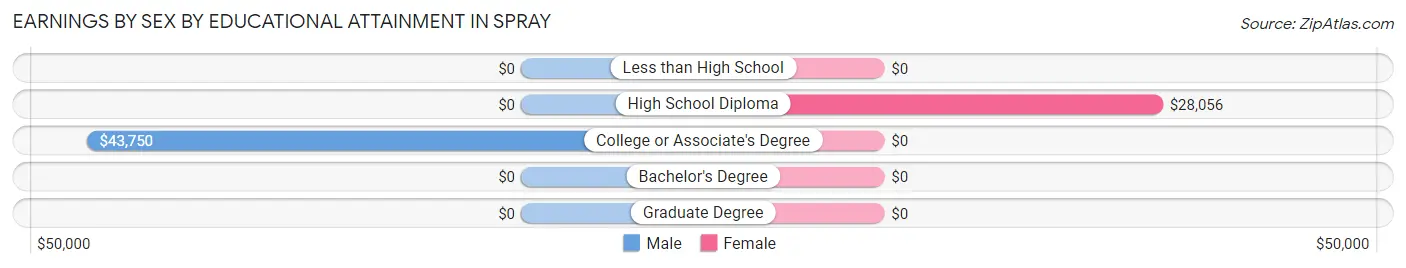
| Educational Attainment | Male Income | Female Income |
| Less than High School | - | - |
| High School Diploma | - | - |
| College or Associate's Degree | $43,750 | $0 |
| Bachelor's Degree | - | - |
| Graduate Degree | - | - |
| Total | $41,250 | $28,333 |
Family Income in Spray
Family Income Brackets in Spray
According to the Spray family income data, there are 10 families falling into the $75,000 to $99,999 income range, which is the most common income bracket and makes up 26.3% of all families.
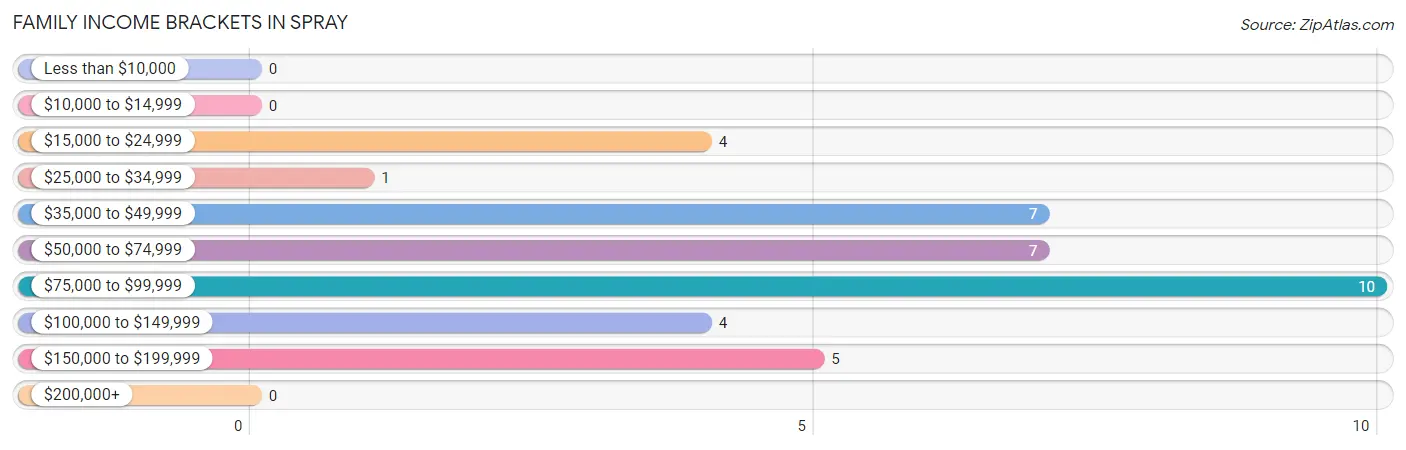
| Income Bracket | # Families | % Families |
| Less than $10,000 | 0 | 0.0% |
| $10,000 to $14,999 | 0 | 0.0% |
| $15,000 to $24,999 | 4 | 10.5% |
| $25,000 to $34,999 | 1 | 2.6% |
| $35,000 to $49,999 | 7 | 18.4% |
| $50,000 to $74,999 | 7 | 18.4% |
| $75,000 to $99,999 | 10 | 26.3% |
| $100,000 to $149,999 | 4 | 10.5% |
| $150,000 to $199,999 | 5 | 13.2% |
| $200,000+ | 0 | 0.0% |
Family Income by Famaliy Size in Spray
4-person families (12 | 31.6%) account for the highest median family income in Spray with $78,125 per family, while 2-person families (24 | 63.2%) have the highest median income of $35,312 per family member.
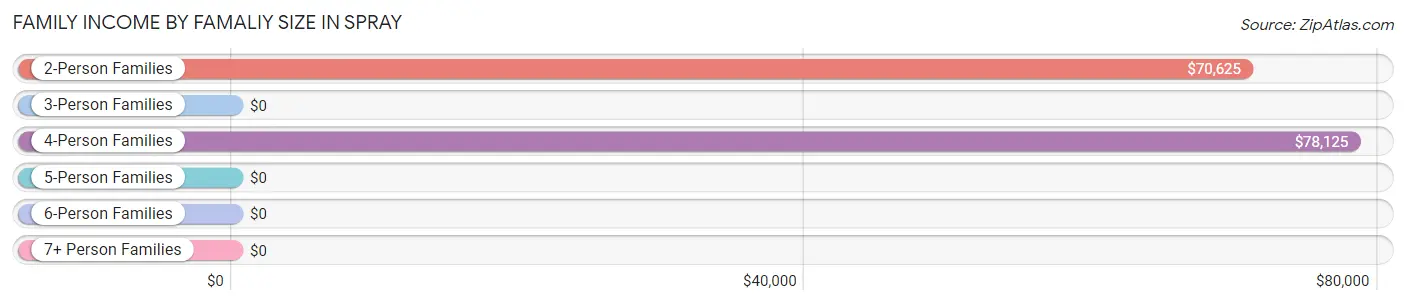
| Income Bracket | # Families | Median Income |
| 2-Person Families | 24 (63.2%) | $70,625 |
| 3-Person Families | 0 (0.0%) | $0 |
| 4-Person Families | 12 (31.6%) | $78,125 |
| 5-Person Families | 2 (5.3%) | $0 |
| 6-Person Families | 0 (0.0%) | $0 |
| 7+ Person Families | 0 (0.0%) | $0 |
| Total | 38 (100.0%) | $75,000 |
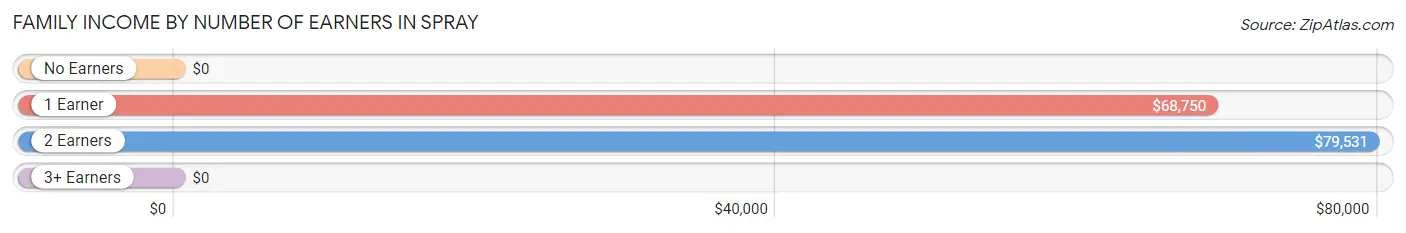
Family Income by Number of Earners in Spray
| Number of Earners | # Families | Median Income |
| No Earners | 7 (18.4%) | $0 |
| 1 Earner | 14 (36.8%) | $68,750 |
| 2 Earners | 17 (44.7%) | $79,531 |
| 3+ Earners | 0 (0.0%) | $0 |
| Total | 38 (100.0%) | $75,000 |
Household Income in Spray
Household Income Brackets in Spray
With 19 households falling in the category, the $25,000 to $34,999 income range is the most frequent in Spray, accounting for 23.5% of all households.
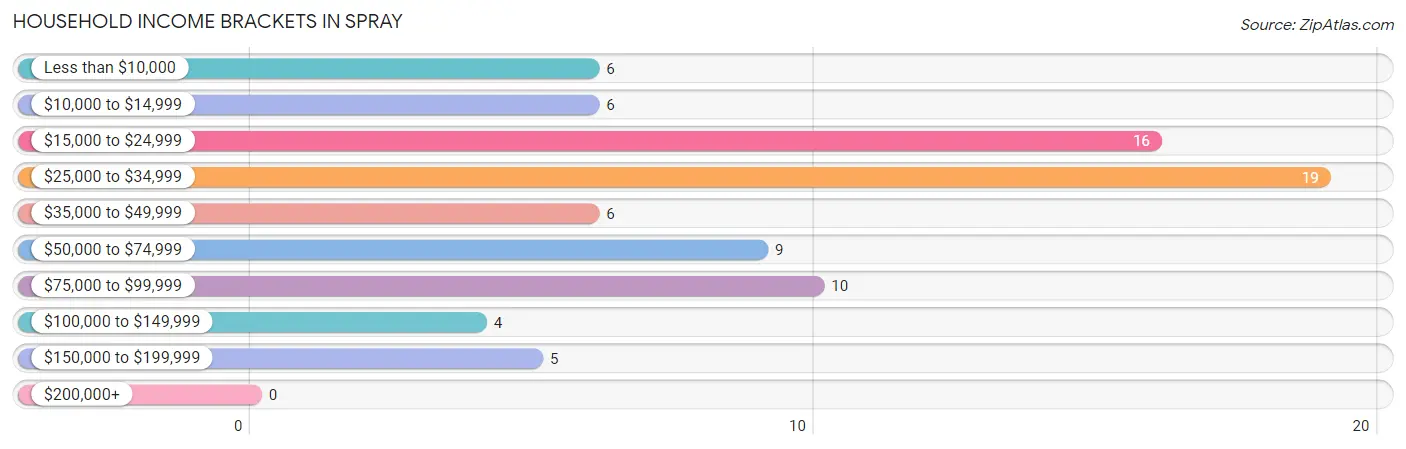
| Income Bracket | # Households | % Households |
| Less than $10,000 | 6 | 7.4% |
| $10,000 to $14,999 | 6 | 7.4% |
| $15,000 to $24,999 | 16 | 19.8% |
| $25,000 to $34,999 | 19 | 23.5% |
| $35,000 to $49,999 | 6 | 7.4% |
| $50,000 to $74,999 | 9 | 11.1% |
| $75,000 to $99,999 | 10 | 12.3% |
| $100,000 to $149,999 | 4 | 4.9% |
| $150,000 to $199,999 | 5 | 6.2% |
| $200,000+ | 0 | 0.0% |
Household Income by Householder Age in Spray
The median household income in Spray is $30,469, with the highest median household income of $70,000 found in the 25 to 44 years age bracket for the primary householder. A total of 20 households (24.7%) fall into this category.
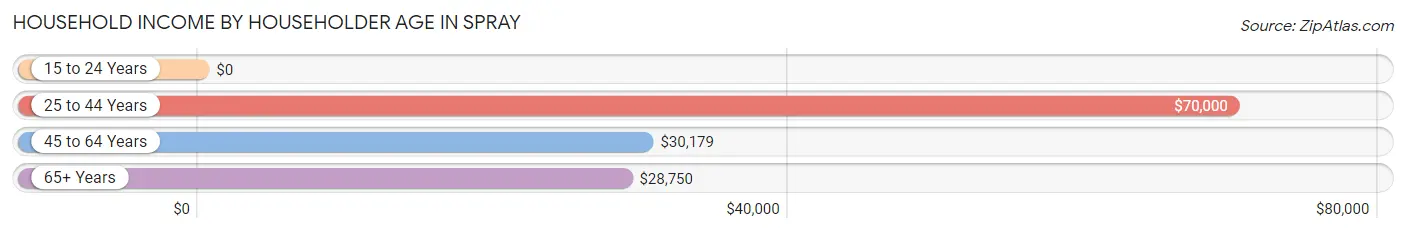
| Income Bracket | # Households | Median Income |
| 15 to 24 Years | 0 (0.0%) | $0 |
| 25 to 44 Years | 20 (24.7%) | $70,000 |
| 45 to 64 Years | 21 (25.9%) | $30,179 |
| 65+ Years | 40 (49.4%) | $28,750 |
| Total | 81 (100.0%) | $30,469 |
Poverty in Spray
Income Below Poverty by Sex and Age in Spray
With 13.6% poverty level for males and 20.5% for females among the residents of Spray, 35 to 44 year old males and 75 year old and over females are the most vulnerable to poverty, with 8 males (80.0%) and 6 females (50.0%) in their respective age groups living below the poverty level.
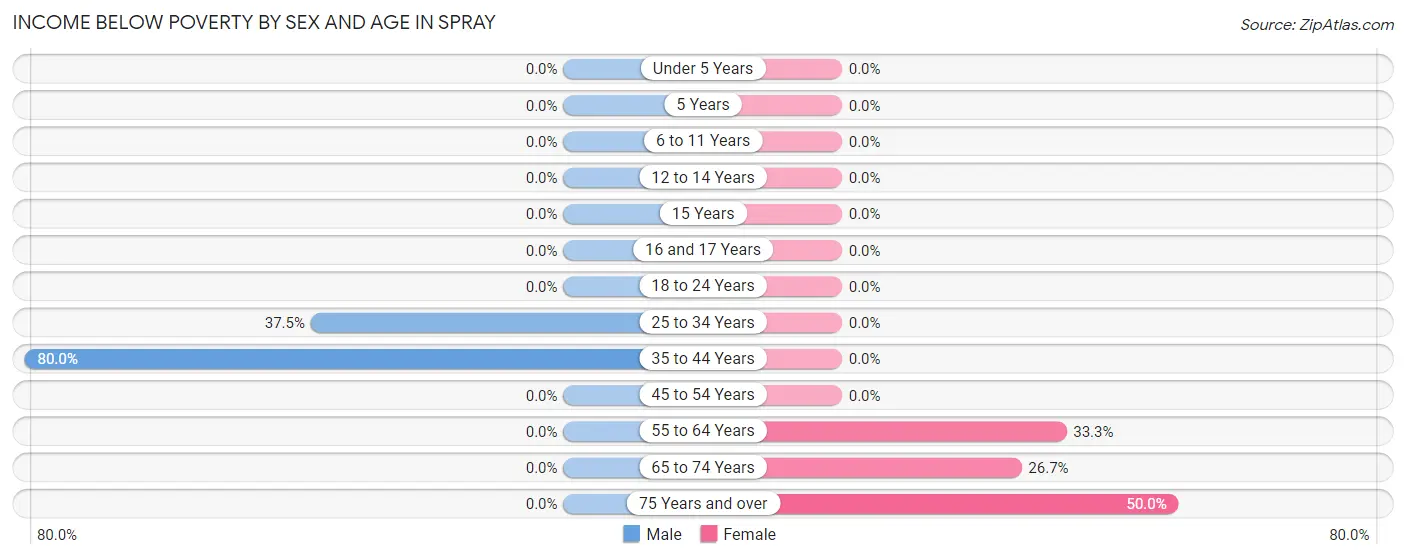
| Age Bracket | Male | Female |
| Under 5 Years | 0 (0.0%) | 0 (0.0%) |
| 5 Years | 0 (0.0%) | 0 (0.0%) |
| 6 to 11 Years | 0 (0.0%) | 0 (0.0%) |
| 12 to 14 Years | 0 (0.0%) | 0 (0.0%) |
| 15 Years | 0 (0.0%) | 0 (0.0%) |
| 16 and 17 Years | 0 (0.0%) | 0 (0.0%) |
| 18 to 24 Years | 0 (0.0%) | 0 (0.0%) |
| 25 to 34 Years | 6 (37.5%) | 0 (0.0%) |
| 35 to 44 Years | 8 (80.0%) | 0 (0.0%) |
| 45 to 54 Years | 0 (0.0%) | 0 (0.0%) |
| 55 to 64 Years | 0 (0.0%) | 6 (33.3%) |
| 65 to 74 Years | 0 (0.0%) | 4 (26.7%) |
| 75 Years and over | 0 (0.0%) | 6 (50.0%) |
| Total | 14 (13.6%) | 16 (20.5%) |
Income Above Poverty by Sex and Age in Spray
According to the poverty statistics in Spray, males aged under 5 years and females aged under 5 years are the age groups that are most secure financially, with 100.0% of males and 100.0% of females in these age groups living above the poverty line.
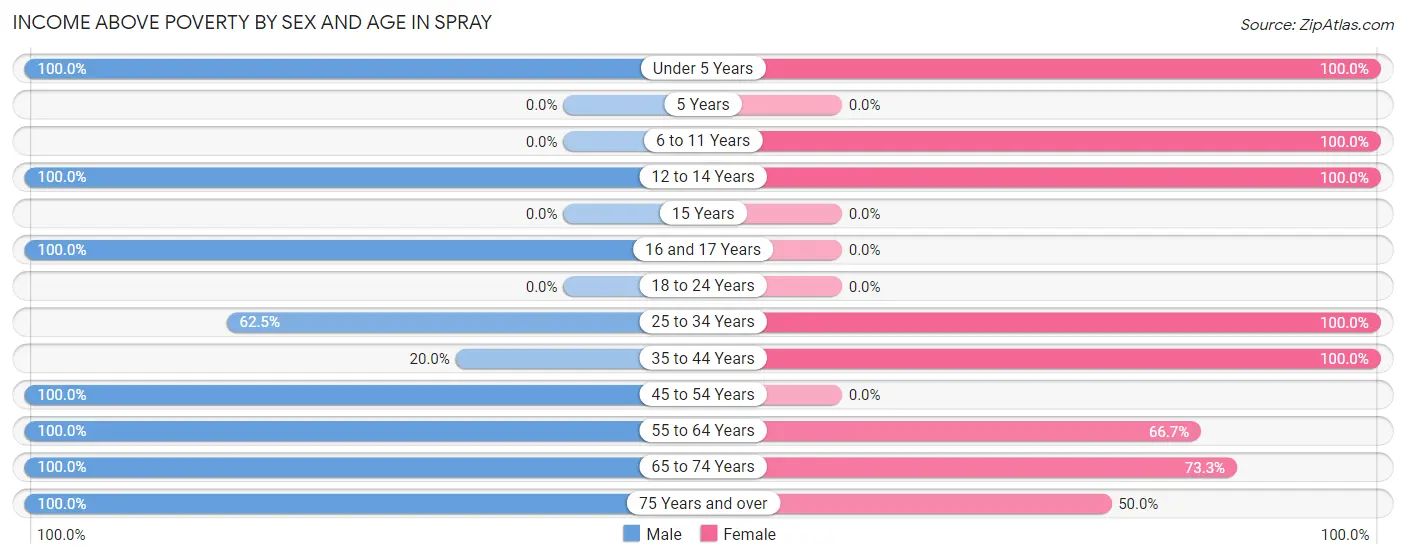
| Age Bracket | Male | Female |
| Under 5 Years | 13 (100.0%) | 12 (100.0%) |
| 5 Years | 0 (0.0%) | 0 (0.0%) |
| 6 to 11 Years | 0 (0.0%) | 2 (100.0%) |
| 12 to 14 Years | 4 (100.0%) | 3 (100.0%) |
| 15 Years | 0 (0.0%) | 0 (0.0%) |
| 16 and 17 Years | 2 (100.0%) | 0 (0.0%) |
| 18 to 24 Years | 0 (0.0%) | 0 (0.0%) |
| 25 to 34 Years | 10 (62.5%) | 14 (100.0%) |
| 35 to 44 Years | 2 (20.0%) | 2 (100.0%) |
| 45 to 54 Years | 6 (100.0%) | 0 (0.0%) |
| 55 to 64 Years | 14 (100.0%) | 12 (66.7%) |
| 65 to 74 Years | 20 (100.0%) | 11 (73.3%) |
| 75 Years and over | 18 (100.0%) | 6 (50.0%) |
| Total | 89 (86.4%) | 62 (79.5%) |
Income Below Poverty Among Married-Couple Families in Spray
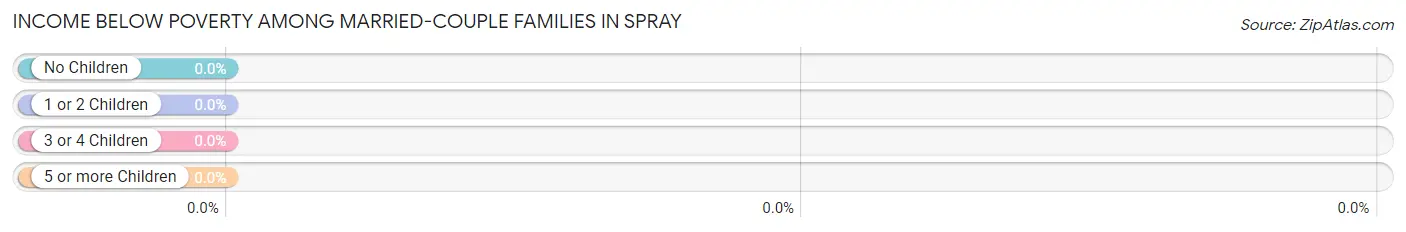
| Children | Above Poverty | Below Poverty |
| No Children | 23 (100.0%) | 0 (0.0%) |
| 1 or 2 Children | 10 (100.0%) | 0 (0.0%) |
| 3 or 4 Children | 2 (100.0%) | 0 (0.0%) |
| 5 or more Children | 0 (0.0%) | 0 (0.0%) |
| Total | 35 (100.0%) | 0 (0.0%) |
Income Below Poverty Among Single-Parent Households in Spray
| Children | Single Father | Single Mother |
| No Children | 0 (0.0%) | 0 (0.0%) |
| 1 or 2 Children | 0 (0.0%) | 0 (0.0%) |
| 3 or 4 Children | 0 (0.0%) | 0 (0.0%) |
| 5 or more Children | 0 (0.0%) | 0 (0.0%) |
| Total | 0 (0.0%) | 0 (0.0%) |
Income Below Poverty Among Married-Couple vs Single-Parent Households in Spray
| Children | Married-Couple Families | Single-Parent Households |
| No Children | 0 (0.0%) | 0 (0.0%) |
| 1 or 2 Children | 0 (0.0%) | 0 (0.0%) |
| 3 or 4 Children | 0 (0.0%) | 0 (0.0%) |
| 5 or more Children | 0 (0.0%) | 0 (0.0%) |
| Total | 0 (0.0%) | 0 (0.0%) |
Employment Characteristics in Spray
Employment by Class of Employer in Spray
Among the 53 employed individuals in Spray, state government employees (19 | 35.8%), not-for-profit organizations (15 | 28.3%), and self-employed (not incorporated) (6 | 11.3%) make up the most common classes of employment.
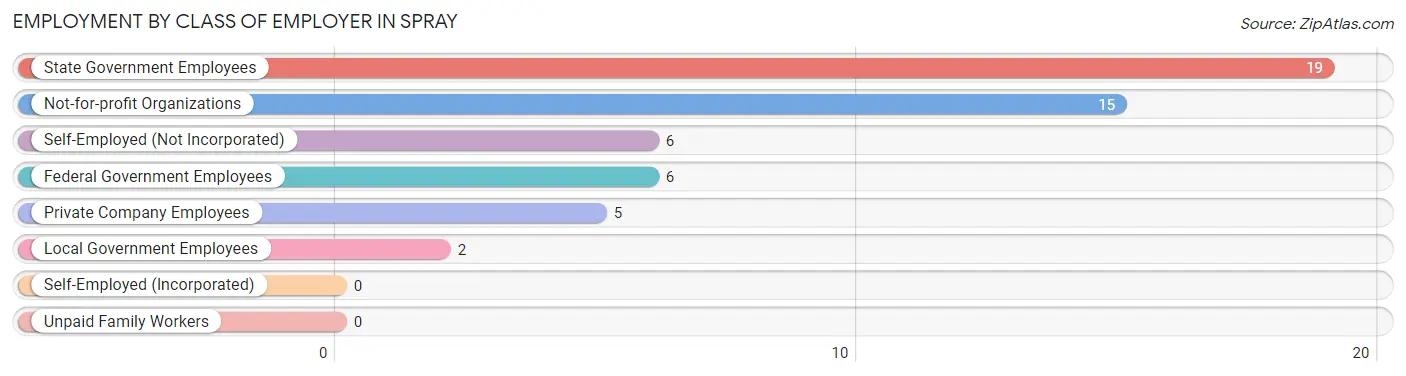
| Employer Class | # Employees | % Employees |
| Private Company Employees | 5 | 9.4% |
| Self-Employed (Incorporated) | 0 | 0.0% |
| Self-Employed (Not Incorporated) | 6 | 11.3% |
| Not-for-profit Organizations | 15 | 28.3% |
| Local Government Employees | 2 | 3.8% |
| State Government Employees | 19 | 35.8% |
| Federal Government Employees | 6 | 11.3% |
| Unpaid Family Workers | 0 | 0.0% |
| Total | 53 | 100.0% |
Employment Status by Age in Spray
According to the labor force statistics for Spray, out of the total population over 16 years of age (165), 35.8% or 59 individuals are in the labor force, with 10.2% or 6 of them unemployed. The age group with the highest labor force participation rate is 20 to 24 years, with 100.0% or 2 individuals in the labor force. Within the labor force, the 60 to 64 years age range has the highest percentage of unemployed individuals, with 85.7% or 6 of them being unemployed.
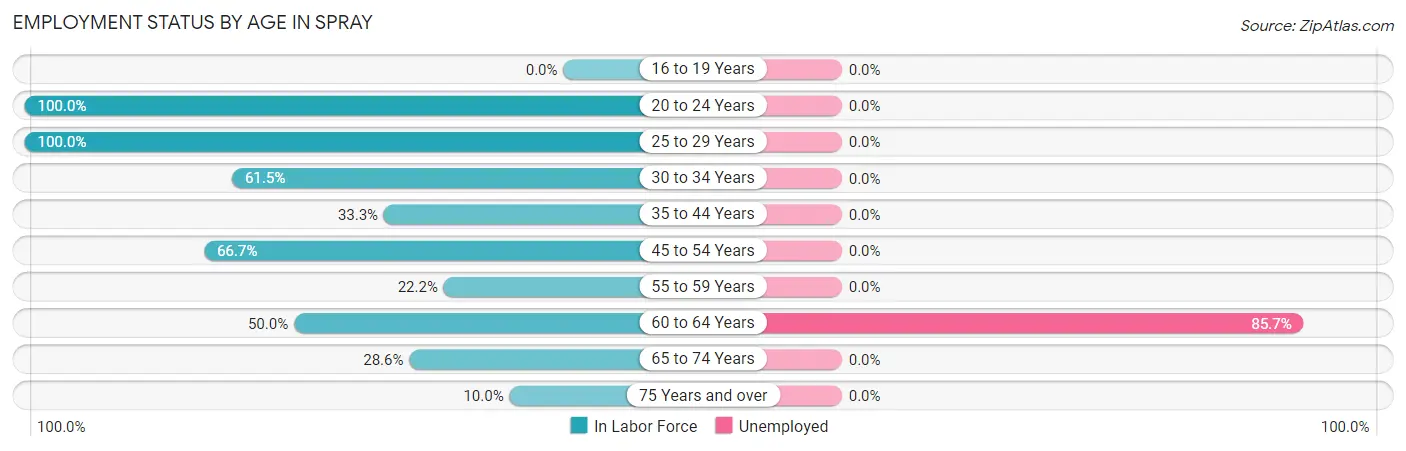
| Age Bracket | In Labor Force | Unemployed |
| 16 to 19 Years | 0 (0.0%) | 0 (0.0%) |
| 20 to 24 Years | 2 (100.0%) | 0 (0.0%) |
| 25 to 29 Years | 17 (100.0%) | 0 (0.0%) |
| 30 to 34 Years | 8 (61.5%) | 0 (0.0%) |
| 35 to 44 Years | 4 (33.3%) | 0 (0.0%) |
| 45 to 54 Years | 4 (66.7%) | 0 (0.0%) |
| 55 to 59 Years | 4 (22.2%) | 0 (0.0%) |
| 60 to 64 Years | 7 (50.0%) | 6 (85.7%) |
| 65 to 74 Years | 10 (28.6%) | 0 (0.0%) |
| 75 Years and over | 3 (10.0%) | 0 (0.0%) |
| Total | 59 (35.8%) | 6 (10.2%) |
Employment Status by Educational Attainment in Spray
According to labor force statistics for Spray, 55.0% of individuals (44) out of the total population between 25 and 64 years of age (80) are in the labor force, with 13.6% or 6 of them being unemployed. The group with the highest labor force participation rate are those with the educational attainment of bachelor's degree or higher, with 100.0% or 10 individuals in the labor force. Within the labor force, individuals with college / associate degree education have the highest percentage of unemployment, with 27.3% or 6 of them being unemployed.
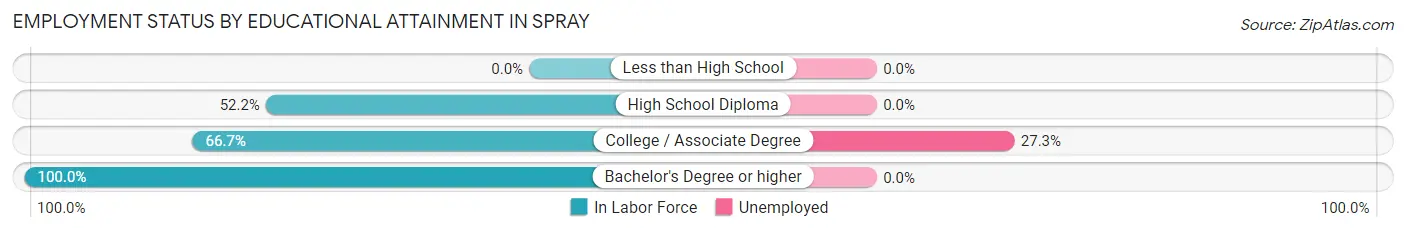
| Educational Attainment | In Labor Force | Unemployed |
| Less than High School | 0 (0.0%) | 0 (0.0%) |
| High School Diploma | 12 (52.2%) | 0 (0.0%) |
| College / Associate Degree | 22 (66.7%) | 9 (27.3%) |
| Bachelor's Degree or higher | 10 (100.0%) | 0 (0.0%) |
| Total | 44 (55.0%) | 11 (13.6%) |
Employment Occupations by Sex in Spray
Management, Business, Science and Arts Occupations
The most common Management, Business, Science and Arts occupations in Spray are Community & Social Service (26 | 49.1%), Education Instruction & Library (19 | 35.8%), Education, Arts & Media (4 | 7.5%), and Arts, Media & Entertainment (3 | 5.7%).
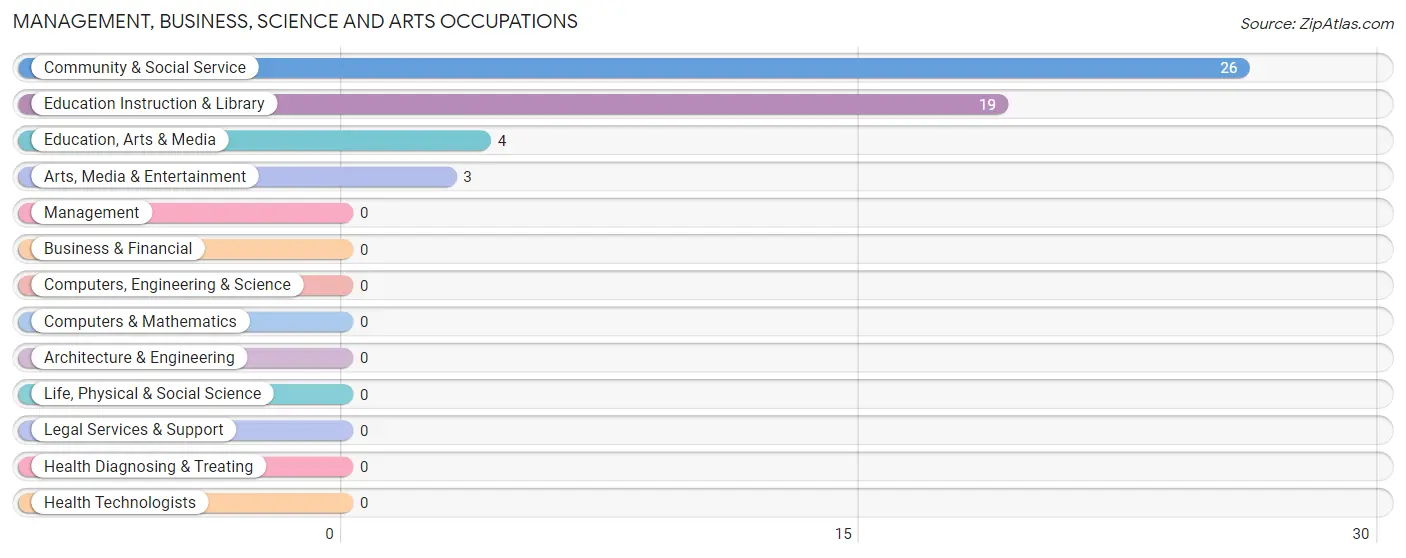
Management, Business, Science and Arts Occupations by Sex
Within the Management, Business, Science and Arts occupations in Spray, the most male-oriented occupations are Education Instruction & Library (52.6%), and Community & Social Service (38.5%), while the most female-oriented occupations are Education, Arts & Media (100.0%), Arts, Media & Entertainment (100.0%), and Community & Social Service (61.5%).
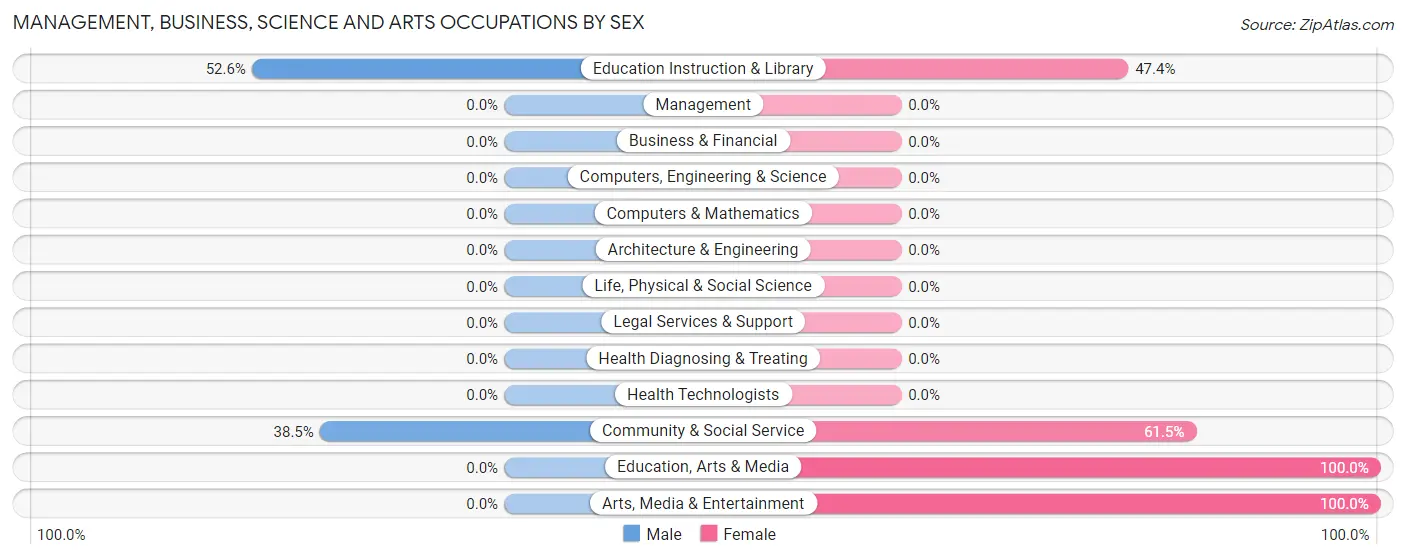
| Occupation | Male | Female |
| Management | 0 (0.0%) | 0 (0.0%) |
| Business & Financial | 0 (0.0%) | 0 (0.0%) |
| Computers, Engineering & Science | 0 (0.0%) | 0 (0.0%) |
| Computers & Mathematics | 0 (0.0%) | 0 (0.0%) |
| Architecture & Engineering | 0 (0.0%) | 0 (0.0%) |
| Life, Physical & Social Science | 0 (0.0%) | 0 (0.0%) |
| Community & Social Service | 10 (38.5%) | 16 (61.5%) |
| Education, Arts & Media | 0 (0.0%) | 4 (100.0%) |
| Legal Services & Support | 0 (0.0%) | 0 (0.0%) |
| Education Instruction & Library | 10 (52.6%) | 9 (47.4%) |
| Arts, Media & Entertainment | 0 (0.0%) | 3 (100.0%) |
| Health Diagnosing & Treating | 0 (0.0%) | 0 (0.0%) |
| Health Technologists | 0 (0.0%) | 0 (0.0%) |
| Total (Category) | 10 (38.5%) | 16 (61.5%) |
| Total (Overall) | 33 (62.3%) | 20 (37.7%) |
Services Occupations
The most common Services occupations in Spray are , and Cleaning & Maintenance (10 | 18.9%).
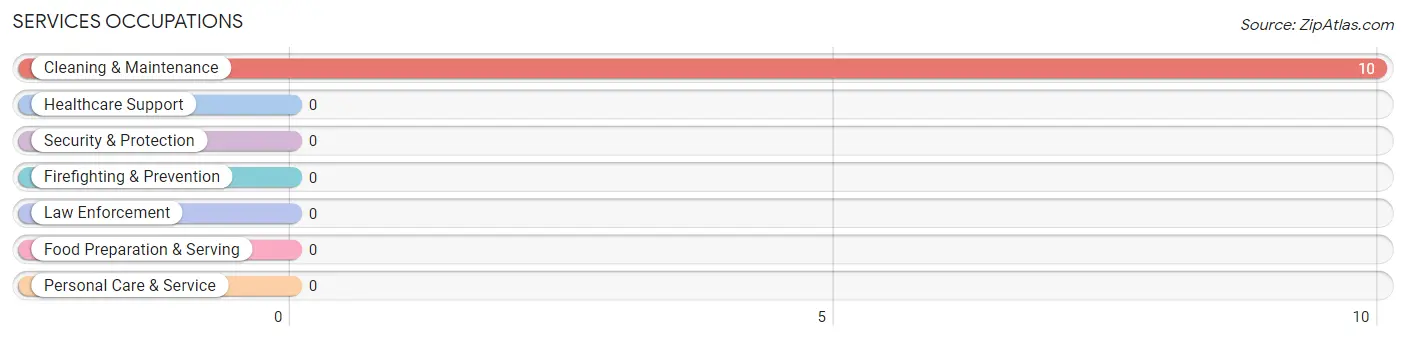
Services Occupations by Sex
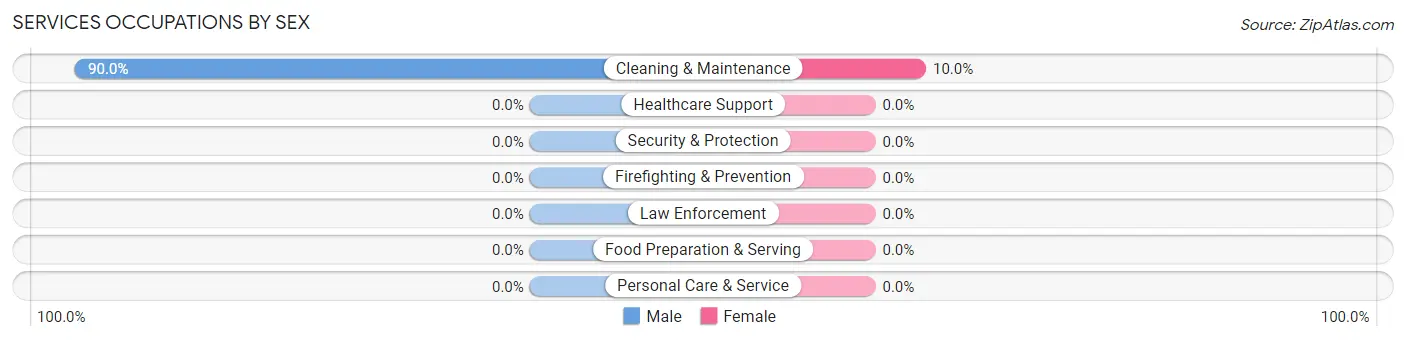
| Occupation | Male | Female |
| Healthcare Support | 0 (0.0%) | 0 (0.0%) |
| Security & Protection | 0 (0.0%) | 0 (0.0%) |
| Firefighting & Prevention | 0 (0.0%) | 0 (0.0%) |
| Law Enforcement | 0 (0.0%) | 0 (0.0%) |
| Food Preparation & Serving | 0 (0.0%) | 0 (0.0%) |
| Cleaning & Maintenance | 9 (90.0%) | 1 (10.0%) |
| Personal Care & Service | 0 (0.0%) | 0 (0.0%) |
| Total (Category) | 9 (90.0%) | 1 (10.0%) |
| Total (Overall) | 33 (62.3%) | 20 (37.7%) |
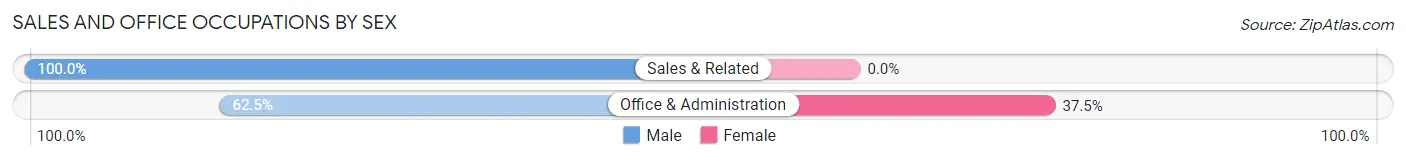
Sales and Office Occupations
The most common Sales and Office occupations in Spray are Office & Administration (8 | 15.1%), and Sales & Related (2 | 3.8%).
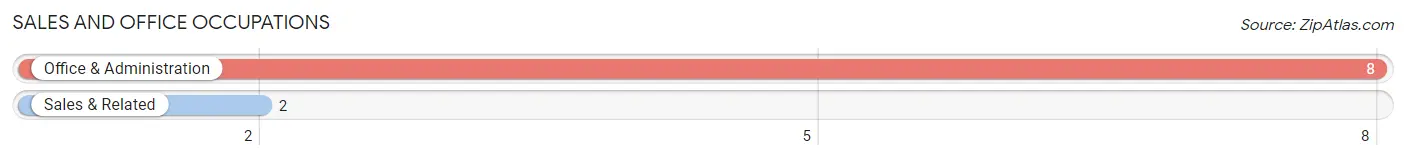
Sales and Office Occupations by Sex
| Occupation | Male | Female |
| Sales & Related | 2 (100.0%) | 0 (0.0%) |
| Office & Administration | 5 (62.5%) | 3 (37.5%) |
| Total (Category) | 7 (70.0%) | 3 (30.0%) |
| Total (Overall) | 33 (62.3%) | 20 (37.7%) |
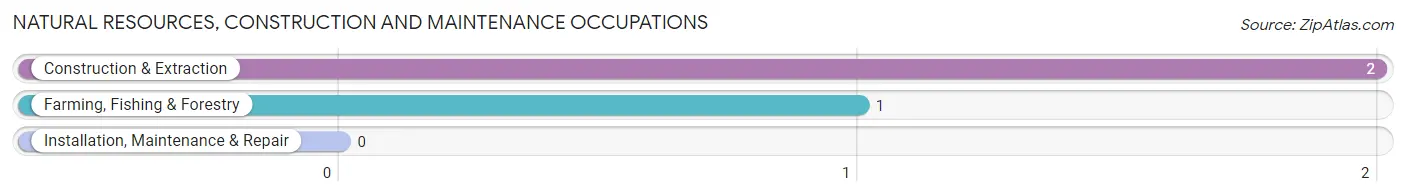
Natural Resources, Construction and Maintenance Occupations
The most common Natural Resources, Construction and Maintenance occupations in Spray are Construction & Extraction (2 | 3.8%), and Farming, Fishing & Forestry (1 | 1.9%).
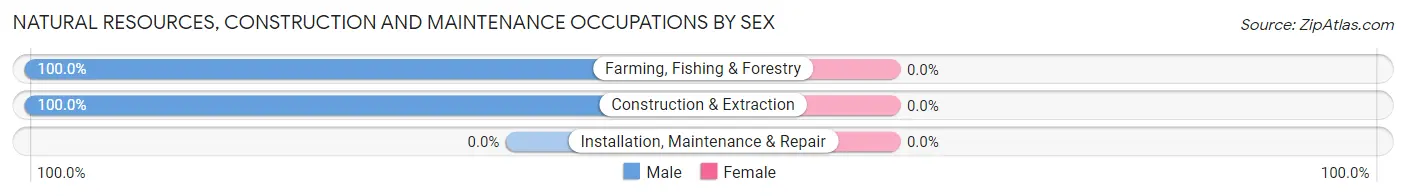
Natural Resources, Construction and Maintenance Occupations by Sex
| Occupation | Male | Female |
| Farming, Fishing & Forestry | 1 (100.0%) | 0 (0.0%) |
| Construction & Extraction | 2 (100.0%) | 0 (0.0%) |
| Installation, Maintenance & Repair | 0 (0.0%) | 0 (0.0%) |
| Total (Category) | 3 (100.0%) | 0 (0.0%) |
| Total (Overall) | 33 (62.3%) | 20 (37.7%) |
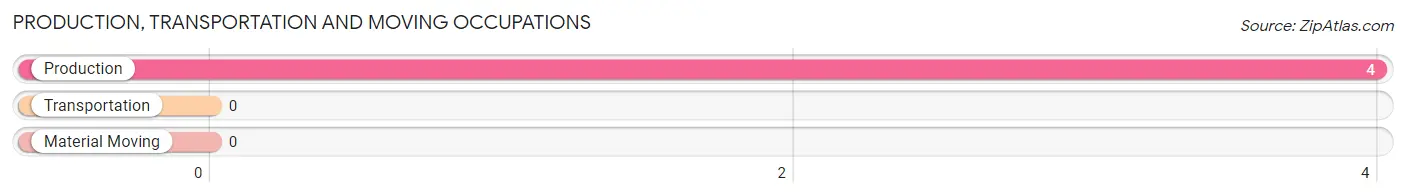
Production, Transportation and Moving Occupations
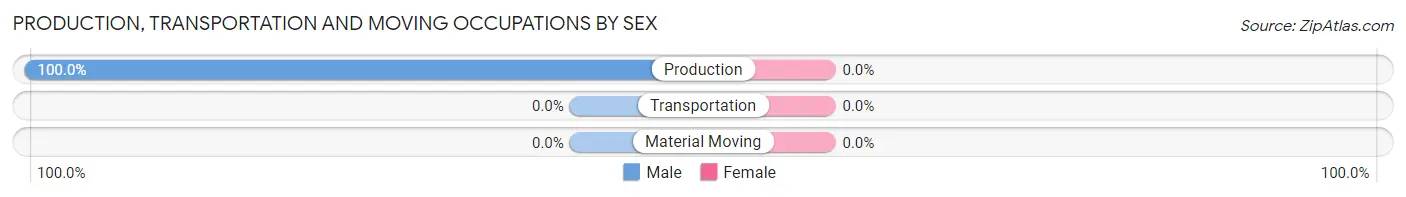
The most common Production, Transportation and Moving occupations in Spray are , and Production (4 | 7.5%).
Production, Transportation and Moving Occupations by Sex
| Occupation | Male | Female |
| Production | 4 (100.0%) | 0 (0.0%) |
| Transportation | 0 (0.0%) | 0 (0.0%) |
| Material Moving | 0 (0.0%) | 0 (0.0%) |
| Total (Category) | 4 (100.0%) | 0 (0.0%) |
| Total (Overall) | 33 (62.3%) | 20 (37.7%) |
Employment Industries by Sex in Spray
Employment Industries in Spray
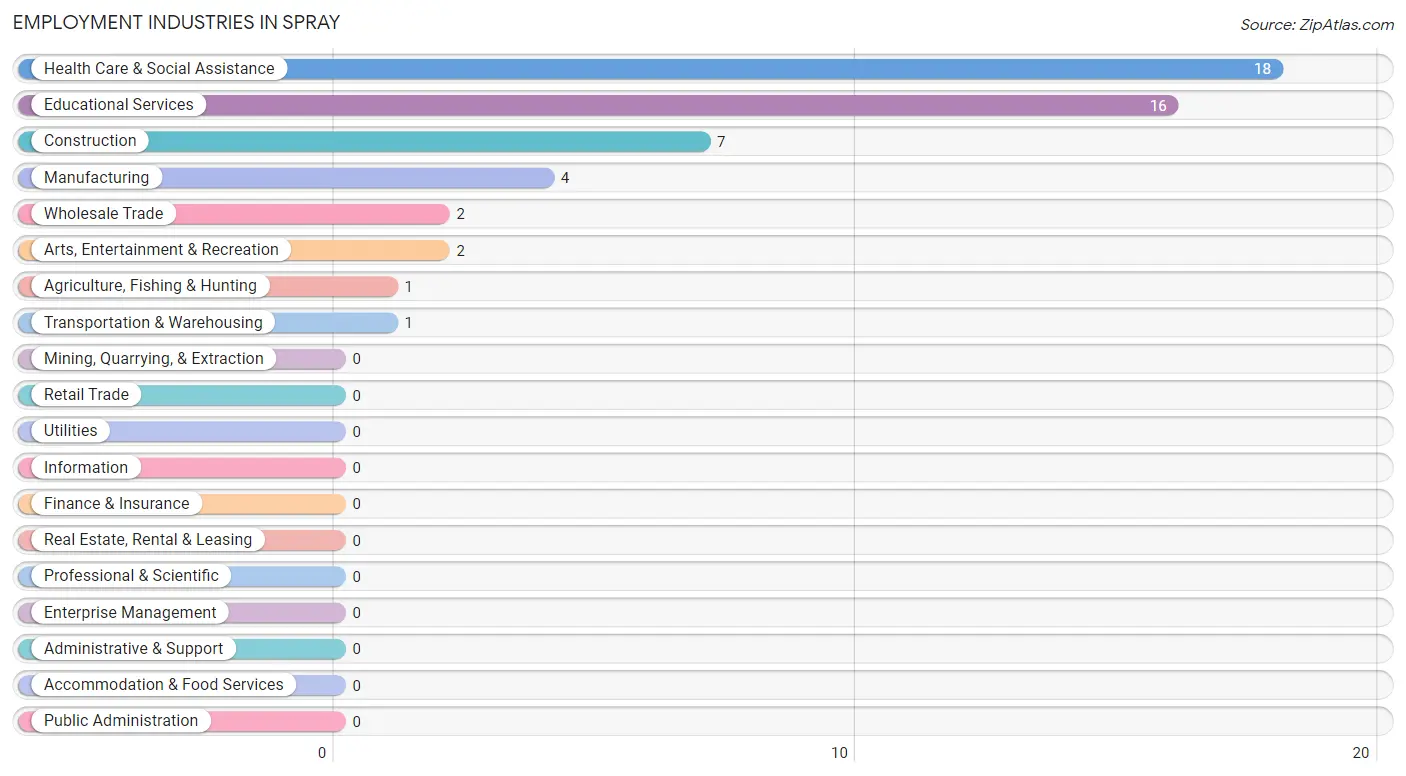
The major employment industries in Spray include Health Care & Social Assistance (18 | 34.0%), Educational Services (16 | 30.2%), Construction (7 | 13.2%), Manufacturing (4 | 7.5%), and Wholesale Trade (2 | 3.8%).
Employment Industries by Sex in Spray
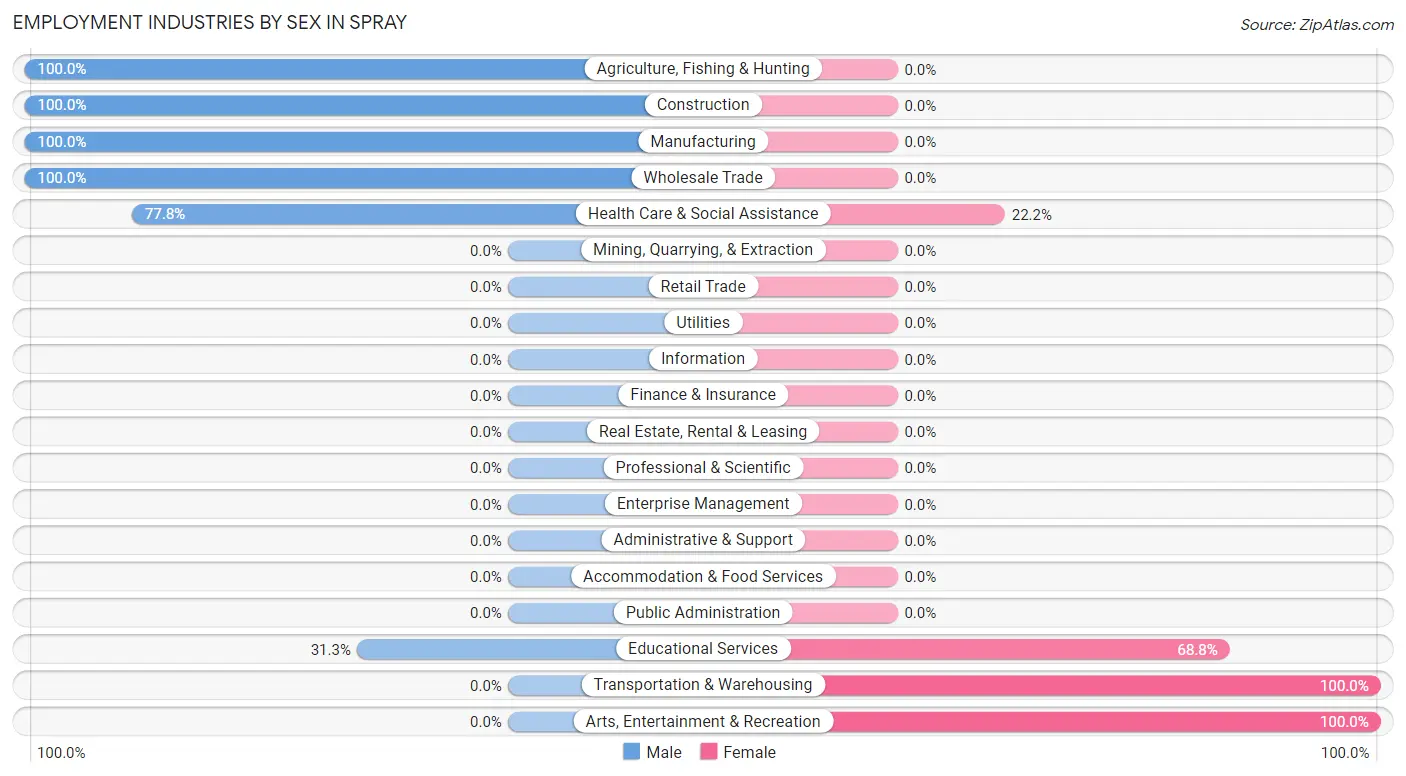
The Spray industries that see more men than women are Agriculture, Fishing & Hunting (100.0%), Construction (100.0%), and Manufacturing (100.0%), whereas the industries that tend to have a higher number of women are Transportation & Warehousing (100.0%), Arts, Entertainment & Recreation (100.0%), and Educational Services (68.8%).
| Industry | Male | Female |
| Agriculture, Fishing & Hunting | 1 (100.0%) | 0 (0.0%) |
| Mining, Quarrying, & Extraction | 0 (0.0%) | 0 (0.0%) |
| Construction | 7 (100.0%) | 0 (0.0%) |
| Manufacturing | 4 (100.0%) | 0 (0.0%) |
| Wholesale Trade | 2 (100.0%) | 0 (0.0%) |
| Retail Trade | 0 (0.0%) | 0 (0.0%) |
| Transportation & Warehousing | 0 (0.0%) | 1 (100.0%) |
| Utilities | 0 (0.0%) | 0 (0.0%) |
| Information | 0 (0.0%) | 0 (0.0%) |
| Finance & Insurance | 0 (0.0%) | 0 (0.0%) |
| Real Estate, Rental & Leasing | 0 (0.0%) | 0 (0.0%) |
| Professional & Scientific | 0 (0.0%) | 0 (0.0%) |
| Enterprise Management | 0 (0.0%) | 0 (0.0%) |
| Administrative & Support | 0 (0.0%) | 0 (0.0%) |
| Educational Services | 5 (31.2%) | 11 (68.8%) |
| Health Care & Social Assistance | 14 (77.8%) | 4 (22.2%) |
| Arts, Entertainment & Recreation | 0 (0.0%) | 2 (100.0%) |
| Accommodation & Food Services | 0 (0.0%) | 0 (0.0%) |
| Public Administration | 0 (0.0%) | 0 (0.0%) |
| Total | 33 (62.3%) | 20 (37.7%) |
Education in Spray
School Enrollment in Spray
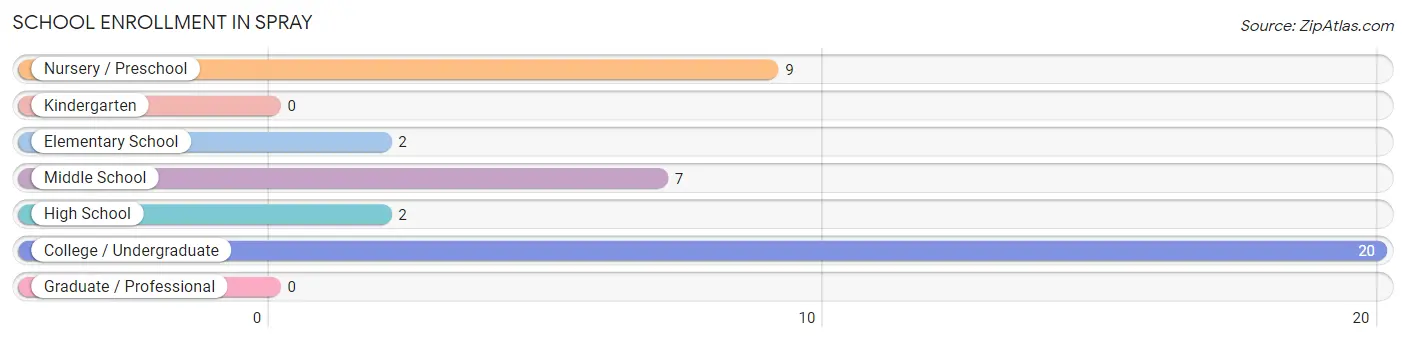
The most common levels of schooling among the 40 students in Spray are college / undergraduate (20 | 50.0%), nursery / preschool (9 | 22.5%), and middle school (7 | 17.5%).
| School Level | # Students | % Students |
| Nursery / Preschool | 9 | 22.5% |
| Kindergarten | 0 | 0.0% |
| Elementary School | 2 | 5.0% |
| Middle School | 7 | 17.5% |
| High School | 2 | 5.0% |
| College / Undergraduate | 20 | 50.0% |
| Graduate / Professional | 0 | 0.0% |
| Total | 40 | 100.0% |
School Enrollment by Age by Funding Source in Spray
Out of a total of 40 students who are enrolled in schools in Spray, 4 (10.0%) attend a private institution, while the remaining 36 (90.0%) are enrolled in public schools. The age group of 18 to 19 year olds has the highest likelihood of being enrolled in private schools, with 3 (50.0% in the age bracket) enrolled. Conversely, the age group of 3 to 4 year olds has the lowest likelihood of being enrolled in a private school, with 9 (100.0% in the age bracket) attending a public institution.
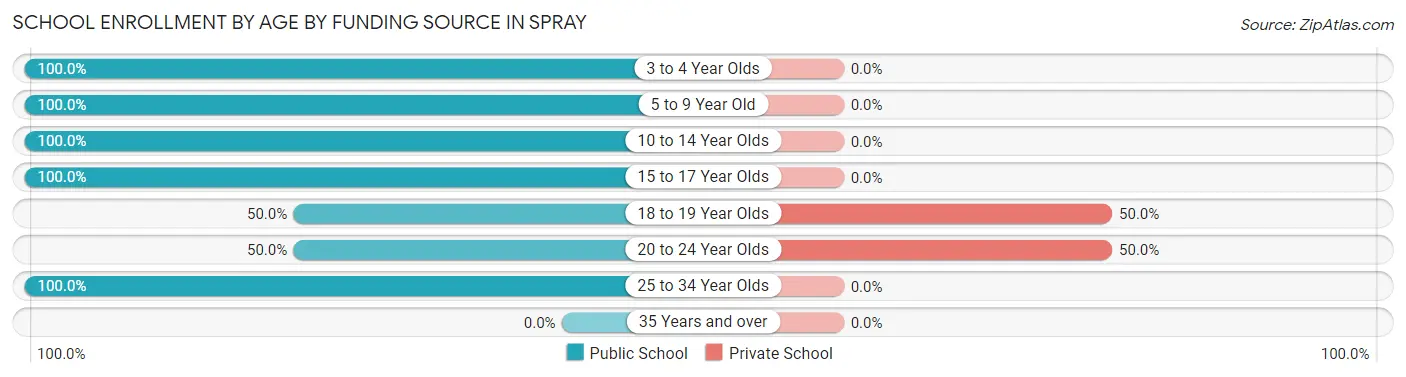
| Age Bracket | Public School | Private School |
| 3 to 4 Year Olds | 9 (100.0%) | 0 (0.0%) |
| 5 to 9 Year Old | 2 (100.0%) | 0 (0.0%) |
| 10 to 14 Year Olds | 7 (100.0%) | 0 (0.0%) |
| 15 to 17 Year Olds | 12 (100.0%) | 0 (0.0%) |
| 18 to 19 Year Olds | 3 (50.0%) | 3 (50.0%) |
| 20 to 24 Year Olds | 1 (50.0%) | 1 (50.0%) |
| 25 to 34 Year Olds | 2 (100.0%) | 0 (0.0%) |
| 35 Years and over | 0 (0.0%) | 0 (0.0%) |
| Total | 36 (90.0%) | 4 (10.0%) |
Educational Attainment by Field of Study in Spray
Visual & performing arts (6 | 60.0%), and education (4 | 40.0%) are the most common fields of study among 10 individuals in Spray who have obtained a bachelor's degree or higher.
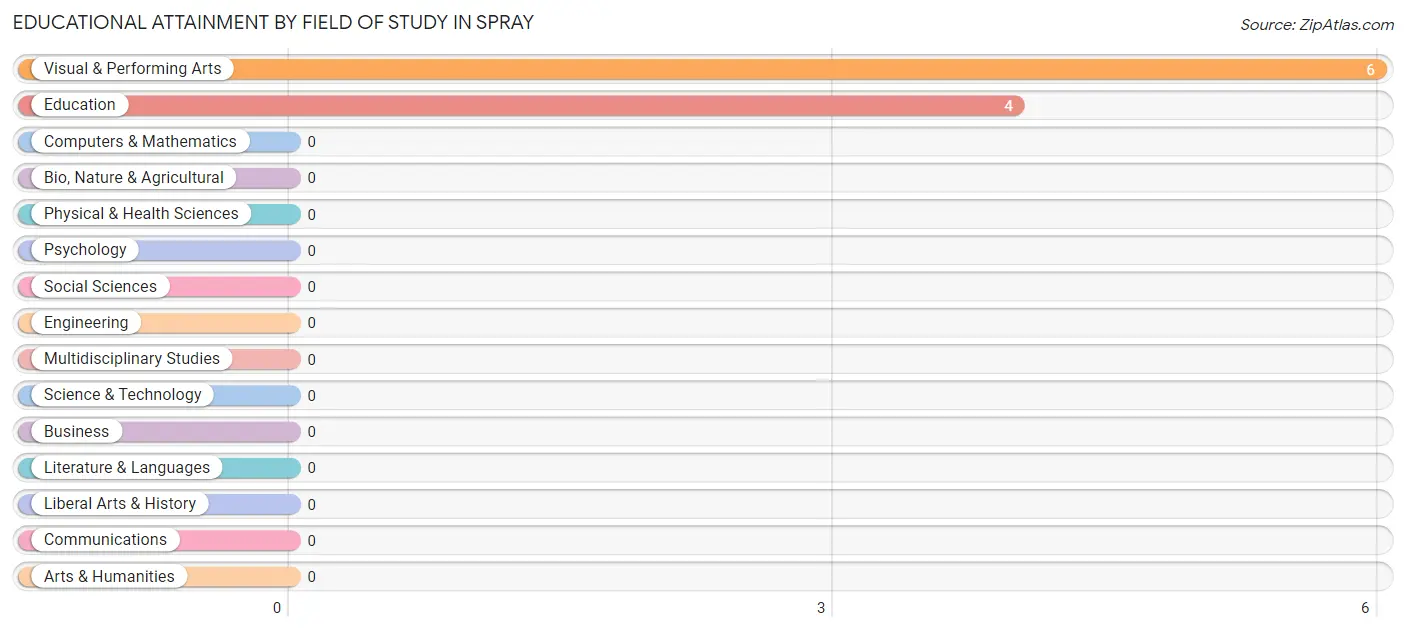
| Field of Study | # Graduates | % Graduates |
| Computers & Mathematics | 0 | 0.0% |
| Bio, Nature & Agricultural | 0 | 0.0% |
| Physical & Health Sciences | 0 | 0.0% |
| Psychology | 0 | 0.0% |
| Social Sciences | 0 | 0.0% |
| Engineering | 0 | 0.0% |
| Multidisciplinary Studies | 0 | 0.0% |
| Science & Technology | 0 | 0.0% |
| Business | 0 | 0.0% |
| Education | 4 | 40.0% |
| Literature & Languages | 0 | 0.0% |
| Liberal Arts & History | 0 | 0.0% |
| Visual & Performing Arts | 6 | 60.0% |
| Communications | 0 | 0.0% |
| Arts & Humanities | 0 | 0.0% |
| Total | 10 | 100.0% |
Transportation & Commute in Spray
Vehicle Availability by Sex in Spray
The most prevalent vehicle ownership categories in Spray are males with 2 vehicles (15, accounting for 46.9%) and females with 2 vehicles (15, making up 78.9%).
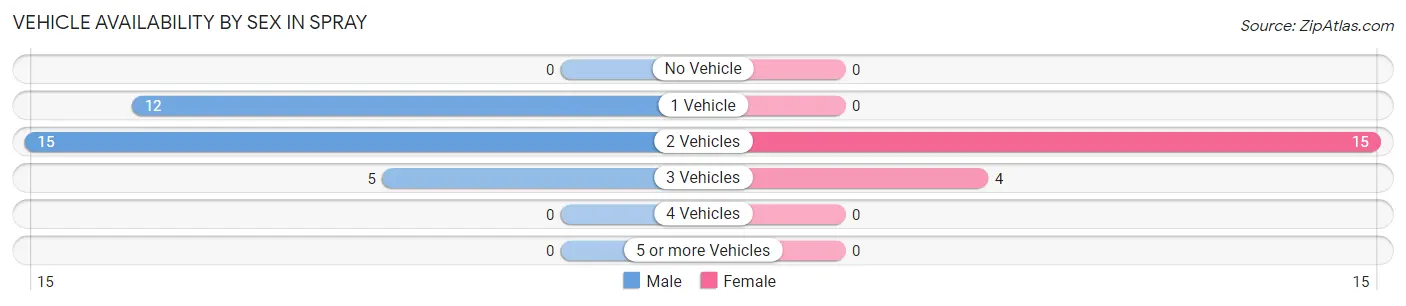
| Vehicles Available | Male | Female |
| No Vehicle | 0 (0.0%) | 0 (0.0%) |
| 1 Vehicle | 12 (37.5%) | 0 (0.0%) |
| 2 Vehicles | 15 (46.9%) | 15 (78.9%) |
| 3 Vehicles | 5 (15.6%) | 4 (21.0%) |
| 4 Vehicles | 0 (0.0%) | 0 (0.0%) |
| 5 or more Vehicles | 0 (0.0%) | 0 (0.0%) |
| Total | 32 (100.0%) | 19 (100.0%) |
Commute Time in Spray
The most frequently occuring commute durations in Spray are less than 5 minutes (22 commuters, 46.8%), 5 to 9 minutes (13 commuters, 27.7%), and 30 to 34 minutes (8 commuters, 17.0%).
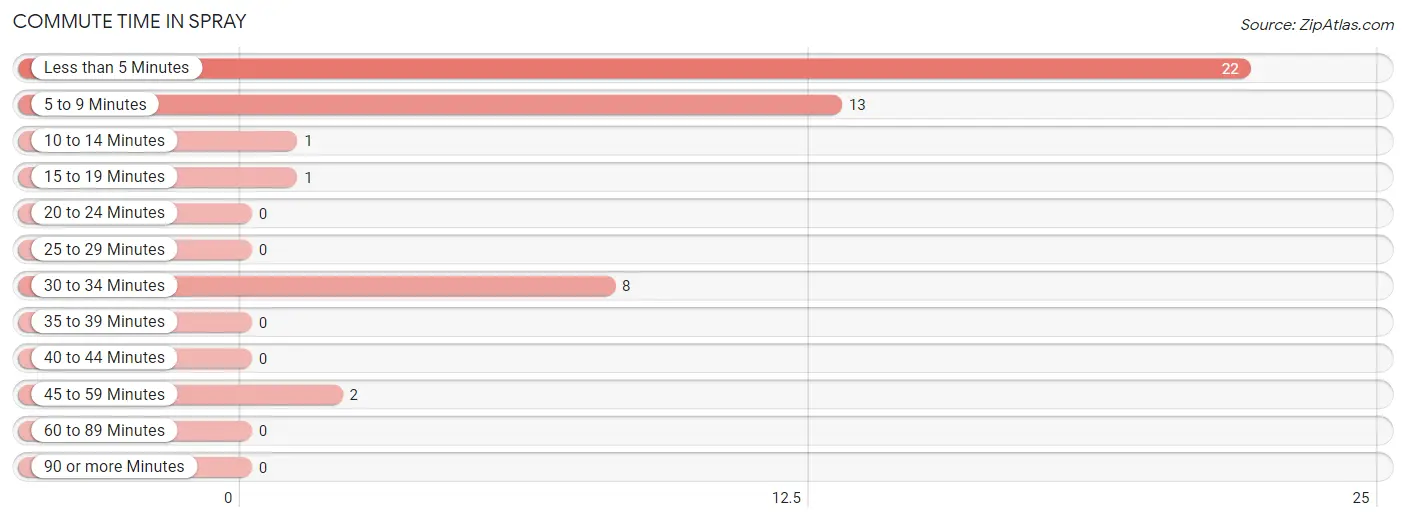
| Commute Time | # Commuters | % Commuters |
| Less than 5 Minutes | 22 | 46.8% |
| 5 to 9 Minutes | 13 | 27.7% |
| 10 to 14 Minutes | 1 | 2.1% |
| 15 to 19 Minutes | 1 | 2.1% |
| 20 to 24 Minutes | 0 | 0.0% |
| 25 to 29 Minutes | 0 | 0.0% |
| 30 to 34 Minutes | 8 | 17.0% |
| 35 to 39 Minutes | 0 | 0.0% |
| 40 to 44 Minutes | 0 | 0.0% |
| 45 to 59 Minutes | 2 | 4.3% |
| 60 to 89 Minutes | 0 | 0.0% |
| 90 or more Minutes | 0 | 0.0% |
Commute Time by Sex in Spray
The most common commute times in Spray are less than 5 minutes (21 commuters, 63.6%) for males and 5 to 9 minutes (13 commuters, 92.9%) for females.
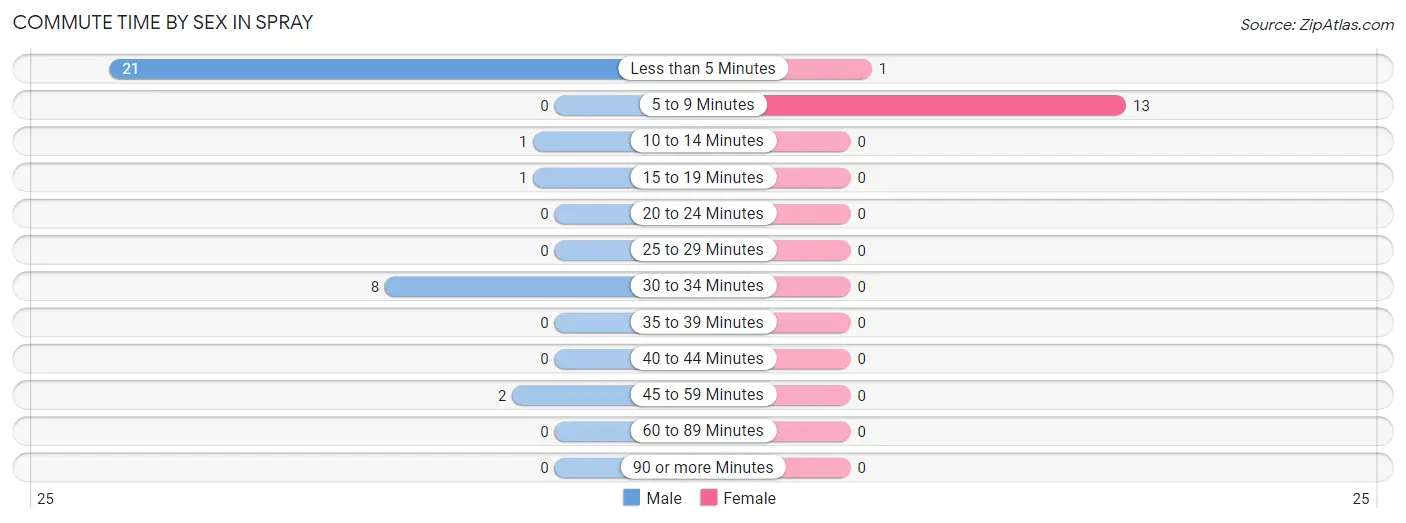
| Commute Time | Male | Female |
| Less than 5 Minutes | 21 (63.6%) | 1 (7.1%) |
| 5 to 9 Minutes | 0 (0.0%) | 13 (92.9%) |
| 10 to 14 Minutes | 1 (3.0%) | 0 (0.0%) |
| 15 to 19 Minutes | 1 (3.0%) | 0 (0.0%) |
| 20 to 24 Minutes | 0 (0.0%) | 0 (0.0%) |
| 25 to 29 Minutes | 0 (0.0%) | 0 (0.0%) |
| 30 to 34 Minutes | 8 (24.2%) | 0 (0.0%) |
| 35 to 39 Minutes | 0 (0.0%) | 0 (0.0%) |
| 40 to 44 Minutes | 0 (0.0%) | 0 (0.0%) |
| 45 to 59 Minutes | 2 (6.1%) | 0 (0.0%) |
| 60 to 89 Minutes | 0 (0.0%) | 0 (0.0%) |
| 90 or more Minutes | 0 (0.0%) | 0 (0.0%) |
Time of Departure to Work by Sex in Spray
The most frequent times of departure to work in Spray are 7:00 AM to 7:29 AM (12, 36.4%) for males and 6:30 AM to 6:59 AM (9, 64.3%) for females.
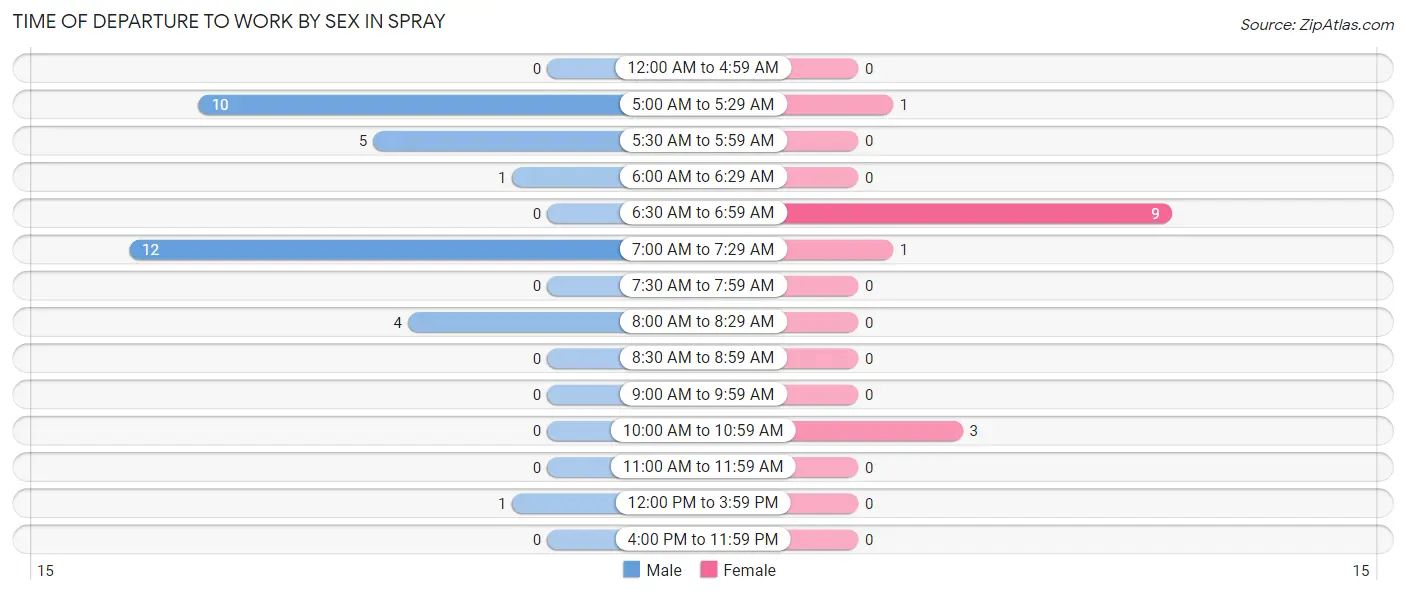
| Time of Departure | Male | Female |
| 12:00 AM to 4:59 AM | 0 (0.0%) | 0 (0.0%) |
| 5:00 AM to 5:29 AM | 10 (30.3%) | 1 (7.1%) |
| 5:30 AM to 5:59 AM | 5 (15.1%) | 0 (0.0%) |
| 6:00 AM to 6:29 AM | 1 (3.0%) | 0 (0.0%) |
| 6:30 AM to 6:59 AM | 0 (0.0%) | 9 (64.3%) |
| 7:00 AM to 7:29 AM | 12 (36.4%) | 1 (7.1%) |
| 7:30 AM to 7:59 AM | 0 (0.0%) | 0 (0.0%) |
| 8:00 AM to 8:29 AM | 4 (12.1%) | 0 (0.0%) |
| 8:30 AM to 8:59 AM | 0 (0.0%) | 0 (0.0%) |
| 9:00 AM to 9:59 AM | 0 (0.0%) | 0 (0.0%) |
| 10:00 AM to 10:59 AM | 0 (0.0%) | 3 (21.4%) |
| 11:00 AM to 11:59 AM | 0 (0.0%) | 0 (0.0%) |
| 12:00 PM to 3:59 PM | 1 (3.0%) | 0 (0.0%) |
| 4:00 PM to 11:59 PM | 0 (0.0%) | 0 (0.0%) |
| Total | 33 (100.0%) | 14 (100.0%) |
Housing Occupancy in Spray
Occupancy by Ownership in Spray
Of the total 81 dwellings in Spray, owner-occupied units account for 51 (63.0%), while renter-occupied units make up 30 (37.0%).
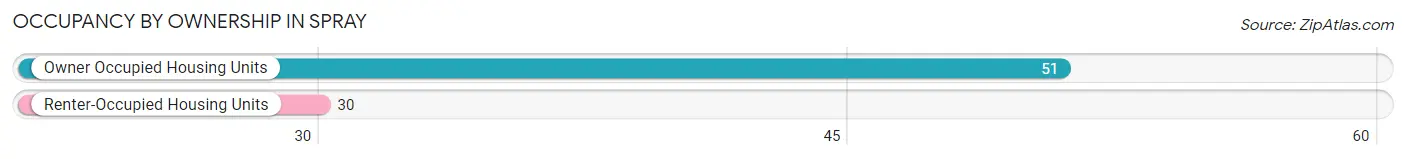
| Occupancy | # Housing Units | % Housing Units |
| Owner Occupied Housing Units | 51 | 63.0% |
| Renter-Occupied Housing Units | 30 | 37.0% |
| Total Occupied Housing Units | 81 | 100.0% |
Occupancy by Household Size in Spray
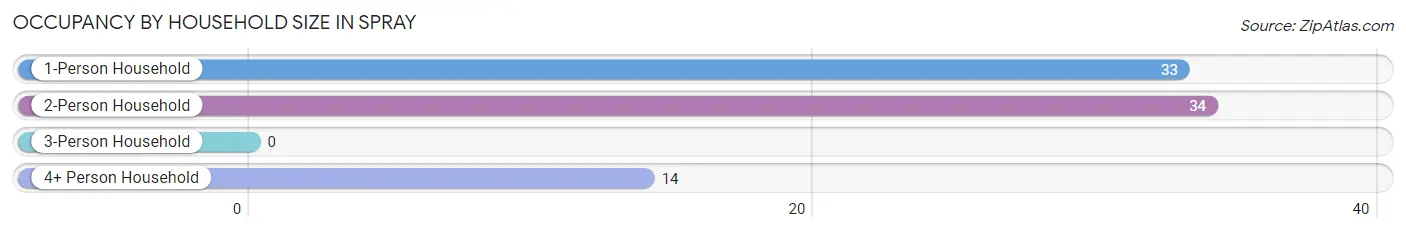
| Household Size | # Housing Units | % Housing Units |
| 1-Person Household | 33 | 40.7% |
| 2-Person Household | 34 | 42.0% |
| 3-Person Household | 0 | 0.0% |
| 4+ Person Household | 14 | 17.3% |
| Total Housing Units | 81 | 100.0% |
Occupancy by Ownership by Household Size in Spray
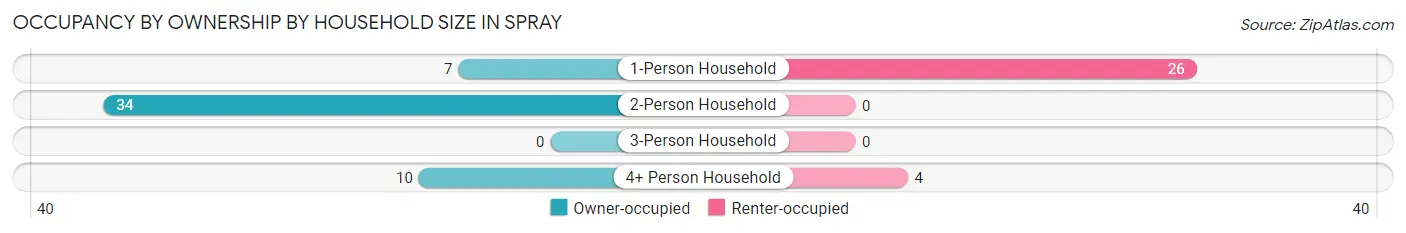
| Household Size | Owner-occupied | Renter-occupied |
| 1-Person Household | 7 (21.2%) | 26 (78.8%) |
| 2-Person Household | 34 (100.0%) | 0 (0.0%) |
| 3-Person Household | 0 (0.0%) | 0 (0.0%) |
| 4+ Person Household | 10 (71.4%) | 4 (28.6%) |
| Total Housing Units | 51 (63.0%) | 30 (37.0%) |
Occupancy by Educational Attainment in Spray
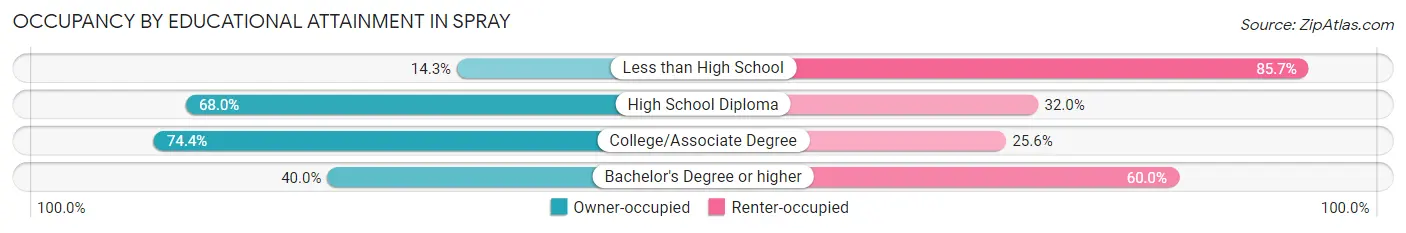
| Household Size | Owner-occupied | Renter-occupied |
| Less than High School | 1 (14.3%) | 6 (85.7%) |
| High School Diploma | 17 (68.0%) | 8 (32.0%) |
| College/Associate Degree | 29 (74.4%) | 10 (25.6%) |
| Bachelor's Degree or higher | 4 (40.0%) | 6 (60.0%) |
Occupancy by Age of Householder in Spray
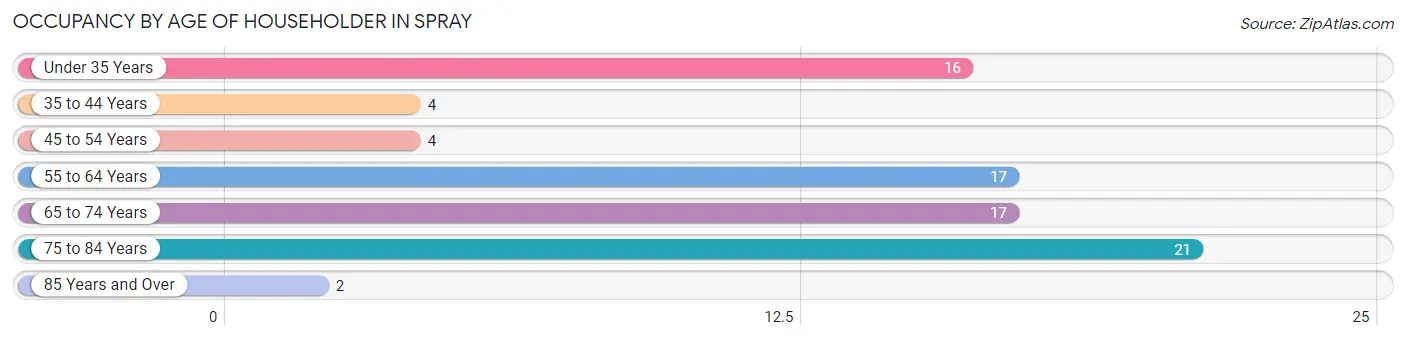
| Age Bracket | # Households | % Households |
| Under 35 Years | 16 | 19.8% |
| 35 to 44 Years | 4 | 4.9% |
| 45 to 54 Years | 4 | 4.9% |
| 55 to 64 Years | 17 | 21.0% |
| 65 to 74 Years | 17 | 21.0% |
| 75 to 84 Years | 21 | 25.9% |
| 85 Years and Over | 2 | 2.5% |
| Total | 81 | 100.0% |
Housing Finances in Spray
Median Income by Occupancy in Spray
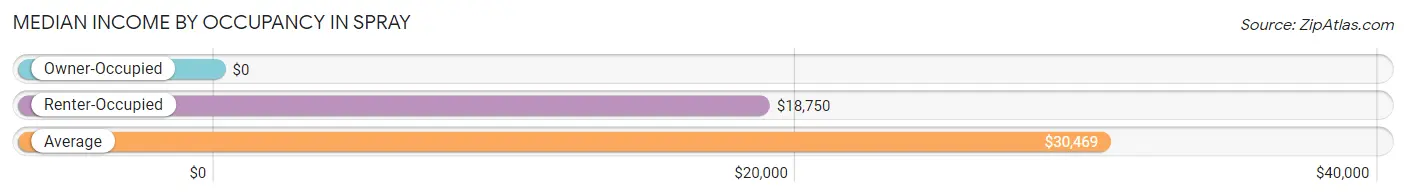
| Occupancy Type | # Households | Median Income |
| Owner-Occupied | 51 (63.0%) | $0 |
| Renter-Occupied | 30 (37.0%) | $18,750 |
| Average | 81 (100.0%) | $30,469 |
Occupancy by Householder Income Bracket in Spray
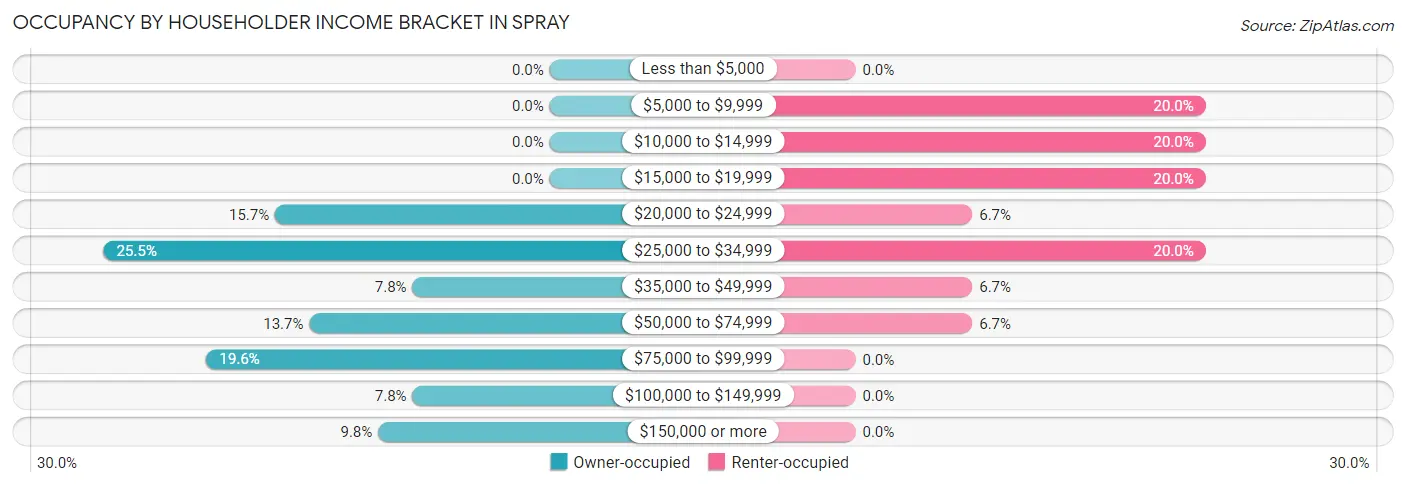
| Income Bracket | Owner-occupied | Renter-occupied |
| Less than $5,000 | 0 (0.0%) | 0 (0.0%) |
| $5,000 to $9,999 | 0 (0.0%) | 6 (20.0%) |
| $10,000 to $14,999 | 0 (0.0%) | 6 (20.0%) |
| $15,000 to $19,999 | 0 (0.0%) | 6 (20.0%) |
| $20,000 to $24,999 | 8 (15.7%) | 2 (6.7%) |
| $25,000 to $34,999 | 13 (25.5%) | 6 (20.0%) |
| $35,000 to $49,999 | 4 (7.8%) | 2 (6.7%) |
| $50,000 to $74,999 | 7 (13.7%) | 2 (6.7%) |
| $75,000 to $99,999 | 10 (19.6%) | 0 (0.0%) |
| $100,000 to $149,999 | 4 (7.8%) | 0 (0.0%) |
| $150,000 or more | 5 (9.8%) | 0 (0.0%) |
| Total | 51 (100.0%) | 30 (100.0%) |
Monthly Housing Cost Tiers in Spray
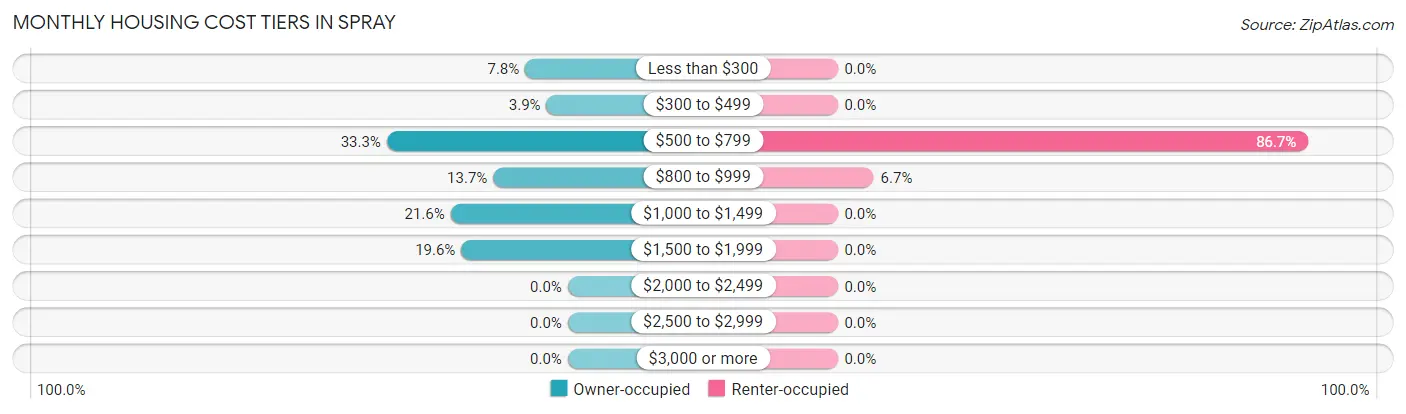
| Monthly Cost | Owner-occupied | Renter-occupied |
| Less than $300 | 4 (7.8%) | 0 (0.0%) |
| $300 to $499 | 2 (3.9%) | 0 (0.0%) |
| $500 to $799 | 17 (33.3%) | 26 (86.7%) |
| $800 to $999 | 7 (13.7%) | 2 (6.7%) |
| $1,000 to $1,499 | 11 (21.6%) | 0 (0.0%) |
| $1,500 to $1,999 | 10 (19.6%) | 0 (0.0%) |
| $2,000 to $2,499 | 0 (0.0%) | 0 (0.0%) |
| $2,500 to $2,999 | 0 (0.0%) | 0 (0.0%) |
| $3,000 or more | 0 (0.0%) | 0 (0.0%) |
| Total | 51 (100.0%) | 30 (100.0%) |
Physical Housing Characteristics in Spray
Housing Structures in Spray
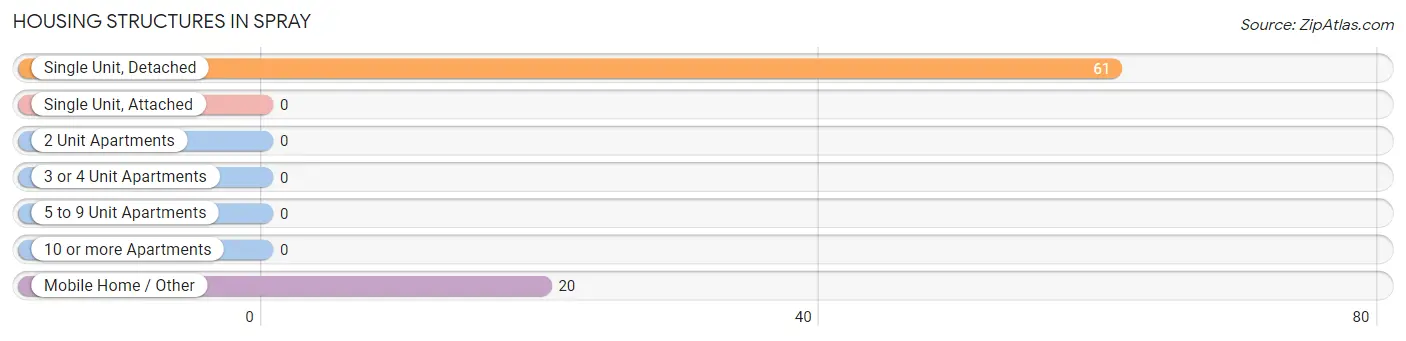
| Structure Type | # Housing Units | % Housing Units |
| Single Unit, Detached | 61 | 75.3% |
| Single Unit, Attached | 0 | 0.0% |
| 2 Unit Apartments | 0 | 0.0% |
| 3 or 4 Unit Apartments | 0 | 0.0% |
| 5 to 9 Unit Apartments | 0 | 0.0% |
| 10 or more Apartments | 0 | 0.0% |
| Mobile Home / Other | 20 | 24.7% |
| Total | 81 | 100.0% |
Housing Structures by Occupancy in Spray
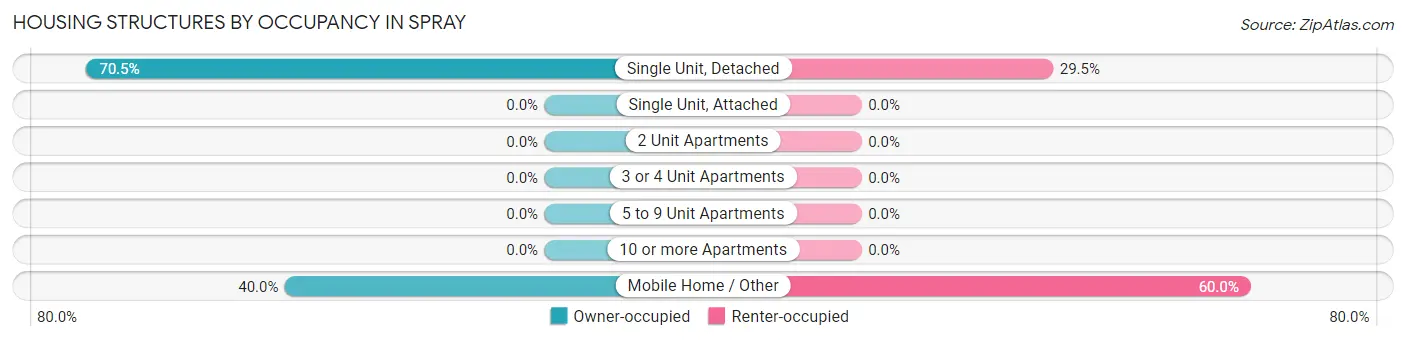
| Structure Type | Owner-occupied | Renter-occupied |
| Single Unit, Detached | 43 (70.5%) | 18 (29.5%) |
| Single Unit, Attached | 0 (0.0%) | 0 (0.0%) |
| 2 Unit Apartments | 0 (0.0%) | 0 (0.0%) |
| 3 or 4 Unit Apartments | 0 (0.0%) | 0 (0.0%) |
| 5 to 9 Unit Apartments | 0 (0.0%) | 0 (0.0%) |
| 10 or more Apartments | 0 (0.0%) | 0 (0.0%) |
| Mobile Home / Other | 8 (40.0%) | 12 (60.0%) |
| Total | 51 (63.0%) | 30 (37.0%) |
Housing Structures by Number of Rooms in Spray
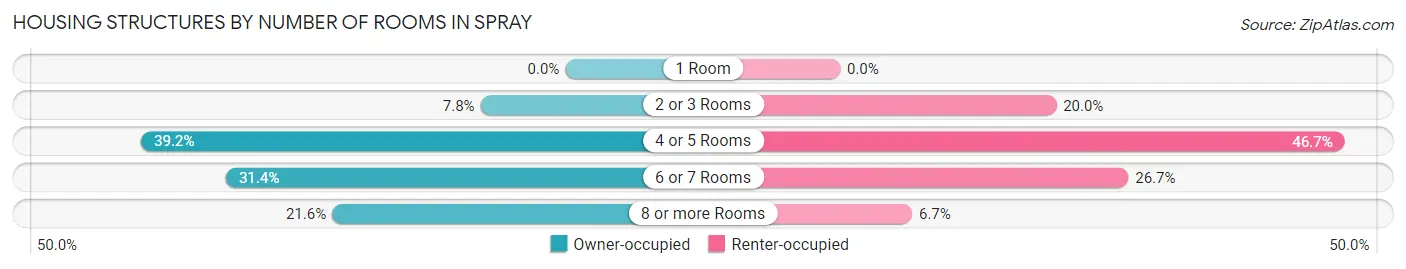
| Number of Rooms | Owner-occupied | Renter-occupied |
| 1 Room | 0 (0.0%) | 0 (0.0%) |
| 2 or 3 Rooms | 4 (7.8%) | 6 (20.0%) |
| 4 or 5 Rooms | 20 (39.2%) | 14 (46.7%) |
| 6 or 7 Rooms | 16 (31.4%) | 8 (26.7%) |
| 8 or more Rooms | 11 (21.6%) | 2 (6.7%) |
| Total | 51 (100.0%) | 30 (100.0%) |
Housing Structure by Heating Type in Spray
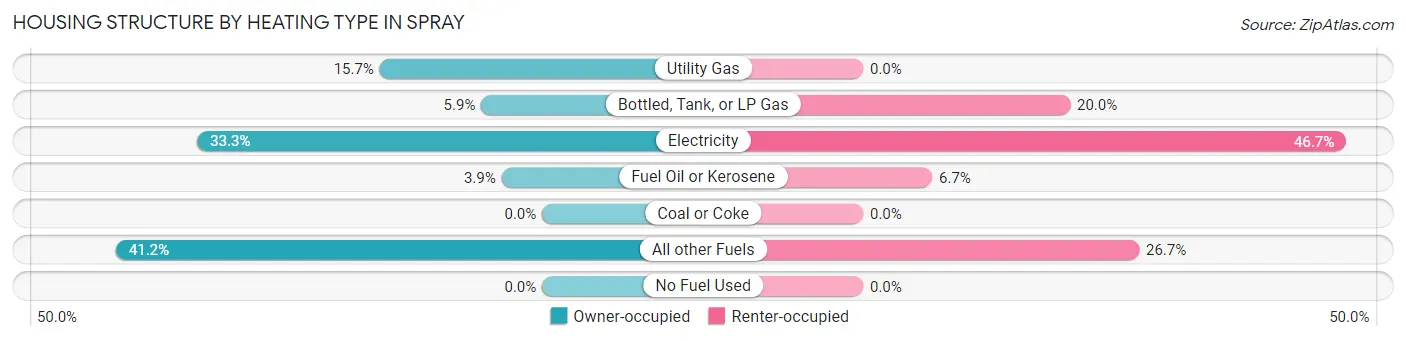
| Heating Type | Owner-occupied | Renter-occupied |
| Utility Gas | 8 (15.7%) | 0 (0.0%) |
| Bottled, Tank, or LP Gas | 3 (5.9%) | 6 (20.0%) |
| Electricity | 17 (33.3%) | 14 (46.7%) |
| Fuel Oil or Kerosene | 2 (3.9%) | 2 (6.7%) |
| Coal or Coke | 0 (0.0%) | 0 (0.0%) |
| All other Fuels | 21 (41.2%) | 8 (26.7%) |
| No Fuel Used | 0 (0.0%) | 0 (0.0%) |
| Total | 51 (100.0%) | 30 (100.0%) |
Household Vehicle Usage in Spray
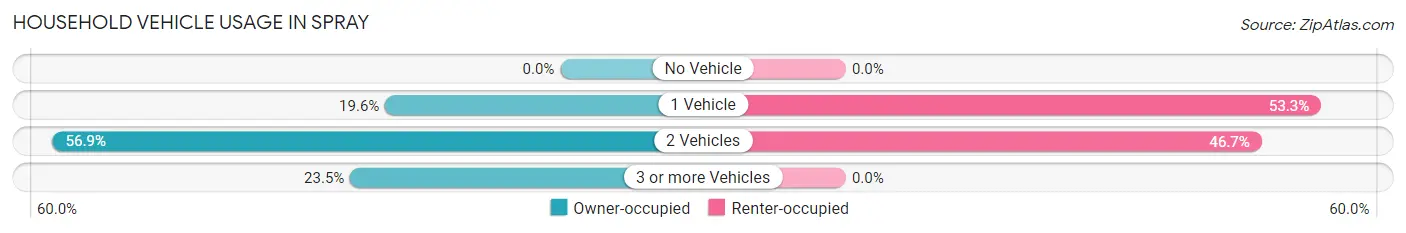
| Vehicles per Household | Owner-occupied | Renter-occupied |
| No Vehicle | 0 (0.0%) | 0 (0.0%) |
| 1 Vehicle | 10 (19.6%) | 16 (53.3%) |
| 2 Vehicles | 29 (56.9%) | 14 (46.7%) |
| 3 or more Vehicles | 12 (23.5%) | 0 (0.0%) |
| Total | 51 (100.0%) | 30 (100.0%) |
Real Estate & Mortgages in Spray
Real Estate and Mortgage Overview in Spray
| Characteristic | Without Mortgage | With Mortgage |
| Housing Units | 22 | 29 |
| Median Property Value | $250,000 | $265,600 |
| Median Household Income | $29,375 | $5 |
| Monthly Housing Costs | $545 | $0 |
| Real Estate Taxes | $2,200 | $6 |
Property Value by Mortgage Status in Spray
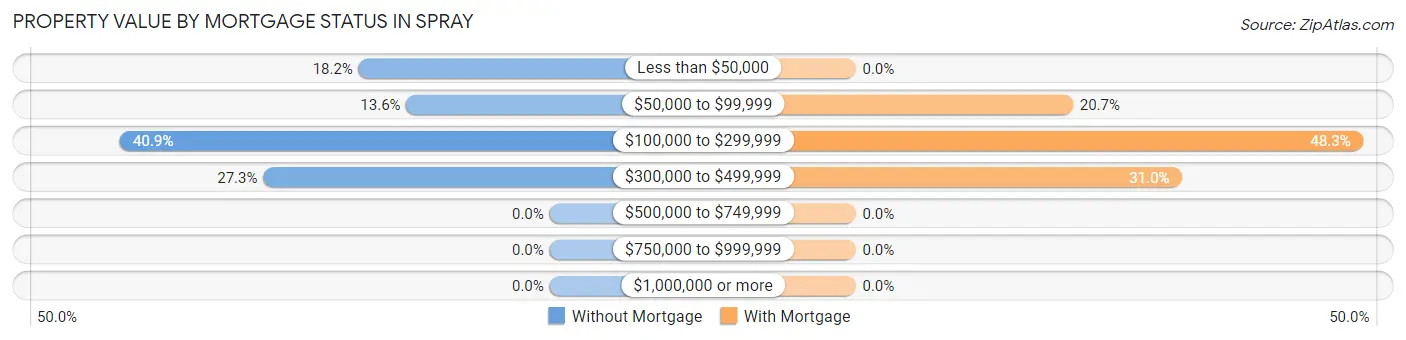
| Property Value | Without Mortgage | With Mortgage |
| Less than $50,000 | 4 (18.2%) | 0 (0.0%) |
| $50,000 to $99,999 | 3 (13.6%) | 6 (20.7%) |
| $100,000 to $299,999 | 9 (40.9%) | 14 (48.3%) |
| $300,000 to $499,999 | 6 (27.3%) | 9 (31.0%) |
| $500,000 to $749,999 | 0 (0.0%) | 0 (0.0%) |
| $750,000 to $999,999 | 0 (0.0%) | 0 (0.0%) |
| $1,000,000 or more | 0 (0.0%) | 0 (0.0%) |
| Total | 22 (100.0%) | 29 (100.0%) |
Household Income by Mortgage Status in Spray
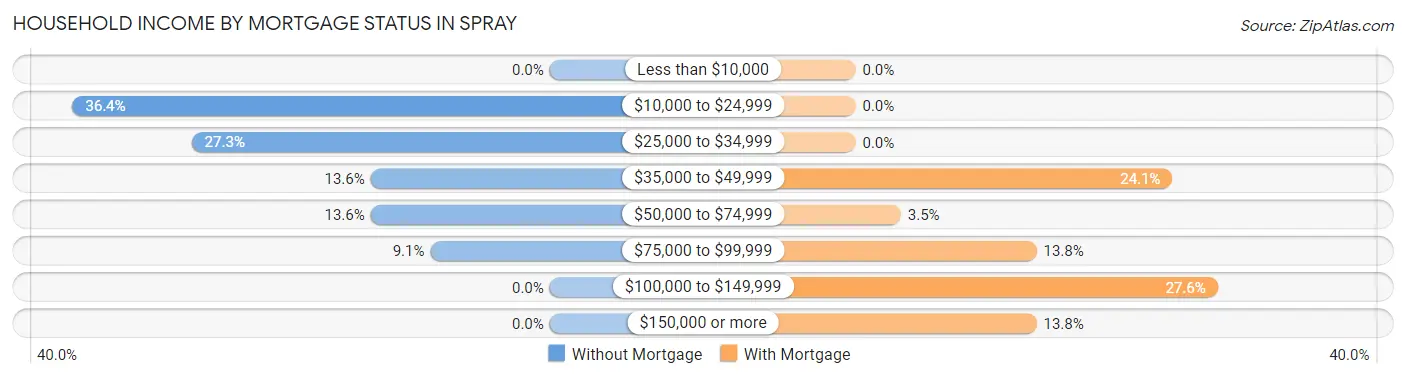
| Household Income | Without Mortgage | With Mortgage |
| Less than $10,000 | 0 (0.0%) | 0 (0.0%) |
| $10,000 to $24,999 | 8 (36.4%) | 0 (0.0%) |
| $25,000 to $34,999 | 6 (27.3%) | 0 (0.0%) |
| $35,000 to $49,999 | 3 (13.6%) | 7 (24.1%) |
| $50,000 to $74,999 | 3 (13.6%) | 1 (3.5%) |
| $75,000 to $99,999 | 2 (9.1%) | 4 (13.8%) |
| $100,000 to $149,999 | 0 (0.0%) | 8 (27.6%) |
| $150,000 or more | 0 (0.0%) | 4 (13.8%) |
| Total | 22 (100.0%) | 29 (100.0%) |
Property Value to Household Income Ratio in Spray
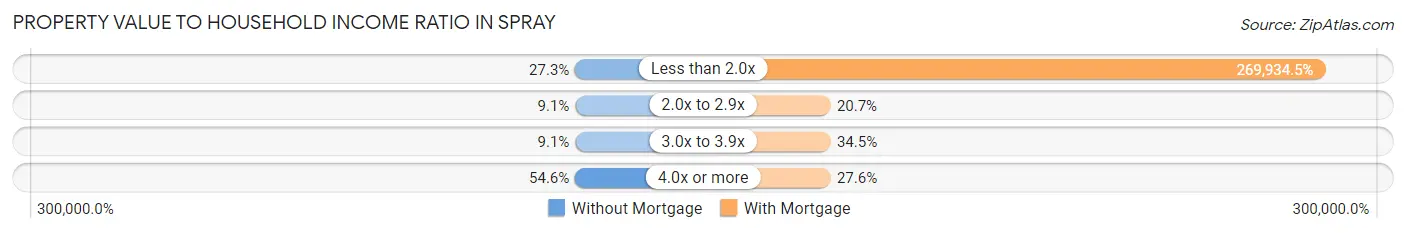
| Value-to-Income Ratio | Without Mortgage | With Mortgage |
| Less than 2.0x | 6 (27.3%) | 78,281 (269,934.5%) |
| 2.0x to 2.9x | 2 (9.1%) | 6 (20.7%) |
| 3.0x to 3.9x | 2 (9.1%) | 10 (34.5%) |
| 4.0x or more | 12 (54.5%) | 8 (27.6%) |
| Total | 22 (100.0%) | 29 (100.0%) |
Real Estate Taxes by Mortgage Status in Spray
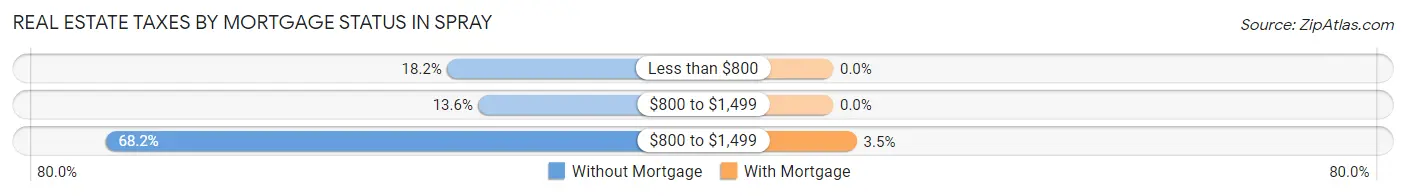
| Property Taxes | Without Mortgage | With Mortgage |
| Less than $800 | 4 (18.2%) | 0 (0.0%) |
| $800 to $1,499 | 3 (13.6%) | 0 (0.0%) |
| $800 to $1,499 | 15 (68.2%) | 1 (3.5%) |
| Total | 22 (100.0%) | 29 (100.0%) |
Health & Disability in Spray
Health Insurance Coverage by Age in Spray
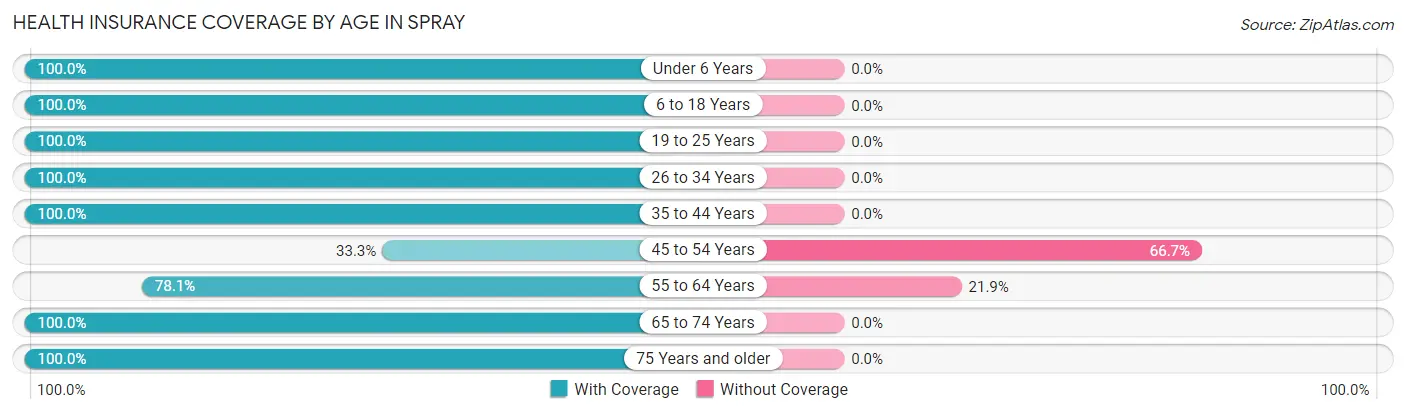
| Age Bracket | With Coverage | Without Coverage |
| Under 6 Years | 25 (100.0%) | 0 (0.0%) |
| 6 to 18 Years | 26 (100.0%) | 0 (0.0%) |
| 19 to 25 Years | 9 (100.0%) | 0 (0.0%) |
| 26 to 34 Years | 24 (100.0%) | 0 (0.0%) |
| 35 to 44 Years | 12 (100.0%) | 0 (0.0%) |
| 45 to 54 Years | 2 (33.3%) | 4 (66.7%) |
| 55 to 64 Years | 25 (78.1%) | 7 (21.9%) |
| 65 to 74 Years | 35 (100.0%) | 0 (0.0%) |
| 75 Years and older | 30 (100.0%) | 0 (0.0%) |
| Total | 188 (94.5%) | 11 (5.5%) |
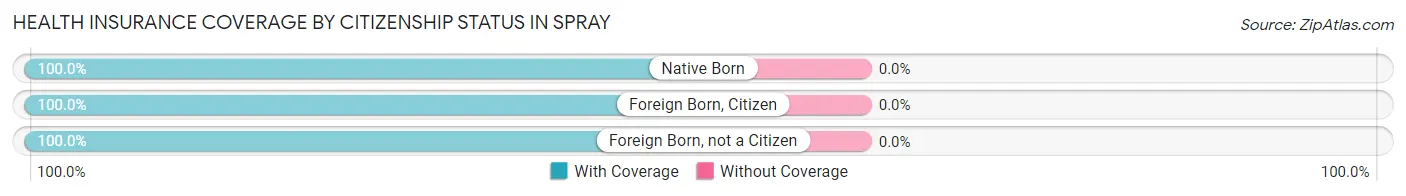
Health Insurance Coverage by Citizenship Status in Spray
| Citizenship Status | With Coverage | Without Coverage |
| Native Born | 25 (100.0%) | 0 (0.0%) |
| Foreign Born, Citizen | 26 (100.0%) | 0 (0.0%) |
| Foreign Born, not a Citizen | 9 (100.0%) | 0 (0.0%) |
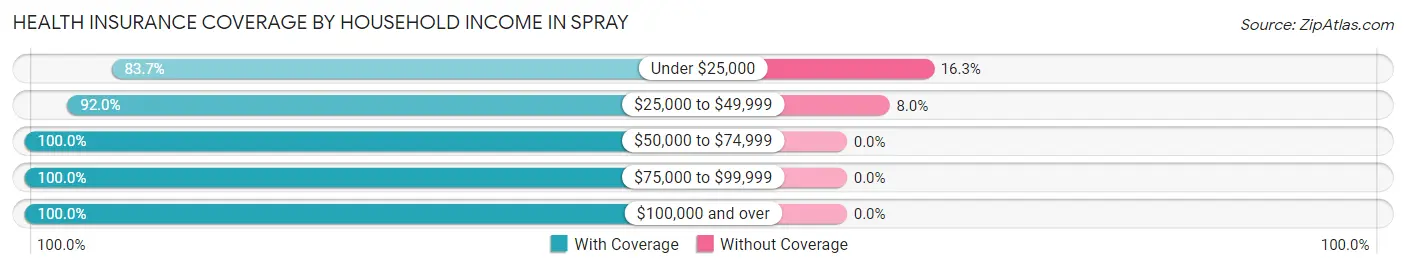
Health Insurance Coverage by Household Income in Spray
| Household Income | With Coverage | Without Coverage |
| Under $25,000 | 36 (83.7%) | 7 (16.3%) |
| $25,000 to $49,999 | 46 (92.0%) | 4 (8.0%) |
| $50,000 to $74,999 | 28 (100.0%) | 0 (0.0%) |
| $75,000 to $99,999 | 38 (100.0%) | 0 (0.0%) |
| $100,000 and over | 22 (100.0%) | 0 (0.0%) |
Public vs Private Health Insurance Coverage by Age in Spray
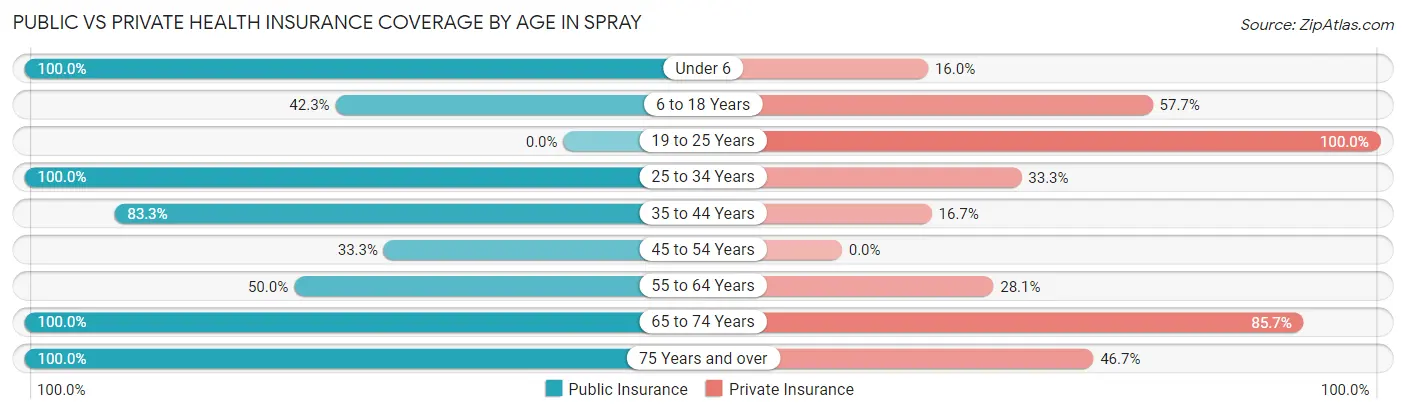
| Age Bracket | Public Insurance | Private Insurance |
| Under 6 | 25 (100.0%) | 4 (16.0%) |
| 6 to 18 Years | 11 (42.3%) | 15 (57.7%) |
| 19 to 25 Years | 0 (0.0%) | 9 (100.0%) |
| 25 to 34 Years | 24 (100.0%) | 8 (33.3%) |
| 35 to 44 Years | 10 (83.3%) | 2 (16.7%) |
| 45 to 54 Years | 2 (33.3%) | 0 (0.0%) |
| 55 to 64 Years | 16 (50.0%) | 9 (28.1%) |
| 65 to 74 Years | 35 (100.0%) | 30 (85.7%) |
| 75 Years and over | 30 (100.0%) | 14 (46.7%) |
| Total | 153 (76.9%) | 91 (45.7%) |
Disability Status by Sex by Age in Spray
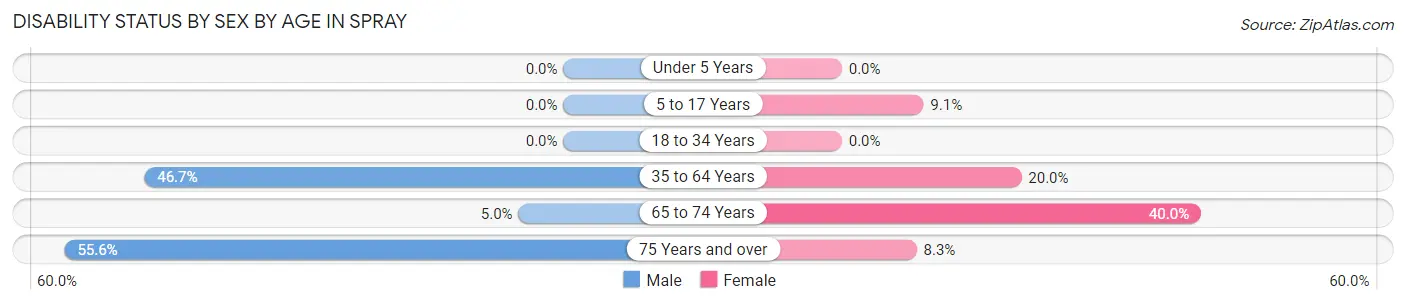
| Age Bracket | Male | Female |
| Under 5 Years | 0 (0.0%) | 0 (0.0%) |
| 5 to 17 Years | 0 (0.0%) | 1 (9.1%) |
| 18 to 34 Years | 0 (0.0%) | 0 (0.0%) |
| 35 to 64 Years | 14 (46.7%) | 4 (20.0%) |
| 65 to 74 Years | 1 (5.0%) | 6 (40.0%) |
| 75 Years and over | 10 (55.6%) | 1 (8.3%) |
Disability Class by Sex by Age in Spray
Disability Class: Hearing Difficulty
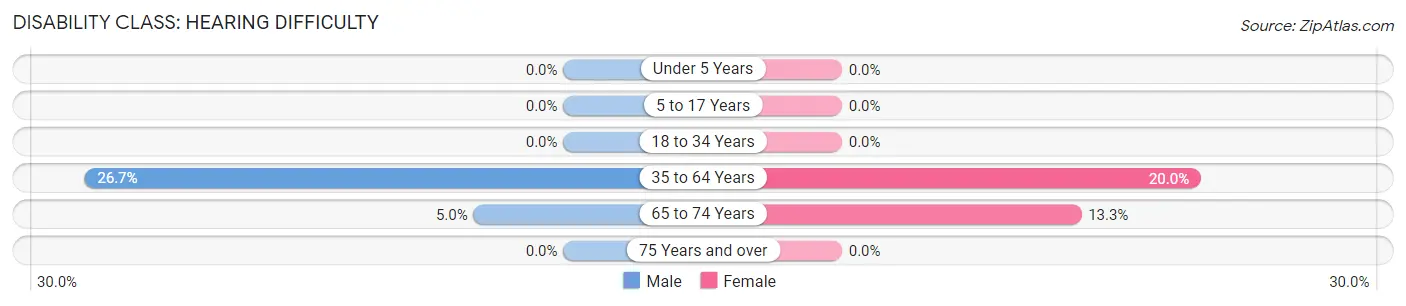
| Age Bracket | Male | Female |
| Under 5 Years | 0 (0.0%) | 0 (0.0%) |
| 5 to 17 Years | 0 (0.0%) | 0 (0.0%) |
| 18 to 34 Years | 0 (0.0%) | 0 (0.0%) |
| 35 to 64 Years | 8 (26.7%) | 4 (20.0%) |
| 65 to 74 Years | 1 (5.0%) | 2 (13.3%) |
| 75 Years and over | 0 (0.0%) | 0 (0.0%) |
Disability Class: Vision Difficulty
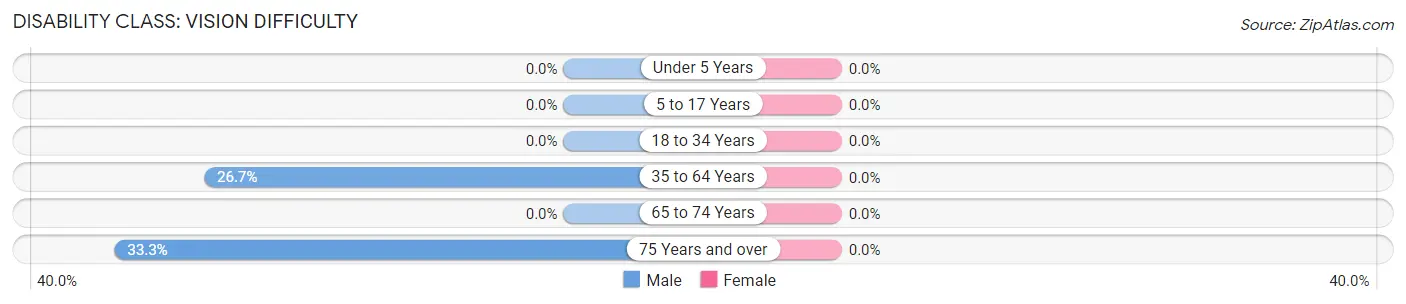
| Age Bracket | Male | Female |
| Under 5 Years | 0 (0.0%) | 0 (0.0%) |
| 5 to 17 Years | 0 (0.0%) | 0 (0.0%) |
| 18 to 34 Years | 0 (0.0%) | 0 (0.0%) |
| 35 to 64 Years | 8 (26.7%) | 0 (0.0%) |
| 65 to 74 Years | 0 (0.0%) | 0 (0.0%) |
| 75 Years and over | 6 (33.3%) | 0 (0.0%) |
Disability Class: Cognitive Difficulty
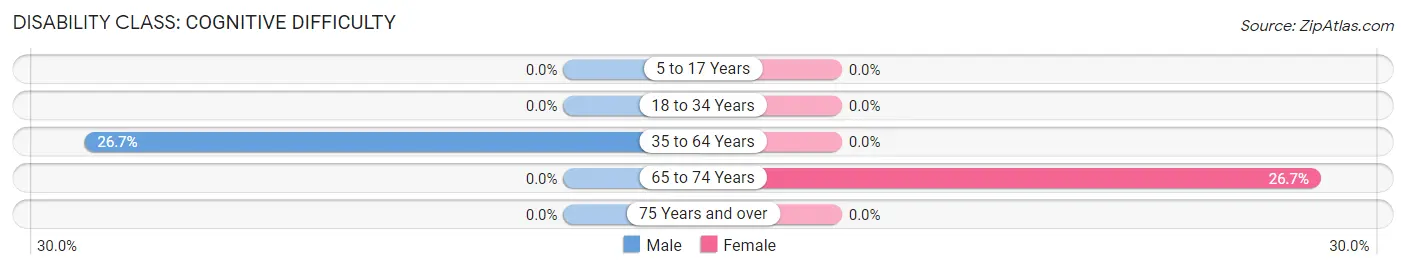
| Age Bracket | Male | Female |
| 5 to 17 Years | 0 (0.0%) | 0 (0.0%) |
| 18 to 34 Years | 0 (0.0%) | 0 (0.0%) |
| 35 to 64 Years | 8 (26.7%) | 0 (0.0%) |
| 65 to 74 Years | 0 (0.0%) | 4 (26.7%) |
| 75 Years and over | 0 (0.0%) | 0 (0.0%) |
Disability Class: Ambulatory Difficulty
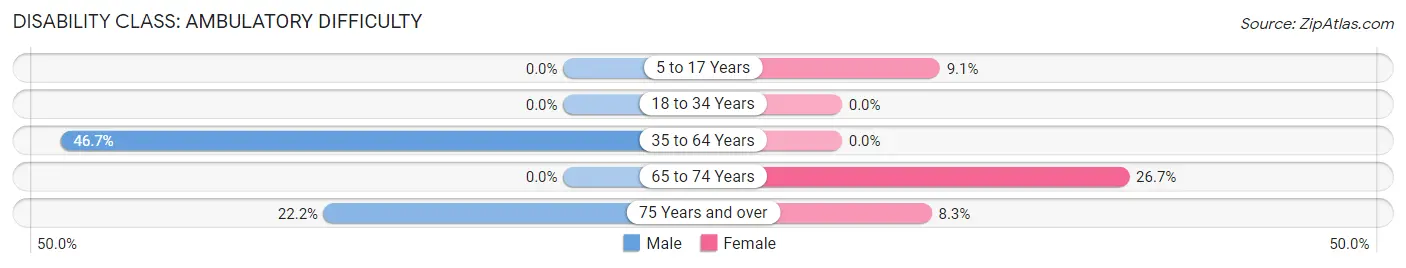
| Age Bracket | Male | Female |
| 5 to 17 Years | 0 (0.0%) | 1 (9.1%) |
| 18 to 34 Years | 0 (0.0%) | 0 (0.0%) |
| 35 to 64 Years | 14 (46.7%) | 0 (0.0%) |
| 65 to 74 Years | 0 (0.0%) | 4 (26.7%) |
| 75 Years and over | 4 (22.2%) | 1 (8.3%) |
Disability Class: Self-Care Difficulty
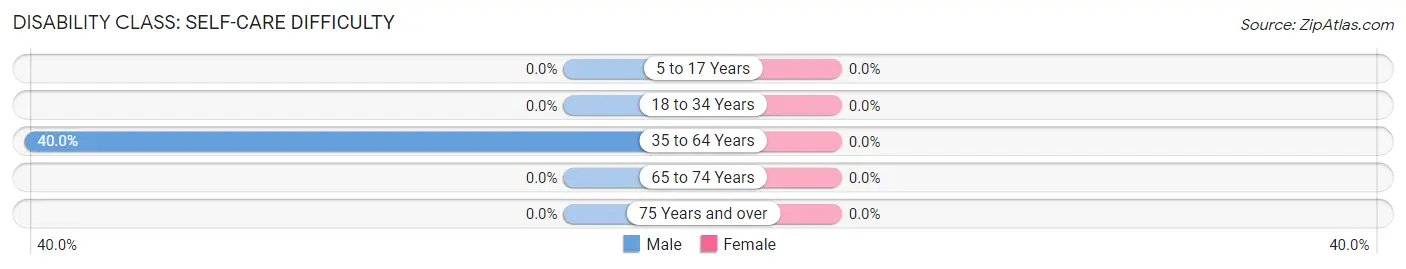
| Age Bracket | Male | Female |
| 5 to 17 Years | 0 (0.0%) | 0 (0.0%) |
| 18 to 34 Years | 0 (0.0%) | 0 (0.0%) |
| 35 to 64 Years | 12 (40.0%) | 0 (0.0%) |
| 65 to 74 Years | 0 (0.0%) | 0 (0.0%) |
| 75 Years and over | 0 (0.0%) | 0 (0.0%) |
Technology Access in Spray
Computing Device Access in Spray
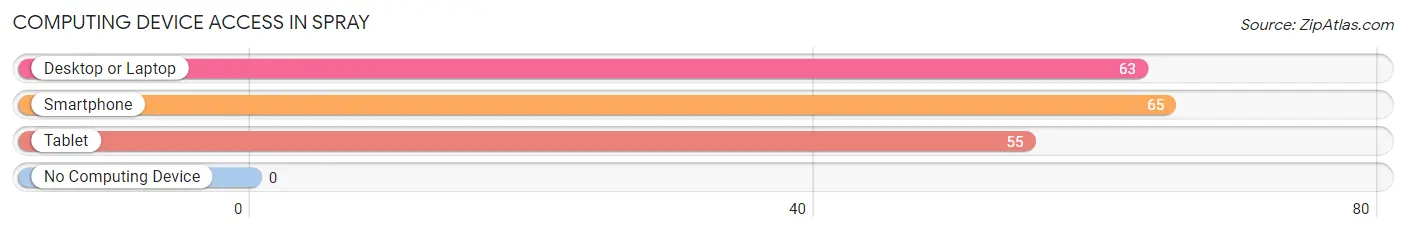
| Device Type | # Households | % Households |
| Desktop or Laptop | 63 | 77.8% |
| Smartphone | 65 | 80.2% |
| Tablet | 55 | 67.9% |
| No Computing Device | 0 | 0.0% |
| Total | 81 | 100.0% |
Internet Access in Spray
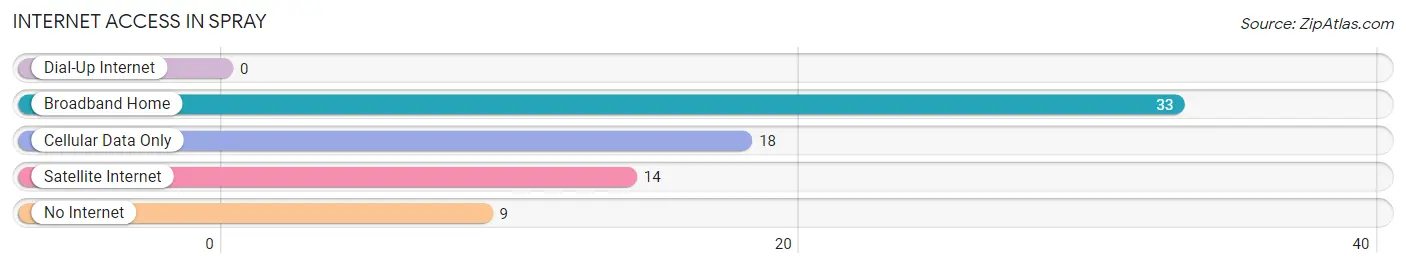
| Internet Type | # Households | % Households |
| Dial-Up Internet | 0 | 0.0% |
| Broadband Home | 33 | 40.7% |
| Cellular Data Only | 18 | 22.2% |
| Satellite Internet | 14 | 17.3% |
| No Internet | 9 | 11.1% |
| Total | 81 | 100.0% |
Spray Summary
Spray, Oregon is a small city located in the northeastern corner of the state, in the foothills of the Blue Mountains. It is situated along the John Day River, and is the county seat of Wheeler County. The city has a population of approximately 500 people, and is a rural community with a strong agricultural base.
History
Spray was founded in 1882 by a group of settlers from the nearby town of Mitchell. The settlers were looking for a place to settle and farm, and chose the area around the John Day River. The town was named after the nearby Spray River, which was named after a local Native American chief.
The town grew slowly, but steadily, and by the early 1900s it had become a thriving agricultural center. The town was home to a number of businesses, including a general store, a hotel, a blacksmith shop, and a sawmill.
In the 1920s, the town began to experience a period of growth and prosperity. The town was connected to the outside world by the Oregon Trunk Railroad, and the town's population grew to over 500 people.
Geography
Spray is located in the northeastern corner of Oregon, in the foothills of the Blue Mountains. The city is situated along the John Day River, and is the county seat of Wheeler County. The city is surrounded by rolling hills and grasslands, and is home to a variety of wildlife, including deer, elk, and antelope.
The climate in Spray is semi-arid, with hot summers and cold winters. The average annual temperature is around 50 degrees Fahrenheit, and the average annual precipitation is around 12 inches.
Economy
Spray's economy is largely based on agriculture. The town is home to a number of farms, and the surrounding area is used for grazing cattle and sheep. The town is also home to a number of small businesses, including a general store, a hotel, and a sawmill.
The town is also home to a number of recreational activities, including fishing, hunting, and camping. The nearby John Day River is a popular destination for kayaking and rafting.
Demographics
As of the 2010 census, the population of Spray was 498 people. The racial makeup of the town was 97.2% White, 0.2% African American, 0.4% Native American, 0.2% Asian, 0.2% from other races, and 1.9% from two or more races. Hispanic or Latino of any race were 1.2% of the population.
The median income for a household in Spray was $30,000, and the median income for a family was $35,000. The per capita income for the town was $14,000. About 15.2% of families and 17.2% of the population were below the poverty line, including 22.2% of those under age 18 and 8.3% of those age 65 or over.
Common Questions
What is the Total Population of Spray?
Total Population of Spray is 199.
What is the Total Male Population of Spray?
Total Male Population of Spray is 111.
What is the Total Female Population of Spray?
Total Female Population of Spray is 88.
What is the Ratio of Males per 100 Females in Spray?
There are 126.14 Males per 100 Females in Spray.
What is the Ratio of Females per 100 Males in Spray?
There are 79.28 Females per 100 Males in Spray.
What is the Median Population Age in Spray?
Median Population Age in Spray is 45.9 Years.
What is the Average Family Size in Spray
Average Family Size in Spray is 3.0 People.
What is the Average Household Size in Spray
Average Household Size in Spray is 2.2 People.
What is Per Capita Income in Spray?
Per Capita income in Spray is $20,473.
What is the Median Family Income in Spray?
Median Family Income in Spray is $75,000.
What is the Median Household income in Spray?
Median Household Income in Spray is $30,469.
What is Inequality or Gini Index in Spray?
Inequality or Gini Index in Spray is 0.42.
How Large is the Labor Force in Spray?
There are 59 People in the Labor Forcein in Spray.
What is the Percentage of People in the Labor Force in Spray?
35.8% of People are in the Labor Force in Spray.
What is the Unemployment Rate in Spray?
Unemployment Rate in Spray is 10.2%.