Raleigh Hills, OR
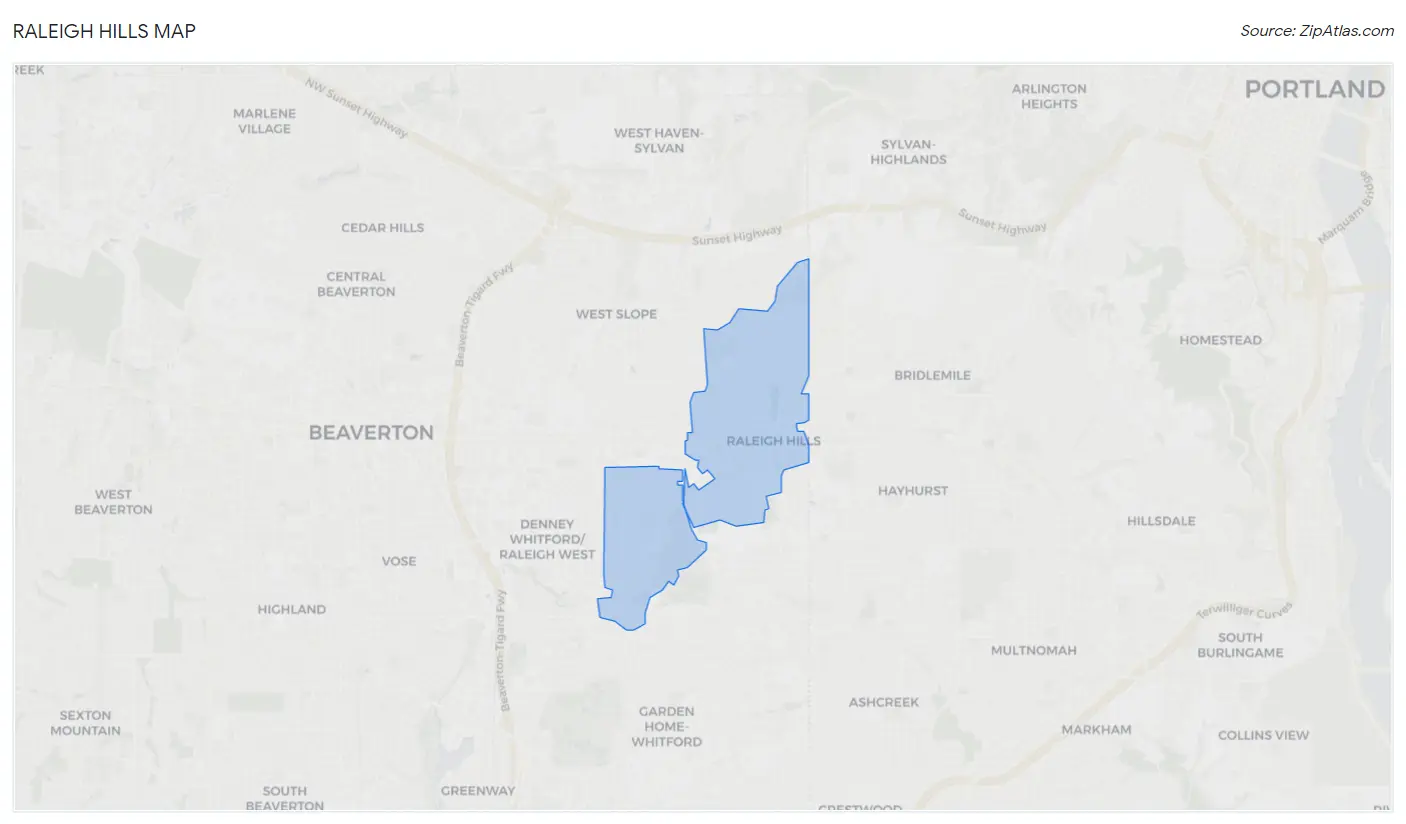
Raleigh Hills Map
Raleigh Hills Overview
6,737
TOTAL POPULATION
3,226
MALE POPULATION
3,511
FEMALE POPULATION
91.88
MALES / 100 FEMALES
108.83
FEMALES / 100 MALES
45.5
MEDIAN AGE
2.7
AVG FAMILY SIZE
2.1
AVG HOUSEHOLD SIZE
$87,969
PER CAPITA INCOME
$167,361
AVG FAMILY INCOME
$119,473
AVG HOUSEHOLD INCOME
33.0%
WAGE / INCOME GAP [ % ]
67.0¢/ $1
WAGE / INCOME GAP [ $ ]
0.53
INEQUALITY / GINI INDEX
3,741
LABOR FORCE [ PEOPLE ]
65.0%
PERCENT IN LABOR FORCE
4.4%
UNEMPLOYMENT RATE
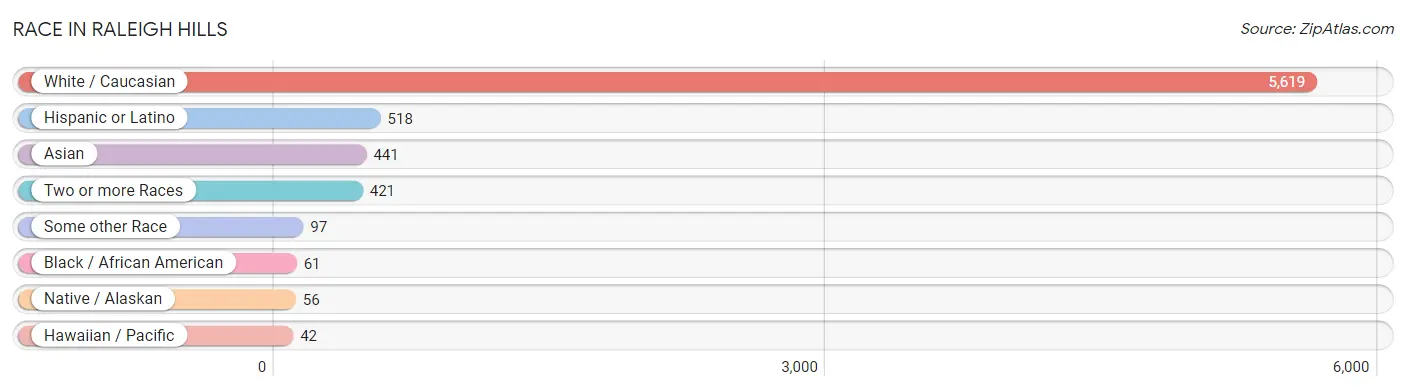
Race in Raleigh Hills
The most populous races in Raleigh Hills are White / Caucasian (5,619 | 83.4%), Hispanic or Latino (518 | 7.7%), and Asian (441 | 6.6%).
| Race | # Population | % Population |
| Asian | 441 | 6.6% |
| Black / African American | 61 | 0.9% |
| Hawaiian / Pacific | 42 | 0.6% |
| Hispanic or Latino | 518 | 7.7% |
| Native / Alaskan | 56 | 0.8% |
| White / Caucasian | 5,619 | 83.4% |
| Two or more Races | 421 | 6.2% |
| Some other Race | 97 | 1.4% |
| Total | 6,737 | 100.0% |
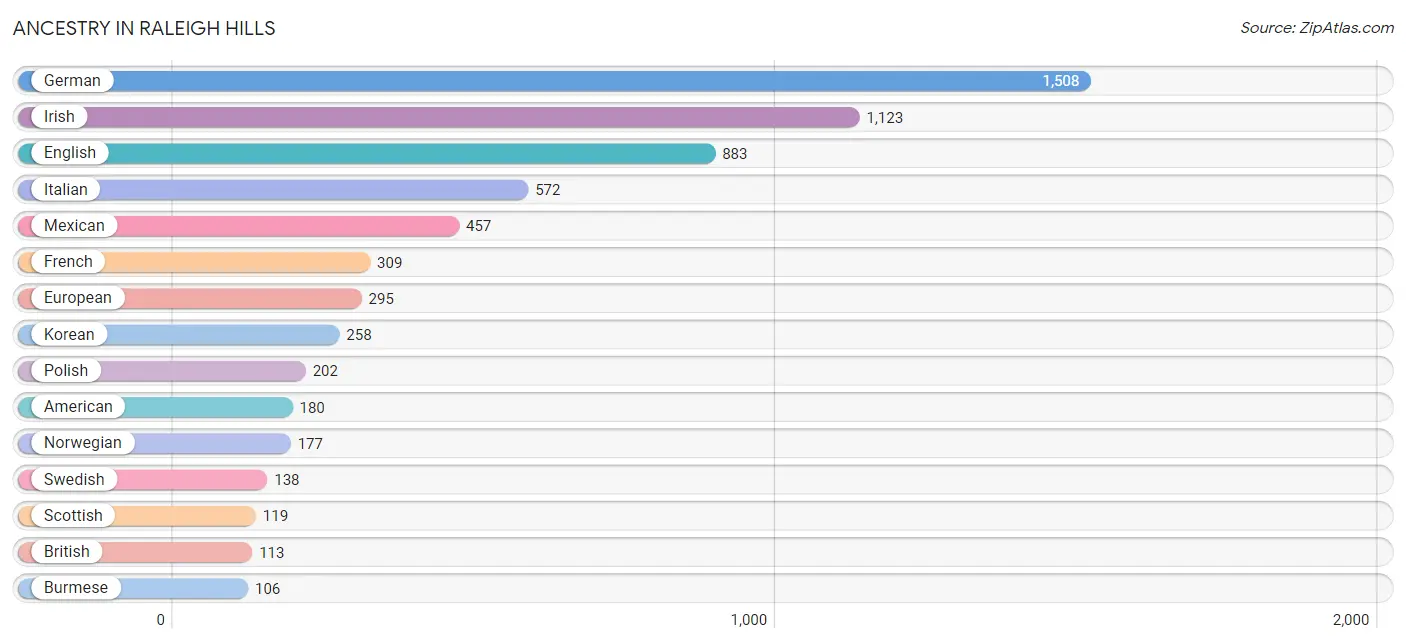
Ancestry in Raleigh Hills
The most populous ancestries reported in Raleigh Hills are German (1,508 | 22.4%), Irish (1,123 | 16.7%), English (883 | 13.1%), Italian (572 | 8.5%), and Mexican (457 | 6.8%), together accounting for 67.4% of all Raleigh Hills residents.
| Ancestry | # Population | % Population |
| American | 180 | 2.7% |
| Arab | 15 | 0.2% |
| Australian | 13 | 0.2% |
| Austrian | 12 | 0.2% |
| Basque | 13 | 0.2% |
| Bhutanese | 21 | 0.3% |
| Blackfeet | 22 | 0.3% |
| British | 113 | 1.7% |
| Burmese | 106 | 1.6% |
| Canadian | 15 | 0.2% |
| Cherokee | 56 | 0.8% |
| Choctaw | 10 | 0.2% |
| Croatian | 90 | 1.3% |
| Czech | 63 | 0.9% |
| Danish | 41 | 0.6% |
| Dominican | 11 | 0.2% |
| Dutch | 49 | 0.7% |
| Eastern European | 31 | 0.5% |
| English | 883 | 13.1% |
| European | 295 | 4.4% |
| Finnish | 16 | 0.2% |
| French | 309 | 4.6% |
| German | 1,508 | 22.4% |
| Greek | 52 | 0.8% |
| Guamanian / Chamorro | 16 | 0.2% |
| Hungarian | 77 | 1.1% |
| Indian (Asian) | 35 | 0.5% |
| Iranian | 38 | 0.6% |
| Irish | 1,123 | 16.7% |
| Italian | 572 | 8.5% |
| Korean | 258 | 3.8% |
| Latvian | 7 | 0.1% |
| Lebanese | 15 | 0.2% |
| Lithuanian | 24 | 0.4% |
| Mexican | 457 | 6.8% |
| Native Hawaiian | 56 | 0.8% |
| Northern European | 28 | 0.4% |
| Norwegian | 177 | 2.6% |
| Okinawan | 12 | 0.2% |
| Pakistani | 10 | 0.2% |
| Peruvian | 7 | 0.1% |
| Polish | 202 | 3.0% |
| Puerto Rican | 10 | 0.2% |
| Russian | 62 | 0.9% |
| Scandinavian | 61 | 0.9% |
| Scotch-Irish | 67 | 1.0% |
| Scottish | 119 | 1.8% |
| Sioux | 40 | 0.6% |
| Slovak | 14 | 0.2% |
| South American | 7 | 0.1% |
| South American Indian | 7 | 0.1% |
| Spanish | 13 | 0.2% |
| Sri Lankan | 91 | 1.3% |
| Swedish | 138 | 2.1% |
| Swiss | 5 | 0.1% |
| Taiwanese | 7 | 0.1% |
| Thai | 68 | 1.0% |
| Ukrainian | 32 | 0.5% |
| Welsh | 28 | 0.4% | View All 59 Rows |
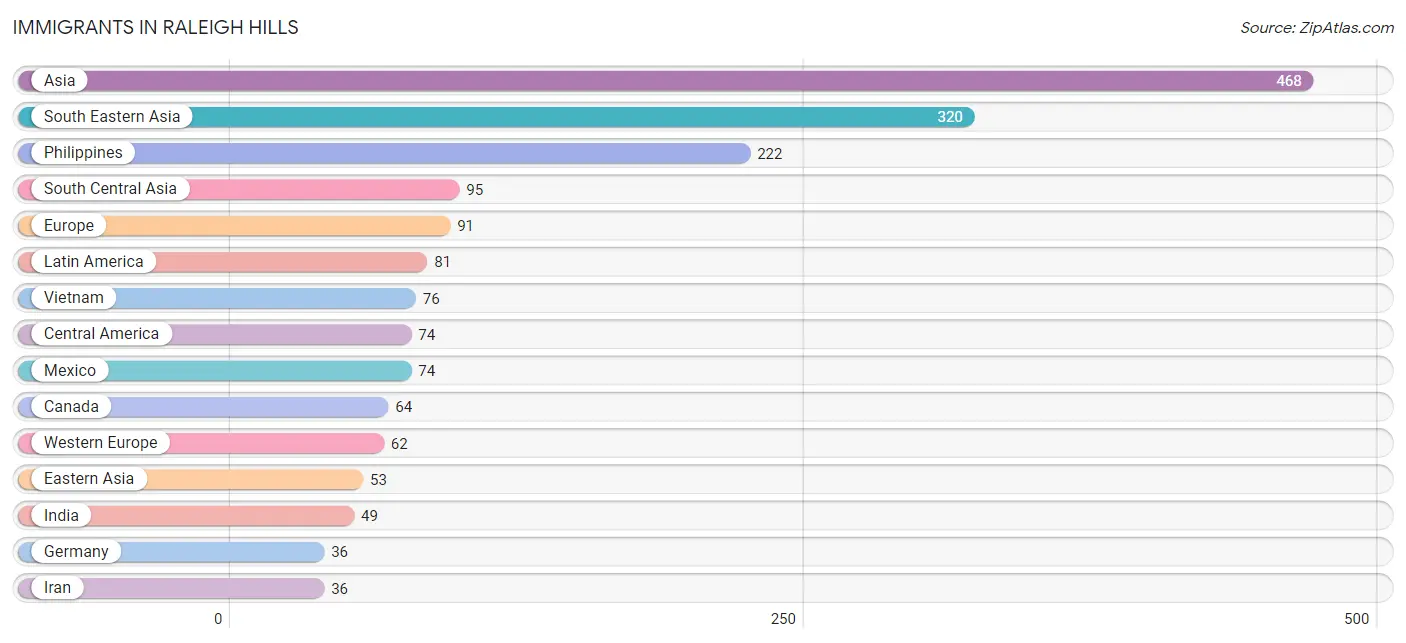
Immigrants in Raleigh Hills
The most numerous immigrant groups reported in Raleigh Hills came from Asia (468 | 7.0%), South Eastern Asia (320 | 4.8%), Philippines (222 | 3.3%), South Central Asia (95 | 1.4%), and Europe (91 | 1.3%), together accounting for 17.8% of all Raleigh Hills residents.
| Immigration Origin | # Population | % Population |
| Asia | 468 | 7.0% |
| Australia | 13 | 0.2% |
| Canada | 64 | 0.9% |
| Central America | 74 | 1.1% |
| China | 20 | 0.3% |
| Eastern Asia | 53 | 0.8% |
| England | 15 | 0.2% |
| Europe | 91 | 1.3% |
| France | 6 | 0.1% |
| Germany | 36 | 0.5% |
| Hong Kong | 20 | 0.3% |
| India | 49 | 0.7% |
| Iran | 36 | 0.5% |
| Korea | 33 | 0.5% |
| Latin America | 81 | 1.2% |
| Mexico | 74 | 1.1% |
| Netherlands | 20 | 0.3% |
| Northern Europe | 29 | 0.4% |
| Oceania | 28 | 0.4% |
| Pakistan | 10 | 0.2% |
| Peru | 7 | 0.1% |
| Philippines | 222 | 3.3% |
| Singapore | 12 | 0.2% |
| South America | 7 | 0.1% |
| South Central Asia | 95 | 1.4% |
| South Eastern Asia | 320 | 4.8% |
| Thailand | 10 | 0.2% |
| Vietnam | 76 | 1.1% |
| Western Europe | 62 | 0.9% | View All 29 Rows |
Sex and Age in Raleigh Hills
Sex and Age in Raleigh Hills
The most populous age groups in Raleigh Hills are 60 to 64 Years (323 | 10.0%) for men and 45 to 49 Years (376 | 10.7%) for women.
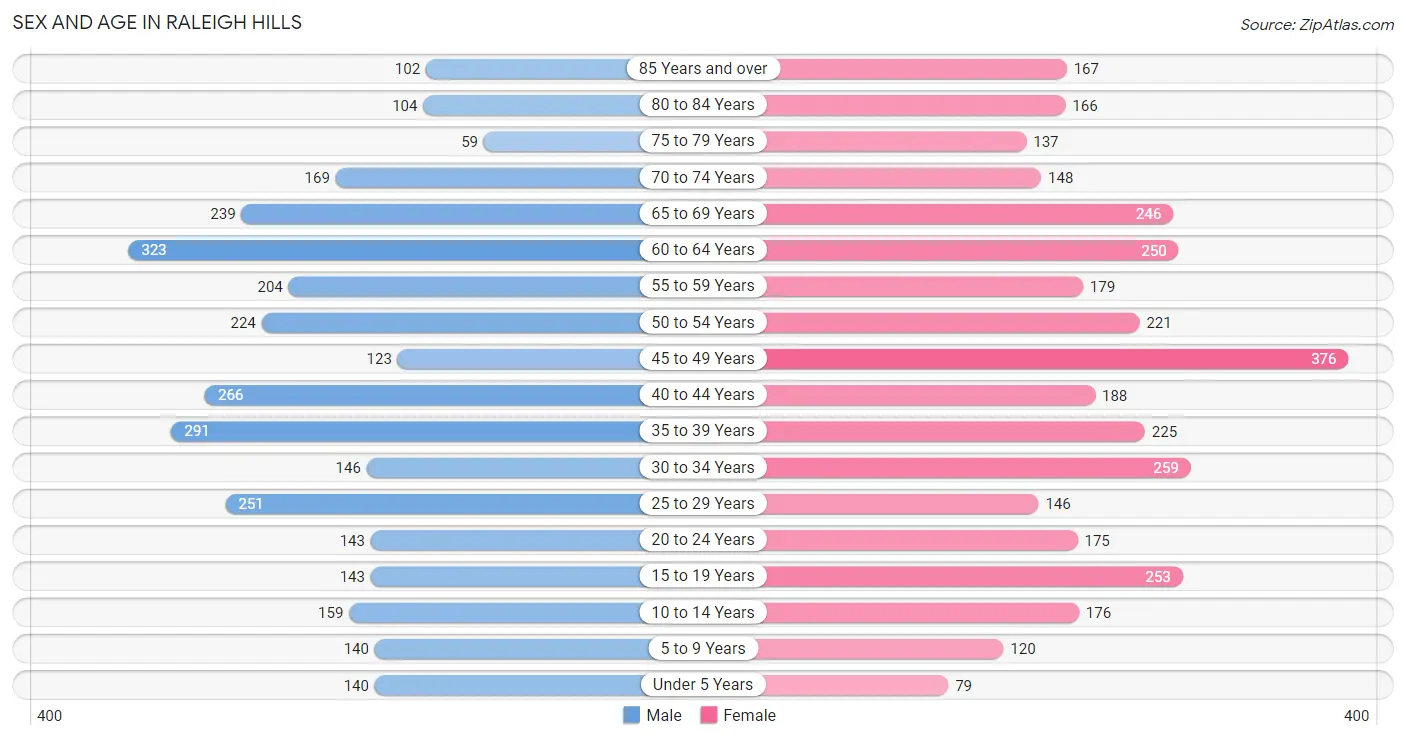
| Age Bracket | Male | Female |
| Under 5 Years | 140 (4.3%) | 79 (2.2%) |
| 5 to 9 Years | 140 (4.3%) | 120 (3.4%) |
| 10 to 14 Years | 159 (4.9%) | 176 (5.0%) |
| 15 to 19 Years | 143 (4.4%) | 253 (7.2%) |
| 20 to 24 Years | 143 (4.4%) | 175 (5.0%) |
| 25 to 29 Years | 251 (7.8%) | 146 (4.2%) |
| 30 to 34 Years | 146 (4.5%) | 259 (7.4%) |
| 35 to 39 Years | 291 (9.0%) | 225 (6.4%) |
| 40 to 44 Years | 266 (8.3%) | 188 (5.3%) |
| 45 to 49 Years | 123 (3.8%) | 376 (10.7%) |
| 50 to 54 Years | 224 (6.9%) | 221 (6.3%) |
| 55 to 59 Years | 204 (6.3%) | 179 (5.1%) |
| 60 to 64 Years | 323 (10.0%) | 250 (7.1%) |
| 65 to 69 Years | 239 (7.4%) | 246 (7.0%) |
| 70 to 74 Years | 169 (5.2%) | 148 (4.2%) |
| 75 to 79 Years | 59 (1.8%) | 137 (3.9%) |
| 80 to 84 Years | 104 (3.2%) | 166 (4.7%) |
| 85 Years and over | 102 (3.2%) | 167 (4.8%) |
| Total | 3,226 (100.0%) | 3,511 (100.0%) |
Families and Households in Raleigh Hills
Median Family Size in Raleigh Hills
The median family size in Raleigh Hills is 2.73 persons per family, with married-couple families (1,699 | 90.7%) accounting for the largest median family size of 2.75 persons per family. On the other hand, single male/father families (37 | 2.0%) represent the smallest median family size with 2.19 persons per family.
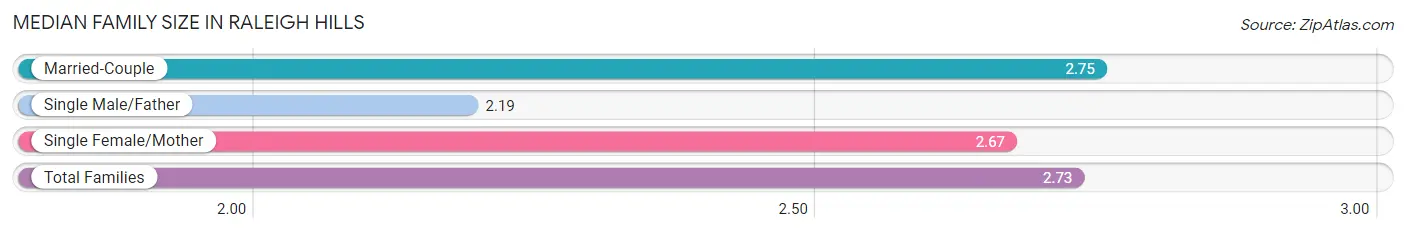
| Family Type | # Families | Family Size |
| Married-Couple | 1,699 (90.7%) | 2.75 |
| Single Male/Father | 37 (2.0%) | 2.19 |
| Single Female/Mother | 138 (7.4%) | 2.67 |
| Total Families | 1,874 (100.0%) | 2.73 |
Median Household Size in Raleigh Hills
The median household size in Raleigh Hills is 2.09 persons per household, with single female/mother households (138 | 4.3%) accounting for the largest median household size of 2.94 persons per household. non-family households (1,323 | 41.4%) represent the smallest median household size with 1.11 persons per household.
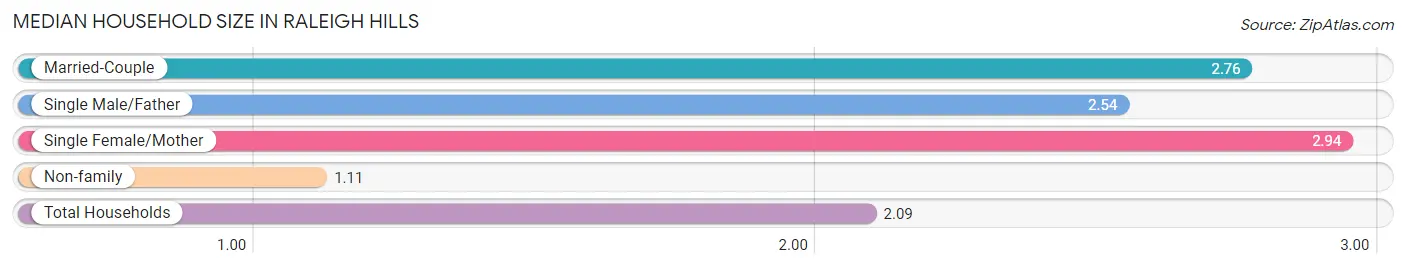
| Household Type | # Households | Household Size |
| Married-Couple | 1,699 (53.1%) | 2.76 |
| Single Male/Father | 37 (1.2%) | 2.54 |
| Single Female/Mother | 138 (4.3%) | 2.94 |
| Non-family | 1,323 (41.4%) | 1.11 |
| Total Households | 3,197 (100.0%) | 2.09 |
Household Size by Marriage Status in Raleigh Hills
Out of a total of 3,197 households in Raleigh Hills, 1,874 (58.6%) are family households, while 1,323 (41.4%) are nonfamily households. The most numerous type of family households are 2-person households, comprising 866, and the most common type of nonfamily households are 1-person households, comprising 1,203.
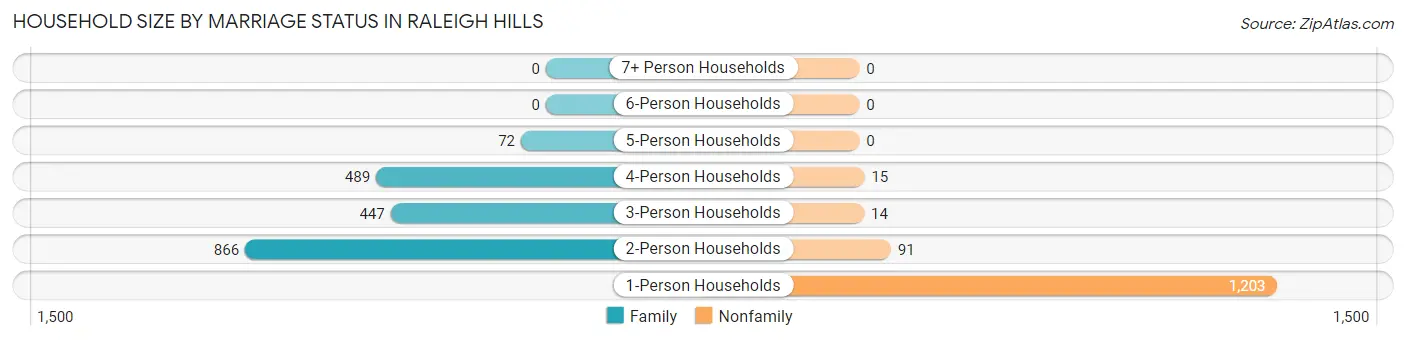
| Household Size | Family Households | Nonfamily Households |
| 1-Person Households | - | 1,203 (37.6%) |
| 2-Person Households | 866 (27.1%) | 91 (2.9%) |
| 3-Person Households | 447 (14.0%) | 14 (0.4%) |
| 4-Person Households | 489 (15.3%) | 15 (0.5%) |
| 5-Person Households | 72 (2.2%) | 0 (0.0%) |
| 6-Person Households | 0 (0.0%) | 0 (0.0%) |
| 7+ Person Households | 0 (0.0%) | 0 (0.0%) |
| Total | 1,874 (58.6%) | 1,323 (41.4%) |
Female Fertility in Raleigh Hills
Fertility by Age in Raleigh Hills
Average fertility rate in Raleigh Hills is 61.0 births per 1,000 women. Women in the age bracket of 35 to 50 years have the highest fertility rate with 104.0 births per 1,000 women. Women in the age bracket of 35 to 50 years acount for 86.1% of all women with births.
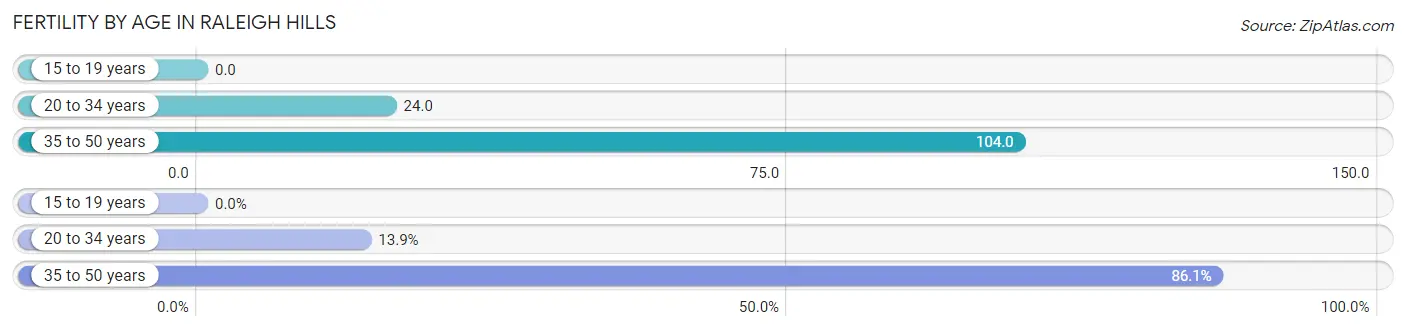
| Age Bracket | Women with Births | Births / 1,000 Women |
| 15 to 19 years | 0 (0.0%) | 0.0 |
| 20 to 34 years | 14 (13.9%) | 24.0 |
| 35 to 50 years | 87 (86.1%) | 104.0 |
| Total | 101 (100.0%) | 61.0 |
Fertility by Age by Marriage Status in Raleigh Hills
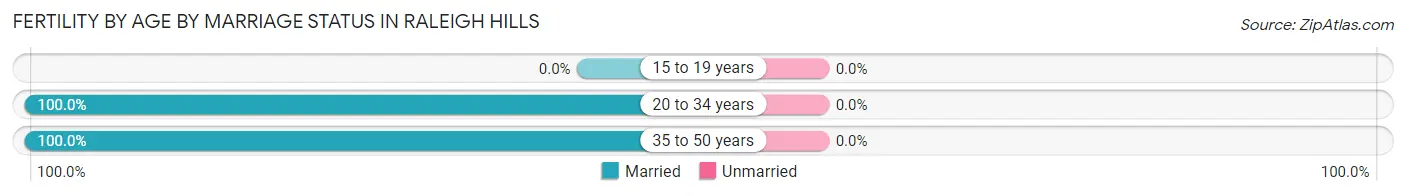
| Age Bracket | Married | Unmarried |
| 15 to 19 years | 0 (0.0%) | 0 (0.0%) |
| 20 to 34 years | 14 (100.0%) | 0 (0.0%) |
| 35 to 50 years | 87 (100.0%) | 0 (0.0%) |
| Total | 101 (100.0%) | 0 (0.0%) |
Fertility by Education in Raleigh Hills
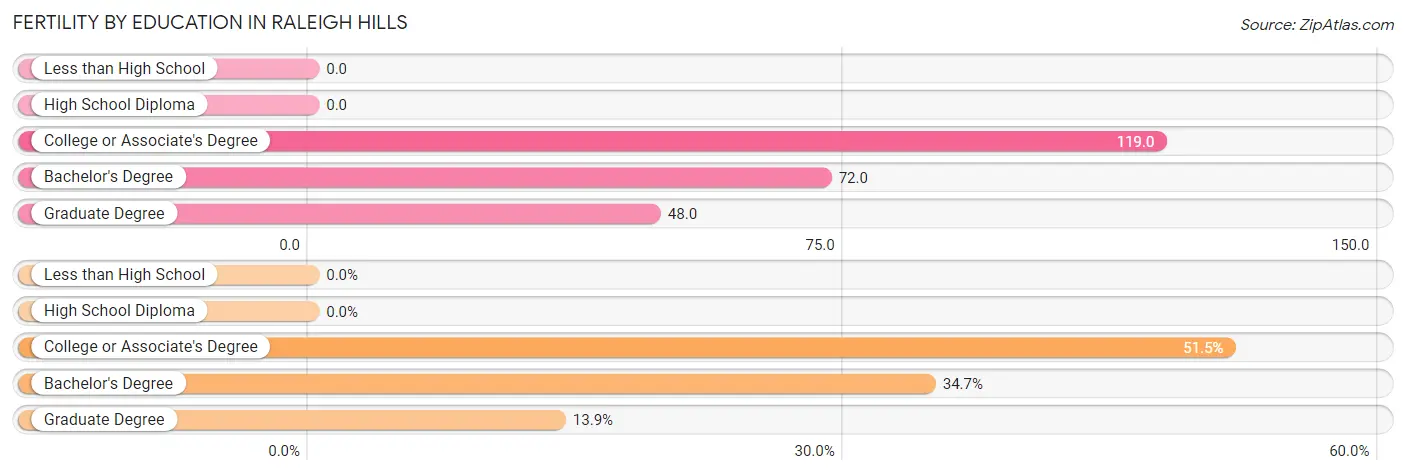
| Educational Attainment | Women with Births | Births / 1,000 Women |
| Less than High School | 0 (0.0%) | 0.0 |
| High School Diploma | 0 (0.0%) | 0.0 |
| College or Associate's Degree | 52 (51.5%) | 119.0 |
| Bachelor's Degree | 35 (34.6%) | 72.0 |
| Graduate Degree | 14 (13.9%) | 48.0 |
| Total | 101 (100.0%) | 61.0 |
Fertility by Education by Marriage Status in Raleigh Hills
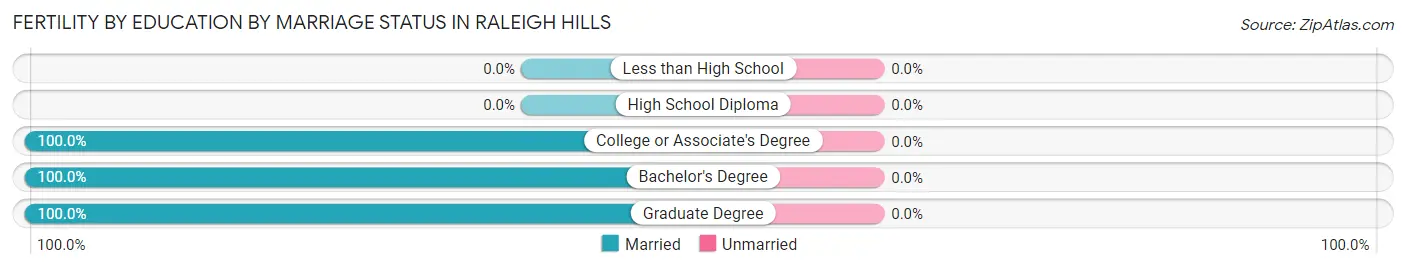
| Educational Attainment | Married | Unmarried |
| Less than High School | 0 (0.0%) | 0 (0.0%) |
| High School Diploma | 0 (0.0%) | 0 (0.0%) |
| College or Associate's Degree | 52 (100.0%) | 0 (0.0%) |
| Bachelor's Degree | 35 (100.0%) | 0 (0.0%) |
| Graduate Degree | 14 (100.0%) | 0 (0.0%) |
| Total | 101 (100.0%) | 0 (0.0%) |
Income in Raleigh Hills
Income Overview in Raleigh Hills
Per Capita Income in Raleigh Hills is $87,969, while median incomes of families and households are $167,361 and $119,473 respectively.
| Characteristic | Number | Measure |
| Per Capita Income | 6,737 | $87,969 |
| Median Family Income | 1,874 | $167,361 |
| Mean Family Income | 1,874 | $251,830 |
| Median Household Income | 3,197 | $119,473 |
| Mean Household Income | 3,197 | $186,798 |
| Income Deficit | 1,874 | $0 |
| Wage / Income Gap (%) | 6,737 | 32.99% |
| Wage / Income Gap ($) | 6,737 | 67.01¢ per $1 |
| Gini / Inequality Index | 6,737 | 0.53 |
Earnings by Sex in Raleigh Hills
Average Earnings in Raleigh Hills are $60,406, $73,929 for men and $49,543 for women, a difference of 33.0%.
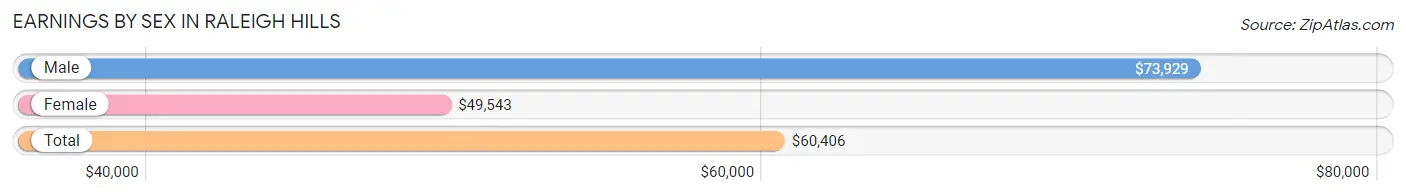
| Sex | Number | Average Earnings |
| Male | 2,168 (55.6%) | $73,929 |
| Female | 1,729 (44.4%) | $49,543 |
| Total | 3,897 (100.0%) | $60,406 |
Earnings by Sex by Income Bracket in Raleigh Hills
The most common earnings brackets in Raleigh Hills are $100,000+ for men (873 | 40.3%) and $100,000+ for women (442 | 25.6%).
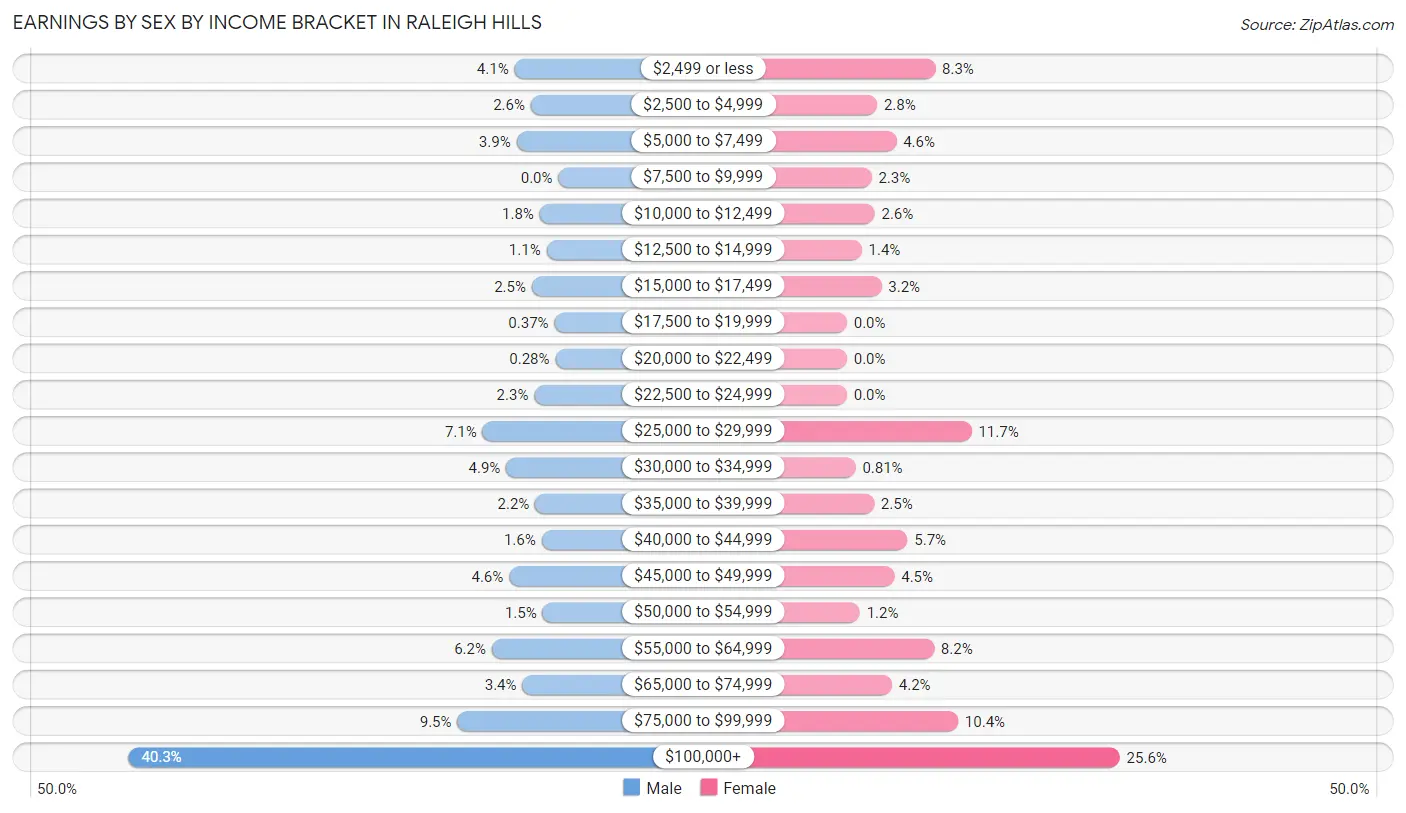
| Income | Male | Female |
| $2,499 or less | 89 (4.1%) | 143 (8.3%) |
| $2,500 to $4,999 | 56 (2.6%) | 49 (2.8%) |
| $5,000 to $7,499 | 85 (3.9%) | 80 (4.6%) |
| $7,500 to $9,999 | 0 (0.0%) | 40 (2.3%) |
| $10,000 to $12,499 | 38 (1.8%) | 45 (2.6%) |
| $12,500 to $14,999 | 24 (1.1%) | 24 (1.4%) |
| $15,000 to $17,499 | 54 (2.5%) | 56 (3.2%) |
| $17,500 to $19,999 | 8 (0.4%) | 0 (0.0%) |
| $20,000 to $22,499 | 6 (0.3%) | 0 (0.0%) |
| $22,500 to $24,999 | 49 (2.3%) | 0 (0.0%) |
| $25,000 to $29,999 | 154 (7.1%) | 202 (11.7%) |
| $30,000 to $34,999 | 106 (4.9%) | 14 (0.8%) |
| $35,000 to $39,999 | 47 (2.2%) | 44 (2.5%) |
| $40,000 to $44,999 | 34 (1.6%) | 98 (5.7%) |
| $45,000 to $49,999 | 100 (4.6%) | 77 (4.4%) |
| $50,000 to $54,999 | 32 (1.5%) | 21 (1.2%) |
| $55,000 to $64,999 | 135 (6.2%) | 141 (8.2%) |
| $65,000 to $74,999 | 73 (3.4%) | 73 (4.2%) |
| $75,000 to $99,999 | 205 (9.5%) | 180 (10.4%) |
| $100,000+ | 873 (40.3%) | 442 (25.6%) |
| Total | 2,168 (100.0%) | 1,729 (100.0%) |
Earnings by Sex by Educational Attainment in Raleigh Hills
Average earnings in Raleigh Hills are $86,410 for men and $58,750 for women, a difference of 32.0%. Men with an educational attainment of bachelor's degree enjoy the highest average annual earnings of $147,917, while those with college or associate's degree education earn the least with $38,929. Women with an educational attainment of graduate degree earn the most with the average annual earnings of $96,250, while those with college or associate's degree education have the smallest earnings of $29,331.
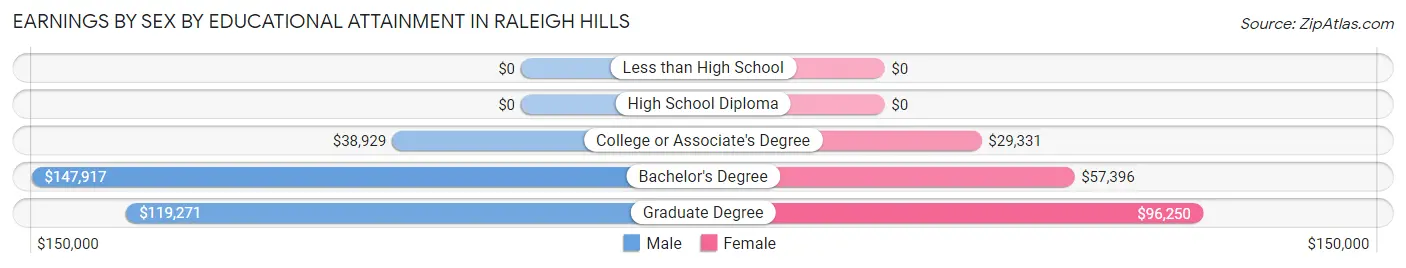
| Educational Attainment | Male Income | Female Income |
| Less than High School | - | - |
| High School Diploma | - | - |
| College or Associate's Degree | $38,929 | $29,331 |
| Bachelor's Degree | $147,917 | $57,396 |
| Graduate Degree | $119,271 | $96,250 |
| Total | $86,410 | $58,750 |
Family Income in Raleigh Hills
Family Income Brackets in Raleigh Hills
According to the Raleigh Hills family income data, there are 836 families falling into the $200,000+ income range, which is the most common income bracket and makes up 44.6% of all families.
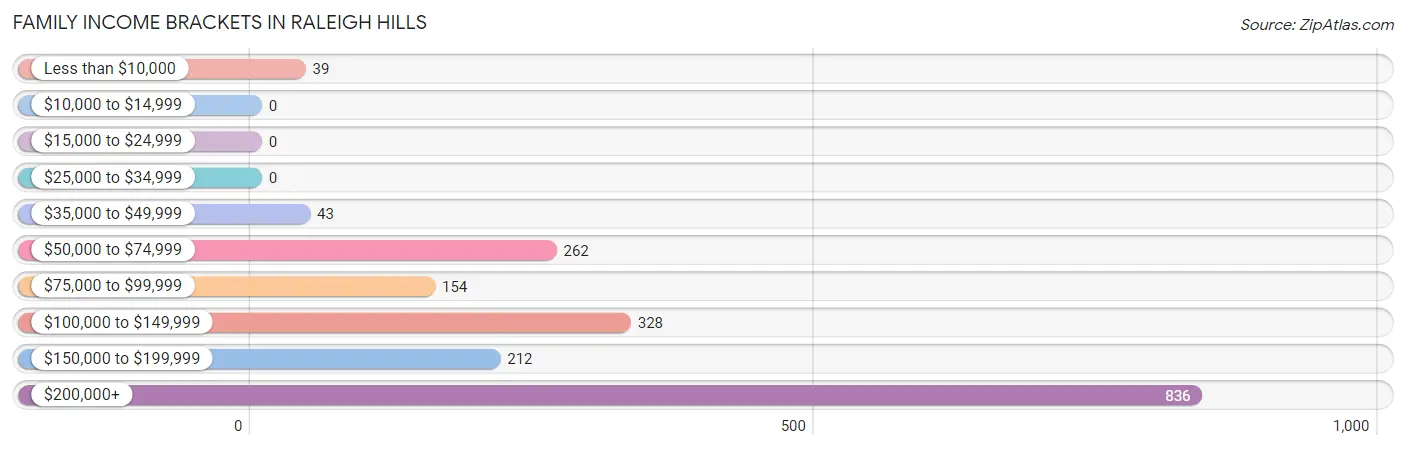
| Income Bracket | # Families | % Families |
| Less than $10,000 | 39 | 2.1% |
| $10,000 to $14,999 | 0 | 0.0% |
| $15,000 to $24,999 | 0 | 0.0% |
| $25,000 to $34,999 | 0 | 0.0% |
| $35,000 to $49,999 | 43 | 2.3% |
| $50,000 to $74,999 | 262 | 14.0% |
| $75,000 to $99,999 | 154 | 8.2% |
| $100,000 to $149,999 | 328 | 17.5% |
| $150,000 to $199,999 | 212 | 11.3% |
| $200,000+ | 836 | 44.6% |
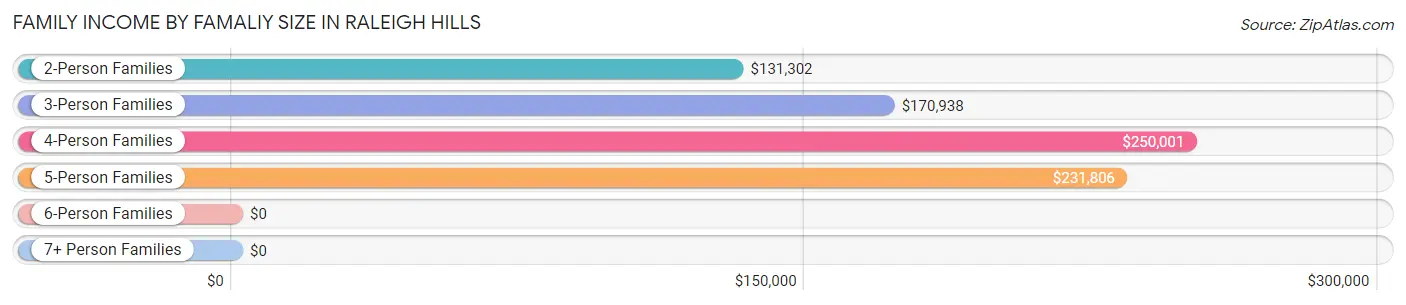
Family Income by Famaliy Size in Raleigh Hills
4-person families (458 | 24.4%) account for the highest median family income in Raleigh Hills with $250,001 per family, while 2-person families (909 | 48.5%) have the highest median income of $65,651 per family member.
| Income Bracket | # Families | Median Income |
| 2-Person Families | 909 (48.5%) | $131,302 |
| 3-Person Families | 435 (23.2%) | $170,938 |
| 4-Person Families | 458 (24.4%) | $250,001 |
| 5-Person Families | 72 (3.8%) | $231,806 |
| 6-Person Families | 0 (0.0%) | $0 |
| 7+ Person Families | 0 (0.0%) | $0 |
| Total | 1,874 (100.0%) | $167,361 |
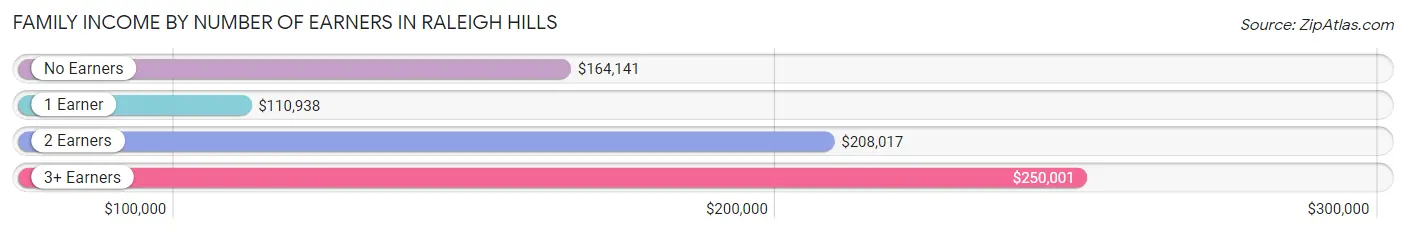
Family Income by Number of Earners in Raleigh Hills
The median family income in Raleigh Hills is $167,361, with families comprising 3+ earners (179) having the highest median family income of $250,001, while families with 1 earner (486) have the lowest median family income of $110,938, accounting for 9.6% and 25.9% of families, respectively.
| Number of Earners | # Families | Median Income |
| No Earners | 253 (13.5%) | $164,141 |
| 1 Earner | 486 (25.9%) | $110,938 |
| 2 Earners | 956 (51.0%) | $208,017 |
| 3+ Earners | 179 (9.6%) | $250,001 |
| Total | 1,874 (100.0%) | $167,361 |
Household Income in Raleigh Hills
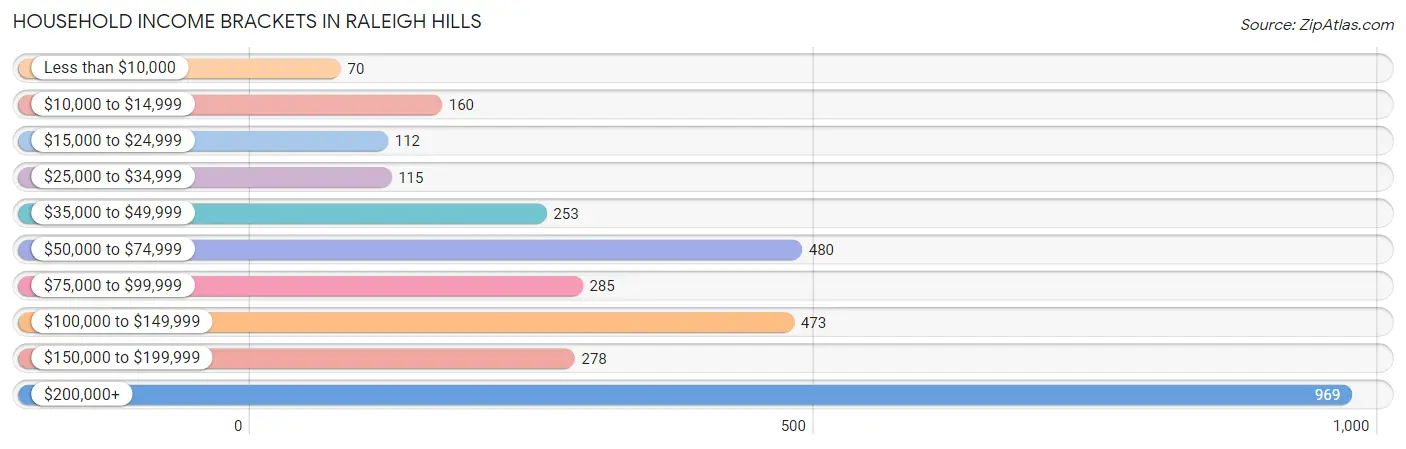
Household Income Brackets in Raleigh Hills
With 969 households falling in the category, the $200,000+ income range is the most frequent in Raleigh Hills, accounting for 30.3% of all households. In contrast, only 70 households (2.2%) fall into the less than $10,000 income bracket, making it the least populous group.
| Income Bracket | # Households | % Households |
| Less than $10,000 | 70 | 2.2% |
| $10,000 to $14,999 | 160 | 5.0% |
| $15,000 to $24,999 | 112 | 3.5% |
| $25,000 to $34,999 | 115 | 3.6% |
| $35,000 to $49,999 | 253 | 7.9% |
| $50,000 to $74,999 | 480 | 15.0% |
| $75,000 to $99,999 | 285 | 8.9% |
| $100,000 to $149,999 | 473 | 14.8% |
| $150,000 to $199,999 | 278 | 8.7% |
| $200,000+ | 969 | 30.3% |
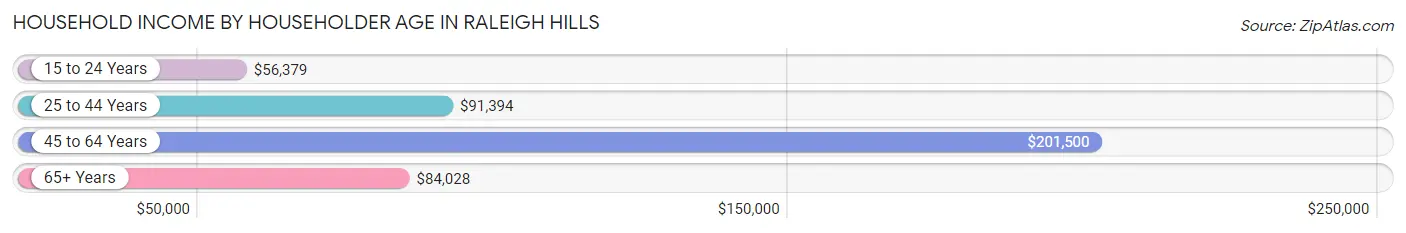
Household Income by Householder Age in Raleigh Hills
The median household income in Raleigh Hills is $119,473, with the highest median household income of $201,500 found in the 45 to 64 years age bracket for the primary householder. A total of 1,154 households (36.1%) fall into this category. Meanwhile, the 15 to 24 years age bracket for the primary householder has the lowest median household income of $56,379, with 144 households (4.5%) in this group.
| Income Bracket | # Households | Median Income |
| 15 to 24 Years | 144 (4.5%) | $56,379 |
| 25 to 44 Years | 842 (26.3%) | $91,394 |
| 45 to 64 Years | 1,154 (36.1%) | $201,500 |
| 65+ Years | 1,057 (33.1%) | $84,028 |
| Total | 3,197 (100.0%) | $119,473 |
Poverty in Raleigh Hills
Income Below Poverty by Sex and Age in Raleigh Hills
With 2.1% poverty level for males and 8.3% for females among the residents of Raleigh Hills, 35 to 44 year old males and 18 to 24 year old females are the most vulnerable to poverty, with 38 males (6.8%) and 44 females (22.6%) in their respective age groups living below the poverty level.
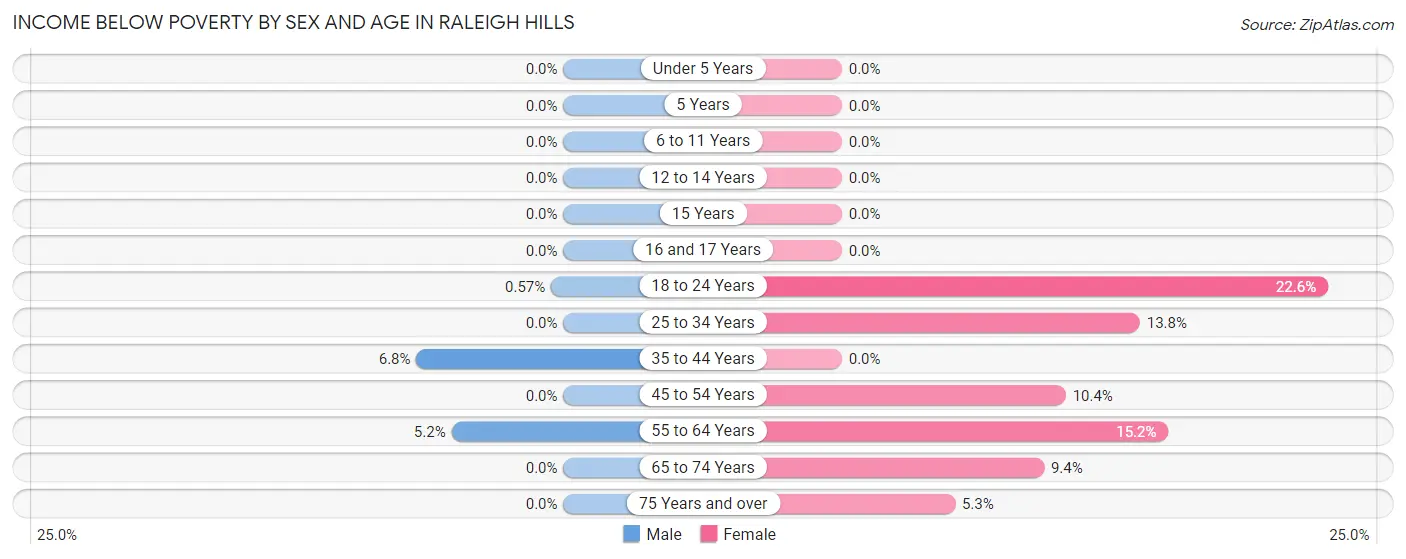
| Age Bracket | Male | Female |
| Under 5 Years | 0 (0.0%) | 0 (0.0%) |
| 5 Years | 0 (0.0%) | 0 (0.0%) |
| 6 to 11 Years | 0 (0.0%) | 0 (0.0%) |
| 12 to 14 Years | 0 (0.0%) | 0 (0.0%) |
| 15 Years | 0 (0.0%) | 0 (0.0%) |
| 16 and 17 Years | 0 (0.0%) | 0 (0.0%) |
| 18 to 24 Years | 1 (0.6%) | 44 (22.6%) |
| 25 to 34 Years | 0 (0.0%) | 56 (13.8%) |
| 35 to 44 Years | 38 (6.8%) | 0 (0.0%) |
| 45 to 54 Years | 0 (0.0%) | 62 (10.4%) |
| 55 to 64 Years | 27 (5.2%) | 65 (15.1%) |
| 65 to 74 Years | 0 (0.0%) | 36 (9.4%) |
| 75 Years and over | 0 (0.0%) | 23 (5.2%) |
| Total | 66 (2.1%) | 286 (8.3%) |
Income Above Poverty by Sex and Age in Raleigh Hills
According to the poverty statistics in Raleigh Hills, males aged under 5 years and females aged under 5 years are the age groups that are most secure financially, with 100.0% of males and 100.0% of females in these age groups living above the poverty line.
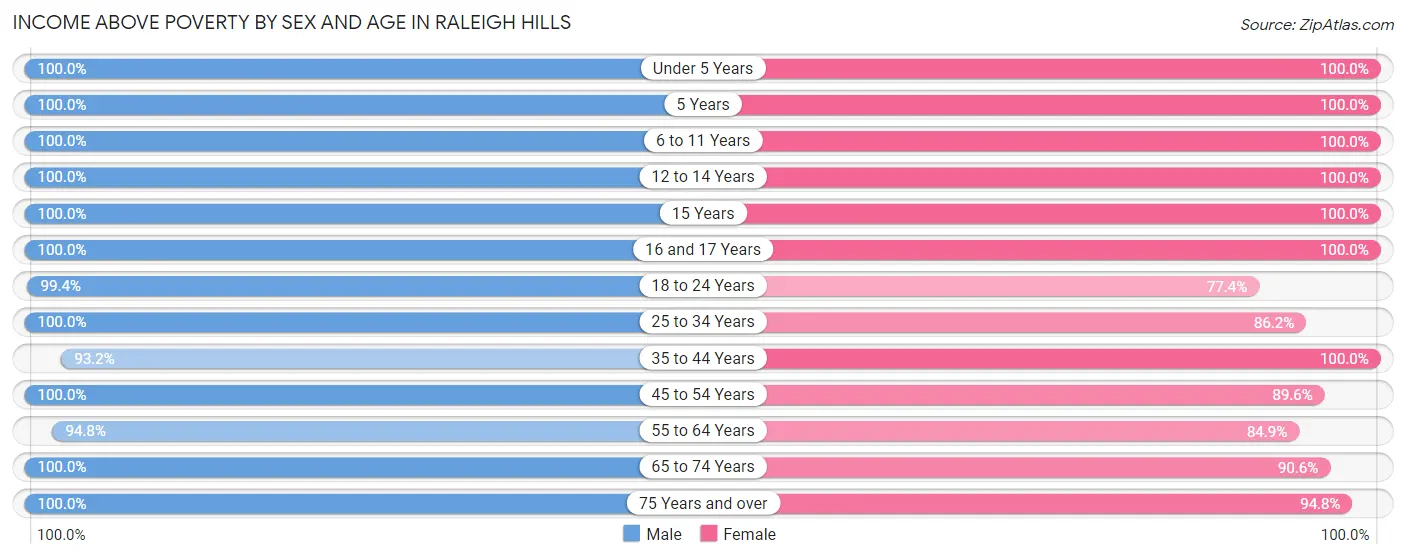
| Age Bracket | Male | Female |
| Under 5 Years | 140 (100.0%) | 79 (100.0%) |
| 5 Years | 31 (100.0%) | 38 (100.0%) |
| 6 to 11 Years | 122 (100.0%) | 163 (100.0%) |
| 12 to 14 Years | 146 (100.0%) | 84 (100.0%) |
| 15 Years | 80 (100.0%) | 87 (100.0%) |
| 16 and 17 Years | 31 (100.0%) | 146 (100.0%) |
| 18 to 24 Years | 174 (99.4%) | 151 (77.4%) |
| 25 to 34 Years | 397 (100.0%) | 349 (86.2%) |
| 35 to 44 Years | 519 (93.2%) | 413 (100.0%) |
| 45 to 54 Years | 347 (100.0%) | 535 (89.6%) |
| 55 to 64 Years | 493 (94.8%) | 364 (84.9%) |
| 65 to 74 Years | 400 (100.0%) | 348 (90.6%) |
| 75 Years and over | 261 (100.0%) | 415 (94.8%) |
| Total | 3,141 (97.9%) | 3,172 (91.7%) |
Income Below Poverty Among Married-Couple Families in Raleigh Hills
The poverty statistics for married-couple families in Raleigh Hills show that 1.3% or 23 of the total 1,699 families live below the poverty line. Families with no children have the highest poverty rate of 2.7%, comprising of 23 families. On the other hand, families with 1 or 2 children have the lowest poverty rate of 0.0%, which includes 0 families.
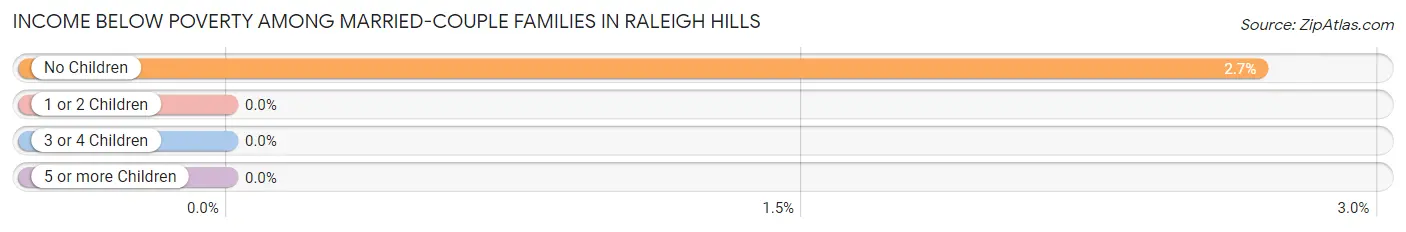
| Children | Above Poverty | Below Poverty |
| No Children | 831 (97.3%) | 23 (2.7%) |
| 1 or 2 Children | 810 (100.0%) | 0 (0.0%) |
| 3 or 4 Children | 35 (100.0%) | 0 (0.0%) |
| 5 or more Children | 0 (0.0%) | 0 (0.0%) |
| Total | 1,676 (98.7%) | 23 (1.3%) |
Income Below Poverty Among Single-Parent Households in Raleigh Hills
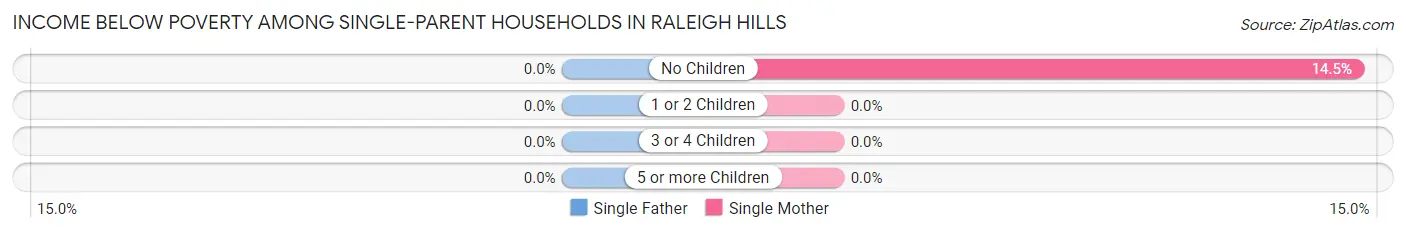
| Children | Single Father | Single Mother |
| No Children | 0 (0.0%) | 17 (14.5%) |
| 1 or 2 Children | 0 (0.0%) | 0 (0.0%) |
| 3 or 4 Children | 0 (0.0%) | 0 (0.0%) |
| 5 or more Children | 0 (0.0%) | 0 (0.0%) |
| Total | 0 (0.0%) | 17 (12.3%) |
Income Below Poverty Among Married-Couple vs Single-Parent Households in Raleigh Hills
The poverty data for Raleigh Hills shows that 23 of the married-couple family households (1.3%) and 17 of the single-parent households (9.7%) are living below the poverty level. Within the married-couple family households, those with no children have the highest poverty rate, with 23 households (2.7%) falling below the poverty line. Among the single-parent households, those with no children have the highest poverty rate, with 17 household (11.0%) living below poverty.
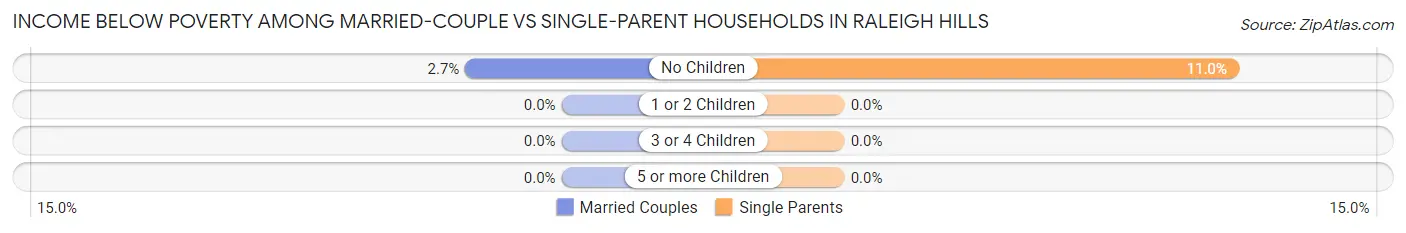
| Children | Married-Couple Families | Single-Parent Households |
| No Children | 23 (2.7%) | 17 (11.0%) |
| 1 or 2 Children | 0 (0.0%) | 0 (0.0%) |
| 3 or 4 Children | 0 (0.0%) | 0 (0.0%) |
| 5 or more Children | 0 (0.0%) | 0 (0.0%) |
| Total | 23 (1.3%) | 17 (9.7%) |
Employment Characteristics in Raleigh Hills
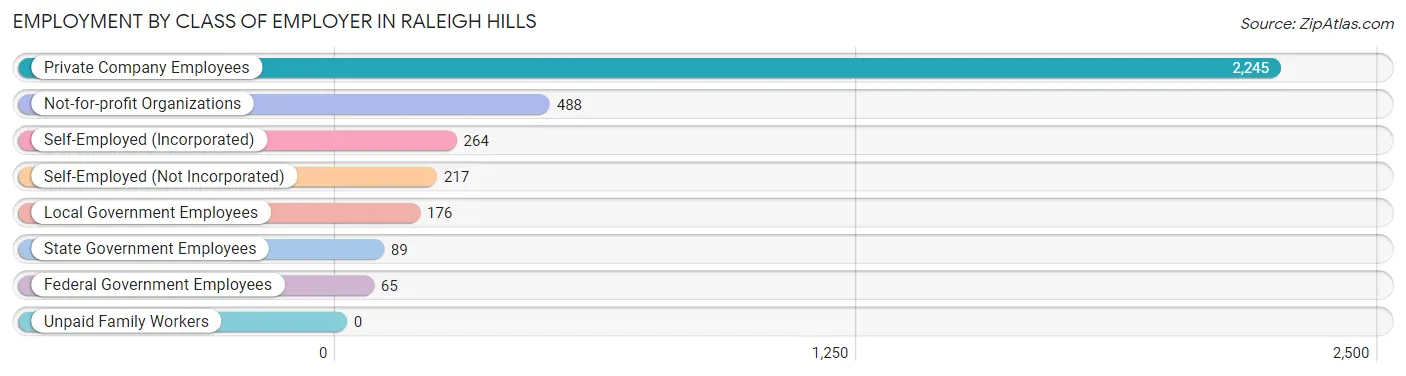
Employment by Class of Employer in Raleigh Hills
Among the 3,544 employed individuals in Raleigh Hills, private company employees (2,245 | 63.3%), not-for-profit organizations (488 | 13.8%), and self-employed (incorporated) (264 | 7.4%) make up the most common classes of employment.
| Employer Class | # Employees | % Employees |
| Private Company Employees | 2,245 | 63.3% |
| Self-Employed (Incorporated) | 264 | 7.4% |
| Self-Employed (Not Incorporated) | 217 | 6.1% |
| Not-for-profit Organizations | 488 | 13.8% |
| Local Government Employees | 176 | 5.0% |
| State Government Employees | 89 | 2.5% |
| Federal Government Employees | 65 | 1.8% |
| Unpaid Family Workers | 0 | 0.0% |
| Total | 3,544 | 100.0% |
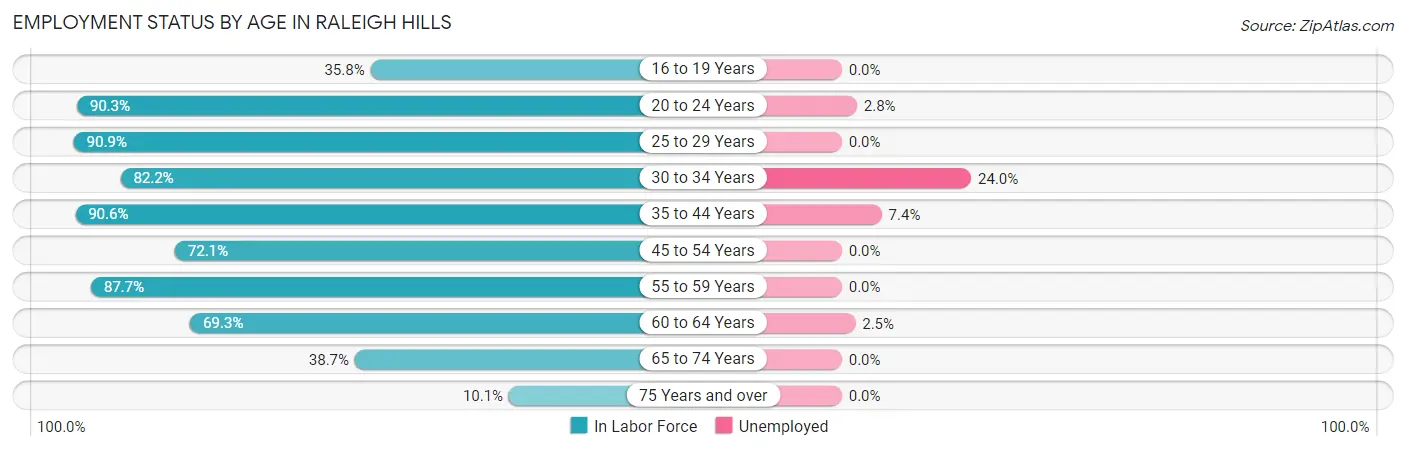
Employment Status by Age in Raleigh Hills
According to the labor force statistics for Raleigh Hills, out of the total population over 16 years of age (5,756), 65.0% or 3,741 individuals are in the labor force, with 4.4% or 165 of them unemployed. The age group with the highest labor force participation rate is 25 to 29 years, with 90.9% or 361 individuals in the labor force. Within the labor force, the 30 to 34 years age range has the highest percentage of unemployed individuals, with 24.0% or 80 of them being unemployed.
| Age Bracket | In Labor Force | Unemployed |
| 16 to 19 Years | 82 (35.8%) | 0 (0.0%) |
| 20 to 24 Years | 287 (90.3%) | 8 (2.8%) |
| 25 to 29 Years | 361 (90.9%) | 0 (0.0%) |
| 30 to 34 Years | 333 (82.2%) | 80 (24.0%) |
| 35 to 44 Years | 879 (90.6%) | 65 (7.4%) |
| 45 to 54 Years | 681 (72.1%) | 0 (0.0%) |
| 55 to 59 Years | 336 (87.7%) | 0 (0.0%) |
| 60 to 64 Years | 397 (69.3%) | 10 (2.5%) |
| 65 to 74 Years | 310 (38.7%) | 0 (0.0%) |
| 75 Years and over | 74 (10.1%) | 0 (0.0%) |
| Total | 3,741 (65.0%) | 165 (4.4%) |
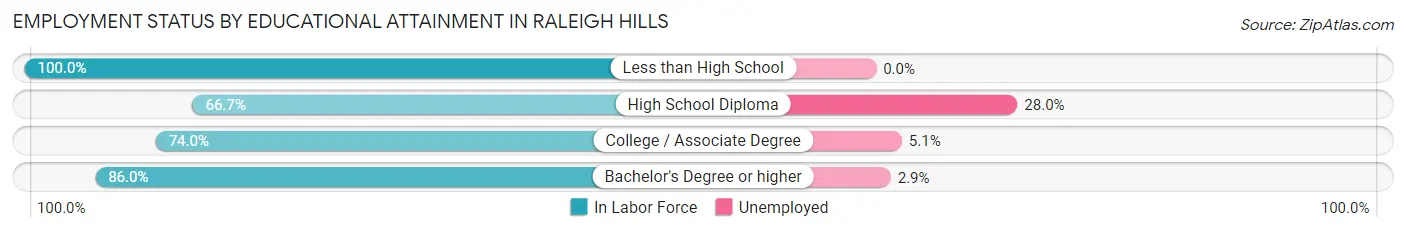
Employment Status by Educational Attainment in Raleigh Hills
According to labor force statistics for Raleigh Hills, 81.3% of individuals (2,985) out of the total population between 25 and 64 years of age (3,672) are in the labor force, with 5.2% or 155 of them being unemployed. The group with the highest labor force participation rate are those with the educational attainment of less than high school, with 100.0% or 89 individuals in the labor force. Within the labor force, individuals with high school diploma education have the highest percentage of unemployment, with 28.0% or 61 of them being unemployed.
| Educational Attainment | In Labor Force | Unemployed |
| Less than High School | 89 (100.0%) | 0 (0.0%) |
| High School Diploma | 218 (66.7%) | 92 (28.0%) |
| College / Associate Degree | 750 (74.0%) | 52 (5.1%) |
| Bachelor's Degree or higher | 1,929 (86.0%) | 65 (2.9%) |
| Total | 2,985 (81.3%) | 191 (5.2%) |
Employment Occupations by Sex in Raleigh Hills
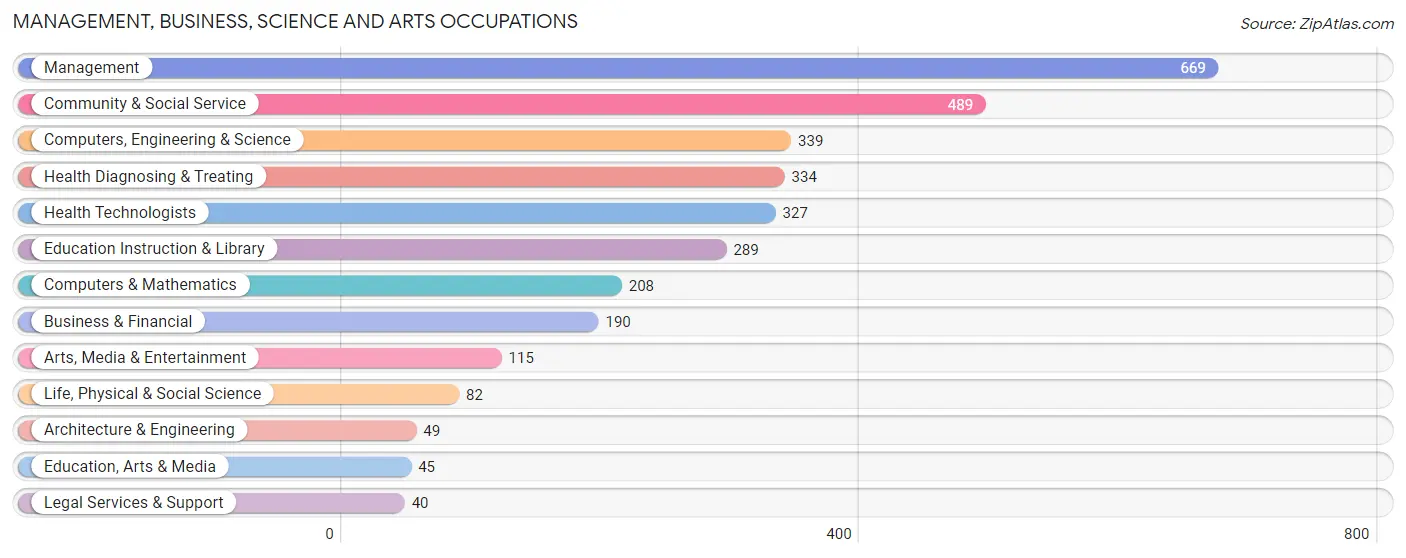
Management, Business, Science and Arts Occupations
The most common Management, Business, Science and Arts occupations in Raleigh Hills are Management (669 | 18.7%), Community & Social Service (489 | 13.7%), Computers, Engineering & Science (339 | 9.5%), Health Diagnosing & Treating (334 | 9.3%), and Health Technologists (327 | 9.1%).
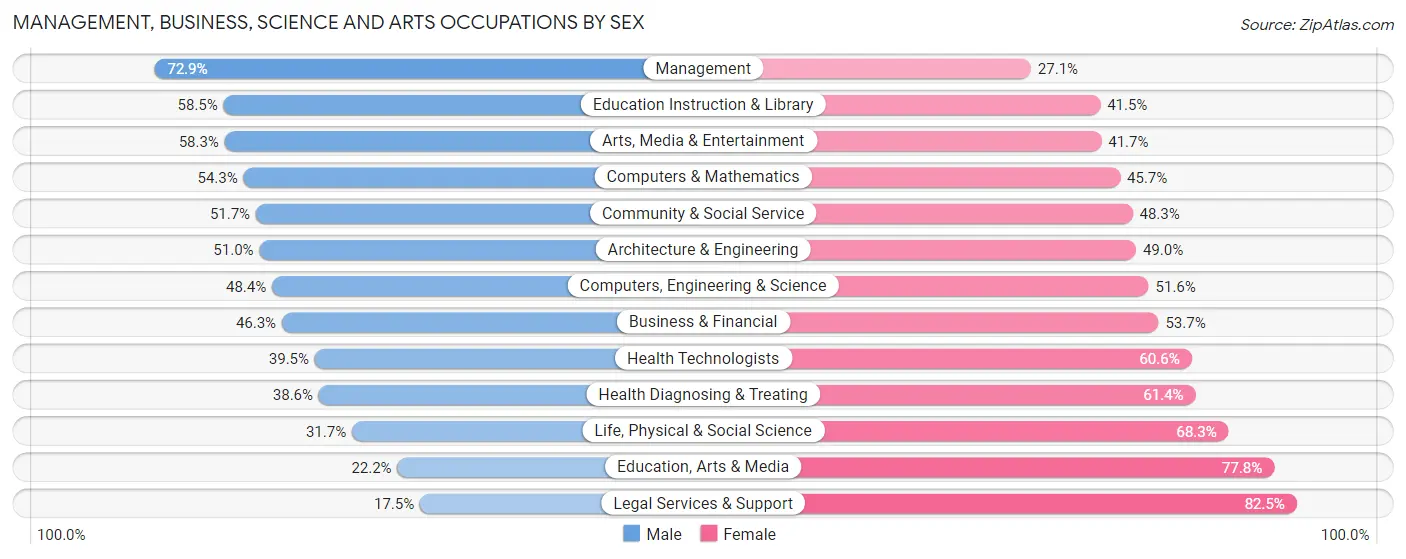
Management, Business, Science and Arts Occupations by Sex
Within the Management, Business, Science and Arts occupations in Raleigh Hills, the most male-oriented occupations are Management (72.9%), Education Instruction & Library (58.5%), and Arts, Media & Entertainment (58.3%), while the most female-oriented occupations are Legal Services & Support (82.5%), Education, Arts & Media (77.8%), and Life, Physical & Social Science (68.3%).
| Occupation | Male | Female |
| Management | 488 (72.9%) | 181 (27.1%) |
| Business & Financial | 88 (46.3%) | 102 (53.7%) |
| Computers, Engineering & Science | 164 (48.4%) | 175 (51.6%) |
| Computers & Mathematics | 113 (54.3%) | 95 (45.7%) |
| Architecture & Engineering | 25 (51.0%) | 24 (49.0%) |
| Life, Physical & Social Science | 26 (31.7%) | 56 (68.3%) |
| Community & Social Service | 253 (51.7%) | 236 (48.3%) |
| Education, Arts & Media | 10 (22.2%) | 35 (77.8%) |
| Legal Services & Support | 7 (17.5%) | 33 (82.5%) |
| Education Instruction & Library | 169 (58.5%) | 120 (41.5%) |
| Arts, Media & Entertainment | 67 (58.3%) | 48 (41.7%) |
| Health Diagnosing & Treating | 129 (38.6%) | 205 (61.4%) |
| Health Technologists | 129 (39.5%) | 198 (60.6%) |
| Total (Category) | 1,122 (55.5%) | 899 (44.5%) |
| Total (Overall) | 2,008 (56.1%) | 1,569 (43.9%) |
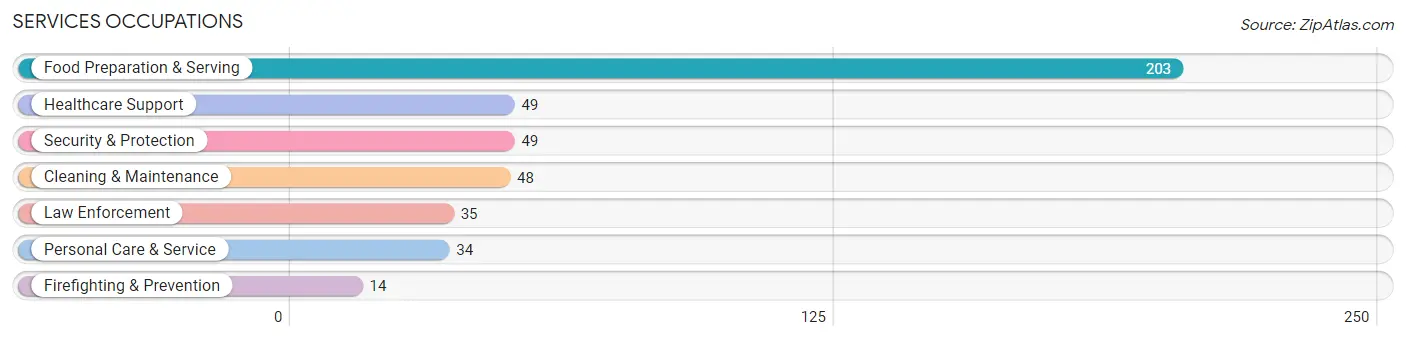
Services Occupations
The most common Services occupations in Raleigh Hills are Food Preparation & Serving (203 | 5.7%), Healthcare Support (49 | 1.4%), Security & Protection (49 | 1.4%), Cleaning & Maintenance (48 | 1.3%), and Law Enforcement (35 | 1.0%).
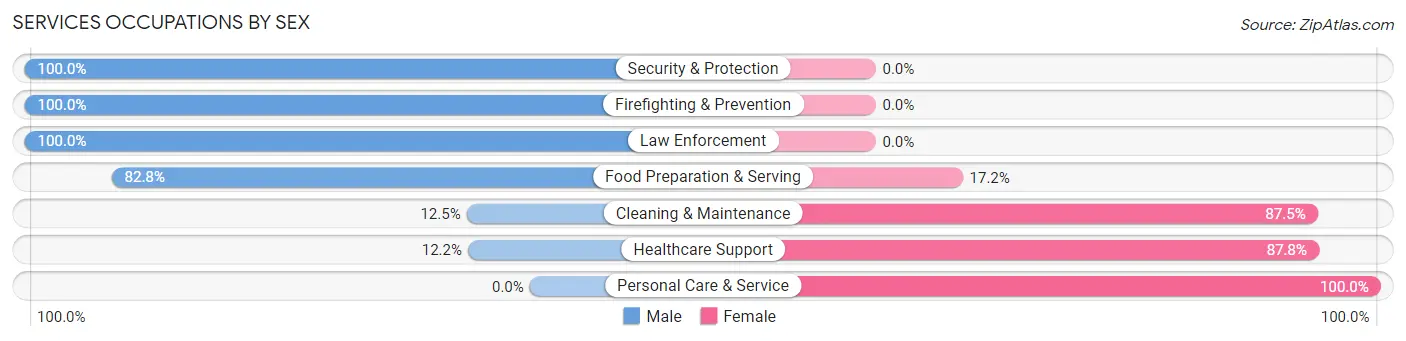
Services Occupations by Sex
Within the Services occupations in Raleigh Hills, the most male-oriented occupations are Security & Protection (100.0%), Firefighting & Prevention (100.0%), and Law Enforcement (100.0%), while the most female-oriented occupations are Personal Care & Service (100.0%), Healthcare Support (87.8%), and Cleaning & Maintenance (87.5%).
| Occupation | Male | Female |
| Healthcare Support | 6 (12.2%) | 43 (87.8%) |
| Security & Protection | 49 (100.0%) | 0 (0.0%) |
| Firefighting & Prevention | 14 (100.0%) | 0 (0.0%) |
| Law Enforcement | 35 (100.0%) | 0 (0.0%) |
| Food Preparation & Serving | 168 (82.8%) | 35 (17.2%) |
| Cleaning & Maintenance | 6 (12.5%) | 42 (87.5%) |
| Personal Care & Service | 0 (0.0%) | 34 (100.0%) |
| Total (Category) | 229 (59.8%) | 154 (40.2%) |
| Total (Overall) | 2,008 (56.1%) | 1,569 (43.9%) |
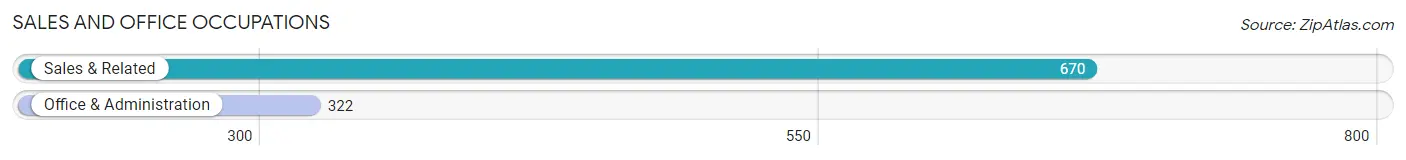
Sales and Office Occupations
The most common Sales and Office occupations in Raleigh Hills are Sales & Related (670 | 18.7%), and Office & Administration (322 | 9.0%).
Sales and Office Occupations by Sex
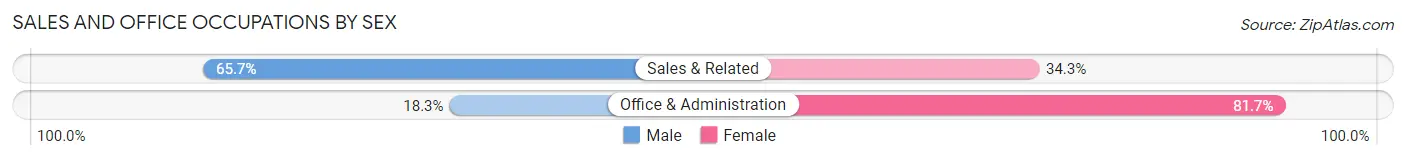
| Occupation | Male | Female |
| Sales & Related | 440 (65.7%) | 230 (34.3%) |
| Office & Administration | 59 (18.3%) | 263 (81.7%) |
| Total (Category) | 499 (50.3%) | 493 (49.7%) |
| Total (Overall) | 2,008 (56.1%) | 1,569 (43.9%) |
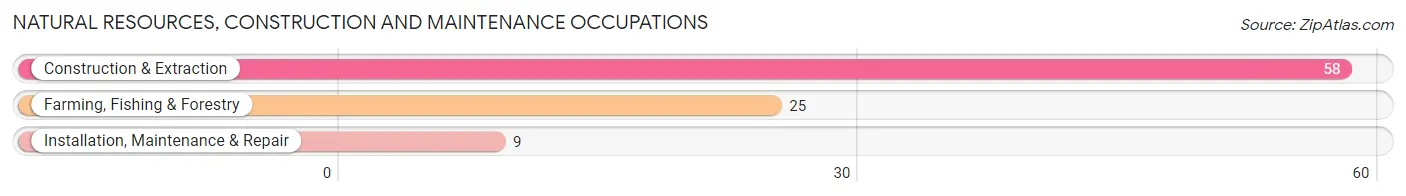
Natural Resources, Construction and Maintenance Occupations
The most common Natural Resources, Construction and Maintenance occupations in Raleigh Hills are Construction & Extraction (58 | 1.6%), Farming, Fishing & Forestry (25 | 0.7%), and Installation, Maintenance & Repair (9 | 0.3%).
Natural Resources, Construction and Maintenance Occupations by Sex
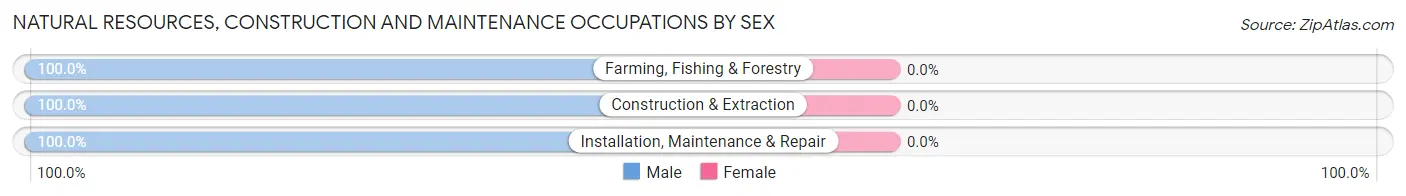
| Occupation | Male | Female |
| Farming, Fishing & Forestry | 25 (100.0%) | 0 (0.0%) |
| Construction & Extraction | 58 (100.0%) | 0 (0.0%) |
| Installation, Maintenance & Repair | 9 (100.0%) | 0 (0.0%) |
| Total (Category) | 92 (100.0%) | 0 (0.0%) |
| Total (Overall) | 2,008 (56.1%) | 1,569 (43.9%) |
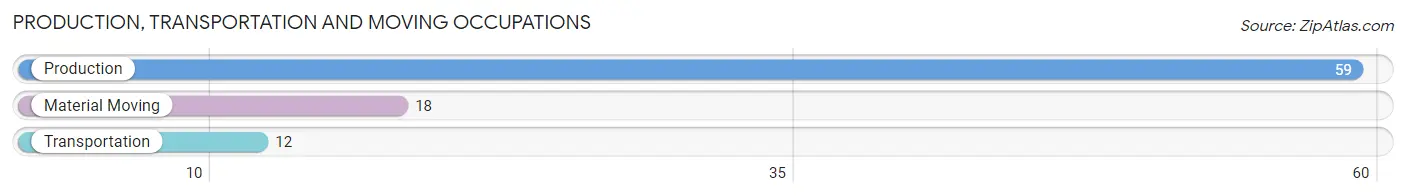
Production, Transportation and Moving Occupations
The most common Production, Transportation and Moving occupations in Raleigh Hills are Production (59 | 1.7%), Material Moving (18 | 0.5%), and Transportation (12 | 0.3%).
Production, Transportation and Moving Occupations by Sex
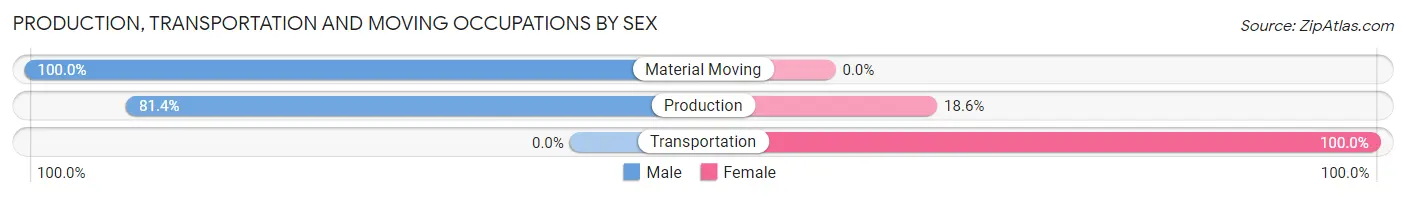
| Occupation | Male | Female |
| Production | 48 (81.4%) | 11 (18.6%) |
| Transportation | 0 (0.0%) | 12 (100.0%) |
| Material Moving | 18 (100.0%) | 0 (0.0%) |
| Total (Category) | 66 (74.2%) | 23 (25.8%) |
| Total (Overall) | 2,008 (56.1%) | 1,569 (43.9%) |
Employment Industries by Sex in Raleigh Hills
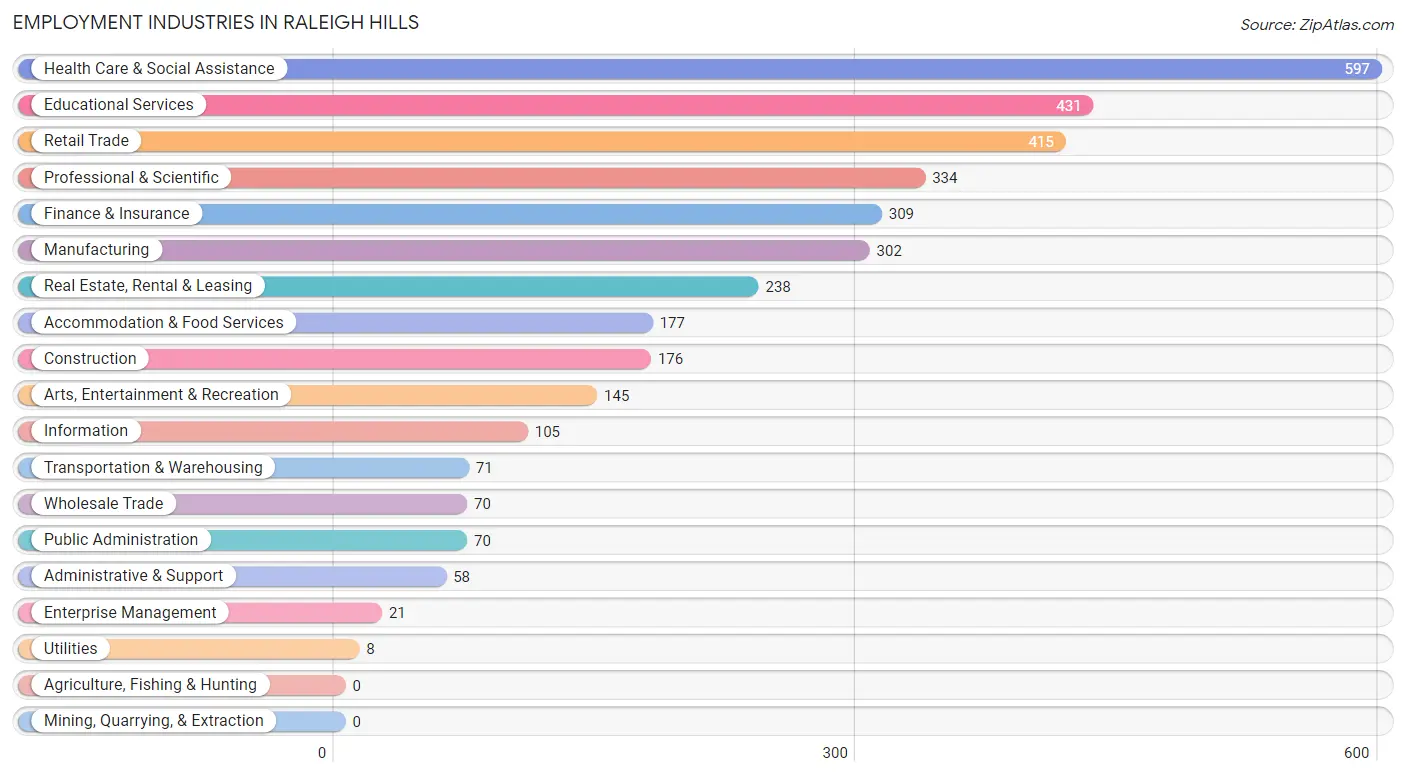
Employment Industries in Raleigh Hills
The major employment industries in Raleigh Hills include Health Care & Social Assistance (597 | 16.7%), Educational Services (431 | 12.0%), Retail Trade (415 | 11.6%), Professional & Scientific (334 | 9.3%), and Finance & Insurance (309 | 8.6%).
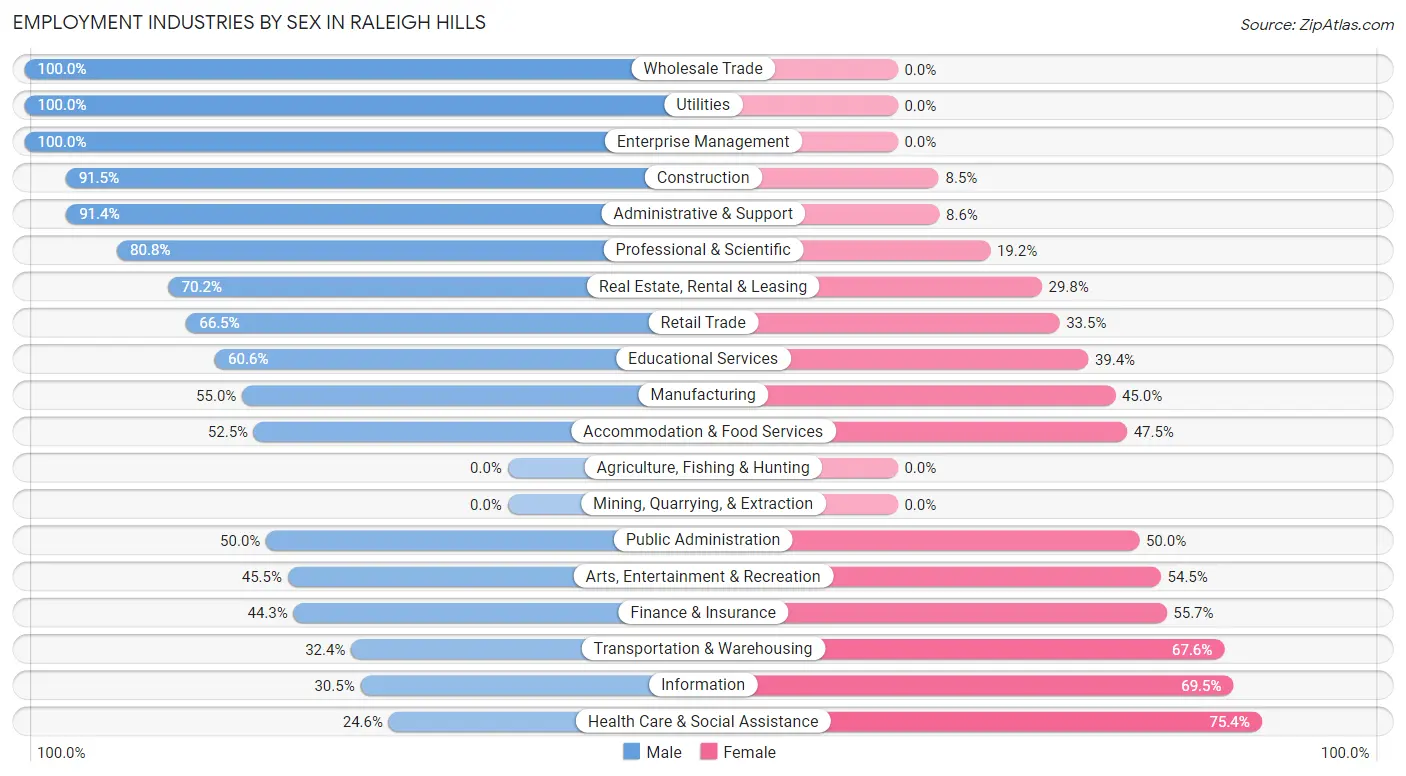
Employment Industries by Sex in Raleigh Hills
The Raleigh Hills industries that see more men than women are Wholesale Trade (100.0%), Utilities (100.0%), and Enterprise Management (100.0%), whereas the industries that tend to have a higher number of women are Health Care & Social Assistance (75.4%), Information (69.5%), and Transportation & Warehousing (67.6%).
| Industry | Male | Female |
| Agriculture, Fishing & Hunting | 0 (0.0%) | 0 (0.0%) |
| Mining, Quarrying, & Extraction | 0 (0.0%) | 0 (0.0%) |
| Construction | 161 (91.5%) | 15 (8.5%) |
| Manufacturing | 166 (55.0%) | 136 (45.0%) |
| Wholesale Trade | 70 (100.0%) | 0 (0.0%) |
| Retail Trade | 276 (66.5%) | 139 (33.5%) |
| Transportation & Warehousing | 23 (32.4%) | 48 (67.6%) |
| Utilities | 8 (100.0%) | 0 (0.0%) |
| Information | 32 (30.5%) | 73 (69.5%) |
| Finance & Insurance | 137 (44.3%) | 172 (55.7%) |
| Real Estate, Rental & Leasing | 167 (70.2%) | 71 (29.8%) |
| Professional & Scientific | 270 (80.8%) | 64 (19.2%) |
| Enterprise Management | 21 (100.0%) | 0 (0.0%) |
| Administrative & Support | 53 (91.4%) | 5 (8.6%) |
| Educational Services | 261 (60.6%) | 170 (39.4%) |
| Health Care & Social Assistance | 147 (24.6%) | 450 (75.4%) |
| Arts, Entertainment & Recreation | 66 (45.5%) | 79 (54.5%) |
| Accommodation & Food Services | 93 (52.5%) | 84 (47.5%) |
| Public Administration | 35 (50.0%) | 35 (50.0%) |
| Total | 2,008 (56.1%) | 1,569 (43.9%) |
Education in Raleigh Hills
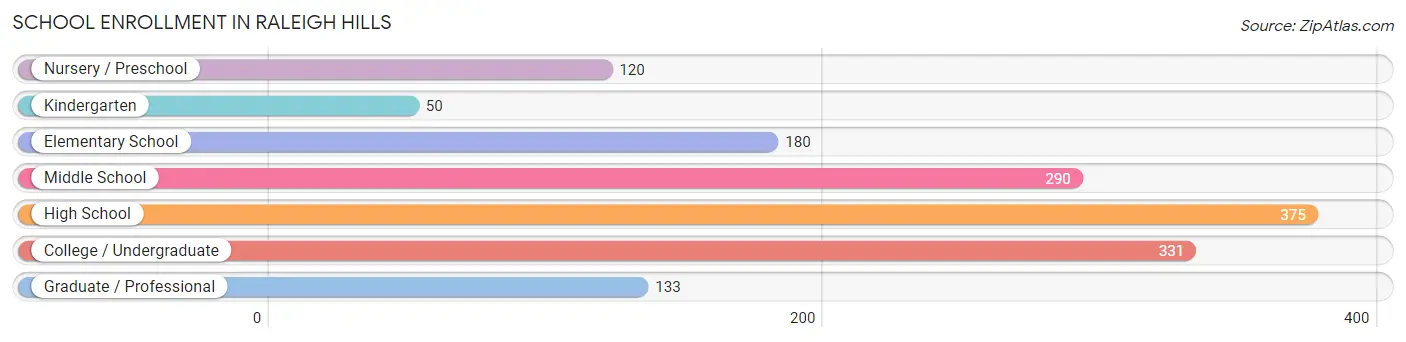
School Enrollment in Raleigh Hills
The most common levels of schooling among the 1,479 students in Raleigh Hills are high school (375 | 25.4%), college / undergraduate (331 | 22.4%), and middle school (290 | 19.6%).
| School Level | # Students | % Students |
| Nursery / Preschool | 120 | 8.1% |
| Kindergarten | 50 | 3.4% |
| Elementary School | 180 | 12.2% |
| Middle School | 290 | 19.6% |
| High School | 375 | 25.4% |
| College / Undergraduate | 331 | 22.4% |
| Graduate / Professional | 133 | 9.0% |
| Total | 1,479 | 100.0% |
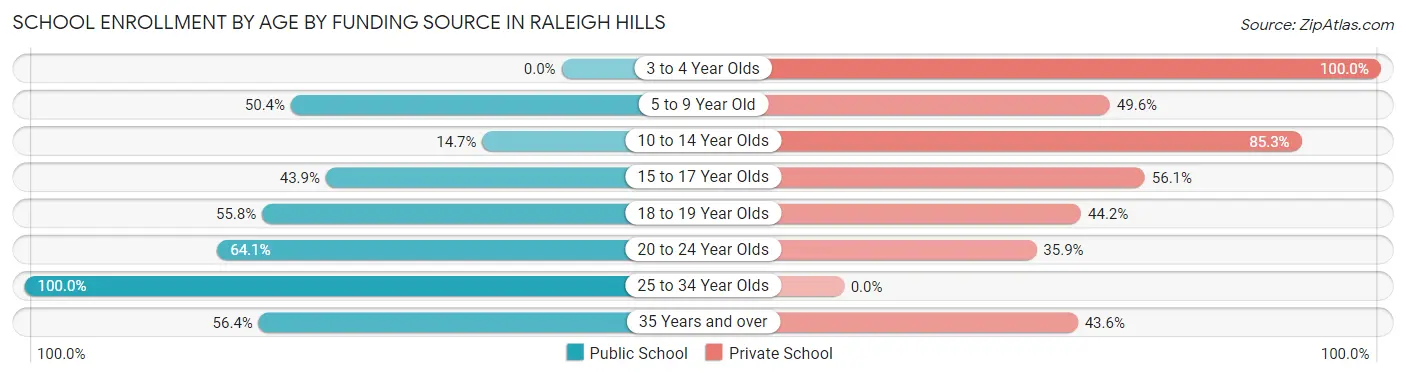
School Enrollment by Age by Funding Source in Raleigh Hills
Out of a total of 1,479 students who are enrolled in schools in Raleigh Hills, 813 (55.0%) attend a private institution, while the remaining 666 (45.0%) are enrolled in public schools. The age group of 3 to 4 year olds has the highest likelihood of being enrolled in private schools, with 94 (100.0% in the age bracket) enrolled. Conversely, the age group of 25 to 34 year olds has the lowest likelihood of being enrolled in a private school, with 146 (100.0% in the age bracket) attending a public institution.
| Age Bracket | Public School | Private School |
| 3 to 4 Year Olds | 0 (0.0%) | 94 (100.0%) |
| 5 to 9 Year Old | 122 (50.4%) | 120 (49.6%) |
| 10 to 14 Year Olds | 46 (14.7%) | 266 (85.3%) |
| 15 to 17 Year Olds | 151 (43.9%) | 193 (56.1%) |
| 18 to 19 Year Olds | 29 (55.8%) | 23 (44.2%) |
| 20 to 24 Year Olds | 75 (64.1%) | 42 (35.9%) |
| 25 to 34 Year Olds | 146 (100.0%) | 0 (0.0%) |
| 35 Years and over | 97 (56.4%) | 75 (43.6%) |
| Total | 666 (45.0%) | 813 (55.0%) |
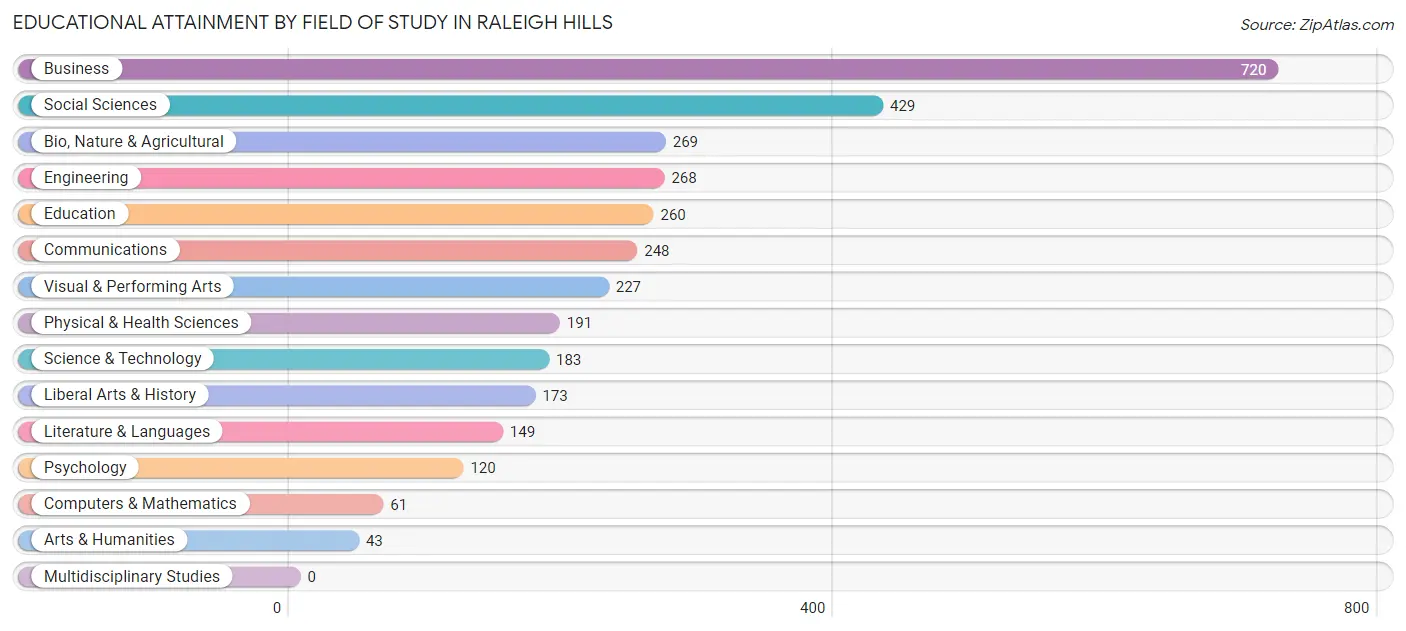
Educational Attainment by Field of Study in Raleigh Hills
Business (720 | 21.5%), social sciences (429 | 12.8%), bio, nature & agricultural (269 | 8.1%), engineering (268 | 8.0%), and education (260 | 7.8%) are the most common fields of study among 3,341 individuals in Raleigh Hills who have obtained a bachelor's degree or higher.
| Field of Study | # Graduates | % Graduates |
| Computers & Mathematics | 61 | 1.8% |
| Bio, Nature & Agricultural | 269 | 8.1% |
| Physical & Health Sciences | 191 | 5.7% |
| Psychology | 120 | 3.6% |
| Social Sciences | 429 | 12.8% |
| Engineering | 268 | 8.0% |
| Multidisciplinary Studies | 0 | 0.0% |
| Science & Technology | 183 | 5.5% |
| Business | 720 | 21.5% |
| Education | 260 | 7.8% |
| Literature & Languages | 149 | 4.5% |
| Liberal Arts & History | 173 | 5.2% |
| Visual & Performing Arts | 227 | 6.8% |
| Communications | 248 | 7.4% |
| Arts & Humanities | 43 | 1.3% |
| Total | 3,341 | 100.0% |
Transportation & Commute in Raleigh Hills
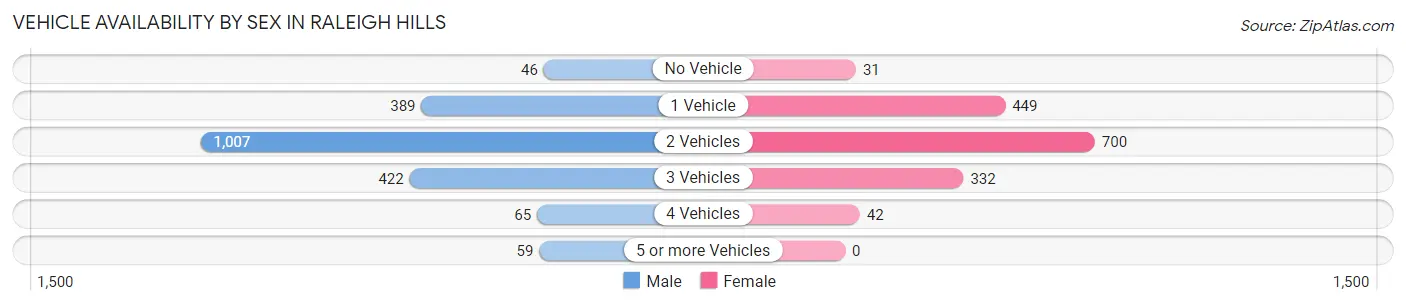
Vehicle Availability by Sex in Raleigh Hills
The most prevalent vehicle ownership categories in Raleigh Hills are males with 2 vehicles (1,007, accounting for 50.6%) and females with 2 vehicles (700, making up 64.8%).
| Vehicles Available | Male | Female |
| No Vehicle | 46 (2.3%) | 31 (2.0%) |
| 1 Vehicle | 389 (19.6%) | 449 (28.9%) |
| 2 Vehicles | 1,007 (50.6%) | 700 (45.1%) |
| 3 Vehicles | 422 (21.2%) | 332 (21.4%) |
| 4 Vehicles | 65 (3.3%) | 42 (2.7%) |
| 5 or more Vehicles | 59 (3.0%) | 0 (0.0%) |
| Total | 1,988 (100.0%) | 1,554 (100.0%) |
Commute Time in Raleigh Hills
The most frequently occuring commute durations in Raleigh Hills are 20 to 24 minutes (785 commuters, 28.7%), 10 to 14 minutes (484 commuters, 17.7%), and 15 to 19 minutes (402 commuters, 14.7%).
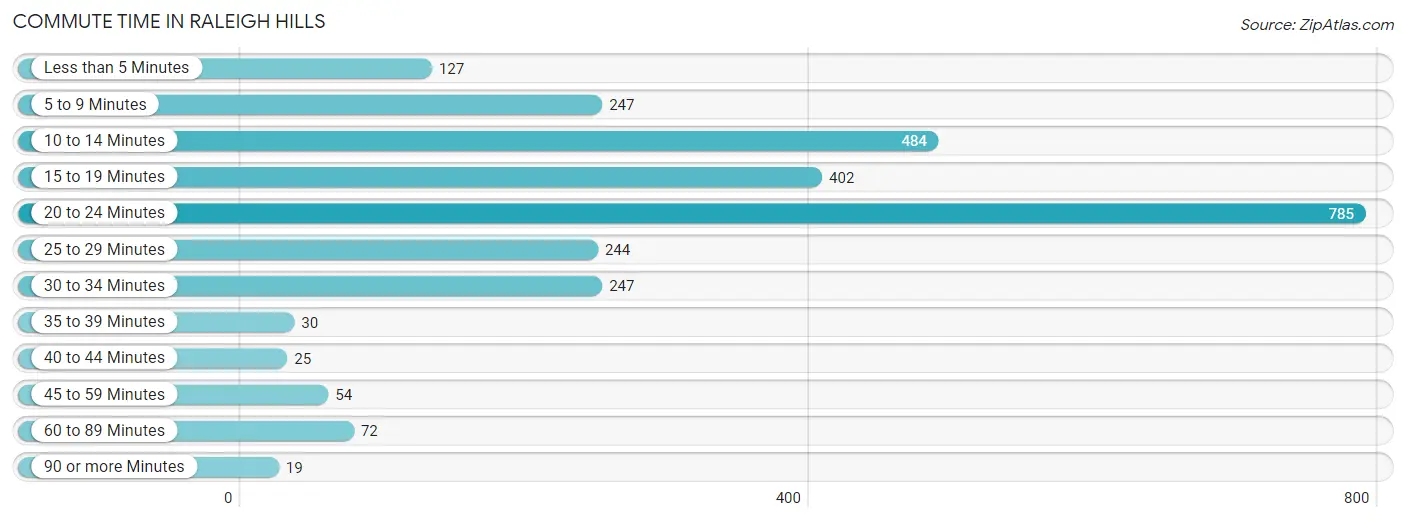
| Commute Time | # Commuters | % Commuters |
| Less than 5 Minutes | 127 | 4.6% |
| 5 to 9 Minutes | 247 | 9.0% |
| 10 to 14 Minutes | 484 | 17.7% |
| 15 to 19 Minutes | 402 | 14.7% |
| 20 to 24 Minutes | 785 | 28.7% |
| 25 to 29 Minutes | 244 | 8.9% |
| 30 to 34 Minutes | 247 | 9.0% |
| 35 to 39 Minutes | 30 | 1.1% |
| 40 to 44 Minutes | 25 | 0.9% |
| 45 to 59 Minutes | 54 | 2.0% |
| 60 to 89 Minutes | 72 | 2.6% |
| 90 or more Minutes | 19 | 0.7% |
Commute Time by Sex in Raleigh Hills
The most common commute times in Raleigh Hills are 20 to 24 minutes (504 commuters, 34.4%) for males and 15 to 19 minutes (300 commuters, 23.6%) for females.
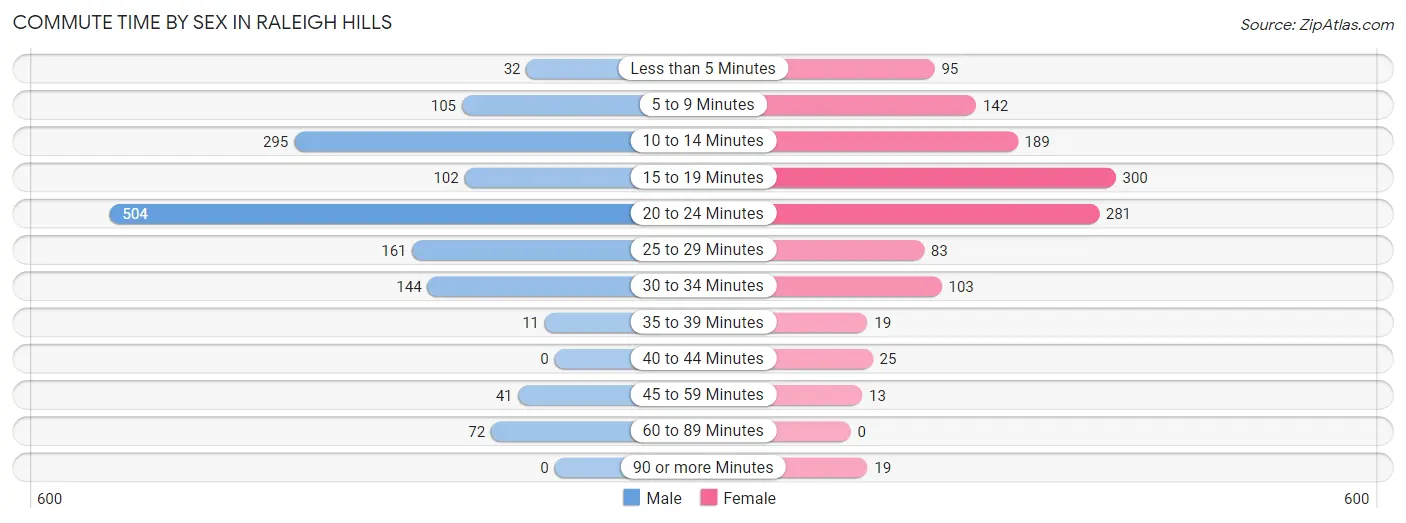
| Commute Time | Male | Female |
| Less than 5 Minutes | 32 (2.2%) | 95 (7.5%) |
| 5 to 9 Minutes | 105 (7.2%) | 142 (11.2%) |
| 10 to 14 Minutes | 295 (20.1%) | 189 (14.9%) |
| 15 to 19 Minutes | 102 (7.0%) | 300 (23.6%) |
| 20 to 24 Minutes | 504 (34.4%) | 281 (22.1%) |
| 25 to 29 Minutes | 161 (11.0%) | 83 (6.5%) |
| 30 to 34 Minutes | 144 (9.8%) | 103 (8.1%) |
| 35 to 39 Minutes | 11 (0.7%) | 19 (1.5%) |
| 40 to 44 Minutes | 0 (0.0%) | 25 (2.0%) |
| 45 to 59 Minutes | 41 (2.8%) | 13 (1.0%) |
| 60 to 89 Minutes | 72 (4.9%) | 0 (0.0%) |
| 90 or more Minutes | 0 (0.0%) | 19 (1.5%) |
Time of Departure to Work by Sex in Raleigh Hills
The most frequent times of departure to work in Raleigh Hills are 8:00 AM to 8:29 AM (278, 19.0%) for males and 8:00 AM to 8:29 AM (320, 25.2%) for females.
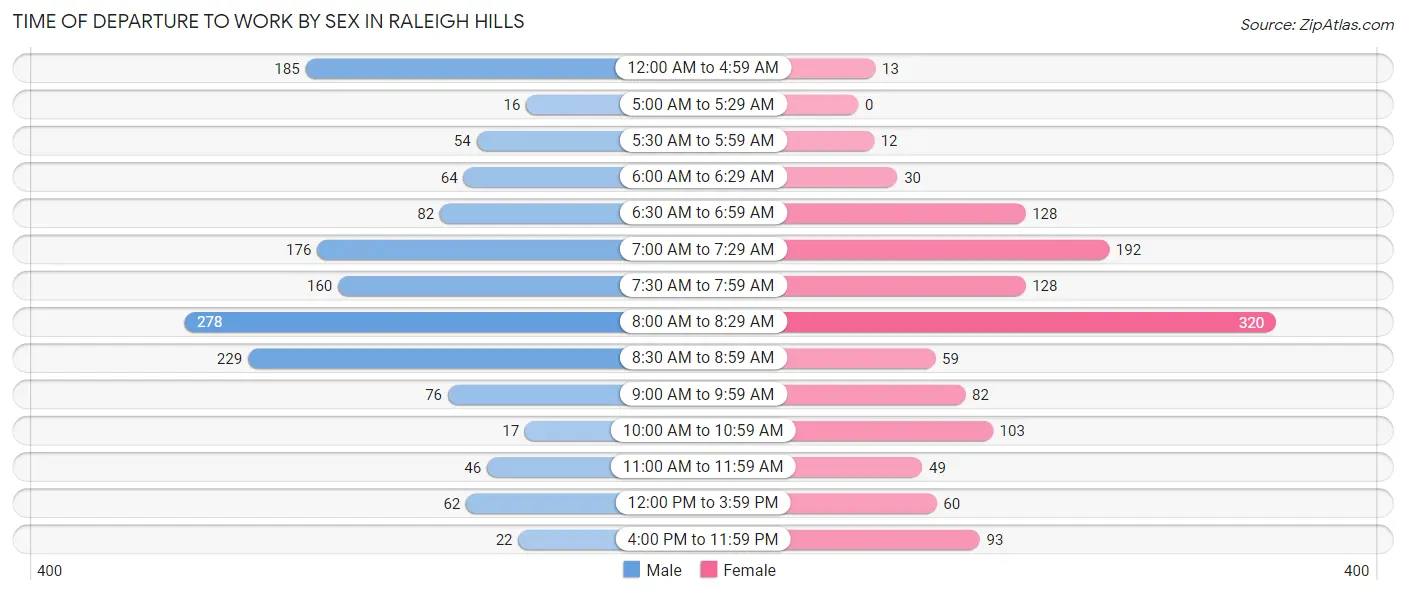
| Time of Departure | Male | Female |
| 12:00 AM to 4:59 AM | 185 (12.6%) | 13 (1.0%) |
| 5:00 AM to 5:29 AM | 16 (1.1%) | 0 (0.0%) |
| 5:30 AM to 5:59 AM | 54 (3.7%) | 12 (0.9%) |
| 6:00 AM to 6:29 AM | 64 (4.4%) | 30 (2.4%) |
| 6:30 AM to 6:59 AM | 82 (5.6%) | 128 (10.1%) |
| 7:00 AM to 7:29 AM | 176 (12.0%) | 192 (15.1%) |
| 7:30 AM to 7:59 AM | 160 (10.9%) | 128 (10.1%) |
| 8:00 AM to 8:29 AM | 278 (19.0%) | 320 (25.2%) |
| 8:30 AM to 8:59 AM | 229 (15.6%) | 59 (4.6%) |
| 9:00 AM to 9:59 AM | 76 (5.2%) | 82 (6.5%) |
| 10:00 AM to 10:59 AM | 17 (1.2%) | 103 (8.1%) |
| 11:00 AM to 11:59 AM | 46 (3.1%) | 49 (3.9%) |
| 12:00 PM to 3:59 PM | 62 (4.2%) | 60 (4.7%) |
| 4:00 PM to 11:59 PM | 22 (1.5%) | 93 (7.3%) |
| Total | 1,467 (100.0%) | 1,269 (100.0%) |
Housing Occupancy in Raleigh Hills
Occupancy by Ownership in Raleigh Hills
Of the total 3,197 dwellings in Raleigh Hills, owner-occupied units account for 1,804 (56.4%), while renter-occupied units make up 1,393 (43.6%).
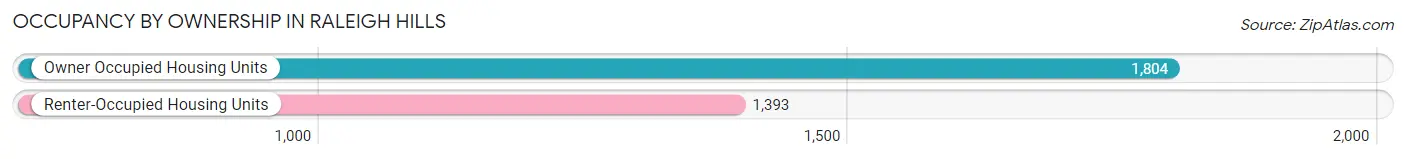
| Occupancy | # Housing Units | % Housing Units |
| Owner Occupied Housing Units | 1,804 | 56.4% |
| Renter-Occupied Housing Units | 1,393 | 43.6% |
| Total Occupied Housing Units | 3,197 | 100.0% |
Occupancy by Household Size in Raleigh Hills
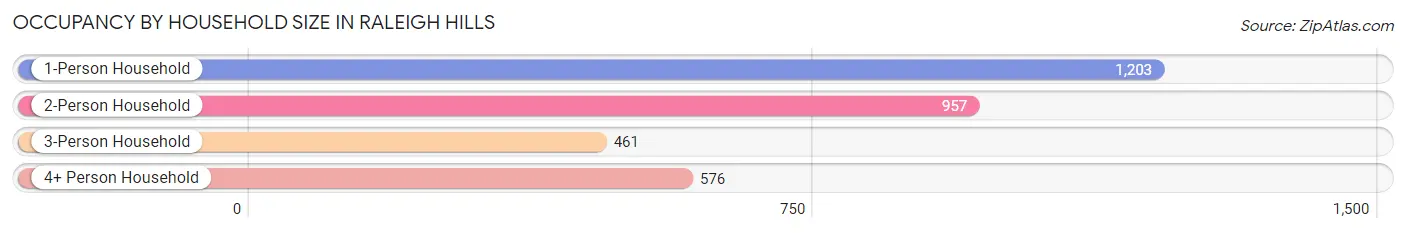
| Household Size | # Housing Units | % Housing Units |
| 1-Person Household | 1,203 | 37.6% |
| 2-Person Household | 957 | 29.9% |
| 3-Person Household | 461 | 14.4% |
| 4+ Person Household | 576 | 18.0% |
| Total Housing Units | 3,197 | 100.0% |
Occupancy by Ownership by Household Size in Raleigh Hills
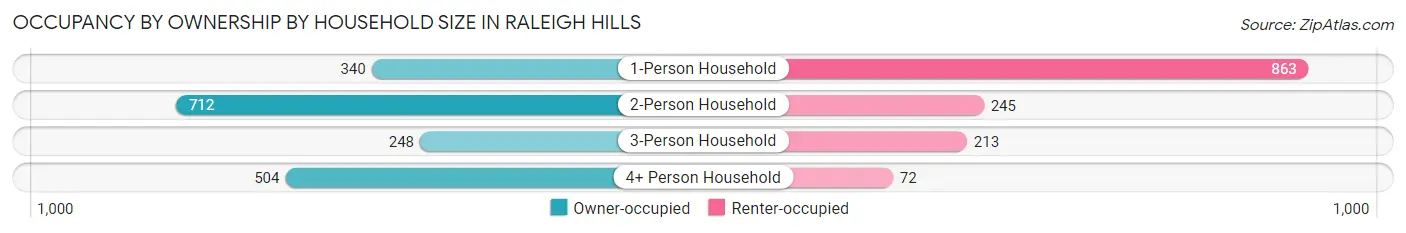
| Household Size | Owner-occupied | Renter-occupied |
| 1-Person Household | 340 (28.3%) | 863 (71.7%) |
| 2-Person Household | 712 (74.4%) | 245 (25.6%) |
| 3-Person Household | 248 (53.8%) | 213 (46.2%) |
| 4+ Person Household | 504 (87.5%) | 72 (12.5%) |
| Total Housing Units | 1,804 (56.4%) | 1,393 (43.6%) |
Occupancy by Educational Attainment in Raleigh Hills
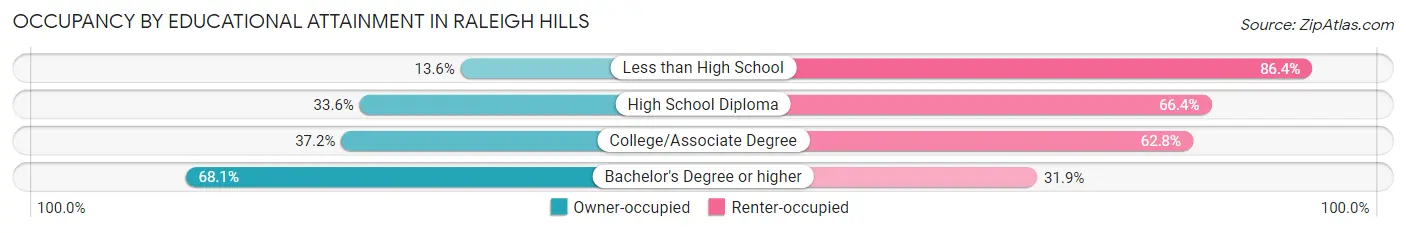
| Household Size | Owner-occupied | Renter-occupied |
| Less than High School | 8 (13.6%) | 51 (86.4%) |
| High School Diploma | 48 (33.6%) | 95 (66.4%) |
| College/Associate Degree | 351 (37.2%) | 592 (62.8%) |
| Bachelor's Degree or higher | 1,397 (68.1%) | 655 (31.9%) |
Occupancy by Age of Householder in Raleigh Hills
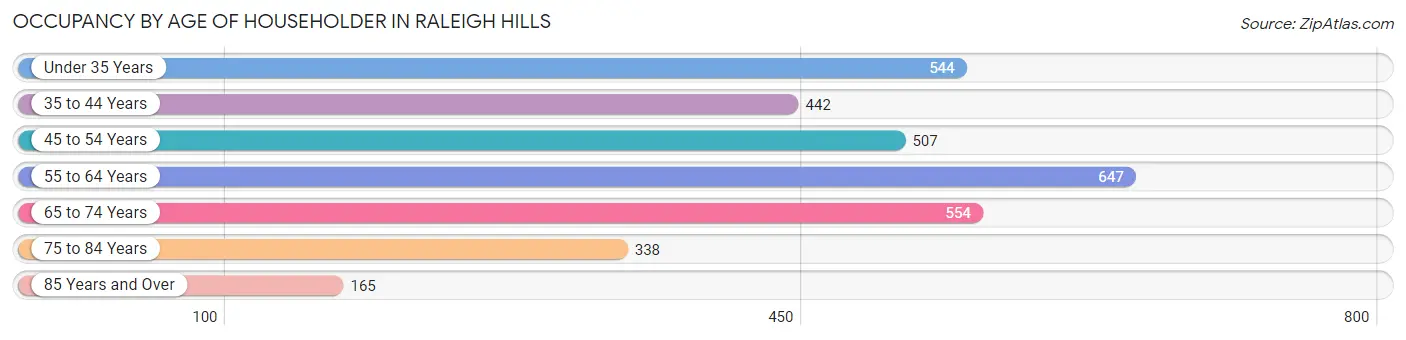
| Age Bracket | # Households | % Households |
| Under 35 Years | 544 | 17.0% |
| 35 to 44 Years | 442 | 13.8% |
| 45 to 54 Years | 507 | 15.9% |
| 55 to 64 Years | 647 | 20.2% |
| 65 to 74 Years | 554 | 17.3% |
| 75 to 84 Years | 338 | 10.6% |
| 85 Years and Over | 165 | 5.2% |
| Total | 3,197 | 100.0% |
Housing Finances in Raleigh Hills
Median Income by Occupancy in Raleigh Hills
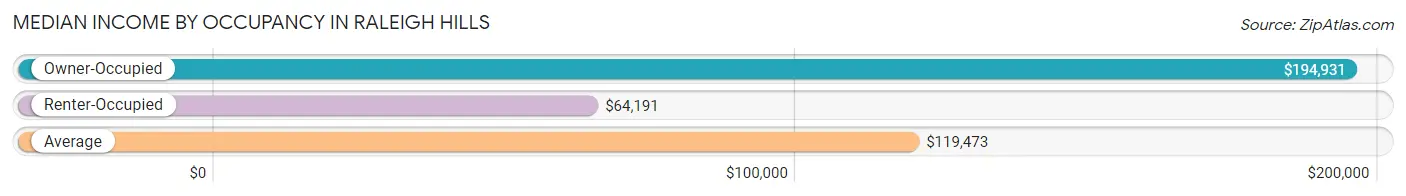
| Occupancy Type | # Households | Median Income |
| Owner-Occupied | 1,804 (56.4%) | $194,931 |
| Renter-Occupied | 1,393 (43.6%) | $64,191 |
| Average | 3,197 (100.0%) | $119,473 |
Occupancy by Householder Income Bracket in Raleigh Hills
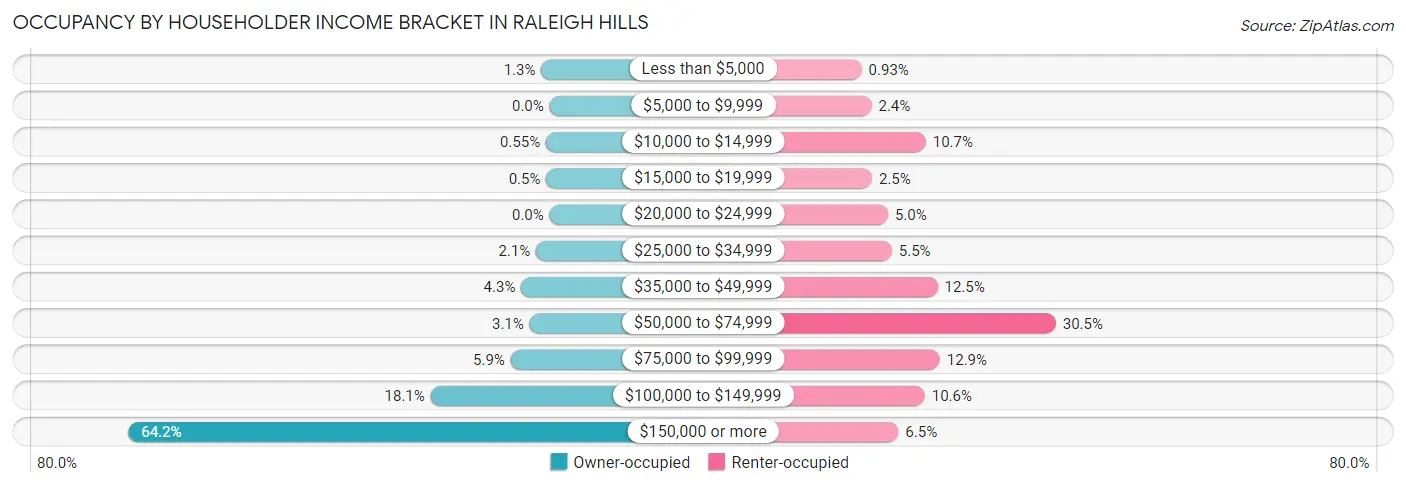
| Income Bracket | Owner-occupied | Renter-occupied |
| Less than $5,000 | 23 (1.3%) | 13 (0.9%) |
| $5,000 to $9,999 | 0 (0.0%) | 34 (2.4%) |
| $10,000 to $14,999 | 10 (0.5%) | 149 (10.7%) |
| $15,000 to $19,999 | 9 (0.5%) | 35 (2.5%) |
| $20,000 to $24,999 | 0 (0.0%) | 69 (5.0%) |
| $25,000 to $34,999 | 37 (2.1%) | 77 (5.5%) |
| $35,000 to $49,999 | 78 (4.3%) | 174 (12.5%) |
| $50,000 to $74,999 | 55 (3.0%) | 425 (30.5%) |
| $75,000 to $99,999 | 107 (5.9%) | 179 (12.9%) |
| $100,000 to $149,999 | 327 (18.1%) | 147 (10.5%) |
| $150,000 or more | 1,158 (64.2%) | 91 (6.5%) |
| Total | 1,804 (100.0%) | 1,393 (100.0%) |
Monthly Housing Cost Tiers in Raleigh Hills
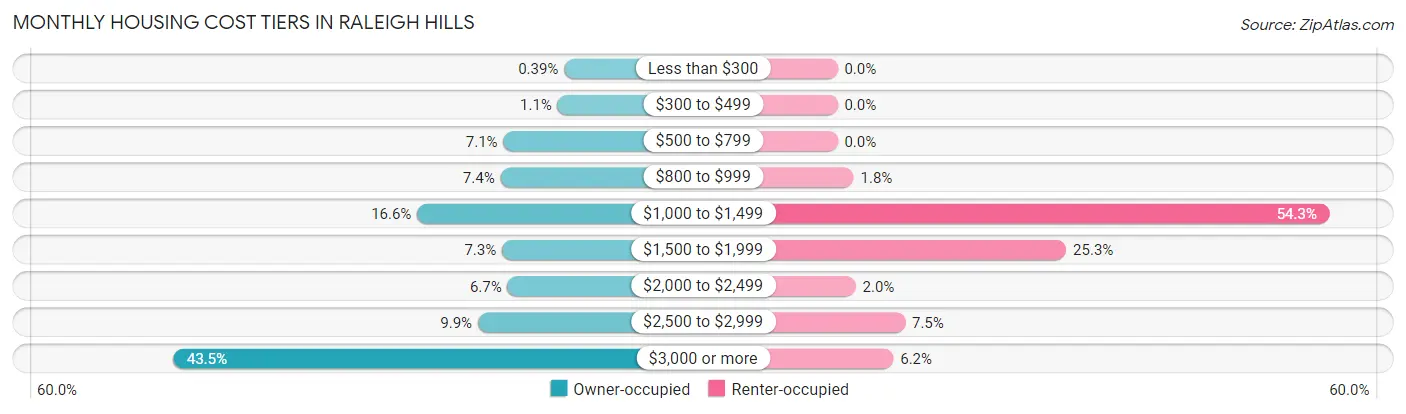
| Monthly Cost | Owner-occupied | Renter-occupied |
| Less than $300 | 7 (0.4%) | 0 (0.0%) |
| $300 to $499 | 20 (1.1%) | 0 (0.0%) |
| $500 to $799 | 128 (7.1%) | 0 (0.0%) |
| $800 to $999 | 134 (7.4%) | 25 (1.8%) |
| $1,000 to $1,499 | 300 (16.6%) | 756 (54.3%) |
| $1,500 to $1,999 | 131 (7.3%) | 352 (25.3%) |
| $2,000 to $2,499 | 120 (6.7%) | 28 (2.0%) |
| $2,500 to $2,999 | 179 (9.9%) | 104 (7.5%) |
| $3,000 or more | 785 (43.5%) | 86 (6.2%) |
| Total | 1,804 (100.0%) | 1,393 (100.0%) |
Physical Housing Characteristics in Raleigh Hills
Housing Structures in Raleigh Hills
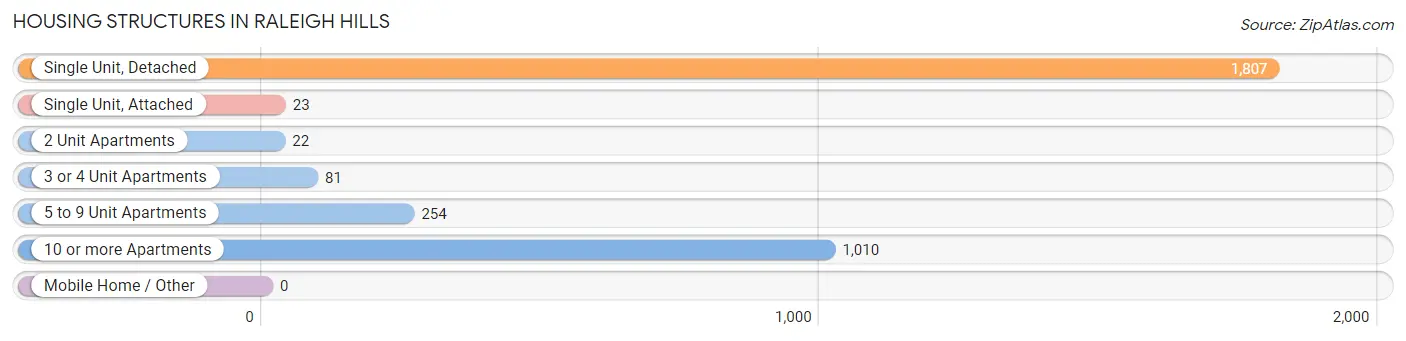
| Structure Type | # Housing Units | % Housing Units |
| Single Unit, Detached | 1,807 | 56.5% |
| Single Unit, Attached | 23 | 0.7% |
| 2 Unit Apartments | 22 | 0.7% |
| 3 or 4 Unit Apartments | 81 | 2.5% |
| 5 to 9 Unit Apartments | 254 | 7.9% |
| 10 or more Apartments | 1,010 | 31.6% |
| Mobile Home / Other | 0 | 0.0% |
| Total | 3,197 | 100.0% |
Housing Structures by Occupancy in Raleigh Hills
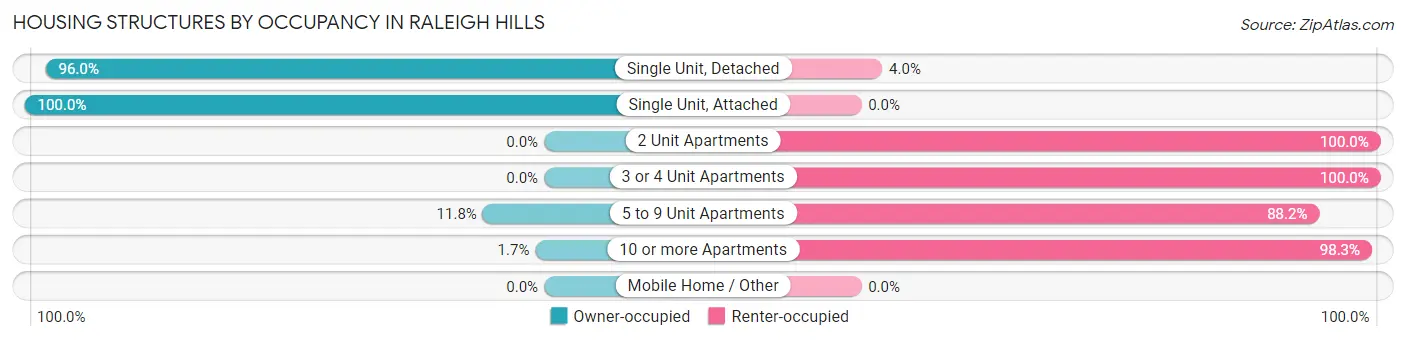
| Structure Type | Owner-occupied | Renter-occupied |
| Single Unit, Detached | 1,734 (96.0%) | 73 (4.0%) |
| Single Unit, Attached | 23 (100.0%) | 0 (0.0%) |
| 2 Unit Apartments | 0 (0.0%) | 22 (100.0%) |
| 3 or 4 Unit Apartments | 0 (0.0%) | 81 (100.0%) |
| 5 to 9 Unit Apartments | 30 (11.8%) | 224 (88.2%) |
| 10 or more Apartments | 17 (1.7%) | 993 (98.3%) |
| Mobile Home / Other | 0 (0.0%) | 0 (0.0%) |
| Total | 1,804 (56.4%) | 1,393 (43.6%) |
Housing Structures by Number of Rooms in Raleigh Hills
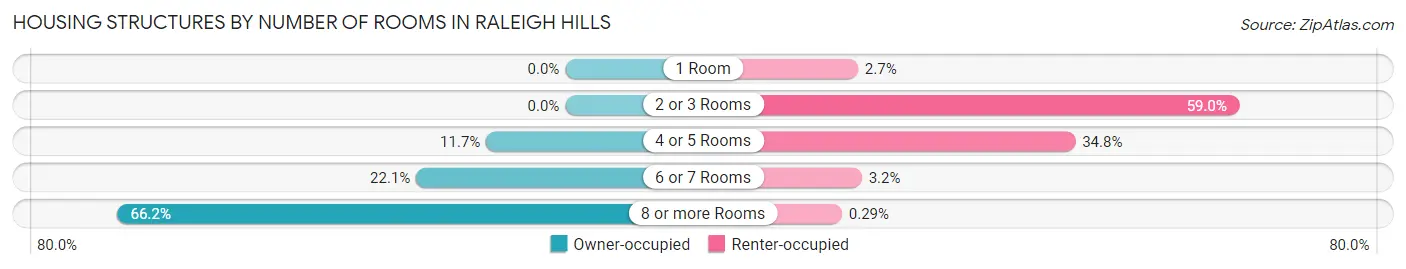
| Number of Rooms | Owner-occupied | Renter-occupied |
| 1 Room | 0 (0.0%) | 37 (2.7%) |
| 2 or 3 Rooms | 0 (0.0%) | 822 (59.0%) |
| 4 or 5 Rooms | 211 (11.7%) | 485 (34.8%) |
| 6 or 7 Rooms | 398 (22.1%) | 45 (3.2%) |
| 8 or more Rooms | 1,195 (66.2%) | 4 (0.3%) |
| Total | 1,804 (100.0%) | 1,393 (100.0%) |
Housing Structure by Heating Type in Raleigh Hills
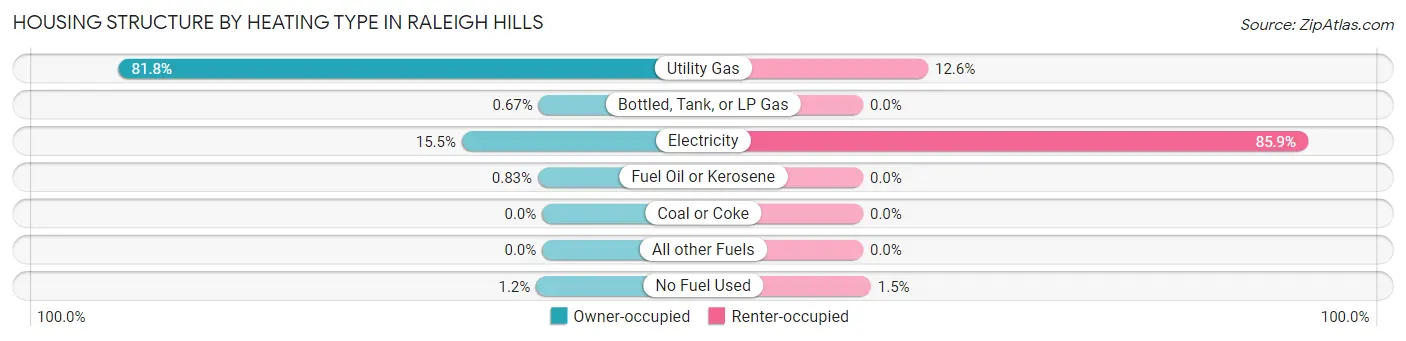
| Heating Type | Owner-occupied | Renter-occupied |
| Utility Gas | 1,476 (81.8%) | 175 (12.6%) |
| Bottled, Tank, or LP Gas | 12 (0.7%) | 0 (0.0%) |
| Electricity | 280 (15.5%) | 1,197 (85.9%) |
| Fuel Oil or Kerosene | 15 (0.8%) | 0 (0.0%) |
| Coal or Coke | 0 (0.0%) | 0 (0.0%) |
| All other Fuels | 0 (0.0%) | 0 (0.0%) |
| No Fuel Used | 21 (1.2%) | 21 (1.5%) |
| Total | 1,804 (100.0%) | 1,393 (100.0%) |
Household Vehicle Usage in Raleigh Hills
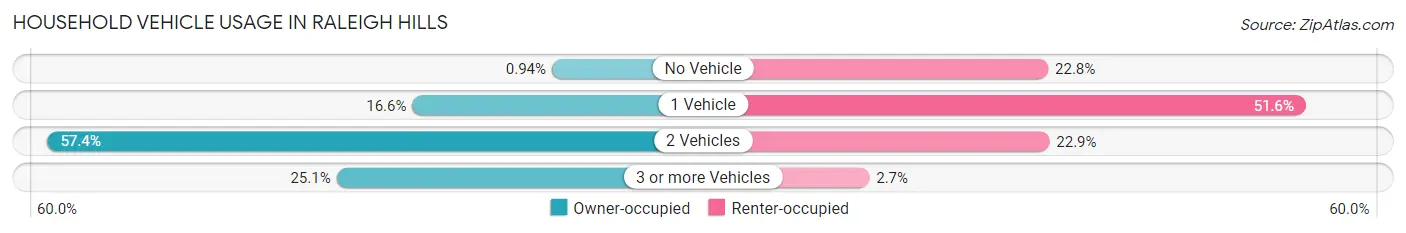
| Vehicles per Household | Owner-occupied | Renter-occupied |
| No Vehicle | 17 (0.9%) | 317 (22.8%) |
| 1 Vehicle | 299 (16.6%) | 719 (51.6%) |
| 2 Vehicles | 1,036 (57.4%) | 319 (22.9%) |
| 3 or more Vehicles | 452 (25.1%) | 38 (2.7%) |
| Total | 1,804 (100.0%) | 1,393 (100.0%) |
Real Estate & Mortgages in Raleigh Hills
Real Estate and Mortgage Overview in Raleigh Hills
| Characteristic | Without Mortgage | With Mortgage |
| Housing Units | 579 | 1,225 |
| Median Property Value | $725,500 | $846,800 |
| Median Household Income | $193,875 | $798 |
| Monthly Housing Costs | $1,001 | $785 |
| Real Estate Taxes | $7,318 | $0 |
Property Value by Mortgage Status in Raleigh Hills
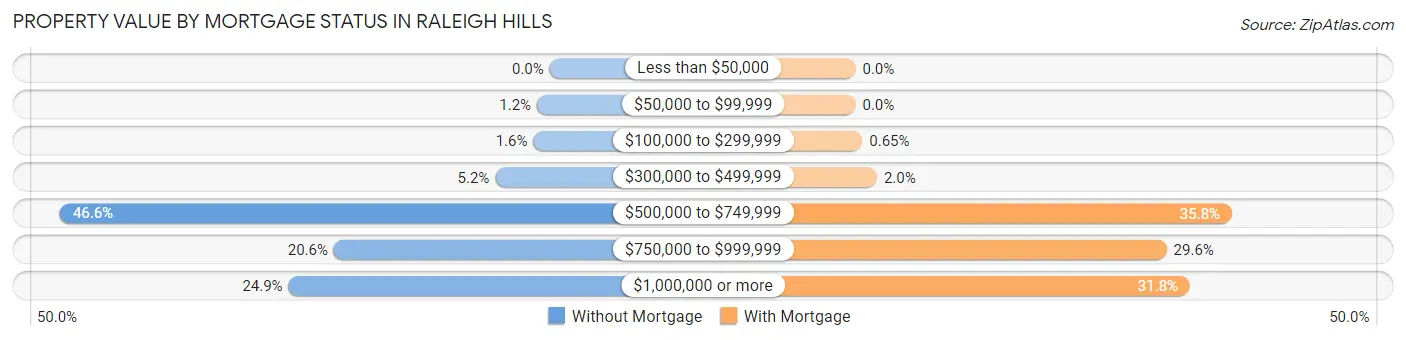
| Property Value | Without Mortgage | With Mortgage |
| Less than $50,000 | 0 (0.0%) | 0 (0.0%) |
| $50,000 to $99,999 | 7 (1.2%) | 0 (0.0%) |
| $100,000 to $299,999 | 9 (1.5%) | 8 (0.6%) |
| $300,000 to $499,999 | 30 (5.2%) | 25 (2.0%) |
| $500,000 to $749,999 | 270 (46.6%) | 439 (35.8%) |
| $750,000 to $999,999 | 119 (20.5%) | 363 (29.6%) |
| $1,000,000 or more | 144 (24.9%) | 390 (31.8%) |
| Total | 579 (100.0%) | 1,225 (100.0%) |
Household Income by Mortgage Status in Raleigh Hills
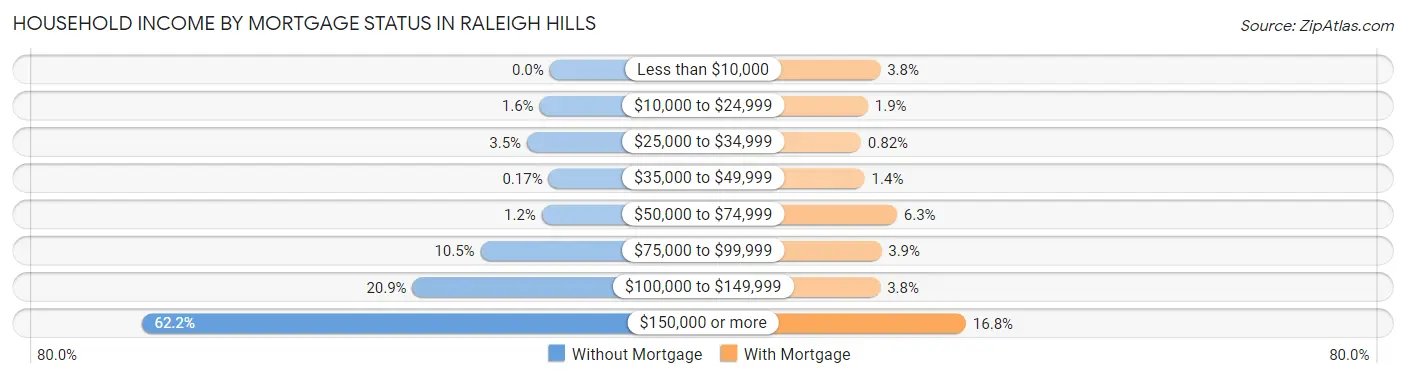
| Household Income | Without Mortgage | With Mortgage |
| Less than $10,000 | 0 (0.0%) | 46 (3.8%) |
| $10,000 to $24,999 | 9 (1.5%) | 23 (1.9%) |
| $25,000 to $34,999 | 20 (3.5%) | 10 (0.8%) |
| $35,000 to $49,999 | 1 (0.2%) | 17 (1.4%) |
| $50,000 to $74,999 | 7 (1.2%) | 77 (6.3%) |
| $75,000 to $99,999 | 61 (10.5%) | 48 (3.9%) |
| $100,000 to $149,999 | 121 (20.9%) | 46 (3.8%) |
| $150,000 or more | 360 (62.2%) | 206 (16.8%) |
| Total | 579 (100.0%) | 1,225 (100.0%) |
Property Value to Household Income Ratio in Raleigh Hills
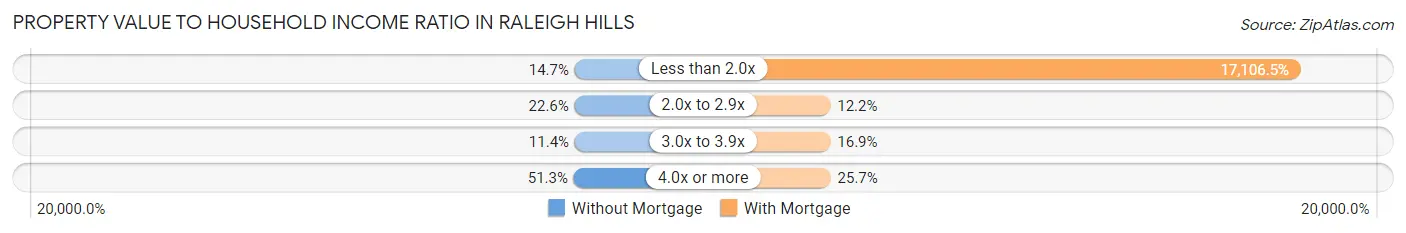
| Value-to-Income Ratio | Without Mortgage | With Mortgage |
| Less than 2.0x | 85 (14.7%) | 209,554 (17,106.5%) |
| 2.0x to 2.9x | 131 (22.6%) | 149 (12.2%) |
| 3.0x to 3.9x | 66 (11.4%) | 207 (16.9%) |
| 4.0x or more | 297 (51.3%) | 315 (25.7%) |
| Total | 579 (100.0%) | 1,225 (100.0%) |
Real Estate Taxes by Mortgage Status in Raleigh Hills
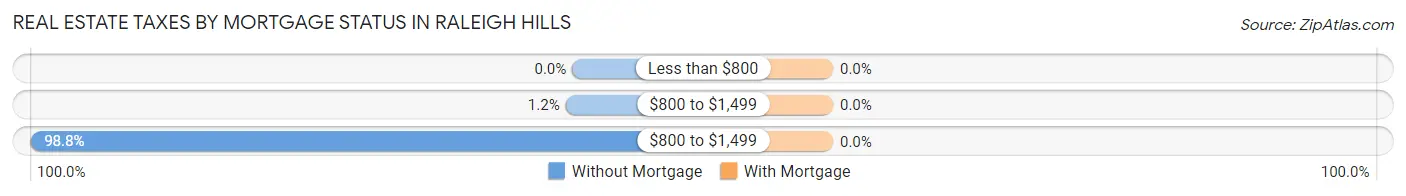
| Property Taxes | Without Mortgage | With Mortgage |
| Less than $800 | 0 (0.0%) | 0 (0.0%) |
| $800 to $1,499 | 7 (1.2%) | 0 (0.0%) |
| $800 to $1,499 | 572 (98.8%) | 0 (0.0%) |
| Total | 579 (100.0%) | 1,225 (100.0%) |
Health & Disability in Raleigh Hills
Health Insurance Coverage by Age in Raleigh Hills
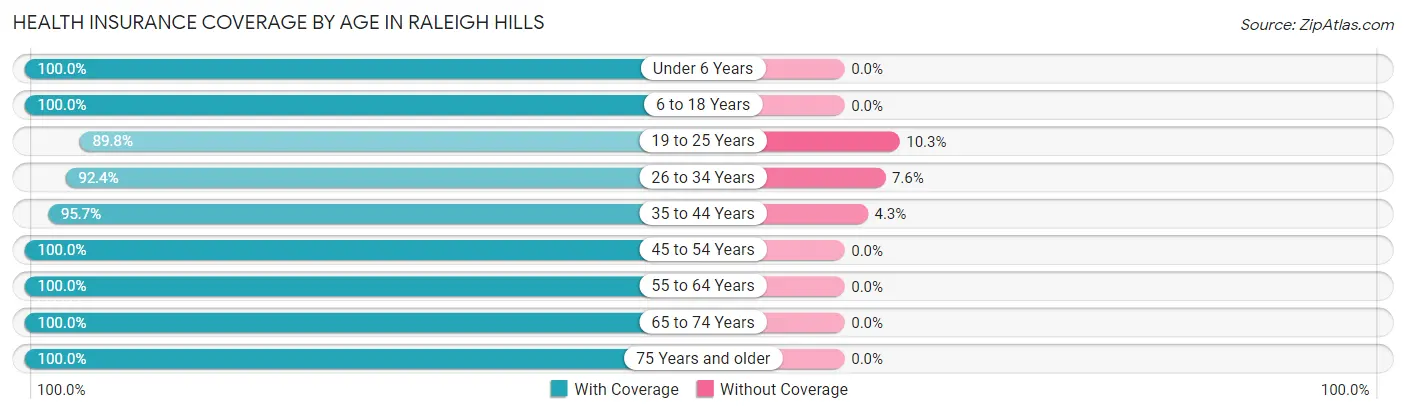
| Age Bracket | With Coverage | Without Coverage |
| Under 6 Years | 288 (100.0%) | 0 (0.0%) |
| 6 to 18 Years | 904 (100.0%) | 0 (0.0%) |
| 19 to 25 Years | 359 (89.7%) | 41 (10.2%) |
| 26 to 34 Years | 682 (92.4%) | 56 (7.6%) |
| 35 to 44 Years | 928 (95.7%) | 42 (4.3%) |
| 45 to 54 Years | 944 (100.0%) | 0 (0.0%) |
| 55 to 64 Years | 949 (100.0%) | 0 (0.0%) |
| 65 to 74 Years | 784 (100.0%) | 0 (0.0%) |
| 75 Years and older | 699 (100.0%) | 0 (0.0%) |
| Total | 6,537 (97.9%) | 139 (2.1%) |
Health Insurance Coverage by Citizenship Status in Raleigh Hills
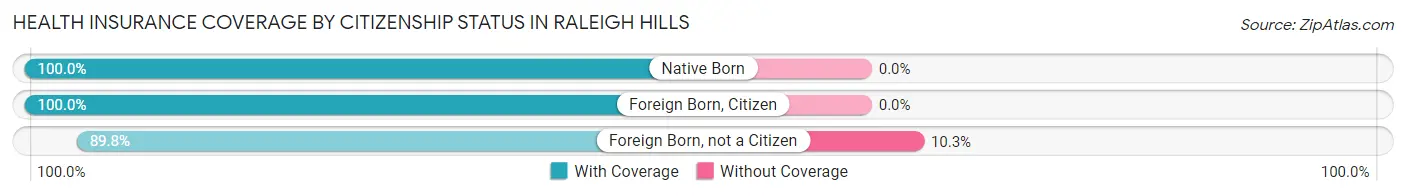
| Citizenship Status | With Coverage | Without Coverage |
| Native Born | 288 (100.0%) | 0 (0.0%) |
| Foreign Born, Citizen | 904 (100.0%) | 0 (0.0%) |
| Foreign Born, not a Citizen | 359 (89.7%) | 41 (10.2%) |
Health Insurance Coverage by Household Income in Raleigh Hills
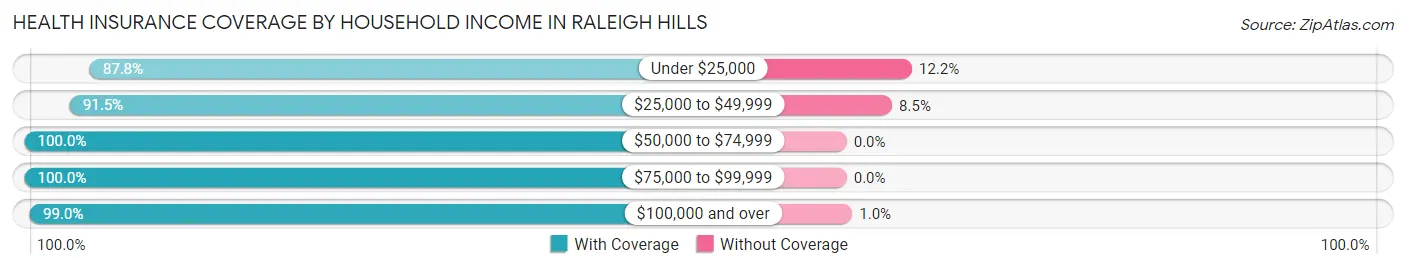
| Household Income | With Coverage | Without Coverage |
| Under $25,000 | 366 (87.8%) | 51 (12.2%) |
| $25,000 to $49,999 | 452 (91.5%) | 42 (8.5%) |
| $50,000 to $74,999 | 811 (100.0%) | 0 (0.0%) |
| $75,000 to $99,999 | 526 (100.0%) | 0 (0.0%) |
| $100,000 and over | 4,378 (99.0%) | 46 (1.0%) |
Public vs Private Health Insurance Coverage by Age in Raleigh Hills
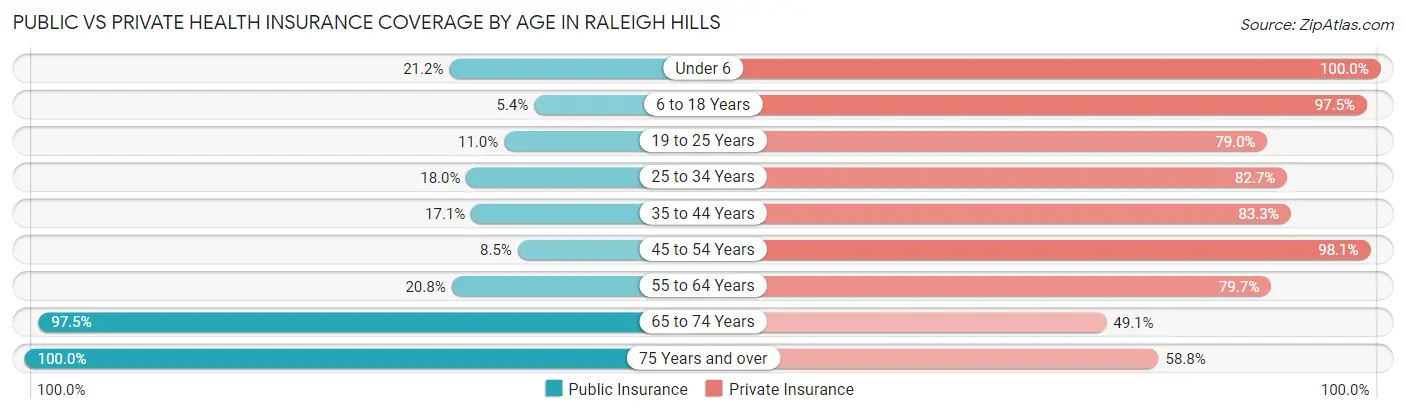
| Age Bracket | Public Insurance | Private Insurance |
| Under 6 | 61 (21.2%) | 288 (100.0%) |
| 6 to 18 Years | 49 (5.4%) | 881 (97.5%) |
| 19 to 25 Years | 44 (11.0%) | 316 (79.0%) |
| 25 to 34 Years | 133 (18.0%) | 610 (82.7%) |
| 35 to 44 Years | 166 (17.1%) | 808 (83.3%) |
| 45 to 54 Years | 80 (8.5%) | 926 (98.1%) |
| 55 to 64 Years | 197 (20.8%) | 756 (79.7%) |
| 65 to 74 Years | 764 (97.5%) | 385 (49.1%) |
| 75 Years and over | 699 (100.0%) | 411 (58.8%) |
| Total | 2,193 (32.9%) | 5,381 (80.6%) |
Disability Status by Sex by Age in Raleigh Hills
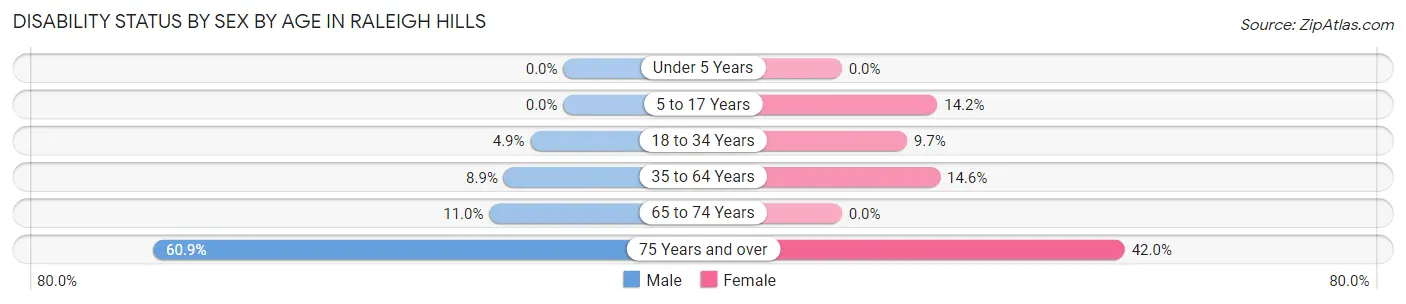
| Age Bracket | Male | Female |
| Under 5 Years | 0 (0.0%) | 0 (0.0%) |
| 5 to 17 Years | 0 (0.0%) | 75 (14.2%) |
| 18 to 34 Years | 28 (4.9%) | 58 (9.7%) |
| 35 to 64 Years | 126 (8.8%) | 210 (14.6%) |
| 65 to 74 Years | 44 (11.0%) | 0 (0.0%) |
| 75 Years and over | 159 (60.9%) | 184 (42.0%) |
Disability Class by Sex by Age in Raleigh Hills
Disability Class: Hearing Difficulty
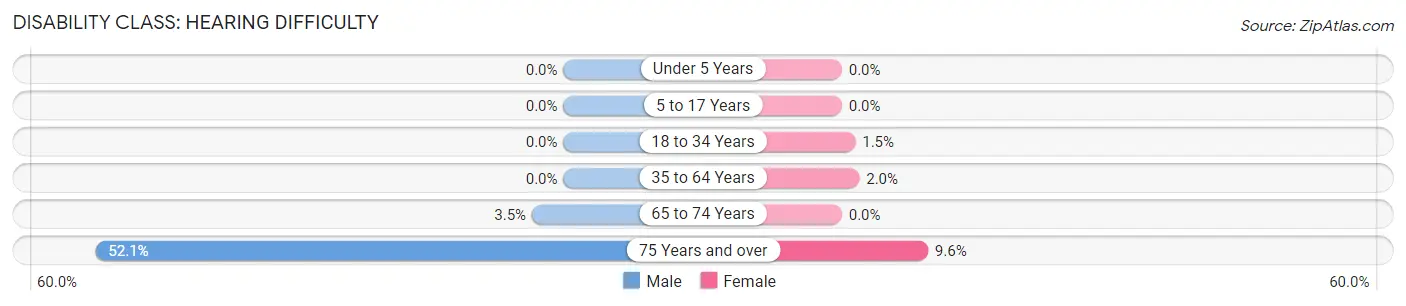
| Age Bracket | Male | Female |
| Under 5 Years | 0 (0.0%) | 0 (0.0%) |
| 5 to 17 Years | 0 (0.0%) | 0 (0.0%) |
| 18 to 34 Years | 0 (0.0%) | 9 (1.5%) |
| 35 to 64 Years | 0 (0.0%) | 28 (1.9%) |
| 65 to 74 Years | 14 (3.5%) | 0 (0.0%) |
| 75 Years and over | 136 (52.1%) | 42 (9.6%) |
Disability Class: Vision Difficulty
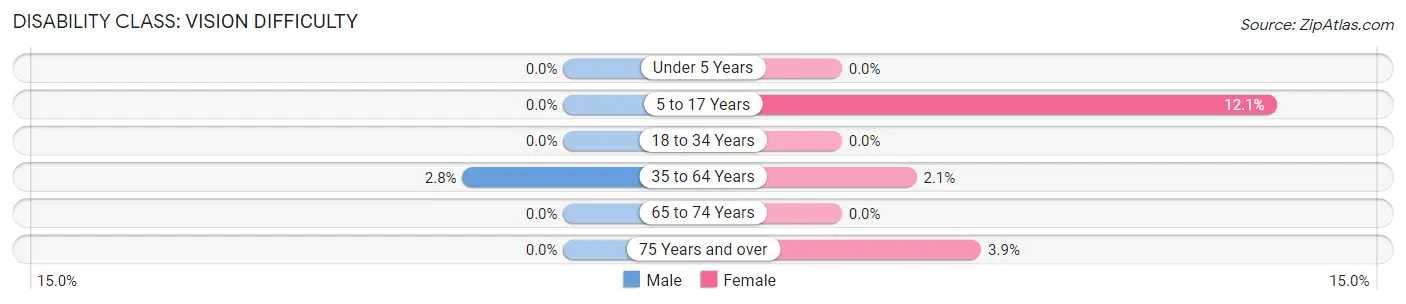
| Age Bracket | Male | Female |
| Under 5 Years | 0 (0.0%) | 0 (0.0%) |
| 5 to 17 Years | 0 (0.0%) | 64 (12.1%) |
| 18 to 34 Years | 0 (0.0%) | 0 (0.0%) |
| 35 to 64 Years | 40 (2.8%) | 30 (2.1%) |
| 65 to 74 Years | 0 (0.0%) | 0 (0.0%) |
| 75 Years and over | 0 (0.0%) | 17 (3.9%) |
Disability Class: Cognitive Difficulty
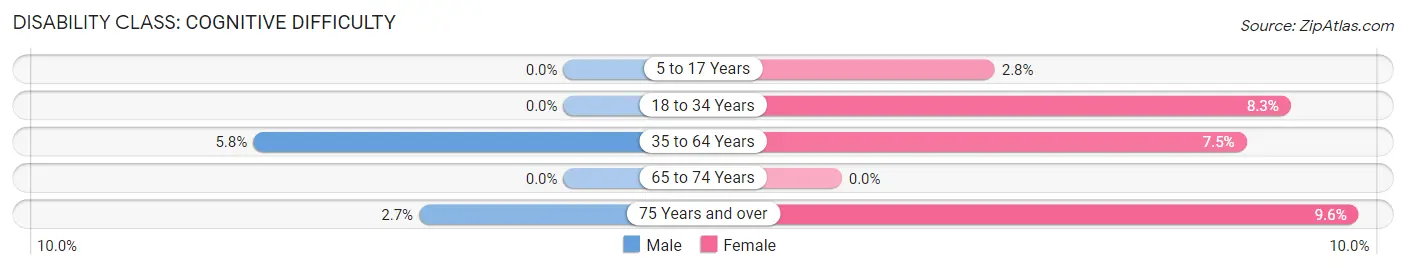
| Age Bracket | Male | Female |
| 5 to 17 Years | 0 (0.0%) | 15 (2.8%) |
| 18 to 34 Years | 0 (0.0%) | 50 (8.3%) |
| 35 to 64 Years | 82 (5.8%) | 108 (7.5%) |
| 65 to 74 Years | 0 (0.0%) | 0 (0.0%) |
| 75 Years and over | 7 (2.7%) | 42 (9.6%) |
Disability Class: Ambulatory Difficulty
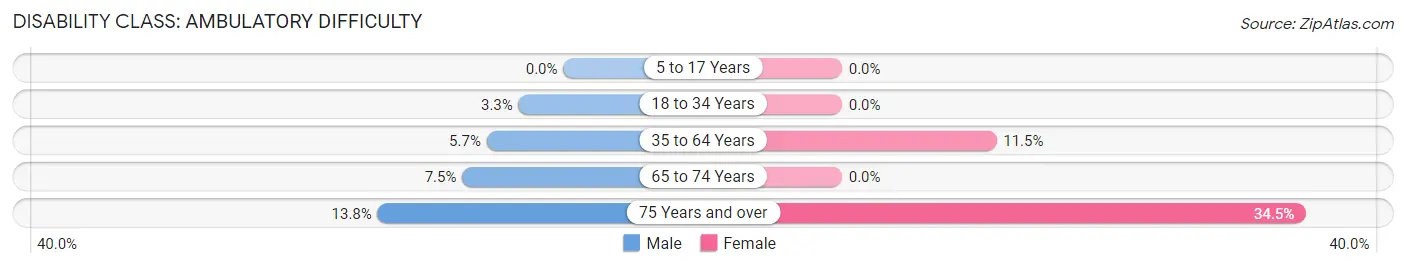
| Age Bracket | Male | Female |
| 5 to 17 Years | 0 (0.0%) | 0 (0.0%) |
| 18 to 34 Years | 19 (3.3%) | 0 (0.0%) |
| 35 to 64 Years | 81 (5.7%) | 165 (11.5%) |
| 65 to 74 Years | 30 (7.5%) | 0 (0.0%) |
| 75 Years and over | 36 (13.8%) | 151 (34.5%) |
Disability Class: Self-Care Difficulty
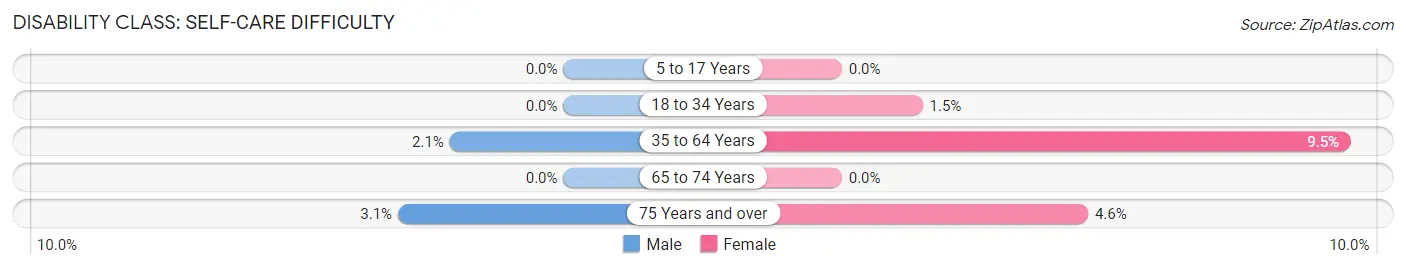
| Age Bracket | Male | Female |
| 5 to 17 Years | 0 (0.0%) | 0 (0.0%) |
| 18 to 34 Years | 0 (0.0%) | 9 (1.5%) |
| 35 to 64 Years | 30 (2.1%) | 136 (9.5%) |
| 65 to 74 Years | 0 (0.0%) | 0 (0.0%) |
| 75 Years and over | 8 (3.1%) | 20 (4.6%) |
Technology Access in Raleigh Hills
Computing Device Access in Raleigh Hills
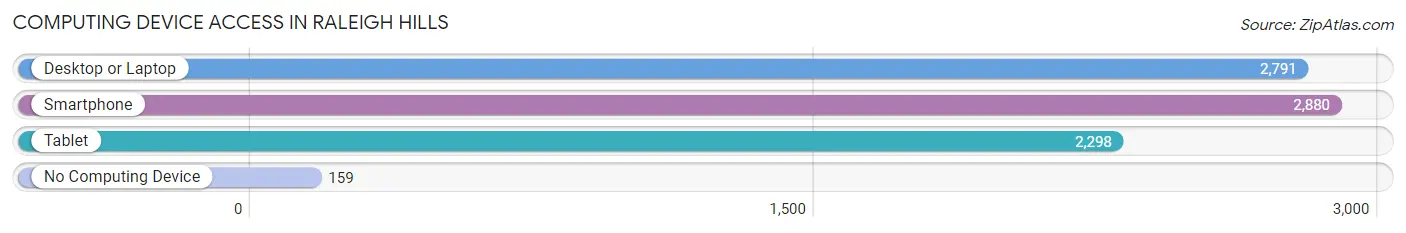
| Device Type | # Households | % Households |
| Desktop or Laptop | 2,791 | 87.3% |
| Smartphone | 2,880 | 90.1% |
| Tablet | 2,298 | 71.9% |
| No Computing Device | 159 | 5.0% |
| Total | 3,197 | 100.0% |
Internet Access in Raleigh Hills
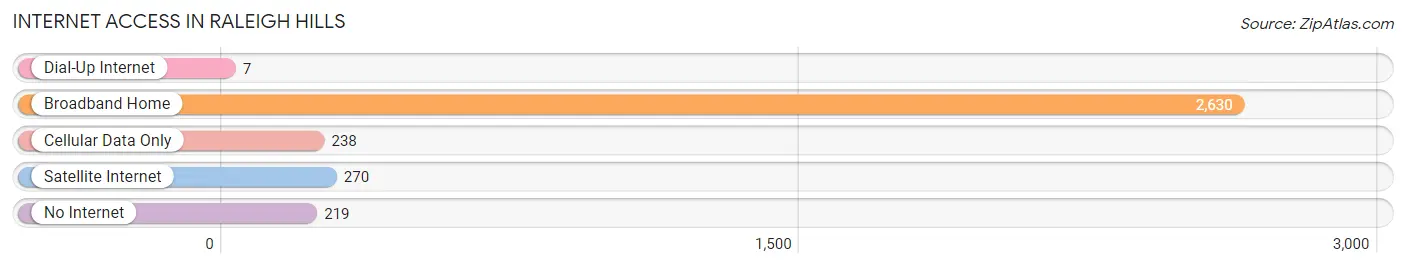
| Internet Type | # Households | % Households |
| Dial-Up Internet | 7 | 0.2% |
| Broadband Home | 2,630 | 82.3% |
| Cellular Data Only | 238 | 7.4% |
| Satellite Internet | 270 | 8.5% |
| No Internet | 219 | 6.9% |
| Total | 3,197 | 100.0% |
Raleigh Hills Summary
Raleigh Hills is an unincorporated community located in Washington County, Oregon, United States. It is located in the Tualatin Valley, just west of Portland. The community is bordered by Beaverton to the north, Garden Home-Whitford to the east, and Metzger to the south. Raleigh Hills is a primarily residential area, with a population of approximately 8,000 people.
History
Raleigh Hills was originally part of the Oregon Territory, which was established in 1848. The area was first settled in the late 1800s by homesteaders, who were attracted to the area by its fertile soil and abundant natural resources. The first post office in the area was established in 1891, and the community was named after the Raleigh family, who were among the first settlers.
In the early 1900s, the area began to develop as a residential community. The first school in the area was built in 1912, and the first church was established in 1915. The community continued to grow throughout the 20th century, and by the 1950s, it had become a popular suburb of Portland.
Geography
Raleigh Hills is located in the Tualatin Valley, just west of Portland. The community is bordered by Beaverton to the north, Garden Home-Whitford to the east, and Metzger to the south. The area is characterized by rolling hills and lush vegetation, and is home to several parks and recreational areas. The climate in Raleigh Hills is mild and temperate, with average temperatures ranging from the mid-30s in the winter to the mid-80s in the summer.
Economy
Raleigh Hills is primarily a residential community, and the majority of its residents are employed in the nearby cities of Portland and Beaverton. The area is home to several small businesses, including restaurants, retail stores, and professional services. The community is also home to several corporate offices, including Intel, Nike, and Tektronix.
Demographics
As of the 2010 census, the population of Raleigh Hills was 8,000. The racial makeup of the community was 79.3% White, 8.2% Asian, 6.3% Hispanic or Latino, and 4.2% African American. The median household income was $71,000, and the median home value was $400,000.
Conclusion
Raleigh Hills is an unincorporated community located in Washington County, Oregon, United States. It is located in the Tualatin Valley, just west of Portland. The community is bordered by Beaverton to the north, Garden Home-Whitford to the east, and Metzger to the south. Raleigh Hills is a primarily residential area, with a population of approximately 8,000 people. The area is characterized by rolling hills and lush vegetation, and is home to several parks and recreational areas. The economy of Raleigh Hills is primarily based on small businesses and corporate offices, and the median household income is $71,000. The racial makeup of the community is 79.3% White, 8.2% Asian, 6.3% Hispanic or Latino, and 4.2% African American.
Common Questions
What is the Total Population of Raleigh Hills?
Total Population of Raleigh Hills is 6,737.
What is the Total Male Population of Raleigh Hills?
Total Male Population of Raleigh Hills is 3,226.
What is the Total Female Population of Raleigh Hills?
Total Female Population of Raleigh Hills is 3,511.
What is the Ratio of Males per 100 Females in Raleigh Hills?
There are 91.88 Males per 100 Females in Raleigh Hills.
What is the Ratio of Females per 100 Males in Raleigh Hills?
There are 108.83 Females per 100 Males in Raleigh Hills.
What is the Median Population Age in Raleigh Hills?
Median Population Age in Raleigh Hills is 45.5 Years.
What is the Average Family Size in Raleigh Hills
Average Family Size in Raleigh Hills is 2.7 People.
What is the Average Household Size in Raleigh Hills
Average Household Size in Raleigh Hills is 2.1 People.
What is Per Capita Income in Raleigh Hills?
Per Capita income in Raleigh Hills is $87,969.
What is the Median Family Income in Raleigh Hills?
Median Family Income in Raleigh Hills is $167,361.
What is the Median Household income in Raleigh Hills?
Median Household Income in Raleigh Hills is $119,473.
What is Income or Wage Gap in Raleigh Hills?
Income or Wage Gap in Raleigh Hills is 33.0%.
Women in Raleigh Hills earn 67.0 cents for every dollar earned by a man.
What is Inequality or Gini Index in Raleigh Hills?
Inequality or Gini Index in Raleigh Hills is 0.53.
How Large is the Labor Force in Raleigh Hills?
There are 3,741 People in the Labor Forcein in Raleigh Hills.
What is the Percentage of People in the Labor Force in Raleigh Hills?
65.0% of People are in the Labor Force in Raleigh Hills.
What is the Unemployment Rate in Raleigh Hills?
Unemployment Rate in Raleigh Hills is 4.4%.