Joseph, OR
Joseph Map
Joseph Overview
1,048
TOTAL POPULATION
484
MALE POPULATION
564
FEMALE POPULATION
85.82
MALES / 100 FEMALES
116.53
FEMALES / 100 MALES
59.6
MEDIAN AGE
2.5
AVG FAMILY SIZE
2.0
AVG HOUSEHOLD SIZE
$29,843
PER CAPITA INCOME
$65,337
AVG FAMILY INCOME
$48,309
AVG HOUSEHOLD INCOME
0.38
INEQUALITY / GINI INDEX
436
LABOR FORCE [ PEOPLE ]
48.0%
PERCENT IN LABOR FORCE
5.3%
UNEMPLOYMENT RATE
Joseph Zip Codes
Joseph Area Codes
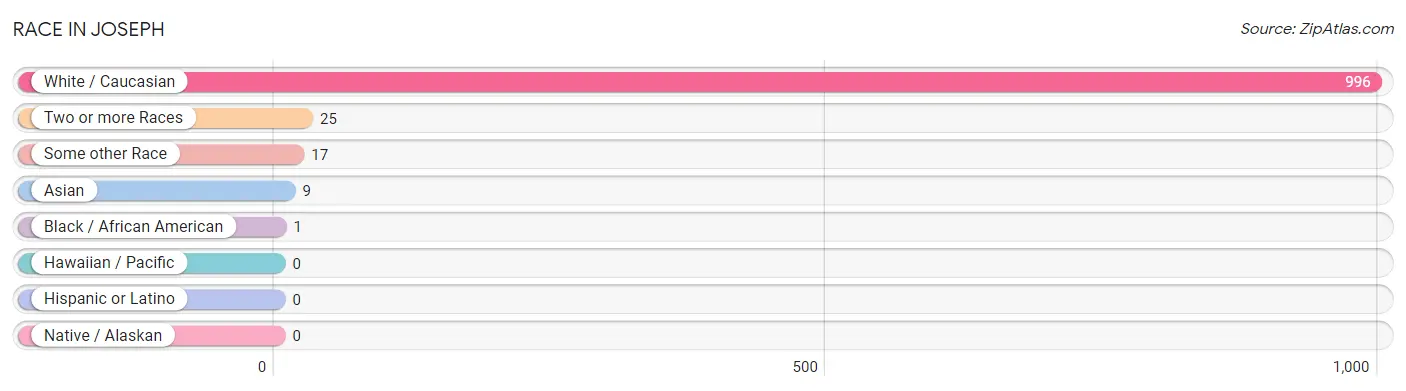
Race in Joseph
The most populous races in Joseph are White / Caucasian (996 | 95.0%), Two or more Races (25 | 2.4%), and Some other Race (17 | 1.6%).
| Race | # Population | % Population |
| Asian | 9 | 0.9% |
| Black / African American | 1 | 0.1% |
| Hawaiian / Pacific | 0 | 0.0% |
| Hispanic or Latino | 0 | 0.0% |
| Native / Alaskan | 0 | 0.0% |
| White / Caucasian | 996 | 95.0% |
| Two or more Races | 25 | 2.4% |
| Some other Race | 17 | 1.6% |
| Total | 1,048 | 100.0% |
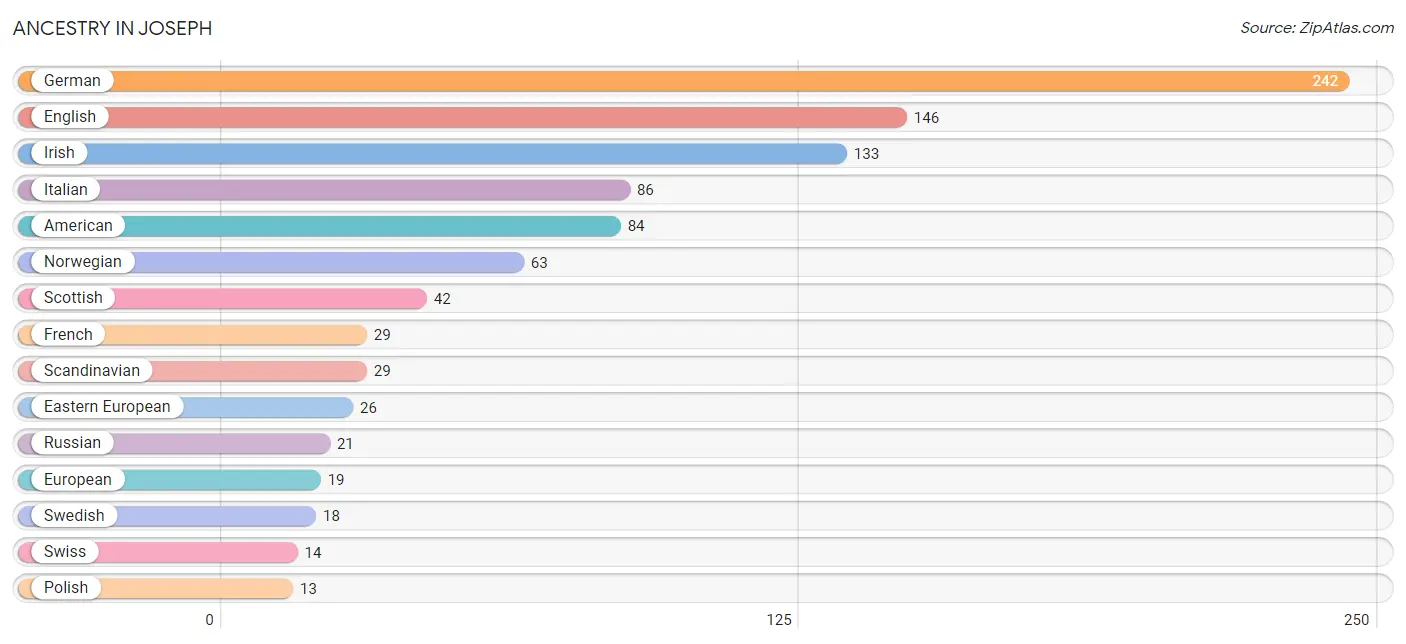
Ancestry in Joseph
The most populous ancestries reported in Joseph are German (242 | 23.1%), English (146 | 13.9%), Irish (133 | 12.7%), Italian (86 | 8.2%), and American (84 | 8.0%), together accounting for 65.9% of all Joseph residents.
| Ancestry | # Population | % Population |
| American | 84 | 8.0% |
| Blackfeet | 4 | 0.4% |
| British | 9 | 0.9% |
| Chippewa | 9 | 0.9% |
| Czech | 10 | 0.9% |
| Danish | 10 | 0.9% |
| Dutch | 4 | 0.4% |
| Eastern European | 26 | 2.5% |
| English | 146 | 13.9% |
| European | 19 | 1.8% |
| Finnish | 10 | 0.9% |
| French | 29 | 2.8% |
| German | 242 | 23.1% |
| Irish | 133 | 12.7% |
| Italian | 86 | 8.2% |
| Laotian | 8 | 0.8% |
| Norwegian | 63 | 6.0% |
| Pakistani | 2 | 0.2% |
| Polish | 13 | 1.2% |
| Portuguese | 2 | 0.2% |
| Russian | 21 | 2.0% |
| Scandinavian | 29 | 2.8% |
| Scotch-Irish | 11 | 1.1% |
| Scottish | 42 | 4.0% |
| Swedish | 18 | 1.7% |
| Swiss | 14 | 1.3% |
| Ukrainian | 2 | 0.2% |
| Welsh | 12 | 1.1% | View All 28 Rows |
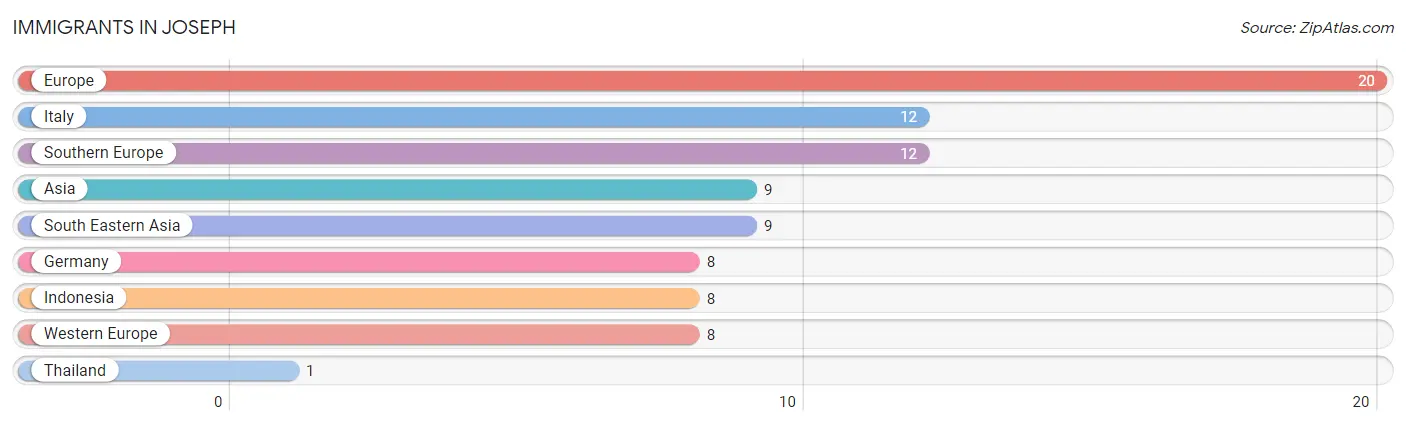
Immigrants in Joseph
The most numerous immigrant groups reported in Joseph came from Europe (20 | 1.9%), Italy (12 | 1.1%), Southern Europe (12 | 1.1%), Asia (9 | 0.9%), and South Eastern Asia (9 | 0.9%), together accounting for 5.9% of all Joseph residents.
| Immigration Origin | # Population | % Population |
| Asia | 9 | 0.9% |
| Europe | 20 | 1.9% |
| Germany | 8 | 0.8% |
| Indonesia | 8 | 0.8% |
| Italy | 12 | 1.1% |
| South Eastern Asia | 9 | 0.9% |
| Southern Europe | 12 | 1.1% |
| Thailand | 1 | 0.1% |
| Western Europe | 8 | 0.8% | View All 9 Rows |
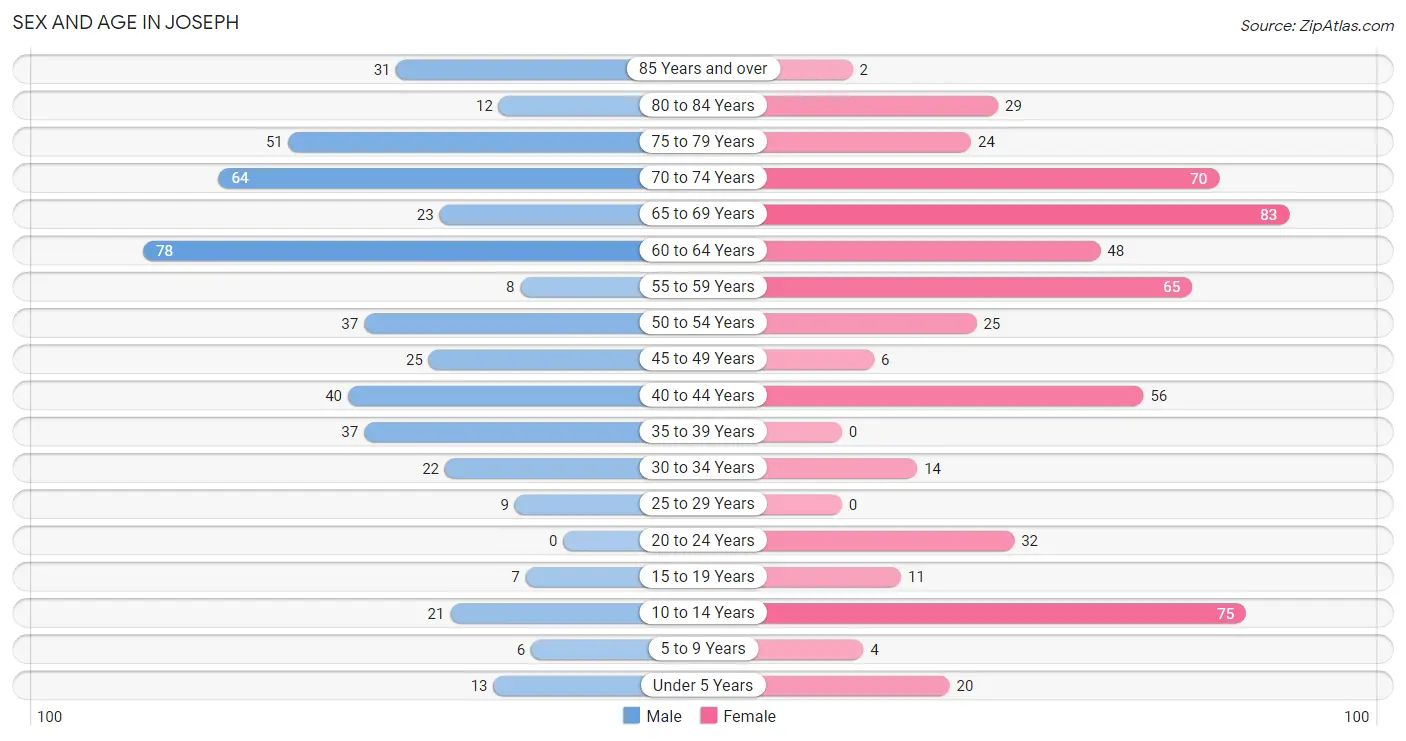
Sex and Age in Joseph
Sex and Age in Joseph
The most populous age groups in Joseph are 60 to 64 Years (78 | 16.1%) for men and 65 to 69 Years (83 | 14.7%) for women.
| Age Bracket | Male | Female |
| Under 5 Years | 13 (2.7%) | 20 (3.5%) |
| 5 to 9 Years | 6 (1.2%) | 4 (0.7%) |
| 10 to 14 Years | 21 (4.3%) | 75 (13.3%) |
| 15 to 19 Years | 7 (1.5%) | 11 (1.9%) |
| 20 to 24 Years | 0 (0.0%) | 32 (5.7%) |
| 25 to 29 Years | 9 (1.9%) | 0 (0.0%) |
| 30 to 34 Years | 22 (4.5%) | 14 (2.5%) |
| 35 to 39 Years | 37 (7.6%) | 0 (0.0%) |
| 40 to 44 Years | 40 (8.3%) | 56 (9.9%) |
| 45 to 49 Years | 25 (5.2%) | 6 (1.1%) |
| 50 to 54 Years | 37 (7.6%) | 25 (4.4%) |
| 55 to 59 Years | 8 (1.7%) | 65 (11.5%) |
| 60 to 64 Years | 78 (16.1%) | 48 (8.5%) |
| 65 to 69 Years | 23 (4.8%) | 83 (14.7%) |
| 70 to 74 Years | 64 (13.2%) | 70 (12.4%) |
| 75 to 79 Years | 51 (10.5%) | 24 (4.3%) |
| 80 to 84 Years | 12 (2.5%) | 29 (5.1%) |
| 85 Years and over | 31 (6.4%) | 2 (0.4%) |
| Total | 484 (100.0%) | 564 (100.0%) |
Families and Households in Joseph
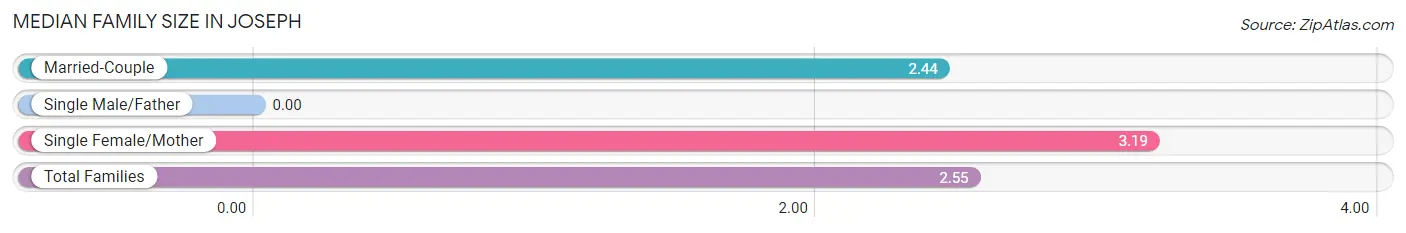
Median Family Size in Joseph
| Family Type | # Families | Family Size |
| Married-Couple | 263 (86.2%) | 2.44 |
| Single Male/Father | 0 (0.0%) | - |
| Single Female/Mother | 42 (13.8%) | 3.19 |
| Total Families | 305 (100.0%) | 2.55 |
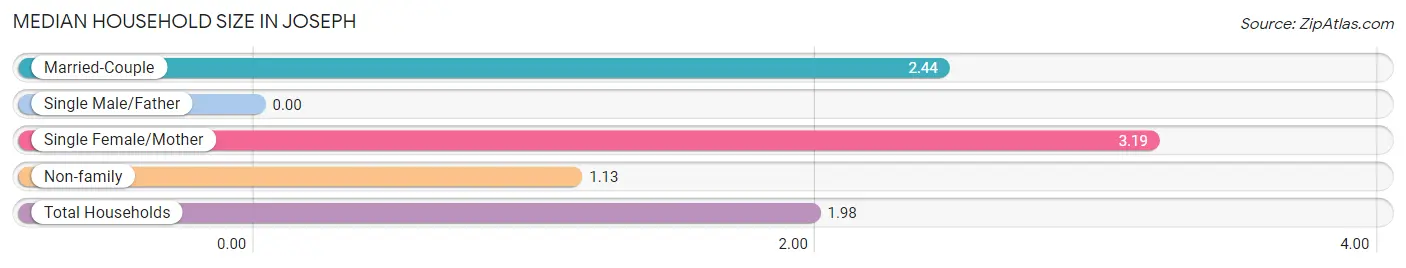
Median Household Size in Joseph
| Household Type | # Households | Household Size |
| Married-Couple | 263 (51.6%) | 2.44 |
| Single Male/Father | 0 (0.0%) | - |
| Single Female/Mother | 42 (8.2%) | 3.19 |
| Non-family | 205 (40.2%) | 1.13 |
| Total Households | 510 (100.0%) | 1.98 |
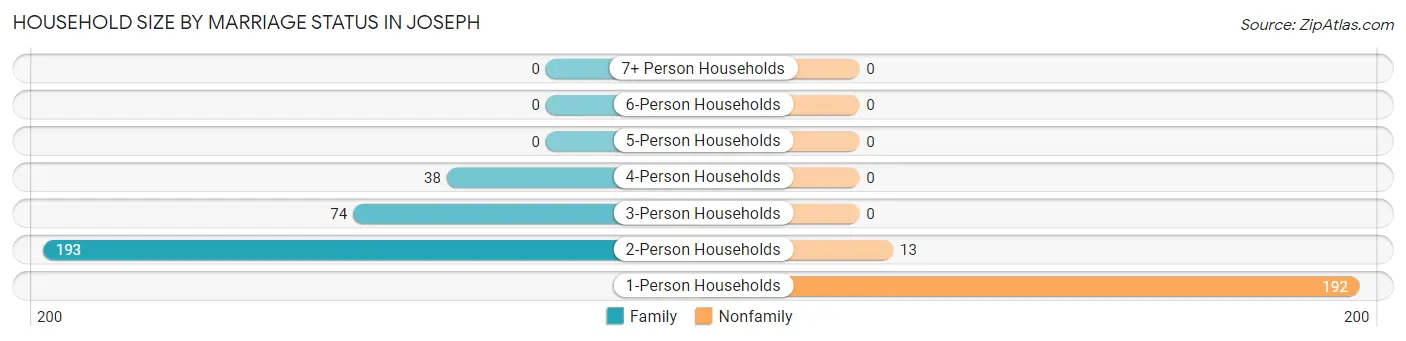
Household Size by Marriage Status in Joseph
Out of a total of 510 households in Joseph, 305 (59.8%) are family households, while 205 (40.2%) are nonfamily households. The most numerous type of family households are 2-person households, comprising 193, and the most common type of nonfamily households are 1-person households, comprising 192.
| Household Size | Family Households | Nonfamily Households |
| 1-Person Households | - | 192 (37.7%) |
| 2-Person Households | 193 (37.8%) | 13 (2.5%) |
| 3-Person Households | 74 (14.5%) | 0 (0.0%) |
| 4-Person Households | 38 (7.4%) | 0 (0.0%) |
| 5-Person Households | 0 (0.0%) | 0 (0.0%) |
| 6-Person Households | 0 (0.0%) | 0 (0.0%) |
| 7+ Person Households | 0 (0.0%) | 0 (0.0%) |
| Total | 305 (59.8%) | 205 (40.2%) |
Female Fertility in Joseph
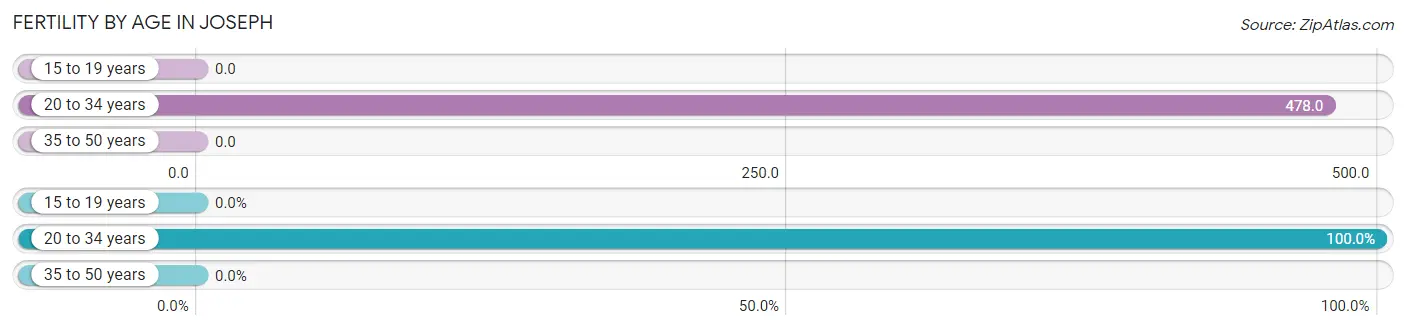
Fertility by Age in Joseph
Average fertility rate in Joseph is 164.0 births per 1,000 women. Women in the age bracket of 20 to 34 years have the highest fertility rate with 478.0 births per 1,000 women. Women in the age bracket of 20 to 34 years acount for 100.0% of all women with births.
| Age Bracket | Women with Births | Births / 1,000 Women |
| 15 to 19 years | 0 (0.0%) | 0.0 |
| 20 to 34 years | 22 (100.0%) | 478.0 |
| 35 to 50 years | 0 (0.0%) | 0.0 |
| Total | 22 (100.0%) | 164.0 |
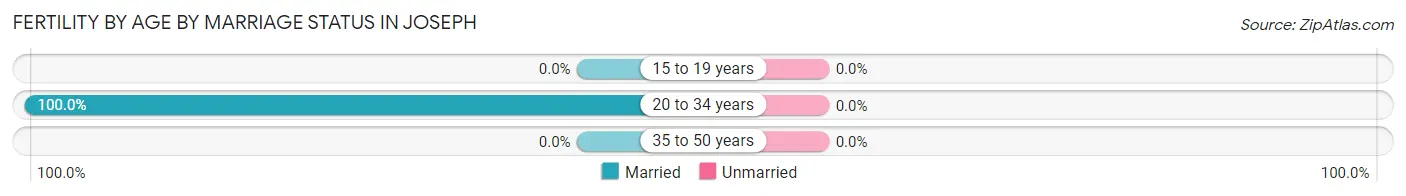
Fertility by Age by Marriage Status in Joseph
| Age Bracket | Married | Unmarried |
| 15 to 19 years | 0 (0.0%) | 0 (0.0%) |
| 20 to 34 years | 22 (100.0%) | 0 (0.0%) |
| 35 to 50 years | 0 (0.0%) | 0 (0.0%) |
| Total | 22 (100.0%) | 0 (0.0%) |
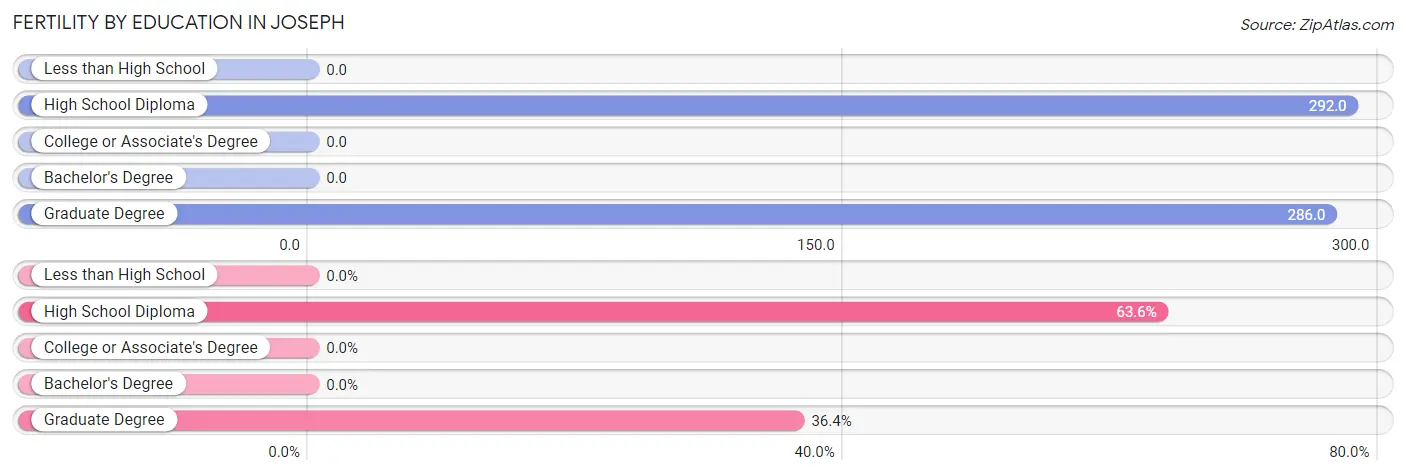
Fertility by Education in Joseph
| Educational Attainment | Women with Births | Births / 1,000 Women |
| Less than High School | 0 (0.0%) | 0.0 |
| High School Diploma | 14 (63.6%) | 292.0 |
| College or Associate's Degree | 0 (0.0%) | 0.0 |
| Bachelor's Degree | 0 (0.0%) | 0.0 |
| Graduate Degree | 8 (36.4%) | 286.0 |
| Total | 22 (100.0%) | 164.0 |
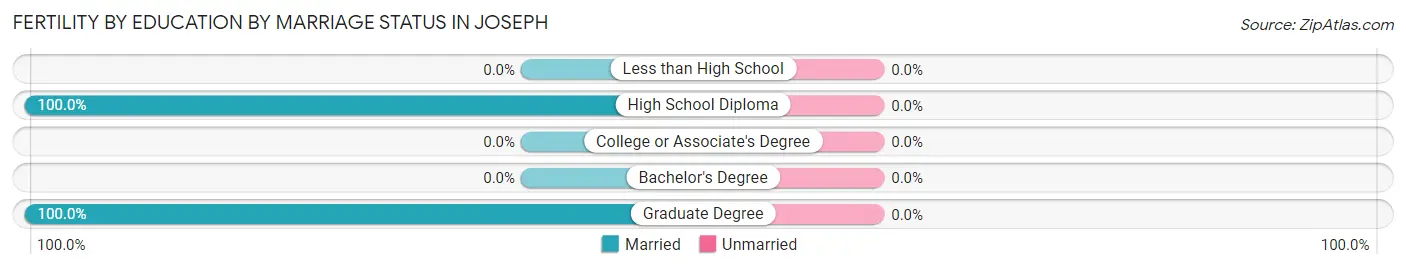
Fertility by Education by Marriage Status in Joseph
| Educational Attainment | Married | Unmarried |
| Less than High School | 0 (0.0%) | 0 (0.0%) |
| High School Diploma | 14 (100.0%) | 0 (0.0%) |
| College or Associate's Degree | 0 (0.0%) | 0 (0.0%) |
| Bachelor's Degree | 0 (0.0%) | 0 (0.0%) |
| Graduate Degree | 8 (100.0%) | 0 (0.0%) |
| Total | 22 (100.0%) | 0 (0.0%) |
Income in Joseph
Income Overview in Joseph
Per Capita Income in Joseph is $29,843, while median incomes of families and households are $65,337 and $48,309 respectively.
| Characteristic | Number | Measure |
| Per Capita Income | 1,048 | $29,843 |
| Median Family Income | 305 | $65,337 |
| Mean Family Income | 305 | $76,218 |
| Median Household Income | 510 | $48,309 |
| Mean Household Income | 510 | $59,198 |
| Income Deficit | 305 | $0 |
| Wage / Income Gap (%) | 1,048 | 0.00% |
| Wage / Income Gap ($) | 1,048 | 100.00¢ per $1 |
| Gini / Inequality Index | 1,048 | 0.38 |
Earnings by Sex in Joseph
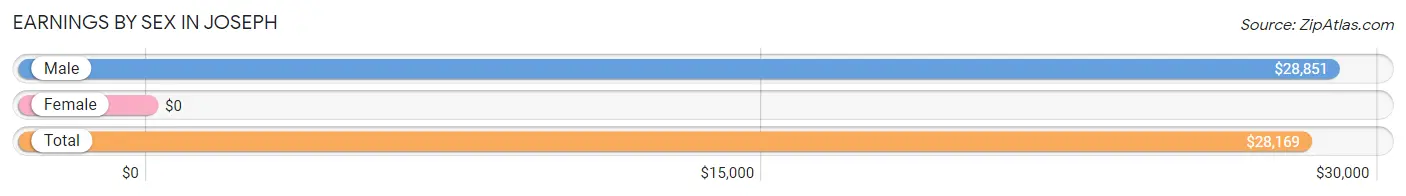
| Sex | Number | Average Earnings |
| Male | 230 (44.5%) | $28,851 |
| Female | 287 (55.5%) | $0 |
| Total | 517 (100.0%) | $28,169 |
Earnings by Sex by Income Bracket in Joseph
The most common earnings brackets in Joseph are $25,000 to $29,999 for men (55 | 23.9%) and $2,500 to $4,999 for women (41 | 14.3%).
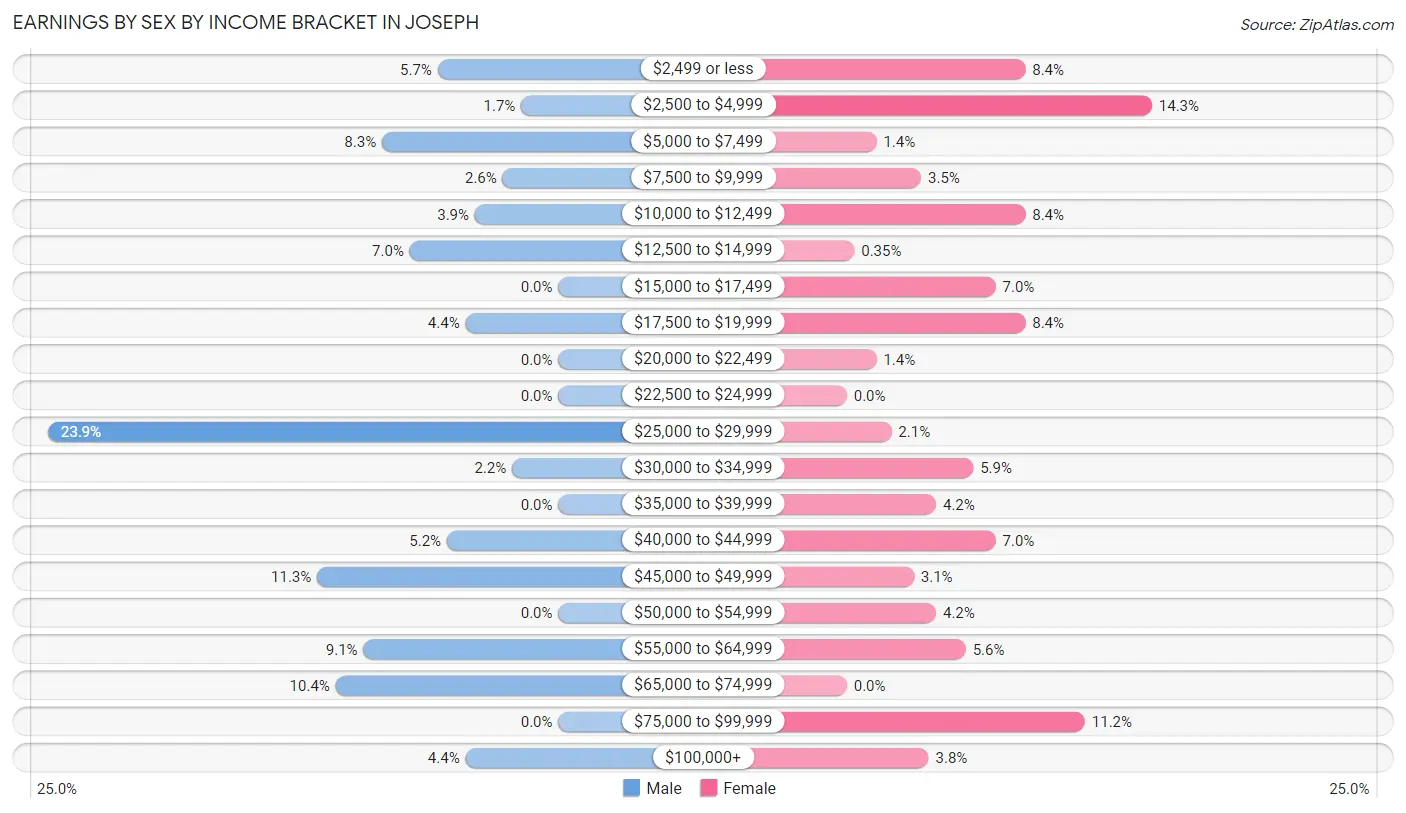
| Income | Male | Female |
| $2,499 or less | 13 (5.7%) | 24 (8.4%) |
| $2,500 to $4,999 | 4 (1.7%) | 41 (14.3%) |
| $5,000 to $7,499 | 19 (8.3%) | 4 (1.4%) |
| $7,500 to $9,999 | 6 (2.6%) | 10 (3.5%) |
| $10,000 to $12,499 | 9 (3.9%) | 24 (8.4%) |
| $12,500 to $14,999 | 16 (7.0%) | 1 (0.4%) |
| $15,000 to $17,499 | 0 (0.0%) | 20 (7.0%) |
| $17,500 to $19,999 | 10 (4.3%) | 24 (8.4%) |
| $20,000 to $22,499 | 0 (0.0%) | 4 (1.4%) |
| $22,500 to $24,999 | 0 (0.0%) | 0 (0.0%) |
| $25,000 to $29,999 | 55 (23.9%) | 6 (2.1%) |
| $30,000 to $34,999 | 5 (2.2%) | 17 (5.9%) |
| $35,000 to $39,999 | 0 (0.0%) | 12 (4.2%) |
| $40,000 to $44,999 | 12 (5.2%) | 20 (7.0%) |
| $45,000 to $49,999 | 26 (11.3%) | 9 (3.1%) |
| $50,000 to $54,999 | 0 (0.0%) | 12 (4.2%) |
| $55,000 to $64,999 | 21 (9.1%) | 16 (5.6%) |
| $65,000 to $74,999 | 24 (10.4%) | 0 (0.0%) |
| $75,000 to $99,999 | 0 (0.0%) | 32 (11.2%) |
| $100,000+ | 10 (4.3%) | 11 (3.8%) |
| Total | 230 (100.0%) | 287 (100.0%) |
Earnings by Sex by Educational Attainment in Joseph
Average earnings in Joseph are $29,088 for men and $30,000 for women, a difference of 3.0%. Men with an educational attainment of bachelor's degree enjoy the highest average annual earnings of $28,068, while those with bachelor's degree education earn the least with $28,068. Women with an educational attainment of graduate degree earn the most with the average annual earnings of $53,438, while those with college or associate's degree education have the smallest earnings of $17,763.
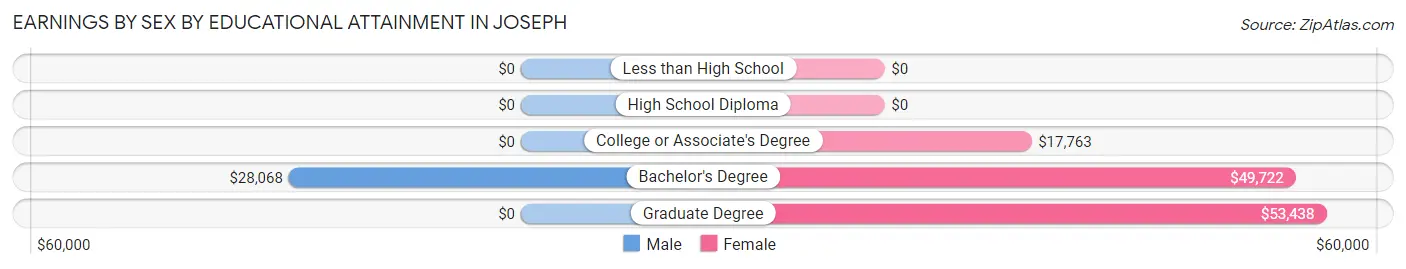
| Educational Attainment | Male Income | Female Income |
| Less than High School | - | - |
| High School Diploma | - | - |
| College or Associate's Degree | - | - |
| Bachelor's Degree | $28,068 | $49,722 |
| Graduate Degree | - | - |
| Total | $29,088 | $30,000 |
Family Income in Joseph
Family Income Brackets in Joseph
According to the Joseph family income data, there are 97 families falling into the $35,000 to $49,999 income range, which is the most common income bracket and makes up 31.8% of all families.
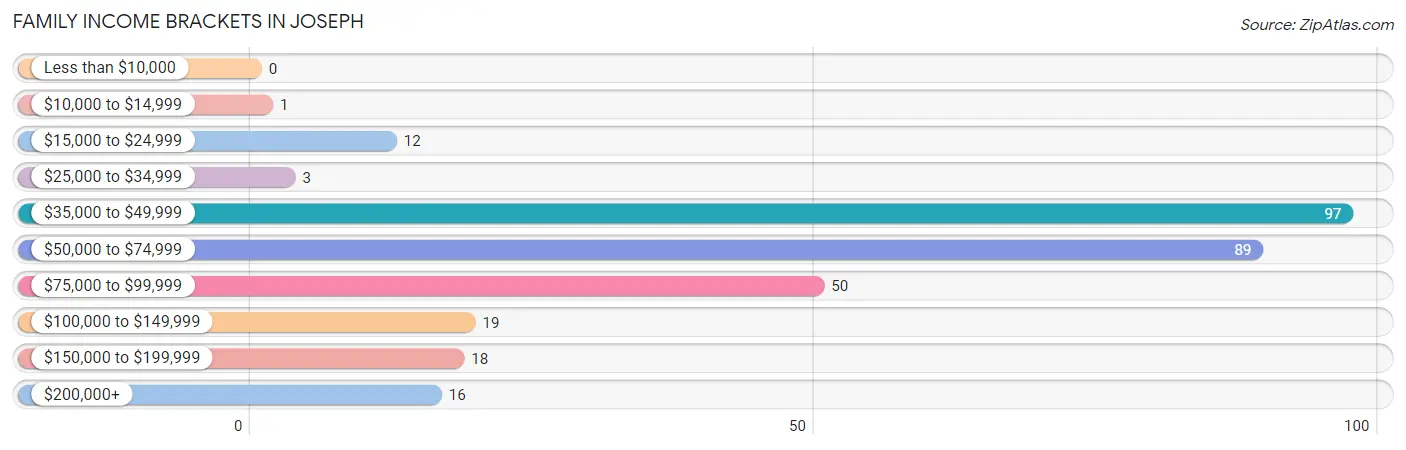
| Income Bracket | # Families | % Families |
| Less than $10,000 | 0 | 0.0% |
| $10,000 to $14,999 | 1 | 0.3% |
| $15,000 to $24,999 | 12 | 3.9% |
| $25,000 to $34,999 | 3 | 1.0% |
| $35,000 to $49,999 | 97 | 31.8% |
| $50,000 to $74,999 | 89 | 29.2% |
| $75,000 to $99,999 | 50 | 16.4% |
| $100,000 to $149,999 | 19 | 6.2% |
| $150,000 to $199,999 | 18 | 5.9% |
| $200,000+ | 16 | 5.2% |
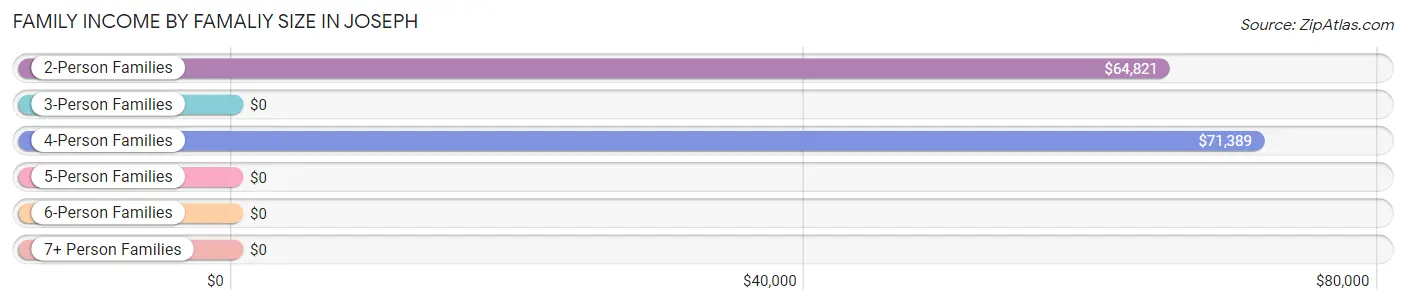
Family Income by Famaliy Size in Joseph
4-person families (38 | 12.5%) account for the highest median family income in Joseph with $71,389 per family, while 2-person families (193 | 63.3%) have the highest median income of $32,410 per family member.
| Income Bracket | # Families | Median Income |
| 2-Person Families | 193 (63.3%) | $64,821 |
| 3-Person Families | 74 (24.3%) | $0 |
| 4-Person Families | 38 (12.5%) | $71,389 |
| 5-Person Families | 0 (0.0%) | $0 |
| 6-Person Families | 0 (0.0%) | $0 |
| 7+ Person Families | 0 (0.0%) | $0 |
| Total | 305 (100.0%) | $65,337 |
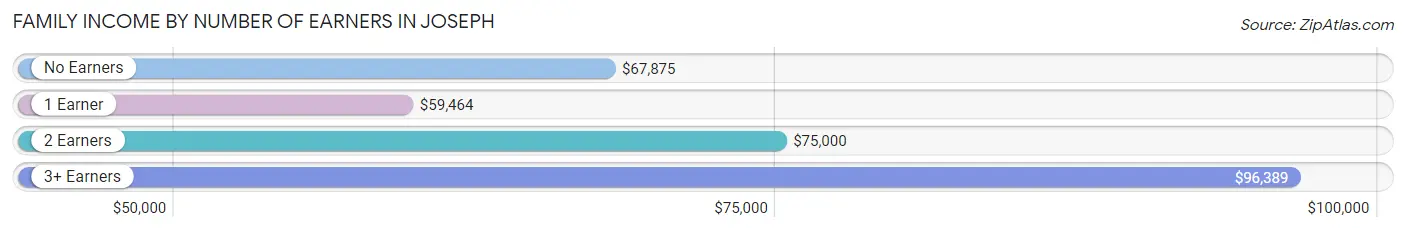
Family Income by Number of Earners in Joseph
The median family income in Joseph is $65,337, with families comprising 3+ earners (18) having the highest median family income of $96,389, while families with 1 earner (114) have the lowest median family income of $59,464, accounting for 5.9% and 37.4% of families, respectively.
| Number of Earners | # Families | Median Income |
| No Earners | 57 (18.7%) | $67,875 |
| 1 Earner | 114 (37.4%) | $59,464 |
| 2 Earners | 116 (38.0%) | $75,000 |
| 3+ Earners | 18 (5.9%) | $96,389 |
| Total | 305 (100.0%) | $65,337 |
Household Income in Joseph
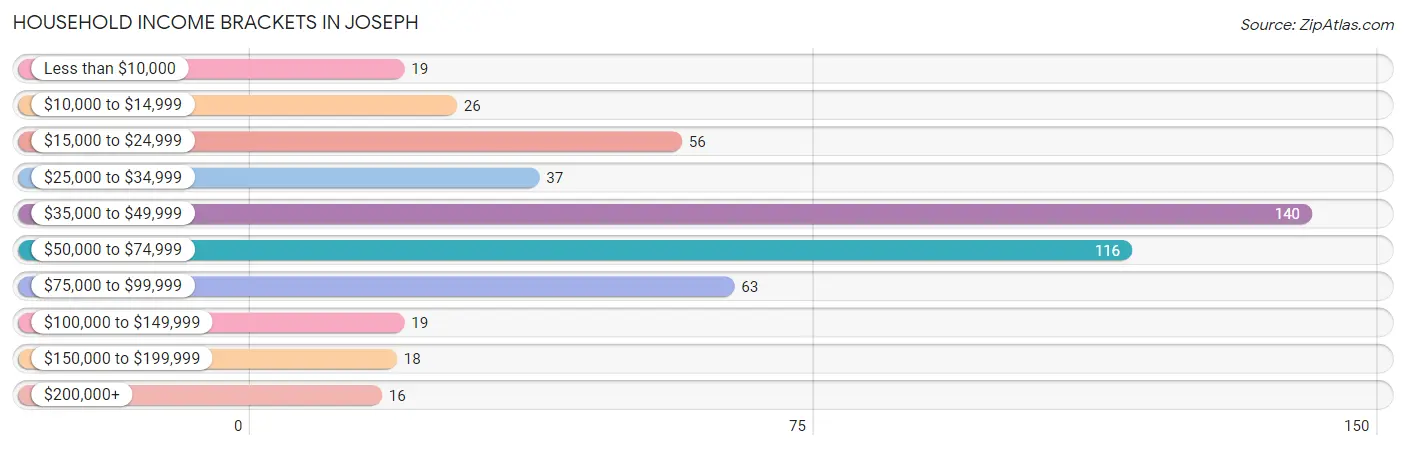
Household Income Brackets in Joseph
With 140 households falling in the category, the $35,000 to $49,999 income range is the most frequent in Joseph, accounting for 27.5% of all households. In contrast, only 16 households (3.1%) fall into the $200,000+ income bracket, making it the least populous group.
| Income Bracket | # Households | % Households |
| Less than $10,000 | 19 | 3.7% |
| $10,000 to $14,999 | 26 | 5.1% |
| $15,000 to $24,999 | 56 | 11.0% |
| $25,000 to $34,999 | 37 | 7.3% |
| $35,000 to $49,999 | 140 | 27.5% |
| $50,000 to $74,999 | 116 | 22.7% |
| $75,000 to $99,999 | 63 | 12.4% |
| $100,000 to $149,999 | 19 | 3.7% |
| $150,000 to $199,999 | 18 | 3.5% |
| $200,000+ | 16 | 3.1% |
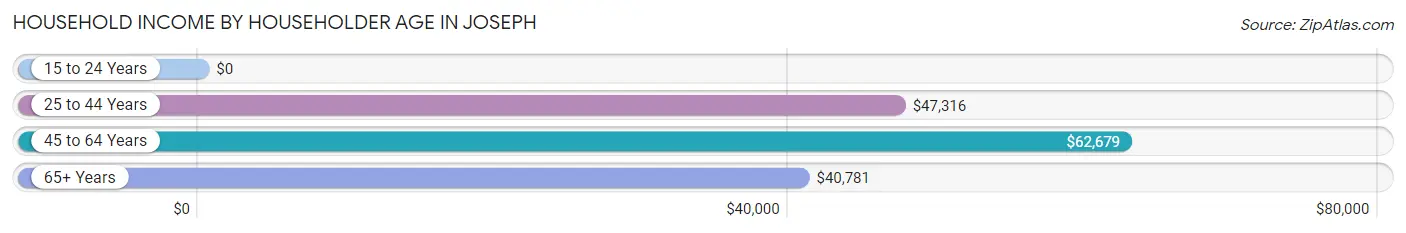
Household Income by Householder Age in Joseph
The median household income in Joseph is $48,309, with the highest median household income of $62,679 found in the 45 to 64 years age bracket for the primary householder. A total of 201 households (39.4%) fall into this category.
| Income Bracket | # Households | Median Income |
| 15 to 24 Years | 0 (0.0%) | $0 |
| 25 to 44 Years | 99 (19.4%) | $47,316 |
| 45 to 64 Years | 201 (39.4%) | $62,679 |
| 65+ Years | 210 (41.2%) | $40,781 |
| Total | 510 (100.0%) | $48,309 |
Poverty in Joseph
Income Below Poverty by Sex and Age in Joseph
With 10.1% poverty level for males and 4.9% for females among the residents of Joseph, 75 year old and over males and 45 to 54 year old females are the most vulnerable to poverty, with 18 males (21.2%) and 8 females (25.8%) in their respective age groups living below the poverty level.
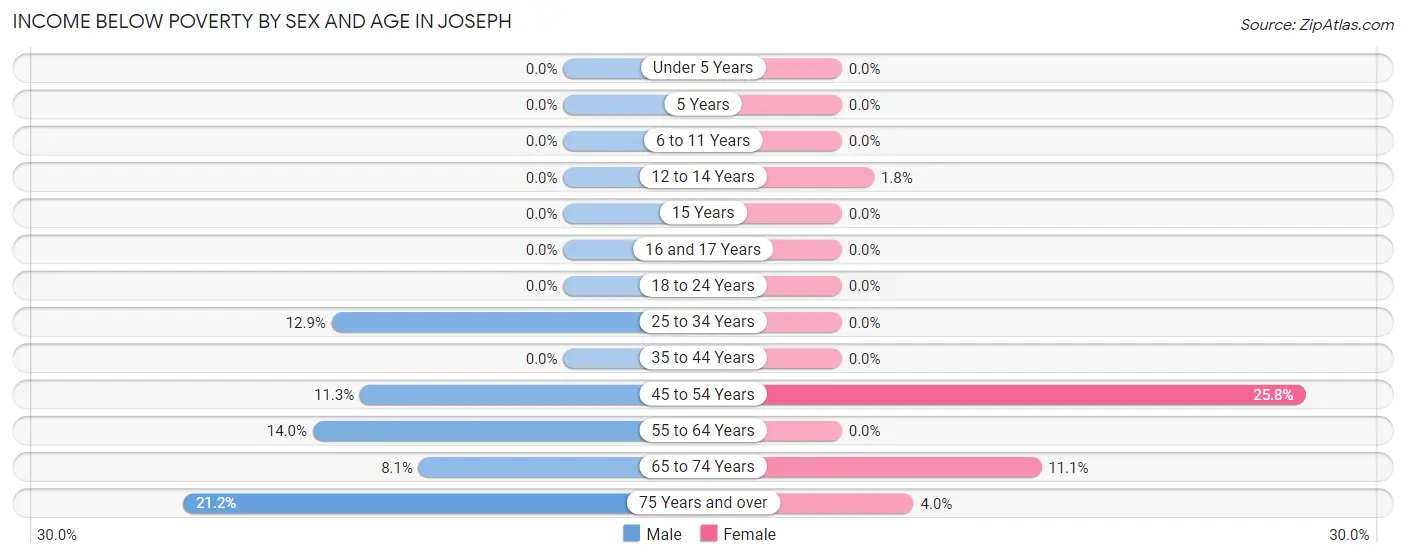
| Age Bracket | Male | Female |
| Under 5 Years | 0 (0.0%) | 0 (0.0%) |
| 5 Years | 0 (0.0%) | 0 (0.0%) |
| 6 to 11 Years | 0 (0.0%) | 0 (0.0%) |
| 12 to 14 Years | 0 (0.0%) | 1 (1.8%) |
| 15 Years | 0 (0.0%) | 0 (0.0%) |
| 16 and 17 Years | 0 (0.0%) | 0 (0.0%) |
| 18 to 24 Years | 0 (0.0%) | 0 (0.0%) |
| 25 to 34 Years | 4 (12.9%) | 0 (0.0%) |
| 35 to 44 Years | 0 (0.0%) | 0 (0.0%) |
| 45 to 54 Years | 6 (11.3%) | 8 (25.8%) |
| 55 to 64 Years | 12 (14.0%) | 0 (0.0%) |
| 65 to 74 Years | 7 (8.1%) | 16 (11.1%) |
| 75 Years and over | 18 (21.2%) | 2 (4.0%) |
| Total | 47 (10.1%) | 27 (4.9%) |
Income Above Poverty by Sex and Age in Joseph
According to the poverty statistics in Joseph, males aged under 5 years and females aged under 5 years are the age groups that are most secure financially, with 100.0% of males and 100.0% of females in these age groups living above the poverty line.
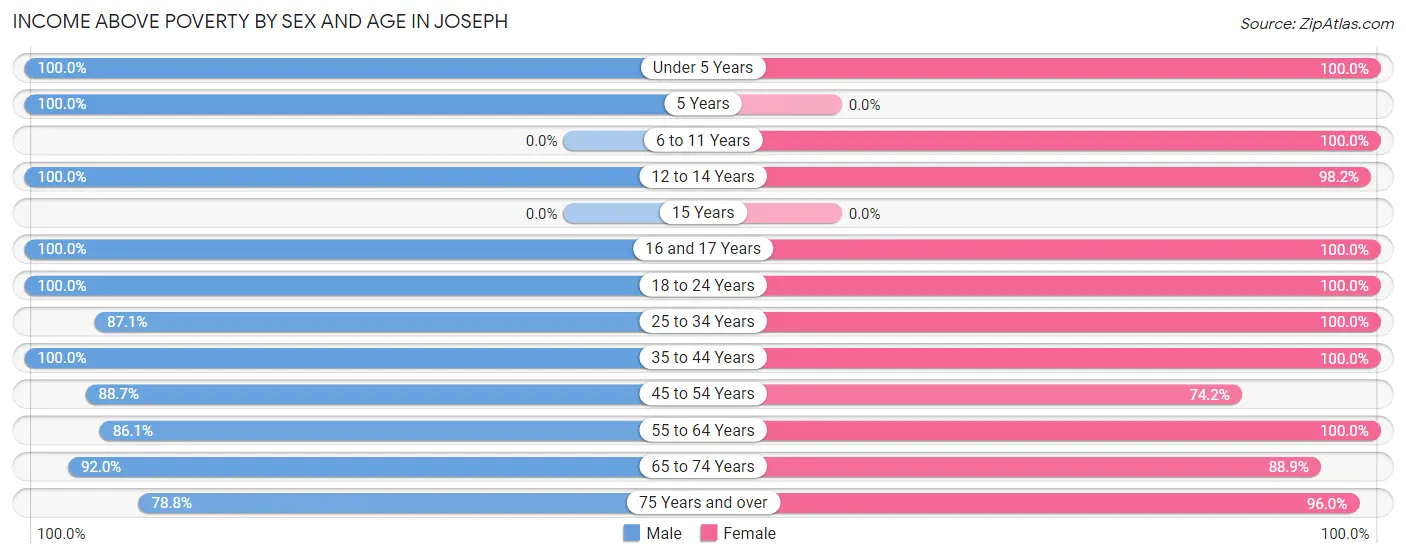
| Age Bracket | Male | Female |
| Under 5 Years | 13 (100.0%) | 20 (100.0%) |
| 5 Years | 6 (100.0%) | 0 (0.0%) |
| 6 to 11 Years | 0 (0.0%) | 23 (100.0%) |
| 12 to 14 Years | 21 (100.0%) | 55 (98.2%) |
| 15 Years | 0 (0.0%) | 0 (0.0%) |
| 16 and 17 Years | 1 (100.0%) | 8 (100.0%) |
| 18 to 24 Years | 6 (100.0%) | 35 (100.0%) |
| 25 to 34 Years | 27 (87.1%) | 14 (100.0%) |
| 35 to 44 Years | 77 (100.0%) | 56 (100.0%) |
| 45 to 54 Years | 47 (88.7%) | 23 (74.2%) |
| 55 to 64 Years | 74 (86.1%) | 113 (100.0%) |
| 65 to 74 Years | 80 (91.9%) | 128 (88.9%) |
| 75 Years and over | 67 (78.8%) | 48 (96.0%) |
| Total | 419 (89.9%) | 523 (95.1%) |
Income Below Poverty Among Married-Couple Families in Joseph
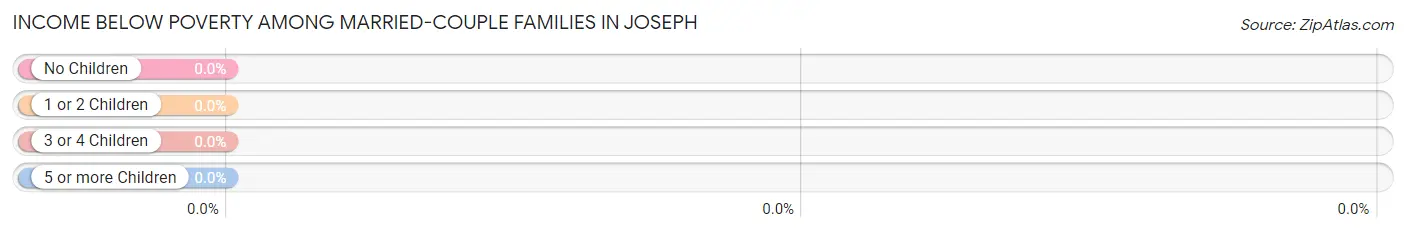
| Children | Above Poverty | Below Poverty |
| No Children | 196 (100.0%) | 0 (0.0%) |
| 1 or 2 Children | 67 (100.0%) | 0 (0.0%) |
| 3 or 4 Children | 0 (0.0%) | 0 (0.0%) |
| 5 or more Children | 0 (0.0%) | 0 (0.0%) |
| Total | 263 (100.0%) | 0 (0.0%) |
Income Below Poverty Among Single-Parent Households in Joseph
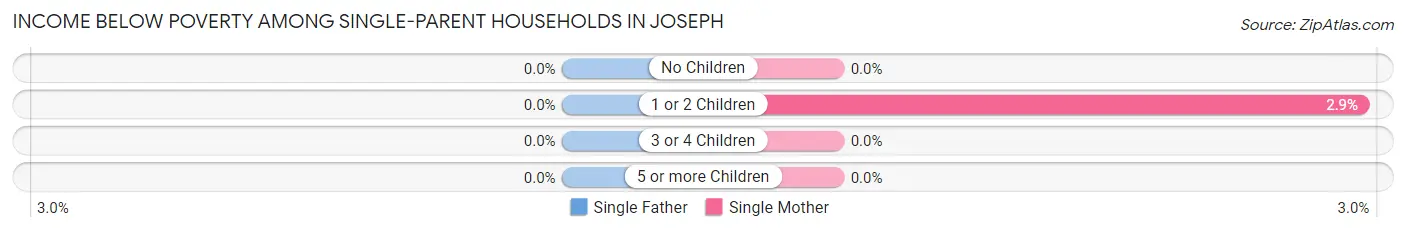
| Children | Single Father | Single Mother |
| No Children | 0 (0.0%) | 0 (0.0%) |
| 1 or 2 Children | 0 (0.0%) | 1 (2.9%) |
| 3 or 4 Children | 0 (0.0%) | 0 (0.0%) |
| 5 or more Children | 0 (0.0%) | 0 (0.0%) |
| Total | 0 (0.0%) | 1 (2.4%) |
Income Below Poverty Among Married-Couple vs Single-Parent Households in Joseph
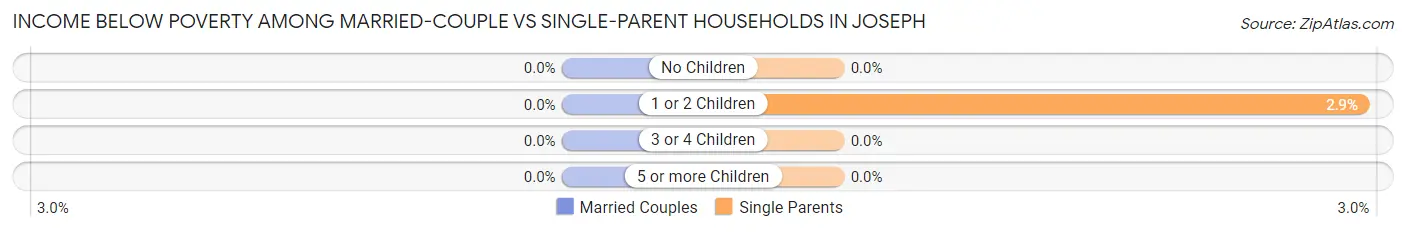
| Children | Married-Couple Families | Single-Parent Households |
| No Children | 0 (0.0%) | 0 (0.0%) |
| 1 or 2 Children | 0 (0.0%) | 1 (2.9%) |
| 3 or 4 Children | 0 (0.0%) | 0 (0.0%) |
| 5 or more Children | 0 (0.0%) | 0 (0.0%) |
| Total | 0 (0.0%) | 1 (2.4%) |
Employment Characteristics in Joseph
Employment by Class of Employer in Joseph
Among the 413 employed individuals in Joseph, private company employees (248 | 60.1%), local government employees (39 | 9.4%), and self-employed (incorporated) (36 | 8.7%) make up the most common classes of employment.
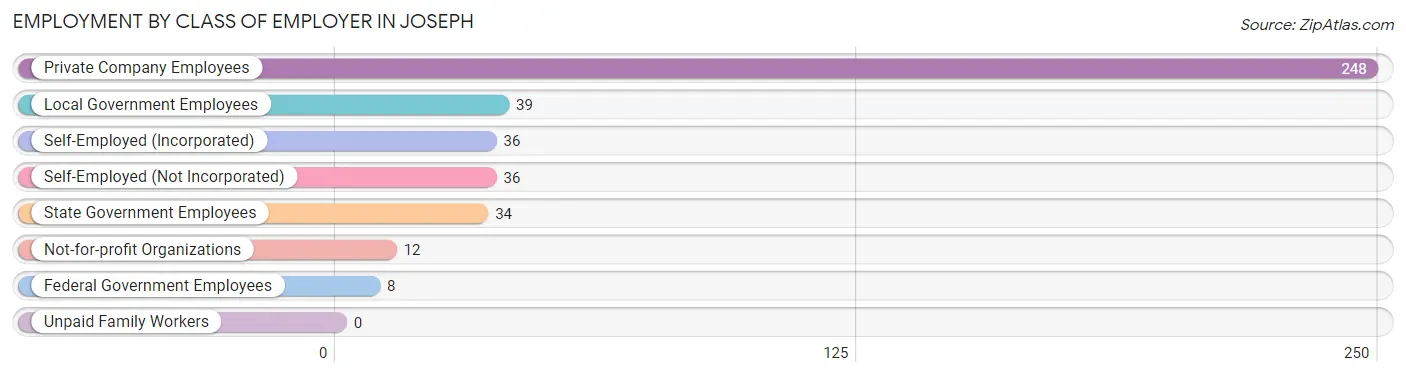
| Employer Class | # Employees | % Employees |
| Private Company Employees | 248 | 60.1% |
| Self-Employed (Incorporated) | 36 | 8.7% |
| Self-Employed (Not Incorporated) | 36 | 8.7% |
| Not-for-profit Organizations | 12 | 2.9% |
| Local Government Employees | 39 | 9.4% |
| State Government Employees | 34 | 8.2% |
| Federal Government Employees | 8 | 1.9% |
| Unpaid Family Workers | 0 | 0.0% |
| Total | 413 | 100.0% |
Employment Status by Age in Joseph
According to the labor force statistics for Joseph, out of the total population over 16 years of age (909), 48.0% or 436 individuals are in the labor force, with 5.3% or 23 of them unemployed. The age group with the highest labor force participation rate is 30 to 34 years, with 100.0% or 36 individuals in the labor force. Within the labor force, the 75 years and over age range has the highest percentage of unemployed individuals, with 38.5% or 5 of them being unemployed.
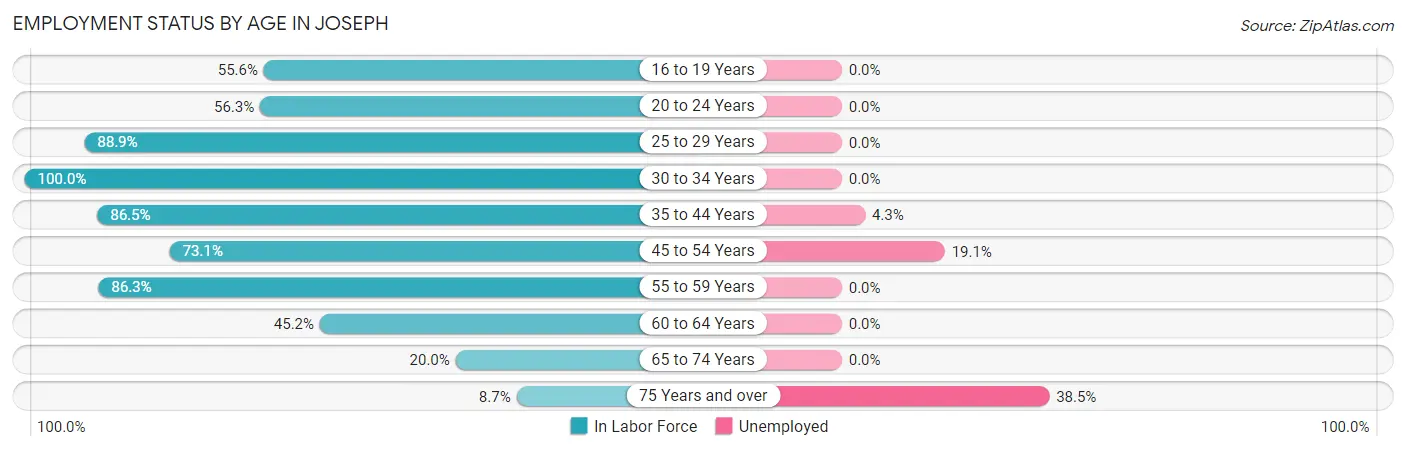
| Age Bracket | In Labor Force | Unemployed |
| 16 to 19 Years | 10 (55.6%) | 0 (0.0%) |
| 20 to 24 Years | 18 (56.3%) | 0 (0.0%) |
| 25 to 29 Years | 8 (88.9%) | 0 (0.0%) |
| 30 to 34 Years | 36 (100.0%) | 0 (0.0%) |
| 35 to 44 Years | 115 (86.5%) | 5 (4.3%) |
| 45 to 54 Years | 68 (73.1%) | 13 (19.1%) |
| 55 to 59 Years | 63 (86.3%) | 0 (0.0%) |
| 60 to 64 Years | 57 (45.2%) | 0 (0.0%) |
| 65 to 74 Years | 48 (20.0%) | 0 (0.0%) |
| 75 Years and over | 13 (8.7%) | 5 (38.5%) |
| Total | 436 (48.0%) | 23 (5.3%) |
Employment Status by Educational Attainment in Joseph
According to labor force statistics for Joseph, 73.8% of individuals (347) out of the total population between 25 and 64 years of age (470) are in the labor force, with 5.2% or 18 of them being unemployed. The group with the highest labor force participation rate are those with the educational attainment of bachelor's degree or higher, with 86.7% or 104 individuals in the labor force. Within the labor force, individuals with college / associate degree education have the highest percentage of unemployment, with 8.1% or 13 of them being unemployed.
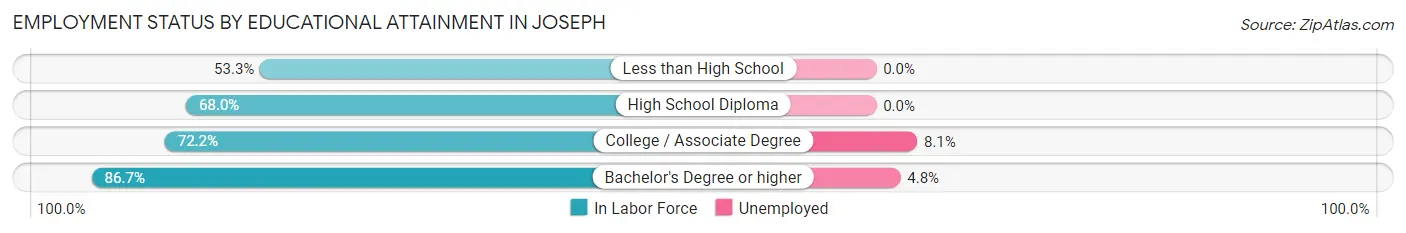
| Educational Attainment | In Labor Force | Unemployed |
| Less than High School | 16 (53.3%) | 0 (0.0%) |
| High School Diploma | 66 (68.0%) | 0 (0.0%) |
| College / Associate Degree | 161 (72.2%) | 18 (8.1%) |
| Bachelor's Degree or higher | 104 (86.7%) | 6 (4.8%) |
| Total | 347 (73.8%) | 24 (5.2%) |
Employment Occupations by Sex in Joseph
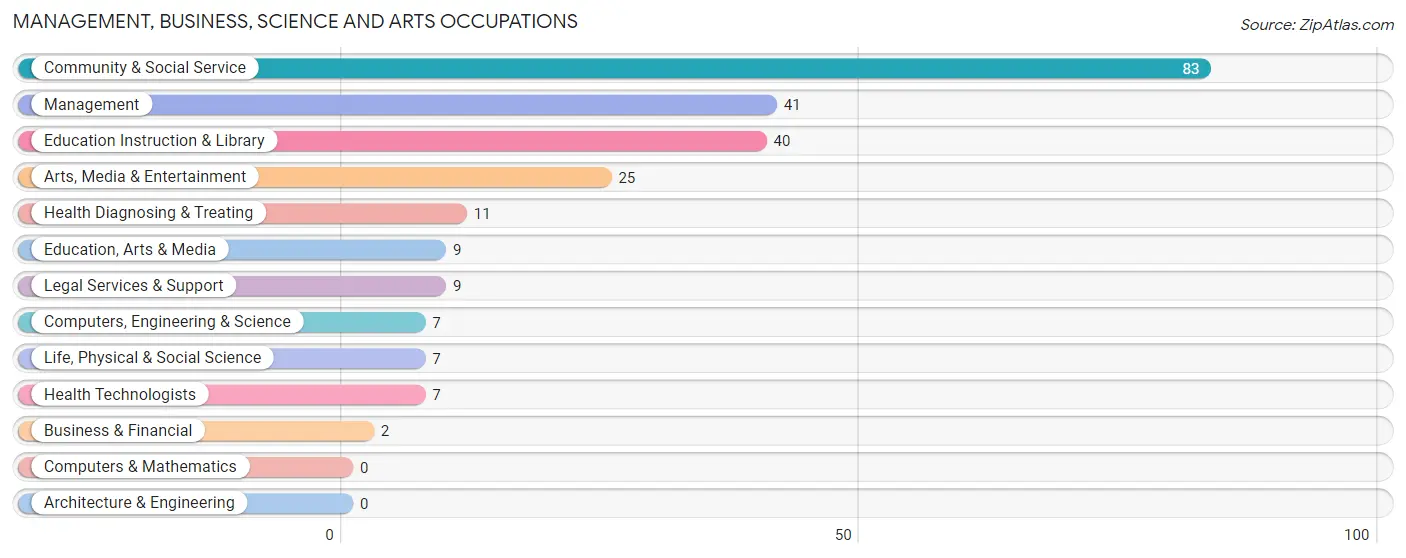
Management, Business, Science and Arts Occupations
The most common Management, Business, Science and Arts occupations in Joseph are Community & Social Service (83 | 20.1%), Management (41 | 9.9%), Education Instruction & Library (40 | 9.7%), Arts, Media & Entertainment (25 | 6.0%), and Health Diagnosing & Treating (11 | 2.7%).
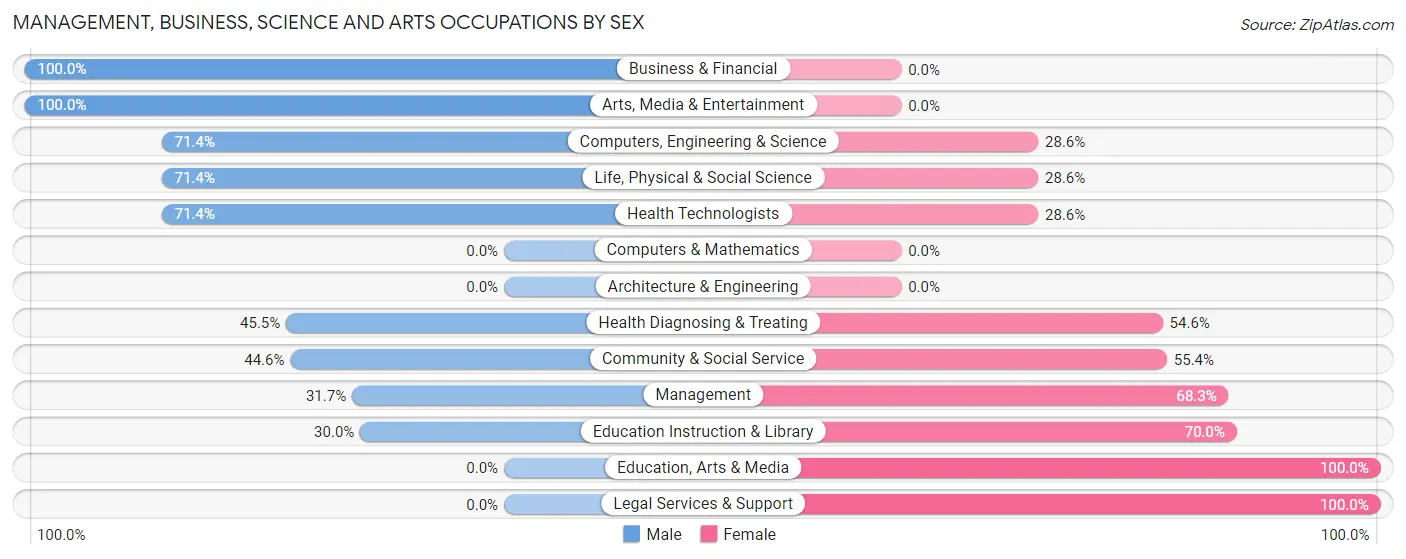
Management, Business, Science and Arts Occupations by Sex
Within the Management, Business, Science and Arts occupations in Joseph, the most male-oriented occupations are Business & Financial (100.0%), Arts, Media & Entertainment (100.0%), and Computers, Engineering & Science (71.4%), while the most female-oriented occupations are Education, Arts & Media (100.0%), Legal Services & Support (100.0%), and Education Instruction & Library (70.0%).
| Occupation | Male | Female |
| Management | 13 (31.7%) | 28 (68.3%) |
| Business & Financial | 2 (100.0%) | 0 (0.0%) |
| Computers, Engineering & Science | 5 (71.4%) | 2 (28.6%) |
| Computers & Mathematics | 0 (0.0%) | 0 (0.0%) |
| Architecture & Engineering | 0 (0.0%) | 0 (0.0%) |
| Life, Physical & Social Science | 5 (71.4%) | 2 (28.6%) |
| Community & Social Service | 37 (44.6%) | 46 (55.4%) |
| Education, Arts & Media | 0 (0.0%) | 9 (100.0%) |
| Legal Services & Support | 0 (0.0%) | 9 (100.0%) |
| Education Instruction & Library | 12 (30.0%) | 28 (70.0%) |
| Arts, Media & Entertainment | 25 (100.0%) | 0 (0.0%) |
| Health Diagnosing & Treating | 5 (45.5%) | 6 (54.5%) |
| Health Technologists | 5 (71.4%) | 2 (28.6%) |
| Total (Category) | 62 (43.1%) | 82 (56.9%) |
| Total (Overall) | 191 (46.3%) | 222 (53.7%) |
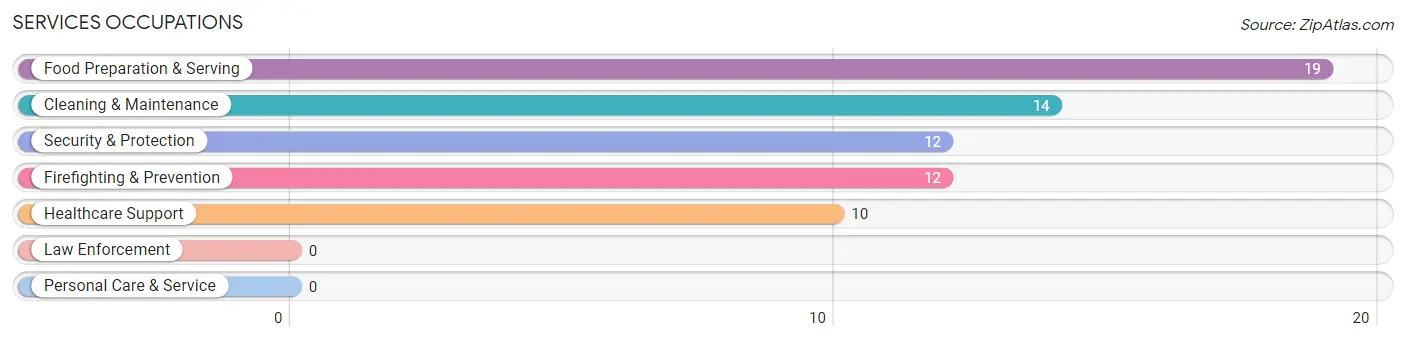
Services Occupations
The most common Services occupations in Joseph are Food Preparation & Serving (19 | 4.6%), Cleaning & Maintenance (14 | 3.4%), Security & Protection (12 | 2.9%), Firefighting & Prevention (12 | 2.9%), and Healthcare Support (10 | 2.4%).
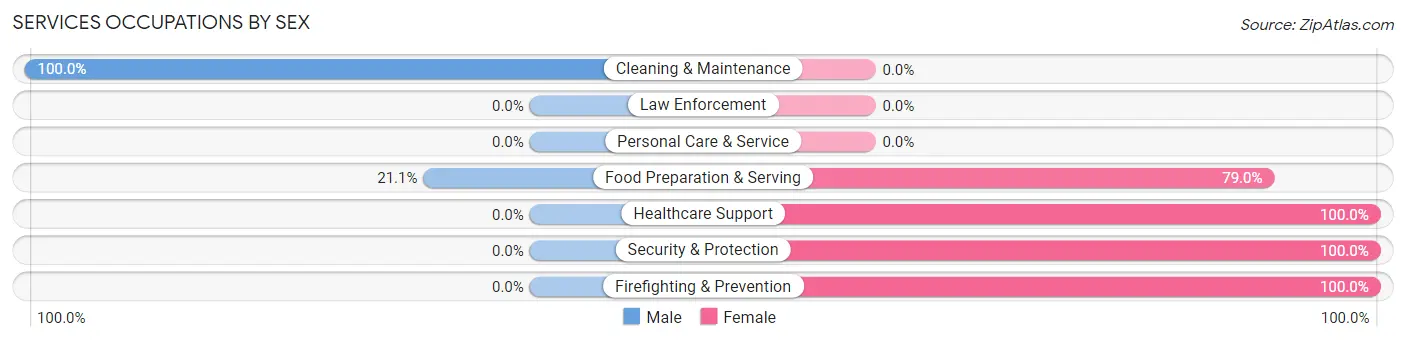
Services Occupations by Sex
Within the Services occupations in Joseph, the most male-oriented occupations are Cleaning & Maintenance (100.0%), and Food Preparation & Serving (21.0%), while the most female-oriented occupations are Healthcare Support (100.0%), Security & Protection (100.0%), and Firefighting & Prevention (100.0%).
| Occupation | Male | Female |
| Healthcare Support | 0 (0.0%) | 10 (100.0%) |
| Security & Protection | 0 (0.0%) | 12 (100.0%) |
| Firefighting & Prevention | 0 (0.0%) | 12 (100.0%) |
| Law Enforcement | 0 (0.0%) | 0 (0.0%) |
| Food Preparation & Serving | 4 (21.0%) | 15 (78.9%) |
| Cleaning & Maintenance | 14 (100.0%) | 0 (0.0%) |
| Personal Care & Service | 0 (0.0%) | 0 (0.0%) |
| Total (Category) | 18 (32.7%) | 37 (67.3%) |
| Total (Overall) | 191 (46.3%) | 222 (53.7%) |
Sales and Office Occupations
The most common Sales and Office occupations in Joseph are Office & Administration (86 | 20.8%), and Sales & Related (30 | 7.3%).
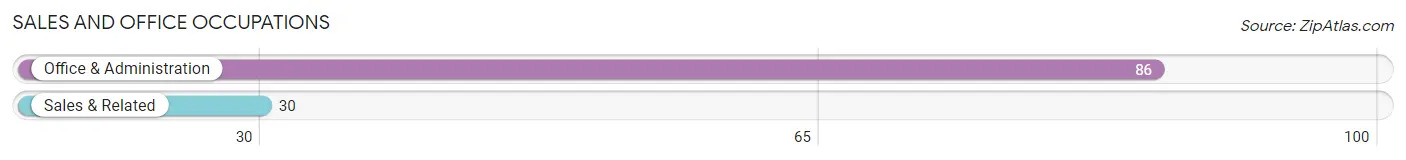
Sales and Office Occupations by Sex
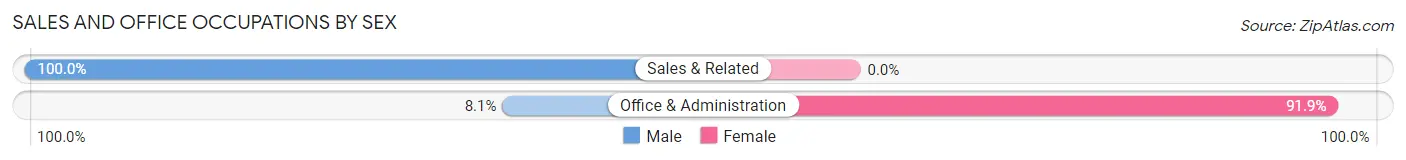
| Occupation | Male | Female |
| Sales & Related | 30 (100.0%) | 0 (0.0%) |
| Office & Administration | 7 (8.1%) | 79 (91.9%) |
| Total (Category) | 37 (31.9%) | 79 (68.1%) |
| Total (Overall) | 191 (46.3%) | 222 (53.7%) |
Natural Resources, Construction and Maintenance Occupations
The most common Natural Resources, Construction and Maintenance occupations in Joseph are Farming, Fishing & Forestry (35 | 8.5%), and Installation, Maintenance & Repair (8 | 1.9%).
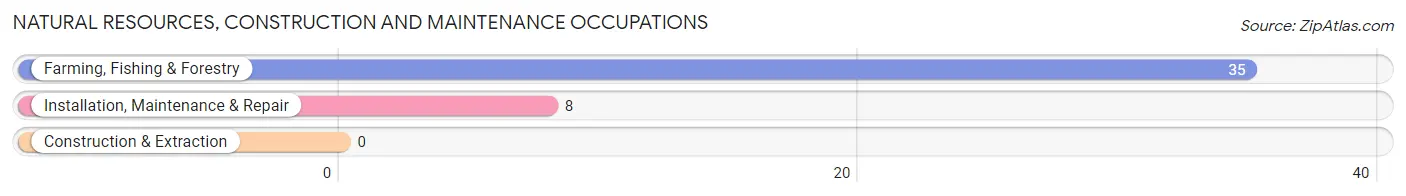
Natural Resources, Construction and Maintenance Occupations by Sex
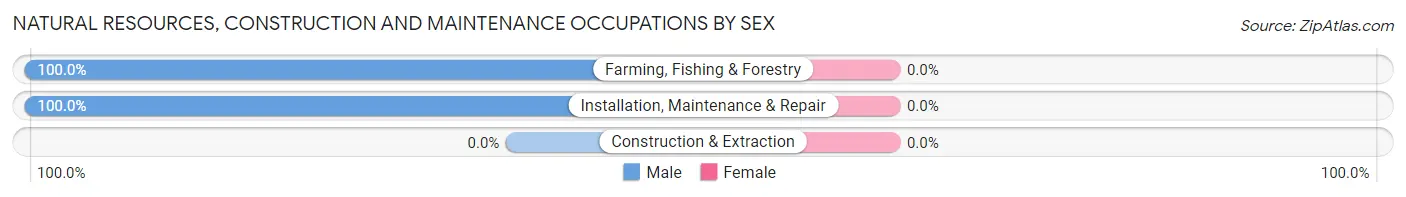
| Occupation | Male | Female |
| Farming, Fishing & Forestry | 35 (100.0%) | 0 (0.0%) |
| Construction & Extraction | 0 (0.0%) | 0 (0.0%) |
| Installation, Maintenance & Repair | 8 (100.0%) | 0 (0.0%) |
| Total (Category) | 43 (100.0%) | 0 (0.0%) |
| Total (Overall) | 191 (46.3%) | 222 (53.7%) |
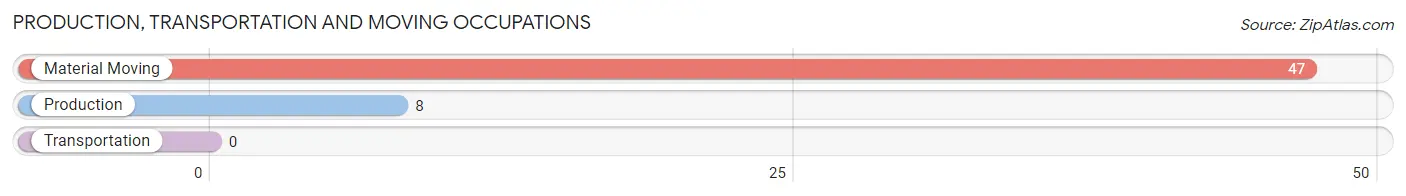
Production, Transportation and Moving Occupations
The most common Production, Transportation and Moving occupations in Joseph are Material Moving (47 | 11.4%), and Production (8 | 1.9%).
Production, Transportation and Moving Occupations by Sex
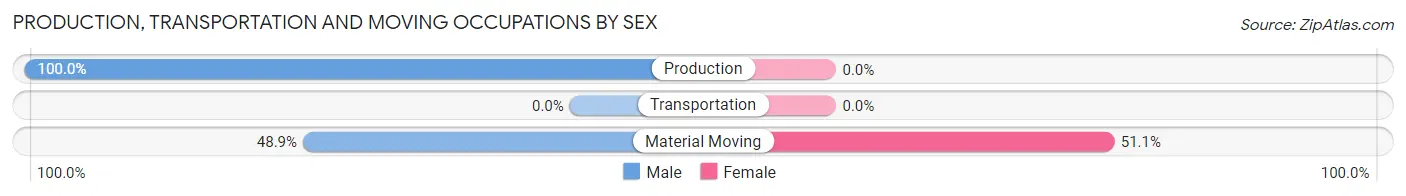
| Occupation | Male | Female |
| Production | 8 (100.0%) | 0 (0.0%) |
| Transportation | 0 (0.0%) | 0 (0.0%) |
| Material Moving | 23 (48.9%) | 24 (51.1%) |
| Total (Category) | 31 (56.4%) | 24 (43.6%) |
| Total (Overall) | 191 (46.3%) | 222 (53.7%) |
Employment Industries by Sex in Joseph
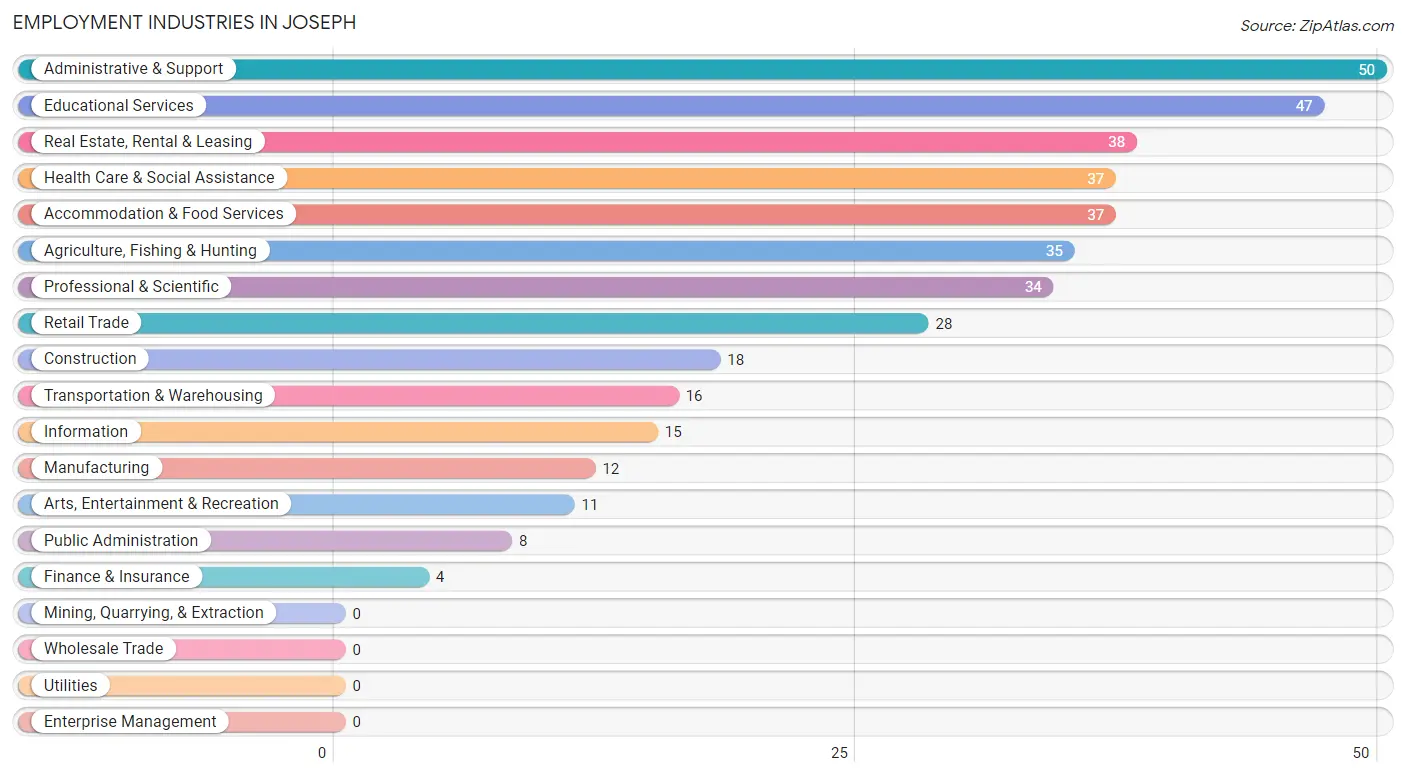
Employment Industries in Joseph
The major employment industries in Joseph include Administrative & Support (50 | 12.1%), Educational Services (47 | 11.4%), Real Estate, Rental & Leasing (38 | 9.2%), Health Care & Social Assistance (37 | 9.0%), and Accommodation & Food Services (37 | 9.0%).
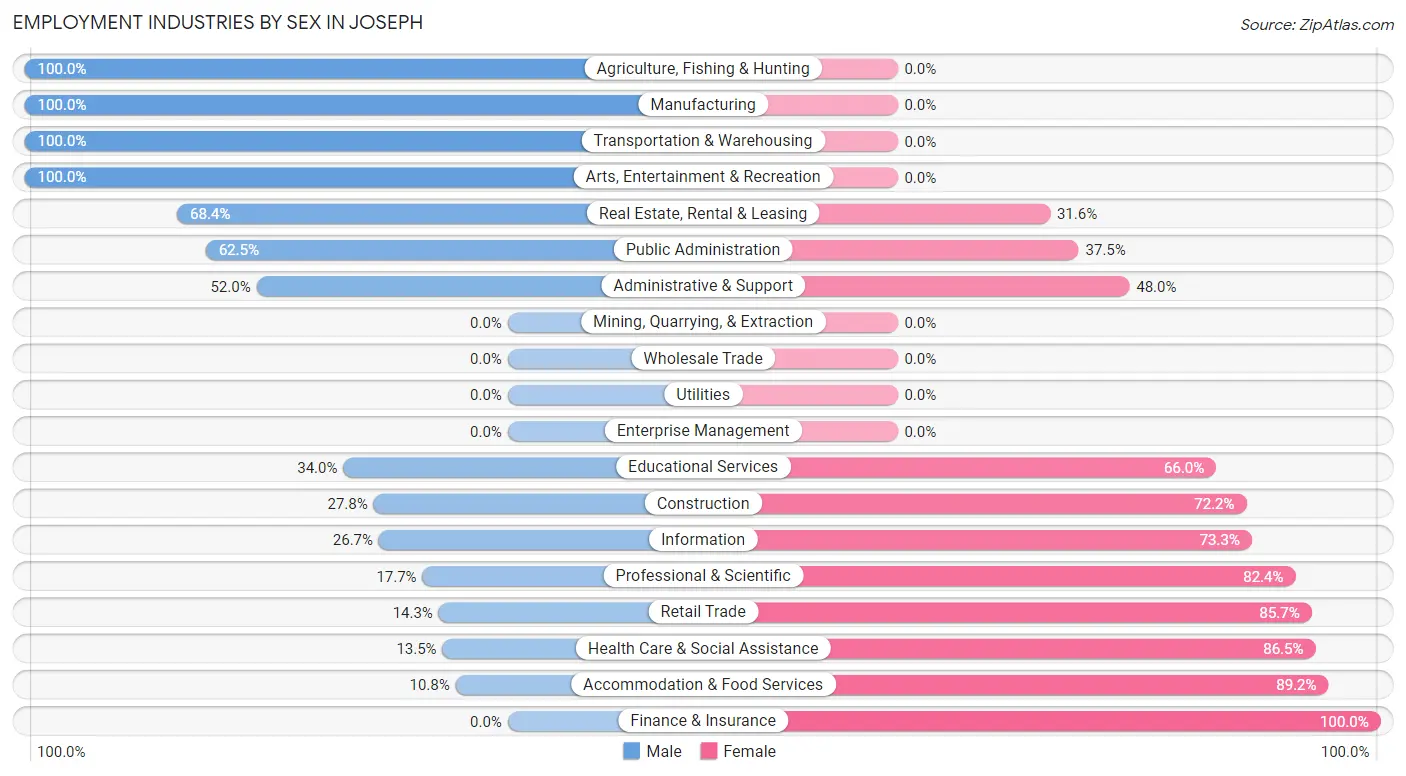
Employment Industries by Sex in Joseph
The Joseph industries that see more men than women are Agriculture, Fishing & Hunting (100.0%), Manufacturing (100.0%), and Transportation & Warehousing (100.0%), whereas the industries that tend to have a higher number of women are Finance & Insurance (100.0%), Accommodation & Food Services (89.2%), and Health Care & Social Assistance (86.5%).
| Industry | Male | Female |
| Agriculture, Fishing & Hunting | 35 (100.0%) | 0 (0.0%) |
| Mining, Quarrying, & Extraction | 0 (0.0%) | 0 (0.0%) |
| Construction | 5 (27.8%) | 13 (72.2%) |
| Manufacturing | 12 (100.0%) | 0 (0.0%) |
| Wholesale Trade | 0 (0.0%) | 0 (0.0%) |
| Retail Trade | 4 (14.3%) | 24 (85.7%) |
| Transportation & Warehousing | 16 (100.0%) | 0 (0.0%) |
| Utilities | 0 (0.0%) | 0 (0.0%) |
| Information | 4 (26.7%) | 11 (73.3%) |
| Finance & Insurance | 0 (0.0%) | 4 (100.0%) |
| Real Estate, Rental & Leasing | 26 (68.4%) | 12 (31.6%) |
| Professional & Scientific | 6 (17.6%) | 28 (82.4%) |
| Enterprise Management | 0 (0.0%) | 0 (0.0%) |
| Administrative & Support | 26 (52.0%) | 24 (48.0%) |
| Educational Services | 16 (34.0%) | 31 (66.0%) |
| Health Care & Social Assistance | 5 (13.5%) | 32 (86.5%) |
| Arts, Entertainment & Recreation | 11 (100.0%) | 0 (0.0%) |
| Accommodation & Food Services | 4 (10.8%) | 33 (89.2%) |
| Public Administration | 5 (62.5%) | 3 (37.5%) |
| Total | 191 (46.3%) | 222 (53.7%) |
Education in Joseph
School Enrollment in Joseph
The most common levels of schooling among the 137 students in Joseph are middle school (86 | 62.8%), high school (25 | 18.2%), and graduate / professional (19 | 13.9%).
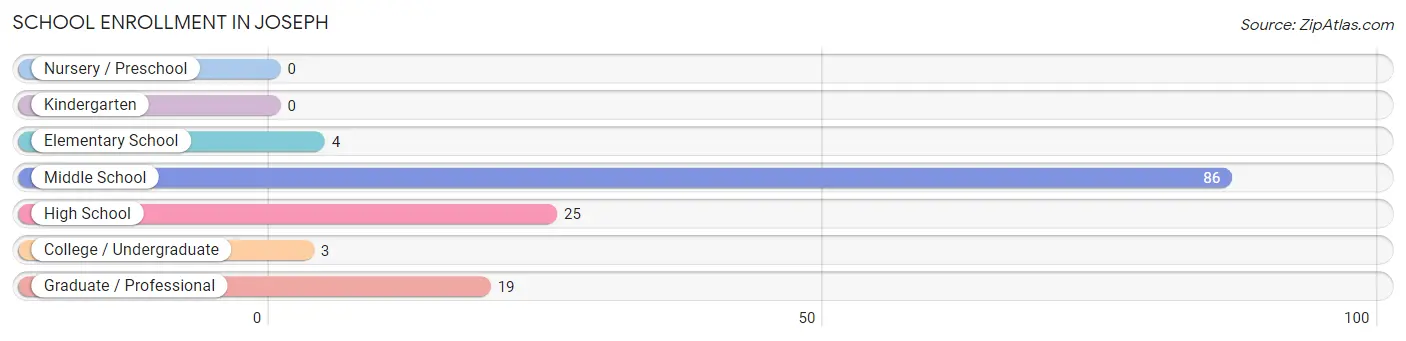
| School Level | # Students | % Students |
| Nursery / Preschool | 0 | 0.0% |
| Kindergarten | 0 | 0.0% |
| Elementary School | 4 | 2.9% |
| Middle School | 86 | 62.8% |
| High School | 25 | 18.2% |
| College / Undergraduate | 3 | 2.2% |
| Graduate / Professional | 19 | 13.9% |
| Total | 137 | 100.0% |
School Enrollment by Age by Funding Source in Joseph
Out of a total of 137 students who are enrolled in schools in Joseph, 55 (40.1%) attend a private institution, while the remaining 82 (59.9%) are enrolled in public schools. The age group of 10 to 14 year olds has the highest likelihood of being enrolled in private schools, with 46 (47.9% in the age bracket) enrolled. Conversely, the age group of 5 to 9 year old has the lowest likelihood of being enrolled in a private school, with 4 (100.0% in the age bracket) attending a public institution.
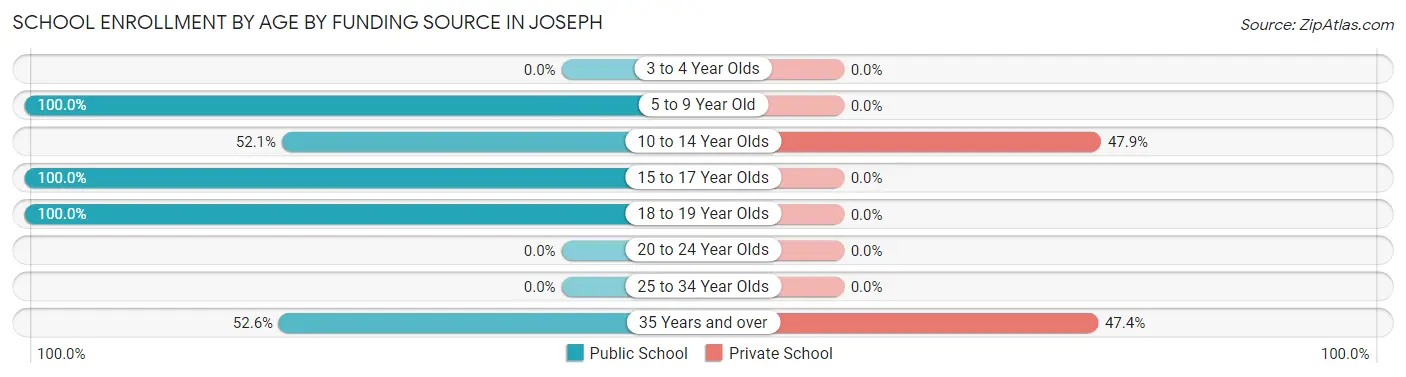
| Age Bracket | Public School | Private School |
| 3 to 4 Year Olds | 0 (0.0%) | 0 (0.0%) |
| 5 to 9 Year Old | 4 (100.0%) | 0 (0.0%) |
| 10 to 14 Year Olds | 50 (52.1%) | 46 (47.9%) |
| 15 to 17 Year Olds | 9 (100.0%) | 0 (0.0%) |
| 18 to 19 Year Olds | 9 (100.0%) | 0 (0.0%) |
| 20 to 24 Year Olds | 0 (0.0%) | 0 (0.0%) |
| 25 to 34 Year Olds | 0 (0.0%) | 0 (0.0%) |
| 35 Years and over | 10 (52.6%) | 9 (47.4%) |
| Total | 82 (59.9%) | 55 (40.1%) |
Educational Attainment by Field of Study in Joseph
Literature & languages (50 | 18.2%), education (41 | 15.0%), bio, nature & agricultural (39 | 14.2%), social sciences (34 | 12.4%), and communications (29 | 10.6%) are the most common fields of study among 274 individuals in Joseph who have obtained a bachelor's degree or higher.
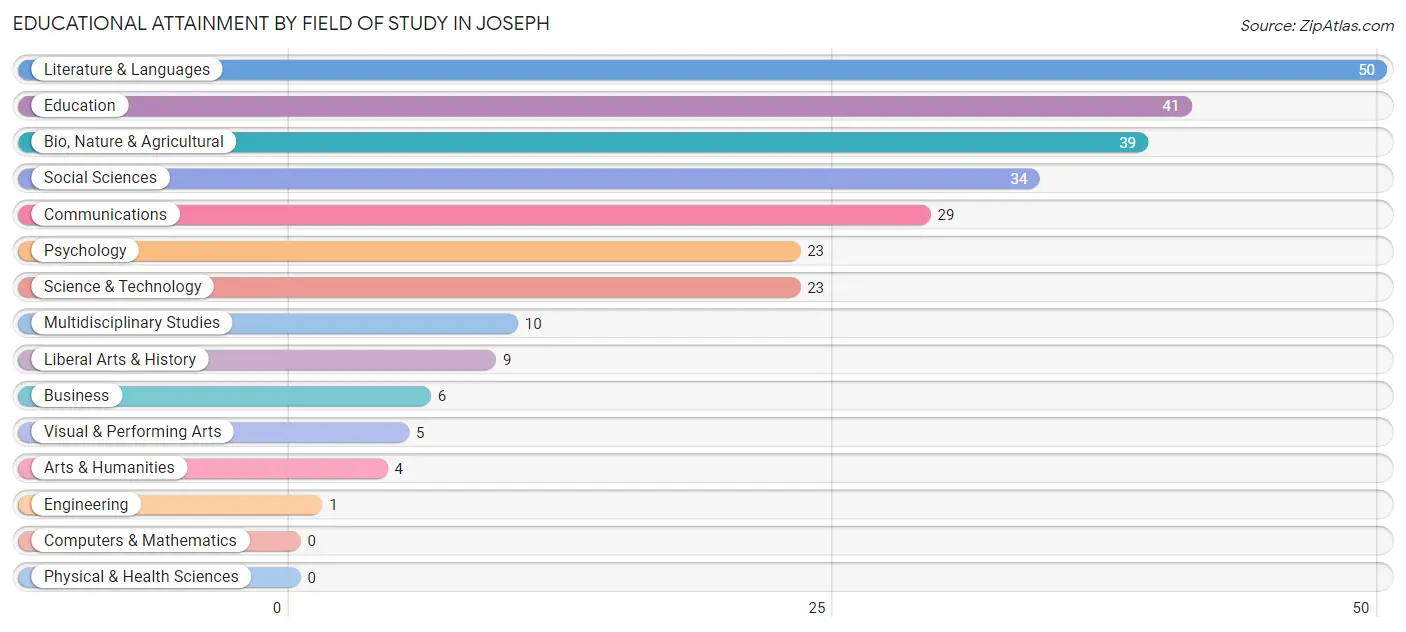
| Field of Study | # Graduates | % Graduates |
| Computers & Mathematics | 0 | 0.0% |
| Bio, Nature & Agricultural | 39 | 14.2% |
| Physical & Health Sciences | 0 | 0.0% |
| Psychology | 23 | 8.4% |
| Social Sciences | 34 | 12.4% |
| Engineering | 1 | 0.4% |
| Multidisciplinary Studies | 10 | 3.6% |
| Science & Technology | 23 | 8.4% |
| Business | 6 | 2.2% |
| Education | 41 | 15.0% |
| Literature & Languages | 50 | 18.2% |
| Liberal Arts & History | 9 | 3.3% |
| Visual & Performing Arts | 5 | 1.8% |
| Communications | 29 | 10.6% |
| Arts & Humanities | 4 | 1.5% |
| Total | 274 | 100.0% |
Transportation & Commute in Joseph
Vehicle Availability by Sex in Joseph
The most prevalent vehicle ownership categories in Joseph are males with 2 vehicles (96, accounting for 51.1%) and females with 2 vehicles (56, making up 43.2%).
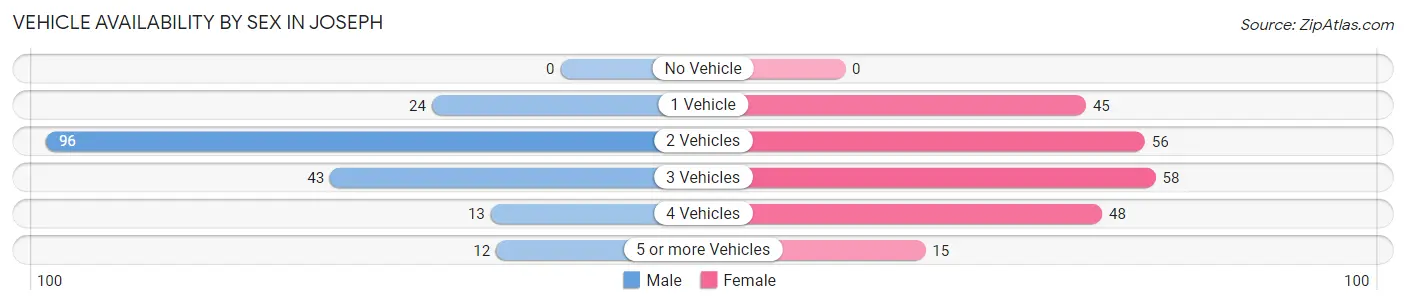
| Vehicles Available | Male | Female |
| No Vehicle | 0 (0.0%) | 0 (0.0%) |
| 1 Vehicle | 24 (12.8%) | 45 (20.3%) |
| 2 Vehicles | 96 (51.1%) | 56 (25.2%) |
| 3 Vehicles | 43 (22.9%) | 58 (26.1%) |
| 4 Vehicles | 13 (6.9%) | 48 (21.6%) |
| 5 or more Vehicles | 12 (6.4%) | 15 (6.8%) |
| Total | 188 (100.0%) | 222 (100.0%) |
Commute Time in Joseph
The most frequently occuring commute durations in Joseph are 10 to 14 minutes (135 commuters, 35.3%), 15 to 19 minutes (101 commuters, 26.4%), and 5 to 9 minutes (70 commuters, 18.3%).
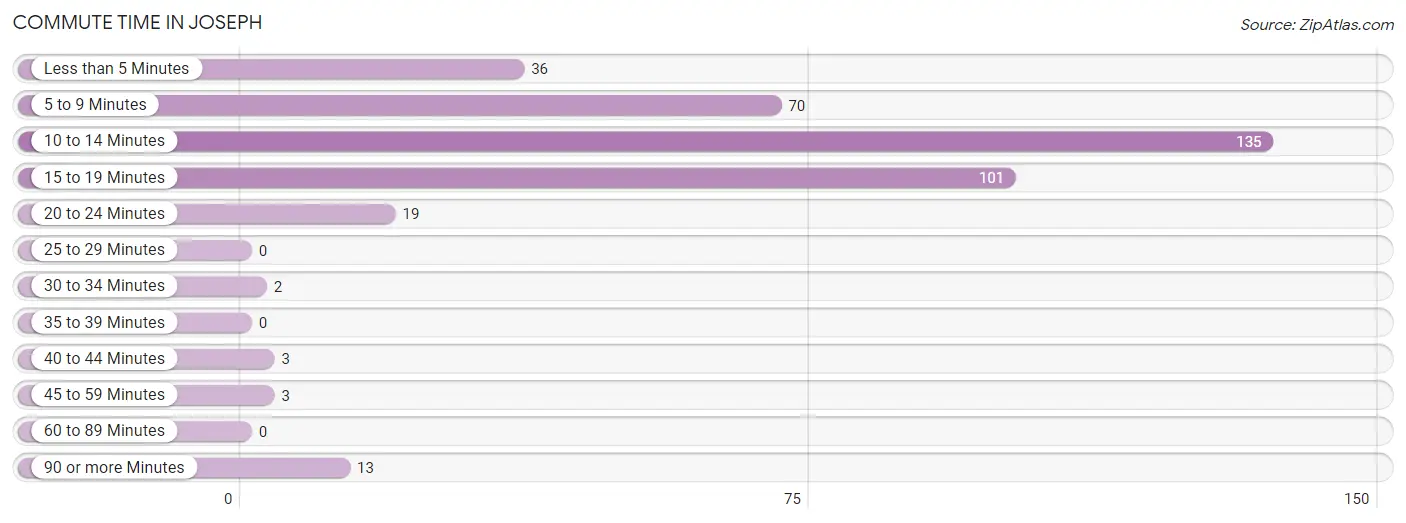
| Commute Time | # Commuters | % Commuters |
| Less than 5 Minutes | 36 | 9.4% |
| 5 to 9 Minutes | 70 | 18.3% |
| 10 to 14 Minutes | 135 | 35.3% |
| 15 to 19 Minutes | 101 | 26.4% |
| 20 to 24 Minutes | 19 | 5.0% |
| 25 to 29 Minutes | 0 | 0.0% |
| 30 to 34 Minutes | 2 | 0.5% |
| 35 to 39 Minutes | 0 | 0.0% |
| 40 to 44 Minutes | 3 | 0.8% |
| 45 to 59 Minutes | 3 | 0.8% |
| 60 to 89 Minutes | 0 | 0.0% |
| 90 or more Minutes | 13 | 3.4% |
Commute Time by Sex in Joseph
The most common commute times in Joseph are 10 to 14 minutes (84 commuters, 48.3%) for males and 15 to 19 minutes (79 commuters, 38.0%) for females.
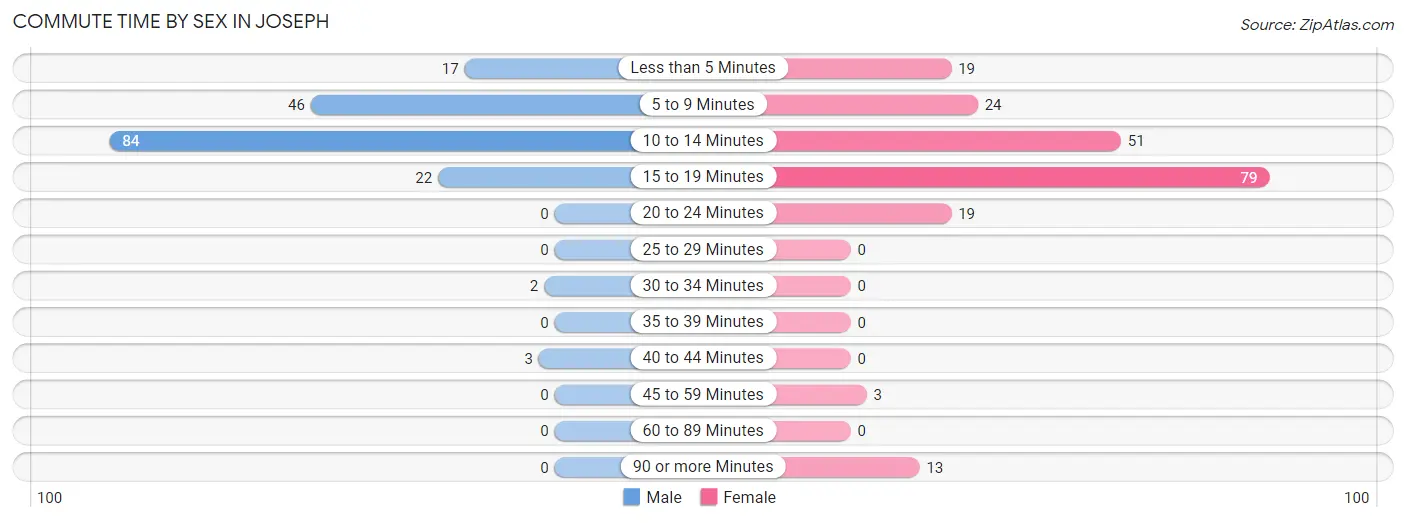
| Commute Time | Male | Female |
| Less than 5 Minutes | 17 (9.8%) | 19 (9.1%) |
| 5 to 9 Minutes | 46 (26.4%) | 24 (11.5%) |
| 10 to 14 Minutes | 84 (48.3%) | 51 (24.5%) |
| 15 to 19 Minutes | 22 (12.6%) | 79 (38.0%) |
| 20 to 24 Minutes | 0 (0.0%) | 19 (9.1%) |
| 25 to 29 Minutes | 0 (0.0%) | 0 (0.0%) |
| 30 to 34 Minutes | 2 (1.1%) | 0 (0.0%) |
| 35 to 39 Minutes | 0 (0.0%) | 0 (0.0%) |
| 40 to 44 Minutes | 3 (1.7%) | 0 (0.0%) |
| 45 to 59 Minutes | 0 (0.0%) | 3 (1.4%) |
| 60 to 89 Minutes | 0 (0.0%) | 0 (0.0%) |
| 90 or more Minutes | 0 (0.0%) | 13 (6.2%) |
Time of Departure to Work by Sex in Joseph
The most frequent times of departure to work in Joseph are 7:30 AM to 7:59 AM (60, 34.5%) for males and 7:30 AM to 7:59 AM (64, 30.8%) for females.
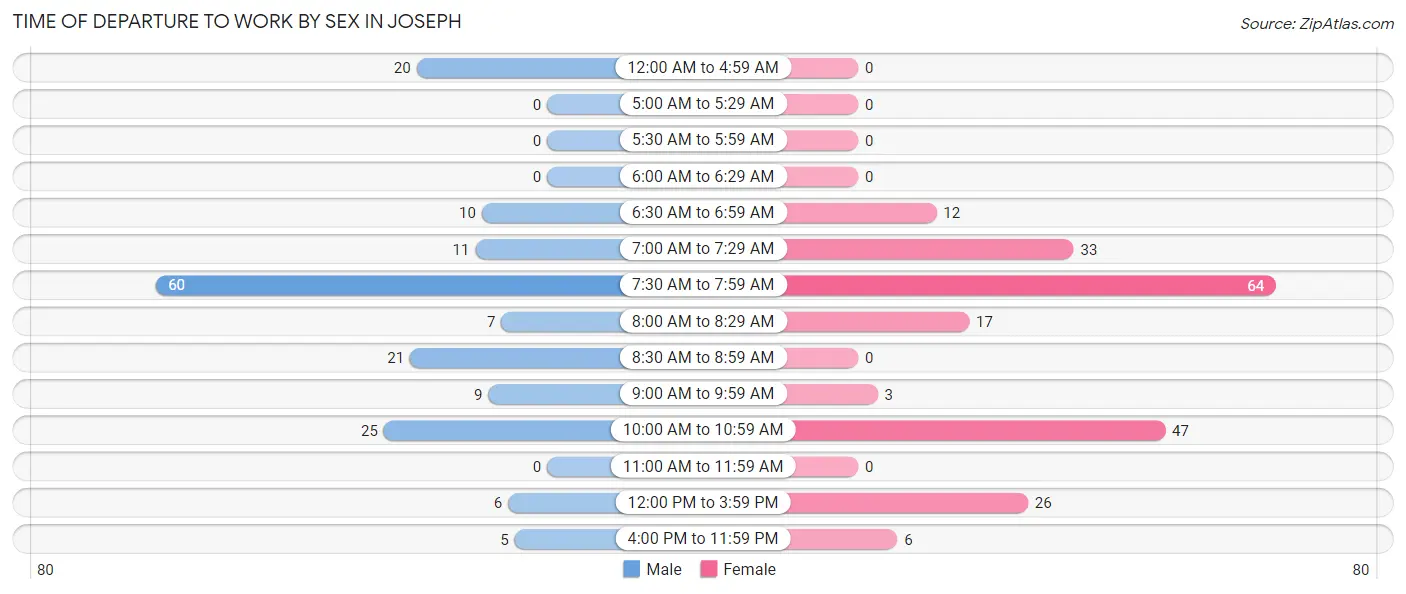
| Time of Departure | Male | Female |
| 12:00 AM to 4:59 AM | 20 (11.5%) | 0 (0.0%) |
| 5:00 AM to 5:29 AM | 0 (0.0%) | 0 (0.0%) |
| 5:30 AM to 5:59 AM | 0 (0.0%) | 0 (0.0%) |
| 6:00 AM to 6:29 AM | 0 (0.0%) | 0 (0.0%) |
| 6:30 AM to 6:59 AM | 10 (5.8%) | 12 (5.8%) |
| 7:00 AM to 7:29 AM | 11 (6.3%) | 33 (15.9%) |
| 7:30 AM to 7:59 AM | 60 (34.5%) | 64 (30.8%) |
| 8:00 AM to 8:29 AM | 7 (4.0%) | 17 (8.2%) |
| 8:30 AM to 8:59 AM | 21 (12.1%) | 0 (0.0%) |
| 9:00 AM to 9:59 AM | 9 (5.2%) | 3 (1.4%) |
| 10:00 AM to 10:59 AM | 25 (14.4%) | 47 (22.6%) |
| 11:00 AM to 11:59 AM | 0 (0.0%) | 0 (0.0%) |
| 12:00 PM to 3:59 PM | 6 (3.5%) | 26 (12.5%) |
| 4:00 PM to 11:59 PM | 5 (2.9%) | 6 (2.9%) |
| Total | 174 (100.0%) | 208 (100.0%) |
Housing Occupancy in Joseph
Occupancy by Ownership in Joseph
Of the total 510 dwellings in Joseph, owner-occupied units account for 359 (70.4%), while renter-occupied units make up 151 (29.6%).
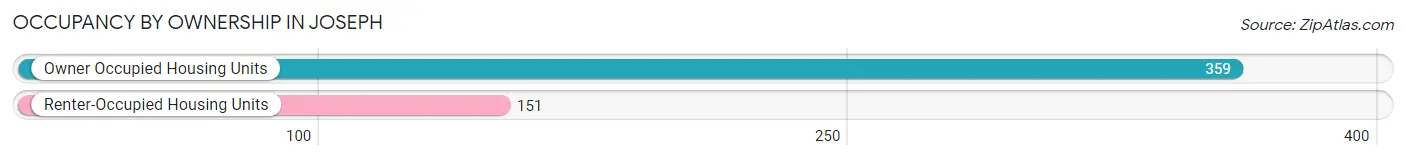
| Occupancy | # Housing Units | % Housing Units |
| Owner Occupied Housing Units | 359 | 70.4% |
| Renter-Occupied Housing Units | 151 | 29.6% |
| Total Occupied Housing Units | 510 | 100.0% |
Occupancy by Household Size in Joseph
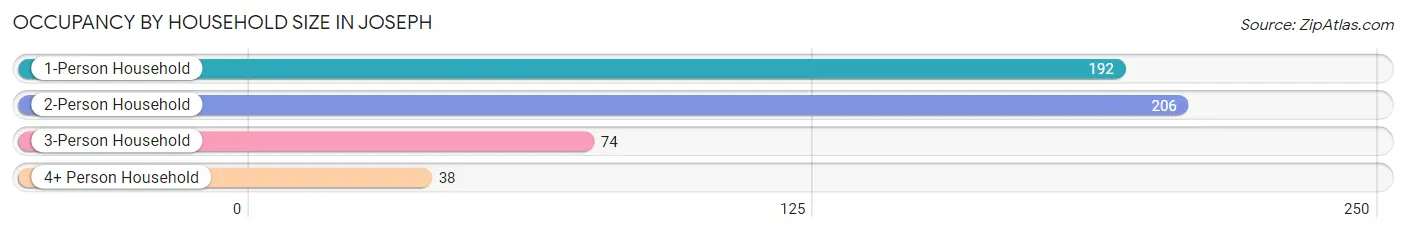
| Household Size | # Housing Units | % Housing Units |
| 1-Person Household | 192 | 37.7% |
| 2-Person Household | 206 | 40.4% |
| 3-Person Household | 74 | 14.5% |
| 4+ Person Household | 38 | 7.4% |
| Total Housing Units | 510 | 100.0% |
Occupancy by Ownership by Household Size in Joseph
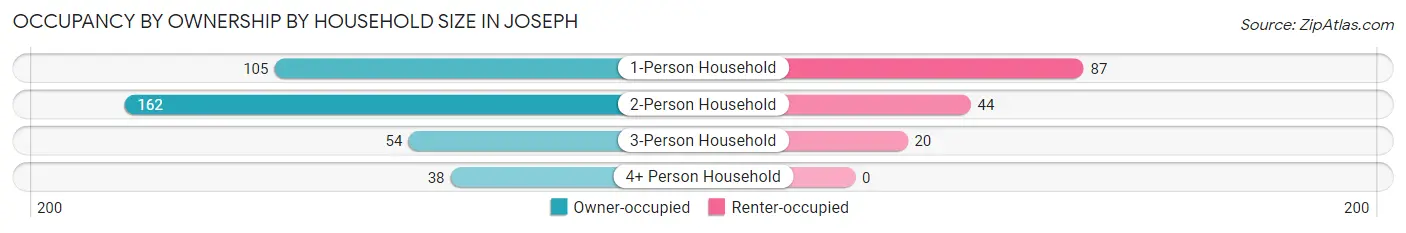
| Household Size | Owner-occupied | Renter-occupied |
| 1-Person Household | 105 (54.7%) | 87 (45.3%) |
| 2-Person Household | 162 (78.6%) | 44 (21.4%) |
| 3-Person Household | 54 (73.0%) | 20 (27.0%) |
| 4+ Person Household | 38 (100.0%) | 0 (0.0%) |
| Total Housing Units | 359 (70.4%) | 151 (29.6%) |
Occupancy by Educational Attainment in Joseph
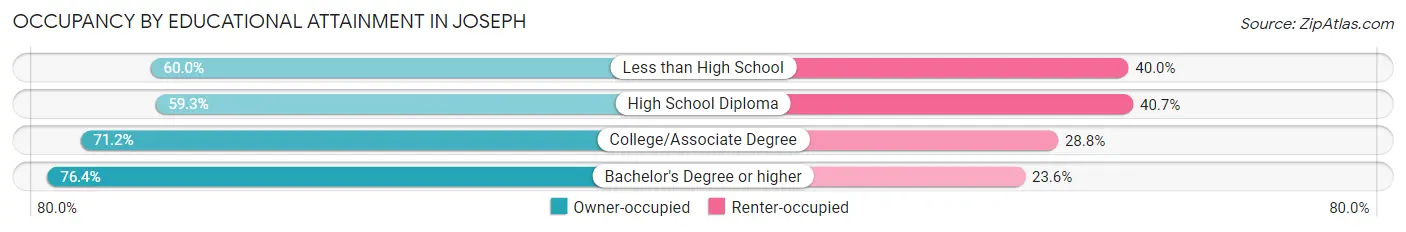
| Household Size | Owner-occupied | Renter-occupied |
| Less than High School | 27 (60.0%) | 18 (40.0%) |
| High School Diploma | 32 (59.3%) | 22 (40.7%) |
| College/Associate Degree | 190 (71.2%) | 77 (28.8%) |
| Bachelor's Degree or higher | 110 (76.4%) | 34 (23.6%) |
Occupancy by Age of Householder in Joseph
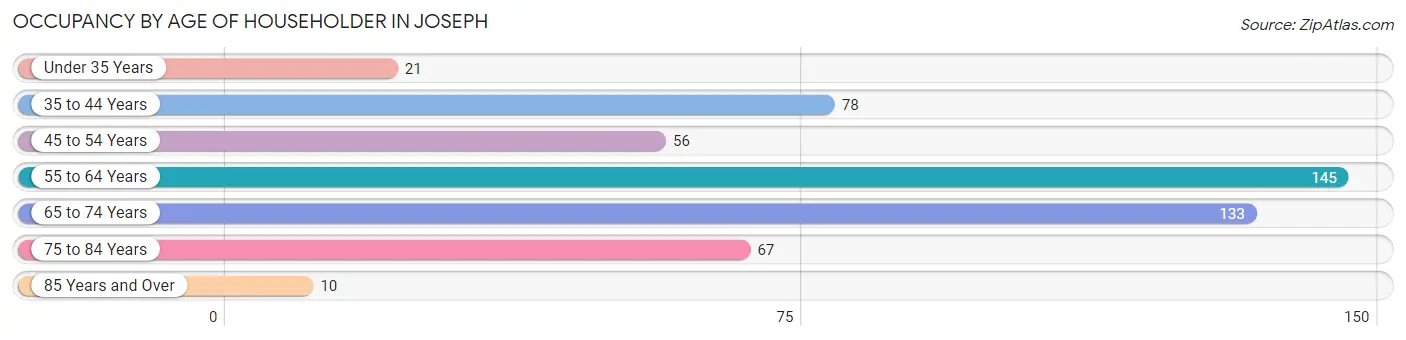
| Age Bracket | # Households | % Households |
| Under 35 Years | 21 | 4.1% |
| 35 to 44 Years | 78 | 15.3% |
| 45 to 54 Years | 56 | 11.0% |
| 55 to 64 Years | 145 | 28.4% |
| 65 to 74 Years | 133 | 26.1% |
| 75 to 84 Years | 67 | 13.1% |
| 85 Years and Over | 10 | 2.0% |
| Total | 510 | 100.0% |
Housing Finances in Joseph
Median Income by Occupancy in Joseph
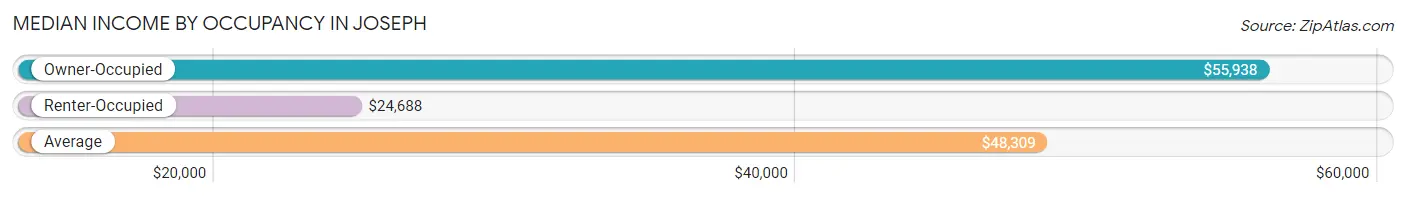
| Occupancy Type | # Households | Median Income |
| Owner-Occupied | 359 (70.4%) | $55,938 |
| Renter-Occupied | 151 (29.6%) | $24,688 |
| Average | 510 (100.0%) | $48,309 |
Occupancy by Householder Income Bracket in Joseph
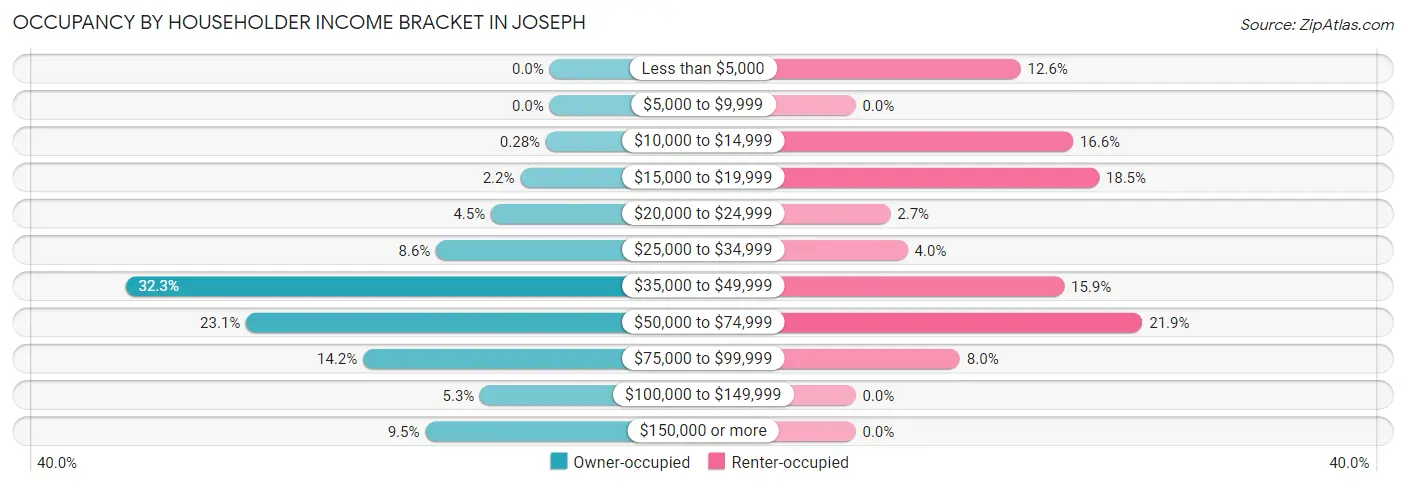
| Income Bracket | Owner-occupied | Renter-occupied |
| Less than $5,000 | 0 (0.0%) | 19 (12.6%) |
| $5,000 to $9,999 | 0 (0.0%) | 0 (0.0%) |
| $10,000 to $14,999 | 1 (0.3%) | 25 (16.6%) |
| $15,000 to $19,999 | 8 (2.2%) | 28 (18.5%) |
| $20,000 to $24,999 | 16 (4.5%) | 4 (2.6%) |
| $25,000 to $34,999 | 31 (8.6%) | 6 (4.0%) |
| $35,000 to $49,999 | 116 (32.3%) | 24 (15.9%) |
| $50,000 to $74,999 | 83 (23.1%) | 33 (21.8%) |
| $75,000 to $99,999 | 51 (14.2%) | 12 (8.0%) |
| $100,000 to $149,999 | 19 (5.3%) | 0 (0.0%) |
| $150,000 or more | 34 (9.5%) | 0 (0.0%) |
| Total | 359 (100.0%) | 151 (100.0%) |
Monthly Housing Cost Tiers in Joseph
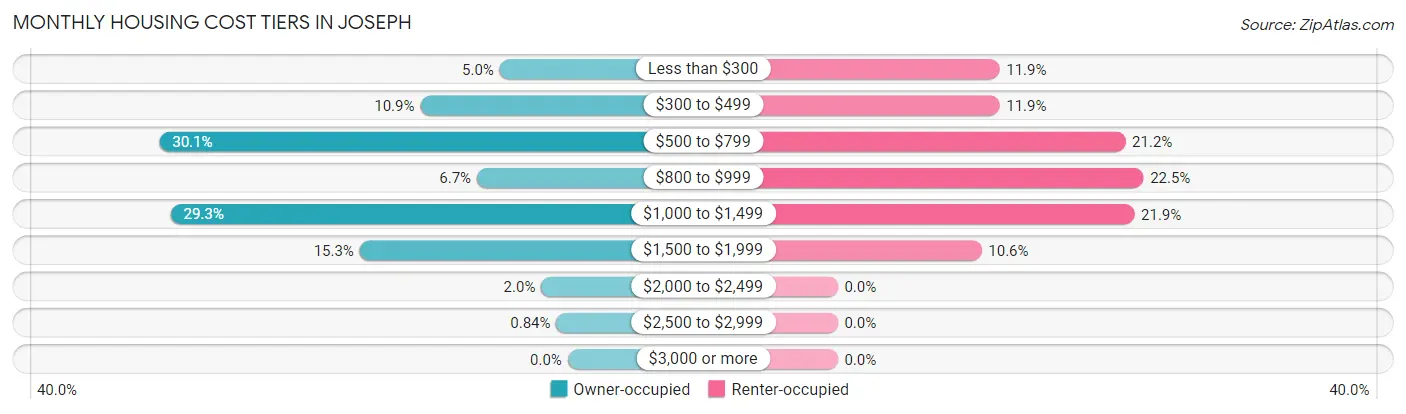
| Monthly Cost | Owner-occupied | Renter-occupied |
| Less than $300 | 18 (5.0%) | 18 (11.9%) |
| $300 to $499 | 39 (10.9%) | 18 (11.9%) |
| $500 to $799 | 108 (30.1%) | 32 (21.2%) |
| $800 to $999 | 24 (6.7%) | 34 (22.5%) |
| $1,000 to $1,499 | 105 (29.2%) | 33 (21.8%) |
| $1,500 to $1,999 | 55 (15.3%) | 16 (10.6%) |
| $2,000 to $2,499 | 7 (1.9%) | 0 (0.0%) |
| $2,500 to $2,999 | 3 (0.8%) | 0 (0.0%) |
| $3,000 or more | 0 (0.0%) | 0 (0.0%) |
| Total | 359 (100.0%) | 151 (100.0%) |
Physical Housing Characteristics in Joseph
Housing Structures in Joseph
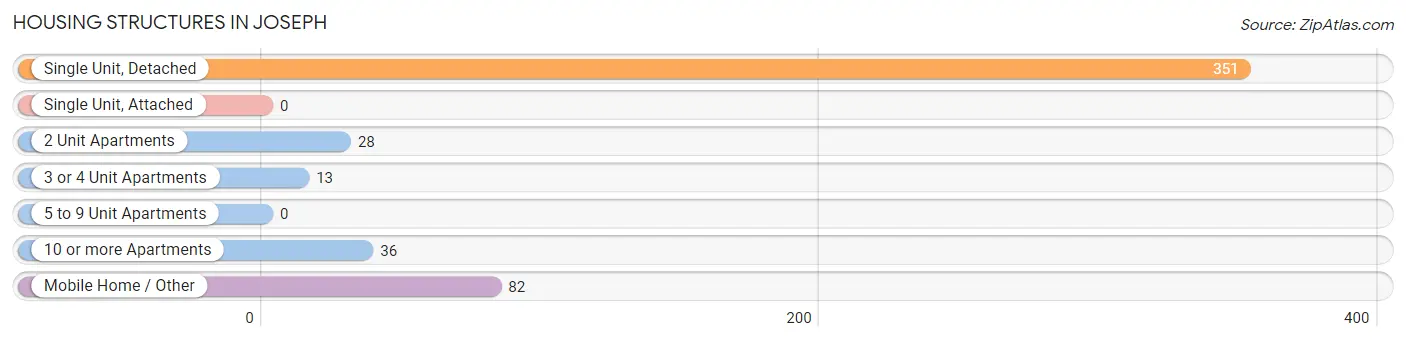
| Structure Type | # Housing Units | % Housing Units |
| Single Unit, Detached | 351 | 68.8% |
| Single Unit, Attached | 0 | 0.0% |
| 2 Unit Apartments | 28 | 5.5% |
| 3 or 4 Unit Apartments | 13 | 2.5% |
| 5 to 9 Unit Apartments | 0 | 0.0% |
| 10 or more Apartments | 36 | 7.1% |
| Mobile Home / Other | 82 | 16.1% |
| Total | 510 | 100.0% |
Housing Structures by Occupancy in Joseph
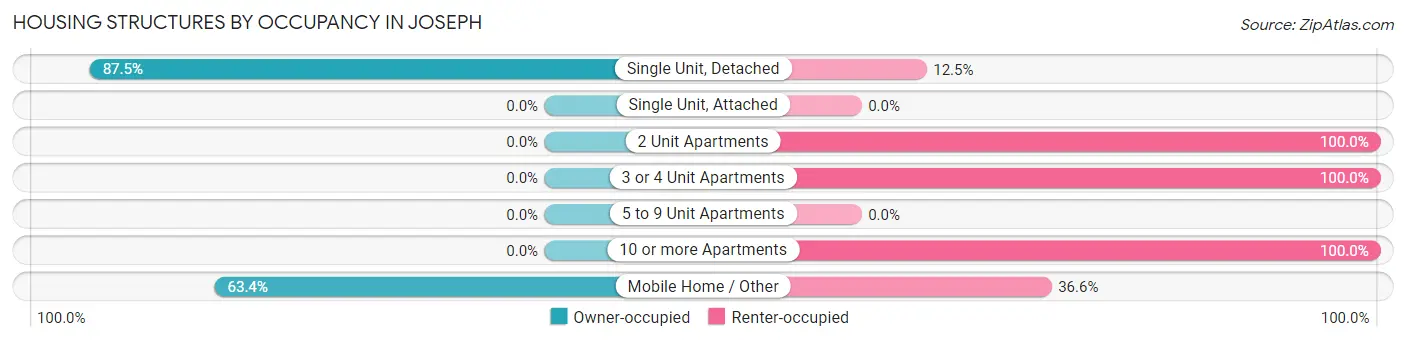
| Structure Type | Owner-occupied | Renter-occupied |
| Single Unit, Detached | 307 (87.5%) | 44 (12.5%) |
| Single Unit, Attached | 0 (0.0%) | 0 (0.0%) |
| 2 Unit Apartments | 0 (0.0%) | 28 (100.0%) |
| 3 or 4 Unit Apartments | 0 (0.0%) | 13 (100.0%) |
| 5 to 9 Unit Apartments | 0 (0.0%) | 0 (0.0%) |
| 10 or more Apartments | 0 (0.0%) | 36 (100.0%) |
| Mobile Home / Other | 52 (63.4%) | 30 (36.6%) |
| Total | 359 (70.4%) | 151 (29.6%) |
Housing Structures by Number of Rooms in Joseph
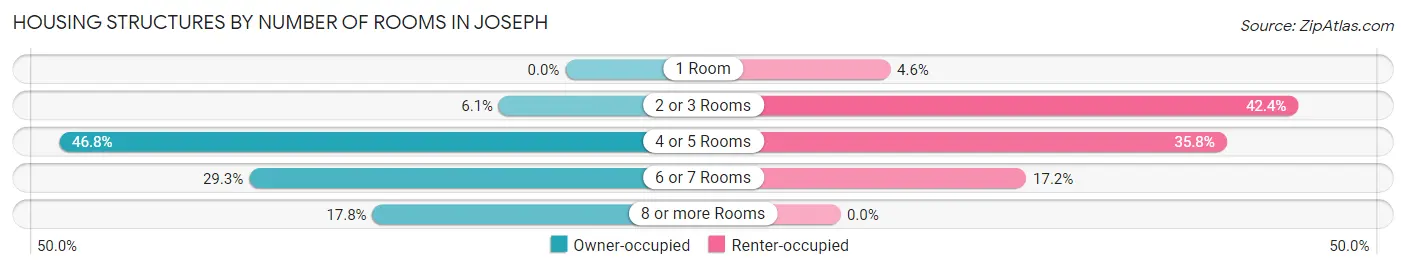
| Number of Rooms | Owner-occupied | Renter-occupied |
| 1 Room | 0 (0.0%) | 7 (4.6%) |
| 2 or 3 Rooms | 22 (6.1%) | 64 (42.4%) |
| 4 or 5 Rooms | 168 (46.8%) | 54 (35.8%) |
| 6 or 7 Rooms | 105 (29.2%) | 26 (17.2%) |
| 8 or more Rooms | 64 (17.8%) | 0 (0.0%) |
| Total | 359 (100.0%) | 151 (100.0%) |
Housing Structure by Heating Type in Joseph
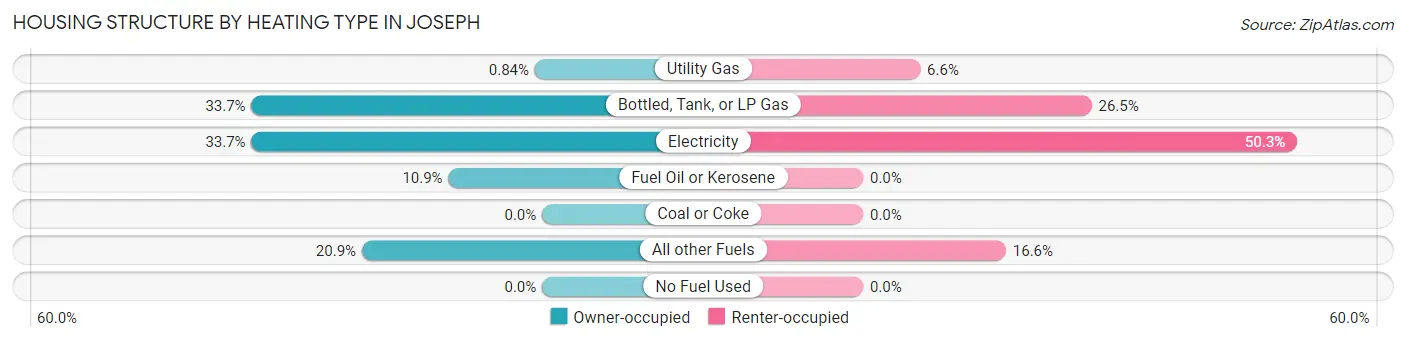
| Heating Type | Owner-occupied | Renter-occupied |
| Utility Gas | 3 (0.8%) | 10 (6.6%) |
| Bottled, Tank, or LP Gas | 121 (33.7%) | 40 (26.5%) |
| Electricity | 121 (33.7%) | 76 (50.3%) |
| Fuel Oil or Kerosene | 39 (10.9%) | 0 (0.0%) |
| Coal or Coke | 0 (0.0%) | 0 (0.0%) |
| All other Fuels | 75 (20.9%) | 25 (16.6%) |
| No Fuel Used | 0 (0.0%) | 0 (0.0%) |
| Total | 359 (100.0%) | 151 (100.0%) |
Household Vehicle Usage in Joseph
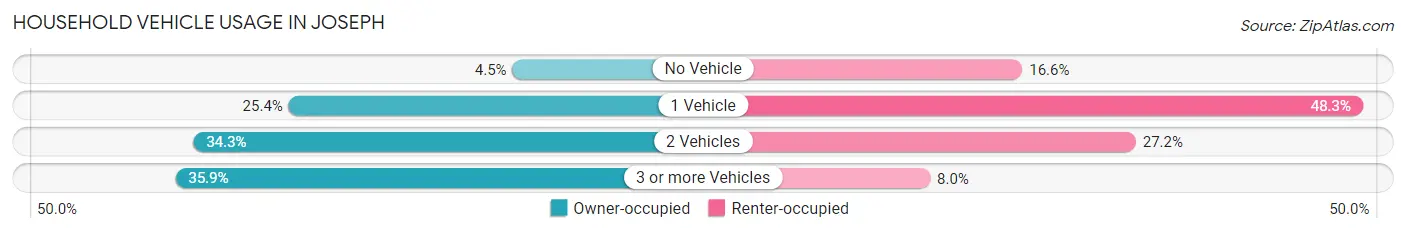
| Vehicles per Household | Owner-occupied | Renter-occupied |
| No Vehicle | 16 (4.5%) | 25 (16.6%) |
| 1 Vehicle | 91 (25.4%) | 73 (48.3%) |
| 2 Vehicles | 123 (34.3%) | 41 (27.2%) |
| 3 or more Vehicles | 129 (35.9%) | 12 (8.0%) |
| Total | 359 (100.0%) | 151 (100.0%) |
Real Estate & Mortgages in Joseph
Real Estate and Mortgage Overview in Joseph
| Characteristic | Without Mortgage | With Mortgage |
| Housing Units | 188 | 171 |
| Median Property Value | $319,600 | $288,600 |
| Median Household Income | $58,333 | $18 |
| Monthly Housing Costs | $593 | $0 |
| Real Estate Taxes | $2,493 | $6 |
Property Value by Mortgage Status in Joseph
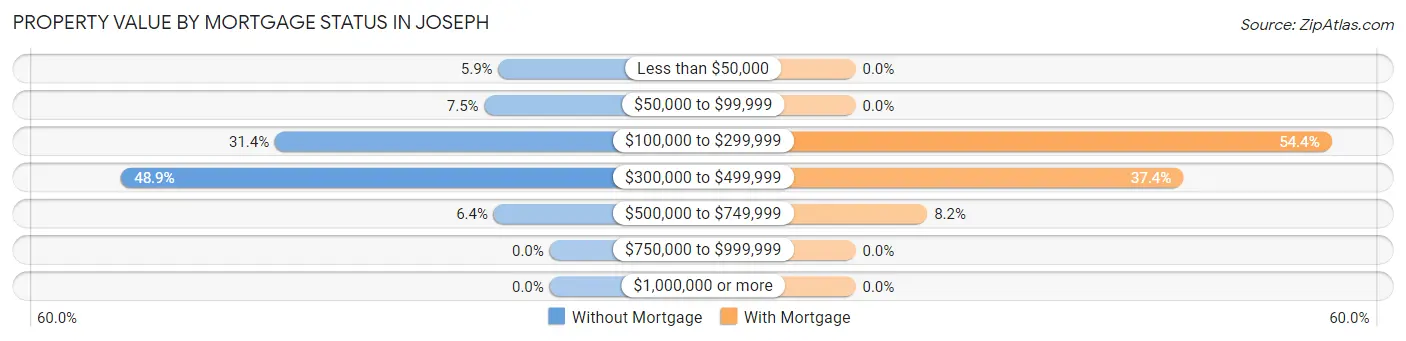
| Property Value | Without Mortgage | With Mortgage |
| Less than $50,000 | 11 (5.9%) | 0 (0.0%) |
| $50,000 to $99,999 | 14 (7.4%) | 0 (0.0%) |
| $100,000 to $299,999 | 59 (31.4%) | 93 (54.4%) |
| $300,000 to $499,999 | 92 (48.9%) | 64 (37.4%) |
| $500,000 to $749,999 | 12 (6.4%) | 14 (8.2%) |
| $750,000 to $999,999 | 0 (0.0%) | 0 (0.0%) |
| $1,000,000 or more | 0 (0.0%) | 0 (0.0%) |
| Total | 188 (100.0%) | 171 (100.0%) |
Household Income by Mortgage Status in Joseph
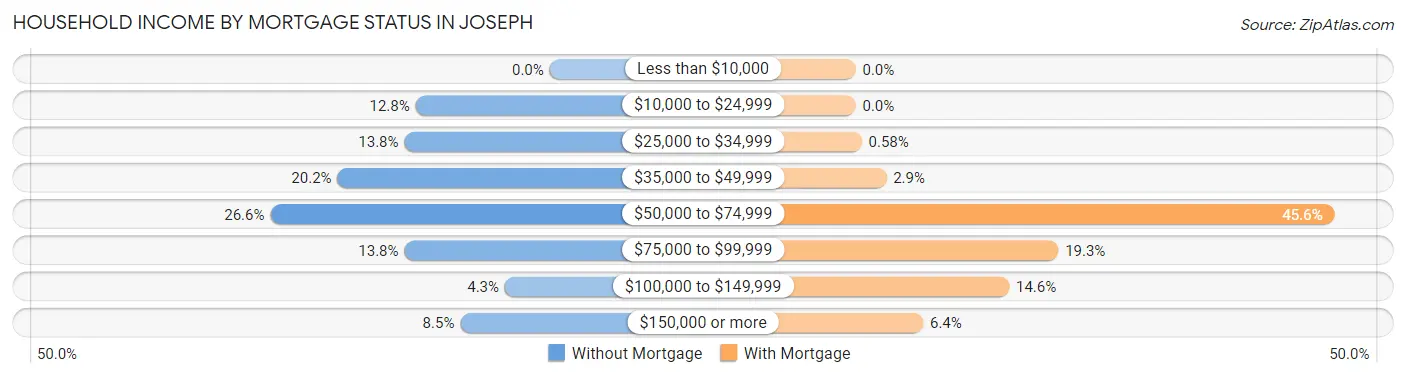
| Household Income | Without Mortgage | With Mortgage |
| Less than $10,000 | 0 (0.0%) | 0 (0.0%) |
| $10,000 to $24,999 | 24 (12.8%) | 0 (0.0%) |
| $25,000 to $34,999 | 26 (13.8%) | 1 (0.6%) |
| $35,000 to $49,999 | 38 (20.2%) | 5 (2.9%) |
| $50,000 to $74,999 | 50 (26.6%) | 78 (45.6%) |
| $75,000 to $99,999 | 26 (13.8%) | 33 (19.3%) |
| $100,000 to $149,999 | 8 (4.3%) | 25 (14.6%) |
| $150,000 or more | 16 (8.5%) | 11 (6.4%) |
| Total | 188 (100.0%) | 171 (100.0%) |
Property Value to Household Income Ratio in Joseph
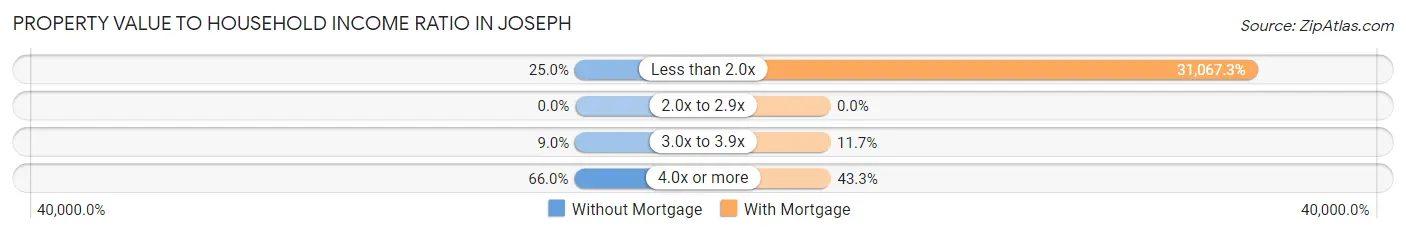
| Value-to-Income Ratio | Without Mortgage | With Mortgage |
| Less than 2.0x | 47 (25.0%) | 53,125 (31,067.3%) |
| 2.0x to 2.9x | 0 (0.0%) | 0 (0.0%) |
| 3.0x to 3.9x | 17 (9.0%) | 20 (11.7%) |
| 4.0x or more | 124 (66.0%) | 74 (43.3%) |
| Total | 188 (100.0%) | 171 (100.0%) |
Real Estate Taxes by Mortgage Status in Joseph
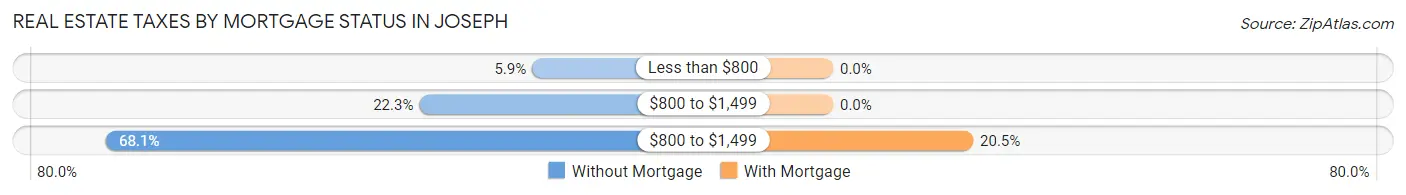
| Property Taxes | Without Mortgage | With Mortgage |
| Less than $800 | 11 (5.9%) | 0 (0.0%) |
| $800 to $1,499 | 42 (22.3%) | 0 (0.0%) |
| $800 to $1,499 | 128 (68.1%) | 35 (20.5%) |
| Total | 188 (100.0%) | 171 (100.0%) |
Health & Disability in Joseph
Health Insurance Coverage by Age in Joseph
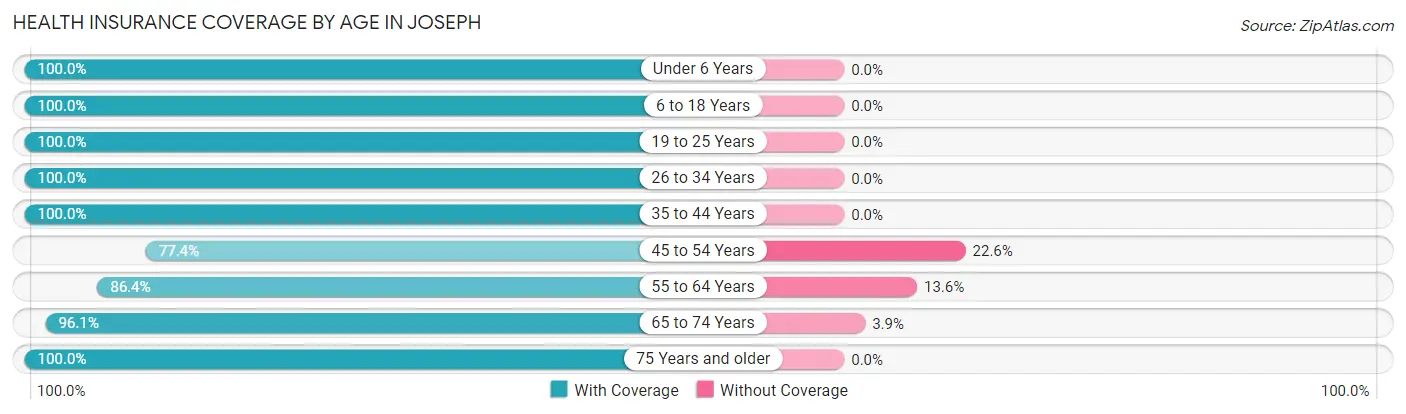
| Age Bracket | With Coverage | Without Coverage |
| Under 6 Years | 39 (100.0%) | 0 (0.0%) |
| 6 to 18 Years | 115 (100.0%) | 0 (0.0%) |
| 19 to 25 Years | 43 (100.0%) | 0 (0.0%) |
| 26 to 34 Years | 37 (100.0%) | 0 (0.0%) |
| 35 to 44 Years | 133 (100.0%) | 0 (0.0%) |
| 45 to 54 Years | 65 (77.4%) | 19 (22.6%) |
| 55 to 64 Years | 172 (86.4%) | 27 (13.6%) |
| 65 to 74 Years | 222 (96.1%) | 9 (3.9%) |
| 75 Years and older | 135 (100.0%) | 0 (0.0%) |
| Total | 961 (94.6%) | 55 (5.4%) |
Health Insurance Coverage by Citizenship Status in Joseph
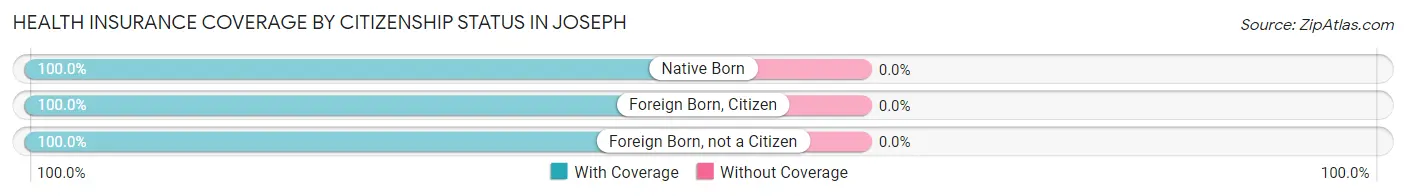
| Citizenship Status | With Coverage | Without Coverage |
| Native Born | 39 (100.0%) | 0 (0.0%) |
| Foreign Born, Citizen | 115 (100.0%) | 0 (0.0%) |
| Foreign Born, not a Citizen | 43 (100.0%) | 0 (0.0%) |
Health Insurance Coverage by Household Income in Joseph
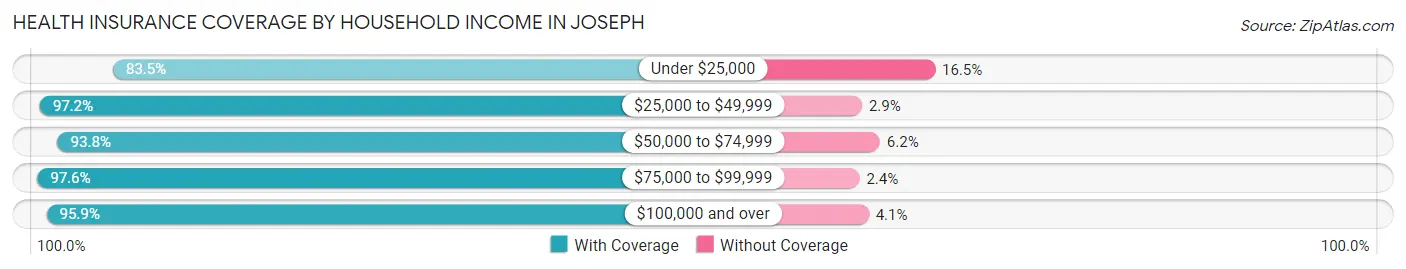
| Household Income | With Coverage | Without Coverage |
| Under $25,000 | 101 (83.5%) | 20 (16.5%) |
| $25,000 to $49,999 | 307 (97.2%) | 9 (2.9%) |
| $50,000 to $74,999 | 242 (93.8%) | 16 (6.2%) |
| $75,000 to $99,999 | 164 (97.6%) | 4 (2.4%) |
| $100,000 and over | 140 (95.9%) | 6 (4.1%) |
Public vs Private Health Insurance Coverage by Age in Joseph
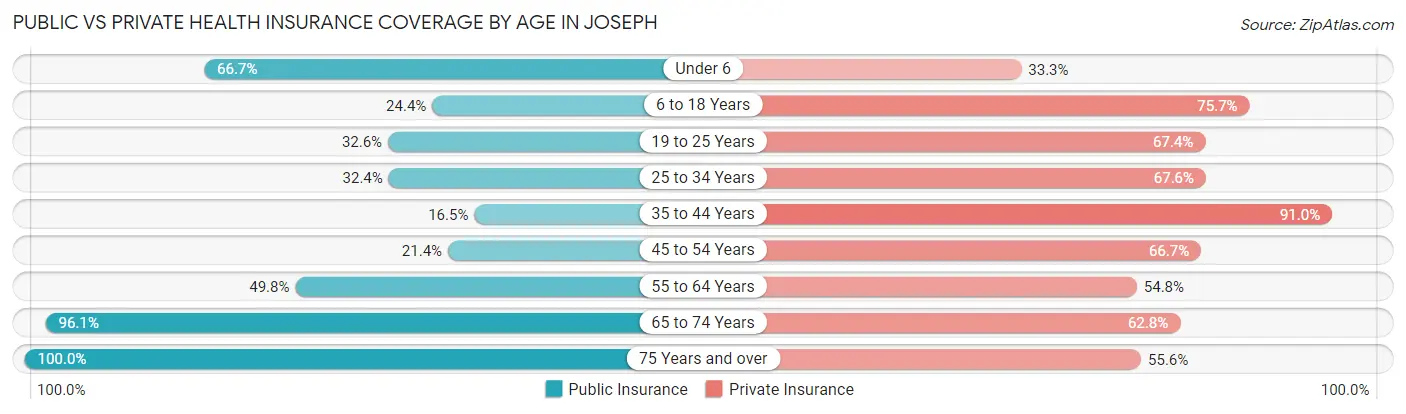
| Age Bracket | Public Insurance | Private Insurance |
| Under 6 | 26 (66.7%) | 13 (33.3%) |
| 6 to 18 Years | 28 (24.3%) | 87 (75.6%) |
| 19 to 25 Years | 14 (32.6%) | 29 (67.4%) |
| 25 to 34 Years | 12 (32.4%) | 25 (67.6%) |
| 35 to 44 Years | 22 (16.5%) | 121 (91.0%) |
| 45 to 54 Years | 18 (21.4%) | 56 (66.7%) |
| 55 to 64 Years | 99 (49.7%) | 109 (54.8%) |
| 65 to 74 Years | 222 (96.1%) | 145 (62.8%) |
| 75 Years and over | 135 (100.0%) | 75 (55.6%) |
| Total | 576 (56.7%) | 660 (65.0%) |
Disability Status by Sex by Age in Joseph
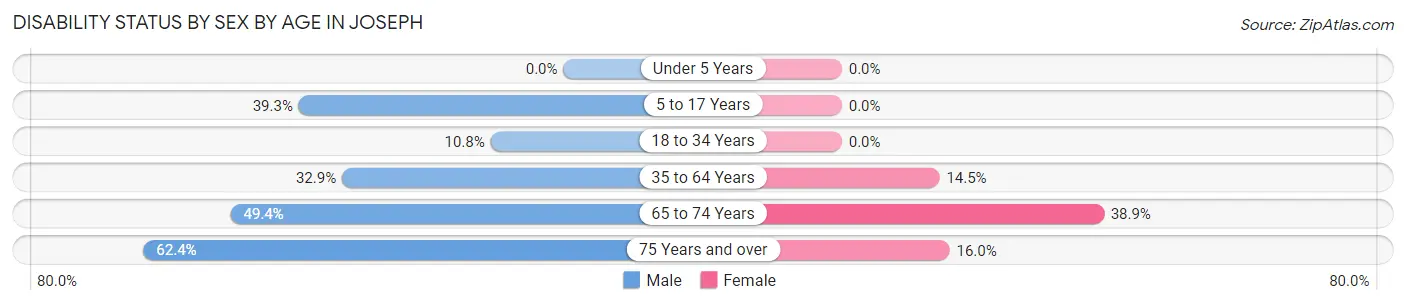
| Age Bracket | Male | Female |
| Under 5 Years | 0 (0.0%) | 0 (0.0%) |
| 5 to 17 Years | 11 (39.3%) | 0 (0.0%) |
| 18 to 34 Years | 4 (10.8%) | 0 (0.0%) |
| 35 to 64 Years | 71 (32.9%) | 29 (14.5%) |
| 65 to 74 Years | 43 (49.4%) | 56 (38.9%) |
| 75 Years and over | 53 (62.4%) | 8 (16.0%) |
Disability Class by Sex by Age in Joseph
Disability Class: Hearing Difficulty
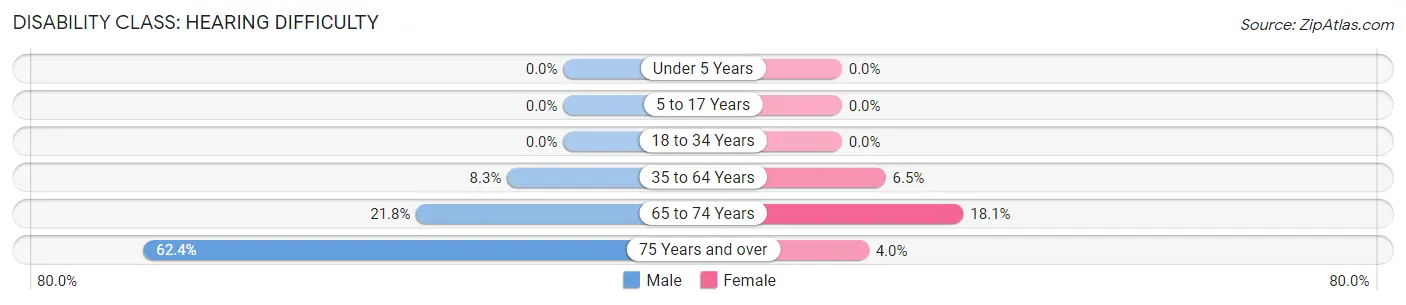
| Age Bracket | Male | Female |
| Under 5 Years | 0 (0.0%) | 0 (0.0%) |
| 5 to 17 Years | 0 (0.0%) | 0 (0.0%) |
| 18 to 34 Years | 0 (0.0%) | 0 (0.0%) |
| 35 to 64 Years | 18 (8.3%) | 13 (6.5%) |
| 65 to 74 Years | 19 (21.8%) | 26 (18.1%) |
| 75 Years and over | 53 (62.4%) | 2 (4.0%) |
Disability Class: Vision Difficulty
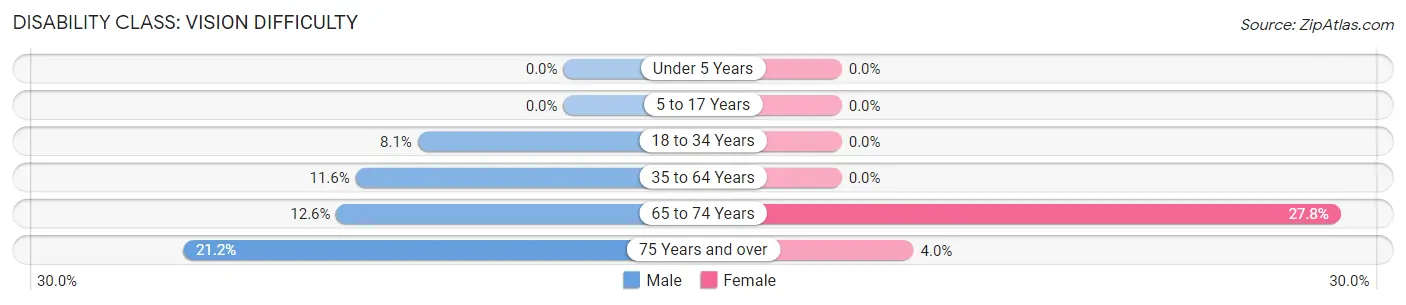
| Age Bracket | Male | Female |
| Under 5 Years | 0 (0.0%) | 0 (0.0%) |
| 5 to 17 Years | 0 (0.0%) | 0 (0.0%) |
| 18 to 34 Years | 3 (8.1%) | 0 (0.0%) |
| 35 to 64 Years | 25 (11.6%) | 0 (0.0%) |
| 65 to 74 Years | 11 (12.6%) | 40 (27.8%) |
| 75 Years and over | 18 (21.2%) | 2 (4.0%) |
Disability Class: Cognitive Difficulty
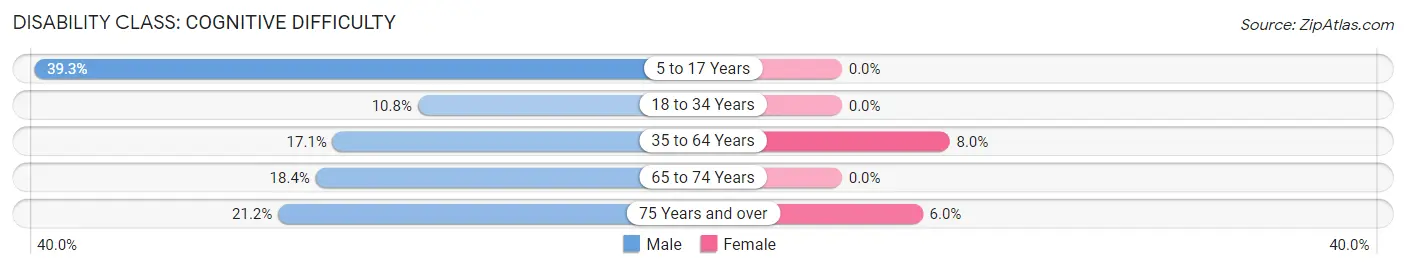
| Age Bracket | Male | Female |
| 5 to 17 Years | 11 (39.3%) | 0 (0.0%) |
| 18 to 34 Years | 4 (10.8%) | 0 (0.0%) |
| 35 to 64 Years | 37 (17.1%) | 16 (8.0%) |
| 65 to 74 Years | 16 (18.4%) | 0 (0.0%) |
| 75 Years and over | 18 (21.2%) | 3 (6.0%) |
Disability Class: Ambulatory Difficulty
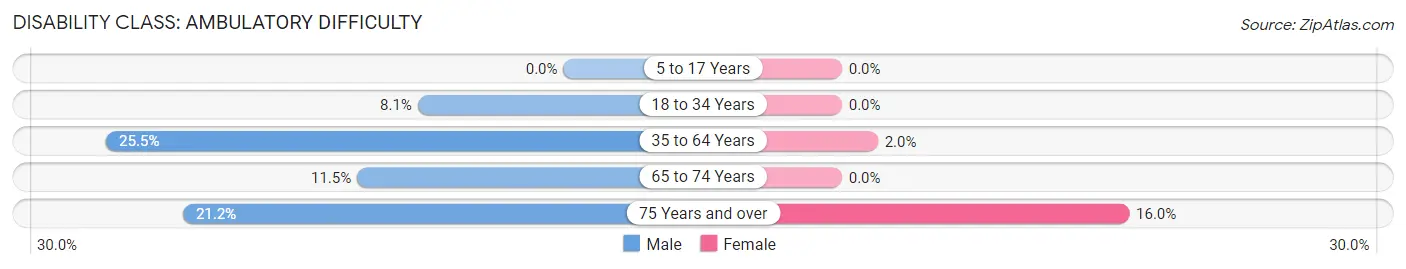
| Age Bracket | Male | Female |
| 5 to 17 Years | 0 (0.0%) | 0 (0.0%) |
| 18 to 34 Years | 3 (8.1%) | 0 (0.0%) |
| 35 to 64 Years | 55 (25.5%) | 4 (2.0%) |
| 65 to 74 Years | 10 (11.5%) | 0 (0.0%) |
| 75 Years and over | 18 (21.2%) | 8 (16.0%) |
Disability Class: Self-Care Difficulty
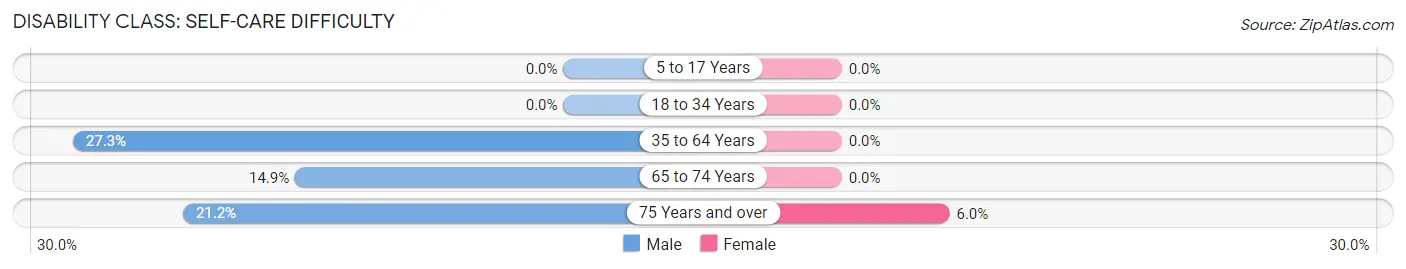
| Age Bracket | Male | Female |
| 5 to 17 Years | 0 (0.0%) | 0 (0.0%) |
| 18 to 34 Years | 0 (0.0%) | 0 (0.0%) |
| 35 to 64 Years | 59 (27.3%) | 0 (0.0%) |
| 65 to 74 Years | 13 (14.9%) | 0 (0.0%) |
| 75 Years and over | 18 (21.2%) | 3 (6.0%) |
Technology Access in Joseph
Computing Device Access in Joseph
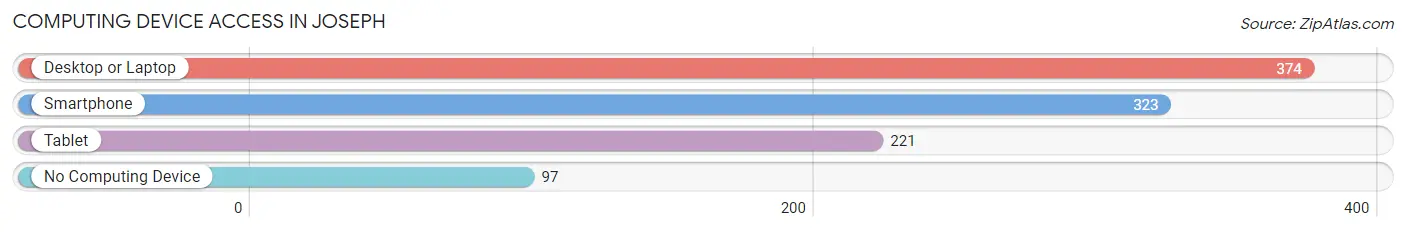
| Device Type | # Households | % Households |
| Desktop or Laptop | 374 | 73.3% |
| Smartphone | 323 | 63.3% |
| Tablet | 221 | 43.3% |
| No Computing Device | 97 | 19.0% |
| Total | 510 | 100.0% |
Internet Access in Joseph
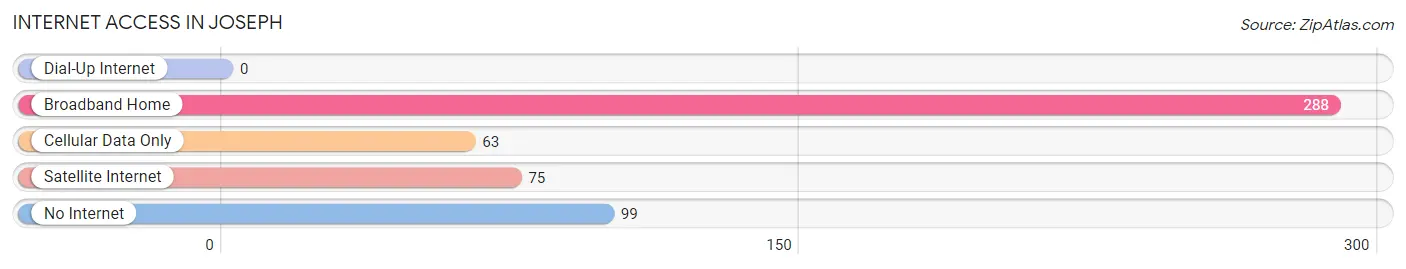
| Internet Type | # Households | % Households |
| Dial-Up Internet | 0 | 0.0% |
| Broadband Home | 288 | 56.5% |
| Cellular Data Only | 63 | 12.3% |
| Satellite Internet | 75 | 14.7% |
| No Internet | 99 | 19.4% |
| Total | 510 | 100.0% |
Joseph Summary
Joseph, Oregon is a small city located in the northeastern corner of the state, in Wallowa County. It is situated in the foothills of the Wallowa Mountains, and is surrounded by the Wallowa-Whitman National Forest. The city is known for its stunning natural beauty, and is a popular destination for outdoor recreation.
History
Joseph was founded in 1887 by a group of settlers from the nearby town of Wallowa. The settlers were looking for a place to build a new town, and chose the area around Joseph Creek. The town was named after Chief Joseph, a leader of the Nez Perce tribe who had been forced to relocate to the area in the late 1800s.
The town quickly grew, and by the early 1900s it had become a bustling center of commerce and industry. The town was home to several sawmills, a flour mill, a woolen mill, and a number of other businesses. The town also had a railroad station, which connected it to the rest of the state.
In the early 1900s, Joseph was also home to a thriving arts and culture scene. The town was home to several theaters, art galleries, and music venues. It was also home to a number of writers, artists, and musicians.
Geography
Joseph is located in the northeastern corner of Oregon, in Wallowa County. It is situated in the foothills of the Wallowa Mountains, and is surrounded by the Wallowa-Whitman National Forest. The city is located at an elevation of 4,000 feet, and has a total area of 1.3 square miles.
The city is located in a semi-arid climate, with hot summers and cold winters. The average annual temperature is around 50 degrees Fahrenheit, and the average annual precipitation is around 15 inches.
Economy
Joseph’s economy is largely based on tourism and outdoor recreation. The city is home to several ski resorts, and is a popular destination for hikers, campers, and other outdoor enthusiasts. The city is also home to several art galleries, museums, and other cultural attractions.
The city is also home to several manufacturing and industrial businesses. These businesses include a sawmill, a flour mill, and a woolen mill. The city is also home to several retail stores, restaurants, and other businesses.
Demographics
As of the 2010 census, the population of Joseph was 1,081. The racial makeup of the city was 94.3% White, 0.7% Native American, 0.3% Asian, 0.2% African American, and 4.5% from other races. The median household income was $35,000, and the median family income was $41,000.
Conclusion
Joseph, Oregon is a small city located in the northeastern corner of the state, in Wallowa County. It is situated in the foothills of the Wallowa Mountains, and is surrounded by the Wallowa-Whitman National Forest. The city is known for its stunning natural beauty, and is a popular destination for outdoor recreation. The city’s economy is largely based on tourism and outdoor recreation, and it is also home to several manufacturing and industrial businesses. As of the 2010 census, the population of Joseph was 1,081.
Common Questions
What is the Total Population of Joseph?
Total Population of Joseph is 1,048.
What is the Total Male Population of Joseph?
Total Male Population of Joseph is 484.
What is the Total Female Population of Joseph?
Total Female Population of Joseph is 564.
What is the Ratio of Males per 100 Females in Joseph?
There are 85.82 Males per 100 Females in Joseph.
What is the Ratio of Females per 100 Males in Joseph?
There are 116.53 Females per 100 Males in Joseph.
What is the Median Population Age in Joseph?
Median Population Age in Joseph is 59.6 Years.
What is the Average Family Size in Joseph
Average Family Size in Joseph is 2.5 People.
What is the Average Household Size in Joseph
Average Household Size in Joseph is 2.0 People.
What is Per Capita Income in Joseph?
Per Capita income in Joseph is $29,843.
What is the Median Family Income in Joseph?
Median Family Income in Joseph is $65,337.
What is the Median Household income in Joseph?
Median Household Income in Joseph is $48,309.
What is Inequality or Gini Index in Joseph?
Inequality or Gini Index in Joseph is 0.38.
How Large is the Labor Force in Joseph?
There are 436 People in the Labor Forcein in Joseph.
What is the Percentage of People in the Labor Force in Joseph?
48.0% of People are in the Labor Force in Joseph.
What is the Unemployment Rate in Joseph?
Unemployment Rate in Joseph is 5.3%.