Rogue River, OR
Rogue River Map
Rogue River Overview
1,997
TOTAL POPULATION
973
MALE POPULATION
1,024
FEMALE POPULATION
95.02
MALES / 100 FEMALES
105.24
FEMALES / 100 MALES
52.6
MEDIAN AGE
2.6
AVG FAMILY SIZE
2.0
AVG HOUSEHOLD SIZE
$26,852
PER CAPITA INCOME
$65,284
AVG FAMILY INCOME
$43,929
AVG HOUSEHOLD INCOME
36.2%
WAGE / INCOME GAP [ % ]
63.8¢/ $1
WAGE / INCOME GAP [ $ ]
0.44
INEQUALITY / GINI INDEX
654
LABOR FORCE [ PEOPLE ]
38.8%
PERCENT IN LABOR FORCE
12.2%
UNEMPLOYMENT RATE
Rogue River Zip Codes
Rogue River Area Codes
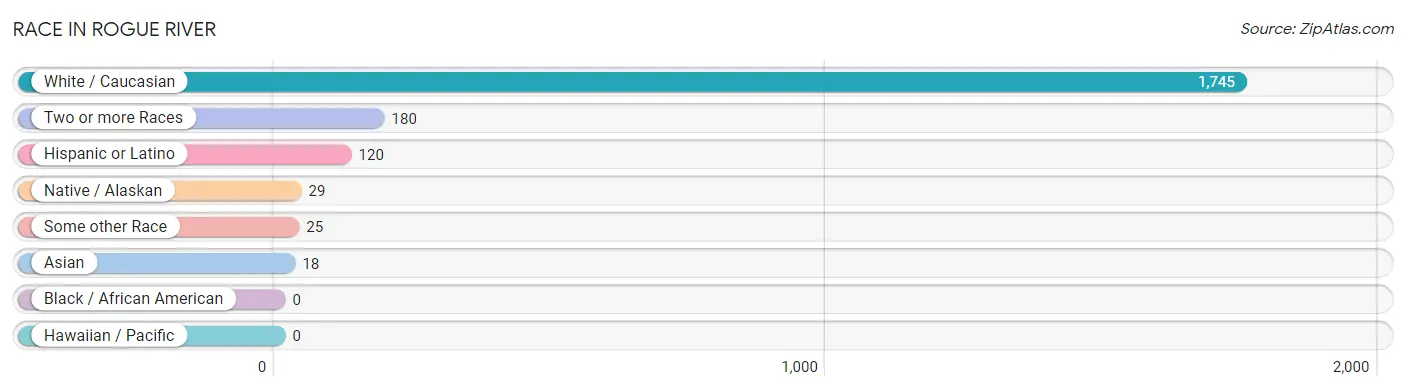
Race in Rogue River
The most populous races in Rogue River are White / Caucasian (1,745 | 87.4%), Two or more Races (180 | 9.0%), and Hispanic or Latino (120 | 6.0%).
| Race | # Population | % Population |
| Asian | 18 | 0.9% |
| Black / African American | 0 | 0.0% |
| Hawaiian / Pacific | 0 | 0.0% |
| Hispanic or Latino | 120 | 6.0% |
| Native / Alaskan | 29 | 1.5% |
| White / Caucasian | 1,745 | 87.4% |
| Two or more Races | 180 | 9.0% |
| Some other Race | 25 | 1.3% |
| Total | 1,997 | 100.0% |
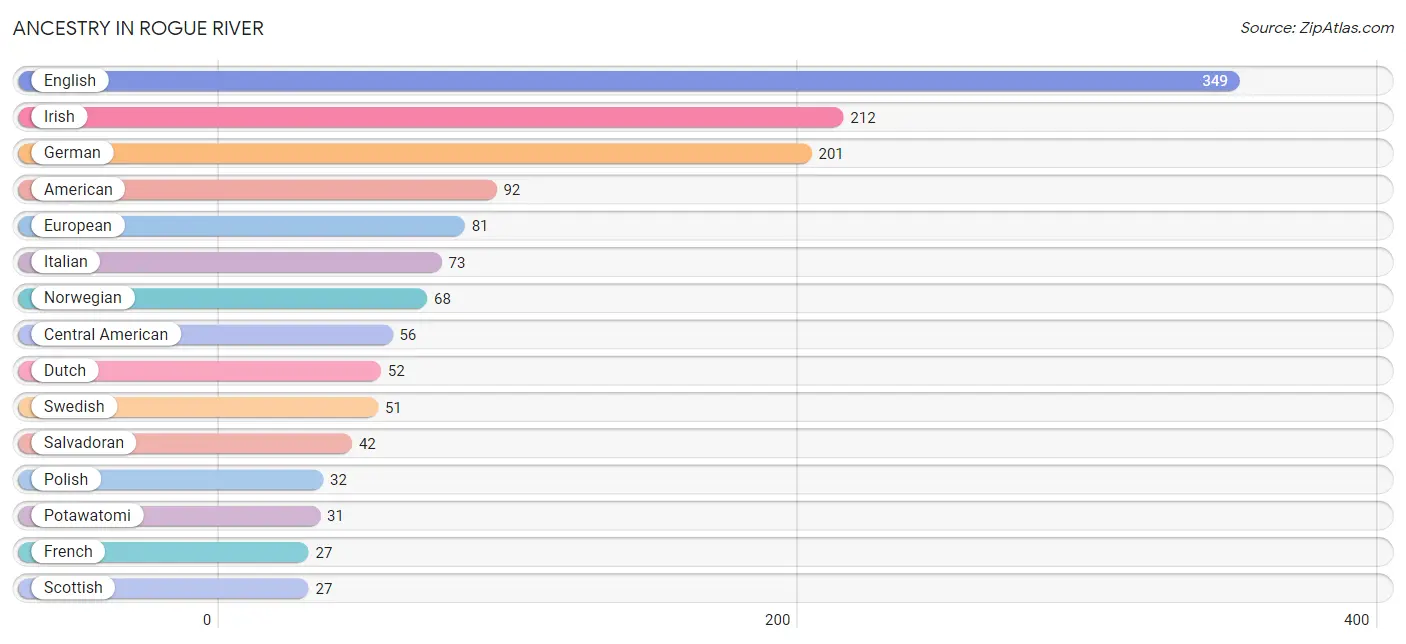
Ancestry in Rogue River
The most populous ancestries reported in Rogue River are English (349 | 17.5%), Irish (212 | 10.6%), German (201 | 10.1%), American (92 | 4.6%), and European (81 | 4.1%), together accounting for 46.8% of all Rogue River residents.
| Ancestry | # Population | % Population |
| American | 92 | 4.6% |
| Arab | 4 | 0.2% |
| Belgian | 23 | 1.1% |
| Blackfeet | 1 | 0.1% |
| British | 8 | 0.4% |
| Burmese | 1 | 0.1% |
| Canadian | 22 | 1.1% |
| Celtic | 14 | 0.7% |
| Central American | 56 | 2.8% |
| Cherokee | 3 | 0.2% |
| Croatian | 7 | 0.4% |
| Danish | 9 | 0.4% |
| Dutch | 52 | 2.6% |
| Eastern European | 7 | 0.4% |
| English | 349 | 17.5% |
| European | 81 | 4.1% |
| Finnish | 15 | 0.7% |
| French | 27 | 1.3% |
| French American Indian | 2 | 0.1% |
| French Canadian | 14 | 0.7% |
| German | 201 | 10.1% |
| Greek | 8 | 0.4% |
| Hungarian | 7 | 0.4% |
| Indian (Asian) | 11 | 0.5% |
| Irish | 212 | 10.6% |
| Italian | 73 | 3.7% |
| Lithuanian | 12 | 0.6% |
| Lumbee | 24 | 1.2% |
| Mexican | 19 | 0.9% |
| Nicaraguan | 14 | 0.7% |
| Norwegian | 68 | 3.4% |
| Paiute | 9 | 0.4% |
| Pakistani | 6 | 0.3% |
| Polish | 32 | 1.6% |
| Portuguese | 8 | 0.4% |
| Potawatomi | 31 | 1.5% |
| Puerto Rican | 26 | 1.3% |
| Russian | 13 | 0.6% |
| Salvadoran | 42 | 2.1% |
| Scandinavian | 11 | 0.5% |
| Scotch-Irish | 17 | 0.9% |
| Scottish | 27 | 1.3% |
| Swedish | 51 | 2.5% |
| Swiss | 1 | 0.1% |
| Ukrainian | 5 | 0.3% |
| Welsh | 11 | 0.5% | View All 46 Rows |
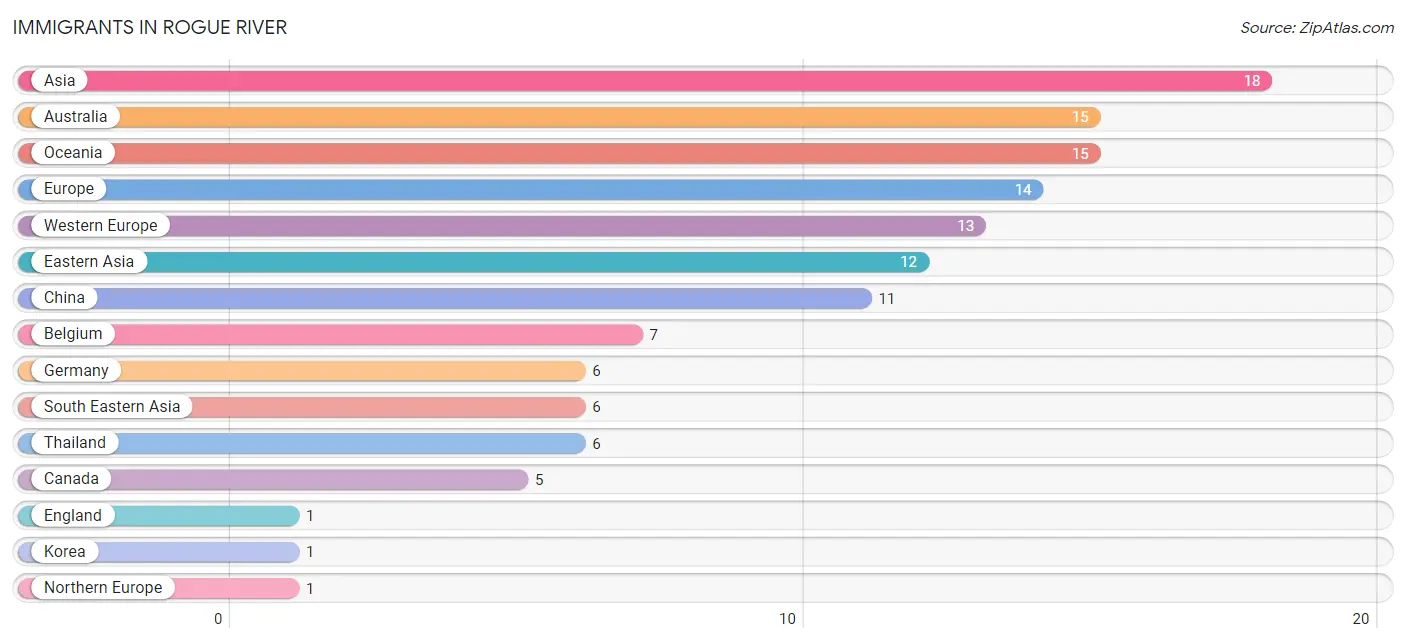
Immigrants in Rogue River
The most numerous immigrant groups reported in Rogue River came from Asia (18 | 0.9%), Australia (15 | 0.7%), Oceania (15 | 0.7%), Europe (14 | 0.7%), and Western Europe (13 | 0.6%), together accounting for 3.7% of all Rogue River residents.
| Immigration Origin | # Population | % Population |
| Asia | 18 | 0.9% |
| Australia | 15 | 0.7% |
| Belgium | 7 | 0.4% |
| Canada | 5 | 0.3% |
| China | 11 | 0.5% |
| Eastern Asia | 12 | 0.6% |
| England | 1 | 0.1% |
| Europe | 14 | 0.7% |
| Germany | 6 | 0.3% |
| Korea | 1 | 0.1% |
| Northern Europe | 1 | 0.1% |
| Oceania | 15 | 0.7% |
| South Eastern Asia | 6 | 0.3% |
| Thailand | 6 | 0.3% |
| Western Europe | 13 | 0.6% | View All 15 Rows |
Sex and Age in Rogue River
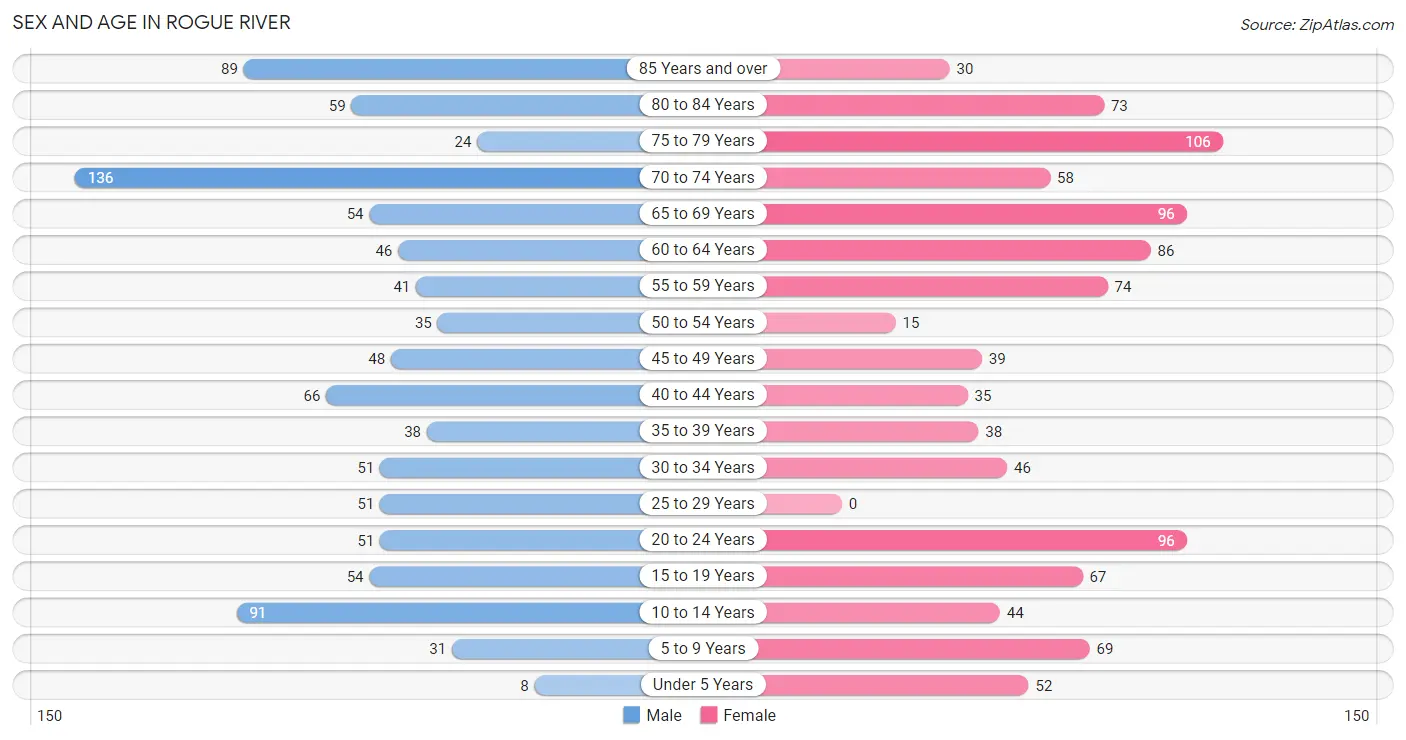
Sex and Age in Rogue River
The most populous age groups in Rogue River are 70 to 74 Years (136 | 14.0%) for men and 75 to 79 Years (106 | 10.3%) for women.
| Age Bracket | Male | Female |
| Under 5 Years | 8 (0.8%) | 52 (5.1%) |
| 5 to 9 Years | 31 (3.2%) | 69 (6.7%) |
| 10 to 14 Years | 91 (9.3%) | 44 (4.3%) |
| 15 to 19 Years | 54 (5.6%) | 67 (6.5%) |
| 20 to 24 Years | 51 (5.2%) | 96 (9.4%) |
| 25 to 29 Years | 51 (5.2%) | 0 (0.0%) |
| 30 to 34 Years | 51 (5.2%) | 46 (4.5%) |
| 35 to 39 Years | 38 (3.9%) | 38 (3.7%) |
| 40 to 44 Years | 66 (6.8%) | 35 (3.4%) |
| 45 to 49 Years | 48 (4.9%) | 39 (3.8%) |
| 50 to 54 Years | 35 (3.6%) | 15 (1.5%) |
| 55 to 59 Years | 41 (4.2%) | 74 (7.2%) |
| 60 to 64 Years | 46 (4.7%) | 86 (8.4%) |
| 65 to 69 Years | 54 (5.6%) | 96 (9.4%) |
| 70 to 74 Years | 136 (14.0%) | 58 (5.7%) |
| 75 to 79 Years | 24 (2.5%) | 106 (10.3%) |
| 80 to 84 Years | 59 (6.1%) | 73 (7.1%) |
| 85 Years and over | 89 (9.1%) | 30 (2.9%) |
| Total | 973 (100.0%) | 1,024 (100.0%) |
Families and Households in Rogue River
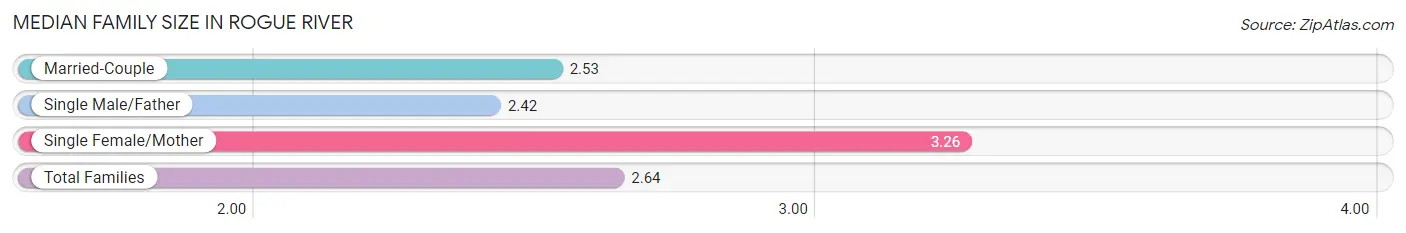
Median Family Size in Rogue River
The median family size in Rogue River is 2.64 persons per family, with single female/mother families (87 | 16.7%) accounting for the largest median family size of 3.26 persons per family. On the other hand, single male/father families (74 | 14.2%) represent the smallest median family size with 2.42 persons per family.
| Family Type | # Families | Family Size |
| Married-Couple | 359 (69.0%) | 2.53 |
| Single Male/Father | 74 (14.2%) | 2.42 |
| Single Female/Mother | 87 (16.7%) | 3.26 |
| Total Families | 520 (100.0%) | 2.64 |
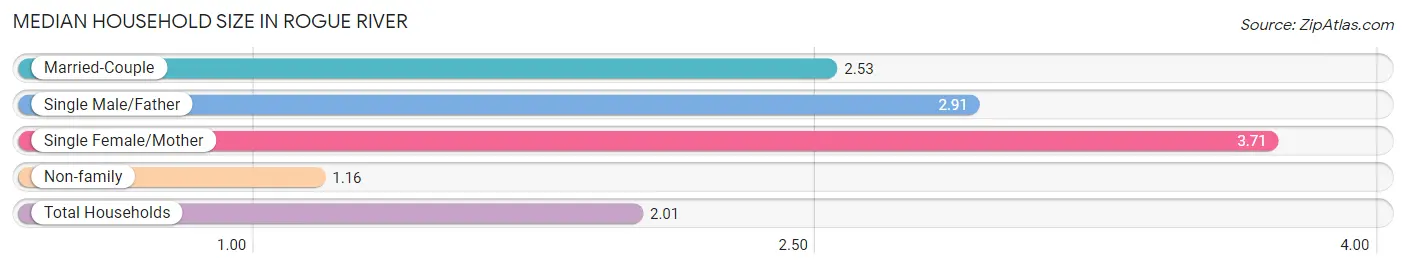
Median Household Size in Rogue River
The median household size in Rogue River is 2.01 persons per household, with single female/mother households (87 | 8.7%) accounting for the largest median household size of 3.71 persons per household. non-family households (476 | 47.8%) represent the smallest median household size with 1.16 persons per household.
| Household Type | # Households | Household Size |
| Married-Couple | 359 (36.0%) | 2.53 |
| Single Male/Father | 74 (7.4%) | 2.91 |
| Single Female/Mother | 87 (8.7%) | 3.71 |
| Non-family | 476 (47.8%) | 1.16 |
| Total Households | 996 (100.0%) | 2.01 |
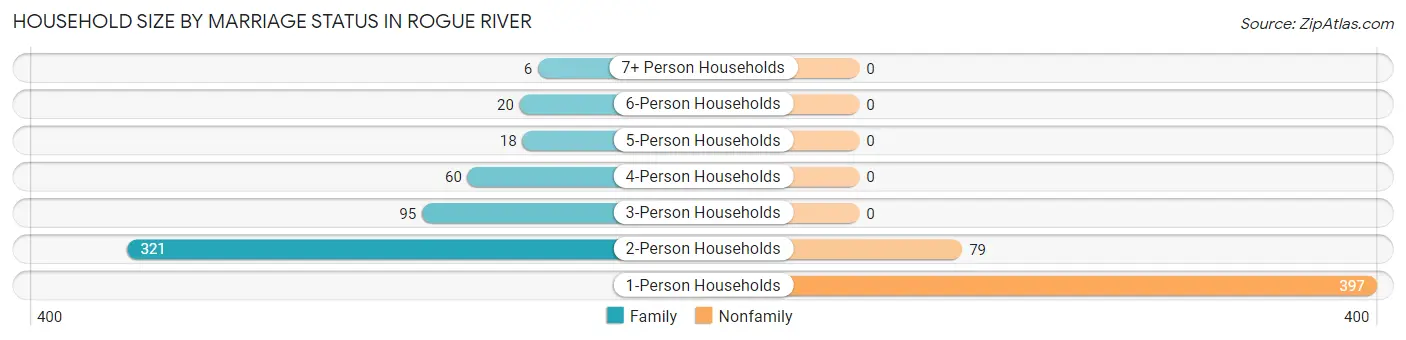
Household Size by Marriage Status in Rogue River
Out of a total of 996 households in Rogue River, 520 (52.2%) are family households, while 476 (47.8%) are nonfamily households. The most numerous type of family households are 2-person households, comprising 321, and the most common type of nonfamily households are 1-person households, comprising 397.
| Household Size | Family Households | Nonfamily Households |
| 1-Person Households | - | 397 (39.9%) |
| 2-Person Households | 321 (32.2%) | 79 (7.9%) |
| 3-Person Households | 95 (9.5%) | 0 (0.0%) |
| 4-Person Households | 60 (6.0%) | 0 (0.0%) |
| 5-Person Households | 18 (1.8%) | 0 (0.0%) |
| 6-Person Households | 20 (2.0%) | 0 (0.0%) |
| 7+ Person Households | 6 (0.6%) | 0 (0.0%) |
| Total | 520 (52.2%) | 476 (47.8%) |
Female Fertility in Rogue River
Fertility by Age in Rogue River
Average fertility rate in Rogue River is 22.0 births per 1,000 women. Women in the age bracket of 20 to 34 years have the highest fertility rate with 49.0 births per 1,000 women. Women in the age bracket of 20 to 34 years acount for 100.0% of all women with births.
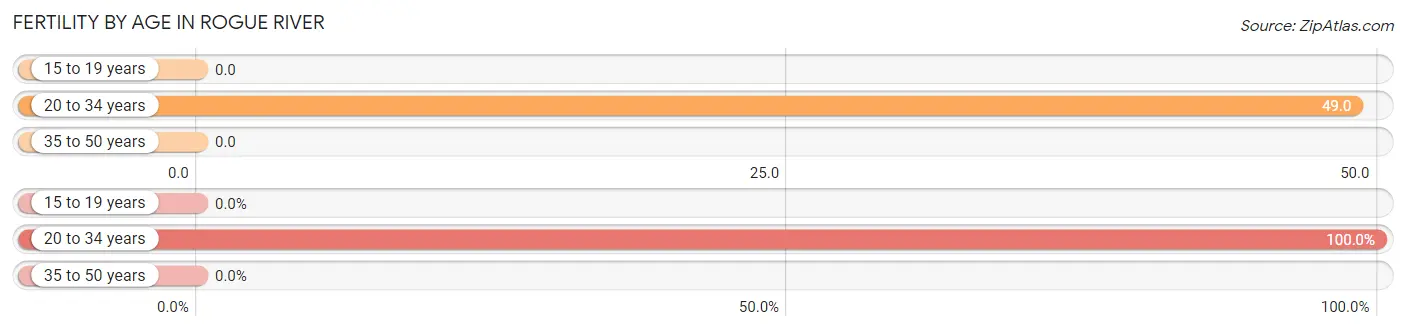
| Age Bracket | Women with Births | Births / 1,000 Women |
| 15 to 19 years | 0 (0.0%) | 0.0 |
| 20 to 34 years | 7 (100.0%) | 49.0 |
| 35 to 50 years | 0 (0.0%) | 0.0 |
| Total | 7 (100.0%) | 22.0 |
Fertility by Age by Marriage Status in Rogue River
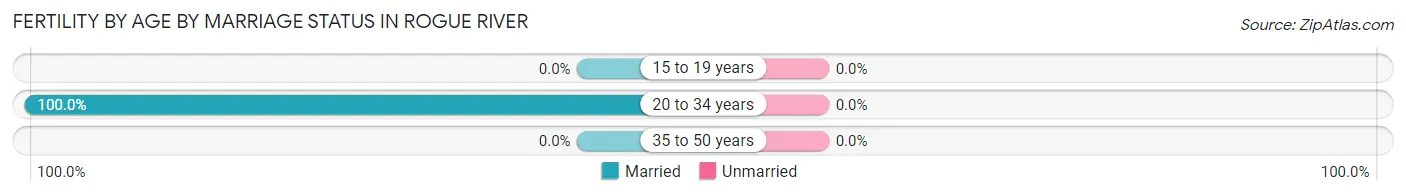
| Age Bracket | Married | Unmarried |
| 15 to 19 years | 0 (0.0%) | 0 (0.0%) |
| 20 to 34 years | 7 (100.0%) | 0 (0.0%) |
| 35 to 50 years | 0 (0.0%) | 0 (0.0%) |
| Total | 7 (100.0%) | 0 (0.0%) |
Fertility by Education in Rogue River
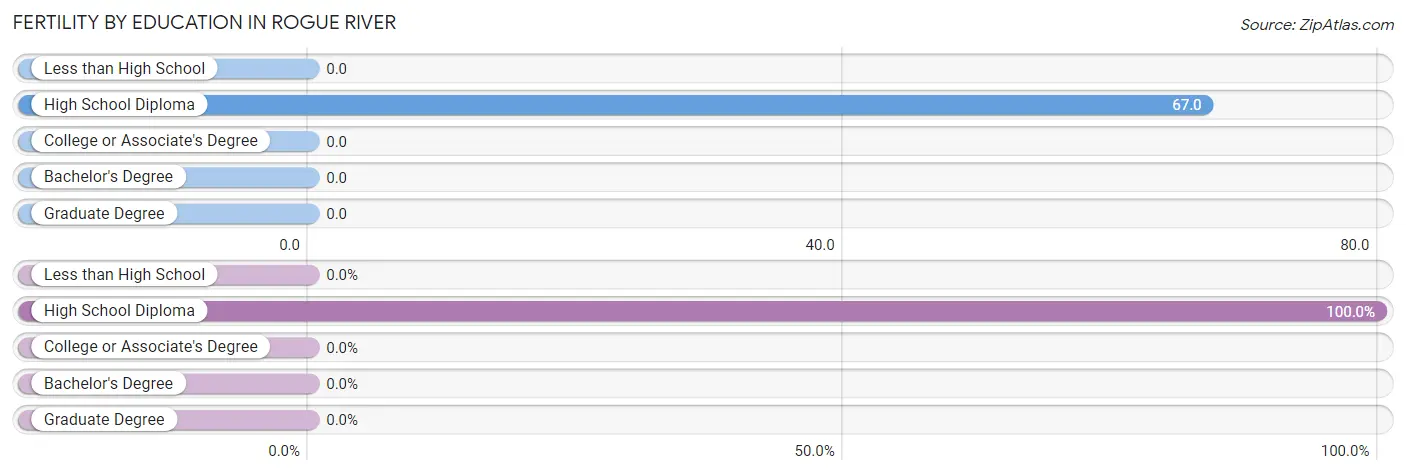
| Educational Attainment | Women with Births | Births / 1,000 Women |
| Less than High School | 0 (0.0%) | 0.0 |
| High School Diploma | 7 (100.0%) | 67.0 |
| College or Associate's Degree | 0 (0.0%) | 0.0 |
| Bachelor's Degree | 0 (0.0%) | 0.0 |
| Graduate Degree | 0 (0.0%) | 0.0 |
| Total | 7 (100.0%) | 22.0 |
Fertility by Education by Marriage Status in Rogue River
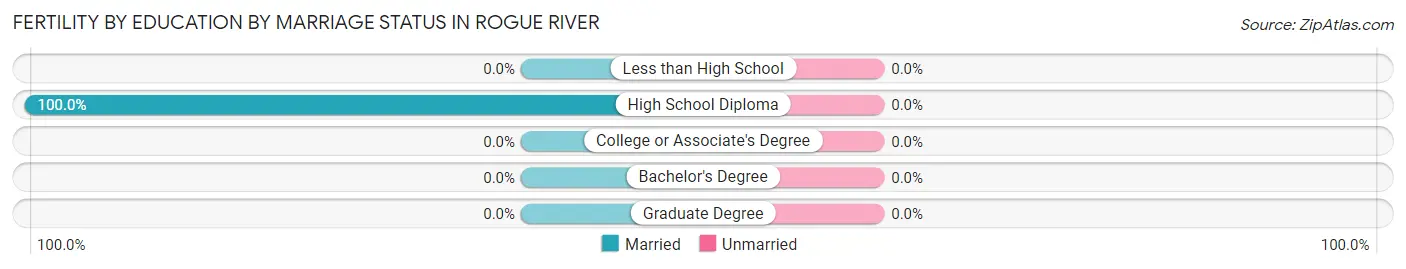
| Educational Attainment | Married | Unmarried |
| Less than High School | 0 (0.0%) | 0 (0.0%) |
| High School Diploma | 7 (100.0%) | 0 (0.0%) |
| College or Associate's Degree | 0 (0.0%) | 0 (0.0%) |
| Bachelor's Degree | 0 (0.0%) | 0 (0.0%) |
| Graduate Degree | 0 (0.0%) | 0 (0.0%) |
| Total | 7 (100.0%) | 0 (0.0%) |
Income in Rogue River
Income Overview in Rogue River
Per Capita Income in Rogue River is $26,852, while median incomes of families and households are $65,284 and $43,929 respectively.
| Characteristic | Number | Measure |
| Per Capita Income | 1,997 | $26,852 |
| Median Family Income | 520 | $65,284 |
| Mean Family Income | 520 | $69,788 |
| Median Household Income | 996 | $43,929 |
| Mean Household Income | 996 | $54,471 |
| Income Deficit | 520 | $0 |
| Wage / Income Gap (%) | 1,997 | 36.18% |
| Wage / Income Gap ($) | 1,997 | 63.82¢ per $1 |
| Gini / Inequality Index | 1,997 | 0.44 |
Earnings by Sex in Rogue River
Average Earnings in Rogue River are $31,750, $38,583 for men and $24,625 for women, a difference of 36.2%.
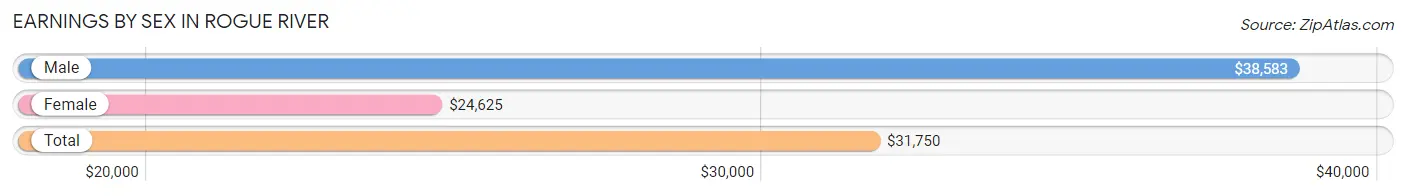
| Sex | Number | Average Earnings |
| Male | 361 (51.4%) | $38,583 |
| Female | 341 (48.6%) | $24,625 |
| Total | 702 (100.0%) | $31,750 |
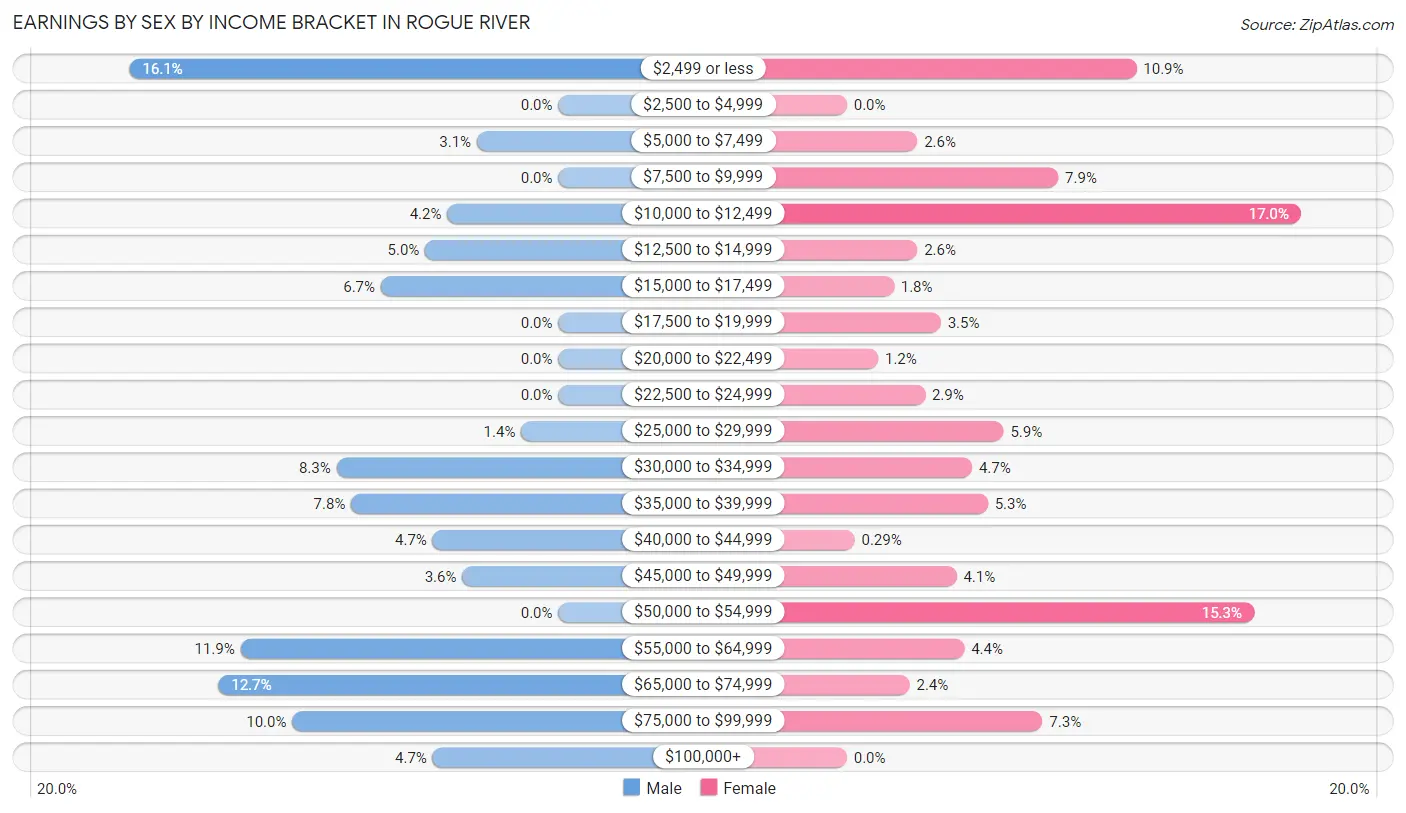
Earnings by Sex by Income Bracket in Rogue River
The most common earnings brackets in Rogue River are $2,499 or less for men (58 | 16.1%) and $10,000 to $12,499 for women (58 | 17.0%).
| Income | Male | Female |
| $2,499 or less | 58 (16.1%) | 37 (10.8%) |
| $2,500 to $4,999 | 0 (0.0%) | 0 (0.0%) |
| $5,000 to $7,499 | 11 (3.0%) | 9 (2.6%) |
| $7,500 to $9,999 | 0 (0.0%) | 27 (7.9%) |
| $10,000 to $12,499 | 15 (4.2%) | 58 (17.0%) |
| $12,500 to $14,999 | 18 (5.0%) | 9 (2.6%) |
| $15,000 to $17,499 | 24 (6.7%) | 6 (1.8%) |
| $17,500 to $19,999 | 0 (0.0%) | 12 (3.5%) |
| $20,000 to $22,499 | 0 (0.0%) | 4 (1.2%) |
| $22,500 to $24,999 | 0 (0.0%) | 10 (2.9%) |
| $25,000 to $29,999 | 5 (1.4%) | 20 (5.9%) |
| $30,000 to $34,999 | 30 (8.3%) | 16 (4.7%) |
| $35,000 to $39,999 | 28 (7.8%) | 18 (5.3%) |
| $40,000 to $44,999 | 17 (4.7%) | 1 (0.3%) |
| $45,000 to $49,999 | 13 (3.6%) | 14 (4.1%) |
| $50,000 to $54,999 | 0 (0.0%) | 52 (15.2%) |
| $55,000 to $64,999 | 43 (11.9%) | 15 (4.4%) |
| $65,000 to $74,999 | 46 (12.7%) | 8 (2.4%) |
| $75,000 to $99,999 | 36 (10.0%) | 25 (7.3%) |
| $100,000+ | 17 (4.7%) | 0 (0.0%) |
| Total | 361 (100.0%) | 341 (100.0%) |
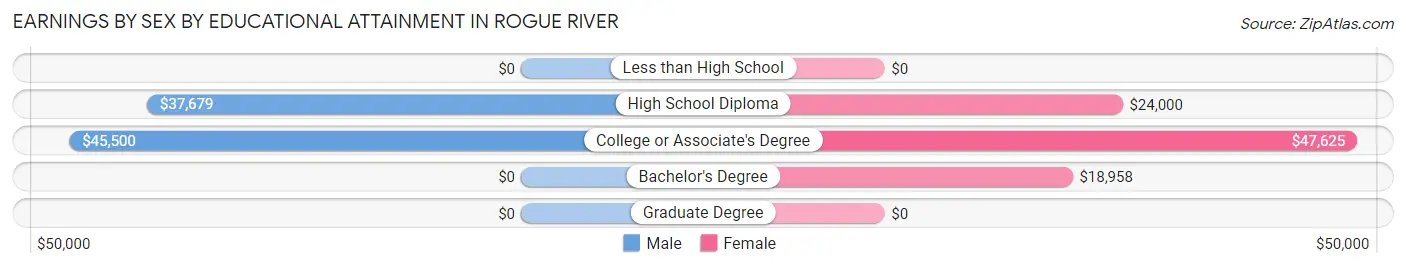
Earnings by Sex by Educational Attainment in Rogue River
Average earnings in Rogue River are $39,107 for men and $28,750 for women, a difference of 26.5%. Men with an educational attainment of college or associate's degree enjoy the highest average annual earnings of $45,500, while those with high school diploma education earn the least with $37,679. Women with an educational attainment of college or associate's degree earn the most with the average annual earnings of $47,625, while those with bachelor's degree education have the smallest earnings of $18,958.
| Educational Attainment | Male Income | Female Income |
| Less than High School | - | - |
| High School Diploma | $37,679 | $24,000 |
| College or Associate's Degree | $45,500 | $47,625 |
| Bachelor's Degree | - | - |
| Graduate Degree | - | - |
| Total | $39,107 | $28,750 |
Family Income in Rogue River
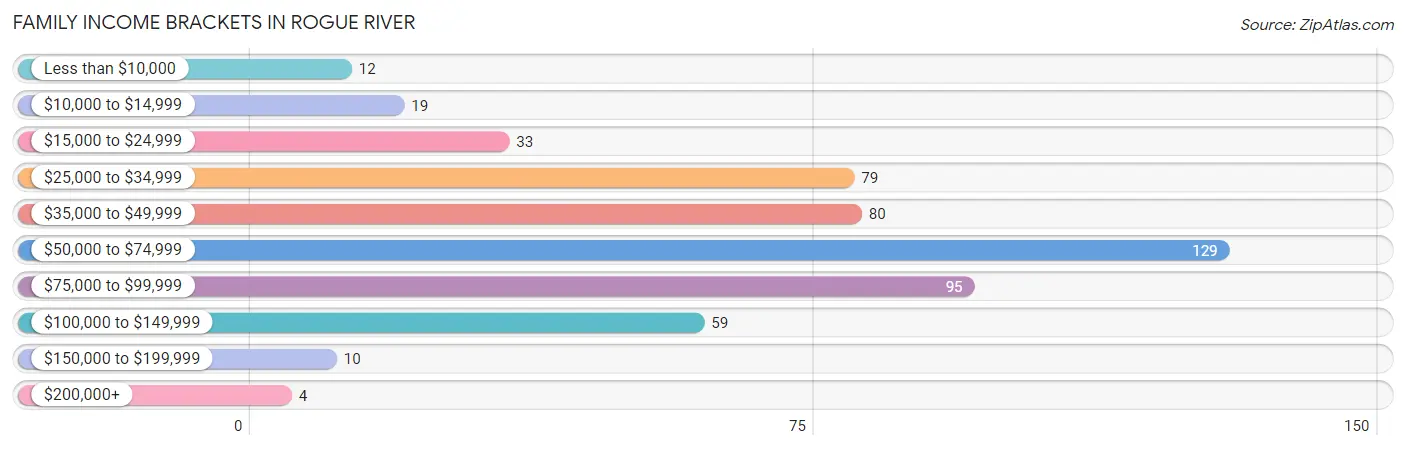
Family Income Brackets in Rogue River
According to the Rogue River family income data, there are 129 families falling into the $50,000 to $74,999 income range, which is the most common income bracket and makes up 24.8% of all families. Conversely, the $200,000+ income bracket is the least frequent group with only 4 families (0.8%) belonging to this category.
| Income Bracket | # Families | % Families |
| Less than $10,000 | 12 | 2.3% |
| $10,000 to $14,999 | 19 | 3.7% |
| $15,000 to $24,999 | 33 | 6.3% |
| $25,000 to $34,999 | 79 | 15.2% |
| $35,000 to $49,999 | 80 | 15.4% |
| $50,000 to $74,999 | 129 | 24.8% |
| $75,000 to $99,999 | 95 | 18.3% |
| $100,000 to $149,999 | 59 | 11.3% |
| $150,000 to $199,999 | 10 | 1.9% |
| $200,000+ | 4 | 0.8% |
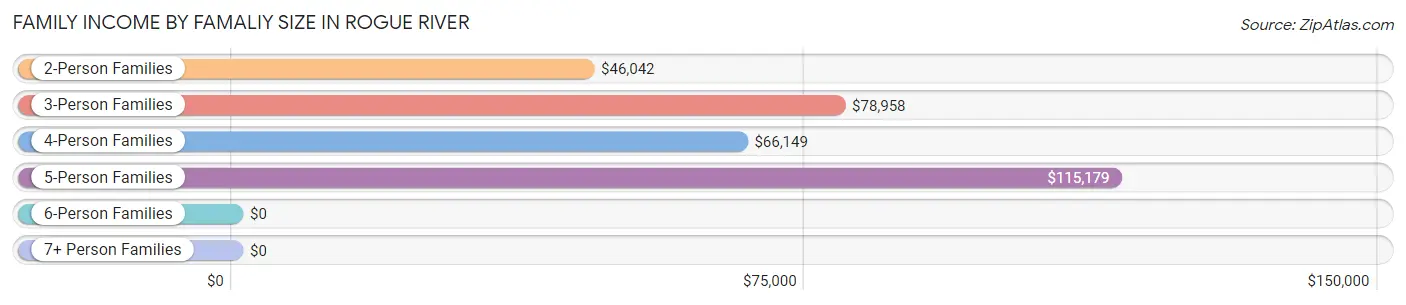
Family Income by Famaliy Size in Rogue River
5-person families (25 | 4.8%) account for the highest median family income in Rogue River with $115,179 per family, while 3-person families (79 | 15.2%) have the highest median income of $26,319 per family member.
| Income Bracket | # Families | Median Income |
| 2-Person Families | 355 (68.3%) | $46,042 |
| 3-Person Families | 79 (15.2%) | $78,958 |
| 4-Person Families | 48 (9.2%) | $66,149 |
| 5-Person Families | 25 (4.8%) | $115,179 |
| 6-Person Families | 7 (1.3%) | $0 |
| 7+ Person Families | 6 (1.1%) | $0 |
| Total | 520 (100.0%) | $65,284 |
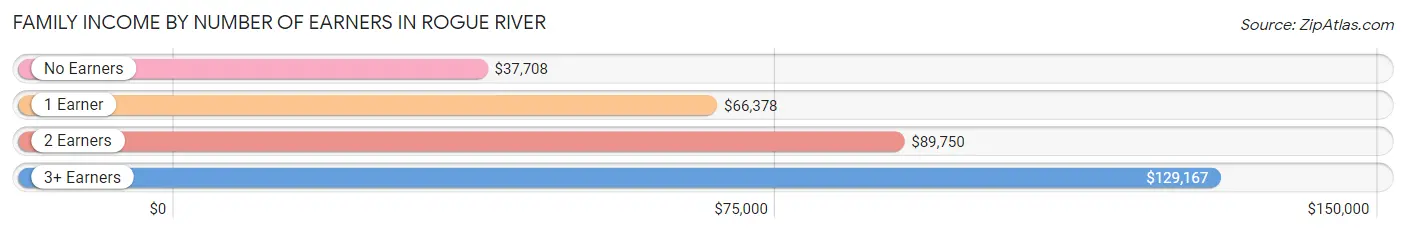
Family Income by Number of Earners in Rogue River
The median family income in Rogue River is $65,284, with families comprising 3+ earners (24) having the highest median family income of $129,167, while families with no earners (196) have the lowest median family income of $37,708, accounting for 4.6% and 37.7% of families, respectively.
| Number of Earners | # Families | Median Income |
| No Earners | 196 (37.7%) | $37,708 |
| 1 Earner | 171 (32.9%) | $66,378 |
| 2 Earners | 129 (24.8%) | $89,750 |
| 3+ Earners | 24 (4.6%) | $129,167 |
| Total | 520 (100.0%) | $65,284 |
Household Income in Rogue River
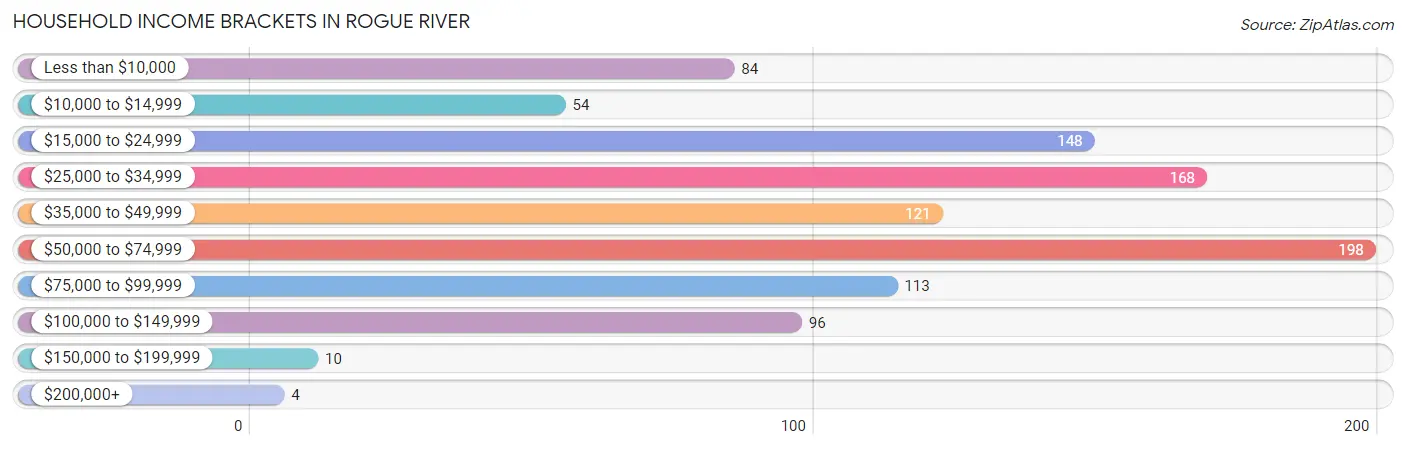
Household Income Brackets in Rogue River
With 198 households falling in the category, the $50,000 to $74,999 income range is the most frequent in Rogue River, accounting for 19.9% of all households. In contrast, only 4 households (0.4%) fall into the $200,000+ income bracket, making it the least populous group.
| Income Bracket | # Households | % Households |
| Less than $10,000 | 84 | 8.4% |
| $10,000 to $14,999 | 54 | 5.4% |
| $15,000 to $24,999 | 148 | 14.9% |
| $25,000 to $34,999 | 168 | 16.9% |
| $35,000 to $49,999 | 121 | 12.1% |
| $50,000 to $74,999 | 198 | 19.9% |
| $75,000 to $99,999 | 113 | 11.3% |
| $100,000 to $149,999 | 96 | 9.6% |
| $150,000 to $199,999 | 10 | 1.0% |
| $200,000+ | 4 | 0.4% |
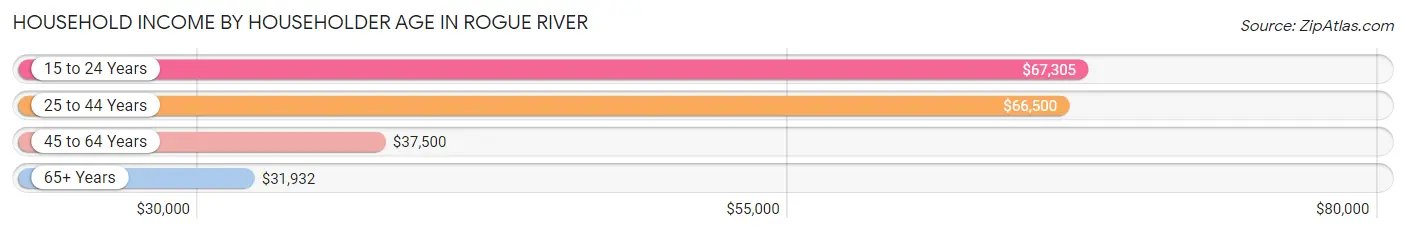
Household Income by Householder Age in Rogue River
The median household income in Rogue River is $43,929, with the highest median household income of $67,305 found in the 15 to 24 years age bracket for the primary householder. A total of 77 households (7.7%) fall into this category. Meanwhile, the 65+ years age bracket for the primary householder has the lowest median household income of $31,932, with 517 households (51.9%) in this group.
| Income Bracket | # Households | Median Income |
| 15 to 24 Years | 77 (7.7%) | $67,305 |
| 25 to 44 Years | 144 (14.5%) | $66,500 |
| 45 to 64 Years | 258 (25.9%) | $37,500 |
| 65+ Years | 517 (51.9%) | $31,932 |
| Total | 996 (100.0%) | $43,929 |
Poverty in Rogue River
Income Below Poverty by Sex and Age in Rogue River
With 13.4% poverty level for males and 17.0% for females among the residents of Rogue River, 15 year old males and 55 to 64 year old females are the most vulnerable to poverty, with 16 males (100.0%) and 73 females (45.6%) in their respective age groups living below the poverty level.
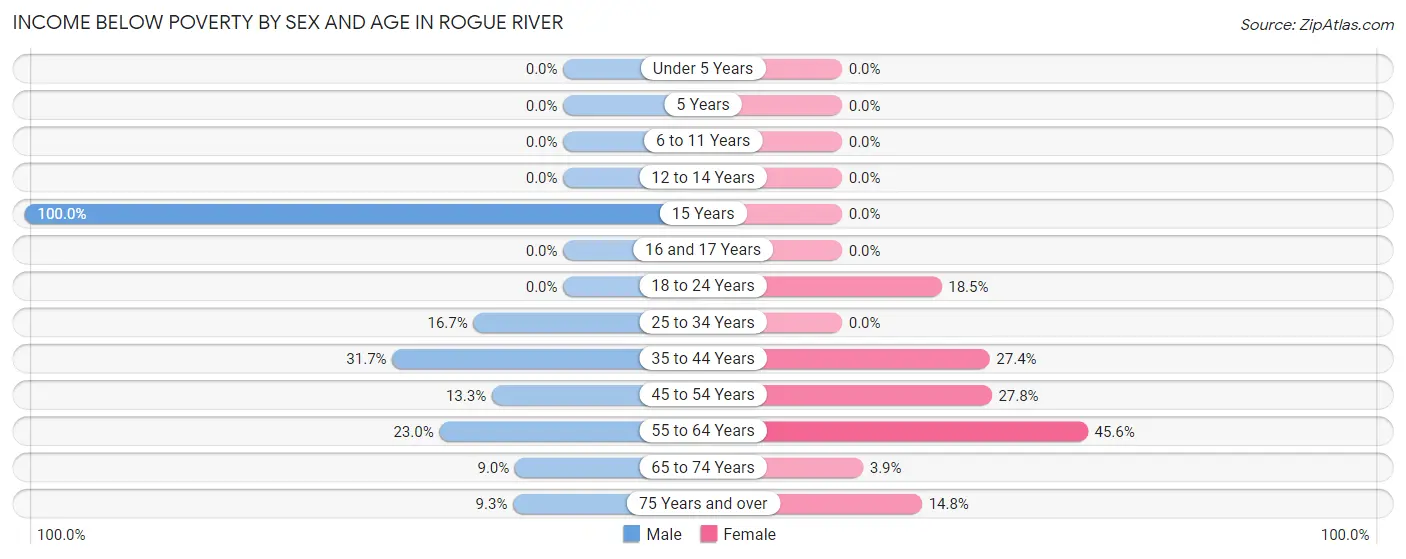
| Age Bracket | Male | Female |
| Under 5 Years | 0 (0.0%) | 0 (0.0%) |
| 5 Years | 0 (0.0%) | 0 (0.0%) |
| 6 to 11 Years | 0 (0.0%) | 0 (0.0%) |
| 12 to 14 Years | 0 (0.0%) | 0 (0.0%) |
| 15 Years | 16 (100.0%) | 0 (0.0%) |
| 16 and 17 Years | 0 (0.0%) | 0 (0.0%) |
| 18 to 24 Years | 0 (0.0%) | 29 (18.5%) |
| 25 to 34 Years | 17 (16.7%) | 0 (0.0%) |
| 35 to 44 Years | 33 (31.7%) | 20 (27.4%) |
| 45 to 54 Years | 11 (13.3%) | 15 (27.8%) |
| 55 to 64 Years | 20 (23.0%) | 73 (45.6%) |
| 65 to 74 Years | 17 (8.9%) | 6 (3.9%) |
| 75 Years and over | 16 (9.3%) | 31 (14.8%) |
| Total | 130 (13.4%) | 174 (17.0%) |
Income Above Poverty by Sex and Age in Rogue River
According to the poverty statistics in Rogue River, males aged under 5 years and females aged under 5 years are the age groups that are most secure financially, with 100.0% of males and 100.0% of females in these age groups living above the poverty line.
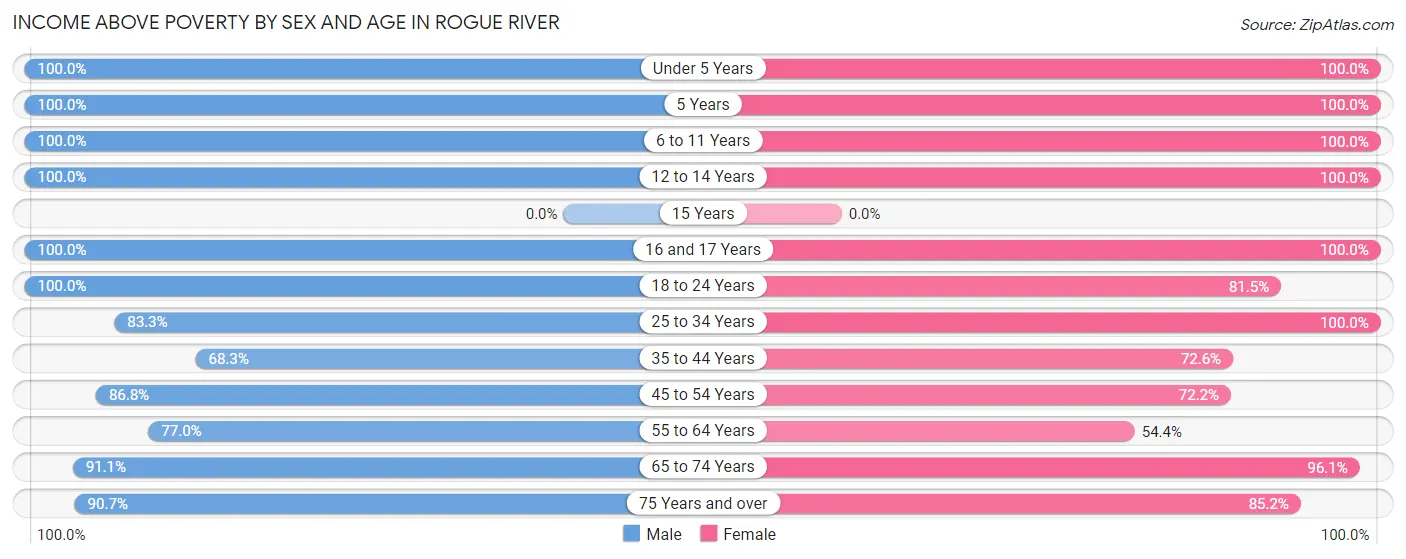
| Age Bracket | Male | Female |
| Under 5 Years | 8 (100.0%) | 52 (100.0%) |
| 5 Years | 15 (100.0%) | 8 (100.0%) |
| 6 to 11 Years | 69 (100.0%) | 78 (100.0%) |
| 12 to 14 Years | 38 (100.0%) | 27 (100.0%) |
| 15 Years | 0 (0.0%) | 0 (0.0%) |
| 16 and 17 Years | 28 (100.0%) | 6 (100.0%) |
| 18 to 24 Years | 61 (100.0%) | 128 (81.5%) |
| 25 to 34 Years | 85 (83.3%) | 46 (100.0%) |
| 35 to 44 Years | 71 (68.3%) | 53 (72.6%) |
| 45 to 54 Years | 72 (86.8%) | 39 (72.2%) |
| 55 to 64 Years | 67 (77.0%) | 87 (54.4%) |
| 65 to 74 Years | 173 (91.0%) | 148 (96.1%) |
| 75 Years and over | 156 (90.7%) | 178 (85.2%) |
| Total | 843 (86.6%) | 850 (83.0%) |
Income Below Poverty Among Married-Couple Families in Rogue River
The poverty statistics for married-couple families in Rogue River show that 4.5% or 16 of the total 359 families live below the poverty line. Families with 1 or 2 children have the highest poverty rate of 7.0%, comprising of 7 families. On the other hand, families with 3 or 4 children have the lowest poverty rate of 0.0%, which includes 0 families.
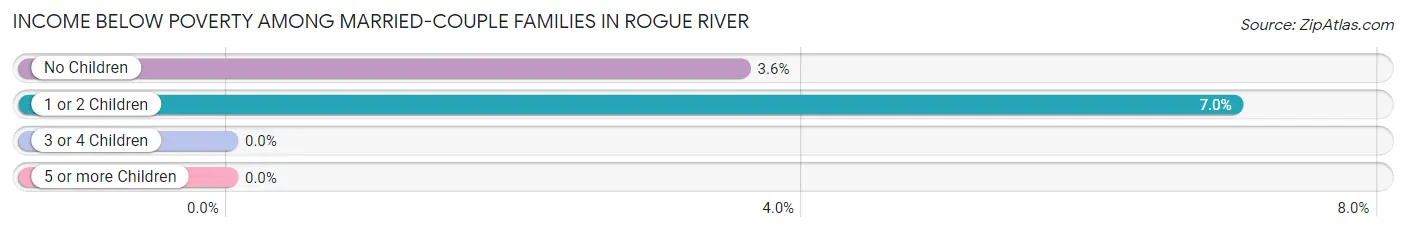
| Children | Above Poverty | Below Poverty |
| No Children | 243 (96.4%) | 9 (3.6%) |
| 1 or 2 Children | 93 (93.0%) | 7 (7.0%) |
| 3 or 4 Children | 7 (100.0%) | 0 (0.0%) |
| 5 or more Children | 0 (0.0%) | 0 (0.0%) |
| Total | 343 (95.5%) | 16 (4.5%) |
Income Below Poverty Among Single-Parent Households in Rogue River
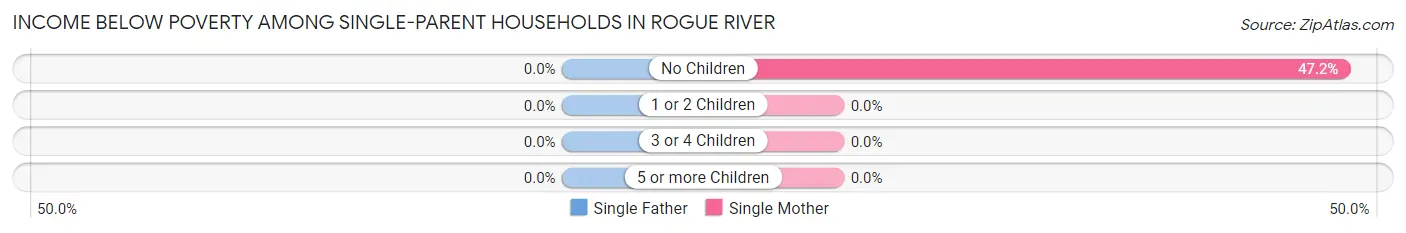
| Children | Single Father | Single Mother |
| No Children | 0 (0.0%) | 25 (47.2%) |
| 1 or 2 Children | 0 (0.0%) | 0 (0.0%) |
| 3 or 4 Children | 0 (0.0%) | 0 (0.0%) |
| 5 or more Children | 0 (0.0%) | 0 (0.0%) |
| Total | 0 (0.0%) | 25 (28.7%) |
Income Below Poverty Among Married-Couple vs Single-Parent Households in Rogue River
The poverty data for Rogue River shows that 16 of the married-couple family households (4.5%) and 25 of the single-parent households (15.5%) are living below the poverty level. Within the married-couple family households, those with 1 or 2 children have the highest poverty rate, with 7 households (7.0%) falling below the poverty line. Among the single-parent households, those with no children have the highest poverty rate, with 25 household (29.4%) living below poverty.
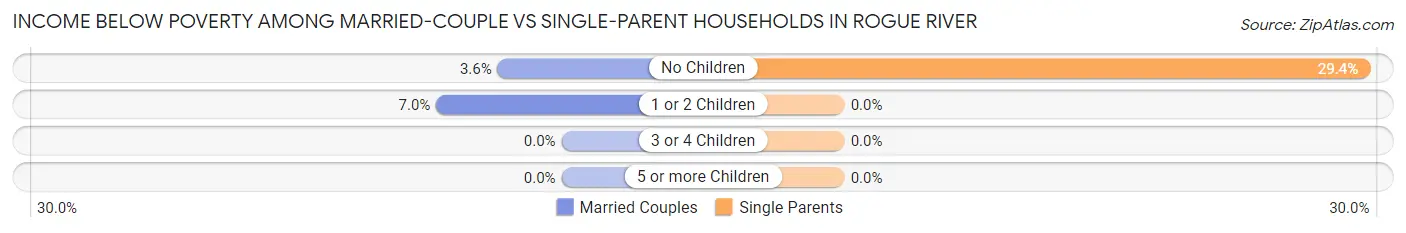
| Children | Married-Couple Families | Single-Parent Households |
| No Children | 9 (3.6%) | 25 (29.4%) |
| 1 or 2 Children | 7 (7.0%) | 0 (0.0%) |
| 3 or 4 Children | 0 (0.0%) | 0 (0.0%) |
| 5 or more Children | 0 (0.0%) | 0 (0.0%) |
| Total | 16 (4.5%) | 25 (15.5%) |
Employment Characteristics in Rogue River
Employment by Class of Employer in Rogue River
Among the 564 employed individuals in Rogue River, private company employees (412 | 73.1%), self-employed (not incorporated) (70 | 12.4%), and not-for-profit organizations (30 | 5.3%) make up the most common classes of employment.
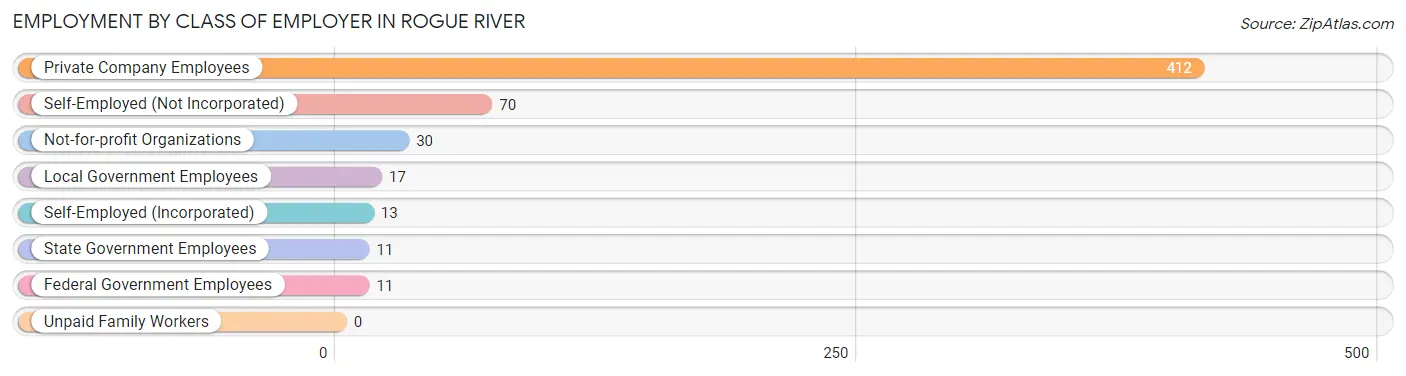
| Employer Class | # Employees | % Employees |
| Private Company Employees | 412 | 73.1% |
| Self-Employed (Incorporated) | 13 | 2.3% |
| Self-Employed (Not Incorporated) | 70 | 12.4% |
| Not-for-profit Organizations | 30 | 5.3% |
| Local Government Employees | 17 | 3.0% |
| State Government Employees | 11 | 1.9% |
| Federal Government Employees | 11 | 1.9% |
| Unpaid Family Workers | 0 | 0.0% |
| Total | 564 | 100.0% |
Employment Status by Age in Rogue River
According to the labor force statistics for Rogue River, out of the total population over 16 years of age (1,686), 38.8% or 654 individuals are in the labor force, with 12.2% or 80 of them unemployed. The age group with the highest labor force participation rate is 16 to 19 years, with 77.1% or 81 individuals in the labor force. Within the labor force, the 35 to 44 years age range has the highest percentage of unemployed individuals, with 27.8% or 30 of them being unemployed.
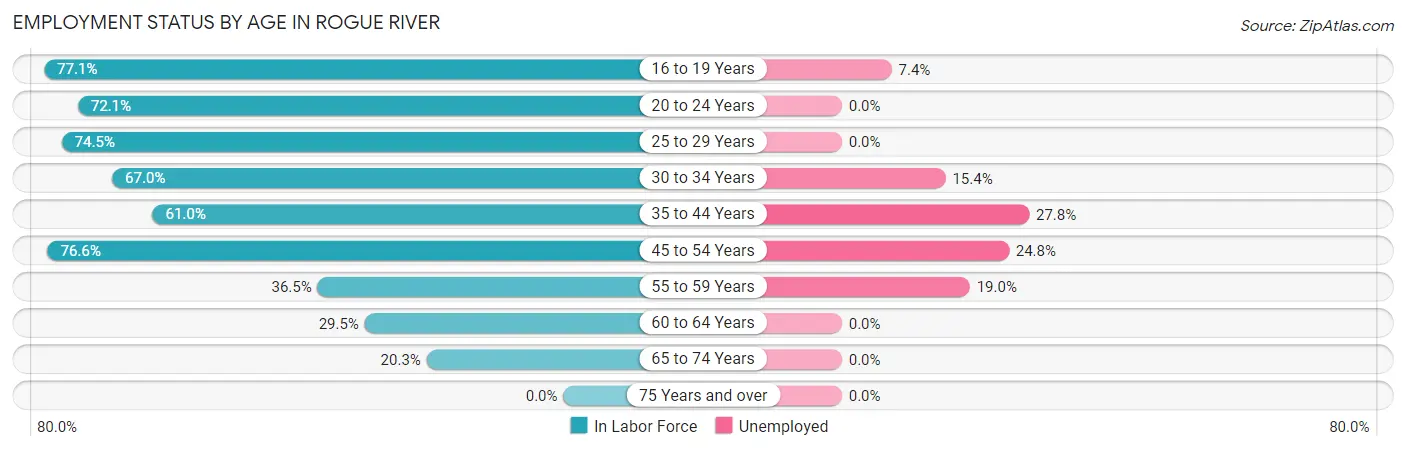
| Age Bracket | In Labor Force | Unemployed |
| 16 to 19 Years | 81 (77.1%) | 6 (7.4%) |
| 20 to 24 Years | 106 (72.1%) | 0 (0.0%) |
| 25 to 29 Years | 38 (74.5%) | 0 (0.0%) |
| 30 to 34 Years | 65 (67.0%) | 10 (15.4%) |
| 35 to 44 Years | 108 (61.0%) | 30 (27.8%) |
| 45 to 54 Years | 105 (76.6%) | 26 (24.8%) |
| 55 to 59 Years | 42 (36.5%) | 8 (19.0%) |
| 60 to 64 Years | 39 (29.5%) | 0 (0.0%) |
| 65 to 74 Years | 70 (20.3%) | 0 (0.0%) |
| 75 Years and over | 0 (0.0%) | 0 (0.0%) |
| Total | 654 (38.8%) | 80 (12.2%) |
Employment Status by Educational Attainment in Rogue River
According to labor force statistics for Rogue River, 56.0% of individuals (397) out of the total population between 25 and 64 years of age (709) are in the labor force, with 18.6% or 74 of them being unemployed. The group with the highest labor force participation rate are those with the educational attainment of bachelor's degree or higher, with 68.1% or 64 individuals in the labor force. Within the labor force, individuals with less than high school education have the highest percentage of unemployment, with 44.0% or 11 of them being unemployed.
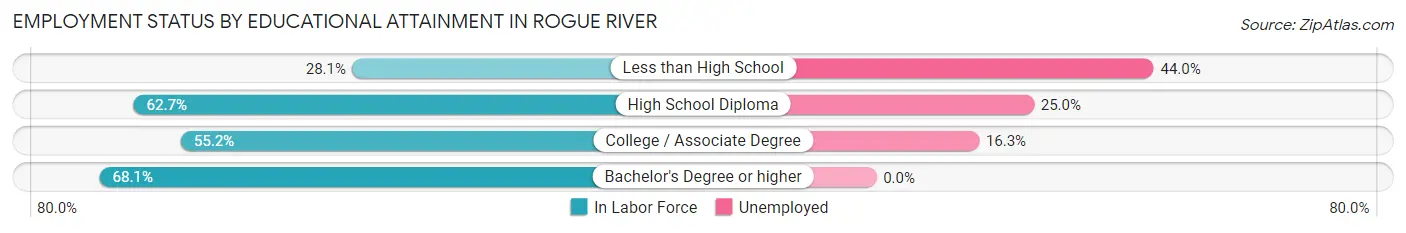
| Educational Attainment | In Labor Force | Unemployed |
| Less than High School | 25 (28.1%) | 39 (44.0%) |
| High School Diploma | 148 (62.7%) | 59 (25.0%) |
| College / Associate Degree | 160 (55.2%) | 47 (16.3%) |
| Bachelor's Degree or higher | 64 (68.1%) | 0 (0.0%) |
| Total | 397 (56.0%) | 132 (18.6%) |
Employment Occupations by Sex in Rogue River
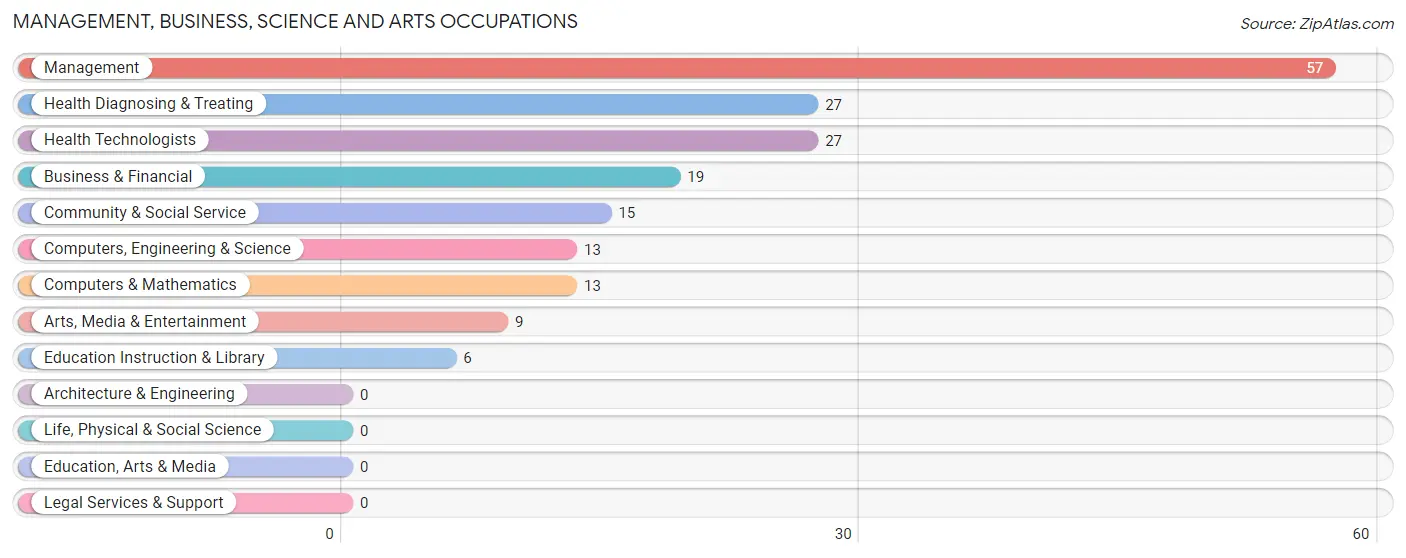
Management, Business, Science and Arts Occupations
The most common Management, Business, Science and Arts occupations in Rogue River are Management (57 | 9.9%), Health Diagnosing & Treating (27 | 4.7%), Health Technologists (27 | 4.7%), Business & Financial (19 | 3.3%), and Community & Social Service (15 | 2.6%).
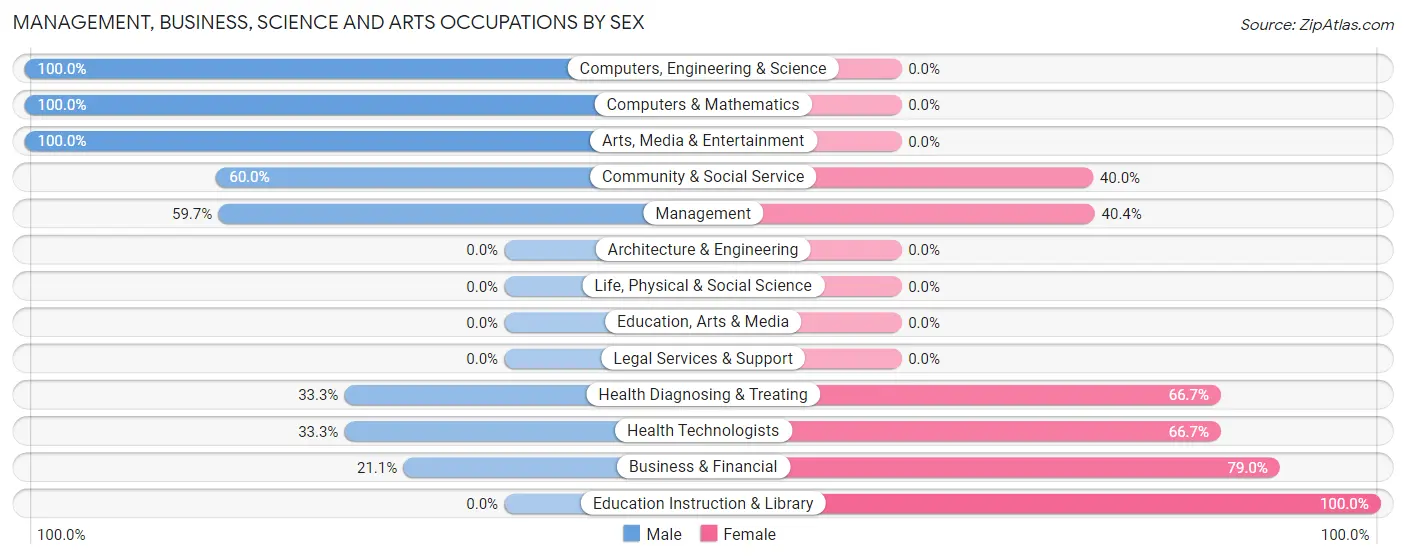
Management, Business, Science and Arts Occupations by Sex
Within the Management, Business, Science and Arts occupations in Rogue River, the most male-oriented occupations are Computers, Engineering & Science (100.0%), Computers & Mathematics (100.0%), and Arts, Media & Entertainment (100.0%), while the most female-oriented occupations are Education Instruction & Library (100.0%), Business & Financial (78.9%), and Health Diagnosing & Treating (66.7%).
| Occupation | Male | Female |
| Management | 34 (59.7%) | 23 (40.4%) |
| Business & Financial | 4 (21.0%) | 15 (78.9%) |
| Computers, Engineering & Science | 13 (100.0%) | 0 (0.0%) |
| Computers & Mathematics | 13 (100.0%) | 0 (0.0%) |
| Architecture & Engineering | 0 (0.0%) | 0 (0.0%) |
| Life, Physical & Social Science | 0 (0.0%) | 0 (0.0%) |
| Community & Social Service | 9 (60.0%) | 6 (40.0%) |
| Education, Arts & Media | 0 (0.0%) | 0 (0.0%) |
| Legal Services & Support | 0 (0.0%) | 0 (0.0%) |
| Education Instruction & Library | 0 (0.0%) | 6 (100.0%) |
| Arts, Media & Entertainment | 9 (100.0%) | 0 (0.0%) |
| Health Diagnosing & Treating | 9 (33.3%) | 18 (66.7%) |
| Health Technologists | 9 (33.3%) | 18 (66.7%) |
| Total (Category) | 69 (52.7%) | 62 (47.3%) |
| Total (Overall) | 295 (51.4%) | 279 (48.6%) |
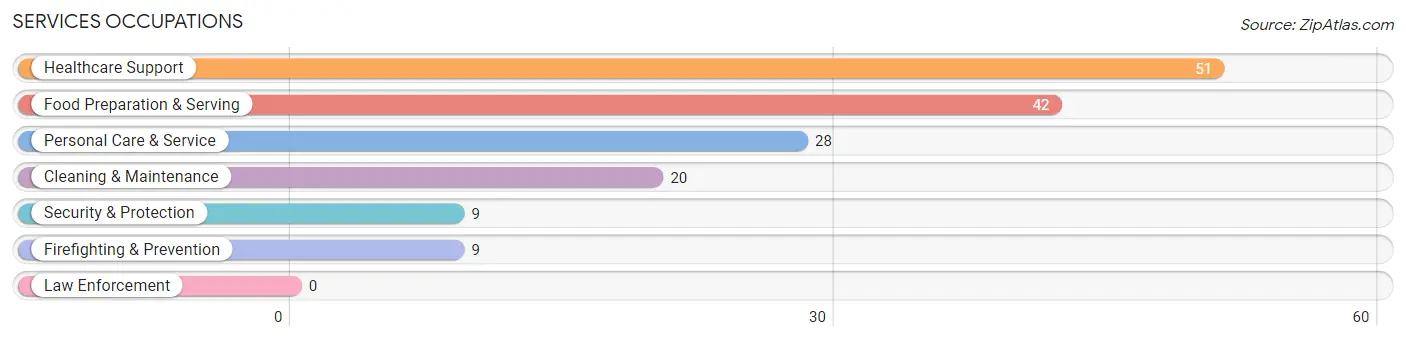
Services Occupations
The most common Services occupations in Rogue River are Healthcare Support (51 | 8.9%), Food Preparation & Serving (42 | 7.3%), Personal Care & Service (28 | 4.9%), Cleaning & Maintenance (20 | 3.5%), and Security & Protection (9 | 1.6%).
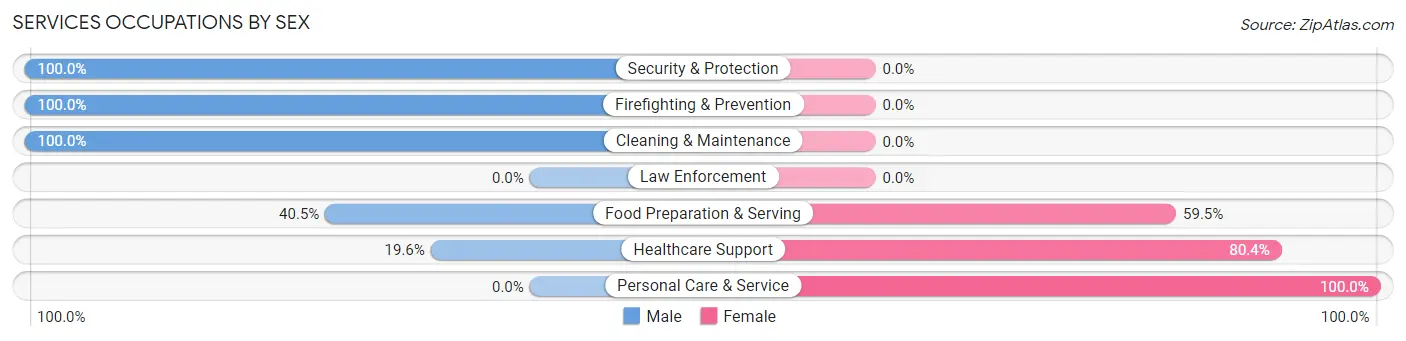
Services Occupations by Sex
Within the Services occupations in Rogue River, the most male-oriented occupations are Security & Protection (100.0%), Firefighting & Prevention (100.0%), and Cleaning & Maintenance (100.0%), while the most female-oriented occupations are Personal Care & Service (100.0%), Healthcare Support (80.4%), and Food Preparation & Serving (59.5%).
| Occupation | Male | Female |
| Healthcare Support | 10 (19.6%) | 41 (80.4%) |
| Security & Protection | 9 (100.0%) | 0 (0.0%) |
| Firefighting & Prevention | 9 (100.0%) | 0 (0.0%) |
| Law Enforcement | 0 (0.0%) | 0 (0.0%) |
| Food Preparation & Serving | 17 (40.5%) | 25 (59.5%) |
| Cleaning & Maintenance | 20 (100.0%) | 0 (0.0%) |
| Personal Care & Service | 0 (0.0%) | 28 (100.0%) |
| Total (Category) | 56 (37.3%) | 94 (62.7%) |
| Total (Overall) | 295 (51.4%) | 279 (48.6%) |
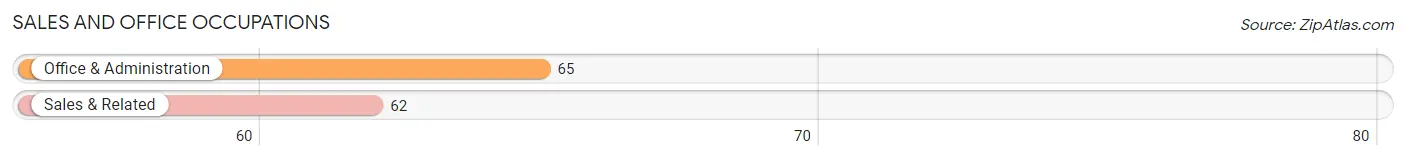
Sales and Office Occupations
The most common Sales and Office occupations in Rogue River are Office & Administration (65 | 11.3%), and Sales & Related (62 | 10.8%).
Sales and Office Occupations by Sex
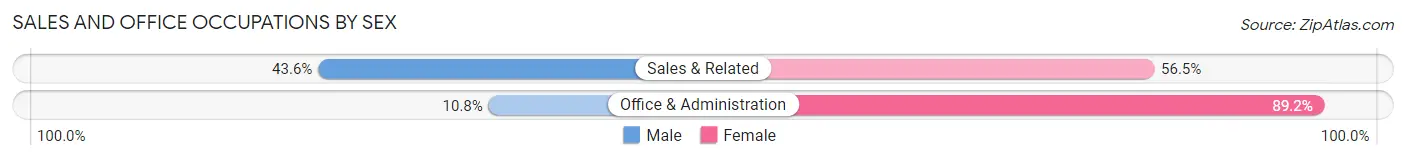
| Occupation | Male | Female |
| Sales & Related | 27 (43.5%) | 35 (56.5%) |
| Office & Administration | 7 (10.8%) | 58 (89.2%) |
| Total (Category) | 34 (26.8%) | 93 (73.2%) |
| Total (Overall) | 295 (51.4%) | 279 (48.6%) |
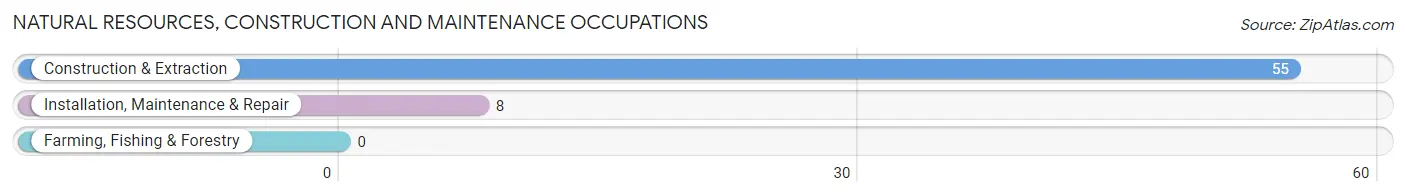
Natural Resources, Construction and Maintenance Occupations
The most common Natural Resources, Construction and Maintenance occupations in Rogue River are Construction & Extraction (55 | 9.6%), and Installation, Maintenance & Repair (8 | 1.4%).
Natural Resources, Construction and Maintenance Occupations by Sex
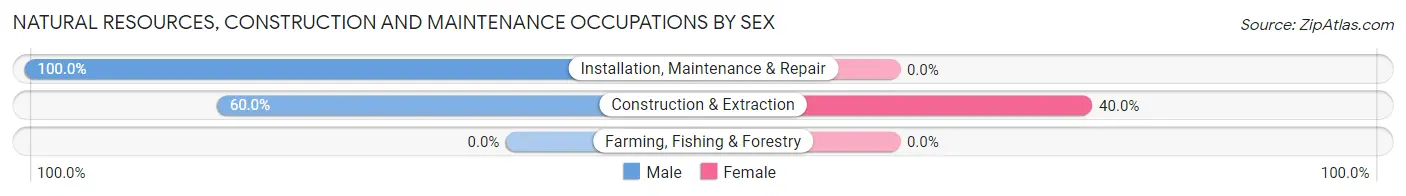
| Occupation | Male | Female |
| Farming, Fishing & Forestry | 0 (0.0%) | 0 (0.0%) |
| Construction & Extraction | 33 (60.0%) | 22 (40.0%) |
| Installation, Maintenance & Repair | 8 (100.0%) | 0 (0.0%) |
| Total (Category) | 41 (65.1%) | 22 (34.9%) |
| Total (Overall) | 295 (51.4%) | 279 (48.6%) |
Production, Transportation and Moving Occupations
The most common Production, Transportation and Moving occupations in Rogue River are Production (61 | 10.6%), and Transportation (42 | 7.3%).
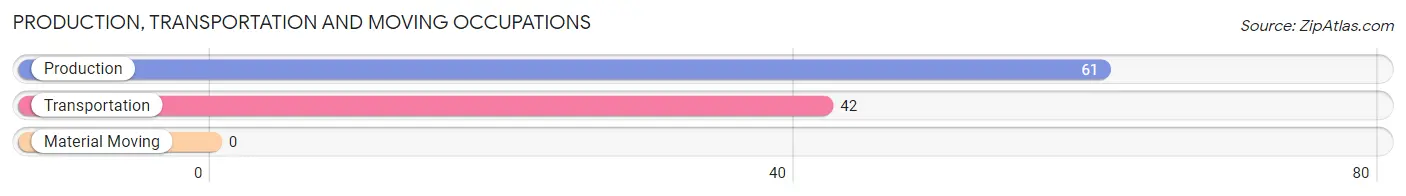
Production, Transportation and Moving Occupations by Sex
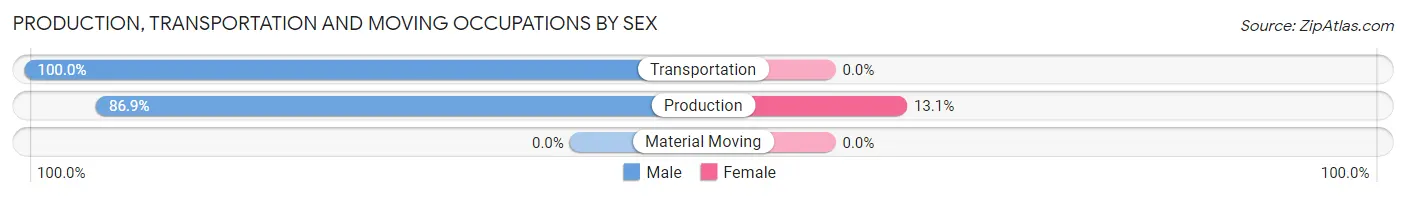
| Occupation | Male | Female |
| Production | 53 (86.9%) | 8 (13.1%) |
| Transportation | 42 (100.0%) | 0 (0.0%) |
| Material Moving | 0 (0.0%) | 0 (0.0%) |
| Total (Category) | 95 (92.2%) | 8 (7.8%) |
| Total (Overall) | 295 (51.4%) | 279 (48.6%) |
Employment Industries by Sex in Rogue River
Employment Industries in Rogue River
The major employment industries in Rogue River include Retail Trade (127 | 22.1%), Health Care & Social Assistance (95 | 16.6%), Transportation & Warehousing (50 | 8.7%), Construction (46 | 8.0%), and Accommodation & Food Services (42 | 7.3%).

Employment Industries by Sex in Rogue River
The Rogue River industries that see more men than women are Agriculture, Fishing & Hunting (100.0%), Wholesale Trade (100.0%), and Administrative & Support (100.0%), whereas the industries that tend to have a higher number of women are Finance & Insurance (100.0%), Public Administration (100.0%), and Health Care & Social Assistance (84.2%).
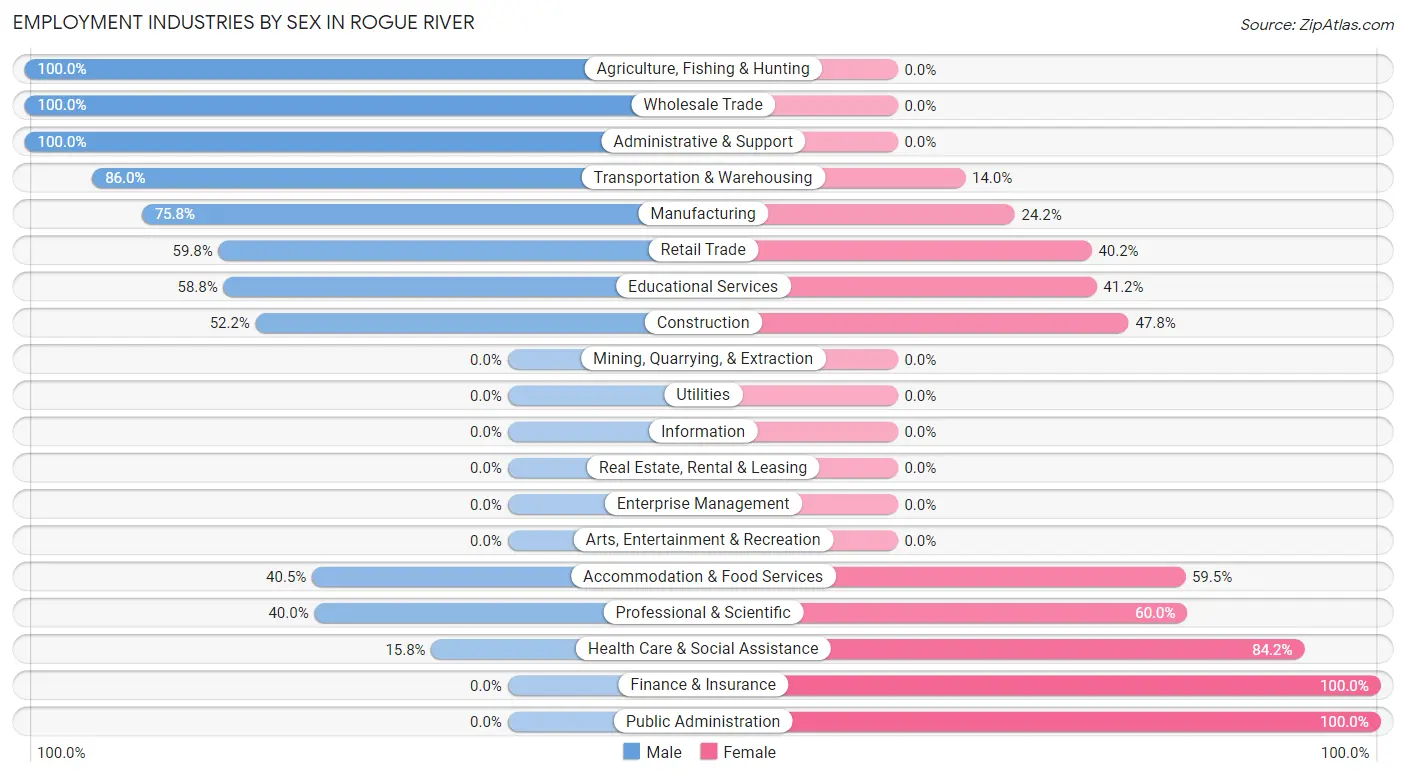
| Industry | Male | Female |
| Agriculture, Fishing & Hunting | 18 (100.0%) | 0 (0.0%) |
| Mining, Quarrying, & Extraction | 0 (0.0%) | 0 (0.0%) |
| Construction | 24 (52.2%) | 22 (47.8%) |
| Manufacturing | 25 (75.8%) | 8 (24.2%) |
| Wholesale Trade | 8 (100.0%) | 0 (0.0%) |
| Retail Trade | 76 (59.8%) | 51 (40.2%) |
| Transportation & Warehousing | 43 (86.0%) | 7 (14.0%) |
| Utilities | 0 (0.0%) | 0 (0.0%) |
| Information | 0 (0.0%) | 0 (0.0%) |
| Finance & Insurance | 0 (0.0%) | 11 (100.0%) |
| Real Estate, Rental & Leasing | 0 (0.0%) | 0 (0.0%) |
| Professional & Scientific | 4 (40.0%) | 6 (60.0%) |
| Enterprise Management | 0 (0.0%) | 0 (0.0%) |
| Administrative & Support | 15 (100.0%) | 0 (0.0%) |
| Educational Services | 10 (58.8%) | 7 (41.2%) |
| Health Care & Social Assistance | 15 (15.8%) | 80 (84.2%) |
| Arts, Entertainment & Recreation | 0 (0.0%) | 0 (0.0%) |
| Accommodation & Food Services | 17 (40.5%) | 25 (59.5%) |
| Public Administration | 0 (0.0%) | 28 (100.0%) |
| Total | 295 (51.4%) | 279 (48.6%) |
Education in Rogue River
School Enrollment in Rogue River
The most common levels of schooling among the 323 students in Rogue River are middle school (117 | 36.2%), elementary school (81 | 25.1%), and high school (53 | 16.4%).
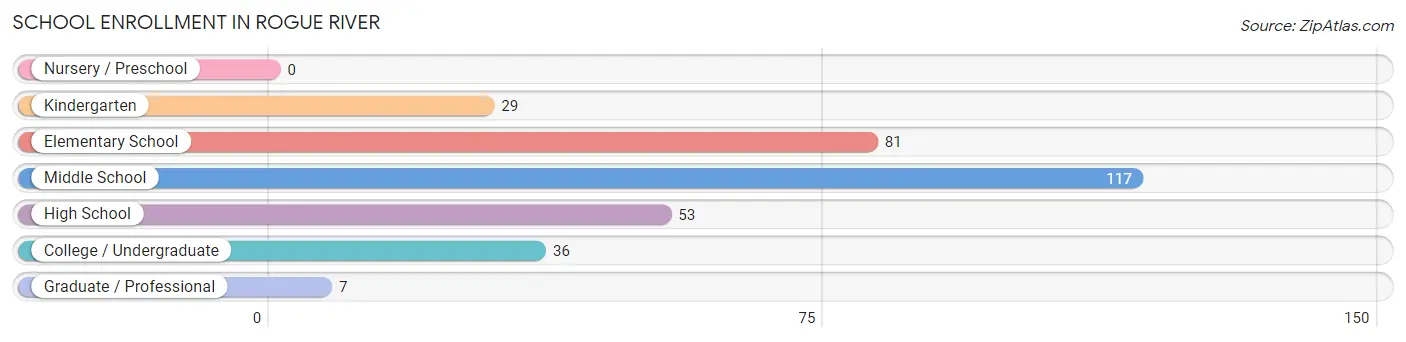
| School Level | # Students | % Students |
| Nursery / Preschool | 0 | 0.0% |
| Kindergarten | 29 | 9.0% |
| Elementary School | 81 | 25.1% |
| Middle School | 117 | 36.2% |
| High School | 53 | 16.4% |
| College / Undergraduate | 36 | 11.2% |
| Graduate / Professional | 7 | 2.2% |
| Total | 323 | 100.0% |
School Enrollment by Age by Funding Source in Rogue River
Out of a total of 323 students who are enrolled in schools in Rogue River, 33 (10.2%) attend a private institution, while the remaining 290 (89.8%) are enrolled in public schools. The age group of 15 to 17 year olds has the highest likelihood of being enrolled in private schools, with 9 (18.0% in the age bracket) enrolled. Conversely, the age group of 20 to 24 year olds has the lowest likelihood of being enrolled in a private school, with 17 (100.0% in the age bracket) attending a public institution.
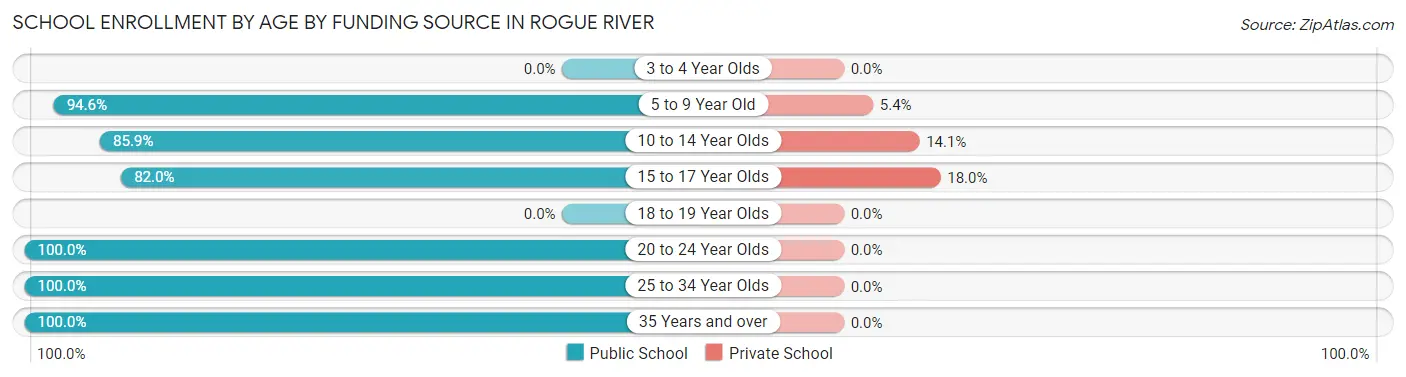
| Age Bracket | Public School | Private School |
| 3 to 4 Year Olds | 0 (0.0%) | 0 (0.0%) |
| 5 to 9 Year Old | 87 (94.6%) | 5 (5.4%) |
| 10 to 14 Year Olds | 116 (85.9%) | 19 (14.1%) |
| 15 to 17 Year Olds | 41 (82.0%) | 9 (18.0%) |
| 18 to 19 Year Olds | 0 (0.0%) | 0 (0.0%) |
| 20 to 24 Year Olds | 17 (100.0%) | 0 (0.0%) |
| 25 to 34 Year Olds | 5 (100.0%) | 0 (0.0%) |
| 35 Years and over | 24 (100.0%) | 0 (0.0%) |
| Total | 290 (89.8%) | 33 (10.2%) |
Educational Attainment by Field of Study in Rogue River
Business (78 | 30.1%), science & technology (40 | 15.4%), social sciences (24 | 9.3%), education (22 | 8.5%), and bio, nature & agricultural (15 | 5.8%) are the most common fields of study among 259 individuals in Rogue River who have obtained a bachelor's degree or higher.
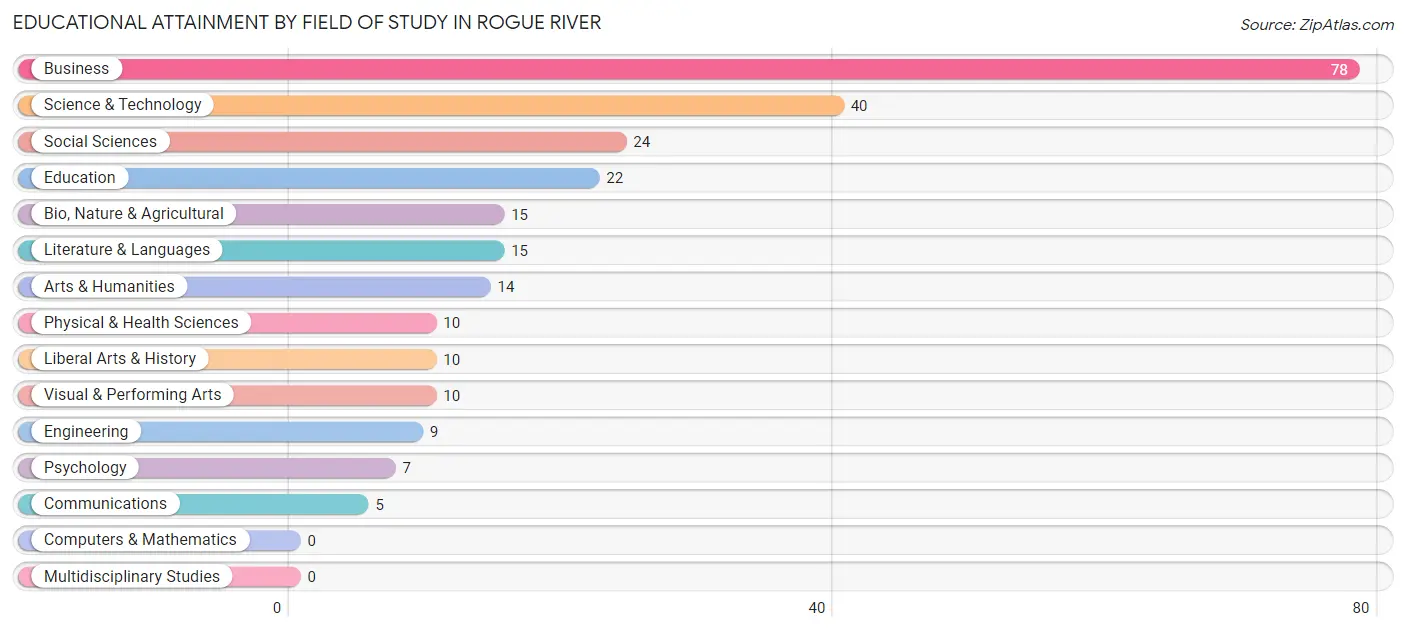
| Field of Study | # Graduates | % Graduates |
| Computers & Mathematics | 0 | 0.0% |
| Bio, Nature & Agricultural | 15 | 5.8% |
| Physical & Health Sciences | 10 | 3.9% |
| Psychology | 7 | 2.7% |
| Social Sciences | 24 | 9.3% |
| Engineering | 9 | 3.5% |
| Multidisciplinary Studies | 0 | 0.0% |
| Science & Technology | 40 | 15.4% |
| Business | 78 | 30.1% |
| Education | 22 | 8.5% |
| Literature & Languages | 15 | 5.8% |
| Liberal Arts & History | 10 | 3.9% |
| Visual & Performing Arts | 10 | 3.9% |
| Communications | 5 | 1.9% |
| Arts & Humanities | 14 | 5.4% |
| Total | 259 | 100.0% |
Transportation & Commute in Rogue River
Vehicle Availability by Sex in Rogue River
The most prevalent vehicle ownership categories in Rogue River are males with 2 vehicles (166, accounting for 57.0%) and females with 2 vehicles (128, making up 60.8%).
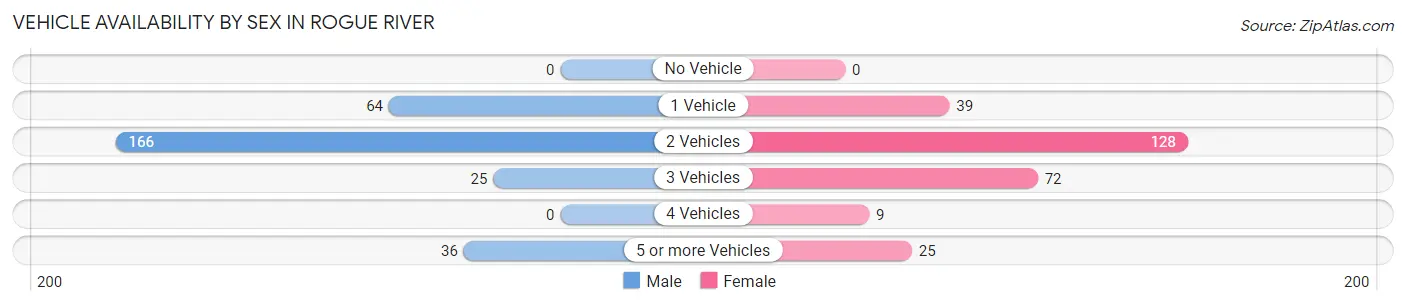
| Vehicles Available | Male | Female |
| No Vehicle | 0 (0.0%) | 0 (0.0%) |
| 1 Vehicle | 64 (22.0%) | 39 (14.3%) |
| 2 Vehicles | 166 (57.0%) | 128 (46.9%) |
| 3 Vehicles | 25 (8.6%) | 72 (26.4%) |
| 4 Vehicles | 0 (0.0%) | 9 (3.3%) |
| 5 or more Vehicles | 36 (12.4%) | 25 (9.2%) |
| Total | 291 (100.0%) | 273 (100.0%) |
Commute Time in Rogue River
The most frequently occuring commute durations in Rogue River are 30 to 34 minutes (131 commuters, 27.0%), 25 to 29 minutes (80 commuters, 16.5%), and 10 to 14 minutes (76 commuters, 15.6%).
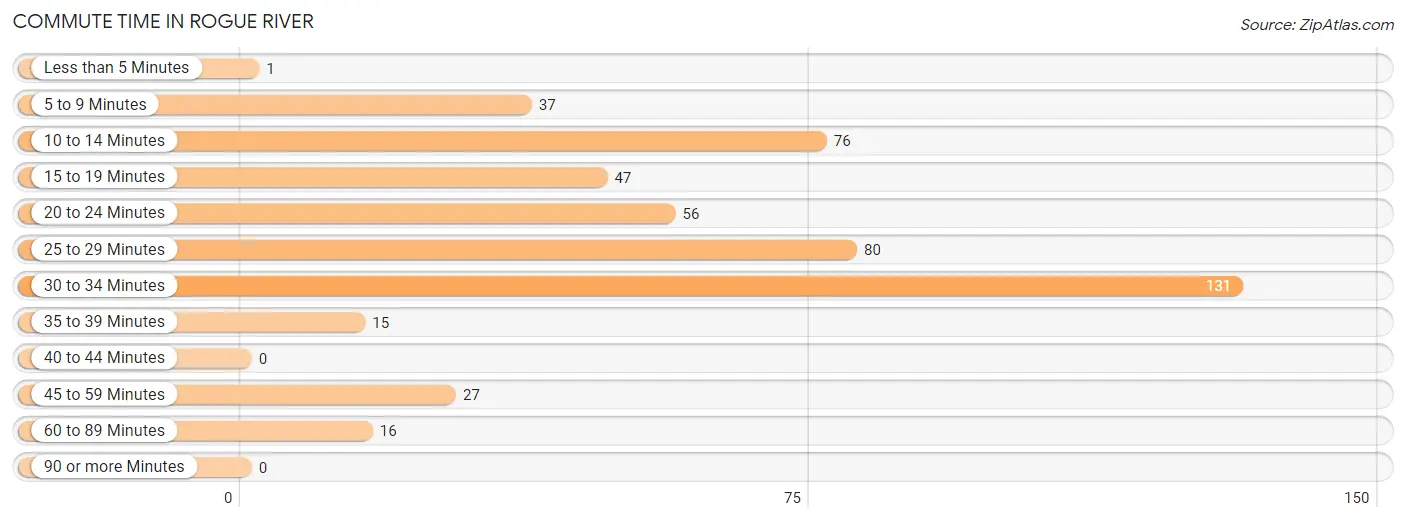
| Commute Time | # Commuters | % Commuters |
| Less than 5 Minutes | 1 | 0.2% |
| 5 to 9 Minutes | 37 | 7.6% |
| 10 to 14 Minutes | 76 | 15.6% |
| 15 to 19 Minutes | 47 | 9.7% |
| 20 to 24 Minutes | 56 | 11.5% |
| 25 to 29 Minutes | 80 | 16.5% |
| 30 to 34 Minutes | 131 | 27.0% |
| 35 to 39 Minutes | 15 | 3.1% |
| 40 to 44 Minutes | 0 | 0.0% |
| 45 to 59 Minutes | 27 | 5.6% |
| 60 to 89 Minutes | 16 | 3.3% |
| 90 or more Minutes | 0 | 0.0% |
Commute Time by Sex in Rogue River
The most common commute times in Rogue River are 30 to 34 minutes (106 commuters, 36.4%) for males and 25 to 29 minutes (48 commuters, 24.6%) for females.
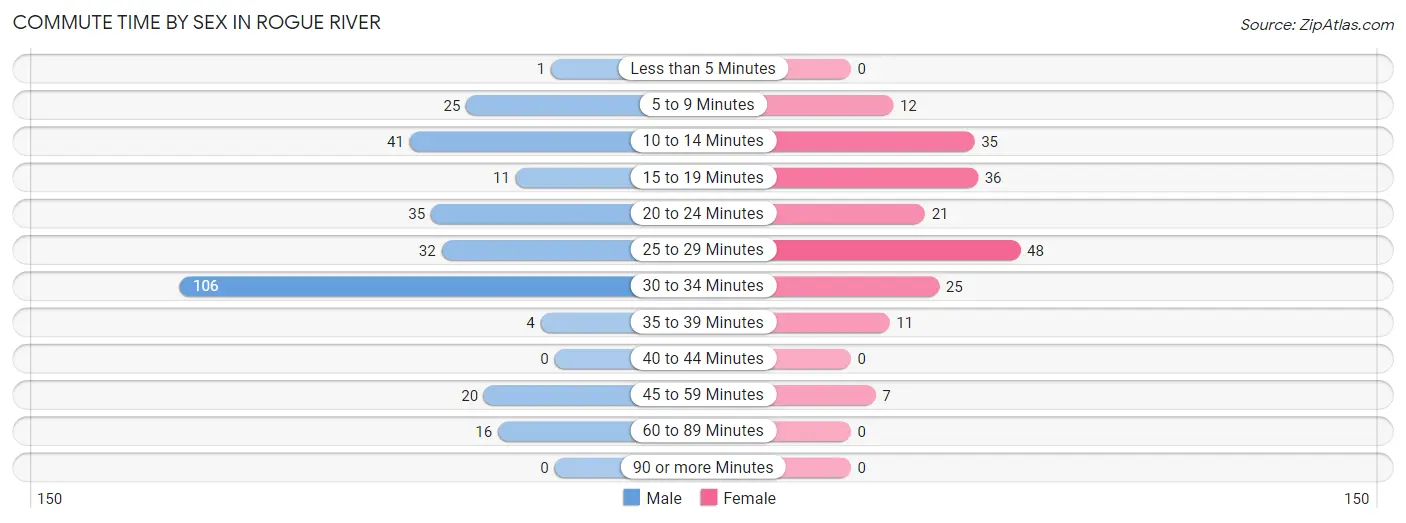
| Commute Time | Male | Female |
| Less than 5 Minutes | 1 (0.3%) | 0 (0.0%) |
| 5 to 9 Minutes | 25 (8.6%) | 12 (6.1%) |
| 10 to 14 Minutes | 41 (14.1%) | 35 (17.9%) |
| 15 to 19 Minutes | 11 (3.8%) | 36 (18.5%) |
| 20 to 24 Minutes | 35 (12.0%) | 21 (10.8%) |
| 25 to 29 Minutes | 32 (11.0%) | 48 (24.6%) |
| 30 to 34 Minutes | 106 (36.4%) | 25 (12.8%) |
| 35 to 39 Minutes | 4 (1.4%) | 11 (5.6%) |
| 40 to 44 Minutes | 0 (0.0%) | 0 (0.0%) |
| 45 to 59 Minutes | 20 (6.9%) | 7 (3.6%) |
| 60 to 89 Minutes | 16 (5.5%) | 0 (0.0%) |
| 90 or more Minutes | 0 (0.0%) | 0 (0.0%) |
Time of Departure to Work by Sex in Rogue River
The most frequent times of departure to work in Rogue River are 6:00 AM to 6:29 AM (93, 32.0%) for males and 6:00 AM to 6:29 AM (44, 22.6%) for females.
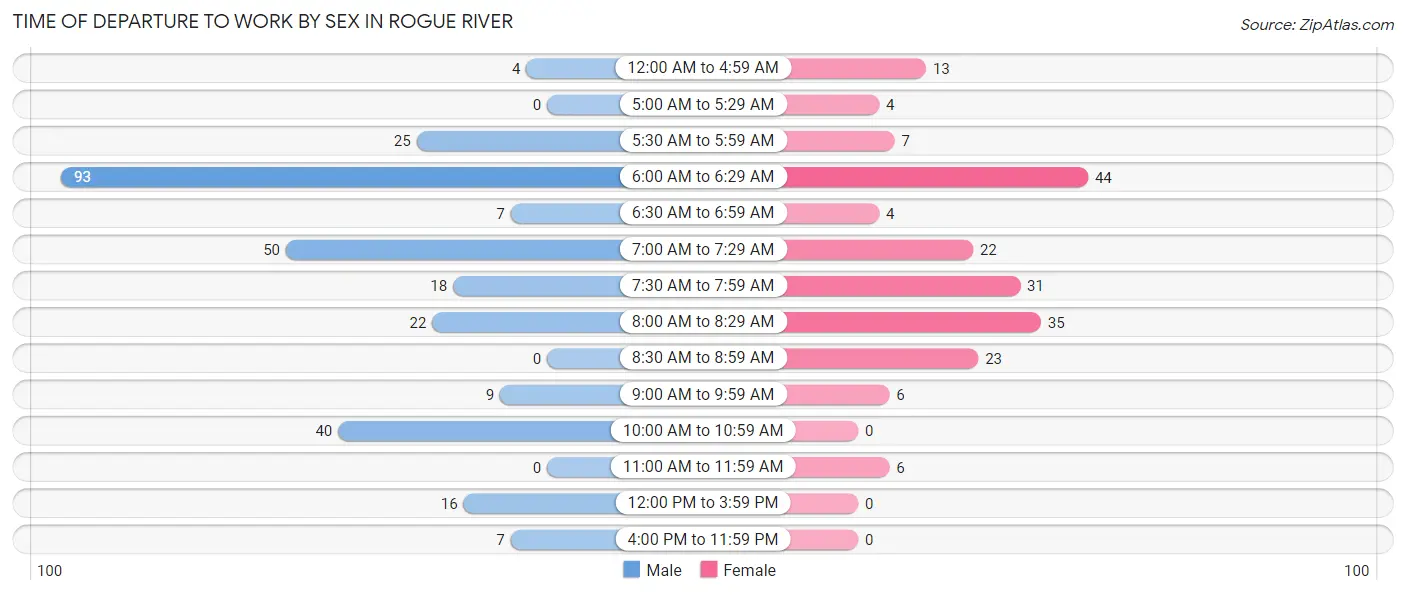
| Time of Departure | Male | Female |
| 12:00 AM to 4:59 AM | 4 (1.4%) | 13 (6.7%) |
| 5:00 AM to 5:29 AM | 0 (0.0%) | 4 (2.1%) |
| 5:30 AM to 5:59 AM | 25 (8.6%) | 7 (3.6%) |
| 6:00 AM to 6:29 AM | 93 (32.0%) | 44 (22.6%) |
| 6:30 AM to 6:59 AM | 7 (2.4%) | 4 (2.1%) |
| 7:00 AM to 7:29 AM | 50 (17.2%) | 22 (11.3%) |
| 7:30 AM to 7:59 AM | 18 (6.2%) | 31 (15.9%) |
| 8:00 AM to 8:29 AM | 22 (7.6%) | 35 (17.9%) |
| 8:30 AM to 8:59 AM | 0 (0.0%) | 23 (11.8%) |
| 9:00 AM to 9:59 AM | 9 (3.1%) | 6 (3.1%) |
| 10:00 AM to 10:59 AM | 40 (13.8%) | 0 (0.0%) |
| 11:00 AM to 11:59 AM | 0 (0.0%) | 6 (3.1%) |
| 12:00 PM to 3:59 PM | 16 (5.5%) | 0 (0.0%) |
| 4:00 PM to 11:59 PM | 7 (2.4%) | 0 (0.0%) |
| Total | 291 (100.0%) | 195 (100.0%) |
Housing Occupancy in Rogue River
Occupancy by Ownership in Rogue River
Of the total 996 dwellings in Rogue River, owner-occupied units account for 567 (56.9%), while renter-occupied units make up 429 (43.1%).
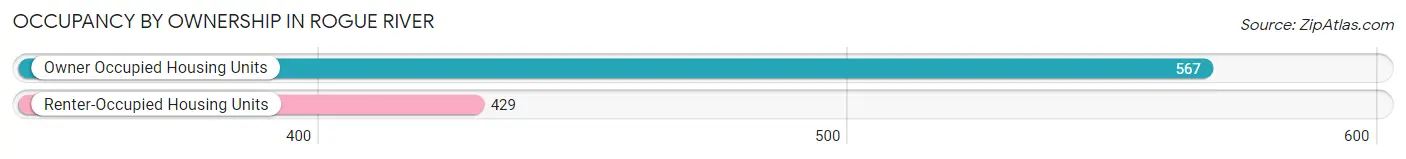
| Occupancy | # Housing Units | % Housing Units |
| Owner Occupied Housing Units | 567 | 56.9% |
| Renter-Occupied Housing Units | 429 | 43.1% |
| Total Occupied Housing Units | 996 | 100.0% |
Occupancy by Household Size in Rogue River
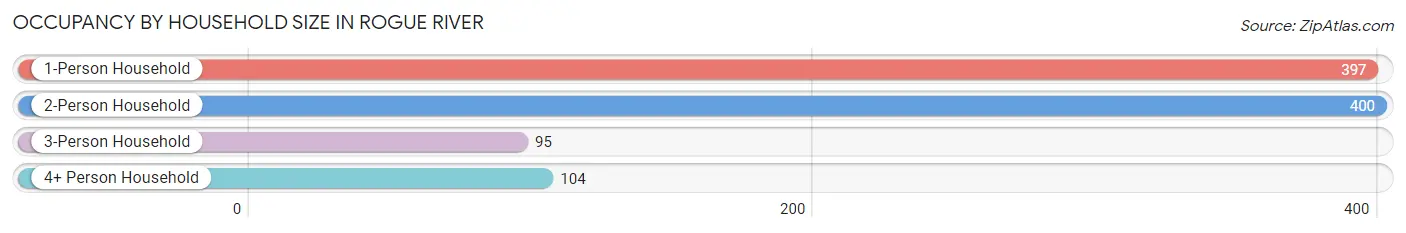
| Household Size | # Housing Units | % Housing Units |
| 1-Person Household | 397 | 39.9% |
| 2-Person Household | 400 | 40.2% |
| 3-Person Household | 95 | 9.5% |
| 4+ Person Household | 104 | 10.4% |
| Total Housing Units | 996 | 100.0% |
Occupancy by Ownership by Household Size in Rogue River
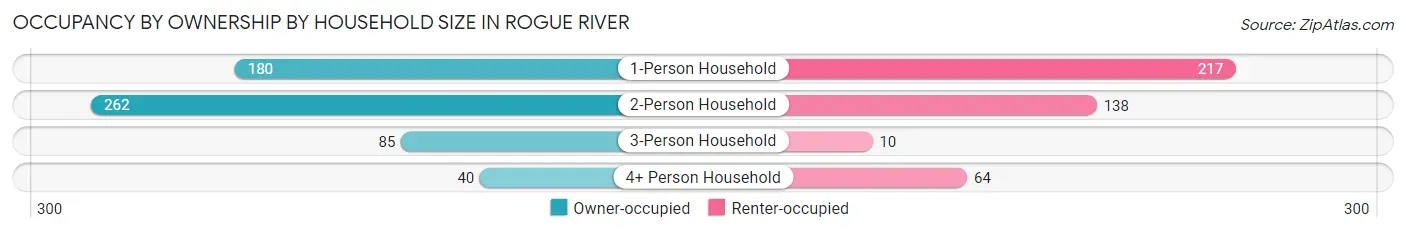
| Household Size | Owner-occupied | Renter-occupied |
| 1-Person Household | 180 (45.3%) | 217 (54.7%) |
| 2-Person Household | 262 (65.5%) | 138 (34.5%) |
| 3-Person Household | 85 (89.5%) | 10 (10.5%) |
| 4+ Person Household | 40 (38.5%) | 64 (61.5%) |
| Total Housing Units | 567 (56.9%) | 429 (43.1%) |
Occupancy by Educational Attainment in Rogue River
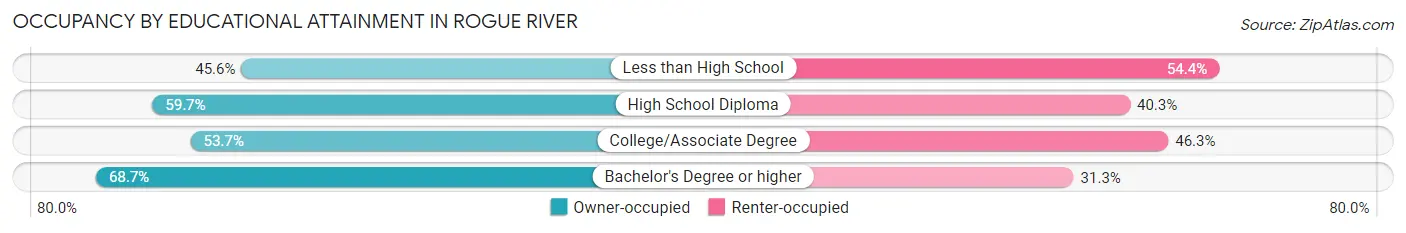
| Household Size | Owner-occupied | Renter-occupied |
| Less than High School | 47 (45.6%) | 56 (54.4%) |
| High School Diploma | 132 (59.7%) | 89 (40.3%) |
| College/Associate Degree | 263 (53.7%) | 227 (46.3%) |
| Bachelor's Degree or higher | 125 (68.7%) | 57 (31.3%) |
Occupancy by Age of Householder in Rogue River
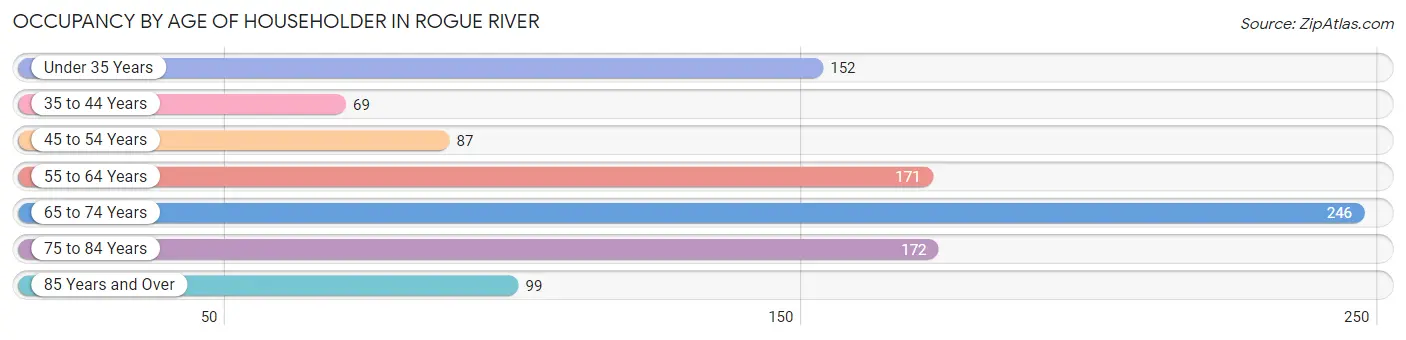
| Age Bracket | # Households | % Households |
| Under 35 Years | 152 | 15.3% |
| 35 to 44 Years | 69 | 6.9% |
| 45 to 54 Years | 87 | 8.7% |
| 55 to 64 Years | 171 | 17.2% |
| 65 to 74 Years | 246 | 24.7% |
| 75 to 84 Years | 172 | 17.3% |
| 85 Years and Over | 99 | 9.9% |
| Total | 996 | 100.0% |
Housing Finances in Rogue River
Median Income by Occupancy in Rogue River
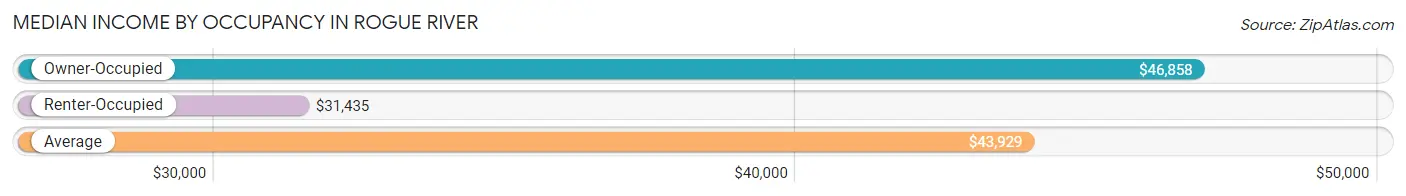
| Occupancy Type | # Households | Median Income |
| Owner-Occupied | 567 (56.9%) | $46,858 |
| Renter-Occupied | 429 (43.1%) | $31,435 |
| Average | 996 (100.0%) | $43,929 |
Occupancy by Householder Income Bracket in Rogue River
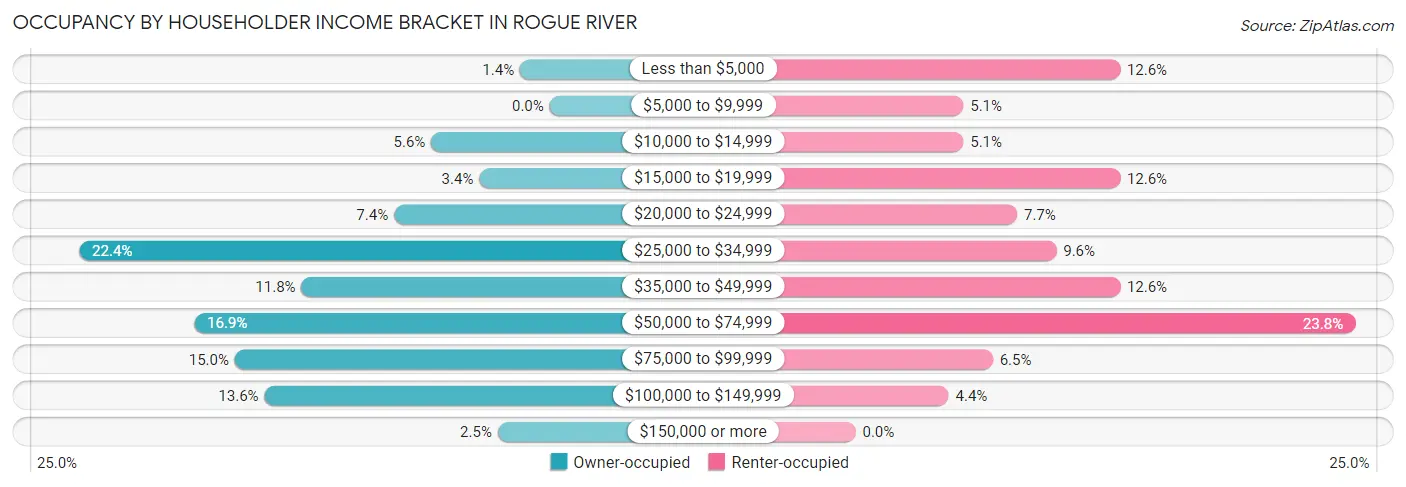
| Income Bracket | Owner-occupied | Renter-occupied |
| Less than $5,000 | 8 (1.4%) | 54 (12.6%) |
| $5,000 to $9,999 | 0 (0.0%) | 22 (5.1%) |
| $10,000 to $14,999 | 32 (5.6%) | 22 (5.1%) |
| $15,000 to $19,999 | 19 (3.4%) | 54 (12.6%) |
| $20,000 to $24,999 | 42 (7.4%) | 33 (7.7%) |
| $25,000 to $34,999 | 127 (22.4%) | 41 (9.6%) |
| $35,000 to $49,999 | 67 (11.8%) | 54 (12.6%) |
| $50,000 to $74,999 | 96 (16.9%) | 102 (23.8%) |
| $75,000 to $99,999 | 85 (15.0%) | 28 (6.5%) |
| $100,000 to $149,999 | 77 (13.6%) | 19 (4.4%) |
| $150,000 or more | 14 (2.5%) | 0 (0.0%) |
| Total | 567 (100.0%) | 429 (100.0%) |
Monthly Housing Cost Tiers in Rogue River
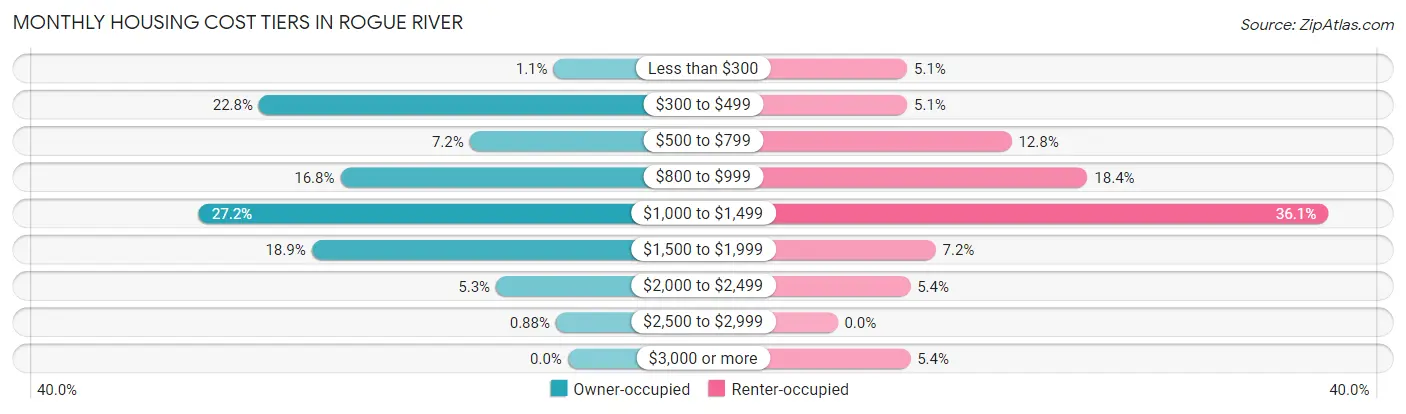
| Monthly Cost | Owner-occupied | Renter-occupied |
| Less than $300 | 6 (1.1%) | 22 (5.1%) |
| $300 to $499 | 129 (22.8%) | 22 (5.1%) |
| $500 to $799 | 41 (7.2%) | 55 (12.8%) |
| $800 to $999 | 95 (16.8%) | 79 (18.4%) |
| $1,000 to $1,499 | 154 (27.2%) | 155 (36.1%) |
| $1,500 to $1,999 | 107 (18.9%) | 31 (7.2%) |
| $2,000 to $2,499 | 30 (5.3%) | 23 (5.4%) |
| $2,500 to $2,999 | 5 (0.9%) | 0 (0.0%) |
| $3,000 or more | 0 (0.0%) | 23 (5.4%) |
| Total | 567 (100.0%) | 429 (100.0%) |
Physical Housing Characteristics in Rogue River
Housing Structures in Rogue River
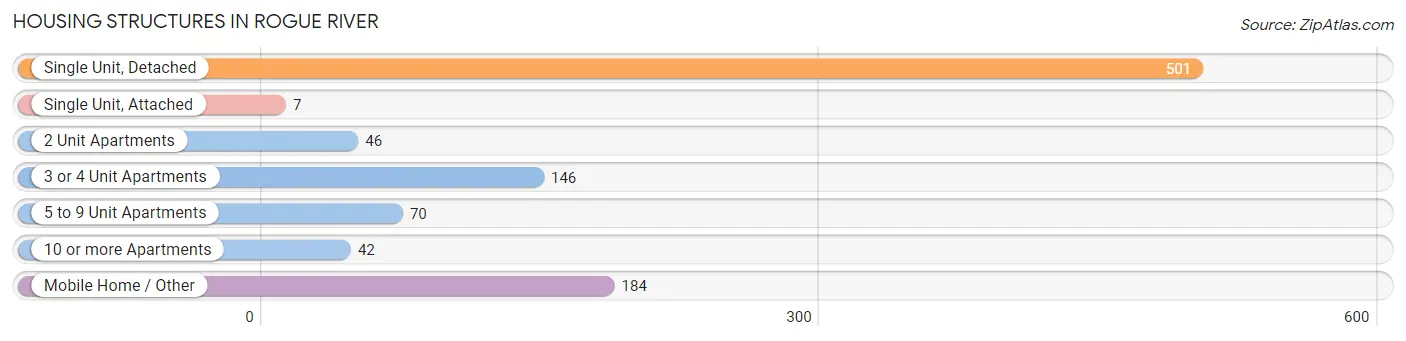
| Structure Type | # Housing Units | % Housing Units |
| Single Unit, Detached | 501 | 50.3% |
| Single Unit, Attached | 7 | 0.7% |
| 2 Unit Apartments | 46 | 4.6% |
| 3 or 4 Unit Apartments | 146 | 14.7% |
| 5 to 9 Unit Apartments | 70 | 7.0% |
| 10 or more Apartments | 42 | 4.2% |
| Mobile Home / Other | 184 | 18.5% |
| Total | 996 | 100.0% |
Housing Structures by Occupancy in Rogue River
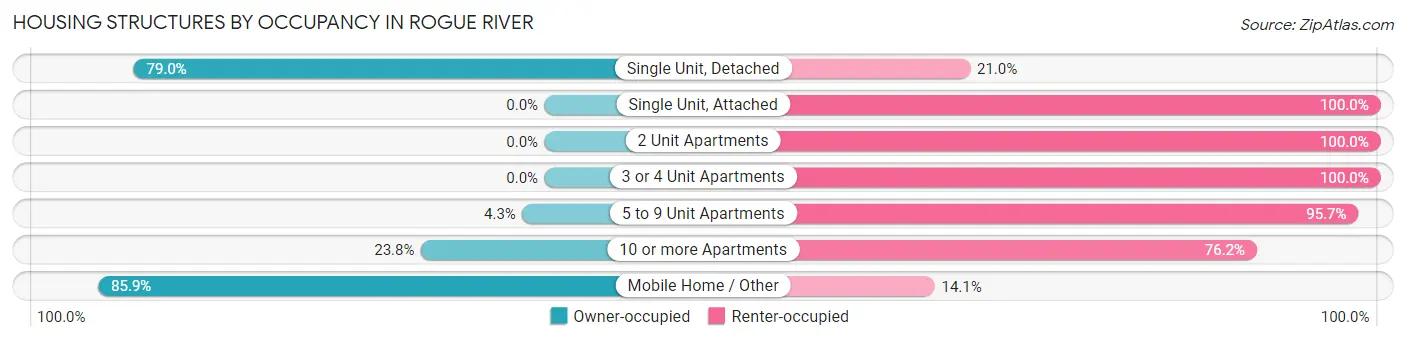
| Structure Type | Owner-occupied | Renter-occupied |
| Single Unit, Detached | 396 (79.0%) | 105 (21.0%) |
| Single Unit, Attached | 0 (0.0%) | 7 (100.0%) |
| 2 Unit Apartments | 0 (0.0%) | 46 (100.0%) |
| 3 or 4 Unit Apartments | 0 (0.0%) | 146 (100.0%) |
| 5 to 9 Unit Apartments | 3 (4.3%) | 67 (95.7%) |
| 10 or more Apartments | 10 (23.8%) | 32 (76.2%) |
| Mobile Home / Other | 158 (85.9%) | 26 (14.1%) |
| Total | 567 (56.9%) | 429 (43.1%) |
Housing Structures by Number of Rooms in Rogue River
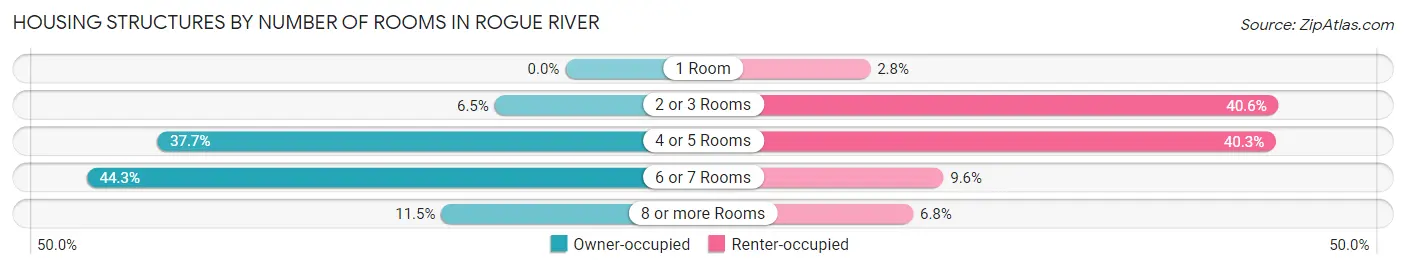
| Number of Rooms | Owner-occupied | Renter-occupied |
| 1 Room | 0 (0.0%) | 12 (2.8%) |
| 2 or 3 Rooms | 37 (6.5%) | 174 (40.6%) |
| 4 or 5 Rooms | 214 (37.7%) | 173 (40.3%) |
| 6 or 7 Rooms | 251 (44.3%) | 41 (9.6%) |
| 8 or more Rooms | 65 (11.5%) | 29 (6.8%) |
| Total | 567 (100.0%) | 429 (100.0%) |
Housing Structure by Heating Type in Rogue River
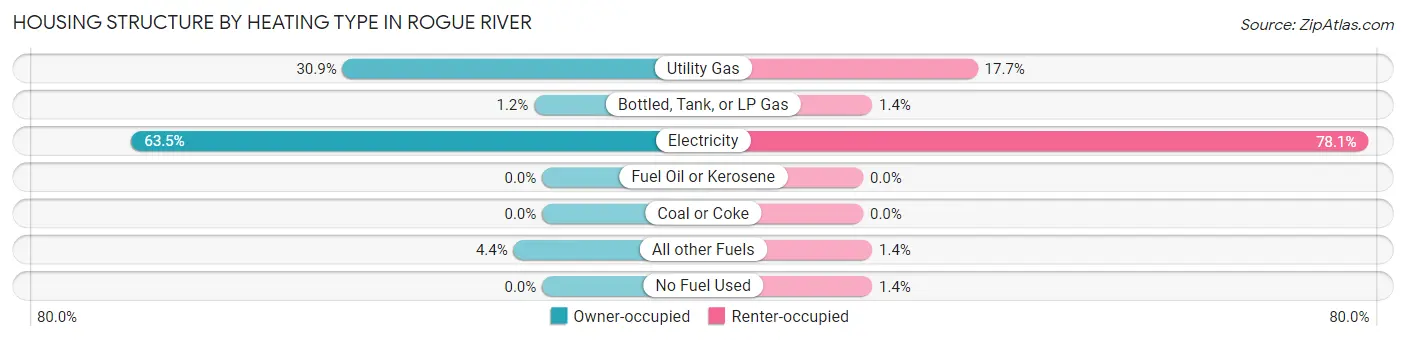
| Heating Type | Owner-occupied | Renter-occupied |
| Utility Gas | 175 (30.9%) | 76 (17.7%) |
| Bottled, Tank, or LP Gas | 7 (1.2%) | 6 (1.4%) |
| Electricity | 360 (63.5%) | 335 (78.1%) |
| Fuel Oil or Kerosene | 0 (0.0%) | 0 (0.0%) |
| Coal or Coke | 0 (0.0%) | 0 (0.0%) |
| All other Fuels | 25 (4.4%) | 6 (1.4%) |
| No Fuel Used | 0 (0.0%) | 6 (1.4%) |
| Total | 567 (100.0%) | 429 (100.0%) |
Household Vehicle Usage in Rogue River
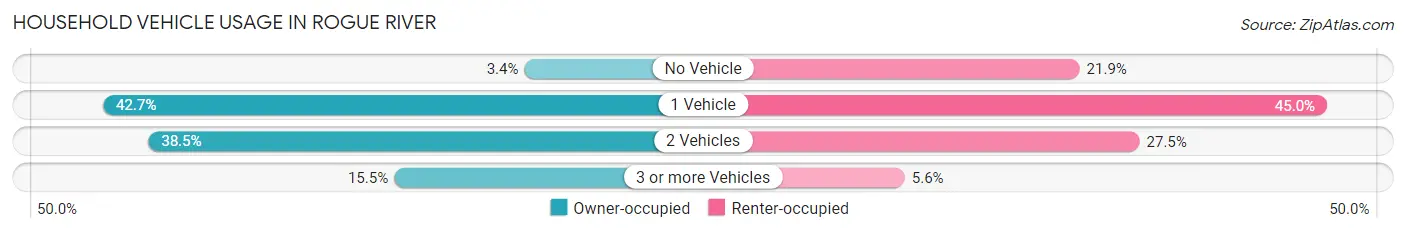
| Vehicles per Household | Owner-occupied | Renter-occupied |
| No Vehicle | 19 (3.4%) | 94 (21.9%) |
| 1 Vehicle | 242 (42.7%) | 193 (45.0%) |
| 2 Vehicles | 218 (38.5%) | 118 (27.5%) |
| 3 or more Vehicles | 88 (15.5%) | 24 (5.6%) |
| Total | 567 (100.0%) | 429 (100.0%) |
Real Estate & Mortgages in Rogue River
Real Estate and Mortgage Overview in Rogue River
| Characteristic | Without Mortgage | With Mortgage |
| Housing Units | 230 | 337 |
| Median Property Value | $169,600 | $276,400 |
| Median Household Income | $46,111 | $2 |
| Monthly Housing Costs | $459 | $0 |
| Real Estate Taxes | $1,365 | $14 |
Property Value by Mortgage Status in Rogue River
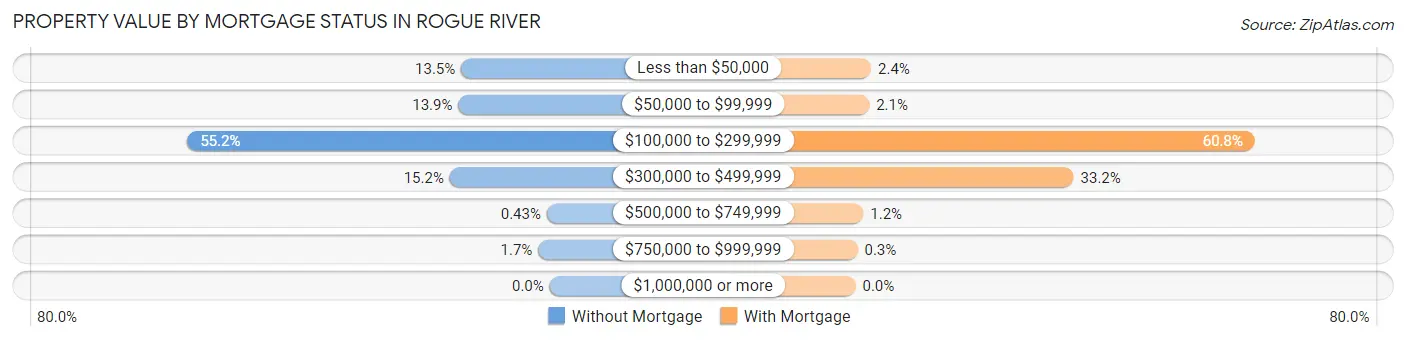
| Property Value | Without Mortgage | With Mortgage |
| Less than $50,000 | 31 (13.5%) | 8 (2.4%) |
| $50,000 to $99,999 | 32 (13.9%) | 7 (2.1%) |
| $100,000 to $299,999 | 127 (55.2%) | 205 (60.8%) |
| $300,000 to $499,999 | 35 (15.2%) | 112 (33.2%) |
| $500,000 to $749,999 | 1 (0.4%) | 4 (1.2%) |
| $750,000 to $999,999 | 4 (1.7%) | 1 (0.3%) |
| $1,000,000 or more | 0 (0.0%) | 0 (0.0%) |
| Total | 230 (100.0%) | 337 (100.0%) |
Household Income by Mortgage Status in Rogue River
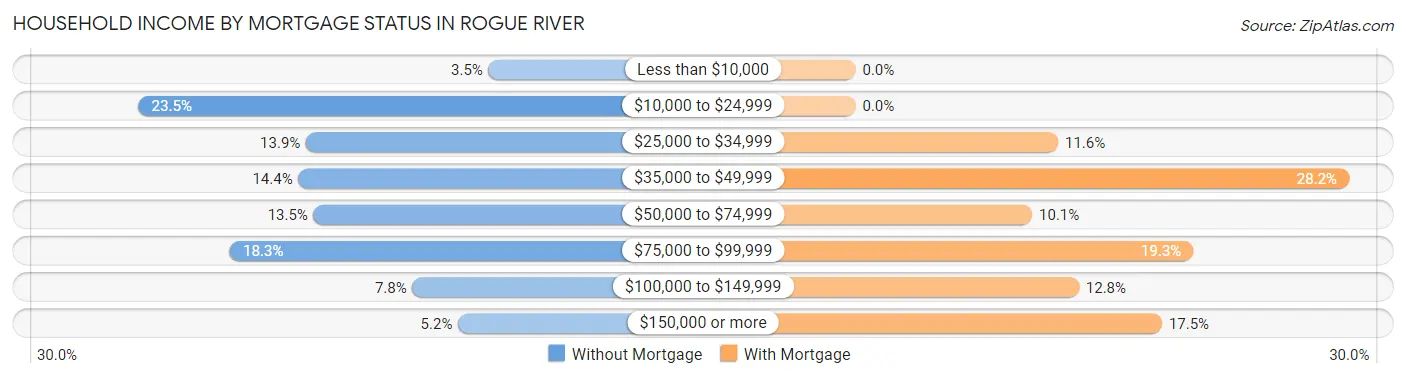
| Household Income | Without Mortgage | With Mortgage |
| Less than $10,000 | 8 (3.5%) | 0 (0.0%) |
| $10,000 to $24,999 | 54 (23.5%) | 0 (0.0%) |
| $25,000 to $34,999 | 32 (13.9%) | 39 (11.6%) |
| $35,000 to $49,999 | 33 (14.3%) | 95 (28.2%) |
| $50,000 to $74,999 | 31 (13.5%) | 34 (10.1%) |
| $75,000 to $99,999 | 42 (18.3%) | 65 (19.3%) |
| $100,000 to $149,999 | 18 (7.8%) | 43 (12.8%) |
| $150,000 or more | 12 (5.2%) | 59 (17.5%) |
| Total | 230 (100.0%) | 337 (100.0%) |
Property Value to Household Income Ratio in Rogue River
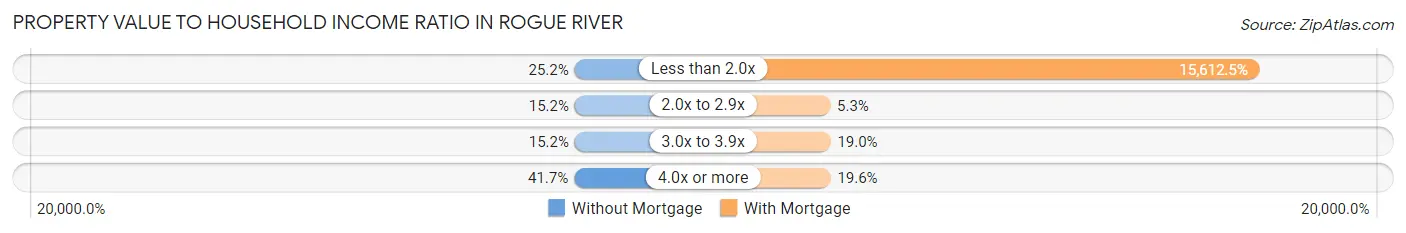
| Value-to-Income Ratio | Without Mortgage | With Mortgage |
| Less than 2.0x | 58 (25.2%) | 52,614 (15,612.5%) |
| 2.0x to 2.9x | 35 (15.2%) | 18 (5.3%) |
| 3.0x to 3.9x | 35 (15.2%) | 64 (19.0%) |
| 4.0x or more | 96 (41.7%) | 66 (19.6%) |
| Total | 230 (100.0%) | 337 (100.0%) |
Real Estate Taxes by Mortgage Status in Rogue River
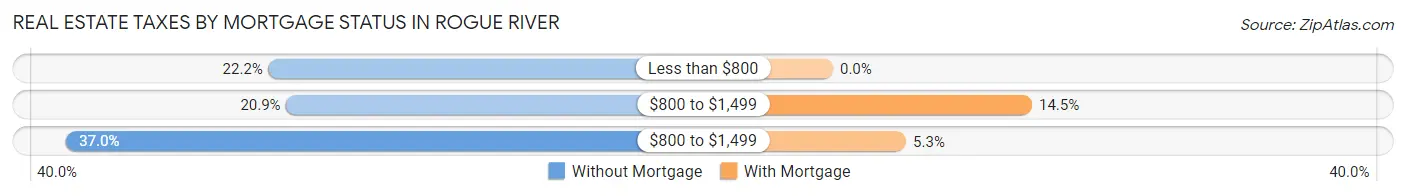
| Property Taxes | Without Mortgage | With Mortgage |
| Less than $800 | 51 (22.2%) | 0 (0.0%) |
| $800 to $1,499 | 48 (20.9%) | 49 (14.5%) |
| $800 to $1,499 | 85 (37.0%) | 18 (5.3%) |
| Total | 230 (100.0%) | 337 (100.0%) |
Health & Disability in Rogue River
Health Insurance Coverage by Age in Rogue River
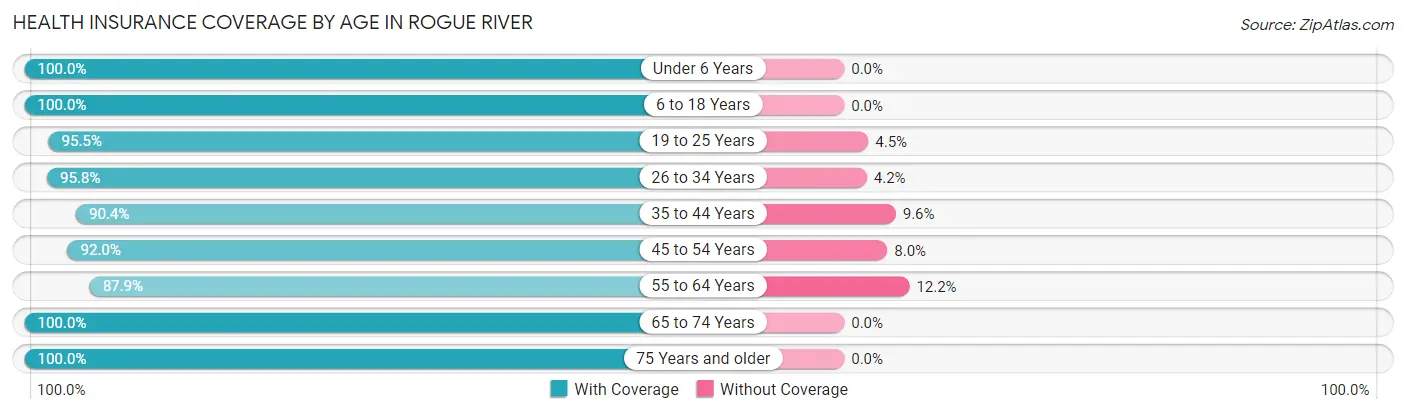
| Age Bracket | With Coverage | Without Coverage |
| Under 6 Years | 83 (100.0%) | 0 (0.0%) |
| 6 to 18 Years | 284 (100.0%) | 0 (0.0%) |
| 19 to 25 Years | 192 (95.5%) | 9 (4.5%) |
| 26 to 34 Years | 137 (95.8%) | 6 (4.2%) |
| 35 to 44 Years | 160 (90.4%) | 17 (9.6%) |
| 45 to 54 Years | 126 (92.0%) | 11 (8.0%) |
| 55 to 64 Years | 217 (87.8%) | 30 (12.1%) |
| 65 to 74 Years | 344 (100.0%) | 0 (0.0%) |
| 75 Years and older | 381 (100.0%) | 0 (0.0%) |
| Total | 1,924 (96.3%) | 73 (3.7%) |
Health Insurance Coverage by Citizenship Status in Rogue River
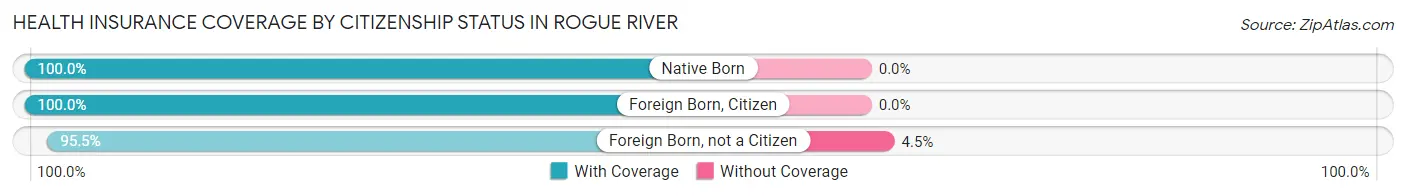
| Citizenship Status | With Coverage | Without Coverage |
| Native Born | 83 (100.0%) | 0 (0.0%) |
| Foreign Born, Citizen | 284 (100.0%) | 0 (0.0%) |
| Foreign Born, not a Citizen | 192 (95.5%) | 9 (4.5%) |
Health Insurance Coverage by Household Income in Rogue River
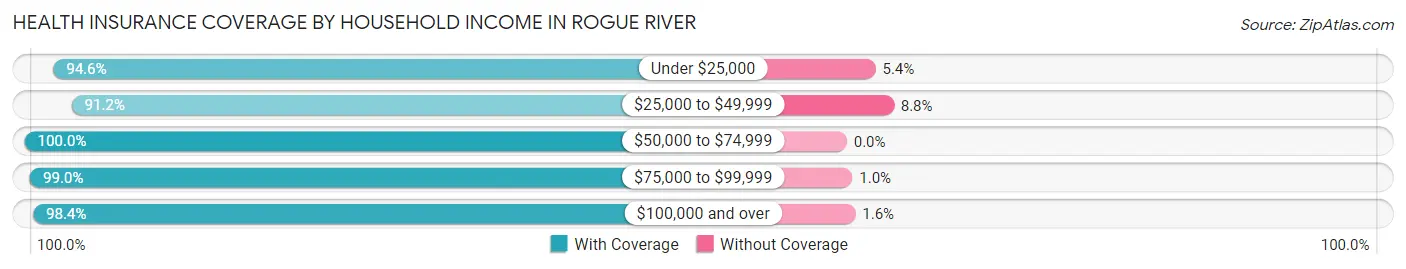
| Household Income | With Coverage | Without Coverage |
| Under $25,000 | 404 (94.6%) | 23 (5.4%) |
| $25,000 to $49,999 | 425 (91.2%) | 41 (8.8%) |
| $50,000 to $74,999 | 440 (100.0%) | 0 (0.0%) |
| $75,000 to $99,999 | 285 (99.0%) | 3 (1.0%) |
| $100,000 and over | 370 (98.4%) | 6 (1.6%) |
Public vs Private Health Insurance Coverage by Age in Rogue River
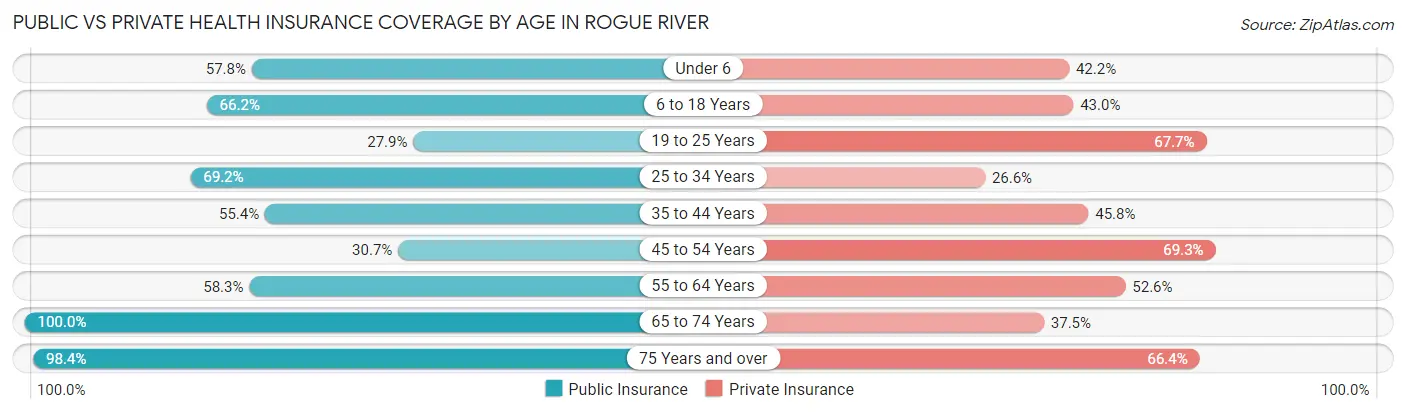
| Age Bracket | Public Insurance | Private Insurance |
| Under 6 | 48 (57.8%) | 35 (42.2%) |
| 6 to 18 Years | 188 (66.2%) | 122 (43.0%) |
| 19 to 25 Years | 56 (27.9%) | 136 (67.7%) |
| 25 to 34 Years | 99 (69.2%) | 38 (26.6%) |
| 35 to 44 Years | 98 (55.4%) | 81 (45.8%) |
| 45 to 54 Years | 42 (30.7%) | 95 (69.3%) |
| 55 to 64 Years | 144 (58.3%) | 130 (52.6%) |
| 65 to 74 Years | 344 (100.0%) | 129 (37.5%) |
| 75 Years and over | 375 (98.4%) | 253 (66.4%) |
| Total | 1,394 (69.8%) | 1,019 (51.0%) |
Disability Status by Sex by Age in Rogue River
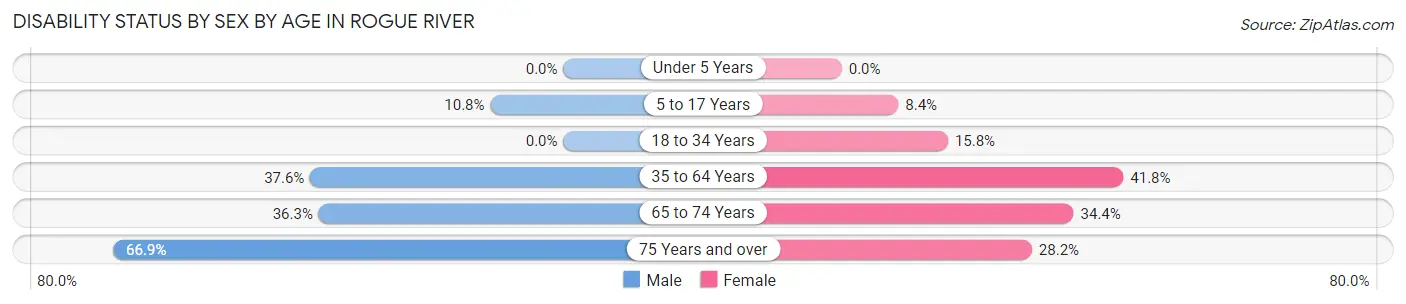
| Age Bracket | Male | Female |
| Under 5 Years | 0 (0.0%) | 0 (0.0%) |
| 5 to 17 Years | 18 (10.8%) | 10 (8.4%) |
| 18 to 34 Years | 0 (0.0%) | 32 (15.8%) |
| 35 to 64 Years | 103 (37.6%) | 120 (41.8%) |
| 65 to 74 Years | 69 (36.3%) | 53 (34.4%) |
| 75 Years and over | 115 (66.9%) | 59 (28.2%) |
Disability Class by Sex by Age in Rogue River
Disability Class: Hearing Difficulty
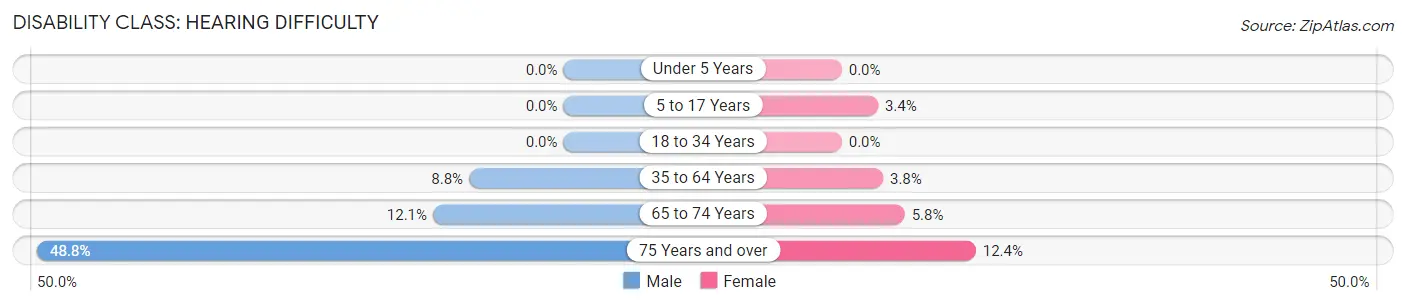
| Age Bracket | Male | Female |
| Under 5 Years | 0 (0.0%) | 0 (0.0%) |
| 5 to 17 Years | 0 (0.0%) | 4 (3.4%) |
| 18 to 34 Years | 0 (0.0%) | 0 (0.0%) |
| 35 to 64 Years | 24 (8.8%) | 11 (3.8%) |
| 65 to 74 Years | 23 (12.1%) | 9 (5.8%) |
| 75 Years and over | 84 (48.8%) | 26 (12.4%) |
Disability Class: Vision Difficulty
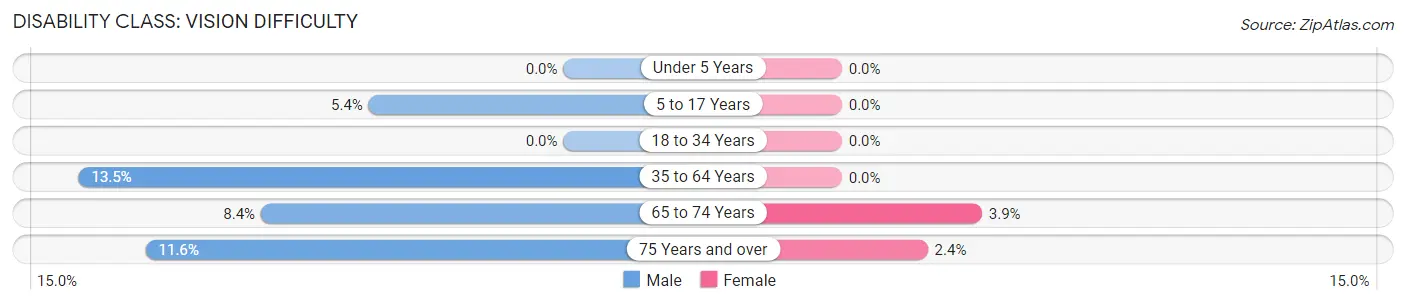
| Age Bracket | Male | Female |
| Under 5 Years | 0 (0.0%) | 0 (0.0%) |
| 5 to 17 Years | 9 (5.4%) | 0 (0.0%) |
| 18 to 34 Years | 0 (0.0%) | 0 (0.0%) |
| 35 to 64 Years | 37 (13.5%) | 0 (0.0%) |
| 65 to 74 Years | 16 (8.4%) | 6 (3.9%) |
| 75 Years and over | 20 (11.6%) | 5 (2.4%) |
Disability Class: Cognitive Difficulty
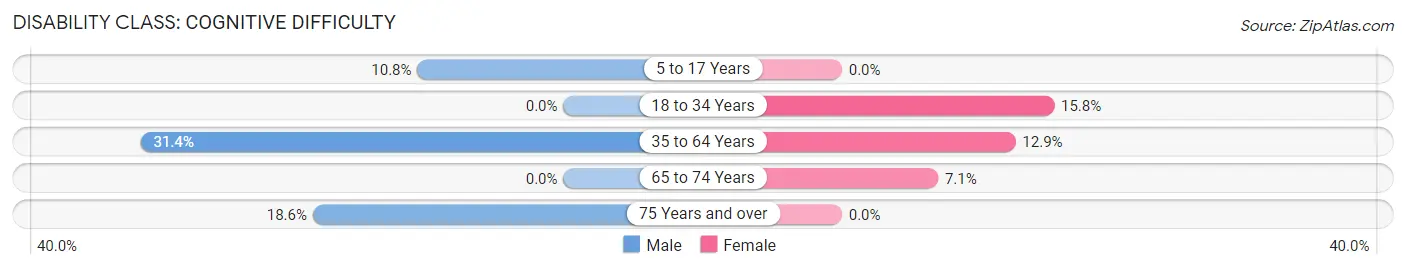
| Age Bracket | Male | Female |
| 5 to 17 Years | 18 (10.8%) | 0 (0.0%) |
| 18 to 34 Years | 0 (0.0%) | 32 (15.8%) |
| 35 to 64 Years | 86 (31.4%) | 37 (12.9%) |
| 65 to 74 Years | 0 (0.0%) | 11 (7.1%) |
| 75 Years and over | 32 (18.6%) | 0 (0.0%) |
Disability Class: Ambulatory Difficulty
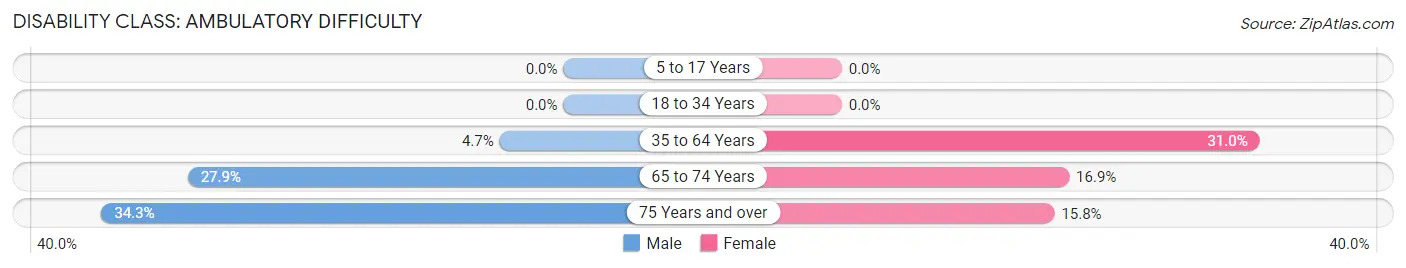
| Age Bracket | Male | Female |
| 5 to 17 Years | 0 (0.0%) | 0 (0.0%) |
| 18 to 34 Years | 0 (0.0%) | 0 (0.0%) |
| 35 to 64 Years | 13 (4.7%) | 89 (31.0%) |
| 65 to 74 Years | 53 (27.9%) | 26 (16.9%) |
| 75 Years and over | 59 (34.3%) | 33 (15.8%) |
Disability Class: Self-Care Difficulty
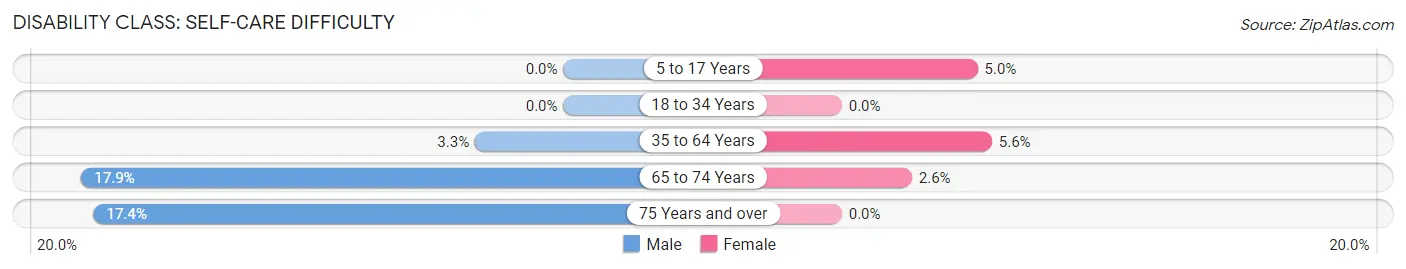
| Age Bracket | Male | Female |
| 5 to 17 Years | 0 (0.0%) | 6 (5.0%) |
| 18 to 34 Years | 0 (0.0%) | 0 (0.0%) |
| 35 to 64 Years | 9 (3.3%) | 16 (5.6%) |
| 65 to 74 Years | 34 (17.9%) | 4 (2.6%) |
| 75 Years and over | 30 (17.4%) | 0 (0.0%) |
Technology Access in Rogue River
Computing Device Access in Rogue River
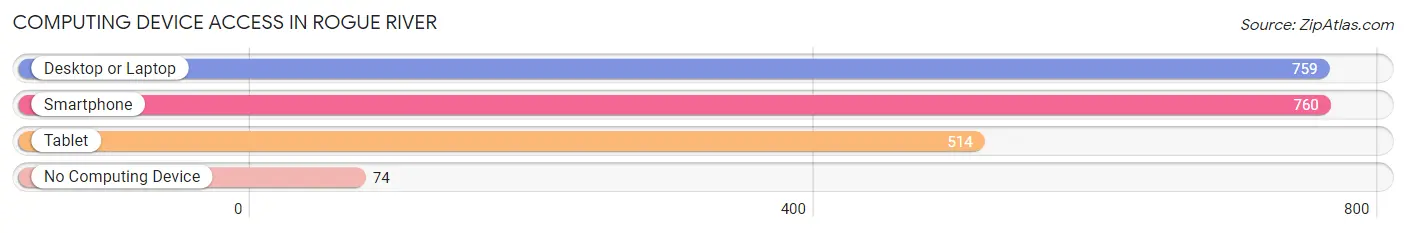
| Device Type | # Households | % Households |
| Desktop or Laptop | 759 | 76.2% |
| Smartphone | 760 | 76.3% |
| Tablet | 514 | 51.6% |
| No Computing Device | 74 | 7.4% |
| Total | 996 | 100.0% |
Internet Access in Rogue River
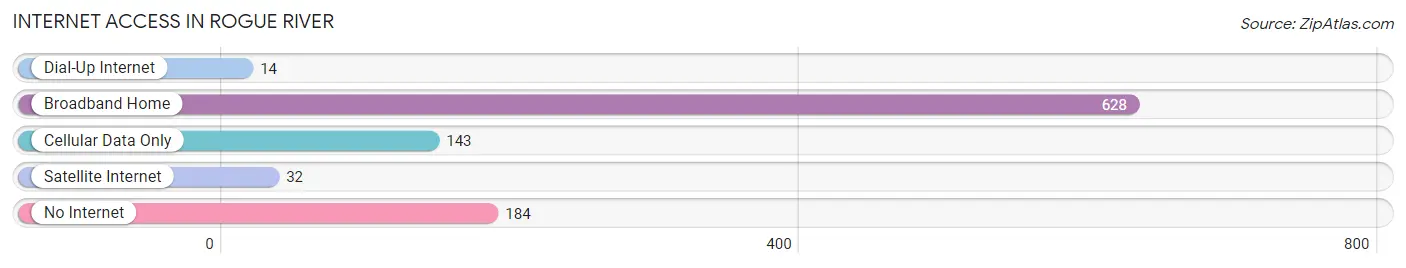
| Internet Type | # Households | % Households |
| Dial-Up Internet | 14 | 1.4% |
| Broadband Home | 628 | 63.0% |
| Cellular Data Only | 143 | 14.4% |
| Satellite Internet | 32 | 3.2% |
| No Internet | 184 | 18.5% |
| Total | 996 | 100.0% |
Rogue River Summary
River, Oregon is a small town located in the Rogue Valley of Southern Oregon. It is situated along the banks of the Rogue River, which is a tributary of the Umpqua River. The town is located in Jackson County and is part of the Medford-Ashland Metropolitan Statistical Area. The population of Rogue River was 1,845 at the 2010 census.
History
The Rogue River area was first inhabited by the Takelma Native Americans. The first European settlers arrived in the area in the early 1850s. The town of Rogue River was founded in 1855 and was named after the nearby river. The town was originally a trading post and was used as a supply point for miners and settlers in the area.
In the late 1800s, the town became a popular destination for tourists and fishermen. The town was also known for its fruit orchards and was home to several canneries. The town was incorporated in 1891 and was the first incorporated city in Jackson County.
Geography
Rogue River is located in the Rogue Valley of Southern Oregon. The town is situated along the banks of the Rogue River, which is a tributary of the Umpqua River. The town is located in Jackson County and is part of the Medford-Ashland Metropolitan Statistical Area.
The town has a total area of 1.2 square miles, all of which is land. The town is located at an elevation of 1,067 feet above sea level.
Economy
The economy of Rogue River is largely based on tourism and agriculture. The town is a popular destination for fishing, camping, and other outdoor activities. The town is also home to several wineries and vineyards.
The town is also home to several businesses, including restaurants, retail stores, and other services. The town is also home to several manufacturing companies, including a wood products company and a metal fabrication company.
Demographics
As of the 2010 census, there were 1,845 people, 745 households, and 486 families residing in the town. The population density was 1,527.3 people per square mile. The racial makeup of the town was 94.2% White, 0.3% African American, 0.9% Native American, 0.7% Asian, 0.1% Pacific Islander, 1.2% from other races, and 2.6% from two or more races. Hispanic or Latino of any race were 4.2% of the population.
The median income for a household in the town was $37,917, and the median income for a family was $45,000. The per capita income for the town was $19,845. About 11.2% of families and 14.2% of the population were below the poverty line, including 19.2% of those under age 18 and 8.2% of those age 65 or over.
Common Questions
What is the Total Population of Rogue River?
Total Population of Rogue River is 1,997.
What is the Total Male Population of Rogue River?
Total Male Population of Rogue River is 973.
What is the Total Female Population of Rogue River?
Total Female Population of Rogue River is 1,024.
What is the Ratio of Males per 100 Females in Rogue River?
There are 95.02 Males per 100 Females in Rogue River.
What is the Ratio of Females per 100 Males in Rogue River?
There are 105.24 Females per 100 Males in Rogue River.
What is the Median Population Age in Rogue River?
Median Population Age in Rogue River is 52.6 Years.
What is the Average Family Size in Rogue River
Average Family Size in Rogue River is 2.6 People.
What is the Average Household Size in Rogue River
Average Household Size in Rogue River is 2.0 People.
What is Per Capita Income in Rogue River?
Per Capita income in Rogue River is $26,852.
What is the Median Family Income in Rogue River?
Median Family Income in Rogue River is $65,284.
What is the Median Household income in Rogue River?
Median Household Income in Rogue River is $43,929.
What is Income or Wage Gap in Rogue River?
Income or Wage Gap in Rogue River is 36.2%.
Women in Rogue River earn 63.8 cents for every dollar earned by a man.
What is Inequality or Gini Index in Rogue River?
Inequality or Gini Index in Rogue River is 0.44.
How Large is the Labor Force in Rogue River?
There are 654 People in the Labor Forcein in Rogue River.
What is the Percentage of People in the Labor Force in Rogue River?
38.8% of People are in the Labor Force in Rogue River.
What is the Unemployment Rate in Rogue River?
Unemployment Rate in Rogue River is 12.2%.