Long Creek, OR
Long Creek Map
Long Creek Overview
190
TOTAL POPULATION
82
MALE POPULATION
108
FEMALE POPULATION
75.93
MALES / 100 FEMALES
131.71
FEMALES / 100 MALES
55.7
MEDIAN AGE
3.3
AVG FAMILY SIZE
2.2
AVG HOUSEHOLD SIZE
$17,737
PER CAPITA INCOME
$41,389
AVG FAMILY INCOME
$30,375
AVG HOUSEHOLD INCOME
28.4%
WAGE / INCOME GAP [ % ]
71.6¢/ $1
WAGE / INCOME GAP [ $ ]
$10,082
FAMILY INCOME DEFICIT
0.43
INEQUALITY / GINI INDEX
47
LABOR FORCE [ PEOPLE ]
30.7%
PERCENT IN LABOR FORCE
6.4%
UNEMPLOYMENT RATE
Long Creek Zip Codes
Long Creek Area Codes
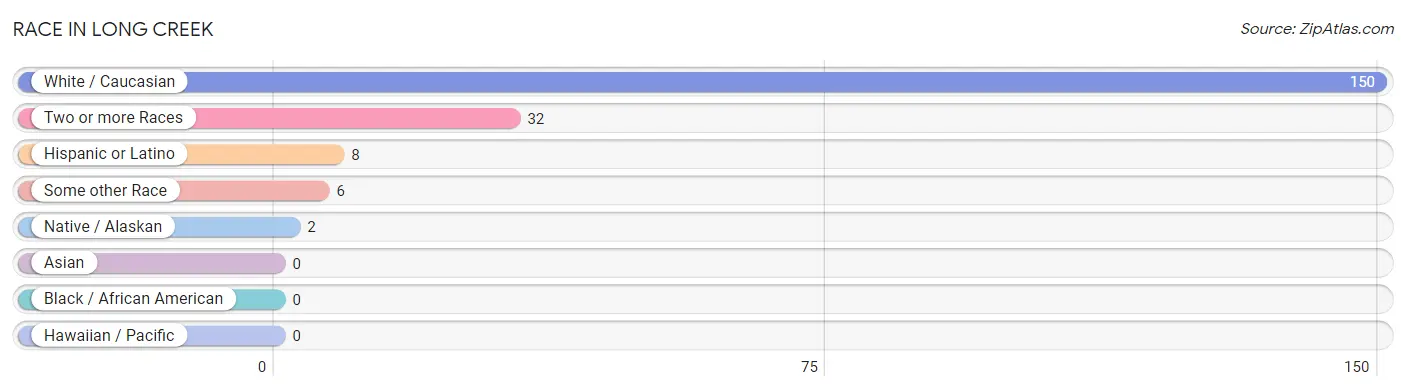
Race in Long Creek
The most populous races in Long Creek are White / Caucasian (150 | 78.9%), Two or more Races (32 | 16.8%), and Hispanic or Latino (8 | 4.2%).
| Race | # Population | % Population |
| Asian | 0 | 0.0% |
| Black / African American | 0 | 0.0% |
| Hawaiian / Pacific | 0 | 0.0% |
| Hispanic or Latino | 8 | 4.2% |
| Native / Alaskan | 2 | 1.1% |
| White / Caucasian | 150 | 78.9% |
| Two or more Races | 32 | 16.8% |
| Some other Race | 6 | 3.2% |
| Total | 190 | 100.0% |
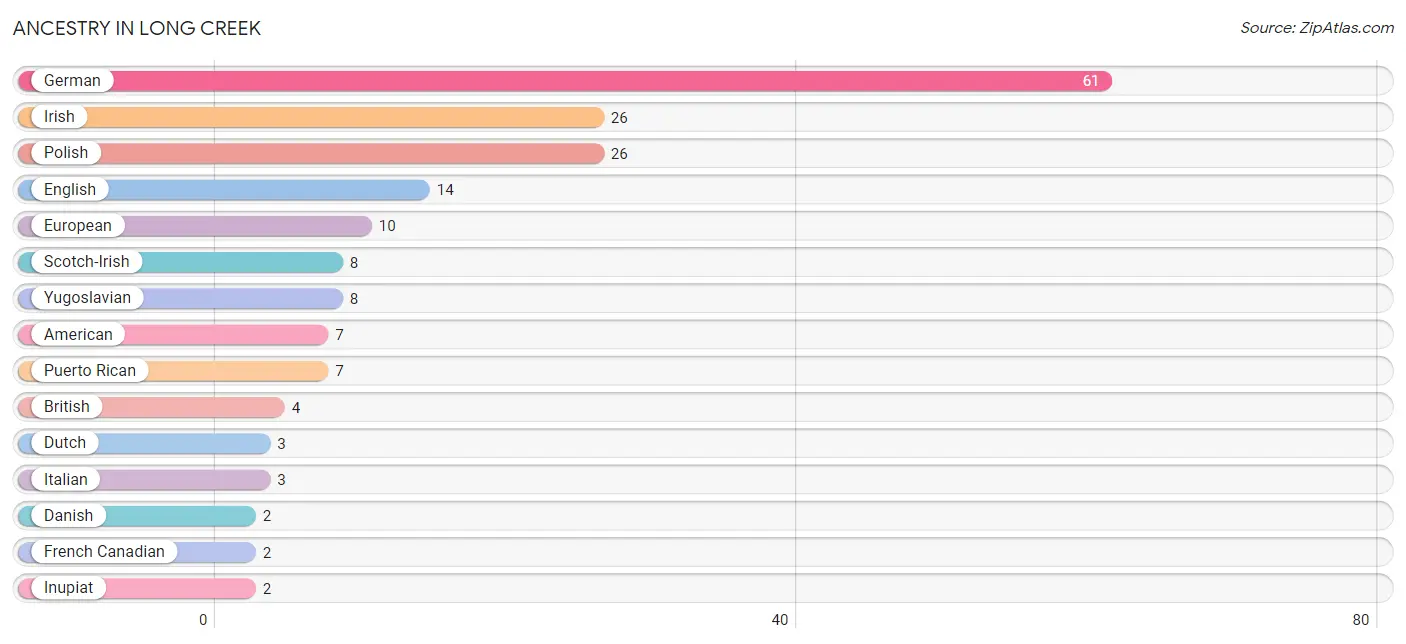
Ancestry in Long Creek
The most populous ancestries reported in Long Creek are German (61 | 32.1%), Irish (26 | 13.7%), Polish (26 | 13.7%), English (14 | 7.4%), and European (10 | 5.3%), together accounting for 72.1% of all Long Creek residents.
| Ancestry | # Population | % Population |
| American | 7 | 3.7% |
| British | 4 | 2.1% |
| Burmese | 1 | 0.5% |
| Danish | 2 | 1.1% |
| Dutch | 3 | 1.6% |
| English | 14 | 7.4% |
| European | 10 | 5.3% |
| French | 1 | 0.5% |
| French Canadian | 2 | 1.1% |
| German | 61 | 32.1% |
| Inupiat | 2 | 1.1% |
| Irish | 26 | 13.7% |
| Italian | 3 | 1.6% |
| Norwegian | 1 | 0.5% |
| Polish | 26 | 13.7% |
| Puerto Rican | 7 | 3.7% |
| Scotch-Irish | 8 | 4.2% |
| South American | 1 | 0.5% |
| Uruguayan | 1 | 0.5% |
| Yugoslavian | 8 | 4.2% | View All 20 Rows |
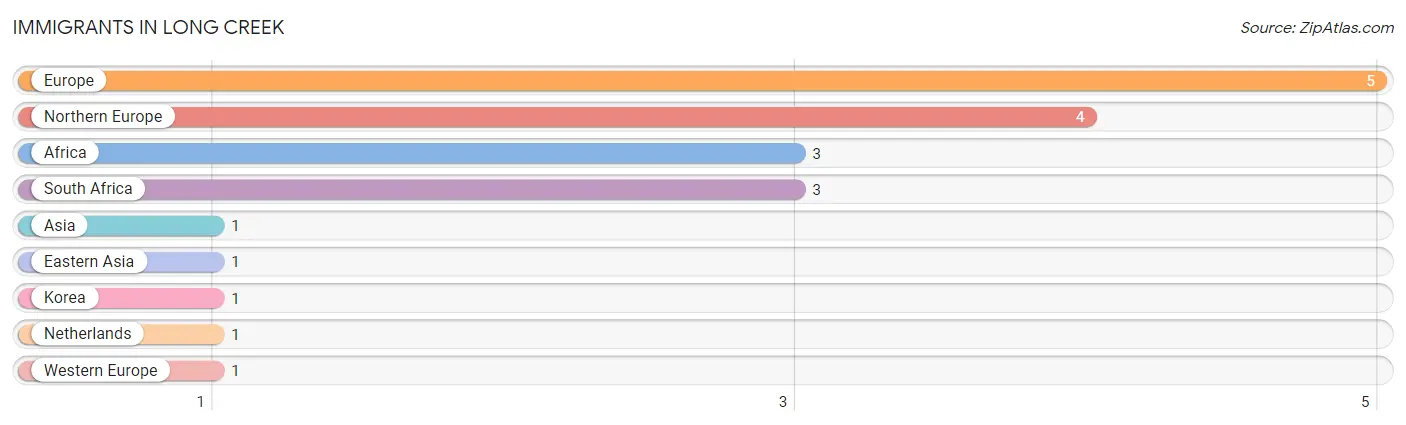
Immigrants in Long Creek
The most numerous immigrant groups reported in Long Creek came from Europe (5 | 2.6%), Northern Europe (4 | 2.1%), Africa (3 | 1.6%), South Africa (3 | 1.6%), and Asia (1 | 0.5%), together accounting for 8.4% of all Long Creek residents.
| Immigration Origin | # Population | % Population |
| Africa | 3 | 1.6% |
| Asia | 1 | 0.5% |
| Eastern Asia | 1 | 0.5% |
| Europe | 5 | 2.6% |
| Korea | 1 | 0.5% |
| Netherlands | 1 | 0.5% |
| Northern Europe | 4 | 2.1% |
| South Africa | 3 | 1.6% |
| Western Europe | 1 | 0.5% | View All 9 Rows |
Sex and Age in Long Creek
Sex and Age in Long Creek
The most populous age groups in Long Creek are 75 to 79 Years (16 | 19.5%) for men and Under 5 Years (15 | 13.9%) for women.
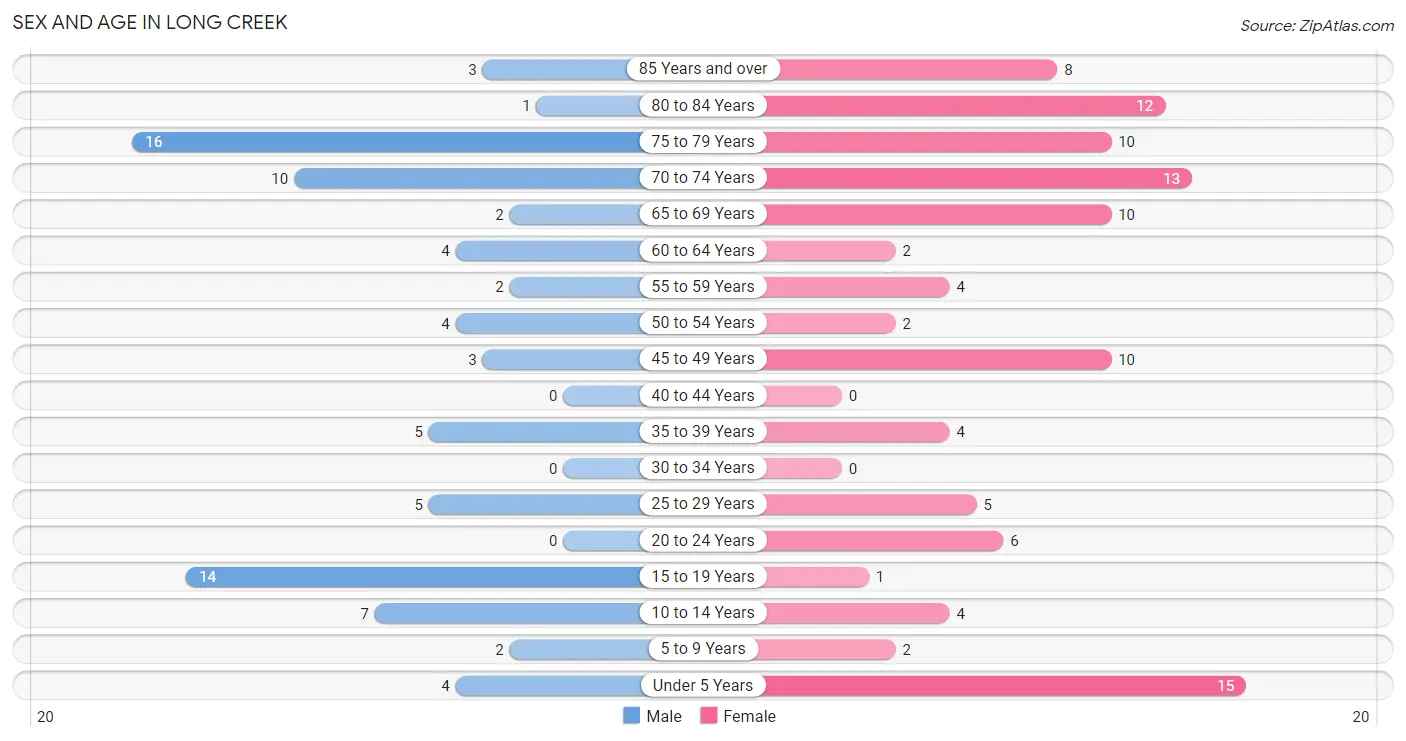
| Age Bracket | Male | Female |
| Under 5 Years | 4 (4.9%) | 15 (13.9%) |
| 5 to 9 Years | 2 (2.4%) | 2 (1.8%) |
| 10 to 14 Years | 7 (8.5%) | 4 (3.7%) |
| 15 to 19 Years | 14 (17.1%) | 1 (0.9%) |
| 20 to 24 Years | 0 (0.0%) | 6 (5.6%) |
| 25 to 29 Years | 5 (6.1%) | 5 (4.6%) |
| 30 to 34 Years | 0 (0.0%) | 0 (0.0%) |
| 35 to 39 Years | 5 (6.1%) | 4 (3.7%) |
| 40 to 44 Years | 0 (0.0%) | 0 (0.0%) |
| 45 to 49 Years | 3 (3.7%) | 10 (9.3%) |
| 50 to 54 Years | 4 (4.9%) | 2 (1.8%) |
| 55 to 59 Years | 2 (2.4%) | 4 (3.7%) |
| 60 to 64 Years | 4 (4.9%) | 2 (1.8%) |
| 65 to 69 Years | 2 (2.4%) | 10 (9.3%) |
| 70 to 74 Years | 10 (12.2%) | 13 (12.0%) |
| 75 to 79 Years | 16 (19.5%) | 10 (9.3%) |
| 80 to 84 Years | 1 (1.2%) | 12 (11.1%) |
| 85 Years and over | 3 (3.7%) | 8 (7.4%) |
| Total | 82 (100.0%) | 108 (100.0%) |
Families and Households in Long Creek
Median Family Size in Long Creek
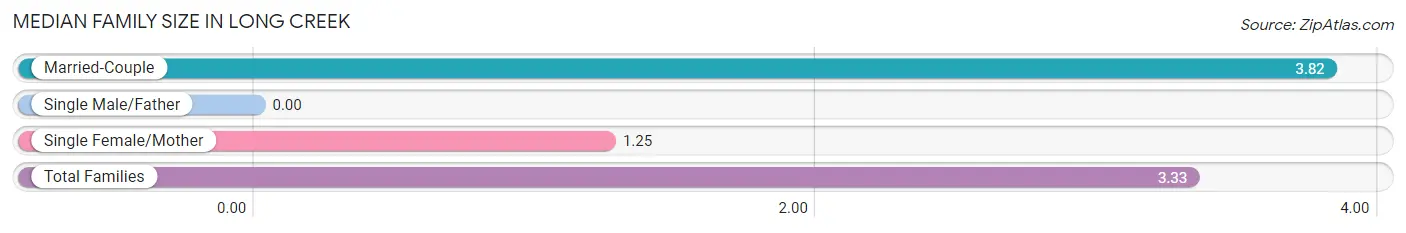
| Family Type | # Families | Family Size |
| Married-Couple | 34 (80.9%) | 3.82 |
| Single Male/Father | 0 (0.0%) | - |
| Single Female/Mother | 8 (19.1%) | 1.25 |
| Total Families | 42 (100.0%) | 3.33 |
Median Household Size in Long Creek
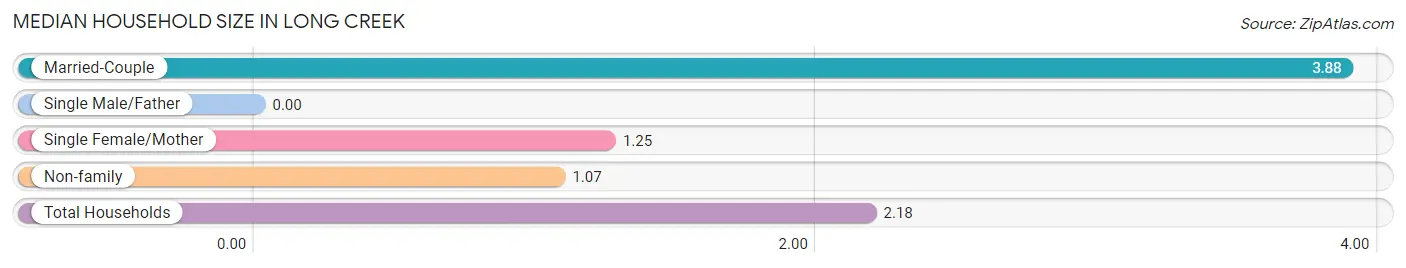
| Household Type | # Households | Household Size |
| Married-Couple | 34 (39.1%) | 3.88 |
| Single Male/Father | 0 (0.0%) | - |
| Single Female/Mother | 8 (9.2%) | 1.25 |
| Non-family | 45 (51.7%) | 1.07 |
| Total Households | 87 (100.0%) | 2.18 |
Household Size by Marriage Status in Long Creek
Out of a total of 87 households in Long Creek, 42 (48.3%) are family households, while 45 (51.7%) are nonfamily households. The most numerous type of family households are 2-person households, comprising 28, and the most common type of nonfamily households are 1-person households, comprising 42.
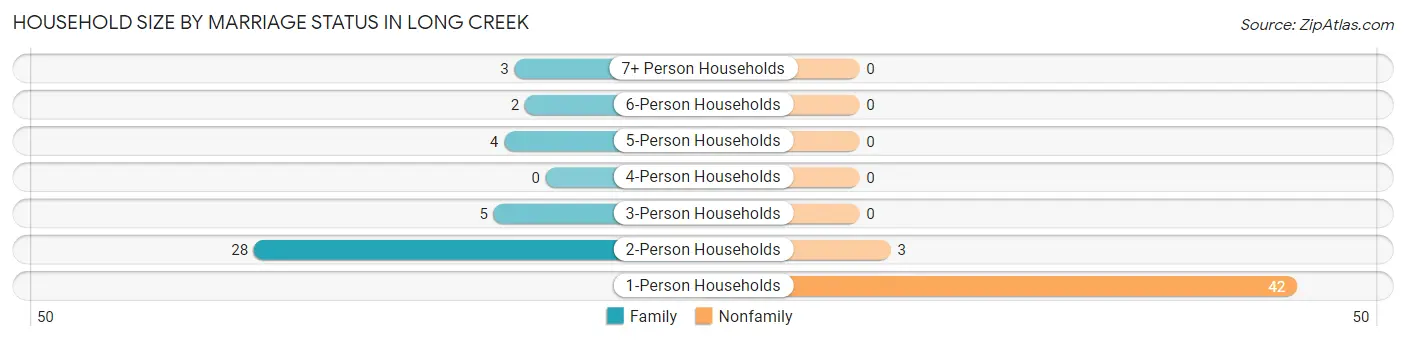
| Household Size | Family Households | Nonfamily Households |
| 1-Person Households | - | 42 (48.3%) |
| 2-Person Households | 28 (32.2%) | 3 (3.5%) |
| 3-Person Households | 5 (5.8%) | 0 (0.0%) |
| 4-Person Households | 0 (0.0%) | 0 (0.0%) |
| 5-Person Households | 4 (4.6%) | 0 (0.0%) |
| 6-Person Households | 2 (2.3%) | 0 (0.0%) |
| 7+ Person Households | 3 (3.5%) | 0 (0.0%) |
| Total | 42 (48.3%) | 45 (51.7%) |
Female Fertility in Long Creek
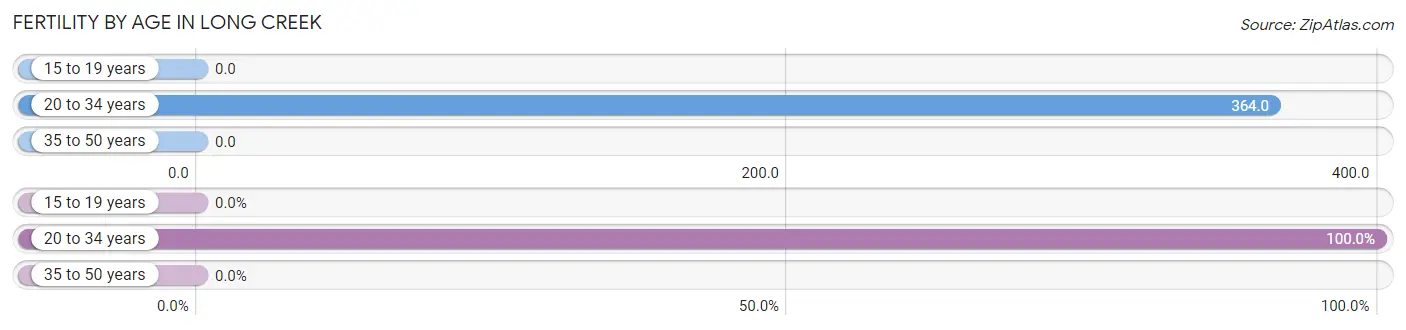
Fertility by Age in Long Creek
Average fertility rate in Long Creek is 154.0 births per 1,000 women. Women in the age bracket of 20 to 34 years have the highest fertility rate with 364.0 births per 1,000 women. Women in the age bracket of 20 to 34 years acount for 100.0% of all women with births.
| Age Bracket | Women with Births | Births / 1,000 Women |
| 15 to 19 years | 0 (0.0%) | 0.0 |
| 20 to 34 years | 4 (100.0%) | 364.0 |
| 35 to 50 years | 0 (0.0%) | 0.0 |
| Total | 4 (100.0%) | 154.0 |
Fertility by Age by Marriage Status in Long Creek
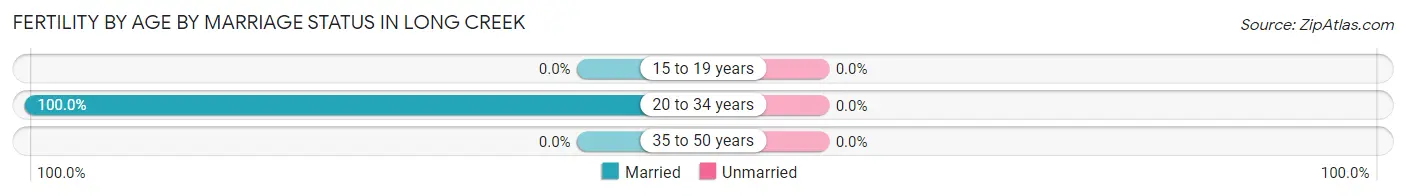
| Age Bracket | Married | Unmarried |
| 15 to 19 years | 0 (0.0%) | 0 (0.0%) |
| 20 to 34 years | 4 (100.0%) | 0 (0.0%) |
| 35 to 50 years | 0 (0.0%) | 0 (0.0%) |
| Total | 4 (100.0%) | 0 (0.0%) |
Fertility by Education in Long Creek
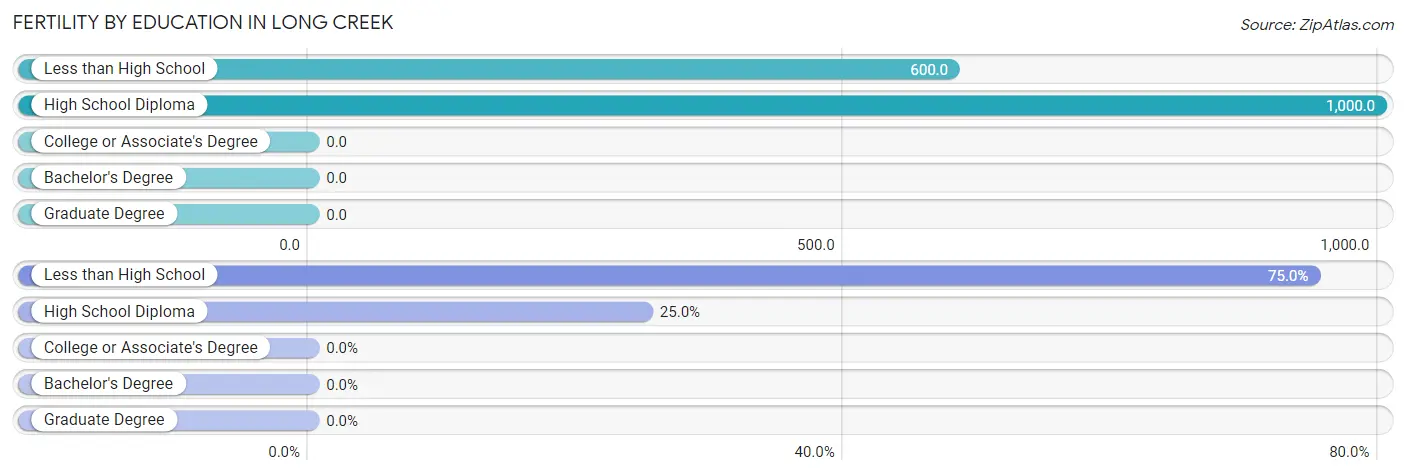
| Educational Attainment | Women with Births | Births / 1,000 Women |
| Less than High School | 3 (75.0%) | 600.0 |
| High School Diploma | 1 (25.0%) | 1,000.0 |
| College or Associate's Degree | 0 (0.0%) | 0.0 |
| Bachelor's Degree | 0 (0.0%) | 0.0 |
| Graduate Degree | 0 (0.0%) | 0.0 |
| Total | 4 (100.0%) | 154.0 |
Fertility by Education by Marriage Status in Long Creek
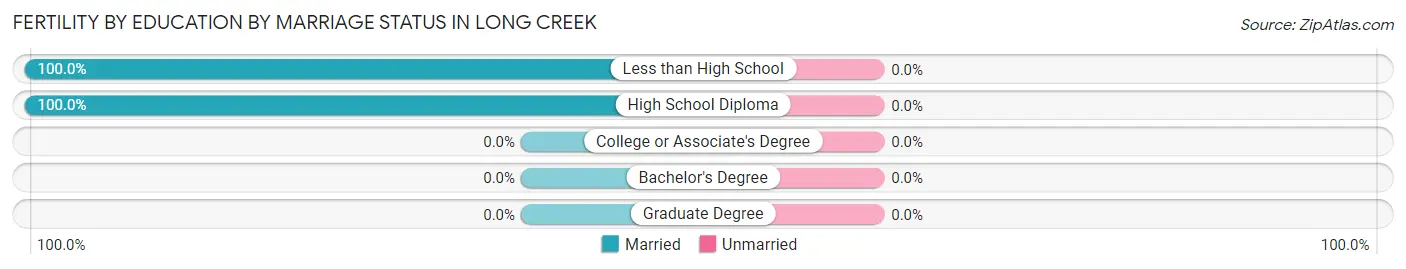
| Educational Attainment | Married | Unmarried |
| Less than High School | 3 (100.0%) | 0 (0.0%) |
| High School Diploma | 1 (100.0%) | 0 (0.0%) |
| College or Associate's Degree | 0 (0.0%) | 0 (0.0%) |
| Bachelor's Degree | 0 (0.0%) | 0 (0.0%) |
| Graduate Degree | 0 (0.0%) | 0 (0.0%) |
| Total | 4 (100.0%) | 0 (0.0%) |
Income in Long Creek
Income Overview in Long Creek
Per Capita Income in Long Creek is $17,737, while median incomes of families and households are $41,389 and $30,375 respectively.
| Characteristic | Number | Measure |
| Per Capita Income | 190 | $17,737 |
| Median Family Income | 42 | $41,389 |
| Mean Family Income | 42 | $56,788 |
| Median Household Income | 87 | $30,375 |
| Mean Household Income | 87 | $38,582 |
| Income Deficit | 42 | $10,082 |
| Wage / Income Gap (%) | 190 | 28.36% |
| Wage / Income Gap ($) | 190 | 71.64¢ per $1 |
| Gini / Inequality Index | 190 | 0.43 |
Earnings by Sex in Long Creek
Average Earnings in Long Creek are $24,250, $27,917 for men and $20,000 for women, a difference of 28.4%.
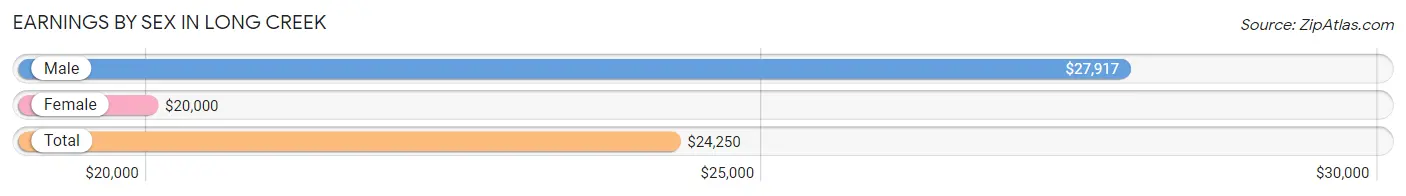
| Sex | Number | Average Earnings |
| Male | 33 (60.0%) | $27,917 |
| Female | 22 (40.0%) | $20,000 |
| Total | 55 (100.0%) | $24,250 |
Earnings by Sex by Income Bracket in Long Creek
The most common earnings brackets in Long Creek are $2,499 or less for men (10 | 30.3%) and $30,000 to $34,999 for women (7 | 31.8%).
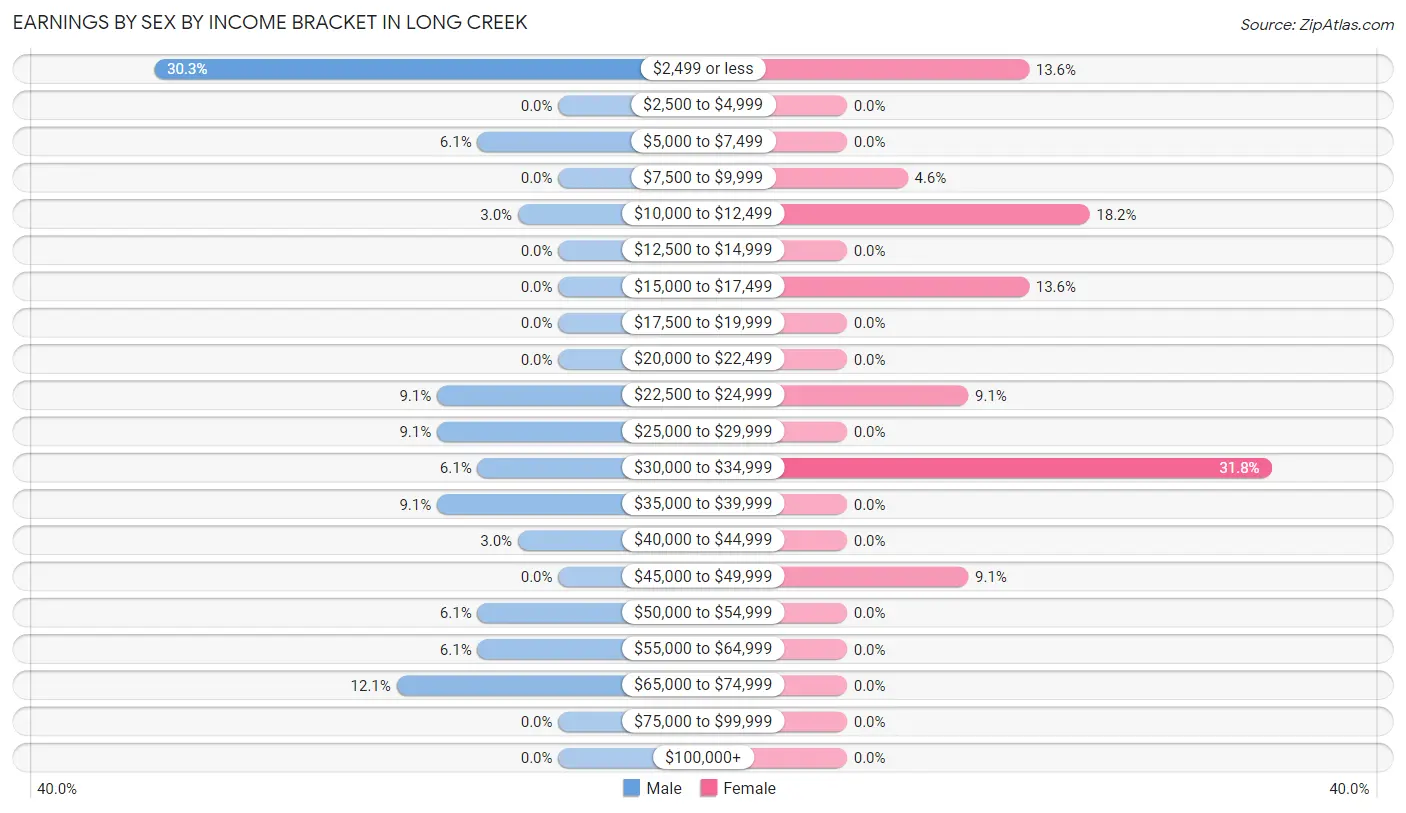
| Income | Male | Female |
| $2,499 or less | 10 (30.3%) | 3 (13.6%) |
| $2,500 to $4,999 | 0 (0.0%) | 0 (0.0%) |
| $5,000 to $7,499 | 2 (6.1%) | 0 (0.0%) |
| $7,500 to $9,999 | 0 (0.0%) | 1 (4.5%) |
| $10,000 to $12,499 | 1 (3.0%) | 4 (18.2%) |
| $12,500 to $14,999 | 0 (0.0%) | 0 (0.0%) |
| $15,000 to $17,499 | 0 (0.0%) | 3 (13.6%) |
| $17,500 to $19,999 | 0 (0.0%) | 0 (0.0%) |
| $20,000 to $22,499 | 0 (0.0%) | 0 (0.0%) |
| $22,500 to $24,999 | 3 (9.1%) | 2 (9.1%) |
| $25,000 to $29,999 | 3 (9.1%) | 0 (0.0%) |
| $30,000 to $34,999 | 2 (6.1%) | 7 (31.8%) |
| $35,000 to $39,999 | 3 (9.1%) | 0 (0.0%) |
| $40,000 to $44,999 | 1 (3.0%) | 0 (0.0%) |
| $45,000 to $49,999 | 0 (0.0%) | 2 (9.1%) |
| $50,000 to $54,999 | 2 (6.1%) | 0 (0.0%) |
| $55,000 to $64,999 | 2 (6.1%) | 0 (0.0%) |
| $65,000 to $74,999 | 4 (12.1%) | 0 (0.0%) |
| $75,000 to $99,999 | 0 (0.0%) | 0 (0.0%) |
| $100,000+ | 0 (0.0%) | 0 (0.0%) |
| Total | 33 (100.0%) | 22 (100.0%) |
Earnings by Sex by Educational Attainment in Long Creek
Average earnings in Long Creek are $30,625 for men and $23,750 for women, a difference of 22.5%. Men with an educational attainment of graduate degree enjoy the highest average annual earnings of $38,125, while those with less than high school education earn the least with $2,499. Women with an educational attainment of college or associate's degree earn the most with the average annual earnings of $23,125, while those with college or associate's degree education have the smallest earnings of $23,125.
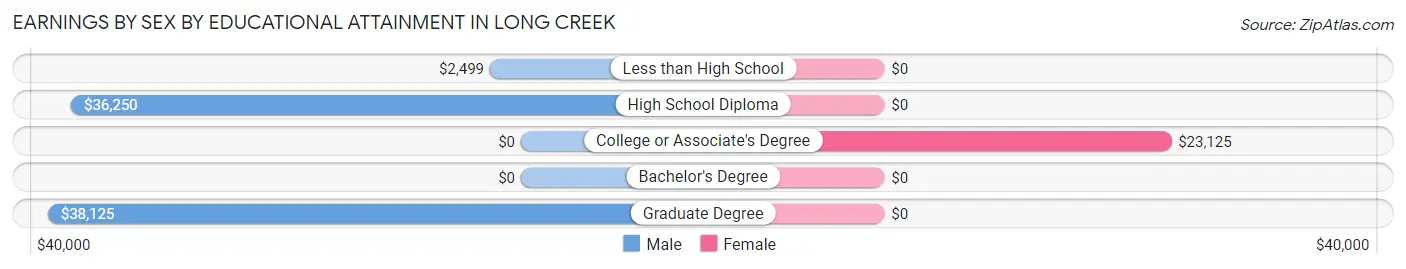
| Educational Attainment | Male Income | Female Income |
| Less than High School | $2,499 | $0 |
| High School Diploma | $36,250 | $0 |
| College or Associate's Degree | - | - |
| Bachelor's Degree | - | - |
| Graduate Degree | $38,125 | $0 |
| Total | $30,625 | $23,750 |
Family Income in Long Creek
Family Income Brackets in Long Creek
According to the Long Creek family income data, there are 12 families falling into the $35,000 to $49,999 income range, which is the most common income bracket and makes up 28.6% of all families.
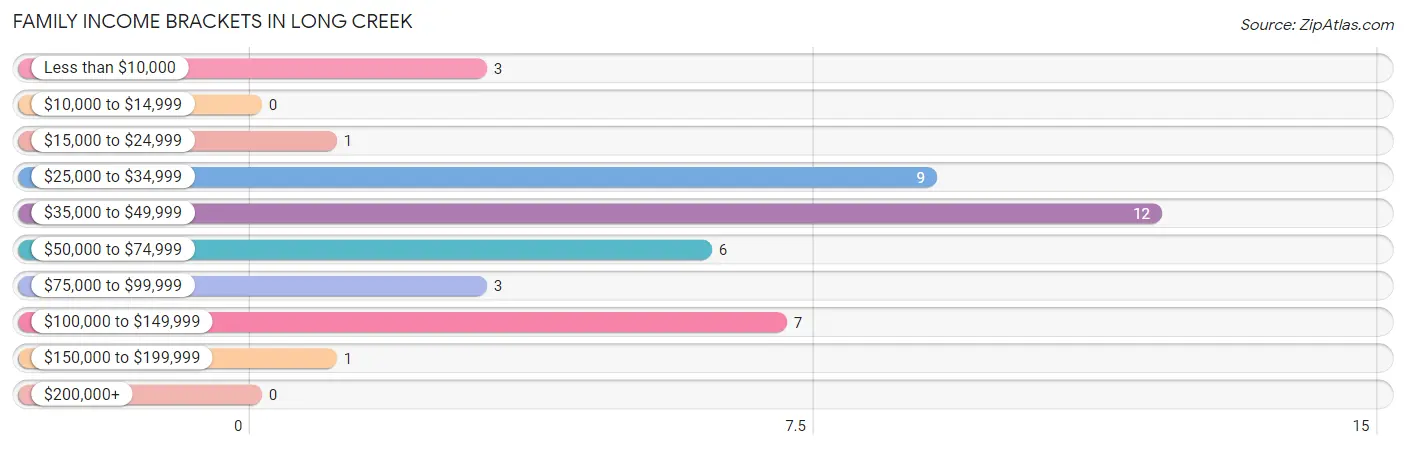
| Income Bracket | # Families | % Families |
| Less than $10,000 | 3 | 7.1% |
| $10,000 to $14,999 | 0 | 0.0% |
| $15,000 to $24,999 | 1 | 2.4% |
| $25,000 to $34,999 | 9 | 21.4% |
| $35,000 to $49,999 | 12 | 28.6% |
| $50,000 to $74,999 | 6 | 14.3% |
| $75,000 to $99,999 | 3 | 7.1% |
| $100,000 to $149,999 | 7 | 16.7% |
| $150,000 to $199,999 | 1 | 2.4% |
| $200,000+ | 0 | 0.0% |
Family Income by Famaliy Size in Long Creek
2-person families (30 | 71.4%) account for the highest median family income in Long Creek with $60,000 per family, while 2-person families (30 | 71.4%) have the highest median income of $30,000 per family member.
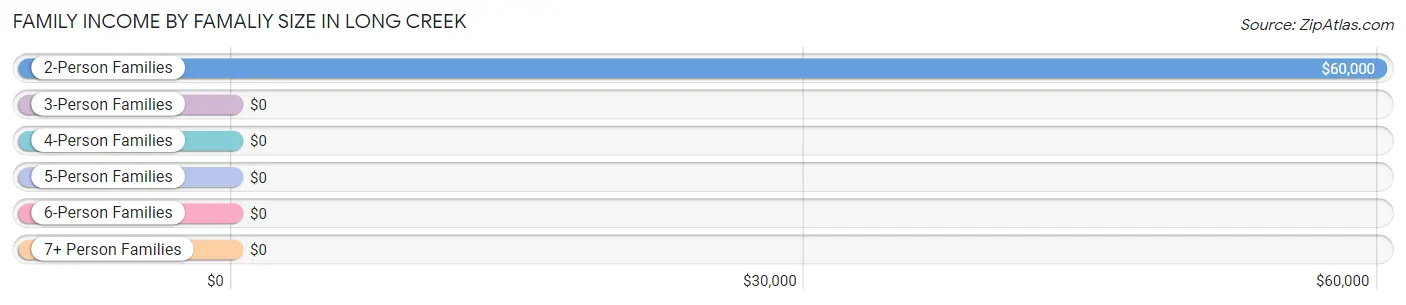
| Income Bracket | # Families | Median Income |
| 2-Person Families | 30 (71.4%) | $60,000 |
| 3-Person Families | 3 (7.1%) | $0 |
| 4-Person Families | 0 (0.0%) | $0 |
| 5-Person Families | 4 (9.5%) | $0 |
| 6-Person Families | 2 (4.8%) | $0 |
| 7+ Person Families | 3 (7.1%) | $0 |
| Total | 42 (100.0%) | $41,389 |
Family Income by Number of Earners in Long Creek
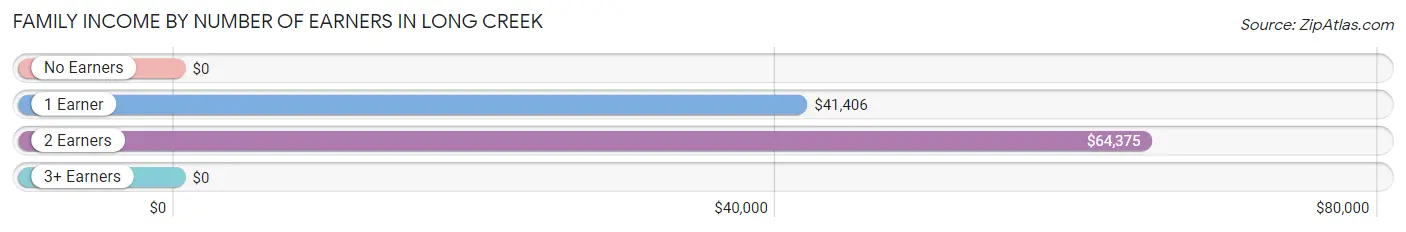
| Number of Earners | # Families | Median Income |
| No Earners | 11 (26.2%) | $0 |
| 1 Earner | 19 (45.2%) | $41,406 |
| 2 Earners | 9 (21.4%) | $64,375 |
| 3+ Earners | 3 (7.1%) | $0 |
| Total | 42 (100.0%) | $41,389 |
Household Income in Long Creek
Household Income Brackets in Long Creek
With 28 households falling in the category, the $15,000 to $24,999 income range is the most frequent in Long Creek, accounting for 32.2% of all households.
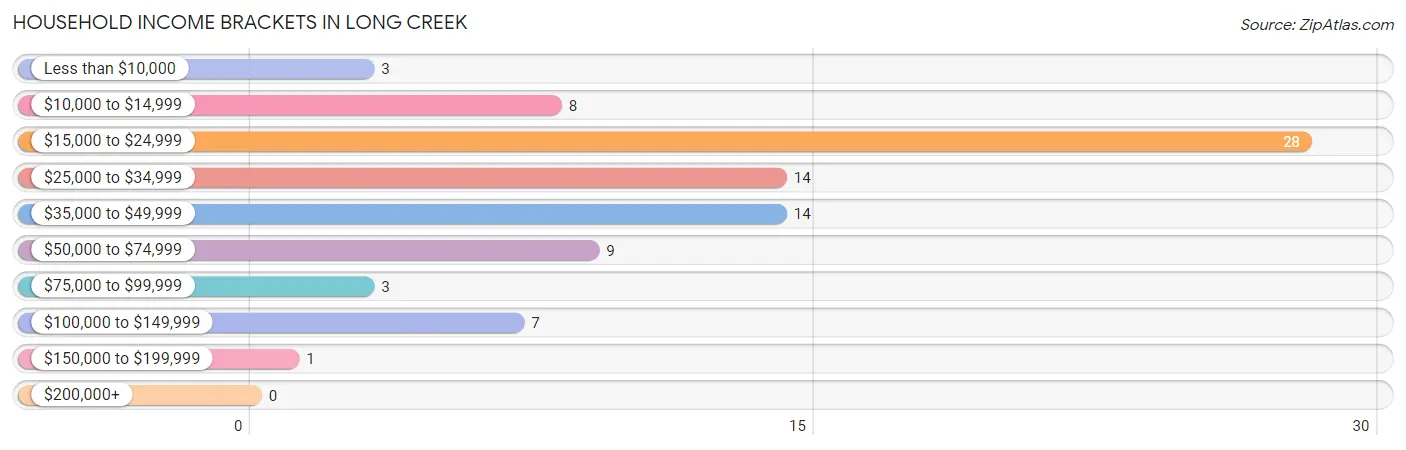
| Income Bracket | # Households | % Households |
| Less than $10,000 | 3 | 3.4% |
| $10,000 to $14,999 | 8 | 9.2% |
| $15,000 to $24,999 | 28 | 32.2% |
| $25,000 to $34,999 | 14 | 16.1% |
| $35,000 to $49,999 | 14 | 16.1% |
| $50,000 to $74,999 | 9 | 10.3% |
| $75,000 to $99,999 | 3 | 3.4% |
| $100,000 to $149,999 | 7 | 8.0% |
| $150,000 to $199,999 | 1 | 1.1% |
| $200,000+ | 0 | 0.0% |
Household Income by Householder Age in Long Creek
The median household income in Long Creek is $30,375, with the highest median household income of $63,125 found in the 45 to 64 years age bracket for the primary householder. A total of 11 households (12.6%) fall into this category.
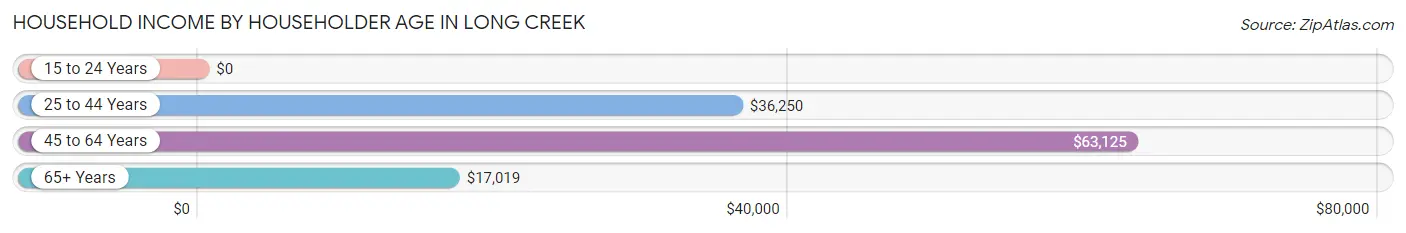
| Income Bracket | # Households | Median Income |
| 15 to 24 Years | 0 (0.0%) | $0 |
| 25 to 44 Years | 14 (16.1%) | $36,250 |
| 45 to 64 Years | 11 (12.6%) | $63,125 |
| 65+ Years | 62 (71.3%) | $17,019 |
| Total | 87 (100.0%) | $30,375 |
Poverty in Long Creek
Income Below Poverty by Sex and Age in Long Creek
With 43.9% poverty level for males and 38.9% for females among the residents of Long Creek, 6 to 11 year old males and 6 to 11 year old females are the most vulnerable to poverty, with 2 males (100.0%) and 2 females (100.0%) in their respective age groups living below the poverty level.
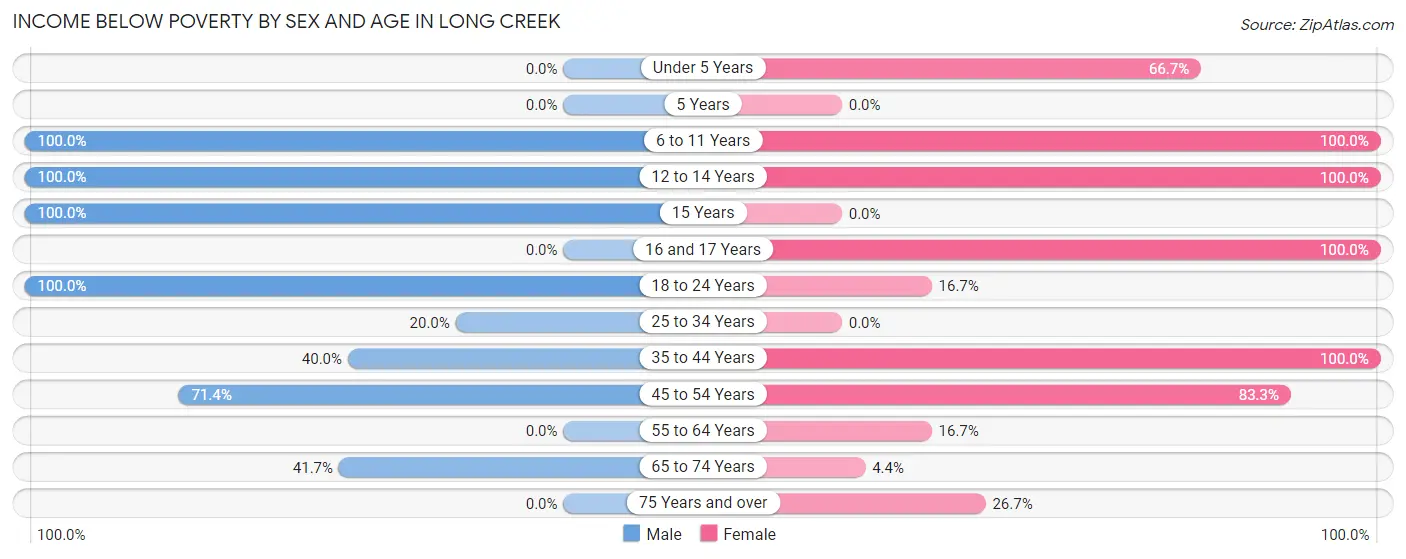
| Age Bracket | Male | Female |
| Under 5 Years | 0 (0.0%) | 10 (66.7%) |
| 5 Years | 0 (0.0%) | 0 (0.0%) |
| 6 to 11 Years | 2 (100.0%) | 2 (100.0%) |
| 12 to 14 Years | 7 (100.0%) | 4 (100.0%) |
| 15 Years | 3 (100.0%) | 0 (0.0%) |
| 16 and 17 Years | 0 (0.0%) | 1 (100.0%) |
| 18 to 24 Years | 11 (100.0%) | 1 (16.7%) |
| 25 to 34 Years | 1 (20.0%) | 0 (0.0%) |
| 35 to 44 Years | 2 (40.0%) | 4 (100.0%) |
| 45 to 54 Years | 5 (71.4%) | 10 (83.3%) |
| 55 to 64 Years | 0 (0.0%) | 1 (16.7%) |
| 65 to 74 Years | 5 (41.7%) | 1 (4.3%) |
| 75 Years and over | 0 (0.0%) | 8 (26.7%) |
| Total | 36 (43.9%) | 42 (38.9%) |
Income Above Poverty by Sex and Age in Long Creek
According to the poverty statistics in Long Creek, males aged under 5 years and females aged 25 to 34 years are the age groups that are most secure financially, with 100.0% of males and 100.0% of females in these age groups living above the poverty line.
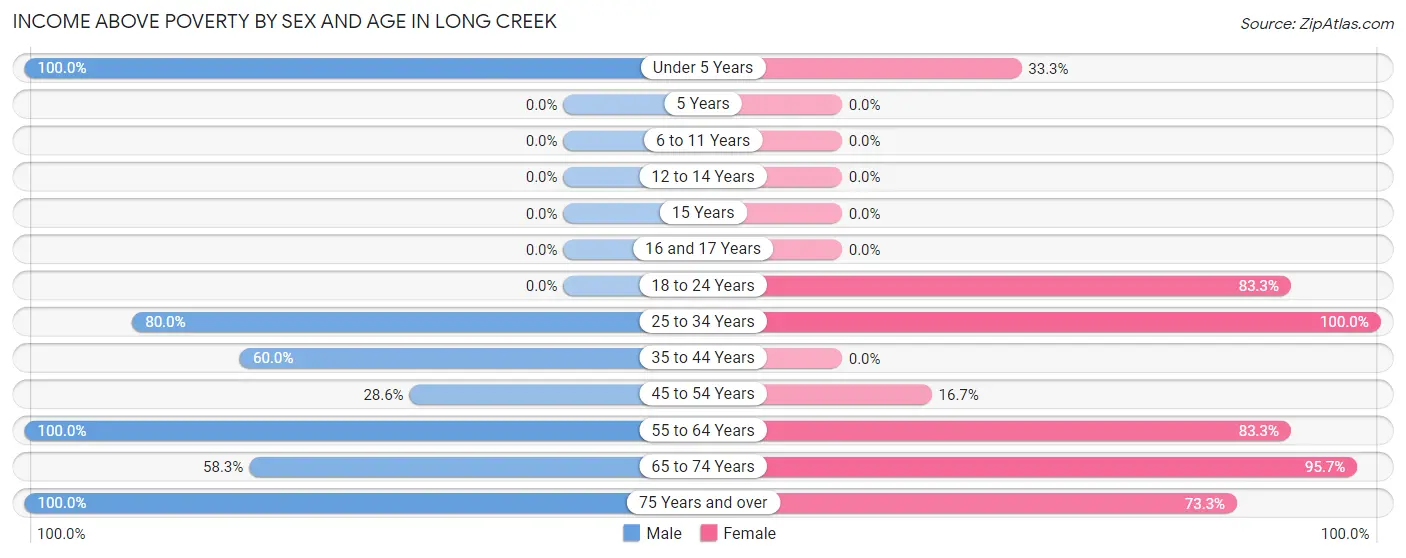
| Age Bracket | Male | Female |
| Under 5 Years | 4 (100.0%) | 5 (33.3%) |
| 5 Years | 0 (0.0%) | 0 (0.0%) |
| 6 to 11 Years | 0 (0.0%) | 0 (0.0%) |
| 12 to 14 Years | 0 (0.0%) | 0 (0.0%) |
| 15 Years | 0 (0.0%) | 0 (0.0%) |
| 16 and 17 Years | 0 (0.0%) | 0 (0.0%) |
| 18 to 24 Years | 0 (0.0%) | 5 (83.3%) |
| 25 to 34 Years | 4 (80.0%) | 5 (100.0%) |
| 35 to 44 Years | 3 (60.0%) | 0 (0.0%) |
| 45 to 54 Years | 2 (28.6%) | 2 (16.7%) |
| 55 to 64 Years | 6 (100.0%) | 5 (83.3%) |
| 65 to 74 Years | 7 (58.3%) | 22 (95.7%) |
| 75 Years and over | 20 (100.0%) | 22 (73.3%) |
| Total | 46 (56.1%) | 66 (61.1%) |
Income Below Poverty Among Married-Couple Families in Long Creek
The poverty statistics for married-couple families in Long Creek show that 32.4% or 11 of the total 34 families live below the poverty line. Families with 1 or 2 children have the highest poverty rate of 100.0%, comprising of 3 families. On the other hand, families with no children have the lowest poverty rate of 12.0%, which includes 3 families.
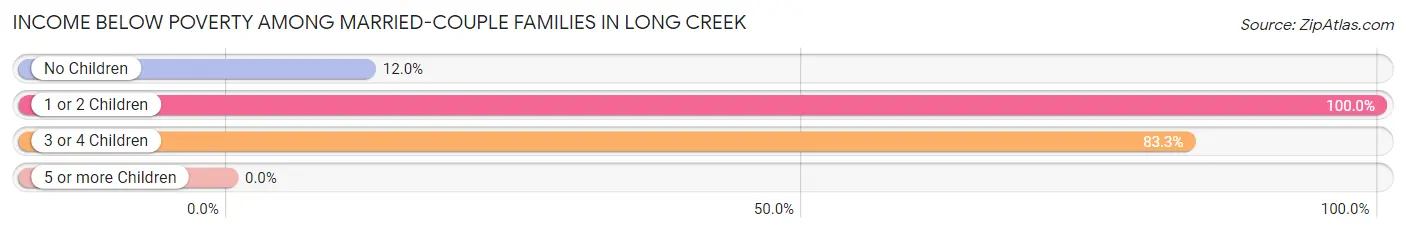
| Children | Above Poverty | Below Poverty |
| No Children | 22 (88.0%) | 3 (12.0%) |
| 1 or 2 Children | 0 (0.0%) | 3 (100.0%) |
| 3 or 4 Children | 1 (16.7%) | 5 (83.3%) |
| 5 or more Children | 0 (0.0%) | 0 (0.0%) |
| Total | 23 (67.6%) | 11 (32.4%) |
Income Below Poverty Among Single-Parent Households in Long Creek
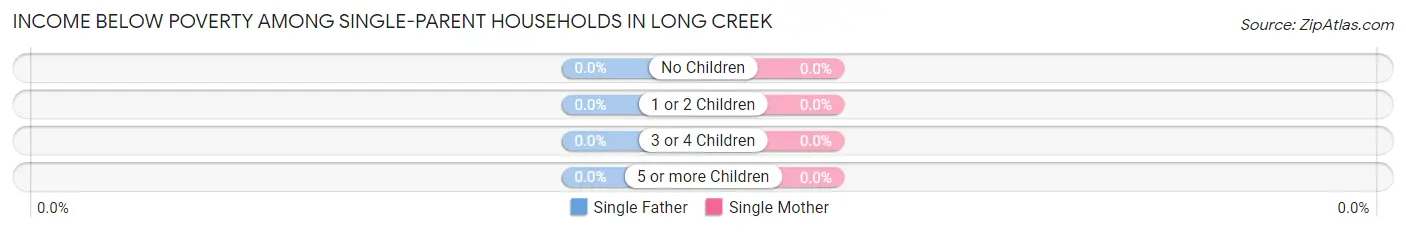
| Children | Single Father | Single Mother |
| No Children | 0 (0.0%) | 0 (0.0%) |
| 1 or 2 Children | 0 (0.0%) | 0 (0.0%) |
| 3 or 4 Children | 0 (0.0%) | 0 (0.0%) |
| 5 or more Children | 0 (0.0%) | 0 (0.0%) |
| Total | 0 (0.0%) | 0 (0.0%) |
Income Below Poverty Among Married-Couple vs Single-Parent Households in Long Creek
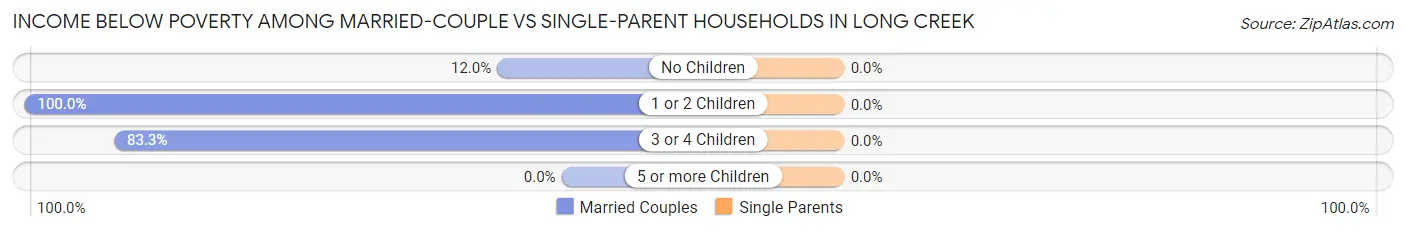
| Children | Married-Couple Families | Single-Parent Households |
| No Children | 3 (12.0%) | 0 (0.0%) |
| 1 or 2 Children | 3 (100.0%) | 0 (0.0%) |
| 3 or 4 Children | 5 (83.3%) | 0 (0.0%) |
| 5 or more Children | 0 (0.0%) | 0 (0.0%) |
| Total | 11 (32.4%) | 0 (0.0%) |
Employment Characteristics in Long Creek
Employment by Class of Employer in Long Creek
Among the 43 employed individuals in Long Creek, not-for-profit organizations (15 | 34.9%), private company employees (11 | 25.6%), and local government employees (6 | 14.0%) make up the most common classes of employment.
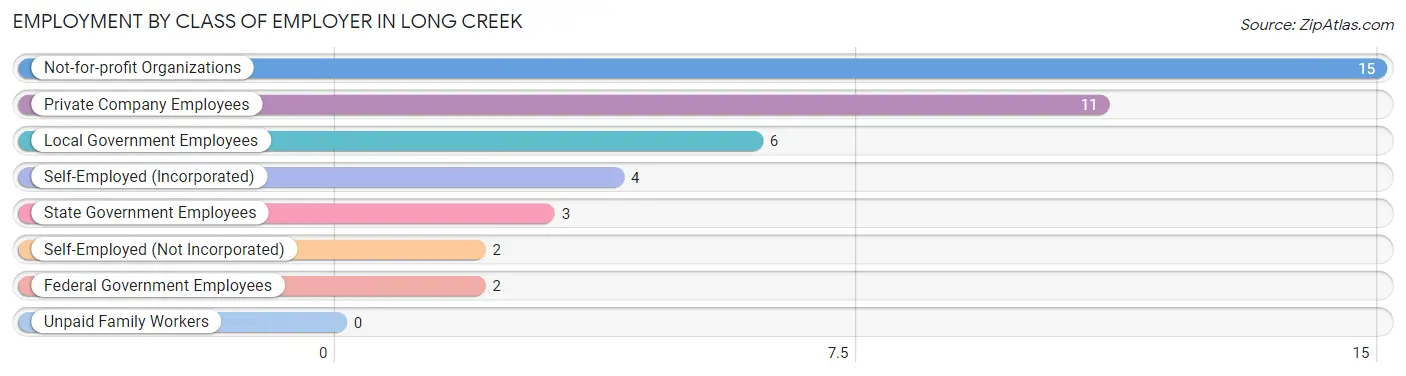
| Employer Class | # Employees | % Employees |
| Private Company Employees | 11 | 25.6% |
| Self-Employed (Incorporated) | 4 | 9.3% |
| Self-Employed (Not Incorporated) | 2 | 4.6% |
| Not-for-profit Organizations | 15 | 34.9% |
| Local Government Employees | 6 | 14.0% |
| State Government Employees | 3 | 7.0% |
| Federal Government Employees | 2 | 4.6% |
| Unpaid Family Workers | 0 | 0.0% |
| Total | 43 | 100.0% |
Employment Status by Age in Long Creek
According to the labor force statistics for Long Creek, out of the total population over 16 years of age (153), 30.7% or 47 individuals are in the labor force, with 6.4% or 3 of them unemployed. The age group with the highest labor force participation rate is 25 to 29 years, with 100.0% or 10 individuals in the labor force. Within the labor force, the 45 to 54 years age range has the highest percentage of unemployed individuals, with 50.0% or 2 of them being unemployed.
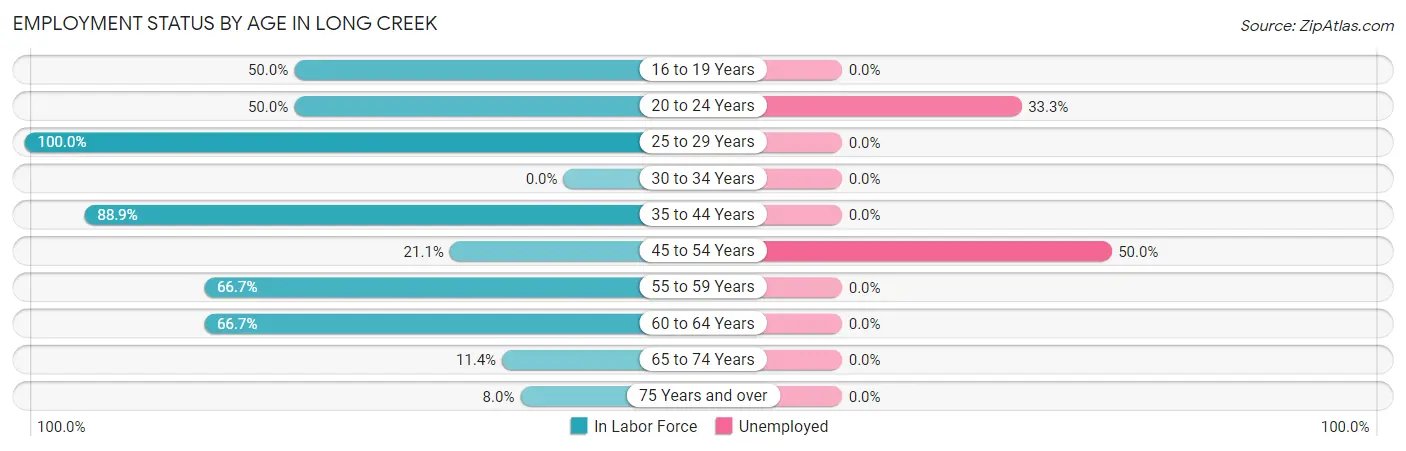
| Age Bracket | In Labor Force | Unemployed |
| 16 to 19 Years | 6 (50.0%) | 0 (0.0%) |
| 20 to 24 Years | 3 (50.0%) | 1 (33.3%) |
| 25 to 29 Years | 10 (100.0%) | 0 (0.0%) |
| 30 to 34 Years | 0 (0.0%) | 0 (0.0%) |
| 35 to 44 Years | 8 (88.9%) | 0 (0.0%) |
| 45 to 54 Years | 4 (21.1%) | 2 (50.0%) |
| 55 to 59 Years | 4 (66.7%) | 0 (0.0%) |
| 60 to 64 Years | 4 (66.7%) | 0 (0.0%) |
| 65 to 74 Years | 4 (11.4%) | 0 (0.0%) |
| 75 Years and over | 4 (8.0%) | 0 (0.0%) |
| Total | 47 (30.7%) | 3 (6.4%) |
Employment Status by Educational Attainment in Long Creek
According to labor force statistics for Long Creek, 60.0% of individuals (30) out of the total population between 25 and 64 years of age (50) are in the labor force, with 6.7% or 2 of them being unemployed. The group with the highest labor force participation rate are those with the educational attainment of bachelor's degree or higher, with 93.8% or 15 individuals in the labor force. Within the labor force, individuals with less than high school education have the highest percentage of unemployment, with 100.0% or 1 of them being unemployed.
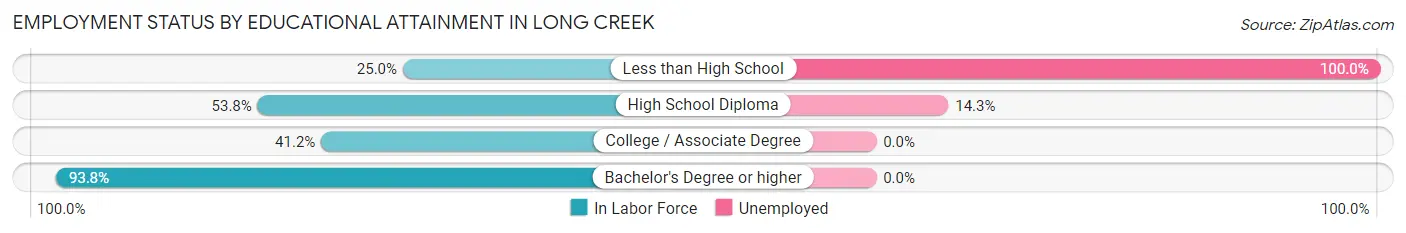
| Educational Attainment | In Labor Force | Unemployed |
| Less than High School | 1 (25.0%) | 4 (100.0%) |
| High School Diploma | 7 (53.8%) | 2 (14.3%) |
| College / Associate Degree | 7 (41.2%) | 0 (0.0%) |
| Bachelor's Degree or higher | 15 (93.8%) | 0 (0.0%) |
| Total | 30 (60.0%) | 3 (6.7%) |
Employment Occupations by Sex in Long Creek
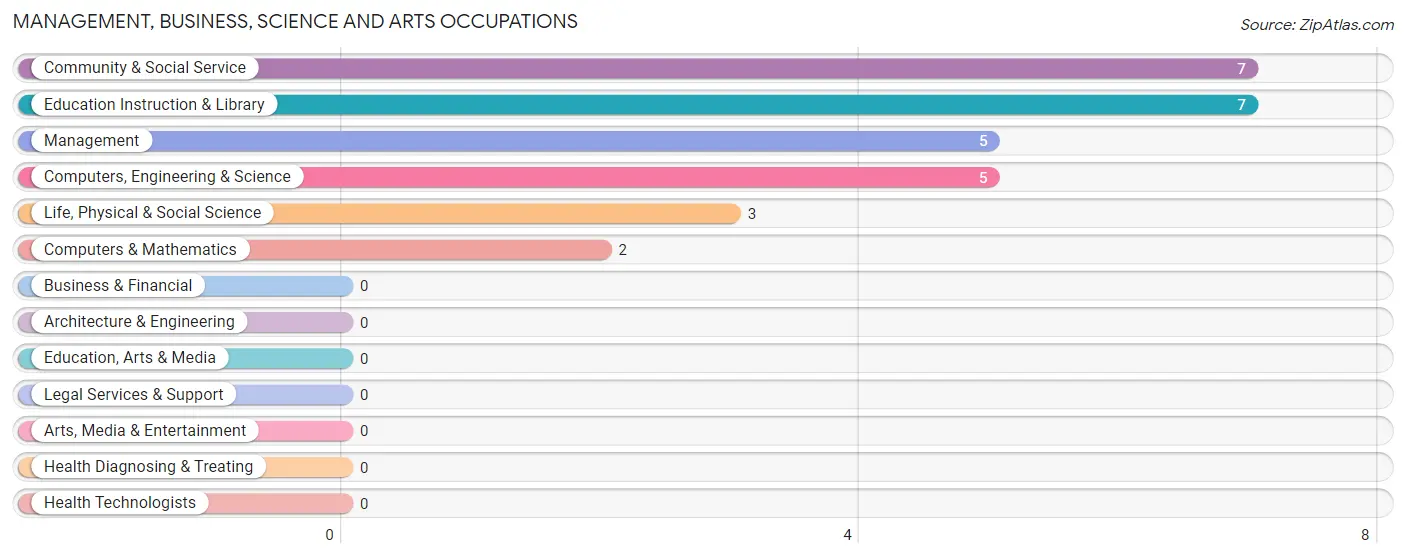
Management, Business, Science and Arts Occupations
The most common Management, Business, Science and Arts occupations in Long Creek are Community & Social Service (7 | 15.9%), Education Instruction & Library (7 | 15.9%), Management (5 | 11.4%), Computers, Engineering & Science (5 | 11.4%), and Life, Physical & Social Science (3 | 6.8%).
Management, Business, Science and Arts Occupations by Sex
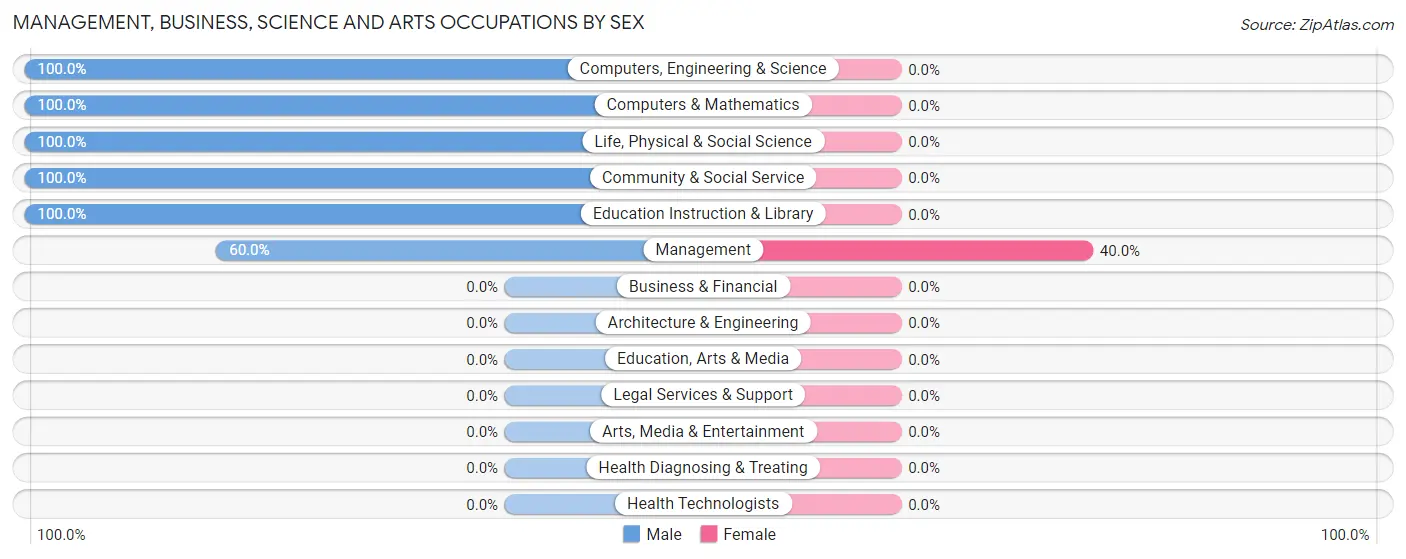
| Occupation | Male | Female |
| Management | 3 (60.0%) | 2 (40.0%) |
| Business & Financial | 0 (0.0%) | 0 (0.0%) |
| Computers, Engineering & Science | 5 (100.0%) | 0 (0.0%) |
| Computers & Mathematics | 2 (100.0%) | 0 (0.0%) |
| Architecture & Engineering | 0 (0.0%) | 0 (0.0%) |
| Life, Physical & Social Science | 3 (100.0%) | 0 (0.0%) |
| Community & Social Service | 7 (100.0%) | 0 (0.0%) |
| Education, Arts & Media | 0 (0.0%) | 0 (0.0%) |
| Legal Services & Support | 0 (0.0%) | 0 (0.0%) |
| Education Instruction & Library | 7 (100.0%) | 0 (0.0%) |
| Arts, Media & Entertainment | 0 (0.0%) | 0 (0.0%) |
| Health Diagnosing & Treating | 0 (0.0%) | 0 (0.0%) |
| Health Technologists | 0 (0.0%) | 0 (0.0%) |
| Total (Category) | 15 (88.2%) | 2 (11.8%) |
| Total (Overall) | 26 (59.1%) | 18 (40.9%) |
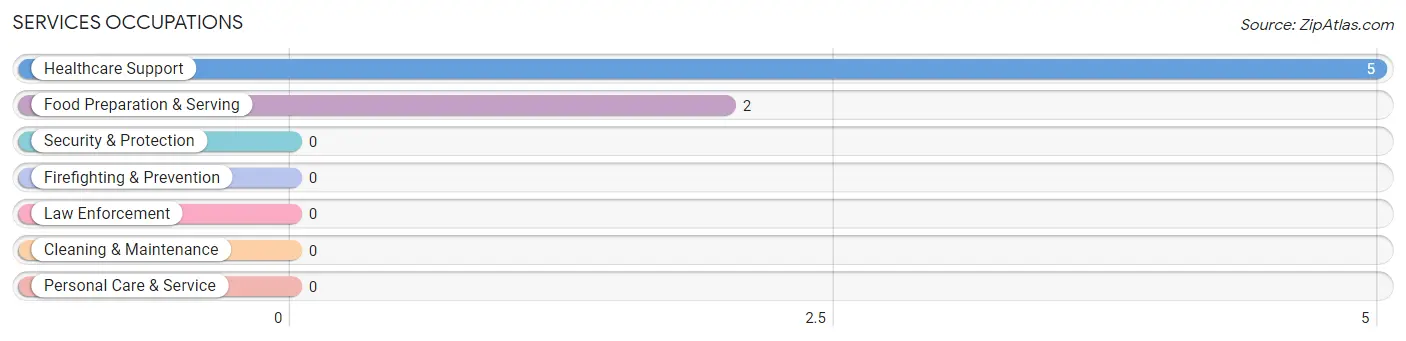
Services Occupations
The most common Services occupations in Long Creek are Healthcare Support (5 | 11.4%), and Food Preparation & Serving (2 | 4.5%).
Services Occupations by Sex
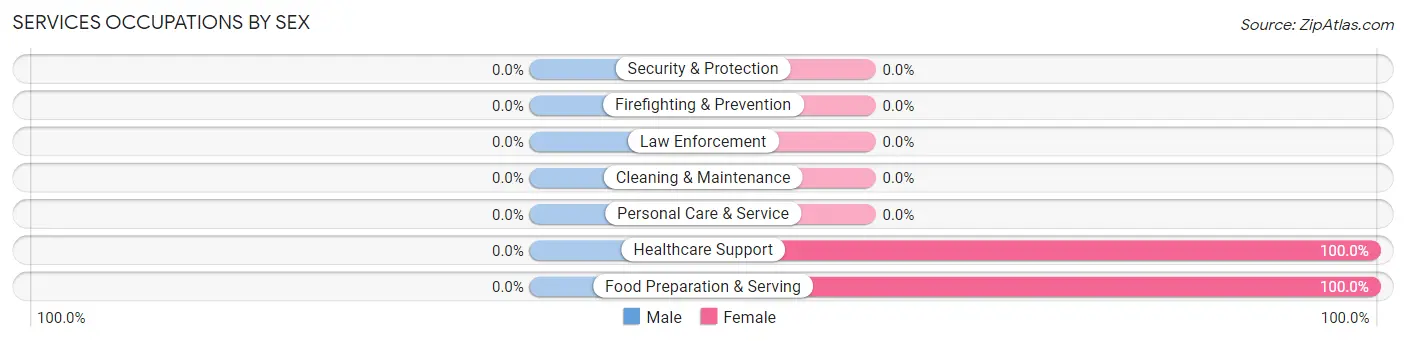
| Occupation | Male | Female |
| Healthcare Support | 0 (0.0%) | 5 (100.0%) |
| Security & Protection | 0 (0.0%) | 0 (0.0%) |
| Firefighting & Prevention | 0 (0.0%) | 0 (0.0%) |
| Law Enforcement | 0 (0.0%) | 0 (0.0%) |
| Food Preparation & Serving | 0 (0.0%) | 2 (100.0%) |
| Cleaning & Maintenance | 0 (0.0%) | 0 (0.0%) |
| Personal Care & Service | 0 (0.0%) | 0 (0.0%) |
| Total (Category) | 0 (0.0%) | 7 (100.0%) |
| Total (Overall) | 26 (59.1%) | 18 (40.9%) |
Sales and Office Occupations
The most common Sales and Office occupations in Long Creek are , and Office & Administration (7 | 15.9%).
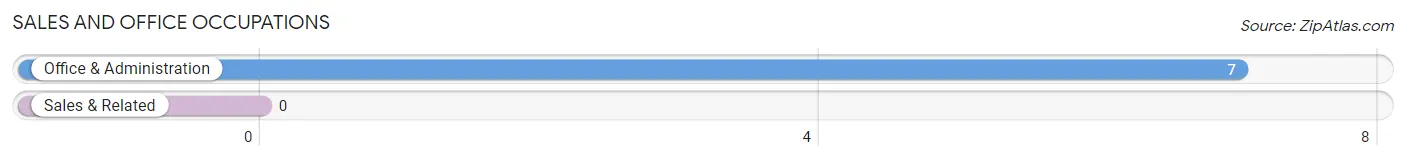
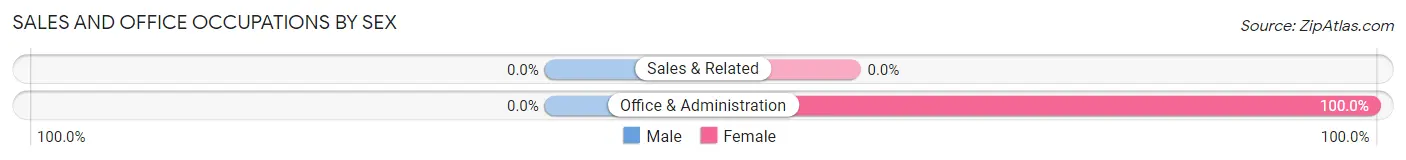
Sales and Office Occupations by Sex
| Occupation | Male | Female |
| Sales & Related | 0 (0.0%) | 0 (0.0%) |
| Office & Administration | 0 (0.0%) | 7 (100.0%) |
| Total (Category) | 0 (0.0%) | 7 (100.0%) |
| Total (Overall) | 26 (59.1%) | 18 (40.9%) |
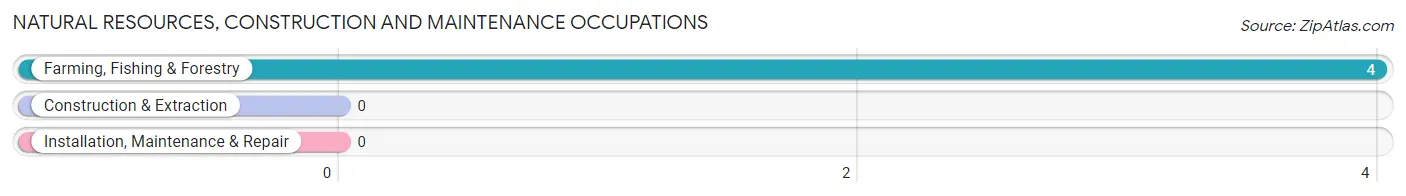
Natural Resources, Construction and Maintenance Occupations
The most common Natural Resources, Construction and Maintenance occupations in Long Creek are , and Farming, Fishing & Forestry (4 | 9.1%).
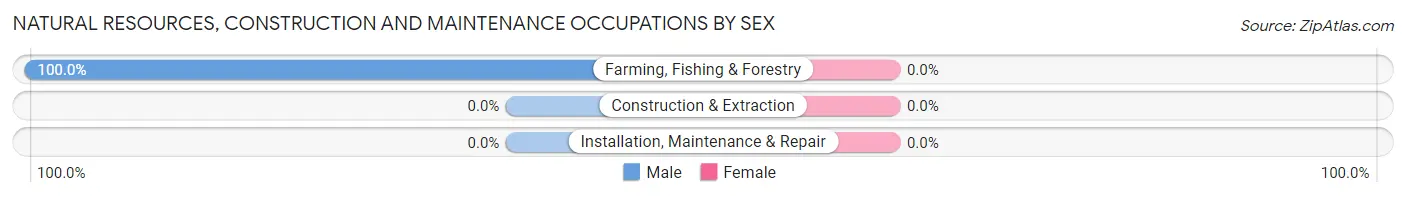
Natural Resources, Construction and Maintenance Occupations by Sex
| Occupation | Male | Female |
| Farming, Fishing & Forestry | 4 (100.0%) | 0 (0.0%) |
| Construction & Extraction | 0 (0.0%) | 0 (0.0%) |
| Installation, Maintenance & Repair | 0 (0.0%) | 0 (0.0%) |
| Total (Category) | 4 (100.0%) | 0 (0.0%) |
| Total (Overall) | 26 (59.1%) | 18 (40.9%) |
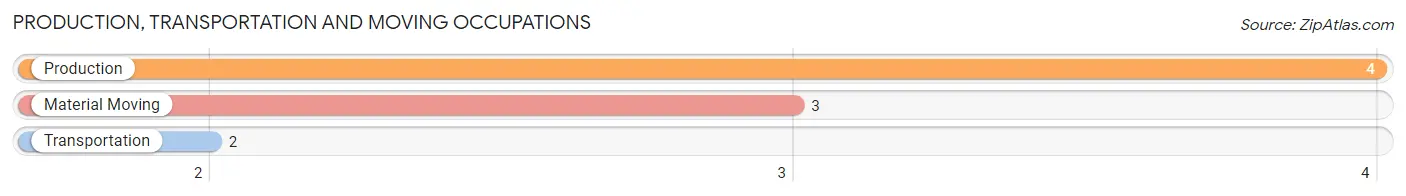
Production, Transportation and Moving Occupations
The most common Production, Transportation and Moving occupations in Long Creek are Production (4 | 9.1%), Material Moving (3 | 6.8%), and Transportation (2 | 4.5%).
Production, Transportation and Moving Occupations by Sex
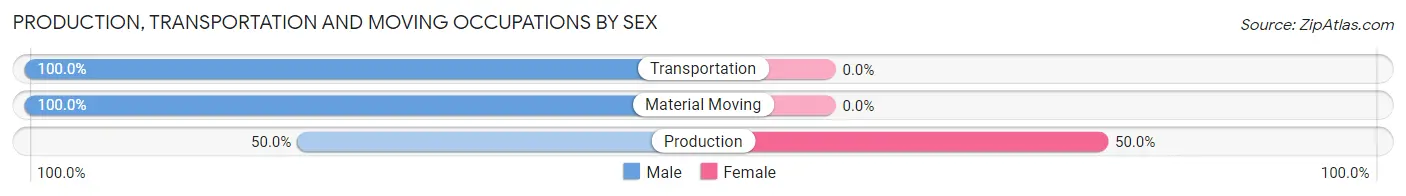
| Occupation | Male | Female |
| Production | 2 (50.0%) | 2 (50.0%) |
| Transportation | 2 (100.0%) | 0 (0.0%) |
| Material Moving | 3 (100.0%) | 0 (0.0%) |
| Total (Category) | 7 (77.8%) | 2 (22.2%) |
| Total (Overall) | 26 (59.1%) | 18 (40.9%) |
Employment Industries by Sex in Long Creek
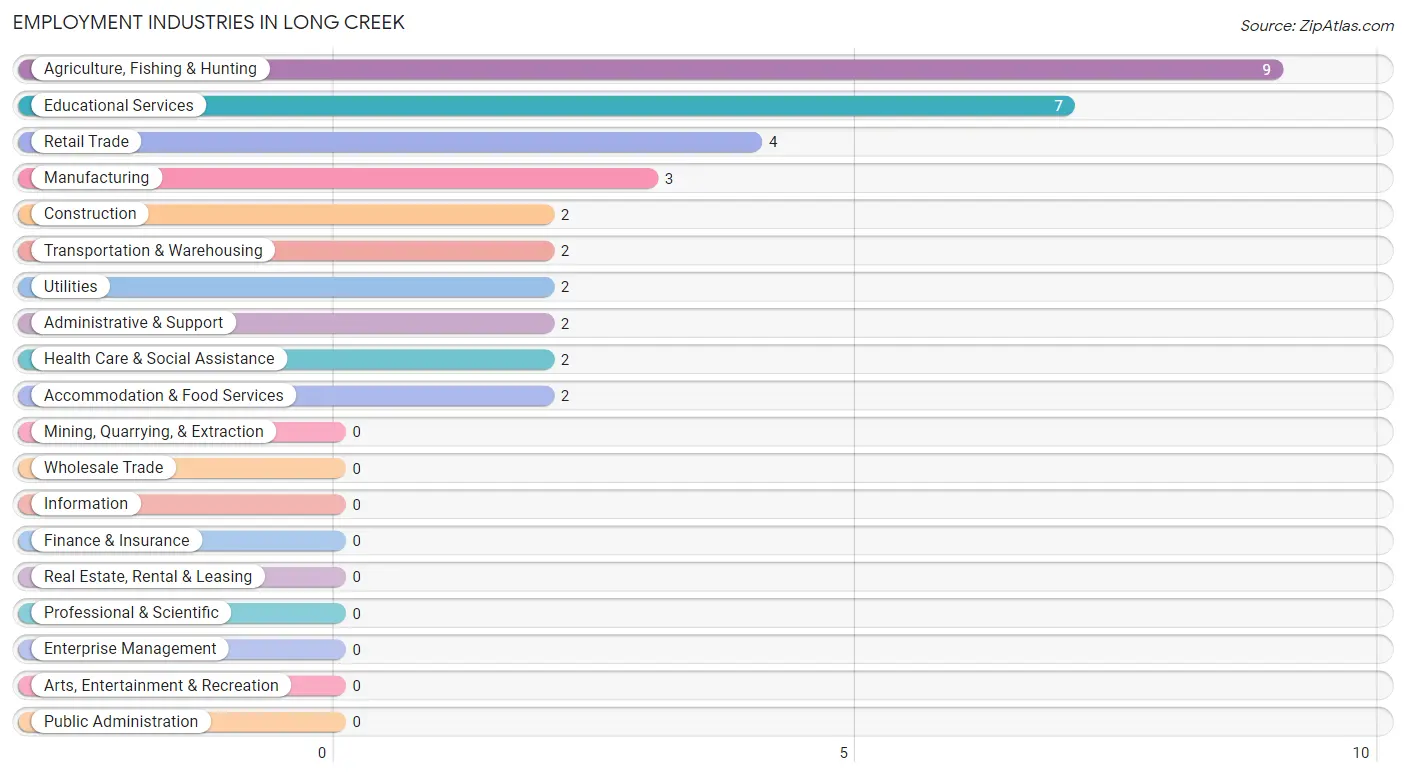
Employment Industries in Long Creek
The major employment industries in Long Creek include Agriculture, Fishing & Hunting (9 | 20.4%), Educational Services (7 | 15.9%), Retail Trade (4 | 9.1%), Manufacturing (3 | 6.8%), and Construction (2 | 4.5%).
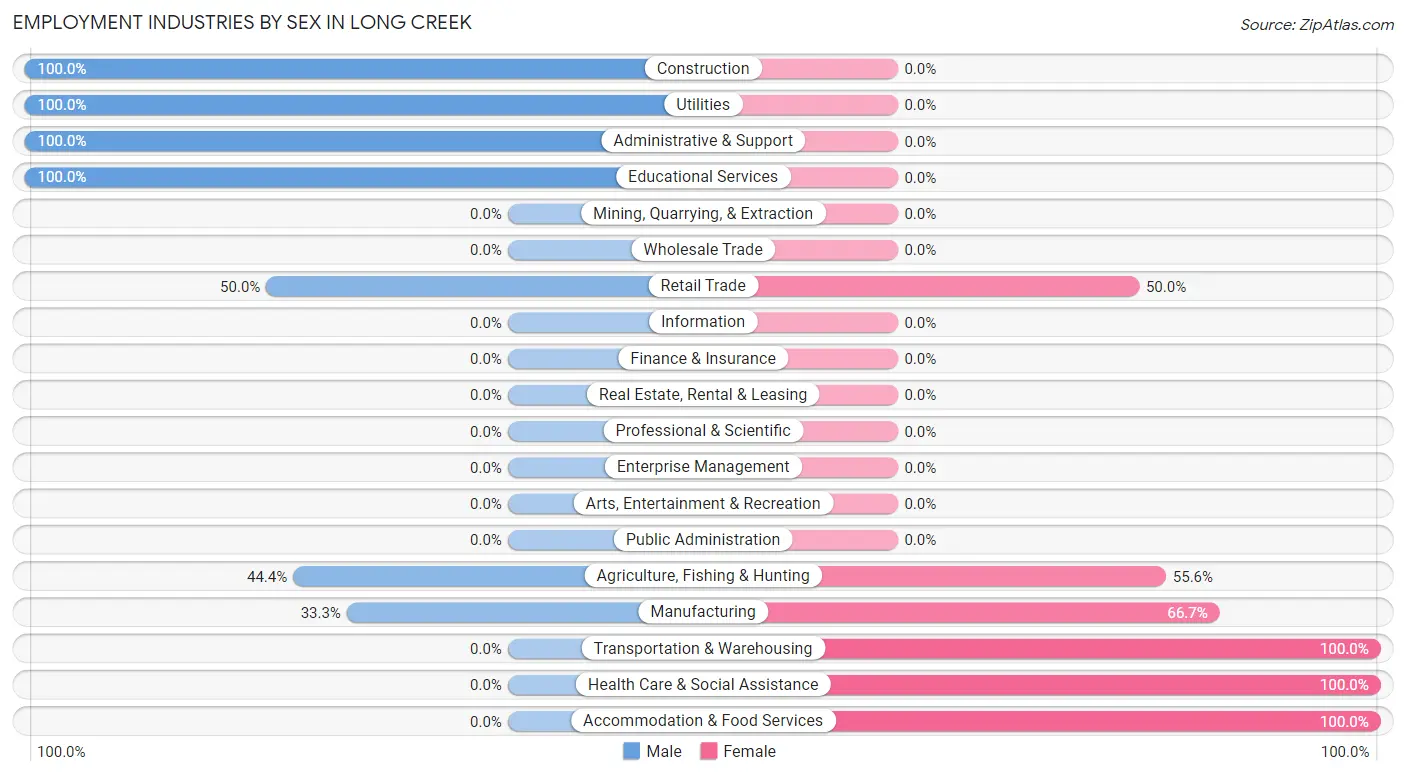
Employment Industries by Sex in Long Creek
The Long Creek industries that see more men than women are Construction (100.0%), Utilities (100.0%), and Administrative & Support (100.0%), whereas the industries that tend to have a higher number of women are Transportation & Warehousing (100.0%), Health Care & Social Assistance (100.0%), and Accommodation & Food Services (100.0%).
| Industry | Male | Female |
| Agriculture, Fishing & Hunting | 4 (44.4%) | 5 (55.6%) |
| Mining, Quarrying, & Extraction | 0 (0.0%) | 0 (0.0%) |
| Construction | 2 (100.0%) | 0 (0.0%) |
| Manufacturing | 1 (33.3%) | 2 (66.7%) |
| Wholesale Trade | 0 (0.0%) | 0 (0.0%) |
| Retail Trade | 2 (50.0%) | 2 (50.0%) |
| Transportation & Warehousing | 0 (0.0%) | 2 (100.0%) |
| Utilities | 2 (100.0%) | 0 (0.0%) |
| Information | 0 (0.0%) | 0 (0.0%) |
| Finance & Insurance | 0 (0.0%) | 0 (0.0%) |
| Real Estate, Rental & Leasing | 0 (0.0%) | 0 (0.0%) |
| Professional & Scientific | 0 (0.0%) | 0 (0.0%) |
| Enterprise Management | 0 (0.0%) | 0 (0.0%) |
| Administrative & Support | 2 (100.0%) | 0 (0.0%) |
| Educational Services | 7 (100.0%) | 0 (0.0%) |
| Health Care & Social Assistance | 0 (0.0%) | 2 (100.0%) |
| Arts, Entertainment & Recreation | 0 (0.0%) | 0 (0.0%) |
| Accommodation & Food Services | 0 (0.0%) | 2 (100.0%) |
| Public Administration | 0 (0.0%) | 0 (0.0%) |
| Total | 26 (59.1%) | 18 (40.9%) |
Education in Long Creek
School Enrollment in Long Creek
The most common levels of schooling among the 31 students in Long Creek are high school (16 | 51.6%), nursery / preschool (5 | 16.1%), and middle school (4 | 12.9%).
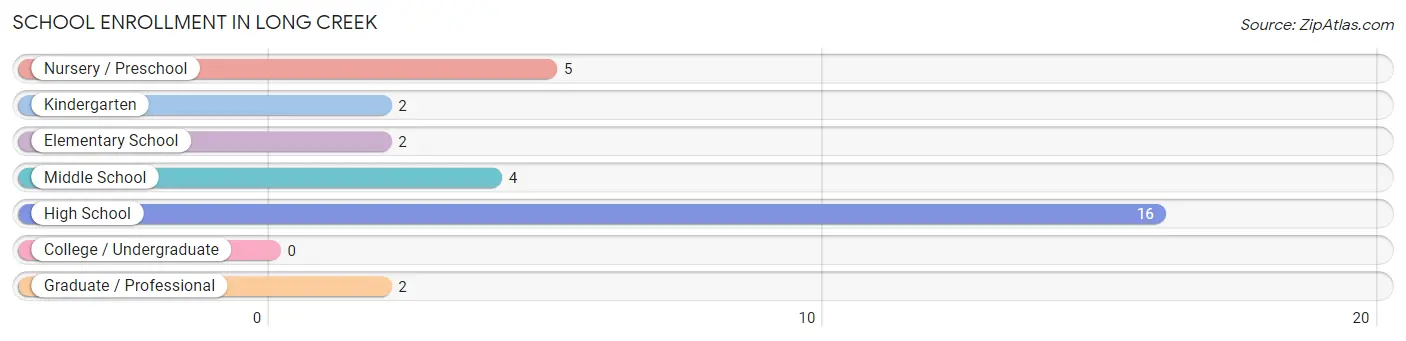
| School Level | # Students | % Students |
| Nursery / Preschool | 5 | 16.1% |
| Kindergarten | 2 | 6.5% |
| Elementary School | 2 | 6.5% |
| Middle School | 4 | 12.9% |
| High School | 16 | 51.6% |
| College / Undergraduate | 0 | 0.0% |
| Graduate / Professional | 2 | 6.5% |
| Total | 31 | 100.0% |
School Enrollment by Age by Funding Source in Long Creek
Out of a total of 31 students who are enrolled in schools in Long Creek, 10 (32.3%) attend a private institution, while the remaining 21 (67.7%) are enrolled in public schools. The age group of 5 to 9 year old has the highest likelihood of being enrolled in private schools, with 4 (100.0% in the age bracket) enrolled. Conversely, the age group of 3 to 4 year olds has the lowest likelihood of being enrolled in a private school, with 5 (100.0% in the age bracket) attending a public institution.
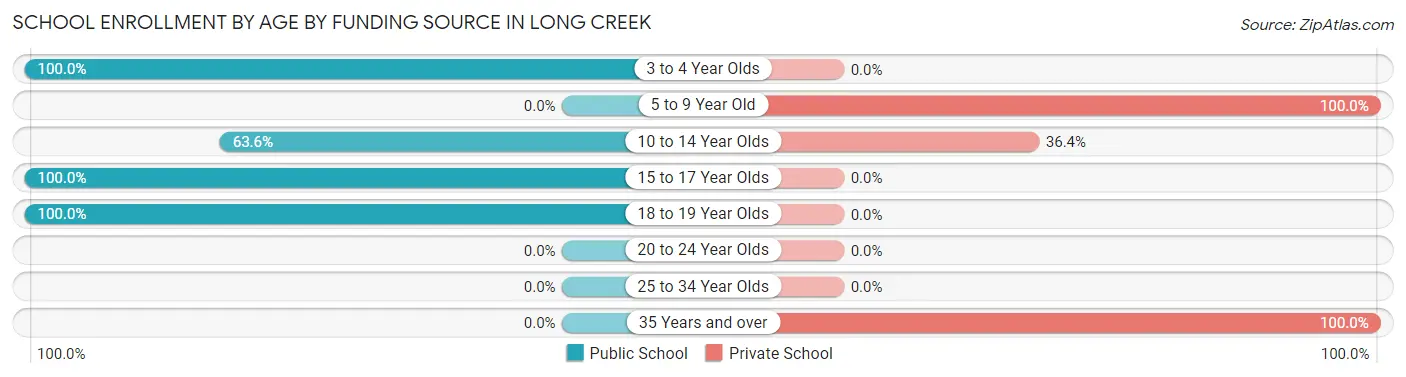
| Age Bracket | Public School | Private School |
| 3 to 4 Year Olds | 5 (100.0%) | 0 (0.0%) |
| 5 to 9 Year Old | 0 (0.0%) | 4 (100.0%) |
| 10 to 14 Year Olds | 7 (63.6%) | 4 (36.4%) |
| 15 to 17 Year Olds | 4 (100.0%) | 0 (0.0%) |
| 18 to 19 Year Olds | 5 (100.0%) | 0 (0.0%) |
| 20 to 24 Year Olds | 0 (0.0%) | 0 (0.0%) |
| 25 to 34 Year Olds | 0 (0.0%) | 0 (0.0%) |
| 35 Years and over | 0 (0.0%) | 2 (100.0%) |
| Total | 21 (67.7%) | 10 (32.3%) |
Educational Attainment by Field of Study in Long Creek
Bio, nature & agricultural (8 | 30.8%), education (4 | 15.4%), literature & languages (4 | 15.4%), physical & health sciences (3 | 11.5%), and science & technology (3 | 11.5%) are the most common fields of study among 26 individuals in Long Creek who have obtained a bachelor's degree or higher.
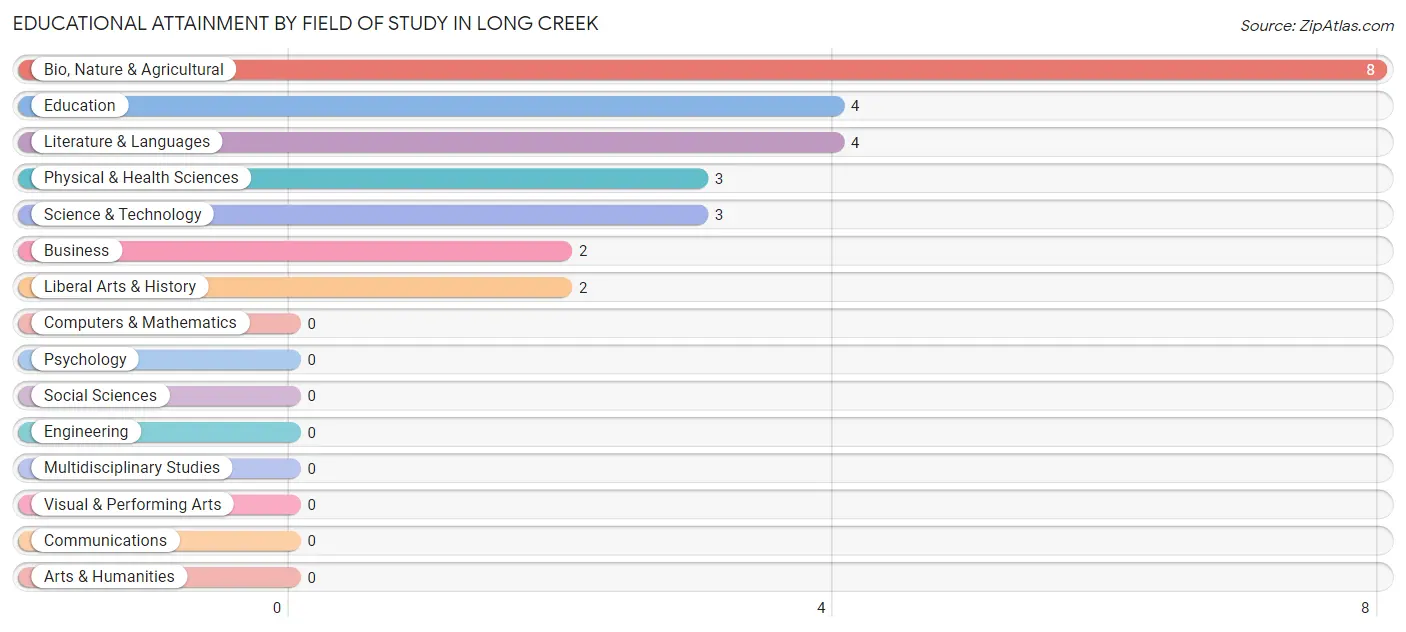
| Field of Study | # Graduates | % Graduates |
| Computers & Mathematics | 0 | 0.0% |
| Bio, Nature & Agricultural | 8 | 30.8% |
| Physical & Health Sciences | 3 | 11.5% |
| Psychology | 0 | 0.0% |
| Social Sciences | 0 | 0.0% |
| Engineering | 0 | 0.0% |
| Multidisciplinary Studies | 0 | 0.0% |
| Science & Technology | 3 | 11.5% |
| Business | 2 | 7.7% |
| Education | 4 | 15.4% |
| Literature & Languages | 4 | 15.4% |
| Liberal Arts & History | 2 | 7.7% |
| Visual & Performing Arts | 0 | 0.0% |
| Communications | 0 | 0.0% |
| Arts & Humanities | 0 | 0.0% |
| Total | 26 | 100.0% |
Transportation & Commute in Long Creek
Vehicle Availability by Sex in Long Creek
The most prevalent vehicle ownership categories in Long Creek are males with 2 vehicles (11, accounting for 44.0%) and females with 2 vehicles (2, making up 61.1%).
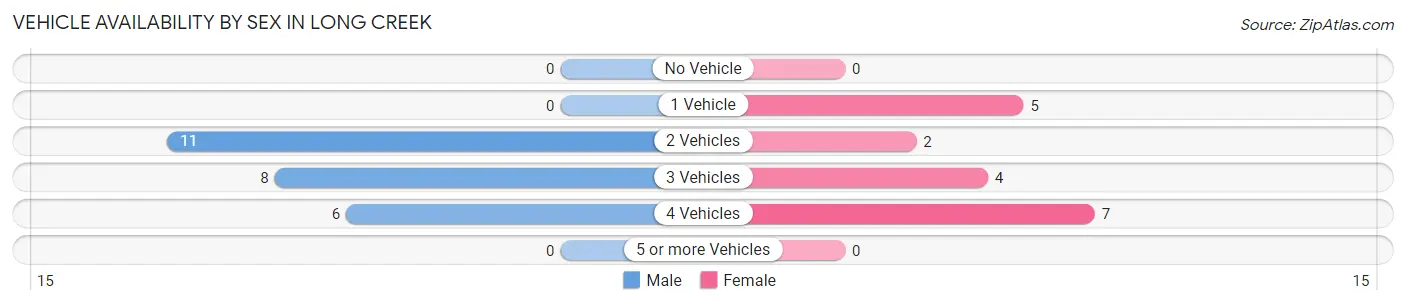
| Vehicles Available | Male | Female |
| No Vehicle | 0 (0.0%) | 0 (0.0%) |
| 1 Vehicle | 0 (0.0%) | 5 (27.8%) |
| 2 Vehicles | 11 (44.0%) | 2 (11.1%) |
| 3 Vehicles | 8 (32.0%) | 4 (22.2%) |
| 4 Vehicles | 6 (24.0%) | 7 (38.9%) |
| 5 or more Vehicles | 0 (0.0%) | 0 (0.0%) |
| Total | 25 (100.0%) | 18 (100.0%) |
Commute Time in Long Creek
The most frequently occuring commute durations in Long Creek are less than 5 minutes (13 commuters, 30.2%), 5 to 9 minutes (9 commuters, 20.9%), and 10 to 14 minutes (6 commuters, 14.0%).
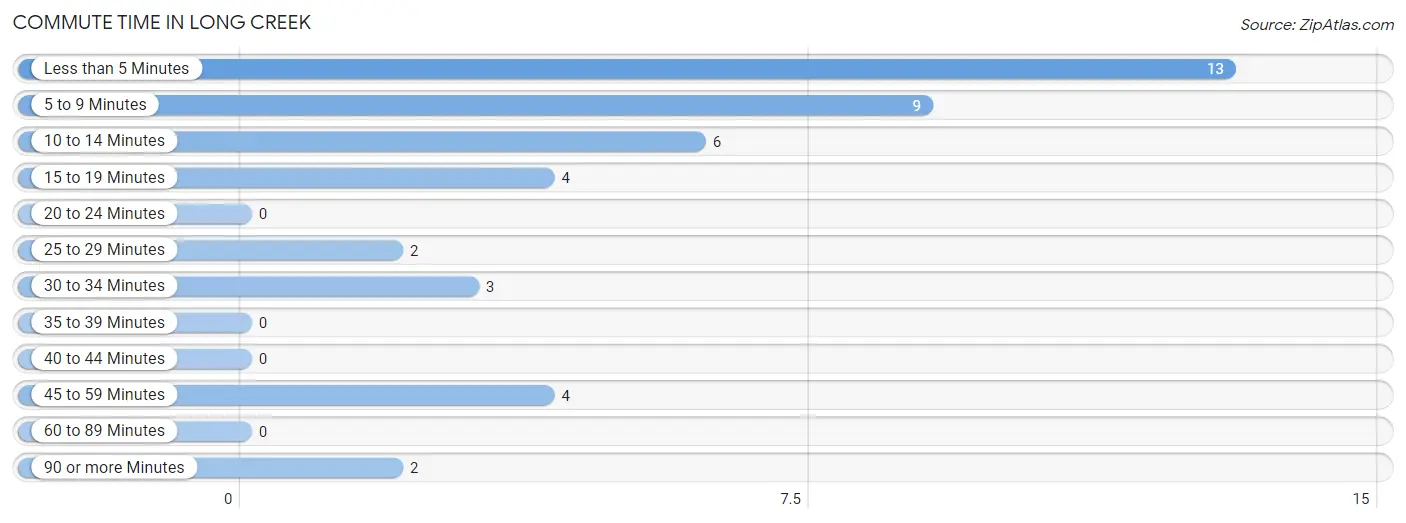
| Commute Time | # Commuters | % Commuters |
| Less than 5 Minutes | 13 | 30.2% |
| 5 to 9 Minutes | 9 | 20.9% |
| 10 to 14 Minutes | 6 | 14.0% |
| 15 to 19 Minutes | 4 | 9.3% |
| 20 to 24 Minutes | 0 | 0.0% |
| 25 to 29 Minutes | 2 | 4.6% |
| 30 to 34 Minutes | 3 | 7.0% |
| 35 to 39 Minutes | 0 | 0.0% |
| 40 to 44 Minutes | 0 | 0.0% |
| 45 to 59 Minutes | 4 | 9.3% |
| 60 to 89 Minutes | 0 | 0.0% |
| 90 or more Minutes | 2 | 4.6% |
Commute Time by Sex in Long Creek
The most common commute times in Long Creek are less than 5 minutes (6 commuters, 24.0%) for males and 5 to 9 minutes (9 commuters, 50.0%) for females.
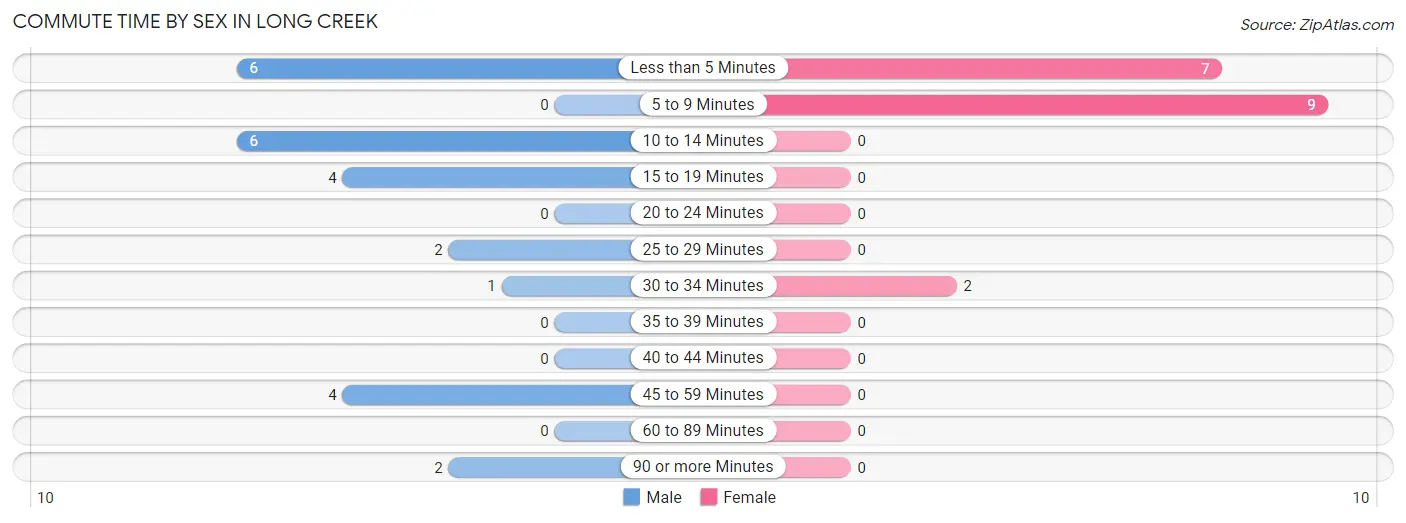
| Commute Time | Male | Female |
| Less than 5 Minutes | 6 (24.0%) | 7 (38.9%) |
| 5 to 9 Minutes | 0 (0.0%) | 9 (50.0%) |
| 10 to 14 Minutes | 6 (24.0%) | 0 (0.0%) |
| 15 to 19 Minutes | 4 (16.0%) | 0 (0.0%) |
| 20 to 24 Minutes | 0 (0.0%) | 0 (0.0%) |
| 25 to 29 Minutes | 2 (8.0%) | 0 (0.0%) |
| 30 to 34 Minutes | 1 (4.0%) | 2 (11.1%) |
| 35 to 39 Minutes | 0 (0.0%) | 0 (0.0%) |
| 40 to 44 Minutes | 0 (0.0%) | 0 (0.0%) |
| 45 to 59 Minutes | 4 (16.0%) | 0 (0.0%) |
| 60 to 89 Minutes | 0 (0.0%) | 0 (0.0%) |
| 90 or more Minutes | 2 (8.0%) | 0 (0.0%) |
Time of Departure to Work by Sex in Long Creek
The most frequent times of departure to work in Long Creek are 7:30 AM to 7:59 AM (9, 36.0%) for males and 6:00 AM to 6:29 AM (5, 27.8%) for females.
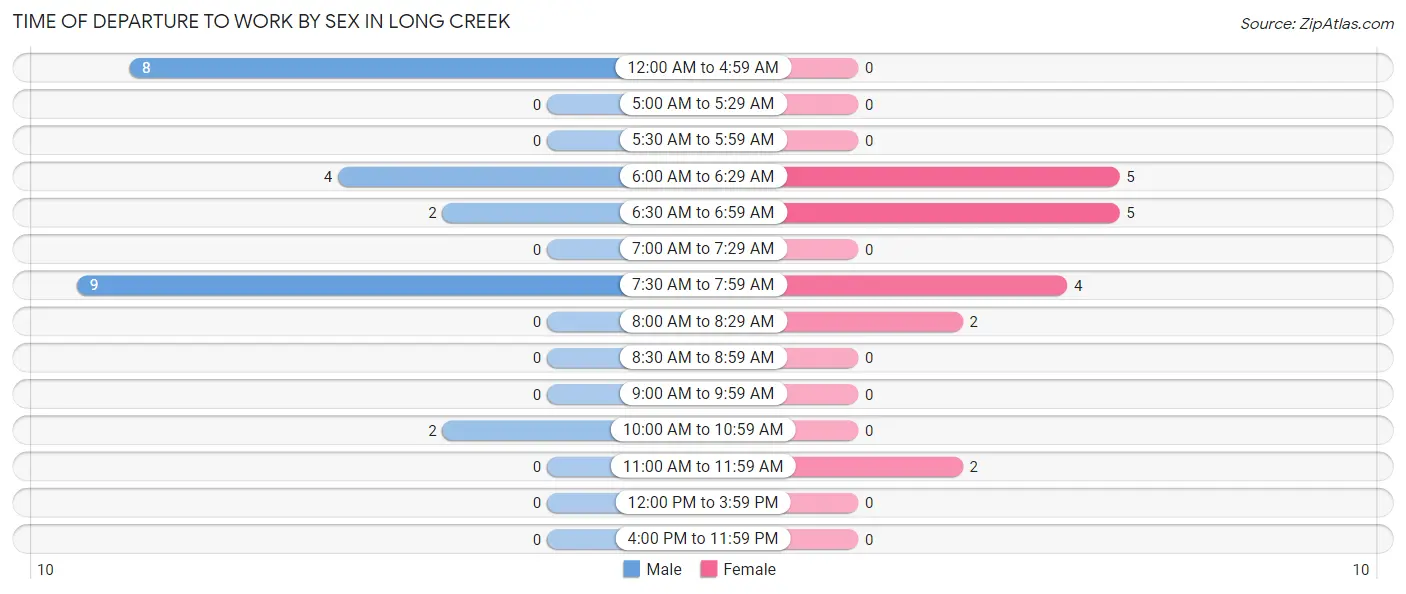
| Time of Departure | Male | Female |
| 12:00 AM to 4:59 AM | 8 (32.0%) | 0 (0.0%) |
| 5:00 AM to 5:29 AM | 0 (0.0%) | 0 (0.0%) |
| 5:30 AM to 5:59 AM | 0 (0.0%) | 0 (0.0%) |
| 6:00 AM to 6:29 AM | 4 (16.0%) | 5 (27.8%) |
| 6:30 AM to 6:59 AM | 2 (8.0%) | 5 (27.8%) |
| 7:00 AM to 7:29 AM | 0 (0.0%) | 0 (0.0%) |
| 7:30 AM to 7:59 AM | 9 (36.0%) | 4 (22.2%) |
| 8:00 AM to 8:29 AM | 0 (0.0%) | 2 (11.1%) |
| 8:30 AM to 8:59 AM | 0 (0.0%) | 0 (0.0%) |
| 9:00 AM to 9:59 AM | 0 (0.0%) | 0 (0.0%) |
| 10:00 AM to 10:59 AM | 2 (8.0%) | 0 (0.0%) |
| 11:00 AM to 11:59 AM | 0 (0.0%) | 2 (11.1%) |
| 12:00 PM to 3:59 PM | 0 (0.0%) | 0 (0.0%) |
| 4:00 PM to 11:59 PM | 0 (0.0%) | 0 (0.0%) |
| Total | 25 (100.0%) | 18 (100.0%) |
Housing Occupancy in Long Creek
Occupancy by Ownership in Long Creek
Of the total 87 dwellings in Long Creek, owner-occupied units account for 71 (81.6%), while renter-occupied units make up 16 (18.4%).
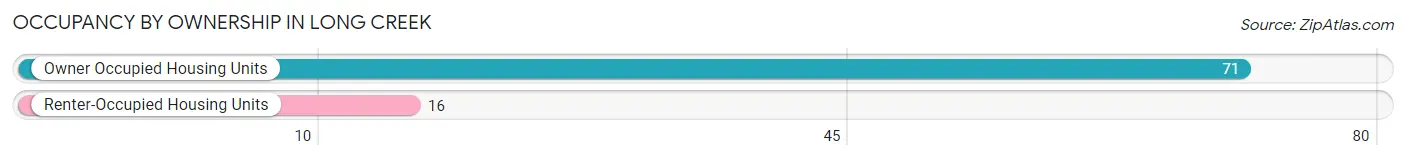
| Occupancy | # Housing Units | % Housing Units |
| Owner Occupied Housing Units | 71 | 81.6% |
| Renter-Occupied Housing Units | 16 | 18.4% |
| Total Occupied Housing Units | 87 | 100.0% |
Occupancy by Household Size in Long Creek
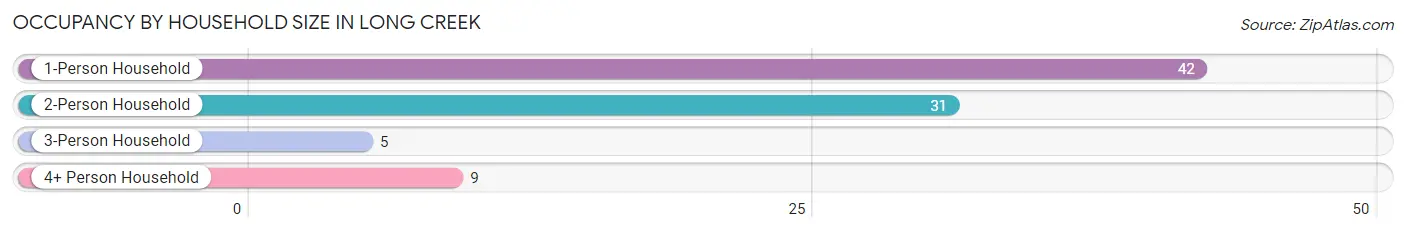
| Household Size | # Housing Units | % Housing Units |
| 1-Person Household | 42 | 48.3% |
| 2-Person Household | 31 | 35.6% |
| 3-Person Household | 5 | 5.8% |
| 4+ Person Household | 9 | 10.3% |
| Total Housing Units | 87 | 100.0% |
Occupancy by Ownership by Household Size in Long Creek
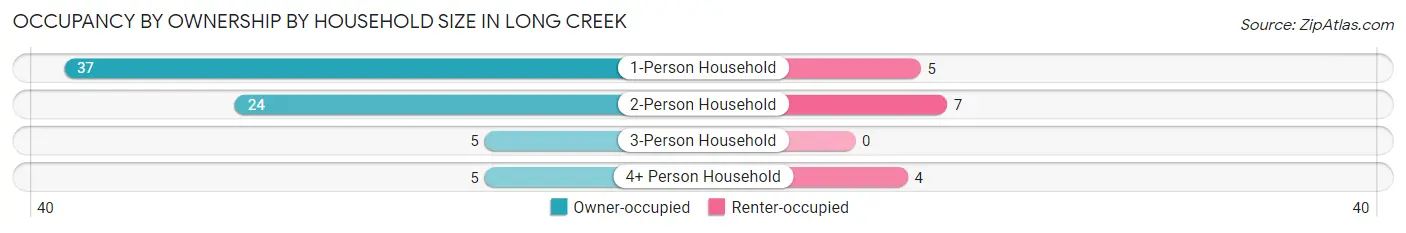
| Household Size | Owner-occupied | Renter-occupied |
| 1-Person Household | 37 (88.1%) | 5 (11.9%) |
| 2-Person Household | 24 (77.4%) | 7 (22.6%) |
| 3-Person Household | 5 (100.0%) | 0 (0.0%) |
| 4+ Person Household | 5 (55.6%) | 4 (44.4%) |
| Total Housing Units | 71 (81.6%) | 16 (18.4%) |
Occupancy by Educational Attainment in Long Creek
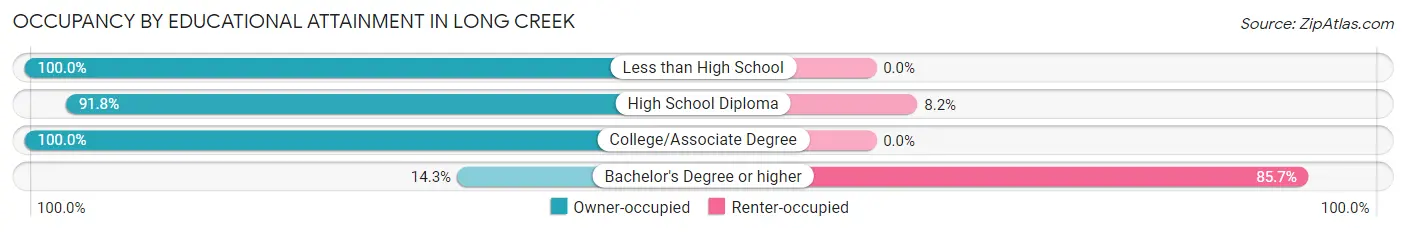
| Household Size | Owner-occupied | Renter-occupied |
| Less than High School | 12 (100.0%) | 0 (0.0%) |
| High School Diploma | 45 (91.8%) | 4 (8.2%) |
| College/Associate Degree | 12 (100.0%) | 0 (0.0%) |
| Bachelor's Degree or higher | 2 (14.3%) | 12 (85.7%) |
Occupancy by Age of Householder in Long Creek
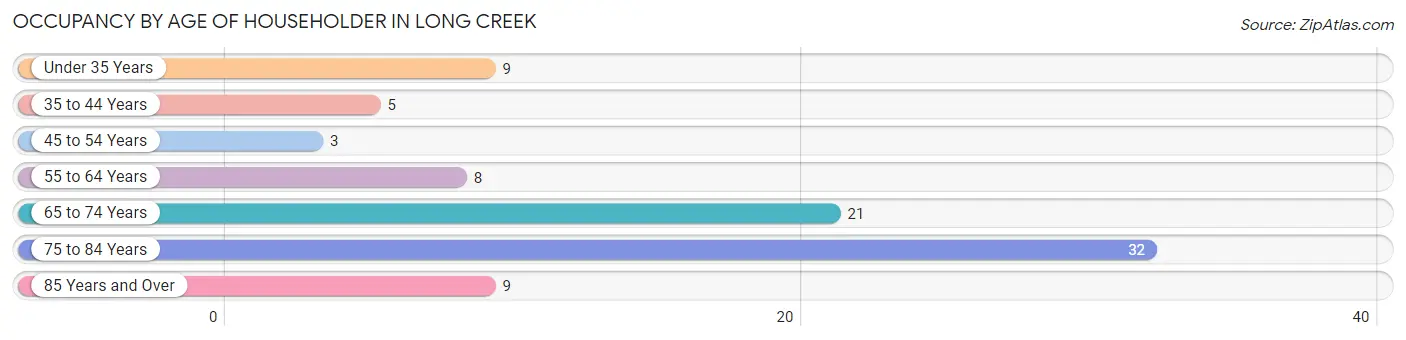
| Age Bracket | # Households | % Households |
| Under 35 Years | 9 | 10.3% |
| 35 to 44 Years | 5 | 5.8% |
| 45 to 54 Years | 3 | 3.5% |
| 55 to 64 Years | 8 | 9.2% |
| 65 to 74 Years | 21 | 24.1% |
| 75 to 84 Years | 32 | 36.8% |
| 85 Years and Over | 9 | 10.3% |
| Total | 87 | 100.0% |
Housing Finances in Long Creek
Median Income by Occupancy in Long Creek
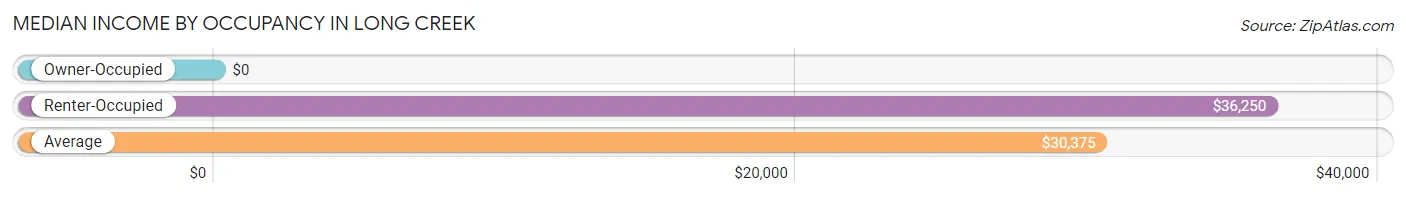
| Occupancy Type | # Households | Median Income |
| Owner-Occupied | 71 (81.6%) | $0 |
| Renter-Occupied | 16 (18.4%) | $36,250 |
| Average | 87 (100.0%) | $30,375 |
Occupancy by Householder Income Bracket in Long Creek
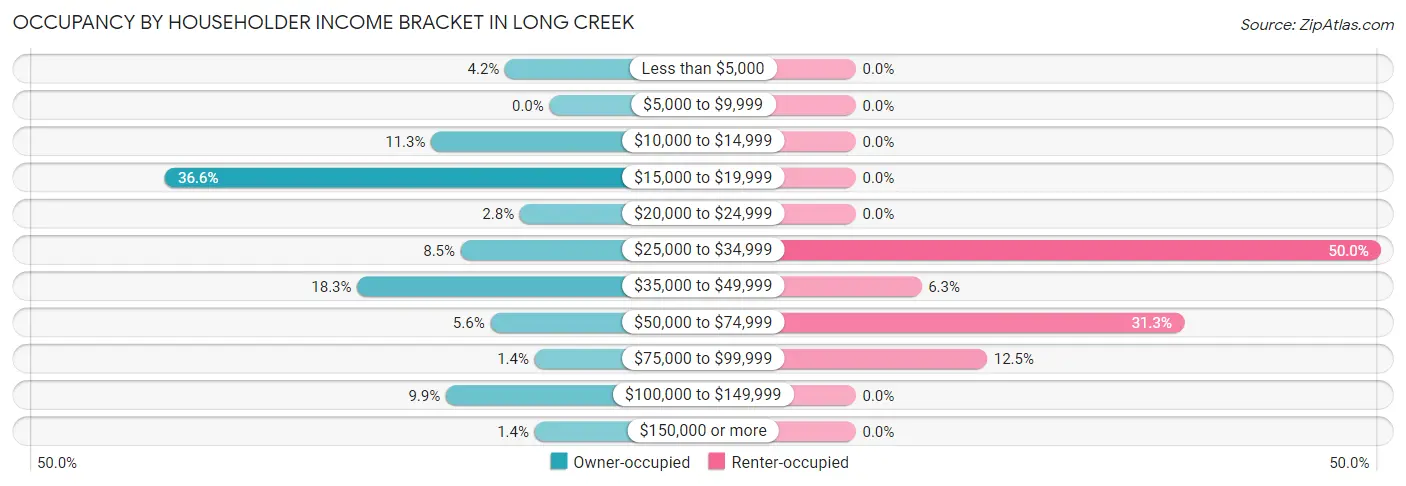
| Income Bracket | Owner-occupied | Renter-occupied |
| Less than $5,000 | 3 (4.2%) | 0 (0.0%) |
| $5,000 to $9,999 | 0 (0.0%) | 0 (0.0%) |
| $10,000 to $14,999 | 8 (11.3%) | 0 (0.0%) |
| $15,000 to $19,999 | 26 (36.6%) | 0 (0.0%) |
| $20,000 to $24,999 | 2 (2.8%) | 0 (0.0%) |
| $25,000 to $34,999 | 6 (8.5%) | 8 (50.0%) |
| $35,000 to $49,999 | 13 (18.3%) | 1 (6.2%) |
| $50,000 to $74,999 | 4 (5.6%) | 5 (31.2%) |
| $75,000 to $99,999 | 1 (1.4%) | 2 (12.5%) |
| $100,000 to $149,999 | 7 (9.9%) | 0 (0.0%) |
| $150,000 or more | 1 (1.4%) | 0 (0.0%) |
| Total | 71 (100.0%) | 16 (100.0%) |
Monthly Housing Cost Tiers in Long Creek
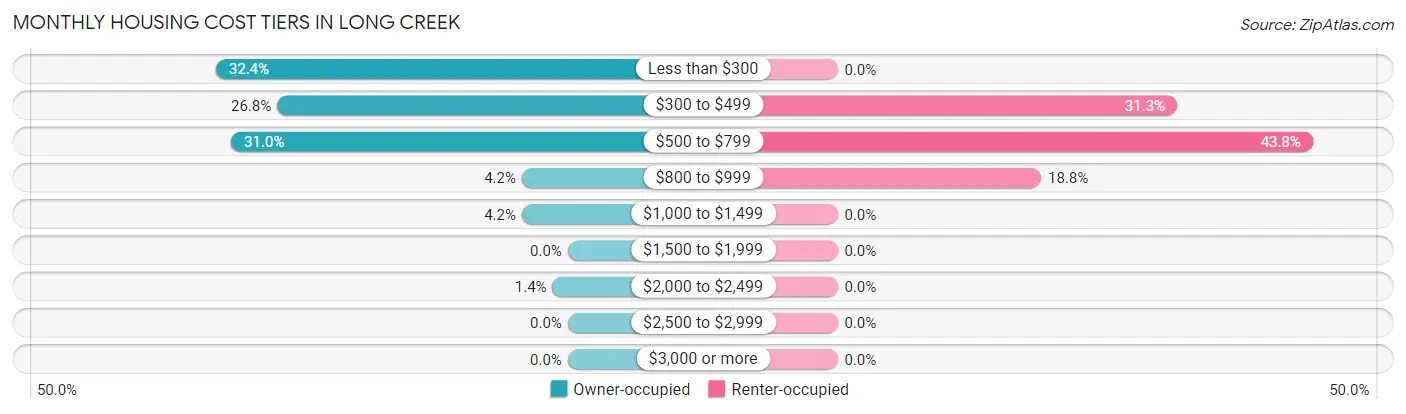
| Monthly Cost | Owner-occupied | Renter-occupied |
| Less than $300 | 23 (32.4%) | 0 (0.0%) |
| $300 to $499 | 19 (26.8%) | 5 (31.2%) |
| $500 to $799 | 22 (31.0%) | 7 (43.8%) |
| $800 to $999 | 3 (4.2%) | 3 (18.8%) |
| $1,000 to $1,499 | 3 (4.2%) | 0 (0.0%) |
| $1,500 to $1,999 | 0 (0.0%) | 0 (0.0%) |
| $2,000 to $2,499 | 1 (1.4%) | 0 (0.0%) |
| $2,500 to $2,999 | 0 (0.0%) | 0 (0.0%) |
| $3,000 or more | 0 (0.0%) | 0 (0.0%) |
| Total | 71 (100.0%) | 16 (100.0%) |
Physical Housing Characteristics in Long Creek
Housing Structures in Long Creek
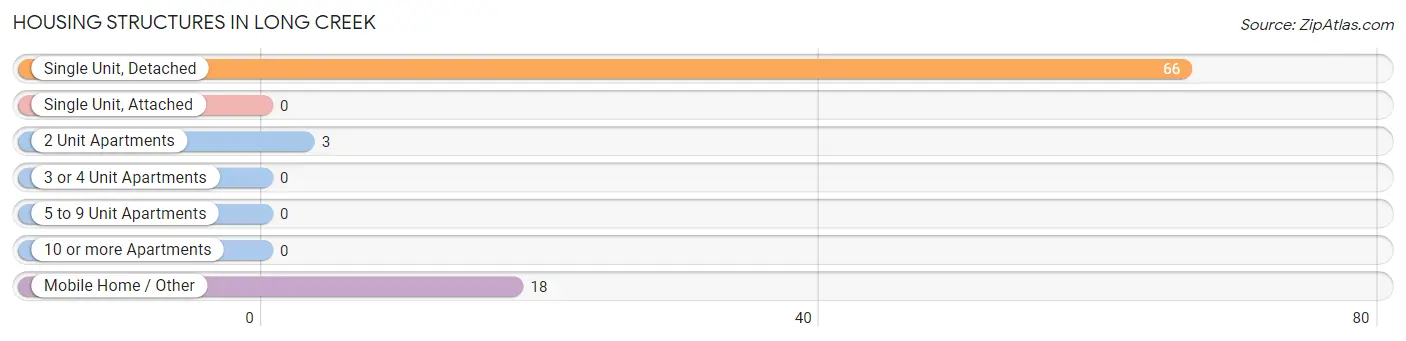
| Structure Type | # Housing Units | % Housing Units |
| Single Unit, Detached | 66 | 75.9% |
| Single Unit, Attached | 0 | 0.0% |
| 2 Unit Apartments | 3 | 3.5% |
| 3 or 4 Unit Apartments | 0 | 0.0% |
| 5 to 9 Unit Apartments | 0 | 0.0% |
| 10 or more Apartments | 0 | 0.0% |
| Mobile Home / Other | 18 | 20.7% |
| Total | 87 | 100.0% |
Housing Structures by Occupancy in Long Creek
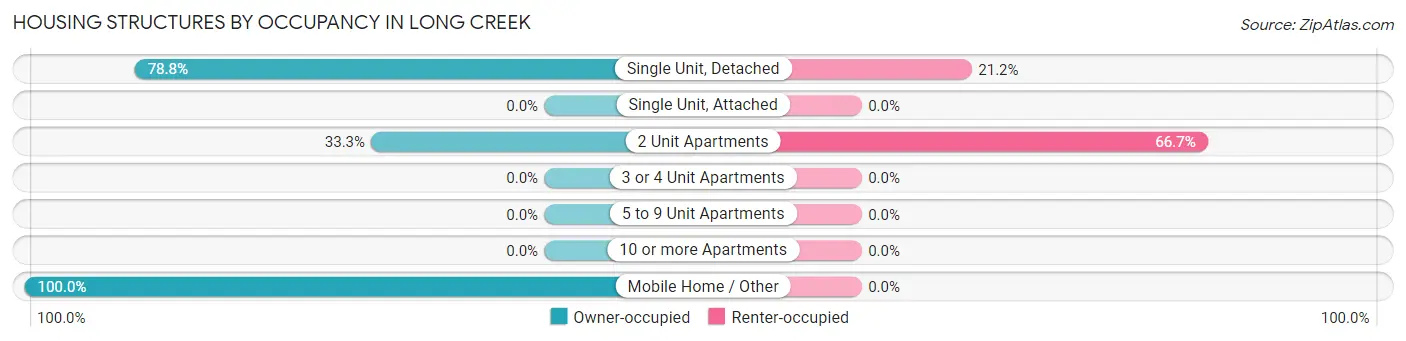
| Structure Type | Owner-occupied | Renter-occupied |
| Single Unit, Detached | 52 (78.8%) | 14 (21.2%) |
| Single Unit, Attached | 0 (0.0%) | 0 (0.0%) |
| 2 Unit Apartments | 1 (33.3%) | 2 (66.7%) |
| 3 or 4 Unit Apartments | 0 (0.0%) | 0 (0.0%) |
| 5 to 9 Unit Apartments | 0 (0.0%) | 0 (0.0%) |
| 10 or more Apartments | 0 (0.0%) | 0 (0.0%) |
| Mobile Home / Other | 18 (100.0%) | 0 (0.0%) |
| Total | 71 (81.6%) | 16 (18.4%) |
Housing Structures by Number of Rooms in Long Creek
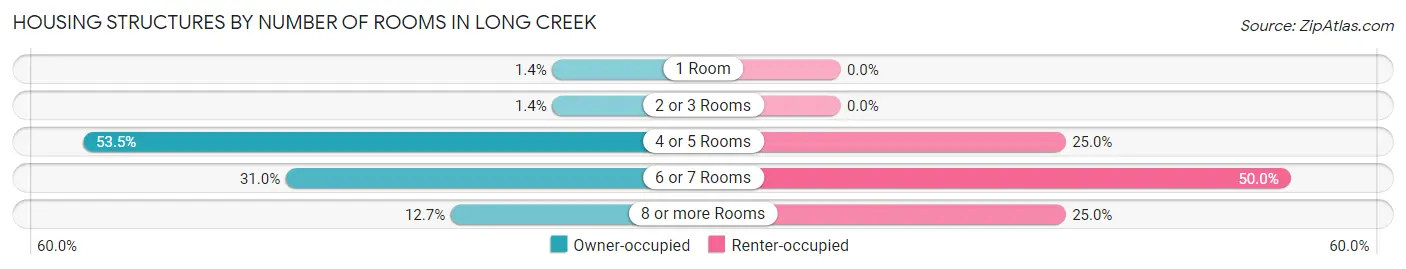
| Number of Rooms | Owner-occupied | Renter-occupied |
| 1 Room | 1 (1.4%) | 0 (0.0%) |
| 2 or 3 Rooms | 1 (1.4%) | 0 (0.0%) |
| 4 or 5 Rooms | 38 (53.5%) | 4 (25.0%) |
| 6 or 7 Rooms | 22 (31.0%) | 8 (50.0%) |
| 8 or more Rooms | 9 (12.7%) | 4 (25.0%) |
| Total | 71 (100.0%) | 16 (100.0%) |
Housing Structure by Heating Type in Long Creek
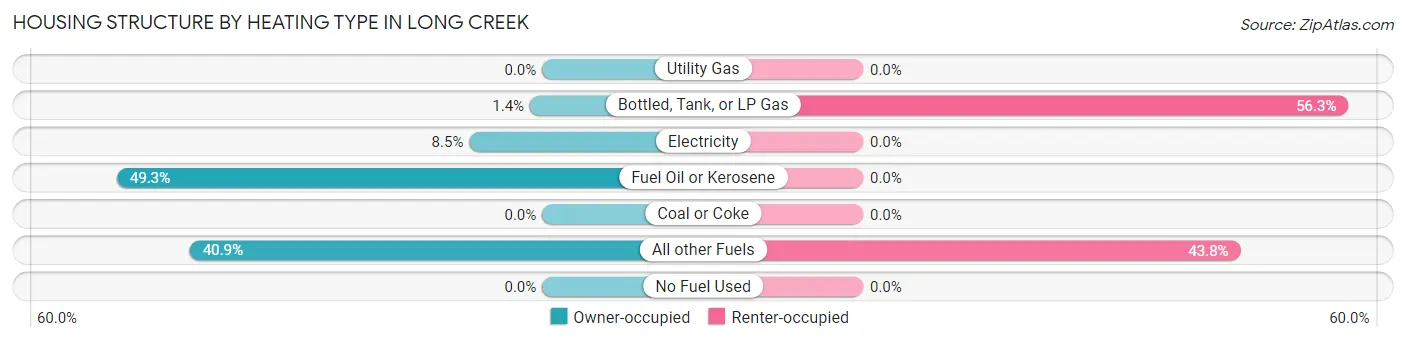
| Heating Type | Owner-occupied | Renter-occupied |
| Utility Gas | 0 (0.0%) | 0 (0.0%) |
| Bottled, Tank, or LP Gas | 1 (1.4%) | 9 (56.2%) |
| Electricity | 6 (8.5%) | 0 (0.0%) |
| Fuel Oil or Kerosene | 35 (49.3%) | 0 (0.0%) |
| Coal or Coke | 0 (0.0%) | 0 (0.0%) |
| All other Fuels | 29 (40.8%) | 7 (43.8%) |
| No Fuel Used | 0 (0.0%) | 0 (0.0%) |
| Total | 71 (100.0%) | 16 (100.0%) |
Household Vehicle Usage in Long Creek
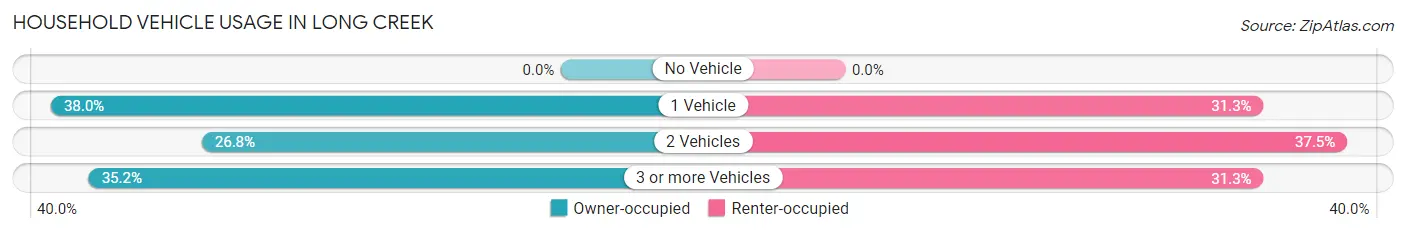
| Vehicles per Household | Owner-occupied | Renter-occupied |
| No Vehicle | 0 (0.0%) | 0 (0.0%) |
| 1 Vehicle | 27 (38.0%) | 5 (31.2%) |
| 2 Vehicles | 19 (26.8%) | 6 (37.5%) |
| 3 or more Vehicles | 25 (35.2%) | 5 (31.2%) |
| Total | 71 (100.0%) | 16 (100.0%) |
Real Estate & Mortgages in Long Creek
Real Estate and Mortgage Overview in Long Creek
| Characteristic | Without Mortgage | With Mortgage |
| Housing Units | 56 | 15 |
| Median Property Value | $65,800 | $0 |
| Median Household Income | - | - |
| Monthly Housing Costs | $350 | $0 |
| Real Estate Taxes | $657 | $0 |
Property Value by Mortgage Status in Long Creek
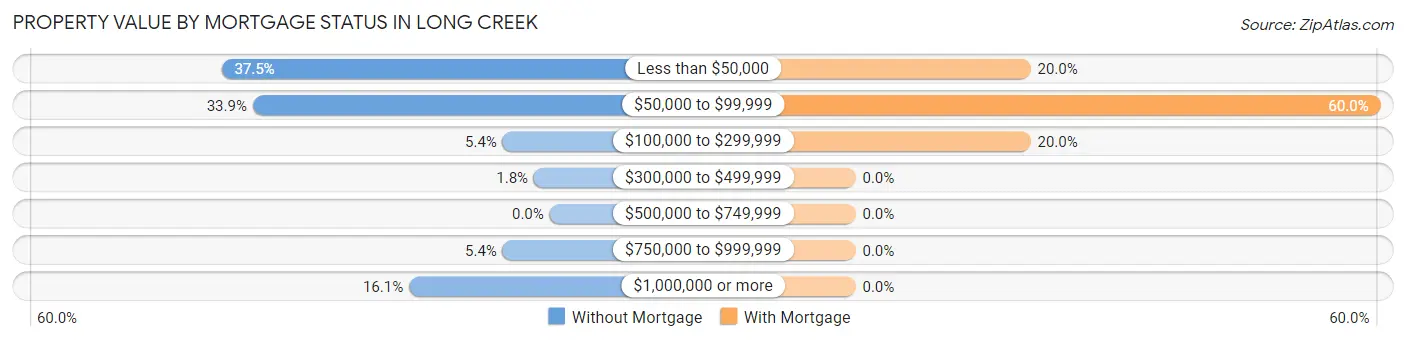
| Property Value | Without Mortgage | With Mortgage |
| Less than $50,000 | 21 (37.5%) | 3 (20.0%) |
| $50,000 to $99,999 | 19 (33.9%) | 9 (60.0%) |
| $100,000 to $299,999 | 3 (5.4%) | 3 (20.0%) |
| $300,000 to $499,999 | 1 (1.8%) | 0 (0.0%) |
| $500,000 to $749,999 | 0 (0.0%) | 0 (0.0%) |
| $750,000 to $999,999 | 3 (5.4%) | 0 (0.0%) |
| $1,000,000 or more | 9 (16.1%) | 0 (0.0%) |
| Total | 56 (100.0%) | 15 (100.0%) |
Household Income by Mortgage Status in Long Creek
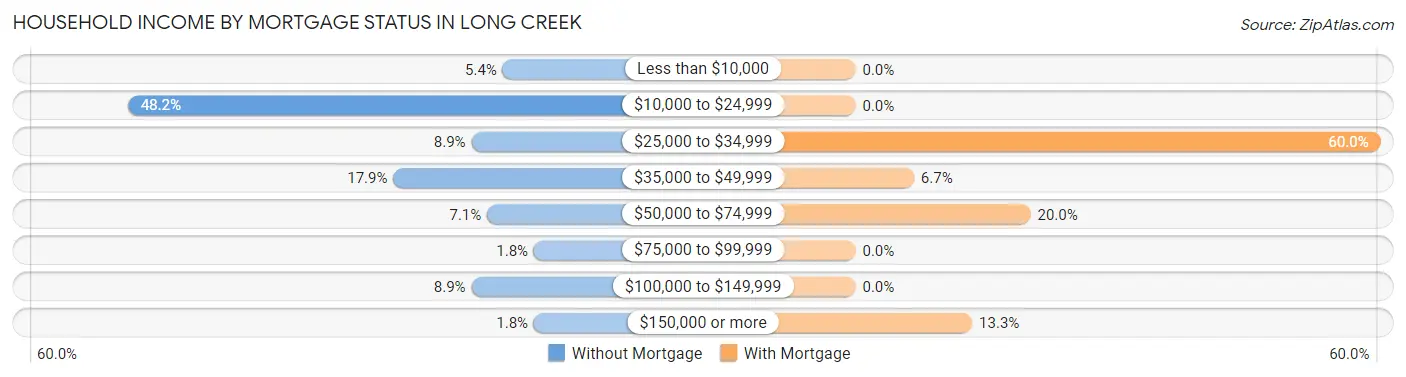
| Household Income | Without Mortgage | With Mortgage |
| Less than $10,000 | 3 (5.4%) | 0 (0.0%) |
| $10,000 to $24,999 | 27 (48.2%) | 0 (0.0%) |
| $25,000 to $34,999 | 5 (8.9%) | 9 (60.0%) |
| $35,000 to $49,999 | 10 (17.9%) | 1 (6.7%) |
| $50,000 to $74,999 | 4 (7.1%) | 3 (20.0%) |
| $75,000 to $99,999 | 1 (1.8%) | 0 (0.0%) |
| $100,000 to $149,999 | 5 (8.9%) | 0 (0.0%) |
| $150,000 or more | 1 (1.8%) | 2 (13.3%) |
| Total | 56 (100.0%) | 15 (100.0%) |
Property Value to Household Income Ratio in Long Creek
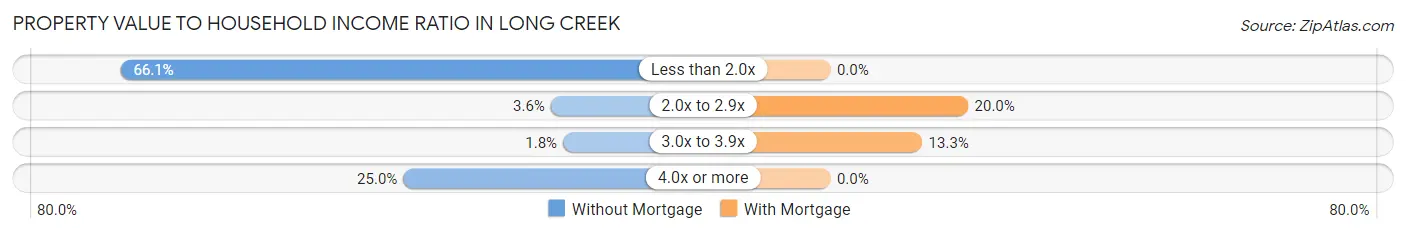
| Value-to-Income Ratio | Without Mortgage | With Mortgage |
| Less than 2.0x | 37 (66.1%) | 0 (0.0%) |
| 2.0x to 2.9x | 2 (3.6%) | 3 (20.0%) |
| 3.0x to 3.9x | 1 (1.8%) | 2 (13.3%) |
| 4.0x or more | 14 (25.0%) | 0 (0.0%) |
| Total | 56 (100.0%) | 15 (100.0%) |
Real Estate Taxes by Mortgage Status in Long Creek
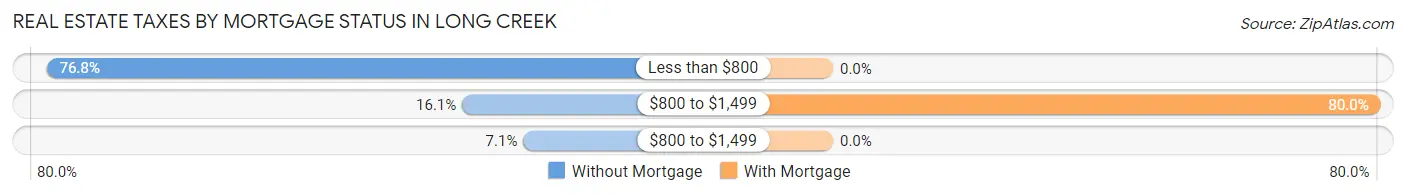
| Property Taxes | Without Mortgage | With Mortgage |
| Less than $800 | 43 (76.8%) | 0 (0.0%) |
| $800 to $1,499 | 9 (16.1%) | 12 (80.0%) |
| $800 to $1,499 | 4 (7.1%) | 0 (0.0%) |
| Total | 56 (100.0%) | 15 (100.0%) |
Health & Disability in Long Creek
Health Insurance Coverage by Age in Long Creek
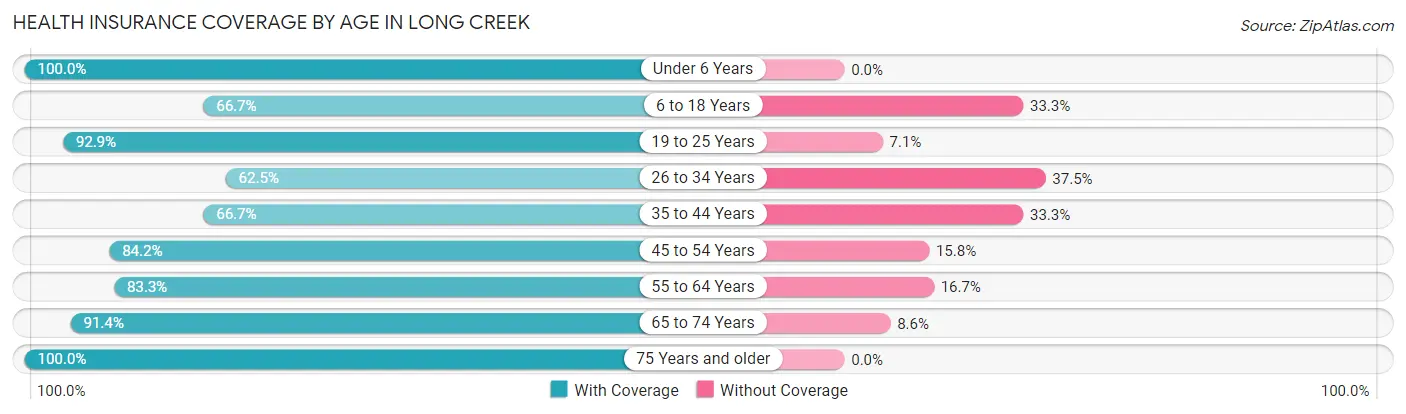
| Age Bracket | With Coverage | Without Coverage |
| Under 6 Years | 19 (100.0%) | 0 (0.0%) |
| 6 to 18 Years | 16 (66.7%) | 8 (33.3%) |
| 19 to 25 Years | 13 (92.9%) | 1 (7.1%) |
| 26 to 34 Years | 5 (62.5%) | 3 (37.5%) |
| 35 to 44 Years | 6 (66.7%) | 3 (33.3%) |
| 45 to 54 Years | 16 (84.2%) | 3 (15.8%) |
| 55 to 64 Years | 10 (83.3%) | 2 (16.7%) |
| 65 to 74 Years | 32 (91.4%) | 3 (8.6%) |
| 75 Years and older | 50 (100.0%) | 0 (0.0%) |
| Total | 167 (87.9%) | 23 (12.1%) |
Health Insurance Coverage by Citizenship Status in Long Creek
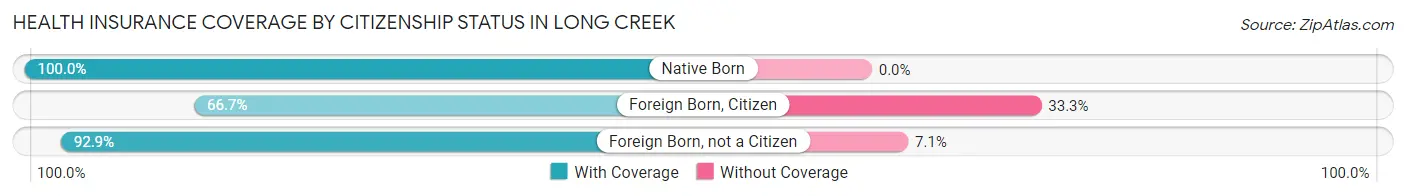
| Citizenship Status | With Coverage | Without Coverage |
| Native Born | 19 (100.0%) | 0 (0.0%) |
| Foreign Born, Citizen | 16 (66.7%) | 8 (33.3%) |
| Foreign Born, not a Citizen | 13 (92.9%) | 1 (7.1%) |
Health Insurance Coverage by Household Income in Long Creek
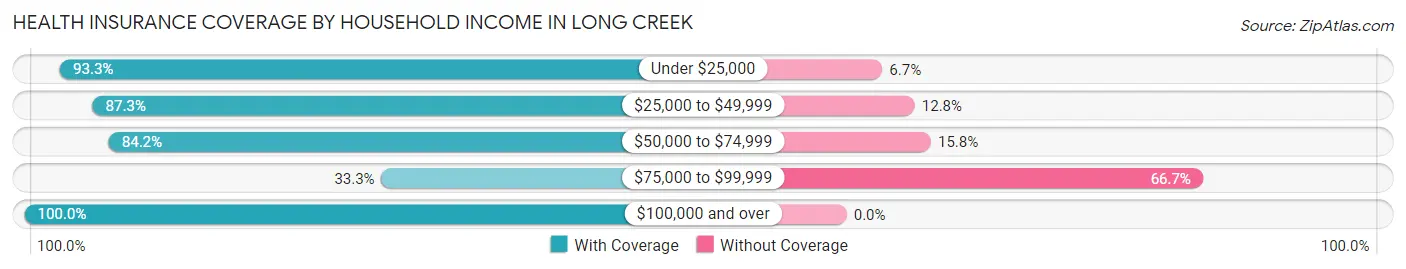
| Household Income | With Coverage | Without Coverage |
| Under $25,000 | 42 (93.3%) | 3 (6.7%) |
| $25,000 to $49,999 | 89 (87.3%) | 13 (12.8%) |
| $50,000 to $74,999 | 16 (84.2%) | 3 (15.8%) |
| $75,000 to $99,999 | 2 (33.3%) | 4 (66.7%) |
| $100,000 and over | 18 (100.0%) | 0 (0.0%) |
Public vs Private Health Insurance Coverage by Age in Long Creek
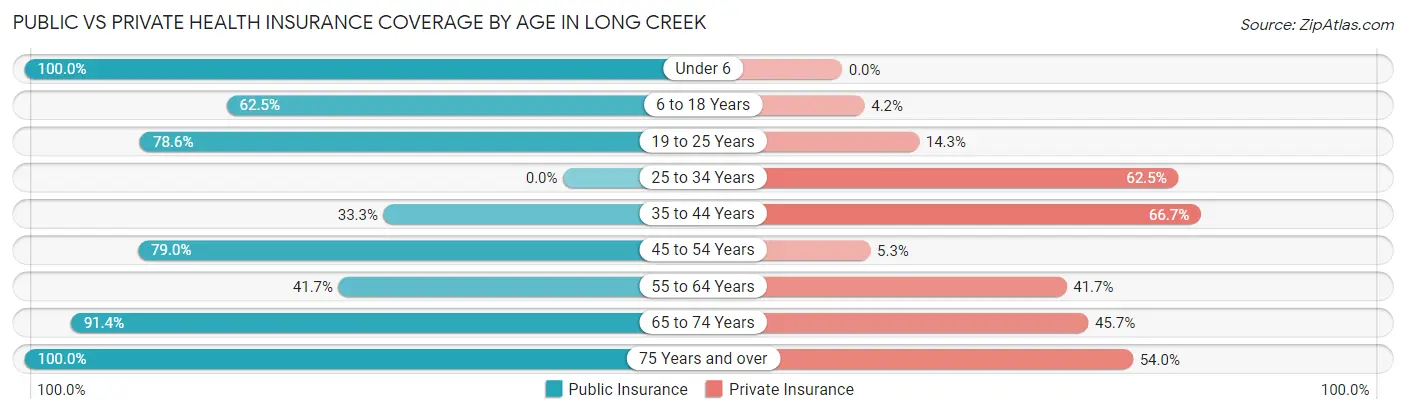
| Age Bracket | Public Insurance | Private Insurance |
| Under 6 | 19 (100.0%) | 0 (0.0%) |
| 6 to 18 Years | 15 (62.5%) | 1 (4.2%) |
| 19 to 25 Years | 11 (78.6%) | 2 (14.3%) |
| 25 to 34 Years | 0 (0.0%) | 5 (62.5%) |
| 35 to 44 Years | 3 (33.3%) | 6 (66.7%) |
| 45 to 54 Years | 15 (78.9%) | 1 (5.3%) |
| 55 to 64 Years | 5 (41.7%) | 5 (41.7%) |
| 65 to 74 Years | 32 (91.4%) | 16 (45.7%) |
| 75 Years and over | 50 (100.0%) | 27 (54.0%) |
| Total | 150 (78.9%) | 63 (33.2%) |
Disability Status by Sex by Age in Long Creek
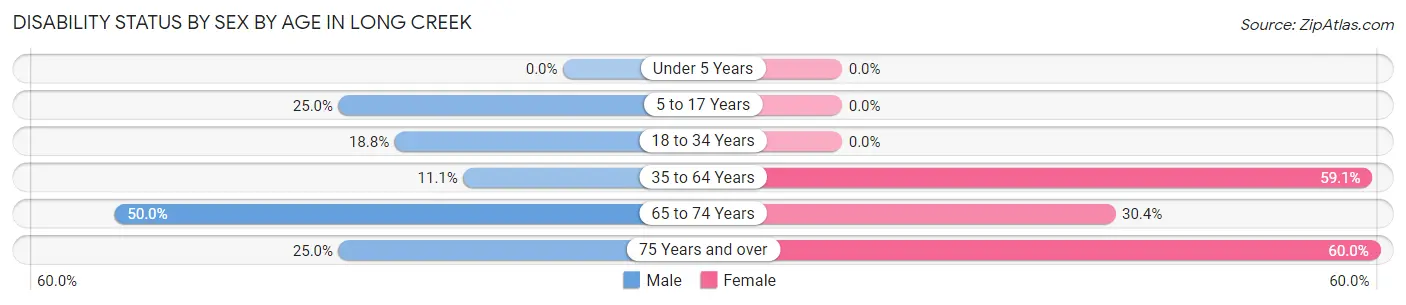
| Age Bracket | Male | Female |
| Under 5 Years | 0 (0.0%) | 0 (0.0%) |
| 5 to 17 Years | 3 (25.0%) | 0 (0.0%) |
| 18 to 34 Years | 3 (18.8%) | 0 (0.0%) |
| 35 to 64 Years | 2 (11.1%) | 13 (59.1%) |
| 65 to 74 Years | 6 (50.0%) | 7 (30.4%) |
| 75 Years and over | 5 (25.0%) | 18 (60.0%) |
Disability Class by Sex by Age in Long Creek
Disability Class: Hearing Difficulty
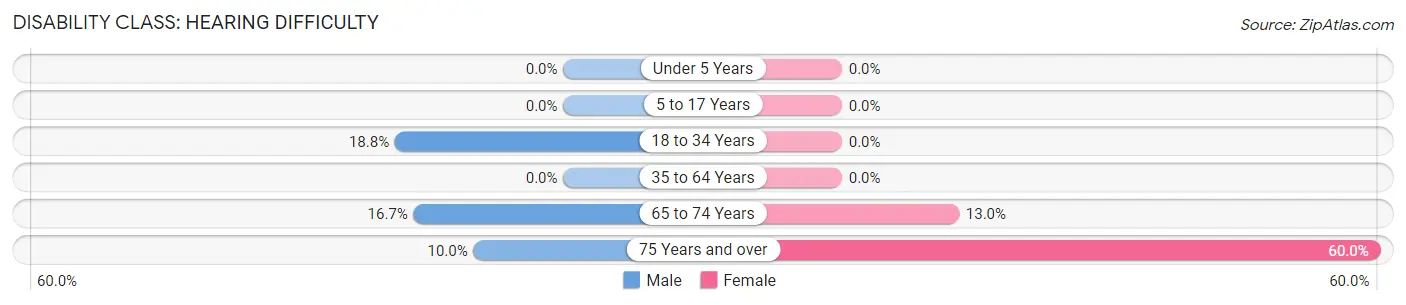
| Age Bracket | Male | Female |
| Under 5 Years | 0 (0.0%) | 0 (0.0%) |
| 5 to 17 Years | 0 (0.0%) | 0 (0.0%) |
| 18 to 34 Years | 3 (18.8%) | 0 (0.0%) |
| 35 to 64 Years | 0 (0.0%) | 0 (0.0%) |
| 65 to 74 Years | 2 (16.7%) | 3 (13.0%) |
| 75 Years and over | 2 (10.0%) | 18 (60.0%) |
Disability Class: Vision Difficulty
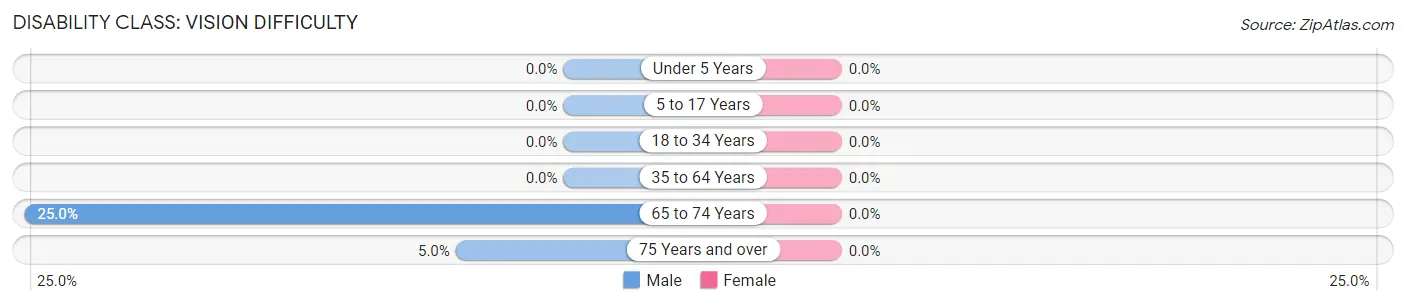
| Age Bracket | Male | Female |
| Under 5 Years | 0 (0.0%) | 0 (0.0%) |
| 5 to 17 Years | 0 (0.0%) | 0 (0.0%) |
| 18 to 34 Years | 0 (0.0%) | 0 (0.0%) |
| 35 to 64 Years | 0 (0.0%) | 0 (0.0%) |
| 65 to 74 Years | 3 (25.0%) | 0 (0.0%) |
| 75 Years and over | 1 (5.0%) | 0 (0.0%) |
Disability Class: Cognitive Difficulty
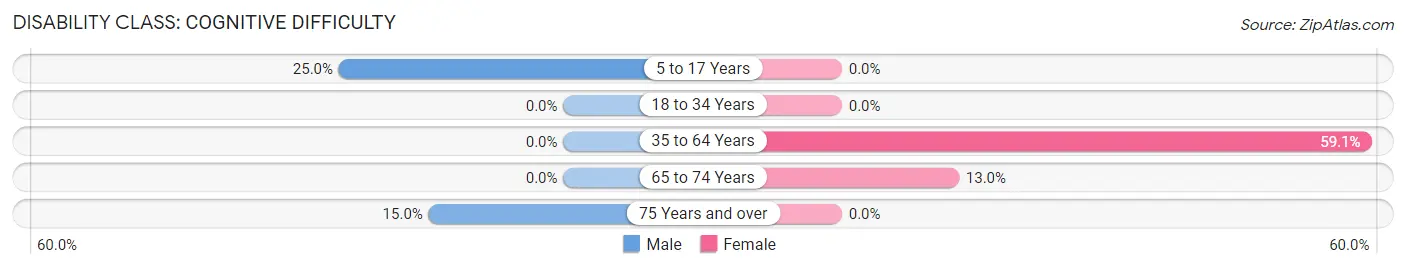
| Age Bracket | Male | Female |
| 5 to 17 Years | 3 (25.0%) | 0 (0.0%) |
| 18 to 34 Years | 0 (0.0%) | 0 (0.0%) |
| 35 to 64 Years | 0 (0.0%) | 13 (59.1%) |
| 65 to 74 Years | 0 (0.0%) | 3 (13.0%) |
| 75 Years and over | 3 (15.0%) | 0 (0.0%) |
Disability Class: Ambulatory Difficulty
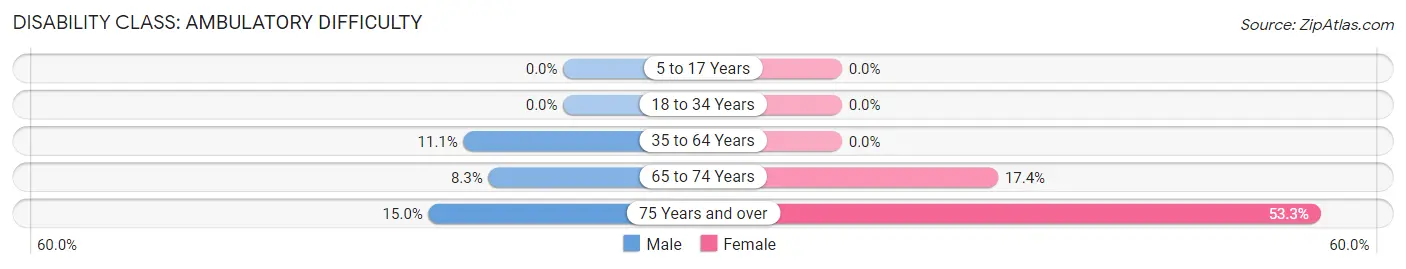
| Age Bracket | Male | Female |
| 5 to 17 Years | 0 (0.0%) | 0 (0.0%) |
| 18 to 34 Years | 0 (0.0%) | 0 (0.0%) |
| 35 to 64 Years | 2 (11.1%) | 0 (0.0%) |
| 65 to 74 Years | 1 (8.3%) | 4 (17.4%) |
| 75 Years and over | 3 (15.0%) | 16 (53.3%) |
Disability Class: Self-Care Difficulty
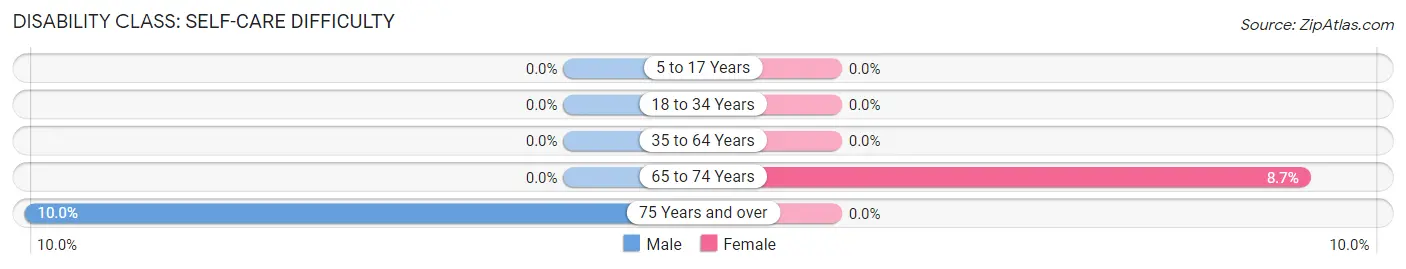
| Age Bracket | Male | Female |
| 5 to 17 Years | 0 (0.0%) | 0 (0.0%) |
| 18 to 34 Years | 0 (0.0%) | 0 (0.0%) |
| 35 to 64 Years | 0 (0.0%) | 0 (0.0%) |
| 65 to 74 Years | 0 (0.0%) | 2 (8.7%) |
| 75 Years and over | 2 (10.0%) | 0 (0.0%) |
Technology Access in Long Creek
Computing Device Access in Long Creek
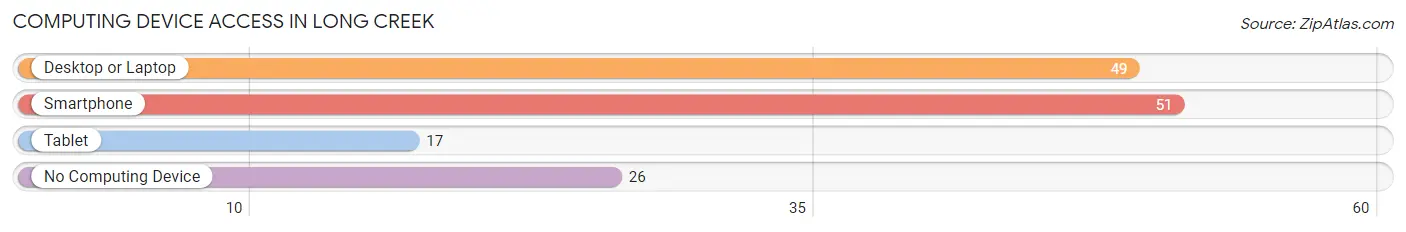
| Device Type | # Households | % Households |
| Desktop or Laptop | 49 | 56.3% |
| Smartphone | 51 | 58.6% |
| Tablet | 17 | 19.5% |
| No Computing Device | 26 | 29.9% |
| Total | 87 | 100.0% |
Internet Access in Long Creek
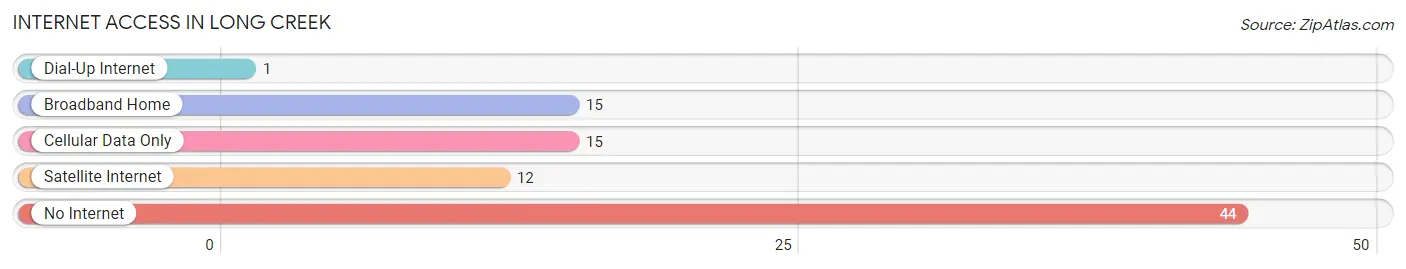
| Internet Type | # Households | % Households |
| Dial-Up Internet | 1 | 1.1% |
| Broadband Home | 15 | 17.2% |
| Cellular Data Only | 15 | 17.2% |
| Satellite Internet | 12 | 13.8% |
| No Internet | 44 | 50.6% |
| Total | 87 | 100.0% |
Long Creek Summary
Long Creek is a small unincorporated community located in Grant County, Oregon, United States. It is situated in the Blue Mountains, at an elevation of 3,845 feet (1,172 m). The population of Long Creek was estimated to be around 200 in 2020.
History
Long Creek was first settled in the late 1800s by homesteaders who were attracted to the area by its abundant natural resources. The first post office was established in 1887, and the town was officially incorporated in 1895. The town was named after the nearby Long Creek, which was named for its length.
The town was a hub for the timber industry, and the local economy was largely based on logging and lumber production. The town also had a thriving agricultural sector, with many local farmers raising cattle, sheep, and horses.
In the early 1900s, Long Creek was a popular destination for tourists, who came to enjoy the area's natural beauty and outdoor activities. The town was also home to a number of businesses, including a hotel, a general store, a blacksmith shop, and a saloon.
Geography
Long Creek is located in the Blue Mountains of eastern Oregon. The town is situated at an elevation of 3,845 feet (1,172 m). The area is characterized by rolling hills, dense forests, and numerous streams and rivers. The nearby Long Creek is a tributary of the John Day River.
The climate in Long Creek is semi-arid, with hot summers and cold winters. The average annual temperature is around 50°F (10°C). The average annual precipitation is around 18 inches (45 cm).
Economy
The economy of Long Creek is largely based on agriculture and timber production. The town is home to several farms, which raise cattle, sheep, and horses. The timber industry is also an important part of the local economy, with several sawmills located in the area.
The town is also home to a number of small businesses, including a general store, a hotel, and a saloon. The local economy is also supported by tourism, with many visitors coming to the area to enjoy the natural beauty and outdoor activities.
Demographics
As of the 2010 census, the population of Long Creek was estimated to be around 200. The racial makeup of the town was 97.5% White, 0.5% Native American, 0.5% Asian, and 1.5% from other races. The median household income was $30,000, and the median home value was $90,000.
Conclusion
Long Creek is a small unincorporated community located in Grant County, Oregon. It is situated in the Blue Mountains, at an elevation of 3,845 feet (1,172 m). The town was first settled in the late 1800s by homesteaders, and the local economy is largely based on agriculture and timber production. The population of Long Creek was estimated to be around 200 in 2020, and the racial makeup of the town was 97.5% White, 0.5% Native American, 0.5% Asian, and 1.5% from other races. The median household income was $30,000, and the median home value was $90,000.
Common Questions
What is the Total Population of Long Creek?
Total Population of Long Creek is 190.
What is the Total Male Population of Long Creek?
Total Male Population of Long Creek is 82.
What is the Total Female Population of Long Creek?
Total Female Population of Long Creek is 108.
What is the Ratio of Males per 100 Females in Long Creek?
There are 75.93 Males per 100 Females in Long Creek.
What is the Ratio of Females per 100 Males in Long Creek?
There are 131.71 Females per 100 Males in Long Creek.
What is the Median Population Age in Long Creek?
Median Population Age in Long Creek is 55.7 Years.
What is the Average Family Size in Long Creek
Average Family Size in Long Creek is 3.3 People.
What is the Average Household Size in Long Creek
Average Household Size in Long Creek is 2.2 People.
What is Per Capita Income in Long Creek?
Per Capita income in Long Creek is $17,737.
What is the Median Family Income in Long Creek?
Median Family Income in Long Creek is $41,389.
What is the Median Household income in Long Creek?
Median Household Income in Long Creek is $30,375.
What is Income or Wage Gap in Long Creek?
Income or Wage Gap in Long Creek is 28.4%.
Women in Long Creek earn 71.6 cents for every dollar earned by a man.
What is Family Income Deficit in Long Creek?
Family Income Deficit in Long Creek is $10,082.
Families that are below poverty line in Long Creek earn $10,082 less on average than the poverty threshold level.
What is Inequality or Gini Index in Long Creek?
Inequality or Gini Index in Long Creek is 0.43.
How Large is the Labor Force in Long Creek?
There are 47 People in the Labor Forcein in Long Creek.
What is the Percentage of People in the Labor Force in Long Creek?
30.7% of People are in the Labor Force in Long Creek.
What is the Unemployment Rate in Long Creek?
Unemployment Rate in Long Creek is 6.4%.