Gearhart, OR
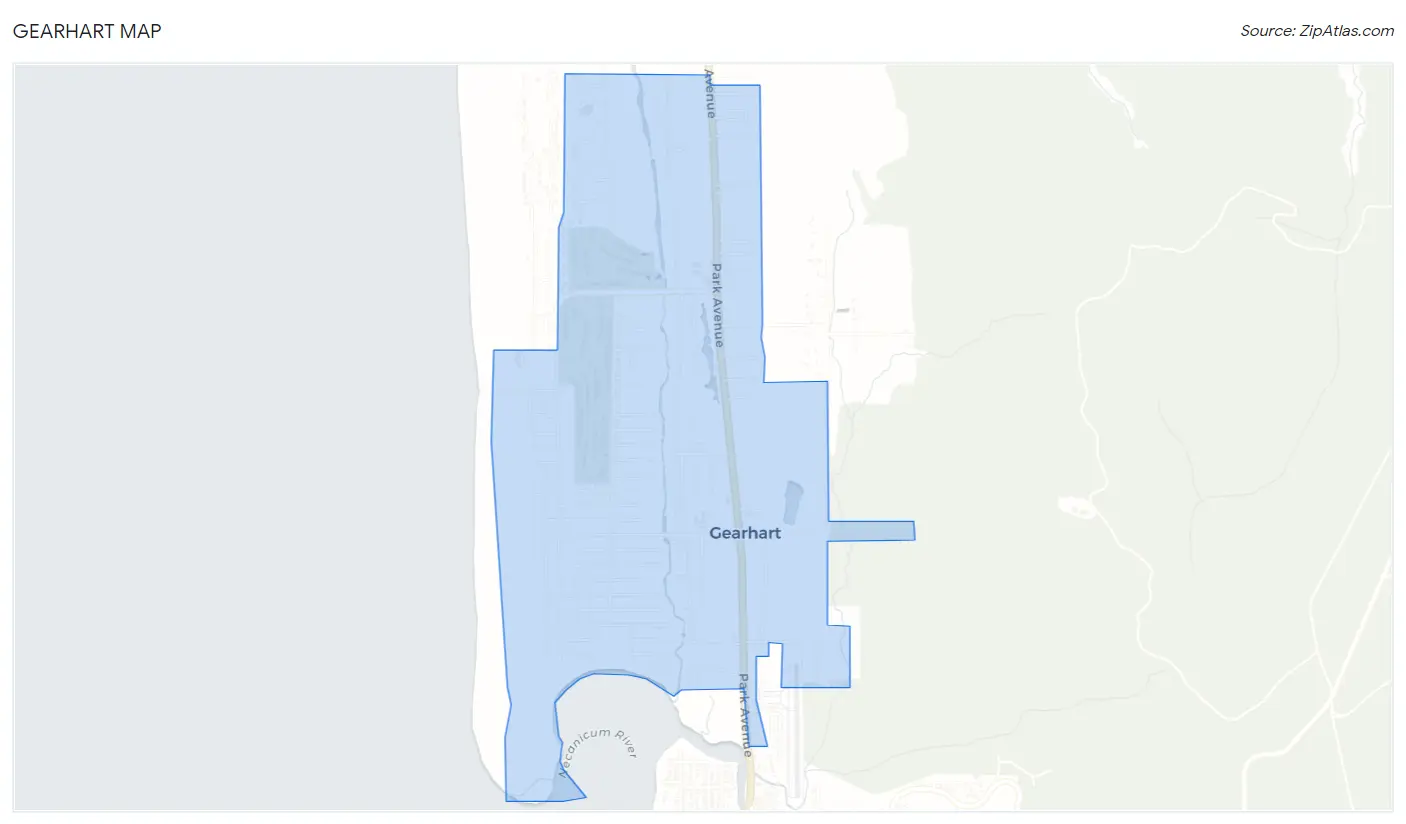
Gearhart Map
Gearhart Overview
2,060
TOTAL POPULATION
1,008
MALE POPULATION
1,052
FEMALE POPULATION
95.82
MALES / 100 FEMALES
104.37
FEMALES / 100 MALES
48.7
MEDIAN AGE
2.9
AVG FAMILY SIZE
2.6
AVG HOUSEHOLD SIZE
$47,979
PER CAPITA INCOME
$117,566
AVG FAMILY INCOME
$100,536
AVG HOUSEHOLD INCOME
41.2%
WAGE / INCOME GAP [ % ]
58.8¢/ $1
WAGE / INCOME GAP [ $ ]
0.39
INEQUALITY / GINI INDEX
943
LABOR FORCE [ PEOPLE ]
57.3%
PERCENT IN LABOR FORCE
2.6%
UNEMPLOYMENT RATE
Race in Gearhart
The most populous races in Gearhart are White / Caucasian (1,870 | 90.8%), Hispanic or Latino (147 | 7.1%), and Two or more Races (139 | 6.8%).
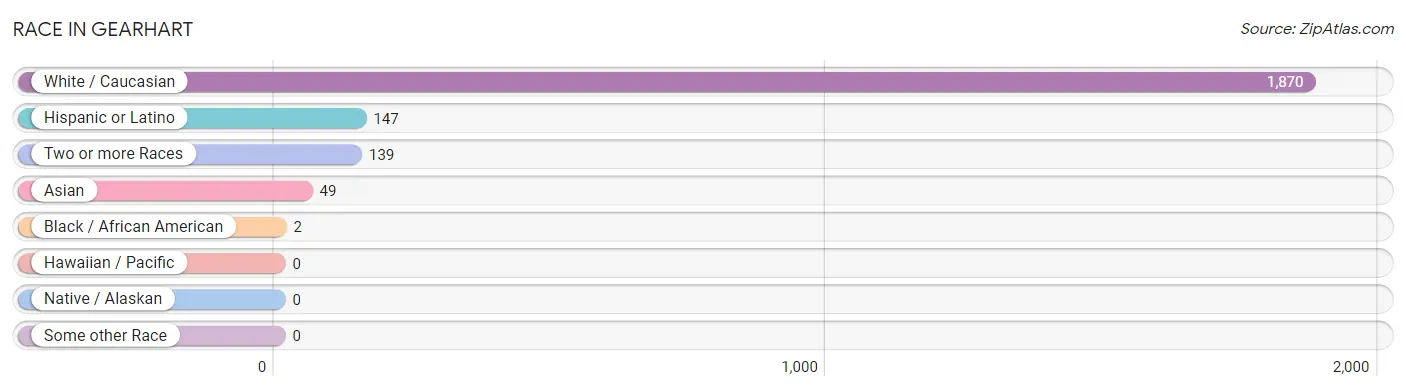
| Race | # Population | % Population |
| Asian | 49 | 2.4% |
| Black / African American | 2 | 0.1% |
| Hawaiian / Pacific | 0 | 0.0% |
| Hispanic or Latino | 147 | 7.1% |
| Native / Alaskan | 0 | 0.0% |
| White / Caucasian | 1,870 | 90.8% |
| Two or more Races | 139 | 6.8% |
| Some other Race | 0 | 0.0% |
| Total | 2,060 | 100.0% |
Ancestry in Gearhart
The most populous ancestries reported in Gearhart are German (420 | 20.4%), English (391 | 19.0%), Irish (237 | 11.5%), Norwegian (82 | 4.0%), and Mexican (74 | 3.6%), together accounting for 58.4% of all Gearhart residents.
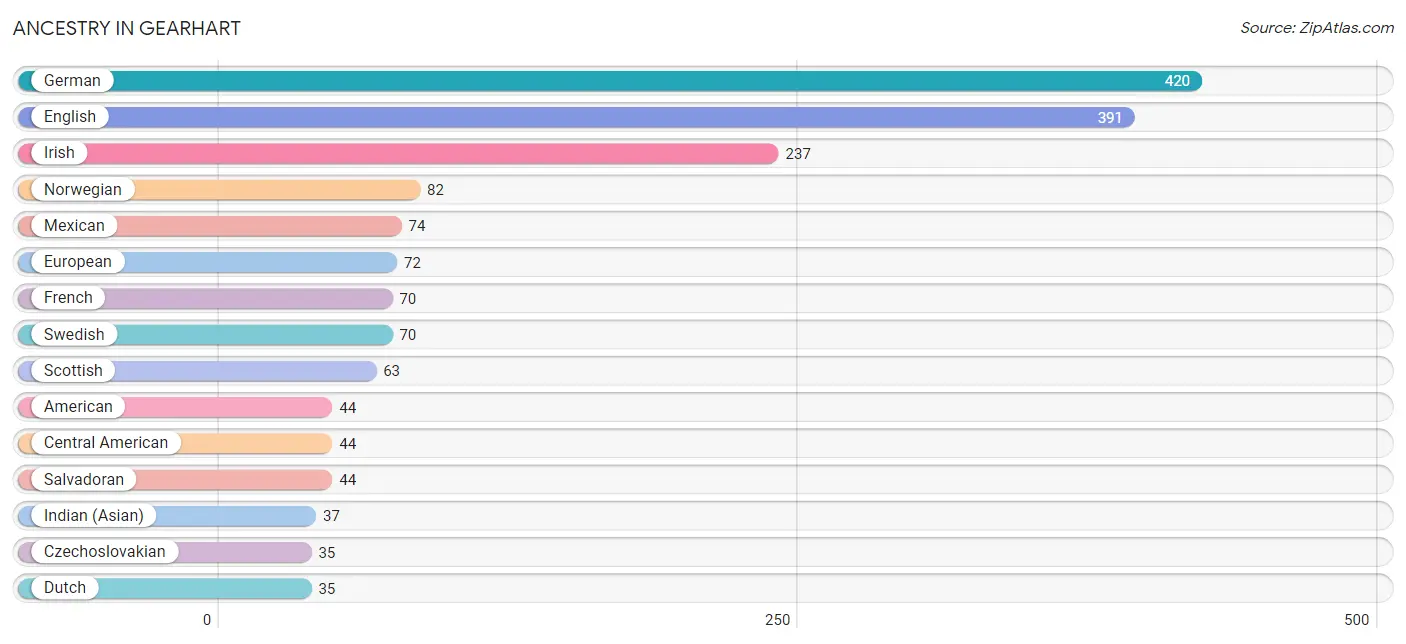
| Ancestry | # Population | % Population |
| American | 44 | 2.1% |
| Arab | 8 | 0.4% |
| Basque | 7 | 0.3% |
| Belgian | 6 | 0.3% |
| Bhutanese | 5 | 0.2% |
| British | 3 | 0.2% |
| Burmese | 4 | 0.2% |
| Canadian | 10 | 0.5% |
| Central American | 44 | 2.1% |
| Cherokee | 6 | 0.3% |
| Comanche | 4 | 0.2% |
| Cuban | 12 | 0.6% |
| Czechoslovakian | 35 | 1.7% |
| Danish | 18 | 0.9% |
| Dutch | 35 | 1.7% |
| Eastern European | 7 | 0.3% |
| English | 391 | 19.0% |
| European | 72 | 3.5% |
| Finnish | 26 | 1.3% |
| French | 70 | 3.4% |
| French Canadian | 18 | 0.9% |
| German | 420 | 20.4% |
| Guamanian / Chamorro | 20 | 1.0% |
| Hungarian | 5 | 0.2% |
| Indian (Asian) | 37 | 1.8% |
| Irish | 237 | 11.5% |
| Italian | 29 | 1.4% |
| Lebanese | 5 | 0.2% |
| Mexican | 74 | 3.6% |
| Native Hawaiian | 28 | 1.4% |
| Norwegian | 82 | 4.0% |
| Polish | 34 | 1.7% |
| Portuguese | 11 | 0.5% |
| Puerto Rican | 4 | 0.2% |
| Salvadoran | 44 | 2.1% |
| Scandinavian | 31 | 1.5% |
| Scotch-Irish | 14 | 0.7% |
| Scottish | 63 | 3.1% |
| Spanish | 13 | 0.6% |
| Sri Lankan | 3 | 0.2% |
| Swedish | 70 | 3.4% |
| Swiss | 18 | 0.9% |
| Syrian | 3 | 0.2% |
| Welsh | 10 | 0.5% |
| Yugoslavian | 3 | 0.2% | View All 45 Rows |
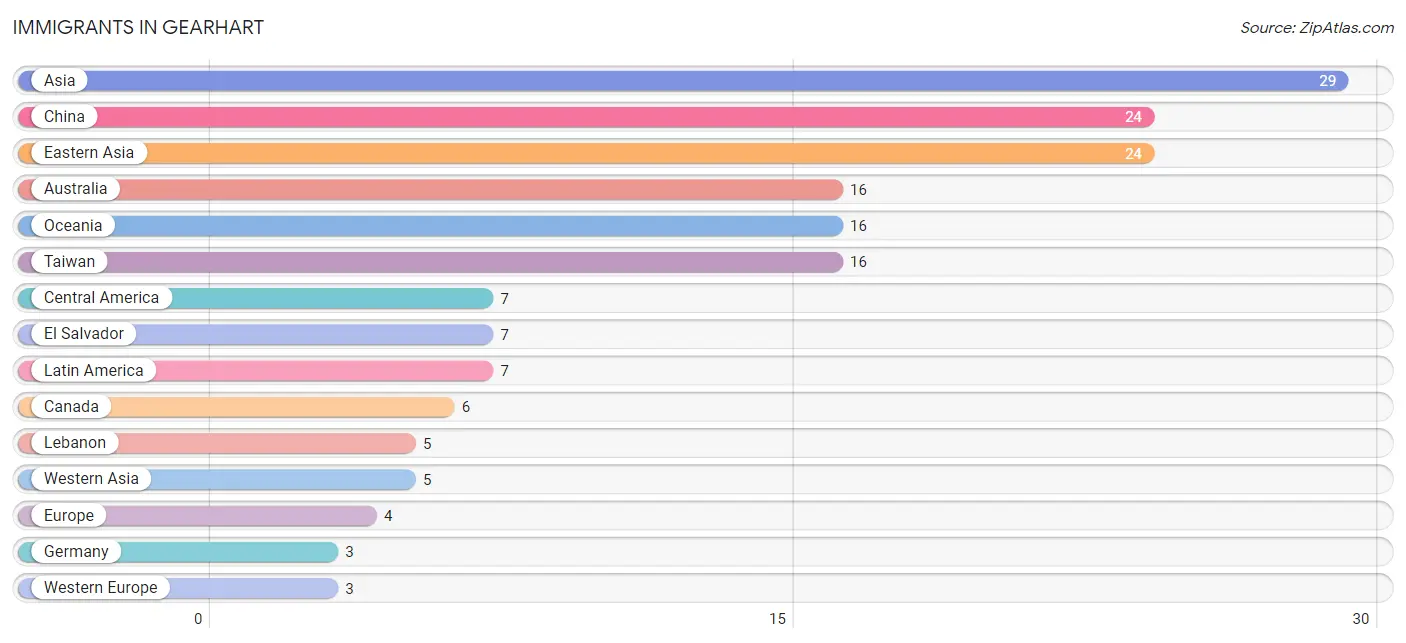
Immigrants in Gearhart
The most numerous immigrant groups reported in Gearhart came from Asia (29 | 1.4%), China (24 | 1.2%), Eastern Asia (24 | 1.2%), Australia (16 | 0.8%), and Oceania (16 | 0.8%), together accounting for 5.3% of all Gearhart residents.
| Immigration Origin | # Population | % Population |
| Asia | 29 | 1.4% |
| Australia | 16 | 0.8% |
| Canada | 6 | 0.3% |
| Central America | 7 | 0.3% |
| China | 24 | 1.2% |
| Eastern Asia | 24 | 1.2% |
| El Salvador | 7 | 0.3% |
| Europe | 4 | 0.2% |
| Germany | 3 | 0.2% |
| Latin America | 7 | 0.3% |
| Lebanon | 5 | 0.2% |
| Northern Europe | 1 | 0.1% |
| Oceania | 16 | 0.8% |
| Taiwan | 16 | 0.8% |
| Western Asia | 5 | 0.2% |
| Western Europe | 3 | 0.2% | View All 16 Rows |
Sex and Age in Gearhart
Sex and Age in Gearhart
The most populous age groups in Gearhart are 70 to 74 Years (137 | 13.6%) for men and 70 to 74 Years (121 | 11.5%) for women.
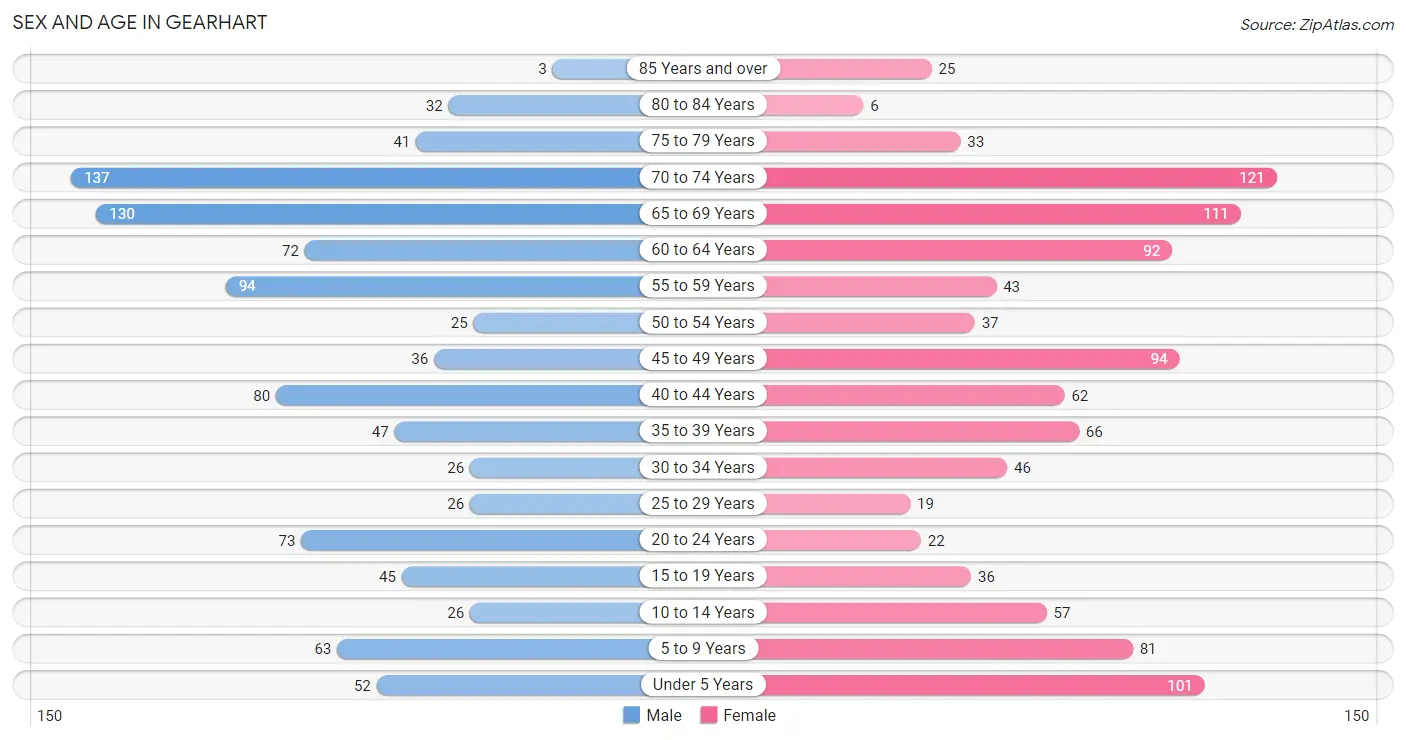
| Age Bracket | Male | Female |
| Under 5 Years | 52 (5.2%) | 101 (9.6%) |
| 5 to 9 Years | 63 (6.2%) | 81 (7.7%) |
| 10 to 14 Years | 26 (2.6%) | 57 (5.4%) |
| 15 to 19 Years | 45 (4.5%) | 36 (3.4%) |
| 20 to 24 Years | 73 (7.2%) | 22 (2.1%) |
| 25 to 29 Years | 26 (2.6%) | 19 (1.8%) |
| 30 to 34 Years | 26 (2.6%) | 46 (4.4%) |
| 35 to 39 Years | 47 (4.7%) | 66 (6.3%) |
| 40 to 44 Years | 80 (7.9%) | 62 (5.9%) |
| 45 to 49 Years | 36 (3.6%) | 94 (8.9%) |
| 50 to 54 Years | 25 (2.5%) | 37 (3.5%) |
| 55 to 59 Years | 94 (9.3%) | 43 (4.1%) |
| 60 to 64 Years | 72 (7.1%) | 92 (8.7%) |
| 65 to 69 Years | 130 (12.9%) | 111 (10.5%) |
| 70 to 74 Years | 137 (13.6%) | 121 (11.5%) |
| 75 to 79 Years | 41 (4.1%) | 33 (3.1%) |
| 80 to 84 Years | 32 (3.2%) | 6 (0.6%) |
| 85 Years and over | 3 (0.3%) | 25 (2.4%) |
| Total | 1,008 (100.0%) | 1,052 (100.0%) |
Families and Households in Gearhart
Median Family Size in Gearhart
The median family size in Gearhart is 2.94 persons per family, with single female/mother families (22 | 3.7%) accounting for the largest median family size of 3.23 persons per family. On the other hand, married-couple families (499 | 84.2%) represent the smallest median family size with 2.90 persons per family.
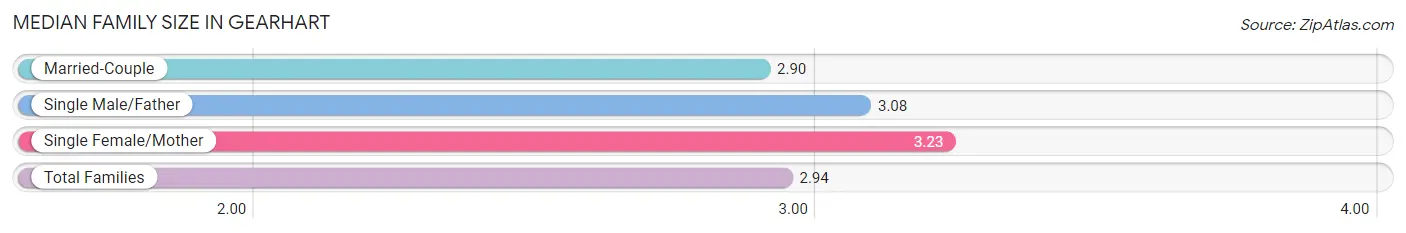
| Family Type | # Families | Family Size |
| Married-Couple | 499 (84.2%) | 2.90 |
| Single Male/Father | 72 (12.1%) | 3.08 |
| Single Female/Mother | 22 (3.7%) | 3.23 |
| Total Families | 593 (100.0%) | 2.94 |
Median Household Size in Gearhart
The median household size in Gearhart is 2.58 persons per household, with single female/mother households (22 | 2.8%) accounting for the largest median household size of 3.41 persons per household. non-family households (205 | 25.7%) represent the smallest median household size with 1.47 persons per household.
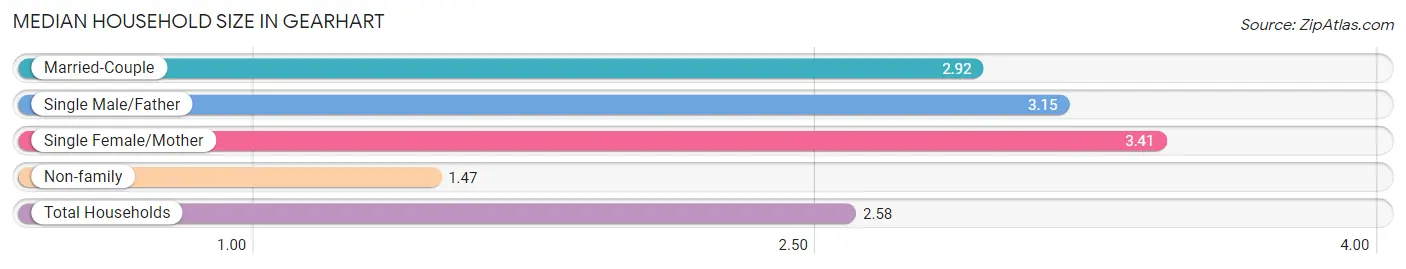
| Household Type | # Households | Household Size |
| Married-Couple | 499 (62.5%) | 2.92 |
| Single Male/Father | 72 (9.0%) | 3.15 |
| Single Female/Mother | 22 (2.8%) | 3.41 |
| Non-family | 205 (25.7%) | 1.47 |
| Total Households | 798 (100.0%) | 2.58 |
Household Size by Marriage Status in Gearhart
Out of a total of 798 households in Gearhart, 593 (74.3%) are family households, while 205 (25.7%) are nonfamily households. The most numerous type of family households are 2-person households, comprising 361, and the most common type of nonfamily households are 1-person households, comprising 128.
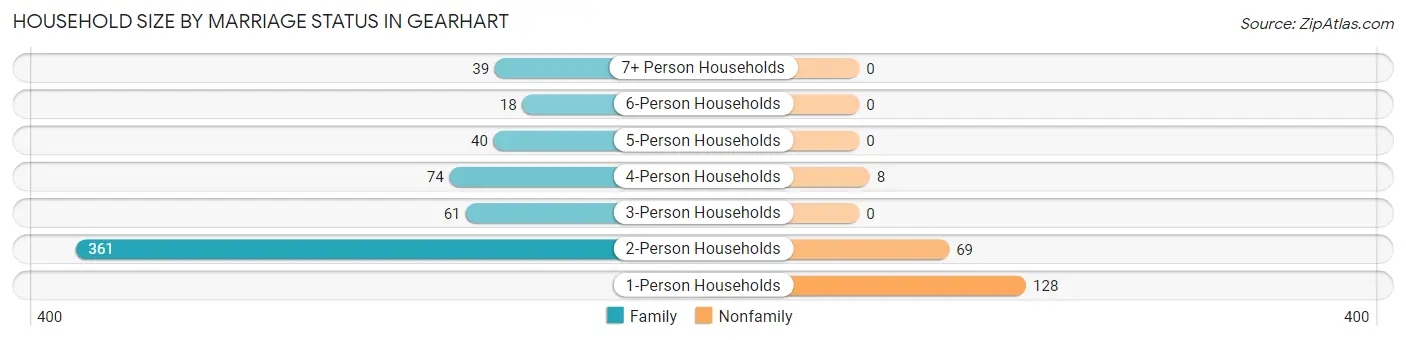
| Household Size | Family Households | Nonfamily Households |
| 1-Person Households | - | 128 (16.0%) |
| 2-Person Households | 361 (45.2%) | 69 (8.6%) |
| 3-Person Households | 61 (7.6%) | 0 (0.0%) |
| 4-Person Households | 74 (9.3%) | 8 (1.0%) |
| 5-Person Households | 40 (5.0%) | 0 (0.0%) |
| 6-Person Households | 18 (2.3%) | 0 (0.0%) |
| 7+ Person Households | 39 (4.9%) | 0 (0.0%) |
| Total | 593 (74.3%) | 205 (25.7%) |
Female Fertility in Gearhart
Fertility by Age in Gearhart
Average fertility rate in Gearhart is 52.0 births per 1,000 women. Women in the age bracket of 20 to 34 years have the highest fertility rate with 218.0 births per 1,000 women. Women in the age bracket of 20 to 34 years acount for 100.0% of all women with births.
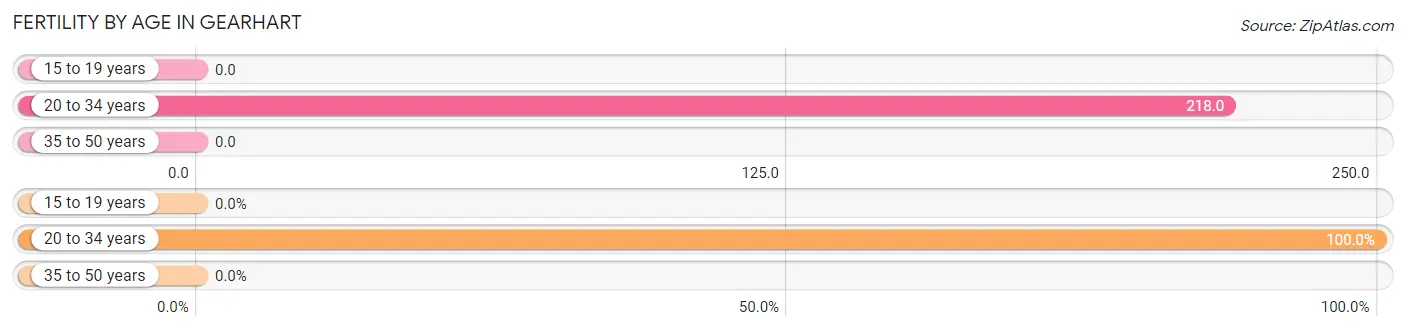
| Age Bracket | Women with Births | Births / 1,000 Women |
| 15 to 19 years | 0 (0.0%) | 0.0 |
| 20 to 34 years | 19 (100.0%) | 218.0 |
| 35 to 50 years | 0 (0.0%) | 0.0 |
| Total | 19 (100.0%) | 52.0 |
Fertility by Age by Marriage Status in Gearhart
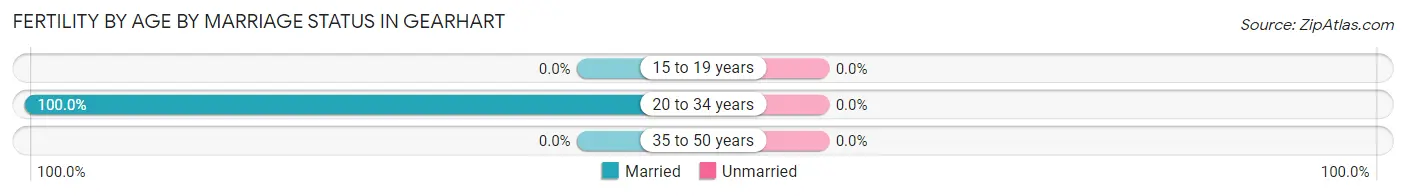
| Age Bracket | Married | Unmarried |
| 15 to 19 years | 0 (0.0%) | 0 (0.0%) |
| 20 to 34 years | 19 (100.0%) | 0 (0.0%) |
| 35 to 50 years | 0 (0.0%) | 0 (0.0%) |
| Total | 19 (100.0%) | 0 (0.0%) |
Fertility by Education in Gearhart
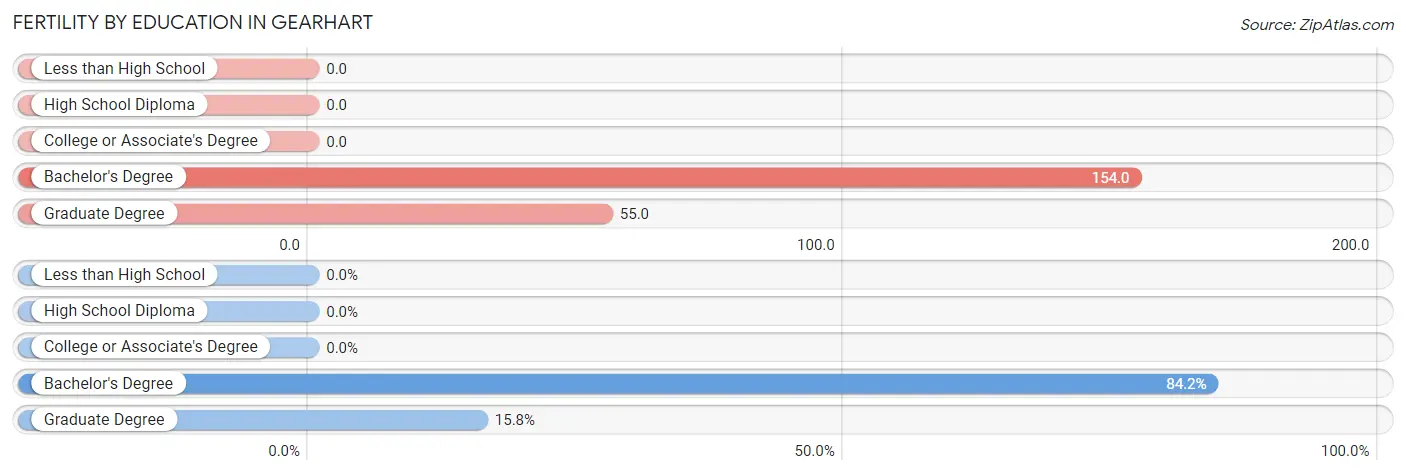
| Educational Attainment | Women with Births | Births / 1,000 Women |
| Less than High School | 0 (0.0%) | 0.0 |
| High School Diploma | 0 (0.0%) | 0.0 |
| College or Associate's Degree | 0 (0.0%) | 0.0 |
| Bachelor's Degree | 16 (84.2%) | 154.0 |
| Graduate Degree | 3 (15.8%) | 55.0 |
| Total | 19 (100.0%) | 52.0 |
Fertility by Education by Marriage Status in Gearhart
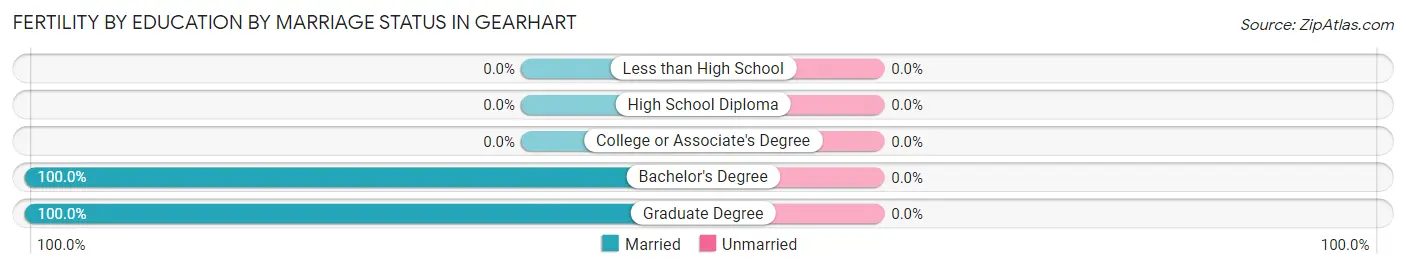
| Educational Attainment | Married | Unmarried |
| Less than High School | 0 (0.0%) | 0 (0.0%) |
| High School Diploma | 0 (0.0%) | 0 (0.0%) |
| College or Associate's Degree | 0 (0.0%) | 0 (0.0%) |
| Bachelor's Degree | 16 (100.0%) | 0 (0.0%) |
| Graduate Degree | 3 (100.0%) | 0 (0.0%) |
| Total | 19 (100.0%) | 0 (0.0%) |
Income in Gearhart
Income Overview in Gearhart
Per Capita Income in Gearhart is $47,979, while median incomes of families and households are $117,566 and $100,536 respectively.
| Characteristic | Number | Measure |
| Per Capita Income | 2,060 | $47,979 |
| Median Family Income | 593 | $117,566 |
| Mean Family Income | 593 | $139,075 |
| Median Household Income | 798 | $100,536 |
| Mean Household Income | 798 | $124,714 |
| Income Deficit | 593 | $0 |
| Wage / Income Gap (%) | 2,060 | 41.23% |
| Wage / Income Gap ($) | 2,060 | 58.77¢ per $1 |
| Gini / Inequality Index | 2,060 | 0.39 |
Earnings by Sex in Gearhart
Average Earnings in Gearhart are $46,111, $58,917 for men and $34,625 for women, a difference of 41.2%.
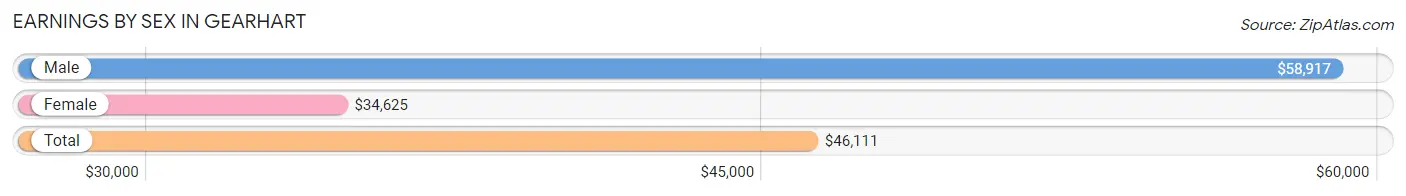
| Sex | Number | Average Earnings |
| Male | 553 (55.9%) | $58,917 |
| Female | 437 (44.1%) | $34,625 |
| Total | 990 (100.0%) | $46,111 |
Earnings by Sex by Income Bracket in Gearhart
The most common earnings brackets in Gearhart are $100,000+ for men (140 | 25.3%) and $100,000+ for women (61 | 14.0%).
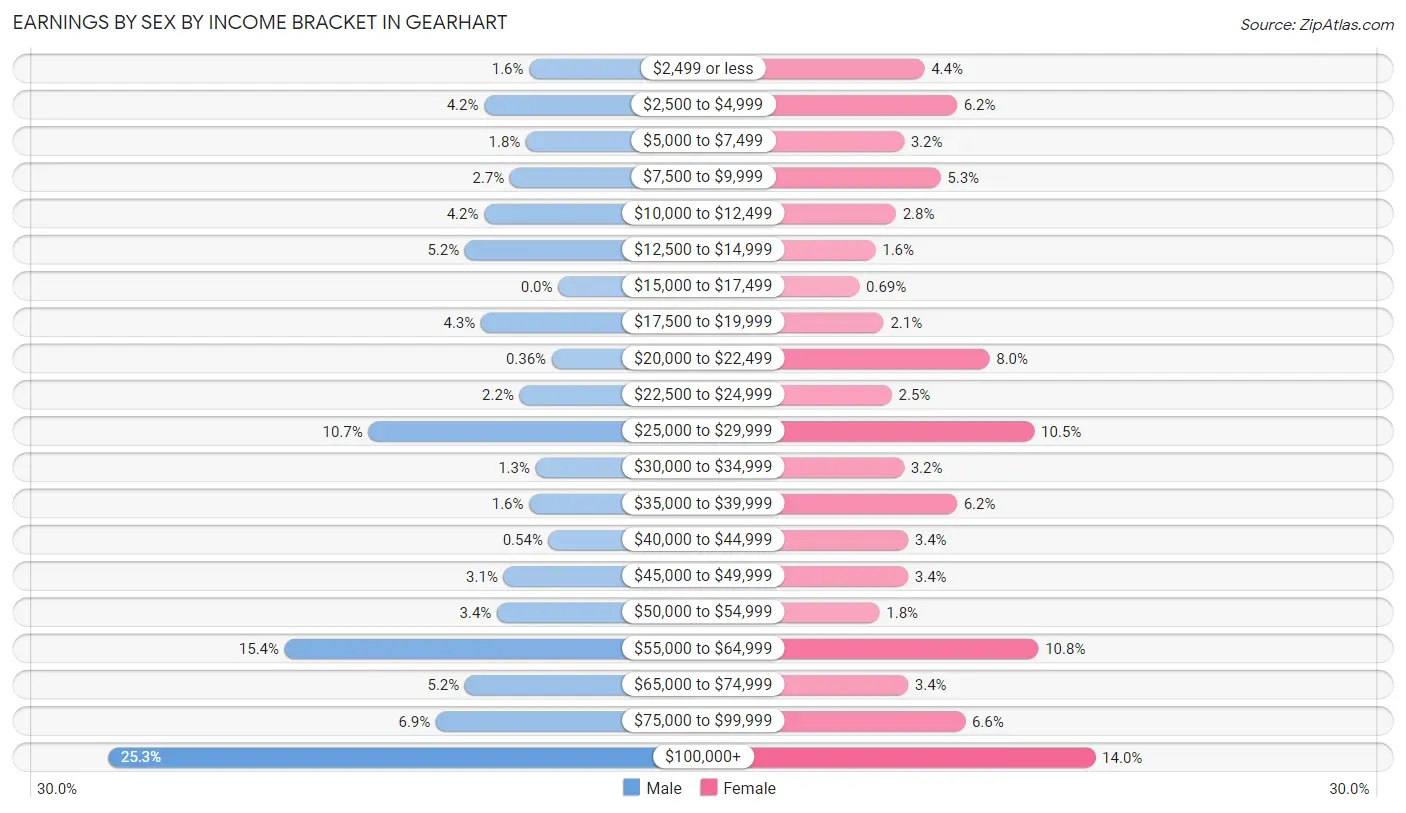
| Income | Male | Female |
| $2,499 or less | 9 (1.6%) | 19 (4.3%) |
| $2,500 to $4,999 | 23 (4.2%) | 27 (6.2%) |
| $5,000 to $7,499 | 10 (1.8%) | 14 (3.2%) |
| $7,500 to $9,999 | 15 (2.7%) | 23 (5.3%) |
| $10,000 to $12,499 | 23 (4.2%) | 12 (2.8%) |
| $12,500 to $14,999 | 29 (5.2%) | 7 (1.6%) |
| $15,000 to $17,499 | 0 (0.0%) | 3 (0.7%) |
| $17,500 to $19,999 | 24 (4.3%) | 9 (2.1%) |
| $20,000 to $22,499 | 2 (0.4%) | 35 (8.0%) |
| $22,500 to $24,999 | 12 (2.2%) | 11 (2.5%) |
| $25,000 to $29,999 | 59 (10.7%) | 46 (10.5%) |
| $30,000 to $34,999 | 7 (1.3%) | 14 (3.2%) |
| $35,000 to $39,999 | 9 (1.6%) | 27 (6.2%) |
| $40,000 to $44,999 | 3 (0.5%) | 15 (3.4%) |
| $45,000 to $49,999 | 17 (3.1%) | 15 (3.4%) |
| $50,000 to $54,999 | 19 (3.4%) | 8 (1.8%) |
| $55,000 to $64,999 | 85 (15.4%) | 47 (10.8%) |
| $65,000 to $74,999 | 29 (5.2%) | 15 (3.4%) |
| $75,000 to $99,999 | 38 (6.9%) | 29 (6.6%) |
| $100,000+ | 140 (25.3%) | 61 (14.0%) |
| Total | 553 (100.0%) | 437 (100.0%) |
Earnings by Sex by Educational Attainment in Gearhart
Average earnings in Gearhart are $62,943 for men and $37,500 for women, a difference of 40.4%. Men with an educational attainment of graduate degree enjoy the highest average annual earnings of $166,750, while those with less than high school education earn the least with $46,250. Women with an educational attainment of graduate degree earn the most with the average annual earnings of $108,375, while those with high school diploma education have the smallest earnings of $20,990.
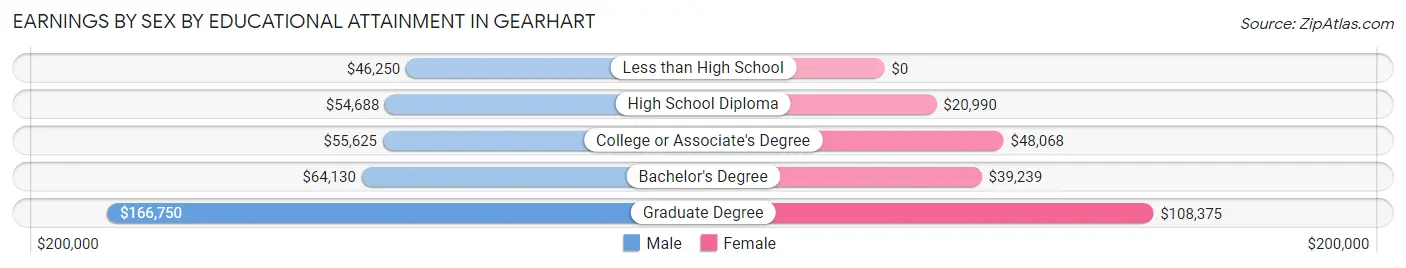
| Educational Attainment | Male Income | Female Income |
| Less than High School | $46,250 | $0 |
| High School Diploma | $54,688 | $20,990 |
| College or Associate's Degree | $55,625 | $48,068 |
| Bachelor's Degree | $64,130 | $39,239 |
| Graduate Degree | $166,750 | $108,375 |
| Total | $62,943 | $37,500 |
Family Income in Gearhart
Family Income Brackets in Gearhart
According to the Gearhart family income data, there are 141 families falling into the $100,000 to $149,999 income range, which is the most common income bracket and makes up 23.8% of all families.
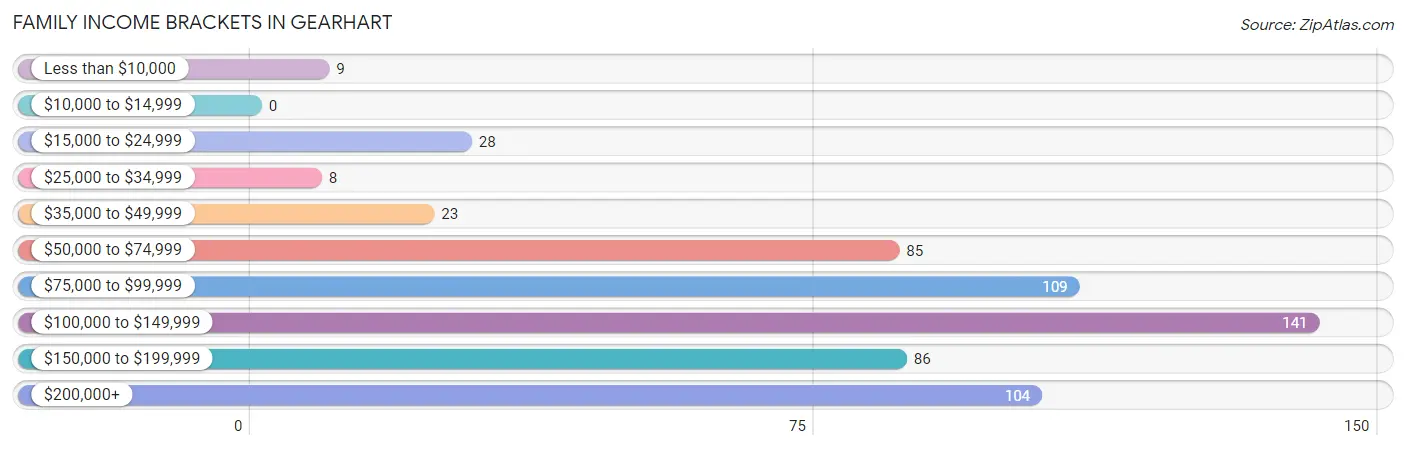
| Income Bracket | # Families | % Families |
| Less than $10,000 | 9 | 1.5% |
| $10,000 to $14,999 | 0 | 0.0% |
| $15,000 to $24,999 | 28 | 4.7% |
| $25,000 to $34,999 | 8 | 1.3% |
| $35,000 to $49,999 | 23 | 3.9% |
| $50,000 to $74,999 | 85 | 14.3% |
| $75,000 to $99,999 | 109 | 18.4% |
| $100,000 to $149,999 | 141 | 23.8% |
| $150,000 to $199,999 | 86 | 14.5% |
| $200,000+ | 104 | 17.5% |
Family Income by Famaliy Size in Gearhart
4-person families (73 | 12.3%) account for the highest median family income in Gearhart with $165,250 per family, while 2-person families (362 | 61.1%) have the highest median income of $48,869 per family member.
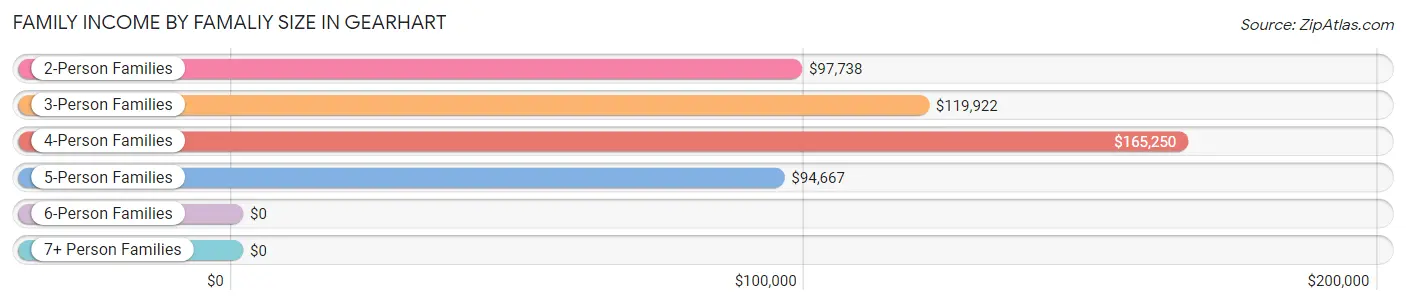
| Income Bracket | # Families | Median Income |
| 2-Person Families | 362 (61.1%) | $97,738 |
| 3-Person Families | 67 (11.3%) | $119,922 |
| 4-Person Families | 73 (12.3%) | $165,250 |
| 5-Person Families | 34 (5.7%) | $94,667 |
| 6-Person Families | 18 (3.0%) | $0 |
| 7+ Person Families | 39 (6.6%) | $0 |
| Total | 593 (100.0%) | $117,566 |
Family Income by Number of Earners in Gearhart
The median family income in Gearhart is $117,566, with families comprising 2 earners (237) having the highest median family income of $152,656, while families with no earners (151) have the lowest median family income of $75,417, accounting for 40.0% and 25.5% of families, respectively.
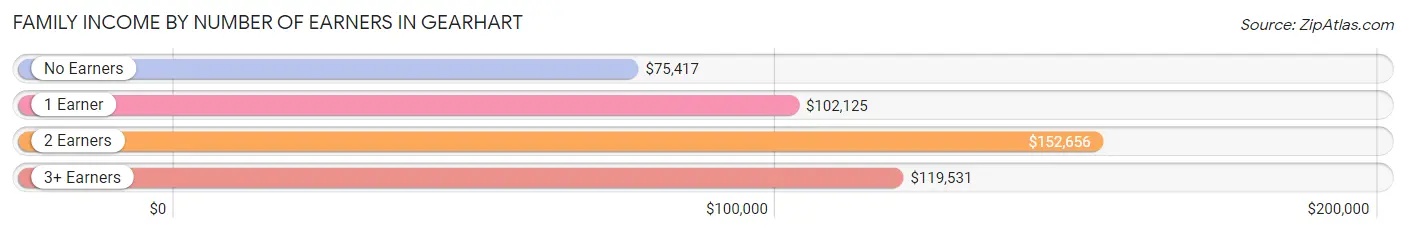
| Number of Earners | # Families | Median Income |
| No Earners | 151 (25.5%) | $75,417 |
| 1 Earner | 151 (25.5%) | $102,125 |
| 2 Earners | 237 (40.0%) | $152,656 |
| 3+ Earners | 54 (9.1%) | $119,531 |
| Total | 593 (100.0%) | $117,566 |
Household Income in Gearhart
Household Income Brackets in Gearhart
With 171 households falling in the category, the $100,000 to $149,999 income range is the most frequent in Gearhart, accounting for 21.4% of all households. In contrast, only 10 households (1.3%) fall into the $25,000 to $34,999 income bracket, making it the least populous group.
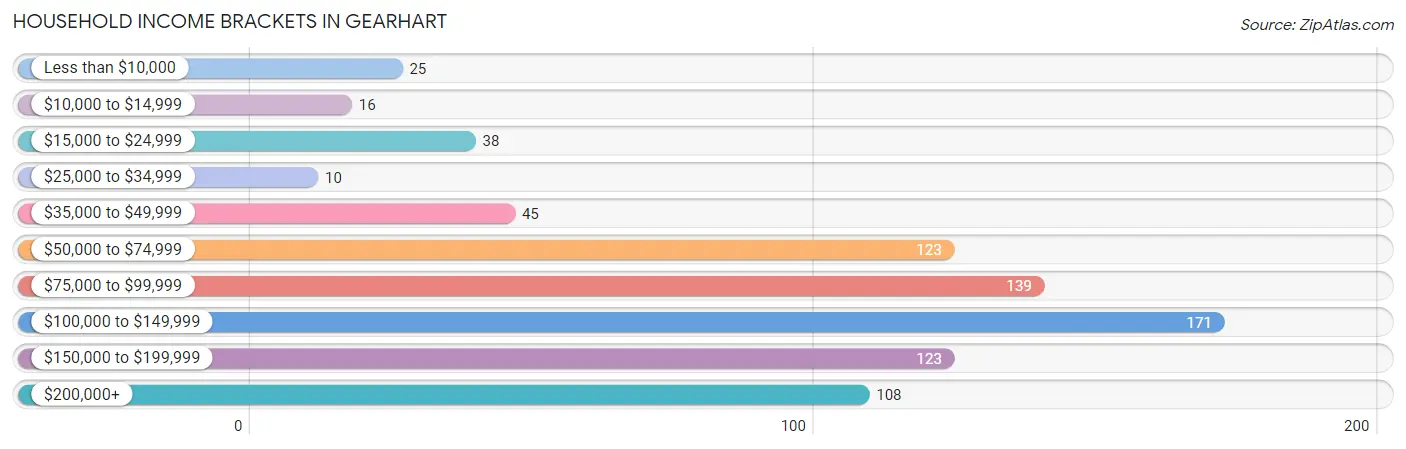
| Income Bracket | # Households | % Households |
| Less than $10,000 | 25 | 3.1% |
| $10,000 to $14,999 | 16 | 2.0% |
| $15,000 to $24,999 | 38 | 4.8% |
| $25,000 to $34,999 | 10 | 1.3% |
| $35,000 to $49,999 | 45 | 5.6% |
| $50,000 to $74,999 | 123 | 15.4% |
| $75,000 to $99,999 | 139 | 17.4% |
| $100,000 to $149,999 | 171 | 21.4% |
| $150,000 to $199,999 | 123 | 15.4% |
| $200,000+ | 108 | 13.5% |
Household Income by Householder Age in Gearhart
The median household income in Gearhart is $100,536, with the highest median household income of $154,122 found in the 25 to 44 years age bracket for the primary householder. A total of 166 households (20.8%) fall into this category. Meanwhile, the 15 to 24 years age bracket for the primary householder has the lowest median household income of $0, with 11 households (1.4%) in this group.
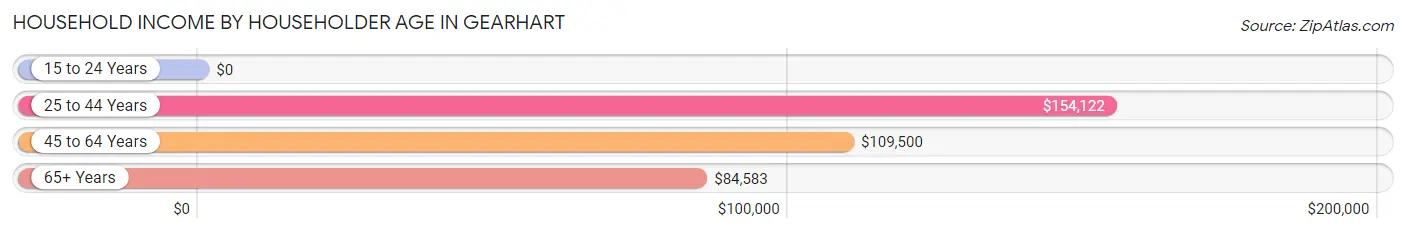
| Income Bracket | # Households | Median Income |
| 15 to 24 Years | 11 (1.4%) | $0 |
| 25 to 44 Years | 166 (20.8%) | $154,122 |
| 45 to 64 Years | 262 (32.8%) | $109,500 |
| 65+ Years | 359 (45.0%) | $84,583 |
| Total | 798 (100.0%) | $100,536 |
Poverty in Gearhart
Income Below Poverty by Sex and Age in Gearhart
With 4.2% poverty level for males and 7.3% for females among the residents of Gearhart, 12 to 14 year old males and 12 to 14 year old females are the most vulnerable to poverty, with 6 males (46.2%) and 7 females (20.6%) in their respective age groups living below the poverty level.
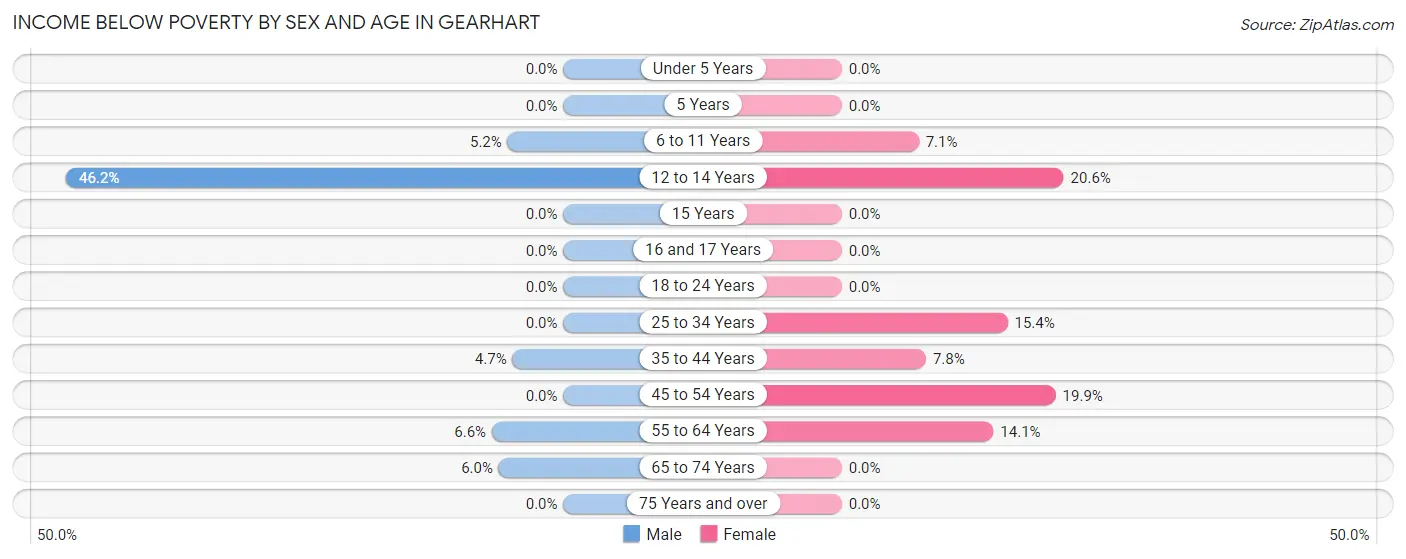
| Age Bracket | Male | Female |
| Under 5 Years | 0 (0.0%) | 0 (0.0%) |
| 5 Years | 0 (0.0%) | 0 (0.0%) |
| 6 to 11 Years | 3 (5.2%) | 5 (7.1%) |
| 12 to 14 Years | 6 (46.2%) | 7 (20.6%) |
| 15 Years | 0 (0.0%) | 0 (0.0%) |
| 16 and 17 Years | 0 (0.0%) | 0 (0.0%) |
| 18 to 24 Years | 0 (0.0%) | 0 (0.0%) |
| 25 to 34 Years | 0 (0.0%) | 10 (15.4%) |
| 35 to 44 Years | 6 (4.7%) | 10 (7.8%) |
| 45 to 54 Years | 0 (0.0%) | 26 (19.9%) |
| 55 to 64 Years | 11 (6.6%) | 19 (14.1%) |
| 65 to 74 Years | 16 (6.0%) | 0 (0.0%) |
| 75 Years and over | 0 (0.0%) | 0 (0.0%) |
| Total | 42 (4.2%) | 77 (7.3%) |
Income Above Poverty by Sex and Age in Gearhart
According to the poverty statistics in Gearhart, males aged under 5 years and females aged under 5 years are the age groups that are most secure financially, with 100.0% of males and 100.0% of females in these age groups living above the poverty line.
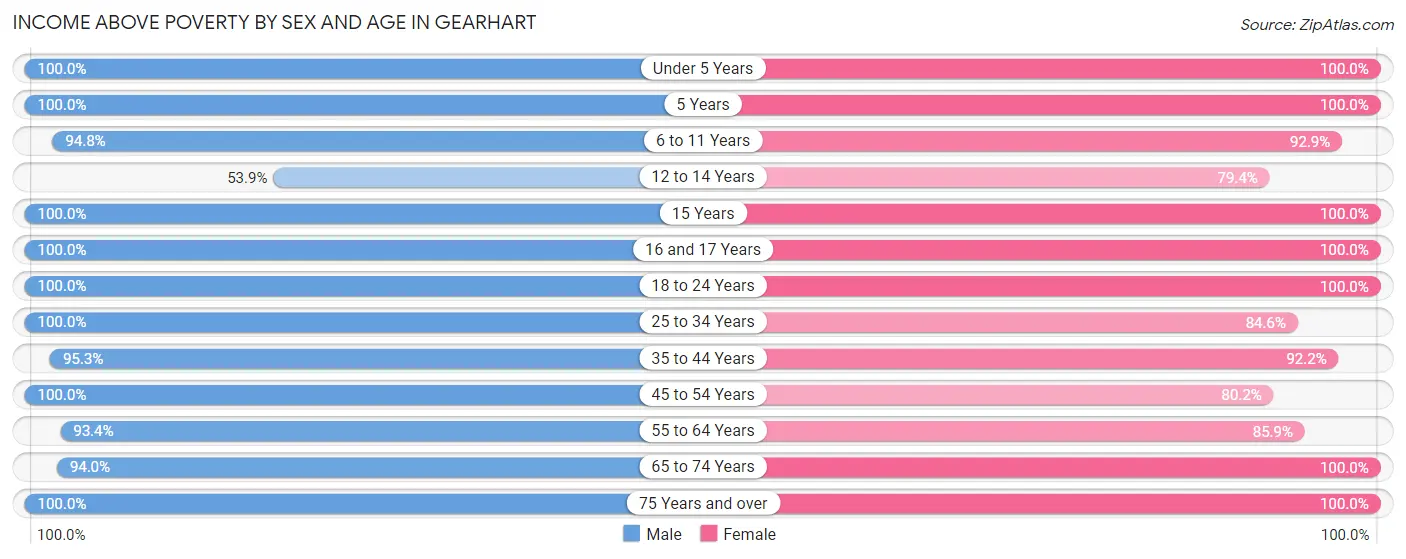
| Age Bracket | Male | Female |
| Under 5 Years | 52 (100.0%) | 101 (100.0%) |
| 5 Years | 15 (100.0%) | 34 (100.0%) |
| 6 to 11 Years | 55 (94.8%) | 65 (92.9%) |
| 12 to 14 Years | 7 (53.8%) | 27 (79.4%) |
| 15 Years | 27 (100.0%) | 8 (100.0%) |
| 16 and 17 Years | 12 (100.0%) | 23 (100.0%) |
| 18 to 24 Years | 79 (100.0%) | 27 (100.0%) |
| 25 to 34 Years | 52 (100.0%) | 55 (84.6%) |
| 35 to 44 Years | 121 (95.3%) | 118 (92.2%) |
| 45 to 54 Years | 61 (100.0%) | 105 (80.1%) |
| 55 to 64 Years | 155 (93.4%) | 116 (85.9%) |
| 65 to 74 Years | 251 (94.0%) | 232 (100.0%) |
| 75 Years and over | 76 (100.0%) | 64 (100.0%) |
| Total | 963 (95.8%) | 975 (92.7%) |
Income Below Poverty Among Married-Couple Families in Gearhart
The poverty statistics for married-couple families in Gearhart show that 1.2% or 6 of the total 499 families live below the poverty line. Families with 1 or 2 children have the highest poverty rate of 6.8%, comprising of 6 families. On the other hand, families with no children have the lowest poverty rate of 0.0%, which includes 0 families.
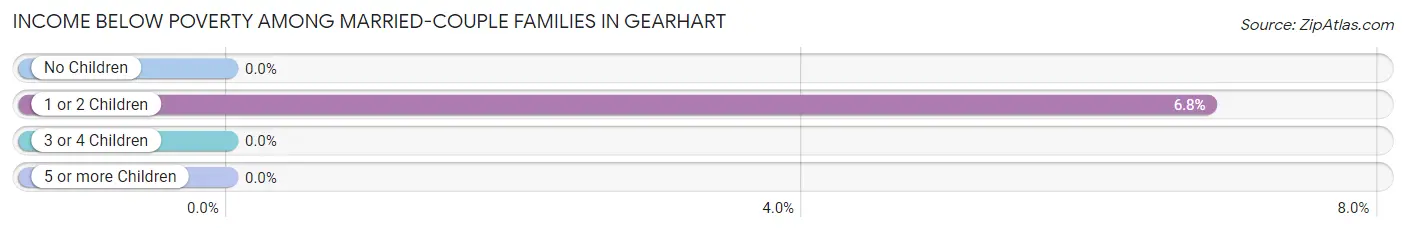
| Children | Above Poverty | Below Poverty |
| No Children | 345 (100.0%) | 0 (0.0%) |
| 1 or 2 Children | 82 (93.2%) | 6 (6.8%) |
| 3 or 4 Children | 66 (100.0%) | 0 (0.0%) |
| 5 or more Children | 0 (0.0%) | 0 (0.0%) |
| Total | 493 (98.8%) | 6 (1.2%) |
Income Below Poverty Among Single-Parent Households in Gearhart
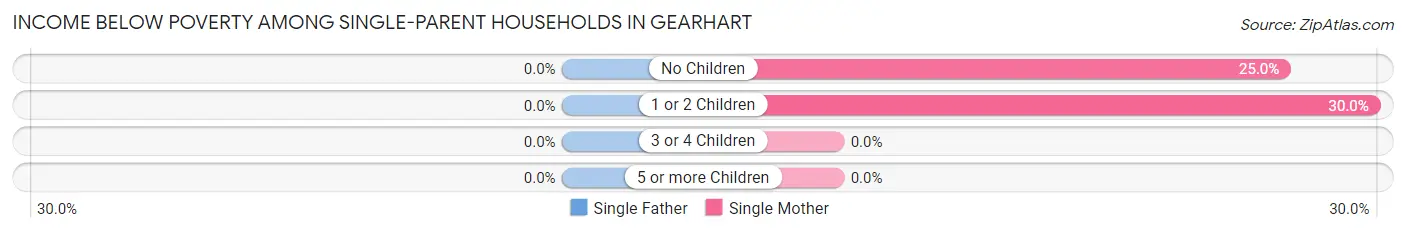
| Children | Single Father | Single Mother |
| No Children | 0 (0.0%) | 3 (25.0%) |
| 1 or 2 Children | 0 (0.0%) | 3 (30.0%) |
| 3 or 4 Children | 0 (0.0%) | 0 (0.0%) |
| 5 or more Children | 0 (0.0%) | 0 (0.0%) |
| Total | 0 (0.0%) | 6 (27.3%) |
Income Below Poverty Among Married-Couple vs Single-Parent Households in Gearhart
The poverty data for Gearhart shows that 6 of the married-couple family households (1.2%) and 6 of the single-parent households (6.4%) are living below the poverty level. Within the married-couple family households, those with 1 or 2 children have the highest poverty rate, with 6 households (6.8%) falling below the poverty line. Among the single-parent households, those with 1 or 2 children have the highest poverty rate, with 3 household (11.5%) living below poverty.
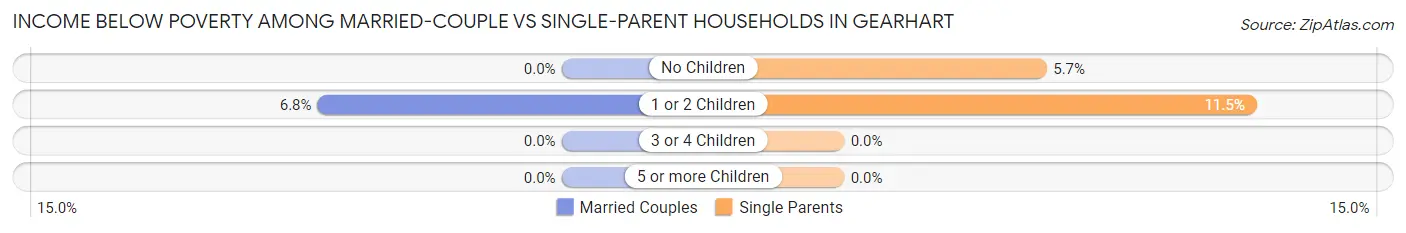
| Children | Married-Couple Families | Single-Parent Households |
| No Children | 0 (0.0%) | 3 (5.7%) |
| 1 or 2 Children | 6 (6.8%) | 3 (11.5%) |
| 3 or 4 Children | 0 (0.0%) | 0 (0.0%) |
| 5 or more Children | 0 (0.0%) | 0 (0.0%) |
| Total | 6 (1.2%) | 6 (6.4%) |
Employment Characteristics in Gearhart
Employment by Class of Employer in Gearhart
Among the 909 employed individuals in Gearhart, private company employees (554 | 61.0%), self-employed (incorporated) (117 | 12.9%), and local government employees (66 | 7.3%) make up the most common classes of employment.
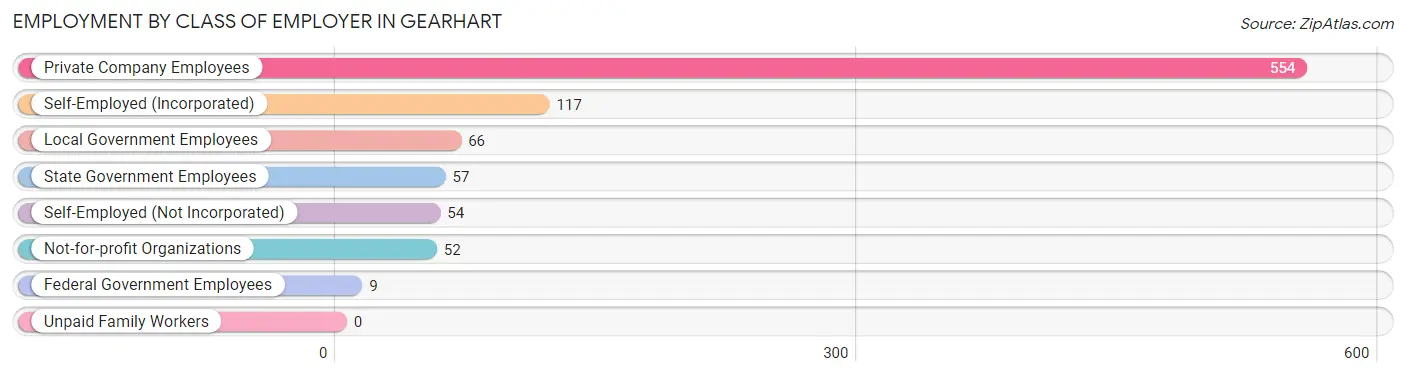
| Employer Class | # Employees | % Employees |
| Private Company Employees | 554 | 61.0% |
| Self-Employed (Incorporated) | 117 | 12.9% |
| Self-Employed (Not Incorporated) | 54 | 5.9% |
| Not-for-profit Organizations | 52 | 5.7% |
| Local Government Employees | 66 | 7.3% |
| State Government Employees | 57 | 6.3% |
| Federal Government Employees | 9 | 1.0% |
| Unpaid Family Workers | 0 | 0.0% |
| Total | 909 | 100.0% |
Employment Status by Age in Gearhart
According to the labor force statistics for Gearhart, out of the total population over 16 years of age (1,645), 57.3% or 943 individuals are in the labor force, with 2.6% or 25 of them unemployed. The age group with the highest labor force participation rate is 20 to 24 years, with 90.5% or 86 individuals in the labor force. Within the labor force, the 65 to 74 years age range has the highest percentage of unemployed individuals, with 8.2% or 11 of them being unemployed.
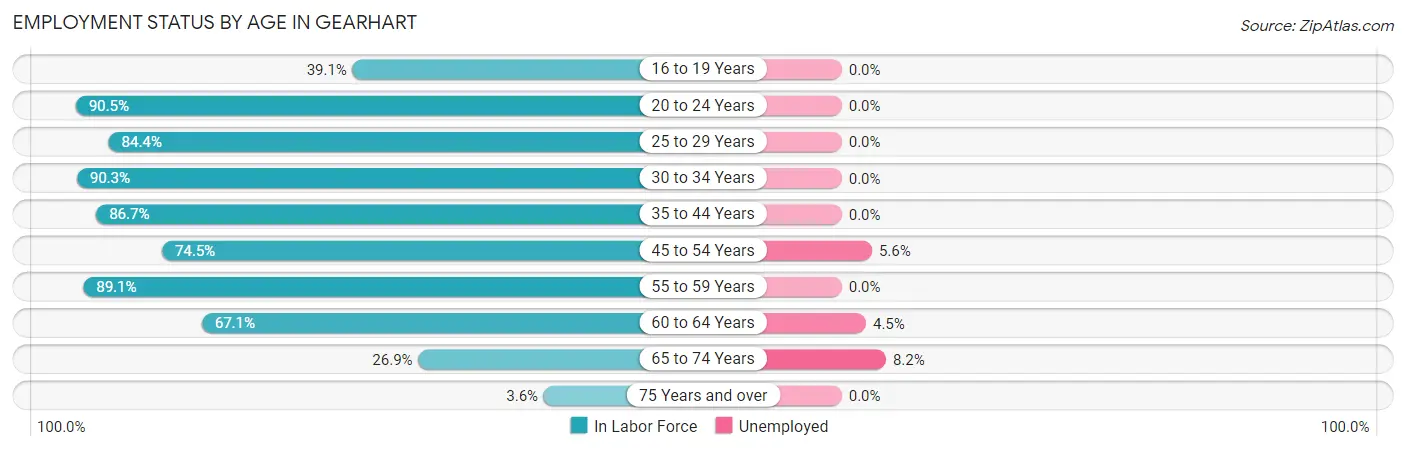
| Age Bracket | In Labor Force | Unemployed |
| 16 to 19 Years | 18 (39.1%) | 0 (0.0%) |
| 20 to 24 Years | 86 (90.5%) | 0 (0.0%) |
| 25 to 29 Years | 38 (84.4%) | 0 (0.0%) |
| 30 to 34 Years | 65 (90.3%) | 0 (0.0%) |
| 35 to 44 Years | 221 (86.7%) | 0 (0.0%) |
| 45 to 54 Years | 143 (74.5%) | 8 (5.6%) |
| 55 to 59 Years | 122 (89.1%) | 0 (0.0%) |
| 60 to 64 Years | 110 (67.1%) | 5 (4.5%) |
| 65 to 74 Years | 134 (26.9%) | 11 (8.2%) |
| 75 Years and over | 5 (3.6%) | 0 (0.0%) |
| Total | 943 (57.3%) | 25 (2.6%) |
Employment Status by Educational Attainment in Gearhart
According to labor force statistics for Gearhart, 80.8% of individuals (699) out of the total population between 25 and 64 years of age (865) are in the labor force, with 1.9% or 13 of them being unemployed. The group with the highest labor force participation rate are those with the educational attainment of high school diploma, with 92.3% or 216 individuals in the labor force. Within the labor force, individuals with college / associate degree education have the highest percentage of unemployment, with 3.0% or 5 of them being unemployed.
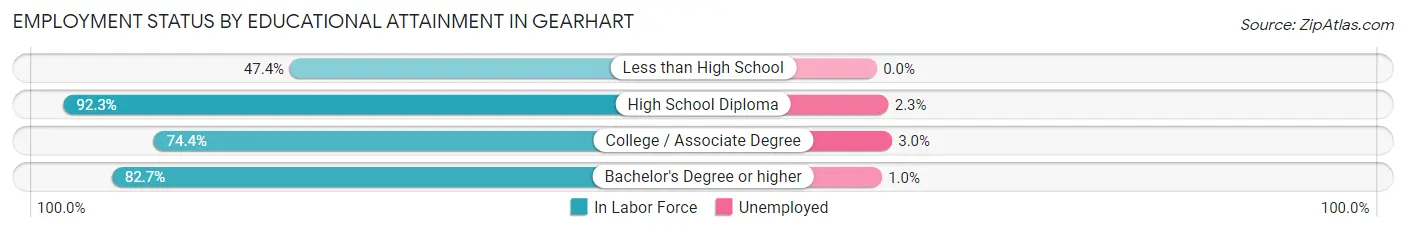
| Educational Attainment | In Labor Force | Unemployed |
| Less than High School | 27 (47.4%) | 0 (0.0%) |
| High School Diploma | 216 (92.3%) | 5 (2.3%) |
| College / Associate Degree | 169 (74.4%) | 7 (3.0%) |
| Bachelor's Degree or higher | 287 (82.7%) | 3 (1.0%) |
| Total | 699 (80.8%) | 16 (1.9%) |
Employment Occupations by Sex in Gearhart
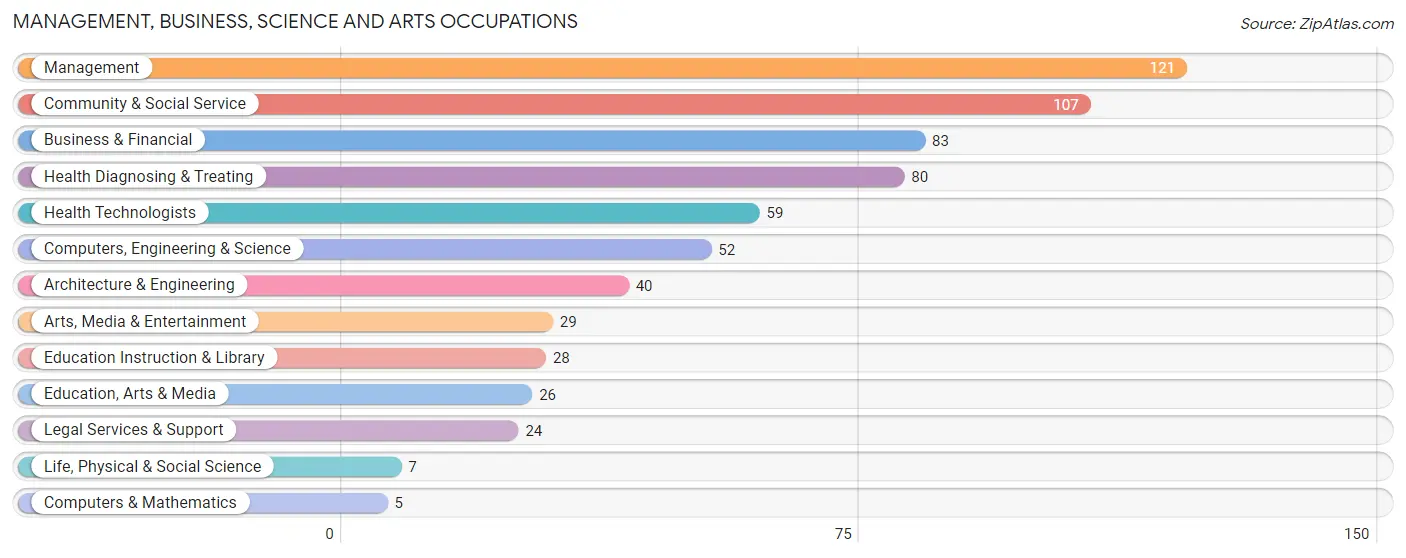
Management, Business, Science and Arts Occupations
The most common Management, Business, Science and Arts occupations in Gearhart are Management (121 | 13.2%), Community & Social Service (107 | 11.7%), Business & Financial (83 | 9.1%), Health Diagnosing & Treating (80 | 8.7%), and Health Technologists (59 | 6.5%).
Management, Business, Science and Arts Occupations by Sex
Within the Management, Business, Science and Arts occupations in Gearhart, the most male-oriented occupations are Computers & Mathematics (100.0%), Architecture & Engineering (100.0%), and Computers, Engineering & Science (94.2%), while the most female-oriented occupations are Education, Arts & Media (100.0%), Business & Financial (86.8%), and Health Diagnosing & Treating (61.3%).
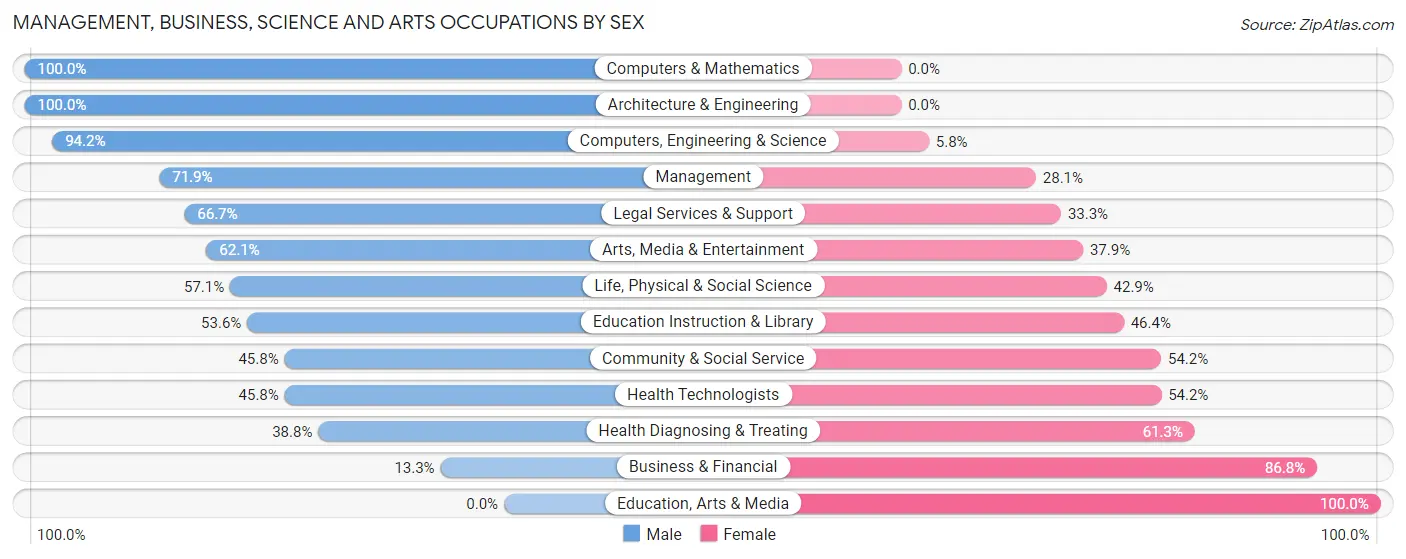
| Occupation | Male | Female |
| Management | 87 (71.9%) | 34 (28.1%) |
| Business & Financial | 11 (13.3%) | 72 (86.8%) |
| Computers, Engineering & Science | 49 (94.2%) | 3 (5.8%) |
| Computers & Mathematics | 5 (100.0%) | 0 (0.0%) |
| Architecture & Engineering | 40 (100.0%) | 0 (0.0%) |
| Life, Physical & Social Science | 4 (57.1%) | 3 (42.9%) |
| Community & Social Service | 49 (45.8%) | 58 (54.2%) |
| Education, Arts & Media | 0 (0.0%) | 26 (100.0%) |
| Legal Services & Support | 16 (66.7%) | 8 (33.3%) |
| Education Instruction & Library | 15 (53.6%) | 13 (46.4%) |
| Arts, Media & Entertainment | 18 (62.1%) | 11 (37.9%) |
| Health Diagnosing & Treating | 31 (38.8%) | 49 (61.3%) |
| Health Technologists | 27 (45.8%) | 32 (54.2%) |
| Total (Category) | 227 (51.2%) | 216 (48.8%) |
| Total (Overall) | 506 (55.4%) | 408 (44.6%) |
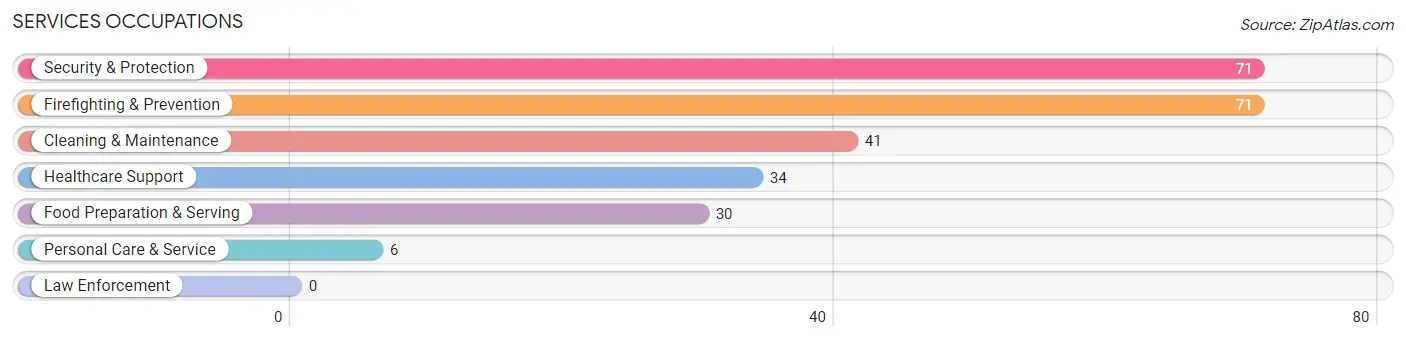
Services Occupations
The most common Services occupations in Gearhart are Security & Protection (71 | 7.8%), Firefighting & Prevention (71 | 7.8%), Cleaning & Maintenance (41 | 4.5%), Healthcare Support (34 | 3.7%), and Food Preparation & Serving (30 | 3.3%).
Services Occupations by Sex
Within the Services occupations in Gearhart, the most male-oriented occupations are Security & Protection (100.0%), Firefighting & Prevention (100.0%), and Personal Care & Service (100.0%), while the most female-oriented occupations are Healthcare Support (61.8%), Cleaning & Maintenance (41.5%), and Food Preparation & Serving (36.7%).
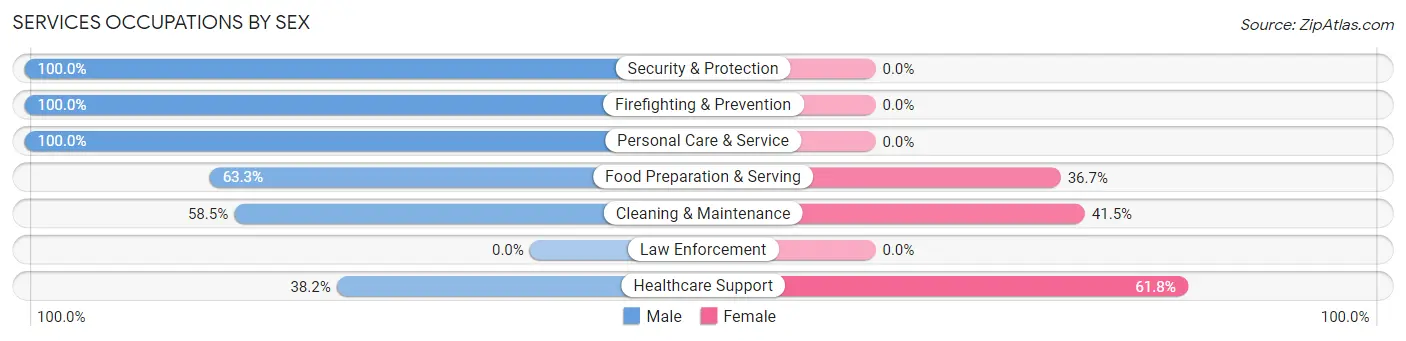
| Occupation | Male | Female |
| Healthcare Support | 13 (38.2%) | 21 (61.8%) |
| Security & Protection | 71 (100.0%) | 0 (0.0%) |
| Firefighting & Prevention | 71 (100.0%) | 0 (0.0%) |
| Law Enforcement | 0 (0.0%) | 0 (0.0%) |
| Food Preparation & Serving | 19 (63.3%) | 11 (36.7%) |
| Cleaning & Maintenance | 24 (58.5%) | 17 (41.5%) |
| Personal Care & Service | 6 (100.0%) | 0 (0.0%) |
| Total (Category) | 133 (73.1%) | 49 (26.9%) |
| Total (Overall) | 506 (55.4%) | 408 (44.6%) |
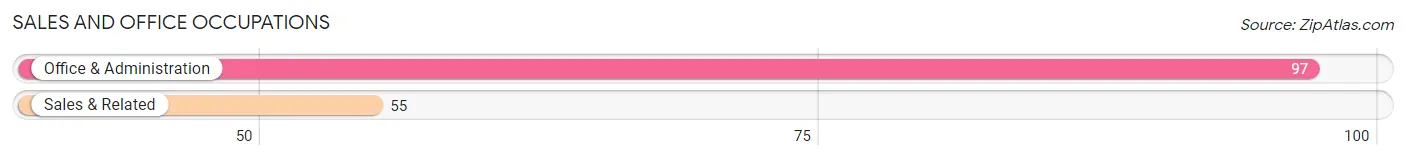
Sales and Office Occupations
The most common Sales and Office occupations in Gearhart are Office & Administration (97 | 10.6%), and Sales & Related (55 | 6.0%).
Sales and Office Occupations by Sex
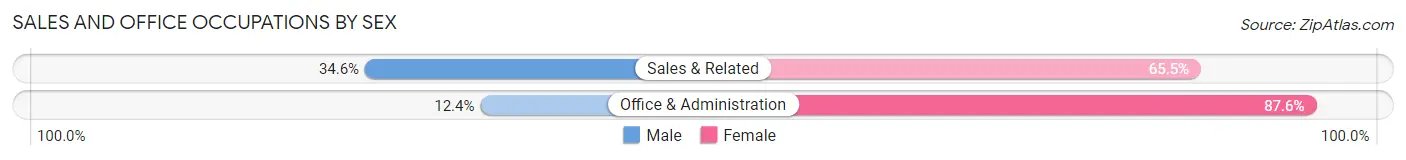
| Occupation | Male | Female |
| Sales & Related | 19 (34.5%) | 36 (65.4%) |
| Office & Administration | 12 (12.4%) | 85 (87.6%) |
| Total (Category) | 31 (20.4%) | 121 (79.6%) |
| Total (Overall) | 506 (55.4%) | 408 (44.6%) |
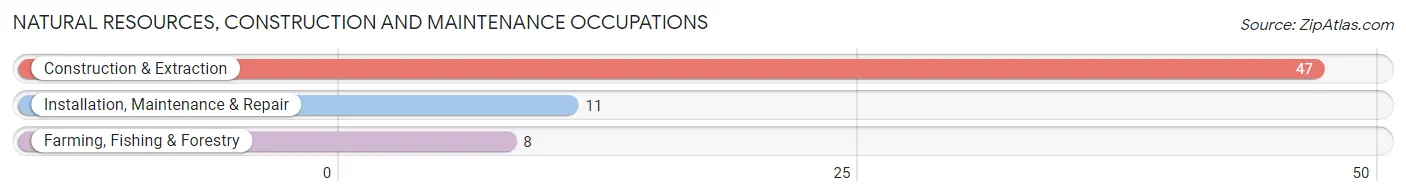
Natural Resources, Construction and Maintenance Occupations
The most common Natural Resources, Construction and Maintenance occupations in Gearhart are Construction & Extraction (47 | 5.1%), Installation, Maintenance & Repair (11 | 1.2%), and Farming, Fishing & Forestry (8 | 0.9%).
Natural Resources, Construction and Maintenance Occupations by Sex
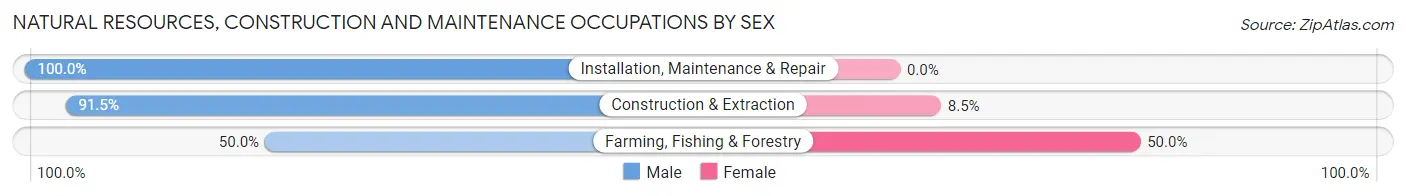
| Occupation | Male | Female |
| Farming, Fishing & Forestry | 4 (50.0%) | 4 (50.0%) |
| Construction & Extraction | 43 (91.5%) | 4 (8.5%) |
| Installation, Maintenance & Repair | 11 (100.0%) | 0 (0.0%) |
| Total (Category) | 58 (87.9%) | 8 (12.1%) |
| Total (Overall) | 506 (55.4%) | 408 (44.6%) |
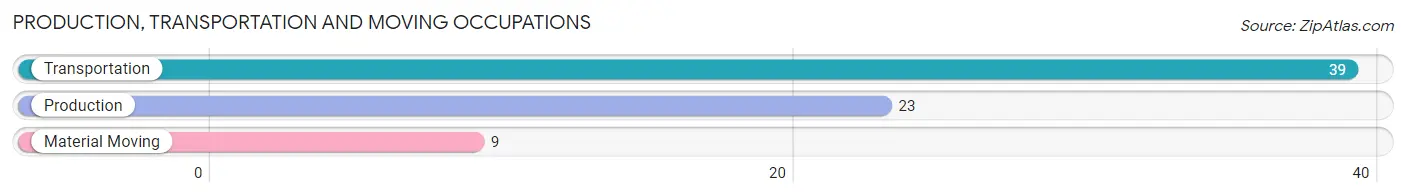
Production, Transportation and Moving Occupations
The most common Production, Transportation and Moving occupations in Gearhart are Transportation (39 | 4.3%), Production (23 | 2.5%), and Material Moving (9 | 1.0%).
Production, Transportation and Moving Occupations by Sex
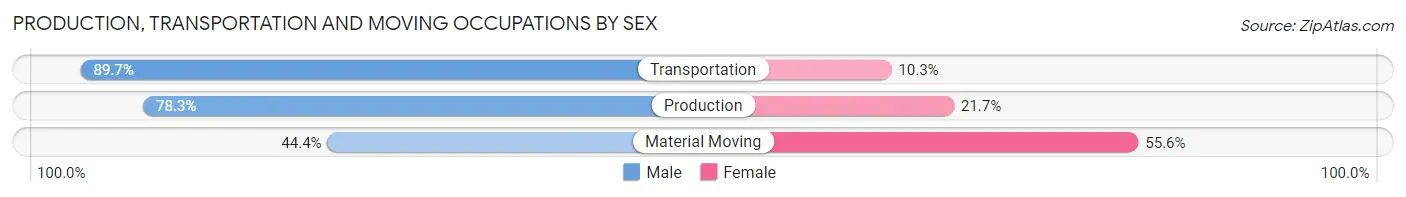
| Occupation | Male | Female |
| Production | 18 (78.3%) | 5 (21.7%) |
| Transportation | 35 (89.7%) | 4 (10.3%) |
| Material Moving | 4 (44.4%) | 5 (55.6%) |
| Total (Category) | 57 (80.3%) | 14 (19.7%) |
| Total (Overall) | 506 (55.4%) | 408 (44.6%) |
Employment Industries by Sex in Gearhart
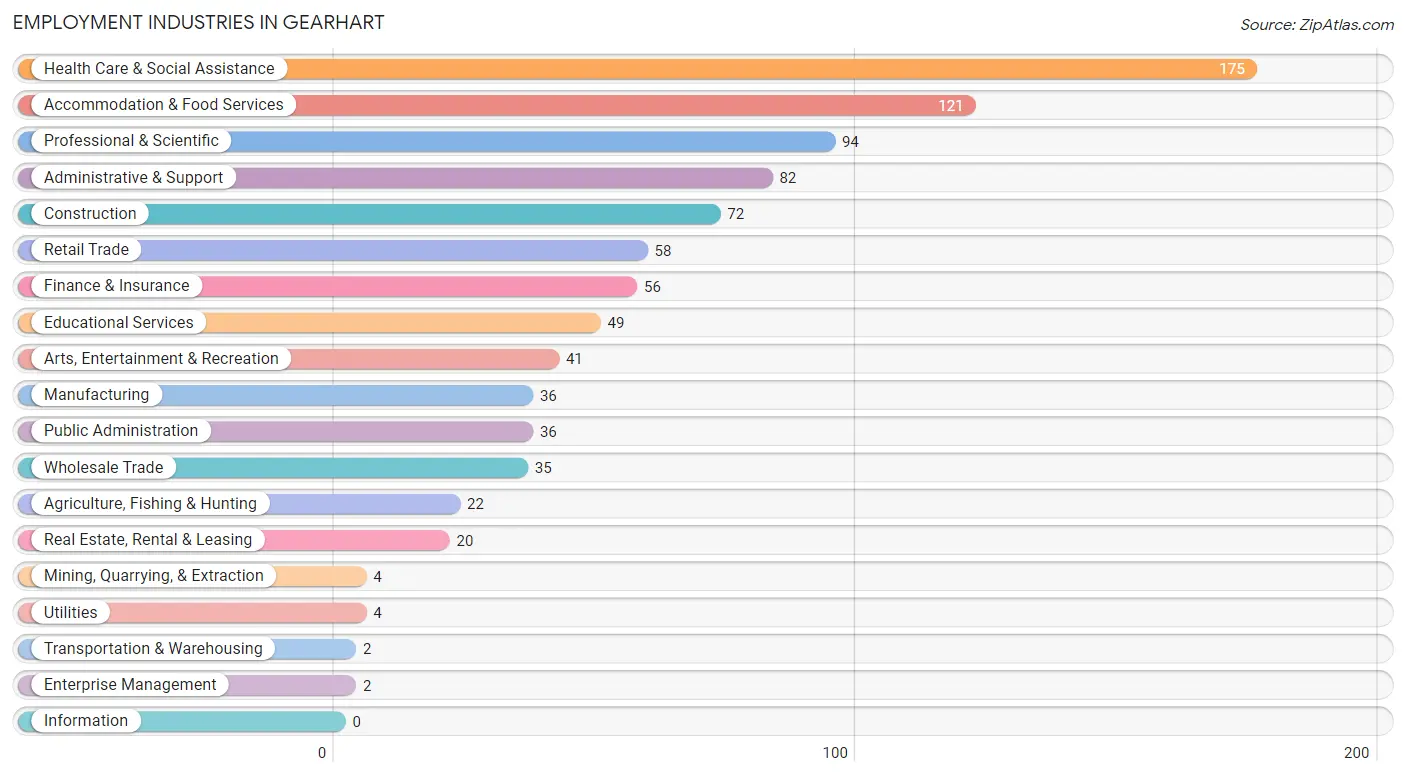
Employment Industries in Gearhart
The major employment industries in Gearhart include Health Care & Social Assistance (175 | 19.2%), Accommodation & Food Services (121 | 13.2%), Professional & Scientific (94 | 10.3%), Administrative & Support (82 | 9.0%), and Construction (72 | 7.9%).
Employment Industries by Sex in Gearhart
The Gearhart industries that see more men than women are Mining, Quarrying, & Extraction (100.0%), Transportation & Warehousing (100.0%), and Enterprise Management (100.0%), whereas the industries that tend to have a higher number of women are Finance & Insurance (89.3%), Retail Trade (77.6%), and Public Administration (72.2%).
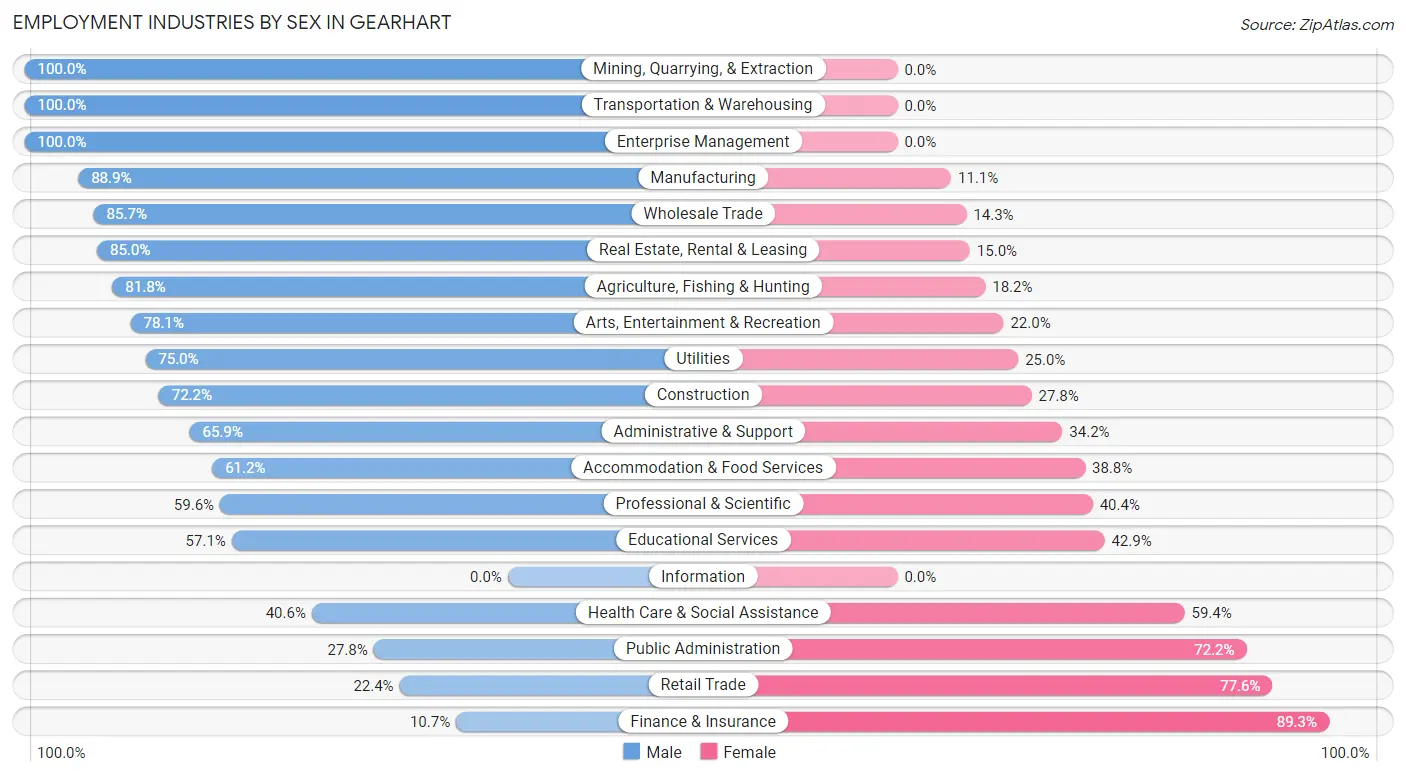
| Industry | Male | Female |
| Agriculture, Fishing & Hunting | 18 (81.8%) | 4 (18.2%) |
| Mining, Quarrying, & Extraction | 4 (100.0%) | 0 (0.0%) |
| Construction | 52 (72.2%) | 20 (27.8%) |
| Manufacturing | 32 (88.9%) | 4 (11.1%) |
| Wholesale Trade | 30 (85.7%) | 5 (14.3%) |
| Retail Trade | 13 (22.4%) | 45 (77.6%) |
| Transportation & Warehousing | 2 (100.0%) | 0 (0.0%) |
| Utilities | 3 (75.0%) | 1 (25.0%) |
| Information | 0 (0.0%) | 0 (0.0%) |
| Finance & Insurance | 6 (10.7%) | 50 (89.3%) |
| Real Estate, Rental & Leasing | 17 (85.0%) | 3 (15.0%) |
| Professional & Scientific | 56 (59.6%) | 38 (40.4%) |
| Enterprise Management | 2 (100.0%) | 0 (0.0%) |
| Administrative & Support | 54 (65.8%) | 28 (34.2%) |
| Educational Services | 28 (57.1%) | 21 (42.9%) |
| Health Care & Social Assistance | 71 (40.6%) | 104 (59.4%) |
| Arts, Entertainment & Recreation | 32 (78.0%) | 9 (22.0%) |
| Accommodation & Food Services | 74 (61.2%) | 47 (38.8%) |
| Public Administration | 10 (27.8%) | 26 (72.2%) |
| Total | 506 (55.4%) | 408 (44.6%) |
Education in Gearhart
School Enrollment in Gearhart
The most common levels of schooling among the 356 students in Gearhart are high school (78 | 21.9%), elementary school (73 | 20.5%), and middle school (65 | 18.3%).
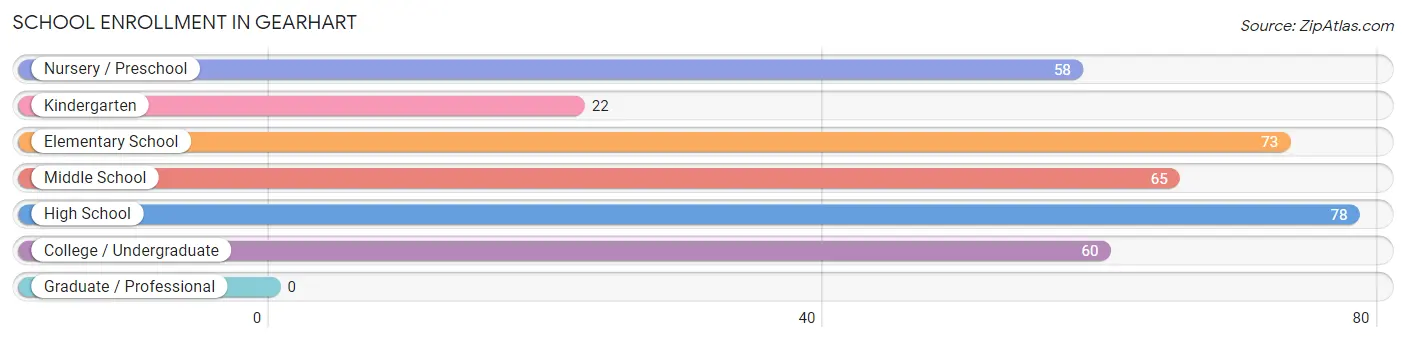
| School Level | # Students | % Students |
| Nursery / Preschool | 58 | 16.3% |
| Kindergarten | 22 | 6.2% |
| Elementary School | 73 | 20.5% |
| Middle School | 65 | 18.3% |
| High School | 78 | 21.9% |
| College / Undergraduate | 60 | 16.9% |
| Graduate / Professional | 0 | 0.0% |
| Total | 356 | 100.0% |
School Enrollment by Age by Funding Source in Gearhart
Out of a total of 356 students who are enrolled in schools in Gearhart, 47 (13.2%) attend a private institution, while the remaining 309 (86.8%) are enrolled in public schools. The age group of 5 to 9 year old has the highest likelihood of being enrolled in private schools, with 38 (31.9% in the age bracket) enrolled. Conversely, the age group of 10 to 14 year olds has the lowest likelihood of being enrolled in a private school, with 83 (100.0% in the age bracket) attending a public institution.
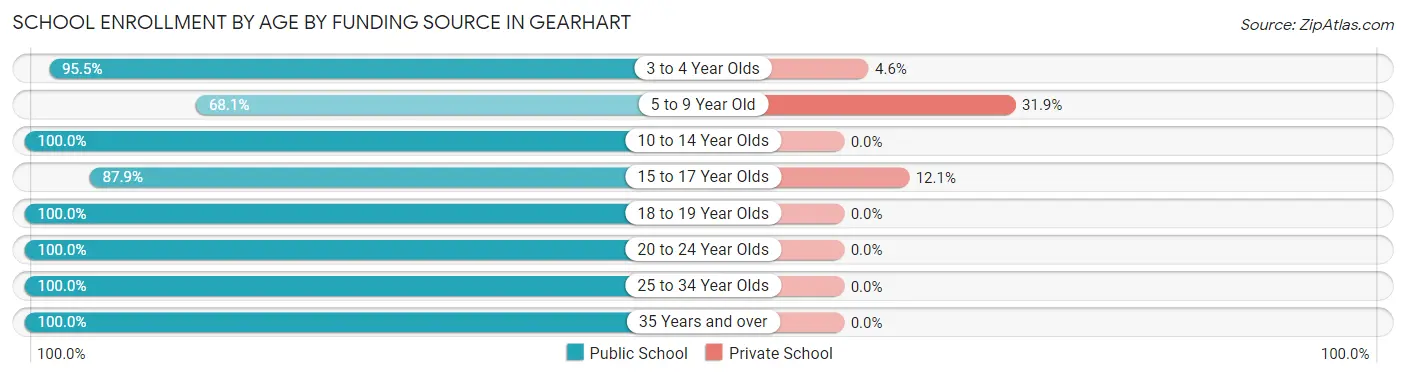
| Age Bracket | Public School | Private School |
| 3 to 4 Year Olds | 21 (95.5%) | 1 (4.5%) |
| 5 to 9 Year Old | 81 (68.1%) | 38 (31.9%) |
| 10 to 14 Year Olds | 83 (100.0%) | 0 (0.0%) |
| 15 to 17 Year Olds | 58 (87.9%) | 8 (12.1%) |
| 18 to 19 Year Olds | 11 (100.0%) | 0 (0.0%) |
| 20 to 24 Year Olds | 37 (100.0%) | 0 (0.0%) |
| 25 to 34 Year Olds | 4 (100.0%) | 0 (0.0%) |
| 35 Years and over | 14 (100.0%) | 0 (0.0%) |
| Total | 309 (86.8%) | 47 (13.2%) |
Educational Attainment by Field of Study in Gearhart
Education (143 | 19.3%), business (114 | 15.4%), science & technology (74 | 10.0%), psychology (56 | 7.5%), and social sciences (56 | 7.5%) are the most common fields of study among 742 individuals in Gearhart who have obtained a bachelor's degree or higher.
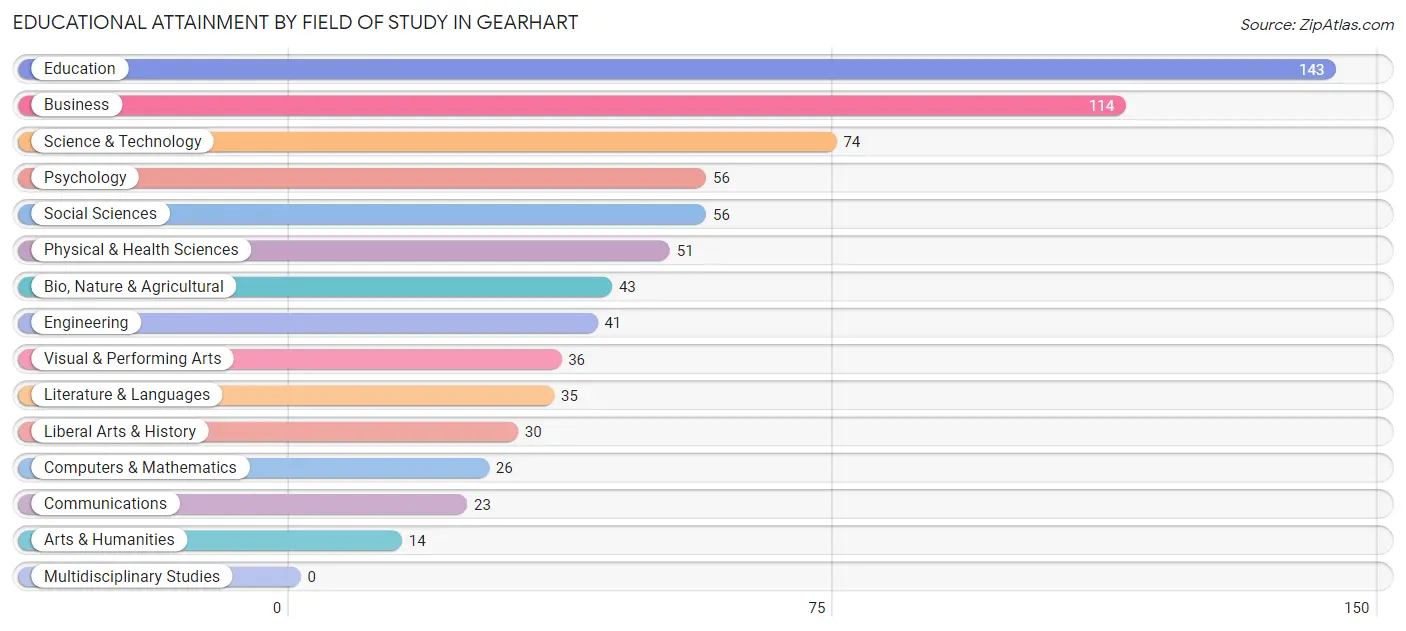
| Field of Study | # Graduates | % Graduates |
| Computers & Mathematics | 26 | 3.5% |
| Bio, Nature & Agricultural | 43 | 5.8% |
| Physical & Health Sciences | 51 | 6.9% |
| Psychology | 56 | 7.5% |
| Social Sciences | 56 | 7.5% |
| Engineering | 41 | 5.5% |
| Multidisciplinary Studies | 0 | 0.0% |
| Science & Technology | 74 | 10.0% |
| Business | 114 | 15.4% |
| Education | 143 | 19.3% |
| Literature & Languages | 35 | 4.7% |
| Liberal Arts & History | 30 | 4.0% |
| Visual & Performing Arts | 36 | 4.9% |
| Communications | 23 | 3.1% |
| Arts & Humanities | 14 | 1.9% |
| Total | 742 | 100.0% |
Transportation & Commute in Gearhart
Vehicle Availability by Sex in Gearhart
The most prevalent vehicle ownership categories in Gearhart are males with 2 vehicles (199, accounting for 39.7%) and females with 2 vehicles (170, making up 48.8%).
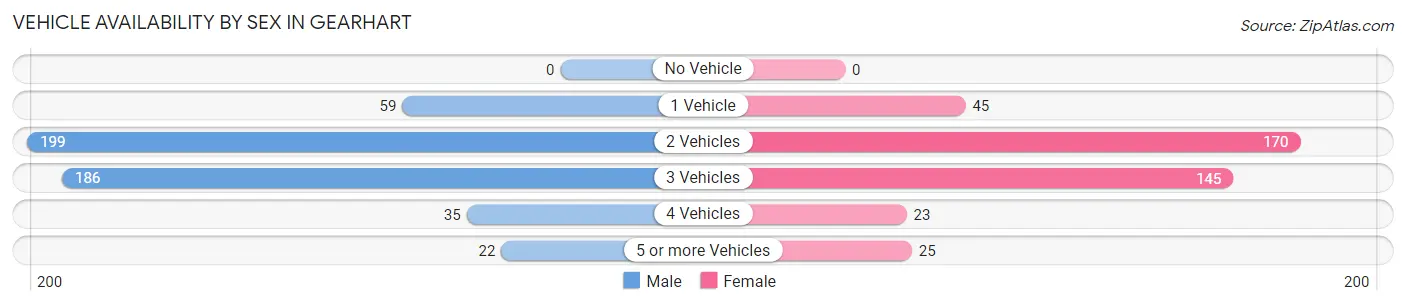
| Vehicles Available | Male | Female |
| No Vehicle | 0 (0.0%) | 0 (0.0%) |
| 1 Vehicle | 59 (11.8%) | 45 (11.0%) |
| 2 Vehicles | 199 (39.7%) | 170 (41.7%) |
| 3 Vehicles | 186 (37.1%) | 145 (35.5%) |
| 4 Vehicles | 35 (7.0%) | 23 (5.6%) |
| 5 or more Vehicles | 22 (4.4%) | 25 (6.1%) |
| Total | 501 (100.0%) | 408 (100.0%) |
Commute Time in Gearhart
The most frequently occuring commute durations in Gearhart are 5 to 9 minutes (228 commuters, 30.8%), 15 to 19 minutes (152 commuters, 20.6%), and 10 to 14 minutes (107 commuters, 14.5%).
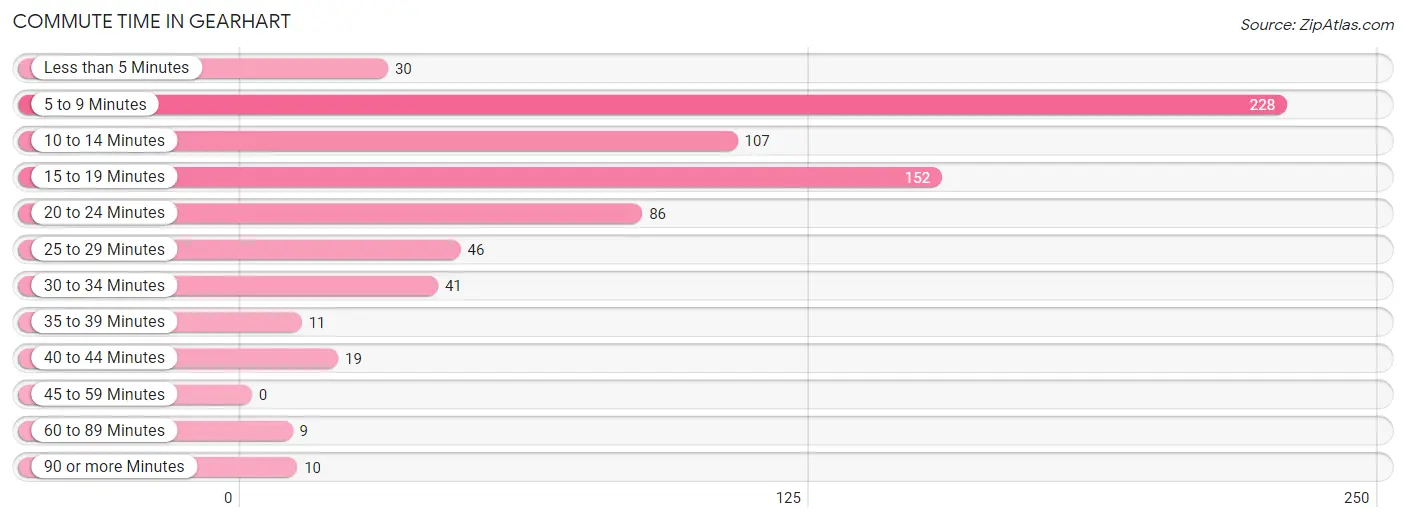
| Commute Time | # Commuters | % Commuters |
| Less than 5 Minutes | 30 | 4.1% |
| 5 to 9 Minutes | 228 | 30.8% |
| 10 to 14 Minutes | 107 | 14.5% |
| 15 to 19 Minutes | 152 | 20.6% |
| 20 to 24 Minutes | 86 | 11.6% |
| 25 to 29 Minutes | 46 | 6.2% |
| 30 to 34 Minutes | 41 | 5.6% |
| 35 to 39 Minutes | 11 | 1.5% |
| 40 to 44 Minutes | 19 | 2.6% |
| 45 to 59 Minutes | 0 | 0.0% |
| 60 to 89 Minutes | 9 | 1.2% |
| 90 or more Minutes | 10 | 1.3% |
Commute Time by Sex in Gearhart
The most common commute times in Gearhart are 5 to 9 minutes (114 commuters, 26.6%) for males and 5 to 9 minutes (114 commuters, 36.7%) for females.
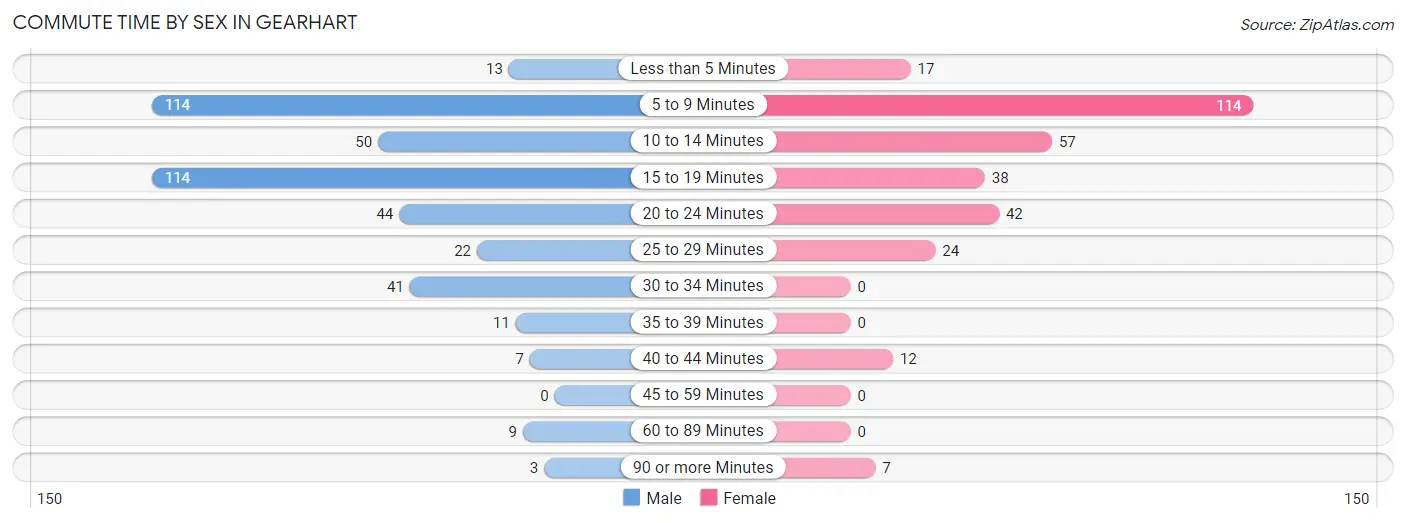
| Commute Time | Male | Female |
| Less than 5 Minutes | 13 (3.0%) | 17 (5.5%) |
| 5 to 9 Minutes | 114 (26.6%) | 114 (36.7%) |
| 10 to 14 Minutes | 50 (11.7%) | 57 (18.3%) |
| 15 to 19 Minutes | 114 (26.6%) | 38 (12.2%) |
| 20 to 24 Minutes | 44 (10.3%) | 42 (13.5%) |
| 25 to 29 Minutes | 22 (5.1%) | 24 (7.7%) |
| 30 to 34 Minutes | 41 (9.6%) | 0 (0.0%) |
| 35 to 39 Minutes | 11 (2.6%) | 0 (0.0%) |
| 40 to 44 Minutes | 7 (1.6%) | 12 (3.9%) |
| 45 to 59 Minutes | 0 (0.0%) | 0 (0.0%) |
| 60 to 89 Minutes | 9 (2.1%) | 0 (0.0%) |
| 90 or more Minutes | 3 (0.7%) | 7 (2.2%) |
Time of Departure to Work by Sex in Gearhart
The most frequent times of departure to work in Gearhart are 8:00 AM to 8:29 AM (90, 21.0%) for males and 7:00 AM to 7:29 AM (73, 23.5%) for females.
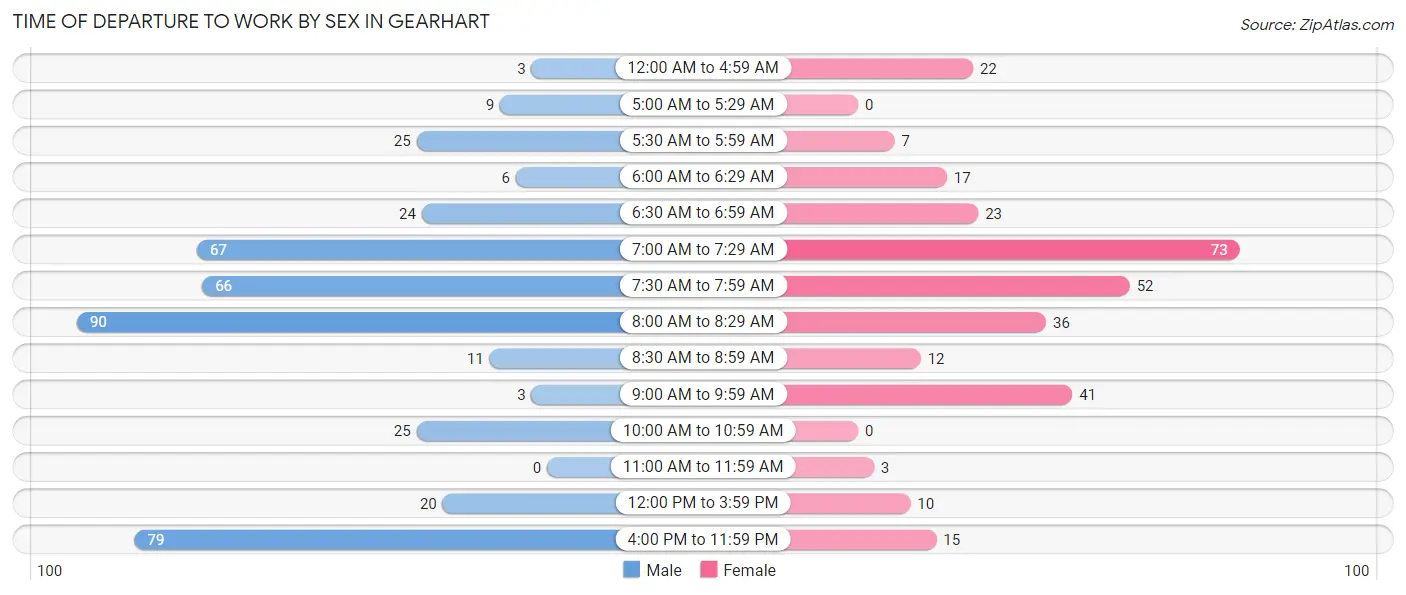
| Time of Departure | Male | Female |
| 12:00 AM to 4:59 AM | 3 (0.7%) | 22 (7.1%) |
| 5:00 AM to 5:29 AM | 9 (2.1%) | 0 (0.0%) |
| 5:30 AM to 5:59 AM | 25 (5.8%) | 7 (2.2%) |
| 6:00 AM to 6:29 AM | 6 (1.4%) | 17 (5.5%) |
| 6:30 AM to 6:59 AM | 24 (5.6%) | 23 (7.4%) |
| 7:00 AM to 7:29 AM | 67 (15.7%) | 73 (23.5%) |
| 7:30 AM to 7:59 AM | 66 (15.4%) | 52 (16.7%) |
| 8:00 AM to 8:29 AM | 90 (21.0%) | 36 (11.6%) |
| 8:30 AM to 8:59 AM | 11 (2.6%) | 12 (3.9%) |
| 9:00 AM to 9:59 AM | 3 (0.7%) | 41 (13.2%) |
| 10:00 AM to 10:59 AM | 25 (5.8%) | 0 (0.0%) |
| 11:00 AM to 11:59 AM | 0 (0.0%) | 3 (1.0%) |
| 12:00 PM to 3:59 PM | 20 (4.7%) | 10 (3.2%) |
| 4:00 PM to 11:59 PM | 79 (18.5%) | 15 (4.8%) |
| Total | 428 (100.0%) | 311 (100.0%) |
Housing Occupancy in Gearhart
Occupancy by Ownership in Gearhart
Of the total 798 dwellings in Gearhart, owner-occupied units account for 686 (86.0%), while renter-occupied units make up 112 (14.0%).
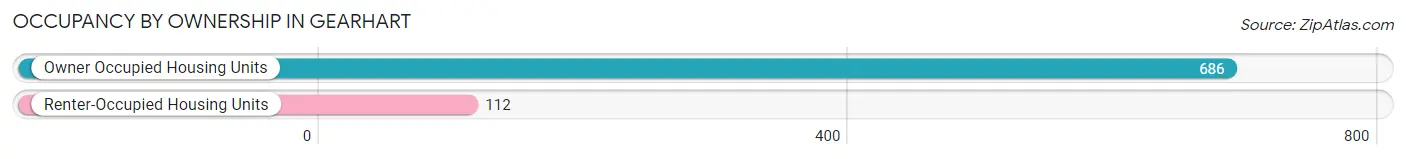
| Occupancy | # Housing Units | % Housing Units |
| Owner Occupied Housing Units | 686 | 86.0% |
| Renter-Occupied Housing Units | 112 | 14.0% |
| Total Occupied Housing Units | 798 | 100.0% |
Occupancy by Household Size in Gearhart
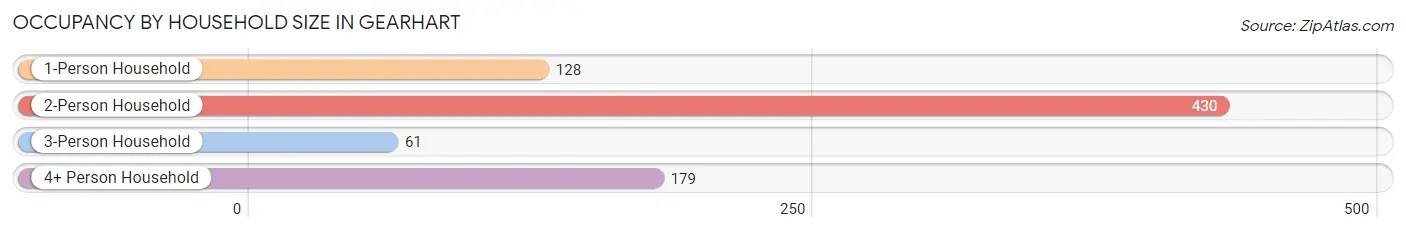
| Household Size | # Housing Units | % Housing Units |
| 1-Person Household | 128 | 16.0% |
| 2-Person Household | 430 | 53.9% |
| 3-Person Household | 61 | 7.6% |
| 4+ Person Household | 179 | 22.4% |
| Total Housing Units | 798 | 100.0% |
Occupancy by Ownership by Household Size in Gearhart
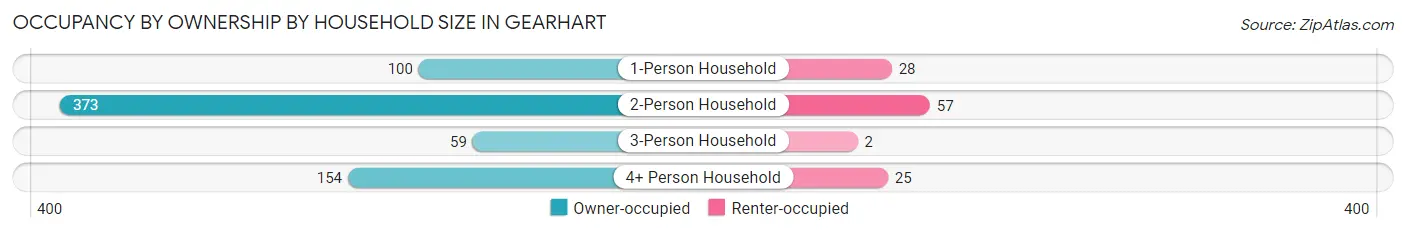
| Household Size | Owner-occupied | Renter-occupied |
| 1-Person Household | 100 (78.1%) | 28 (21.9%) |
| 2-Person Household | 373 (86.7%) | 57 (13.3%) |
| 3-Person Household | 59 (96.7%) | 2 (3.3%) |
| 4+ Person Household | 154 (86.0%) | 25 (14.0%) |
| Total Housing Units | 686 (86.0%) | 112 (14.0%) |
Occupancy by Educational Attainment in Gearhart
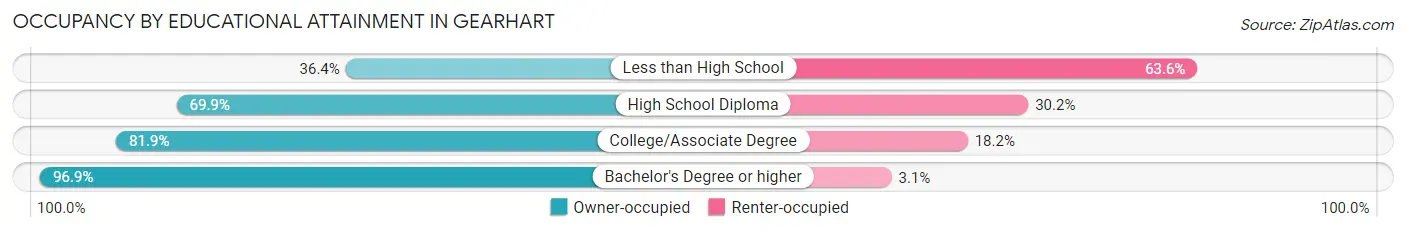
| Household Size | Owner-occupied | Renter-occupied |
| Less than High School | 4 (36.4%) | 7 (63.6%) |
| High School Diploma | 95 (69.9%) | 41 (30.1%) |
| College/Associate Degree | 239 (81.9%) | 53 (18.1%) |
| Bachelor's Degree or higher | 348 (96.9%) | 11 (3.1%) |
Occupancy by Age of Householder in Gearhart
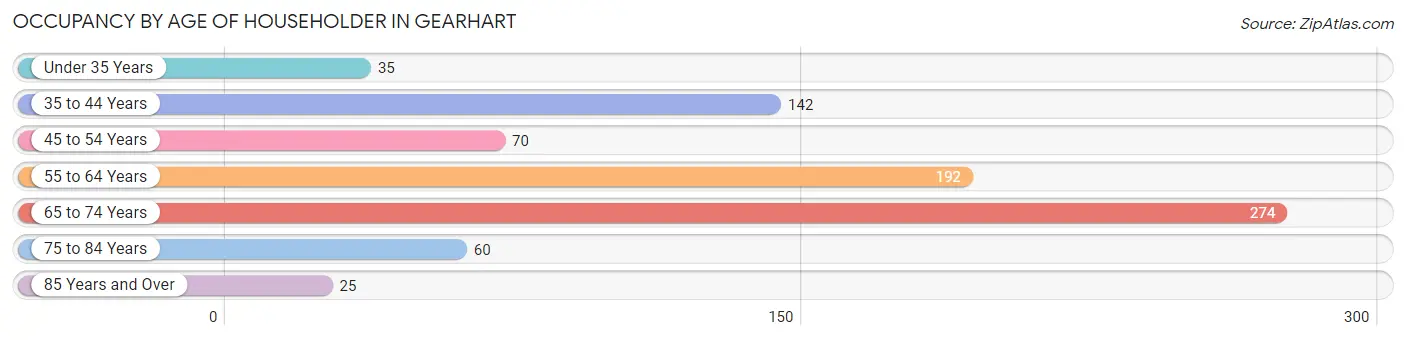
| Age Bracket | # Households | % Households |
| Under 35 Years | 35 | 4.4% |
| 35 to 44 Years | 142 | 17.8% |
| 45 to 54 Years | 70 | 8.8% |
| 55 to 64 Years | 192 | 24.1% |
| 65 to 74 Years | 274 | 34.3% |
| 75 to 84 Years | 60 | 7.5% |
| 85 Years and Over | 25 | 3.1% |
| Total | 798 | 100.0% |
Housing Finances in Gearhart
Median Income by Occupancy in Gearhart
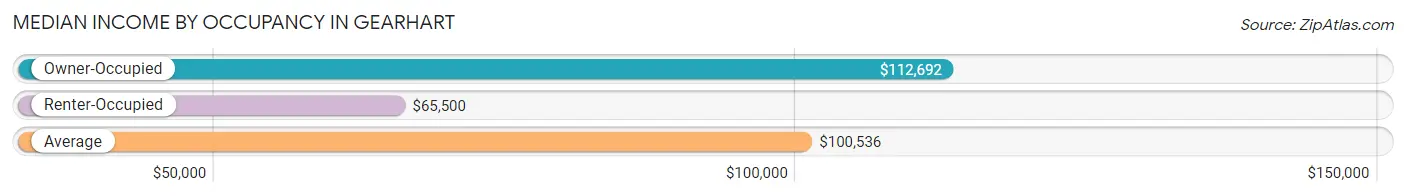
| Occupancy Type | # Households | Median Income |
| Owner-Occupied | 686 (86.0%) | $112,692 |
| Renter-Occupied | 112 (14.0%) | $65,500 |
| Average | 798 (100.0%) | $100,536 |
Occupancy by Householder Income Bracket in Gearhart
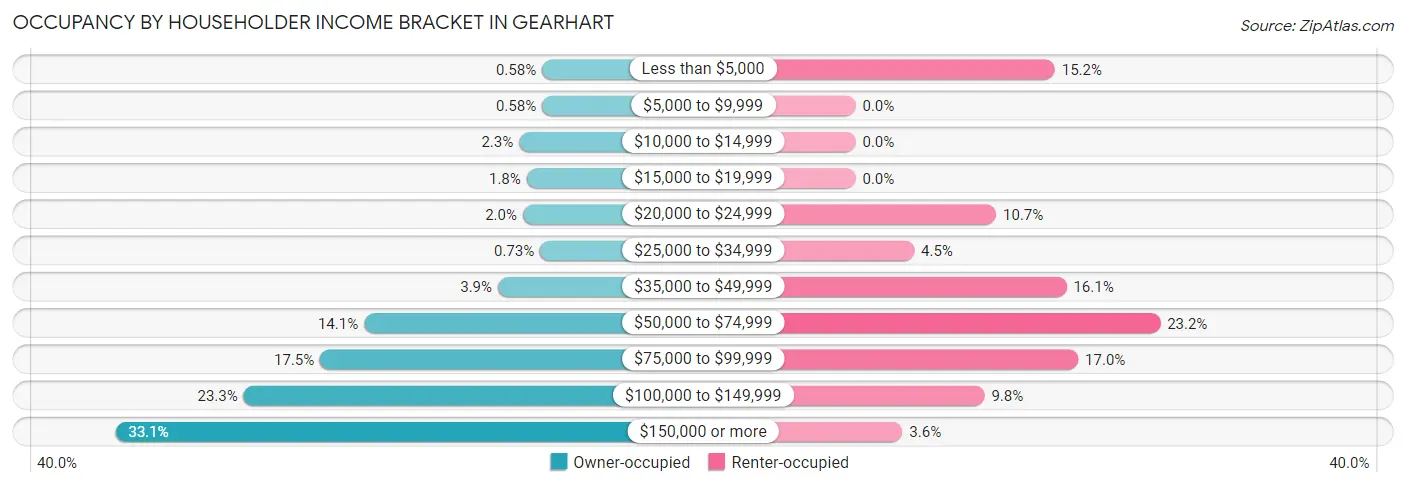
| Income Bracket | Owner-occupied | Renter-occupied |
| Less than $5,000 | 4 (0.6%) | 17 (15.2%) |
| $5,000 to $9,999 | 4 (0.6%) | 0 (0.0%) |
| $10,000 to $14,999 | 16 (2.3%) | 0 (0.0%) |
| $15,000 to $19,999 | 12 (1.8%) | 0 (0.0%) |
| $20,000 to $24,999 | 14 (2.0%) | 12 (10.7%) |
| $25,000 to $34,999 | 5 (0.7%) | 5 (4.5%) |
| $35,000 to $49,999 | 27 (3.9%) | 18 (16.1%) |
| $50,000 to $74,999 | 97 (14.1%) | 26 (23.2%) |
| $75,000 to $99,999 | 120 (17.5%) | 19 (17.0%) |
| $100,000 to $149,999 | 160 (23.3%) | 11 (9.8%) |
| $150,000 or more | 227 (33.1%) | 4 (3.6%) |
| Total | 686 (100.0%) | 112 (100.0%) |
Monthly Housing Cost Tiers in Gearhart
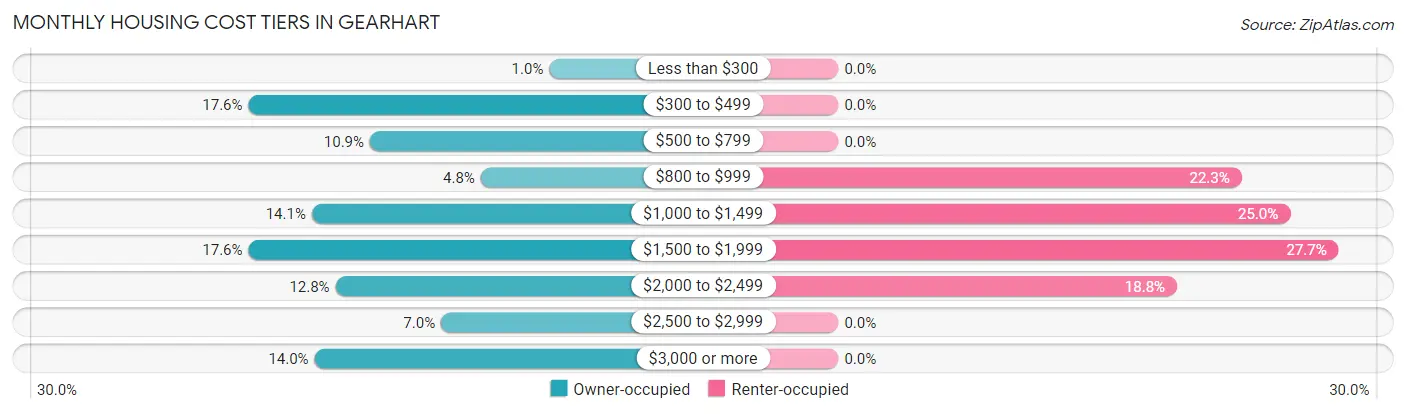
| Monthly Cost | Owner-occupied | Renter-occupied |
| Less than $300 | 7 (1.0%) | 0 (0.0%) |
| $300 to $499 | 121 (17.6%) | 0 (0.0%) |
| $500 to $799 | 75 (10.9%) | 0 (0.0%) |
| $800 to $999 | 33 (4.8%) | 25 (22.3%) |
| $1,000 to $1,499 | 97 (14.1%) | 28 (25.0%) |
| $1,500 to $1,999 | 121 (17.6%) | 31 (27.7%) |
| $2,000 to $2,499 | 88 (12.8%) | 21 (18.8%) |
| $2,500 to $2,999 | 48 (7.0%) | 0 (0.0%) |
| $3,000 or more | 96 (14.0%) | 0 (0.0%) |
| Total | 686 (100.0%) | 112 (100.0%) |
Physical Housing Characteristics in Gearhart
Housing Structures in Gearhart
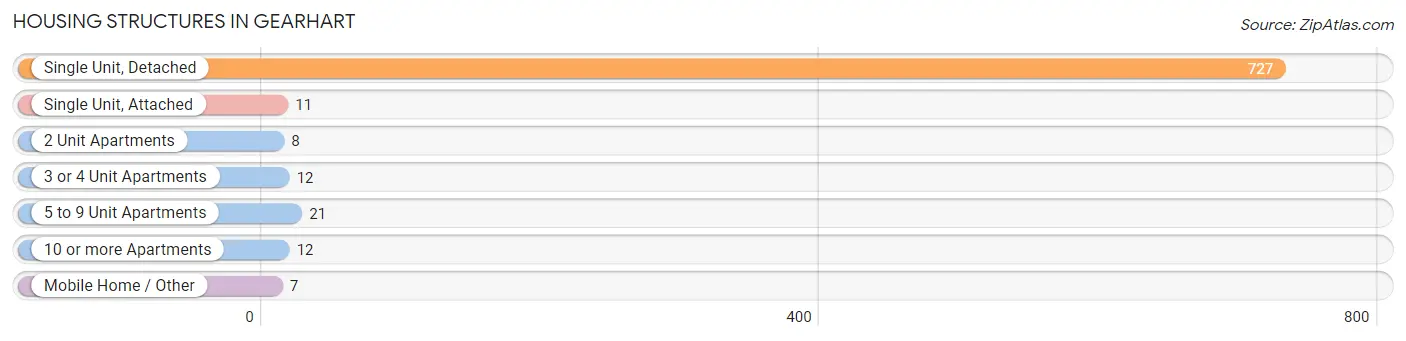
| Structure Type | # Housing Units | % Housing Units |
| Single Unit, Detached | 727 | 91.1% |
| Single Unit, Attached | 11 | 1.4% |
| 2 Unit Apartments | 8 | 1.0% |
| 3 or 4 Unit Apartments | 12 | 1.5% |
| 5 to 9 Unit Apartments | 21 | 2.6% |
| 10 or more Apartments | 12 | 1.5% |
| Mobile Home / Other | 7 | 0.9% |
| Total | 798 | 100.0% |
Housing Structures by Occupancy in Gearhart
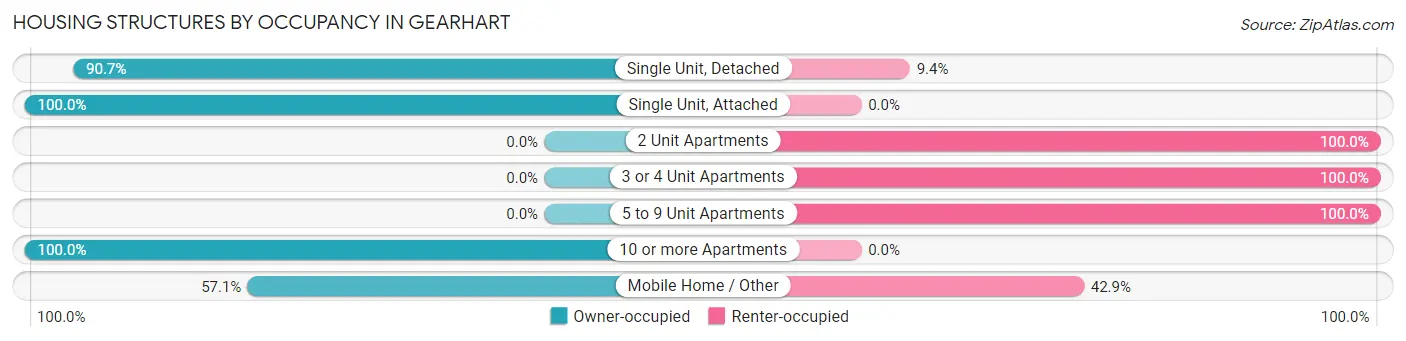
| Structure Type | Owner-occupied | Renter-occupied |
| Single Unit, Detached | 659 (90.6%) | 68 (9.3%) |
| Single Unit, Attached | 11 (100.0%) | 0 (0.0%) |
| 2 Unit Apartments | 0 (0.0%) | 8 (100.0%) |
| 3 or 4 Unit Apartments | 0 (0.0%) | 12 (100.0%) |
| 5 to 9 Unit Apartments | 0 (0.0%) | 21 (100.0%) |
| 10 or more Apartments | 12 (100.0%) | 0 (0.0%) |
| Mobile Home / Other | 4 (57.1%) | 3 (42.9%) |
| Total | 686 (86.0%) | 112 (14.0%) |
Housing Structures by Number of Rooms in Gearhart
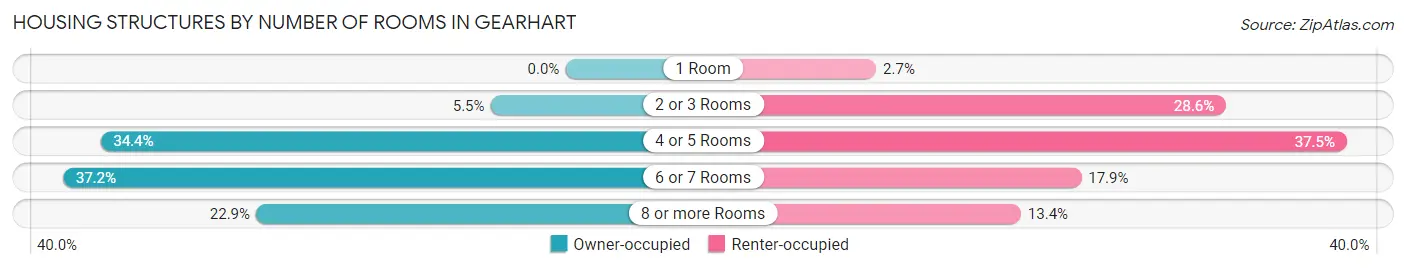
| Number of Rooms | Owner-occupied | Renter-occupied |
| 1 Room | 0 (0.0%) | 3 (2.7%) |
| 2 or 3 Rooms | 38 (5.5%) | 32 (28.6%) |
| 4 or 5 Rooms | 236 (34.4%) | 42 (37.5%) |
| 6 or 7 Rooms | 255 (37.2%) | 20 (17.9%) |
| 8 or more Rooms | 157 (22.9%) | 15 (13.4%) |
| Total | 686 (100.0%) | 112 (100.0%) |
Housing Structure by Heating Type in Gearhart
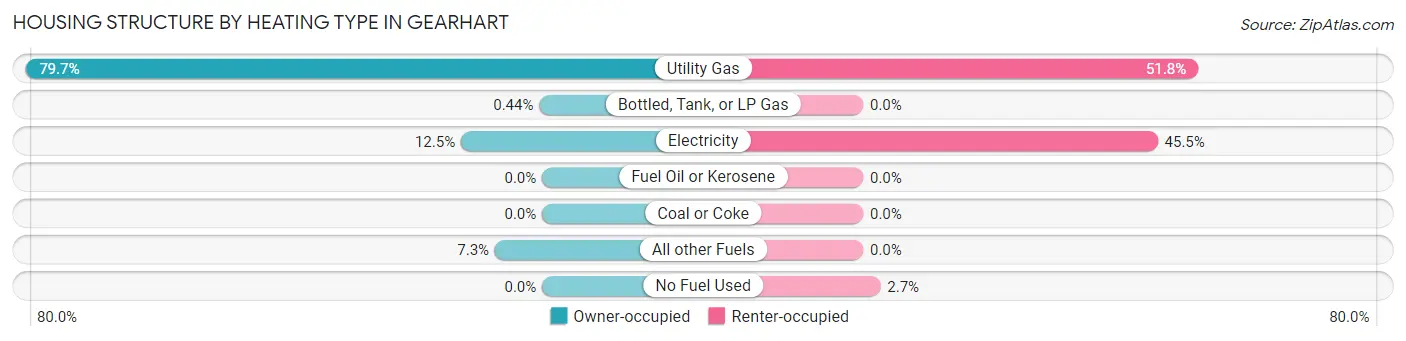
| Heating Type | Owner-occupied | Renter-occupied |
| Utility Gas | 547 (79.7%) | 58 (51.8%) |
| Bottled, Tank, or LP Gas | 3 (0.4%) | 0 (0.0%) |
| Electricity | 86 (12.5%) | 51 (45.5%) |
| Fuel Oil or Kerosene | 0 (0.0%) | 0 (0.0%) |
| Coal or Coke | 0 (0.0%) | 0 (0.0%) |
| All other Fuels | 50 (7.3%) | 0 (0.0%) |
| No Fuel Used | 0 (0.0%) | 3 (2.7%) |
| Total | 686 (100.0%) | 112 (100.0%) |
Household Vehicle Usage in Gearhart
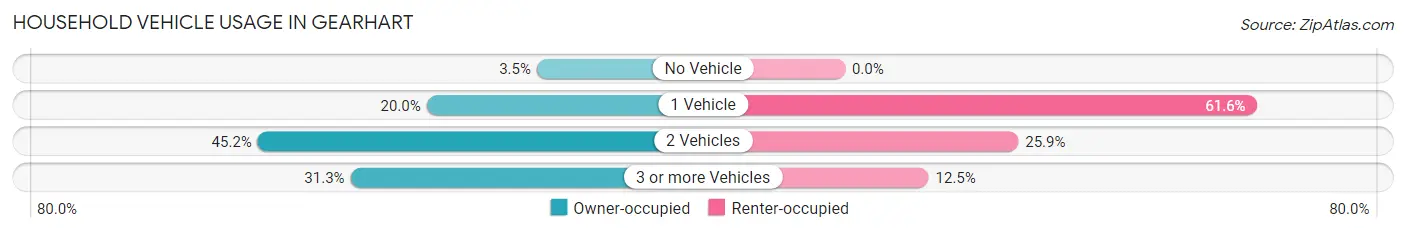
| Vehicles per Household | Owner-occupied | Renter-occupied |
| No Vehicle | 24 (3.5%) | 0 (0.0%) |
| 1 Vehicle | 137 (20.0%) | 69 (61.6%) |
| 2 Vehicles | 310 (45.2%) | 29 (25.9%) |
| 3 or more Vehicles | 215 (31.3%) | 14 (12.5%) |
| Total | 686 (100.0%) | 112 (100.0%) |
Real Estate & Mortgages in Gearhart
Real Estate and Mortgage Overview in Gearhart
| Characteristic | Without Mortgage | With Mortgage |
| Housing Units | 273 | 413 |
| Median Property Value | $476,700 | $542,100 |
| Median Household Income | $83,906 | $188 |
| Monthly Housing Costs | $525 | $96 |
| Real Estate Taxes | $3,208 | $0 |
Property Value by Mortgage Status in Gearhart
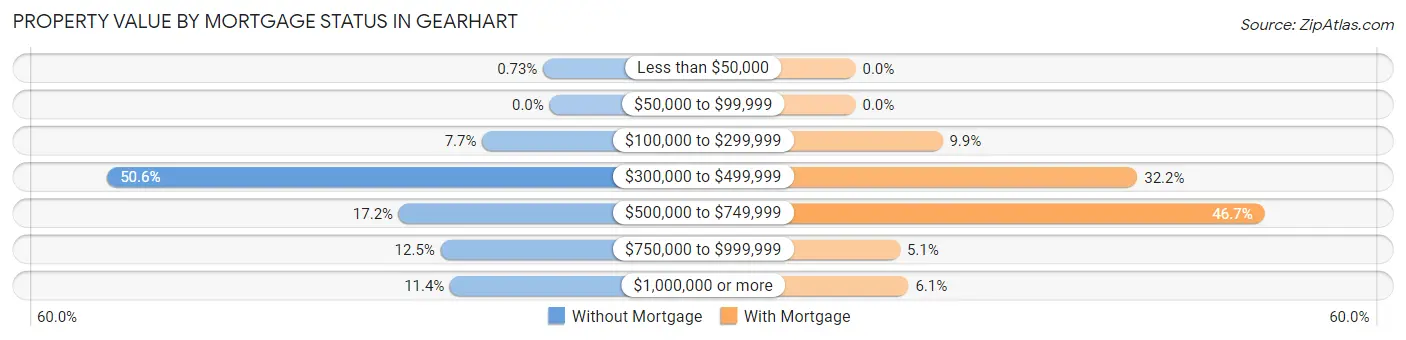
| Property Value | Without Mortgage | With Mortgage |
| Less than $50,000 | 2 (0.7%) | 0 (0.0%) |
| $50,000 to $99,999 | 0 (0.0%) | 0 (0.0%) |
| $100,000 to $299,999 | 21 (7.7%) | 41 (9.9%) |
| $300,000 to $499,999 | 138 (50.5%) | 133 (32.2%) |
| $500,000 to $749,999 | 47 (17.2%) | 193 (46.7%) |
| $750,000 to $999,999 | 34 (12.4%) | 21 (5.1%) |
| $1,000,000 or more | 31 (11.4%) | 25 (6.0%) |
| Total | 273 (100.0%) | 413 (100.0%) |
Household Income by Mortgage Status in Gearhart
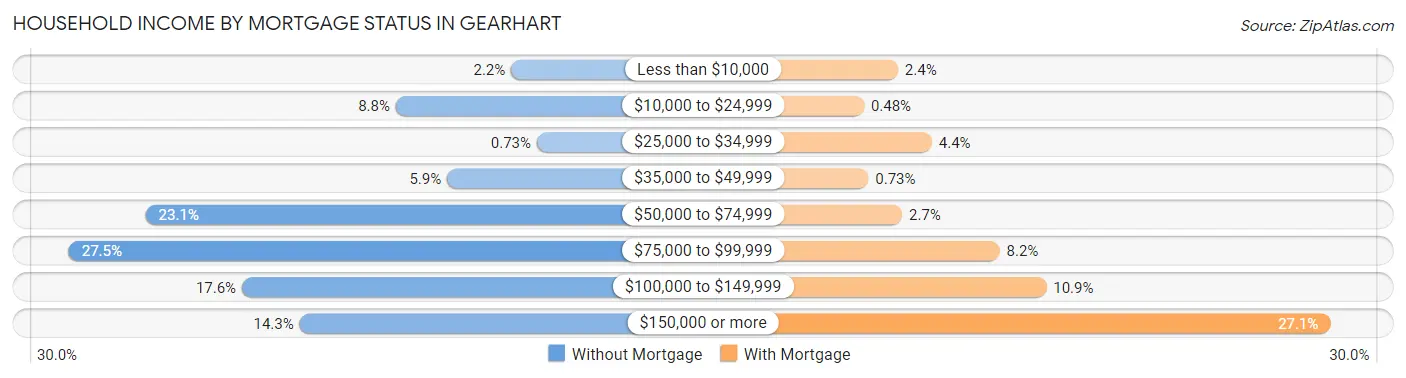
| Household Income | Without Mortgage | With Mortgage |
| Less than $10,000 | 6 (2.2%) | 10 (2.4%) |
| $10,000 to $24,999 | 24 (8.8%) | 2 (0.5%) |
| $25,000 to $34,999 | 2 (0.7%) | 18 (4.4%) |
| $35,000 to $49,999 | 16 (5.9%) | 3 (0.7%) |
| $50,000 to $74,999 | 63 (23.1%) | 11 (2.7%) |
| $75,000 to $99,999 | 75 (27.5%) | 34 (8.2%) |
| $100,000 to $149,999 | 48 (17.6%) | 45 (10.9%) |
| $150,000 or more | 39 (14.3%) | 112 (27.1%) |
| Total | 273 (100.0%) | 413 (100.0%) |
Property Value to Household Income Ratio in Gearhart
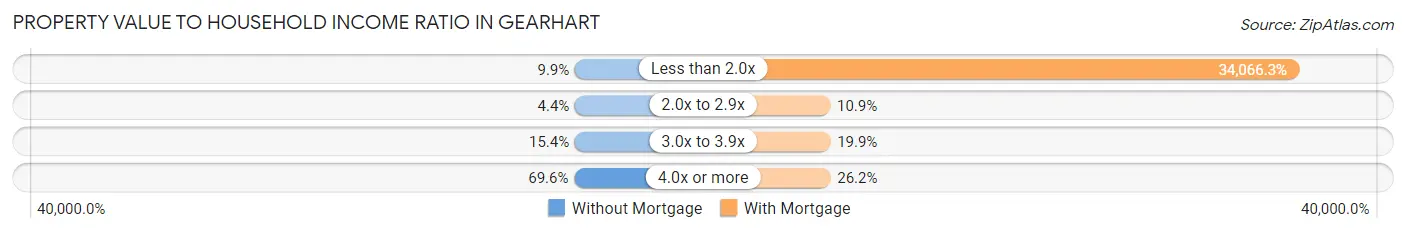
| Value-to-Income Ratio | Without Mortgage | With Mortgage |
| Less than 2.0x | 27 (9.9%) | 140,694 (34,066.3%) |
| 2.0x to 2.9x | 12 (4.4%) | 45 (10.9%) |
| 3.0x to 3.9x | 42 (15.4%) | 82 (19.9%) |
| 4.0x or more | 190 (69.6%) | 108 (26.2%) |
| Total | 273 (100.0%) | 413 (100.0%) |
Real Estate Taxes by Mortgage Status in Gearhart
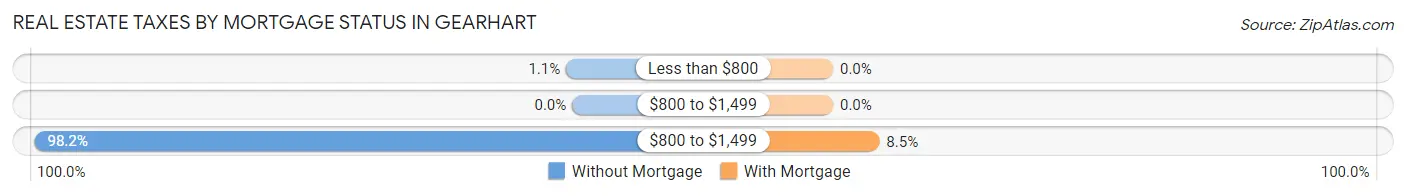
| Property Taxes | Without Mortgage | With Mortgage |
| Less than $800 | 3 (1.1%) | 0 (0.0%) |
| $800 to $1,499 | 0 (0.0%) | 0 (0.0%) |
| $800 to $1,499 | 268 (98.2%) | 35 (8.5%) |
| Total | 273 (100.0%) | 413 (100.0%) |
Health & Disability in Gearhart
Health Insurance Coverage by Age in Gearhart
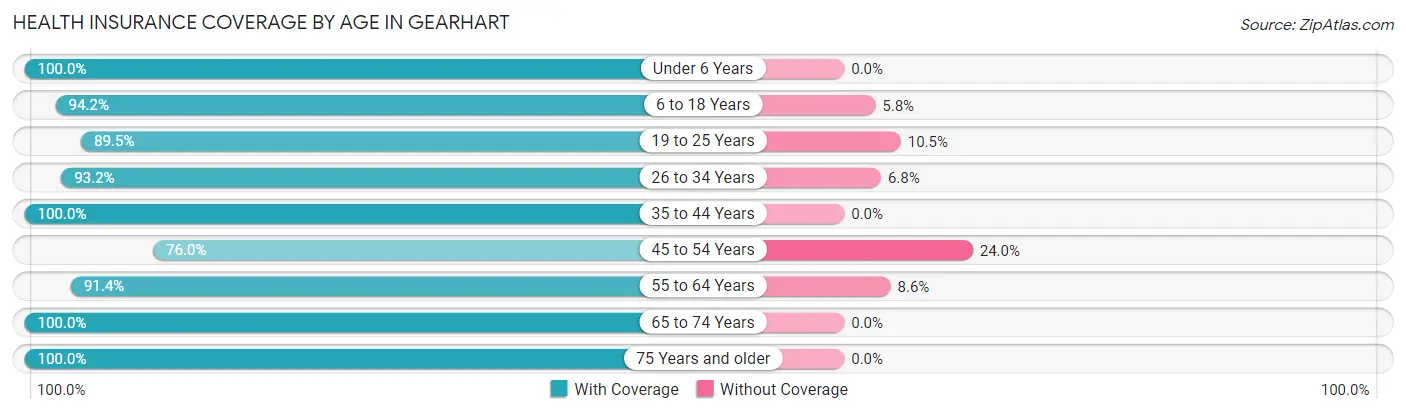
| Age Bracket | With Coverage | Without Coverage |
| Under 6 Years | 202 (100.0%) | 0 (0.0%) |
| 6 to 18 Years | 244 (94.2%) | 15 (5.8%) |
| 19 to 25 Years | 85 (89.5%) | 10 (10.5%) |
| 26 to 34 Years | 109 (93.2%) | 8 (6.8%) |
| 35 to 44 Years | 251 (100.0%) | 0 (0.0%) |
| 45 to 54 Years | 146 (76.0%) | 46 (24.0%) |
| 55 to 64 Years | 275 (91.4%) | 26 (8.6%) |
| 65 to 74 Years | 499 (100.0%) | 0 (0.0%) |
| 75 Years and older | 140 (100.0%) | 0 (0.0%) |
| Total | 1,951 (94.9%) | 105 (5.1%) |
Health Insurance Coverage by Citizenship Status in Gearhart
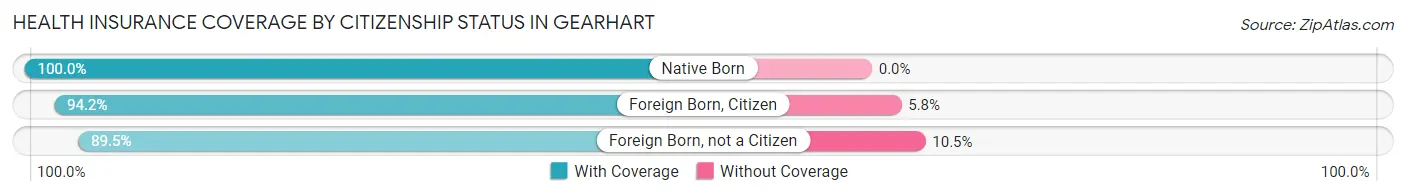
| Citizenship Status | With Coverage | Without Coverage |
| Native Born | 202 (100.0%) | 0 (0.0%) |
| Foreign Born, Citizen | 244 (94.2%) | 15 (5.8%) |
| Foreign Born, not a Citizen | 85 (89.5%) | 10 (10.5%) |
Health Insurance Coverage by Household Income in Gearhart
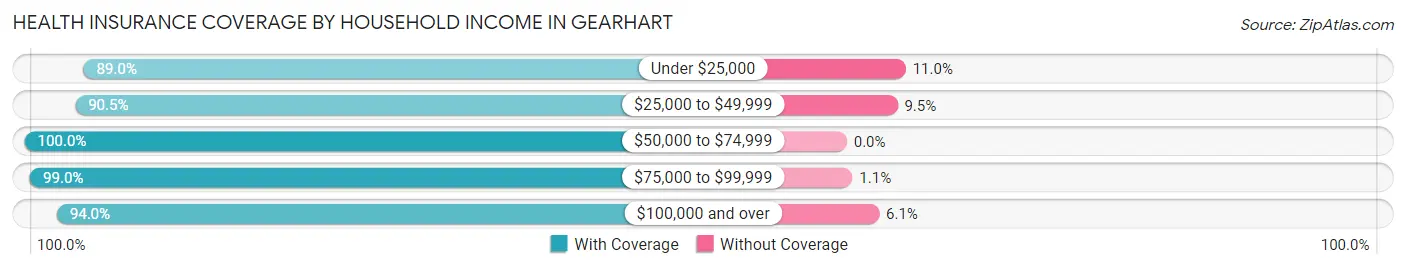
| Household Income | With Coverage | Without Coverage |
| Under $25,000 | 137 (89.0%) | 17 (11.0%) |
| $25,000 to $49,999 | 124 (90.5%) | 13 (9.5%) |
| $50,000 to $74,999 | 288 (100.0%) | 0 (0.0%) |
| $75,000 to $99,999 | 283 (99.0%) | 3 (1.1%) |
| $100,000 and over | 1,119 (94.0%) | 72 (6.0%) |
Public vs Private Health Insurance Coverage by Age in Gearhart
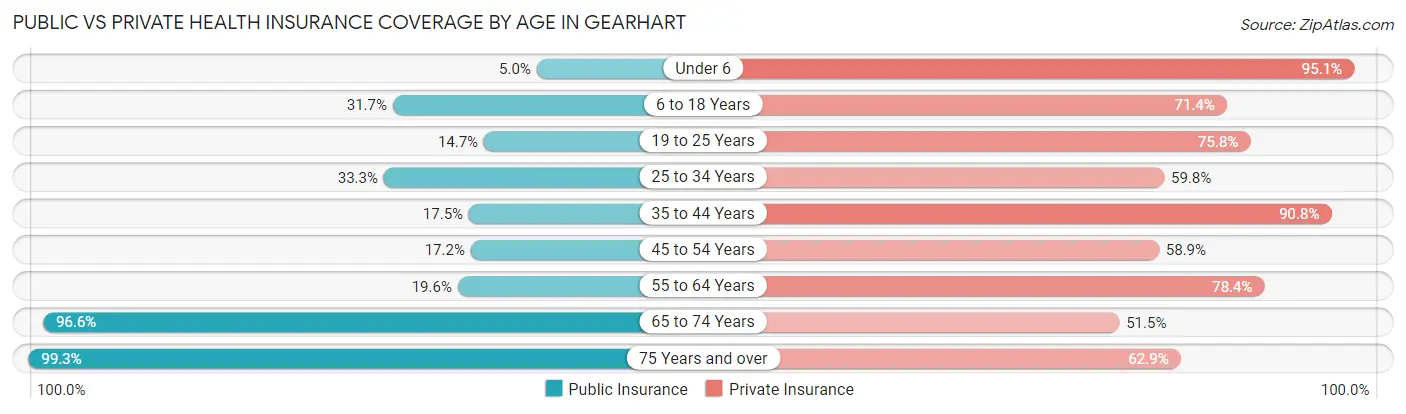
| Age Bracket | Public Insurance | Private Insurance |
| Under 6 | 10 (5.0%) | 192 (95.1%) |
| 6 to 18 Years | 82 (31.7%) | 185 (71.4%) |
| 19 to 25 Years | 14 (14.7%) | 72 (75.8%) |
| 25 to 34 Years | 39 (33.3%) | 70 (59.8%) |
| 35 to 44 Years | 44 (17.5%) | 228 (90.8%) |
| 45 to 54 Years | 33 (17.2%) | 113 (58.9%) |
| 55 to 64 Years | 59 (19.6%) | 236 (78.4%) |
| 65 to 74 Years | 482 (96.6%) | 257 (51.5%) |
| 75 Years and over | 139 (99.3%) | 88 (62.9%) |
| Total | 902 (43.9%) | 1,441 (70.1%) |
Disability Status by Sex by Age in Gearhart
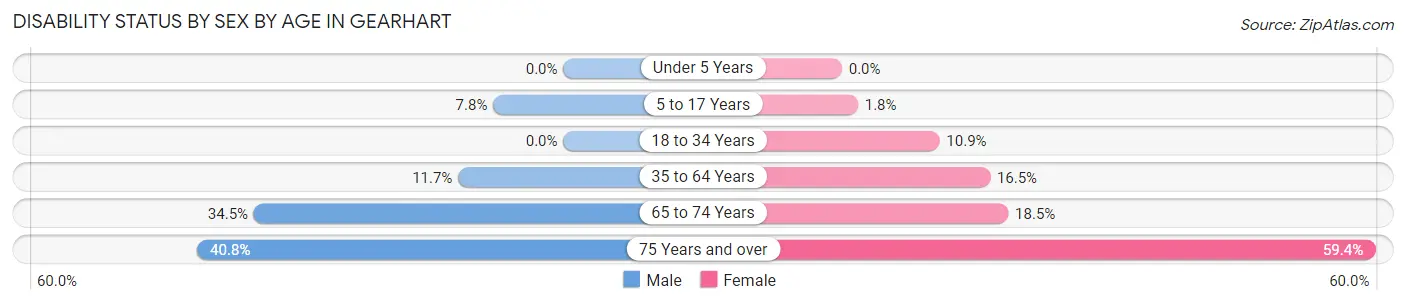
| Age Bracket | Male | Female |
| Under 5 Years | 0 (0.0%) | 0 (0.0%) |
| 5 to 17 Years | 10 (7.8%) | 3 (1.8%) |
| 18 to 34 Years | 0 (0.0%) | 10 (10.9%) |
| 35 to 64 Years | 41 (11.7%) | 65 (16.5%) |
| 65 to 74 Years | 92 (34.5%) | 43 (18.5%) |
| 75 Years and over | 31 (40.8%) | 38 (59.4%) |
Disability Class by Sex by Age in Gearhart
Disability Class: Hearing Difficulty
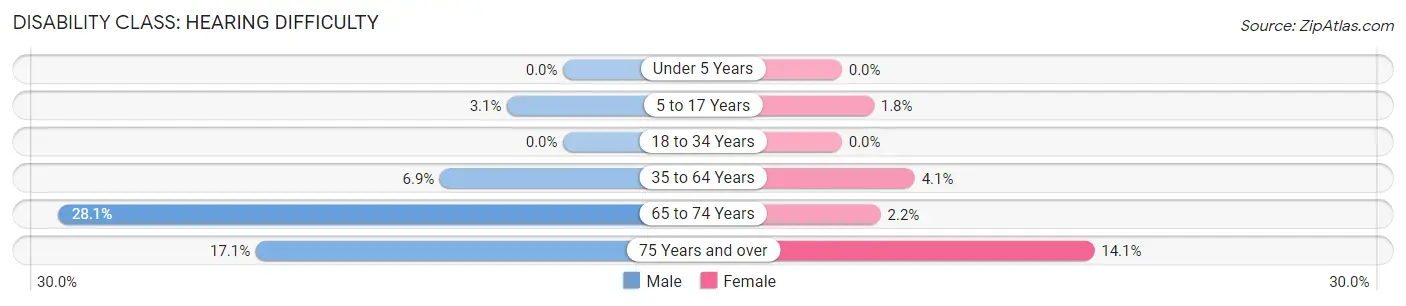
| Age Bracket | Male | Female |
| Under 5 Years | 0 (0.0%) | 0 (0.0%) |
| 5 to 17 Years | 4 (3.1%) | 3 (1.8%) |
| 18 to 34 Years | 0 (0.0%) | 0 (0.0%) |
| 35 to 64 Years | 24 (6.9%) | 16 (4.1%) |
| 65 to 74 Years | 75 (28.1%) | 5 (2.2%) |
| 75 Years and over | 13 (17.1%) | 9 (14.1%) |
Disability Class: Vision Difficulty
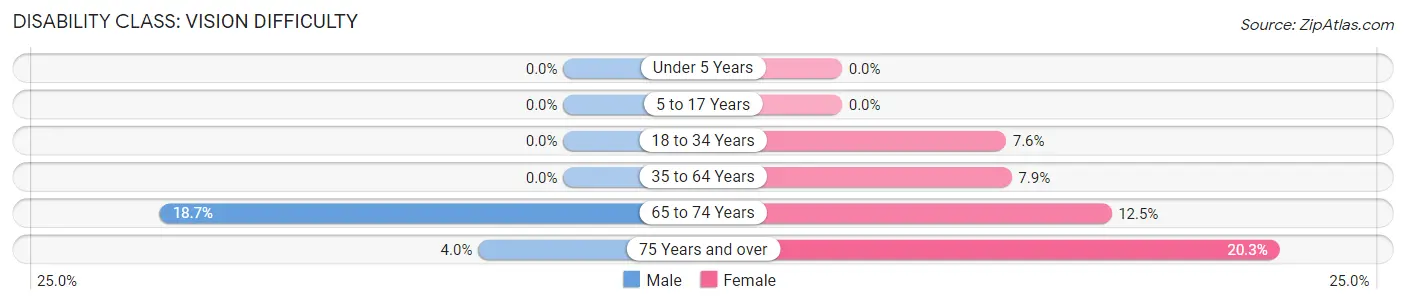
| Age Bracket | Male | Female |
| Under 5 Years | 0 (0.0%) | 0 (0.0%) |
| 5 to 17 Years | 0 (0.0%) | 0 (0.0%) |
| 18 to 34 Years | 0 (0.0%) | 7 (7.6%) |
| 35 to 64 Years | 0 (0.0%) | 31 (7.9%) |
| 65 to 74 Years | 50 (18.7%) | 29 (12.5%) |
| 75 Years and over | 3 (4.0%) | 13 (20.3%) |
Disability Class: Cognitive Difficulty
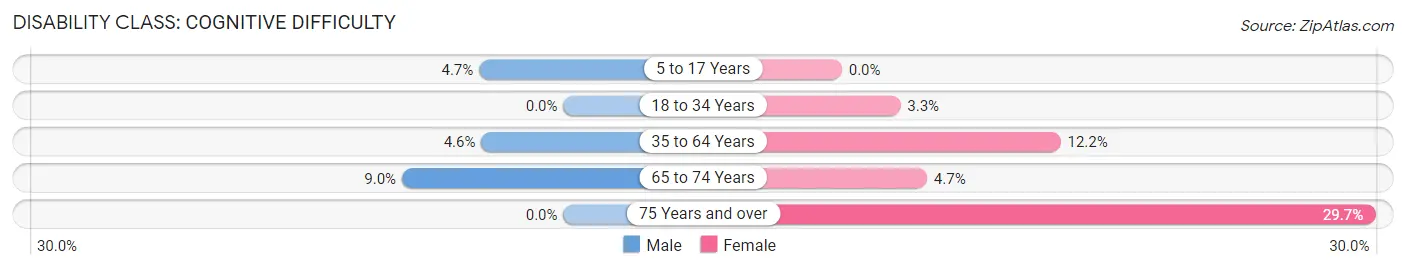
| Age Bracket | Male | Female |
| 5 to 17 Years | 6 (4.7%) | 0 (0.0%) |
| 18 to 34 Years | 0 (0.0%) | 3 (3.3%) |
| 35 to 64 Years | 16 (4.6%) | 48 (12.2%) |
| 65 to 74 Years | 24 (9.0%) | 11 (4.7%) |
| 75 Years and over | 0 (0.0%) | 19 (29.7%) |
Disability Class: Ambulatory Difficulty
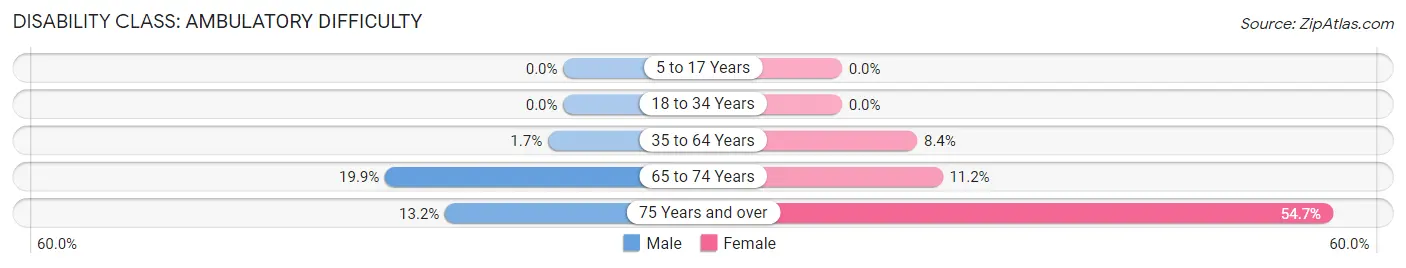
| Age Bracket | Male | Female |
| 5 to 17 Years | 0 (0.0%) | 0 (0.0%) |
| 18 to 34 Years | 0 (0.0%) | 0 (0.0%) |
| 35 to 64 Years | 6 (1.7%) | 33 (8.4%) |
| 65 to 74 Years | 53 (19.9%) | 26 (11.2%) |
| 75 Years and over | 10 (13.2%) | 35 (54.7%) |
Disability Class: Self-Care Difficulty
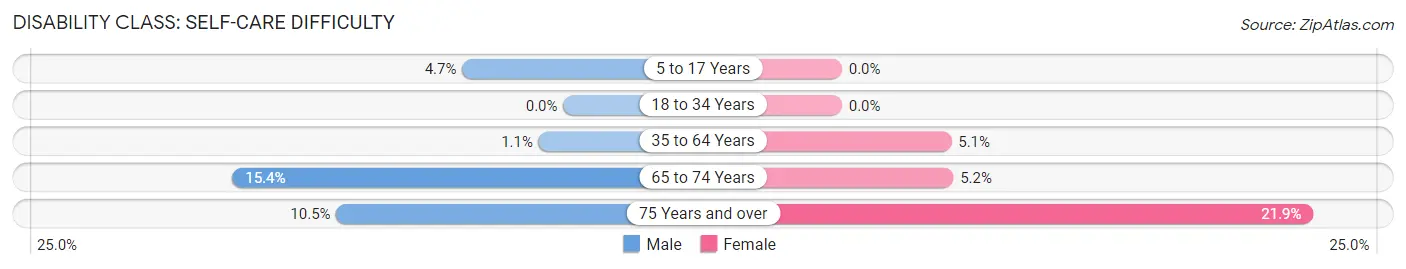
| Age Bracket | Male | Female |
| 5 to 17 Years | 6 (4.7%) | 0 (0.0%) |
| 18 to 34 Years | 0 (0.0%) | 0 (0.0%) |
| 35 to 64 Years | 4 (1.1%) | 20 (5.1%) |
| 65 to 74 Years | 41 (15.4%) | 12 (5.2%) |
| 75 Years and over | 8 (10.5%) | 14 (21.9%) |
Technology Access in Gearhart
Computing Device Access in Gearhart
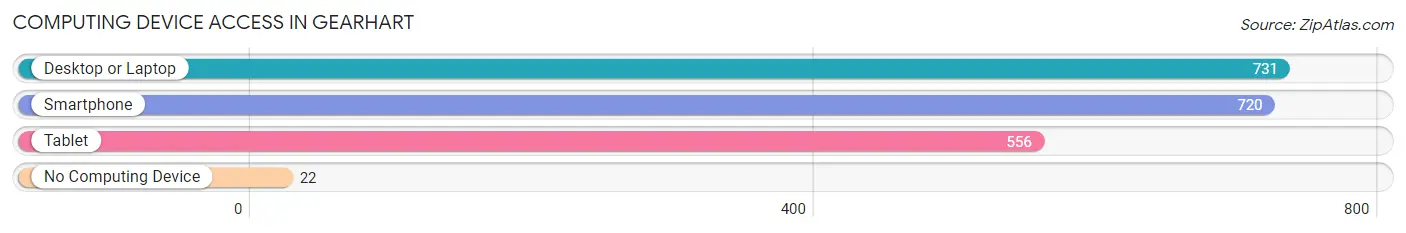
| Device Type | # Households | % Households |
| Desktop or Laptop | 731 | 91.6% |
| Smartphone | 720 | 90.2% |
| Tablet | 556 | 69.7% |
| No Computing Device | 22 | 2.8% |
| Total | 798 | 100.0% |
Internet Access in Gearhart
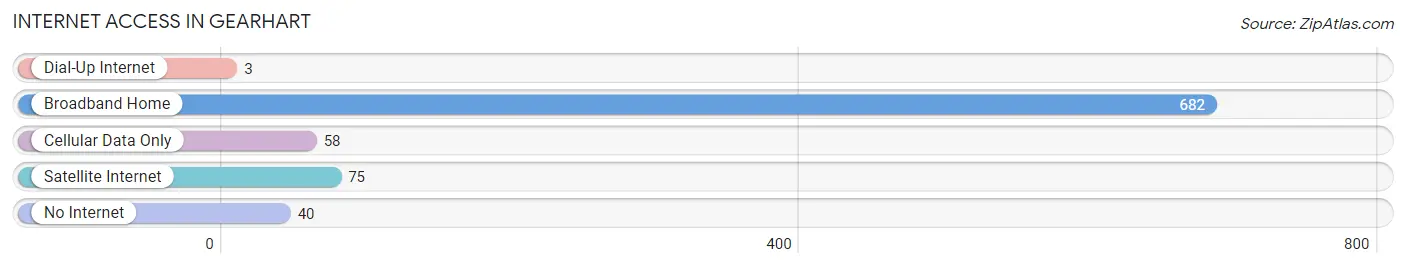
| Internet Type | # Households | % Households |
| Dial-Up Internet | 3 | 0.4% |
| Broadband Home | 682 | 85.5% |
| Cellular Data Only | 58 | 7.3% |
| Satellite Internet | 75 | 9.4% |
| No Internet | 40 | 5.0% |
| Total | 798 | 100.0% |
Gearhart Summary
History
Gearhart, Oregon is a small city located in Clatsop County, Oregon. It is situated on the Pacific Ocean, just north of Seaside and south of Astoria. The city was founded in 1885 by William Gearhart, a German immigrant who had come to the area to work in the lumber industry. Gearhart was originally a small fishing village, but it soon grew into a popular tourist destination.
The city was incorporated in 1911 and has since become a popular summer destination for tourists. Gearhart is known for its beautiful beaches, golf courses, and other recreational activities. The city is also home to the Gearhart Golf Links, which is one of the oldest golf courses in the United States.
Geography
Gearhart is located in Clatsop County, Oregon, on the Pacific Ocean. It is situated just north of Seaside and south of Astoria. The city is bordered by the Necanicum River to the east and the Pacific Ocean to the west. The city has a total area of 2.2 square miles, all of which is land.
The climate in Gearhart is mild and temperate, with warm summers and cool winters. The average temperature in the summer is around 70 degrees Fahrenheit, and the average temperature in the winter is around 40 degrees Fahrenheit.
Economy
The economy of Gearhart is largely based on tourism. The city is a popular summer destination for tourists, and it is home to several golf courses, beaches, and other recreational activities. The city also has a number of restaurants, shops, and other businesses that cater to tourists.
Gearhart is also home to a number of manufacturing and industrial businesses. These businesses include a paper mill, a wood products plant, and a seafood processing plant.
Demographics
As of the 2010 census, the population of Gearhart was 1,462. The racial makeup of the city was 94.3% White, 0.7% African American, 0.7% Native American, 0.7% Asian, 0.2% Pacific Islander, 0.7% from other races, and 2.5% from two or more races. Hispanic or Latino of any race were 2.5% of the population.
The median income for a household in Gearhart was $45,938, and the median income for a family was $50,000. The per capita income for the city was $25,938. About 8.3% of families and 10.2% of the population were below the poverty line, including 14.3% of those under age 18 and 4.2% of those age 65 or over.
Conclusion
Gearhart, Oregon is a small city located in Clatsop County, Oregon. It is situated on the Pacific Ocean, just north of Seaside and south of Astoria. The city was founded in 1885 by William Gearhart, a German immigrant who had come to the area to work in the lumber industry. Gearhart is known for its beautiful beaches, golf courses, and other recreational activities. The economy of Gearhart is largely based on tourism, and the city is home to a number of manufacturing and industrial businesses. As of the 2010 census, the population of Gearhart was 1,462. The median income for a household in Gearhart was $45,938, and the median income for a family was $50,000.
Common Questions
What is the Total Population of Gearhart?
Total Population of Gearhart is 2,060.
What is the Total Male Population of Gearhart?
Total Male Population of Gearhart is 1,008.
What is the Total Female Population of Gearhart?
Total Female Population of Gearhart is 1,052.
What is the Ratio of Males per 100 Females in Gearhart?
There are 95.82 Males per 100 Females in Gearhart.
What is the Ratio of Females per 100 Males in Gearhart?
There are 104.37 Females per 100 Males in Gearhart.
What is the Median Population Age in Gearhart?
Median Population Age in Gearhart is 48.7 Years.
What is the Average Family Size in Gearhart
Average Family Size in Gearhart is 2.9 People.
What is the Average Household Size in Gearhart
Average Household Size in Gearhart is 2.6 People.
What is Per Capita Income in Gearhart?
Per Capita income in Gearhart is $47,979.
What is the Median Family Income in Gearhart?
Median Family Income in Gearhart is $117,566.
What is the Median Household income in Gearhart?
Median Household Income in Gearhart is $100,536.
What is Income or Wage Gap in Gearhart?
Income or Wage Gap in Gearhart is 41.2%.
Women in Gearhart earn 58.8 cents for every dollar earned by a man.
What is Inequality or Gini Index in Gearhart?
Inequality or Gini Index in Gearhart is 0.39.
How Large is the Labor Force in Gearhart?
There are 943 People in the Labor Forcein in Gearhart.
What is the Percentage of People in the Labor Force in Gearhart?
57.3% of People are in the Labor Force in Gearhart.
What is the Unemployment Rate in Gearhart?
Unemployment Rate in Gearhart is 2.6%.