Medina, OH
Medina Map
Medina Overview
26,092
TOTAL POPULATION
12,899
MALE POPULATION
13,193
FEMALE POPULATION
97.77
MALES / 100 FEMALES
102.28
FEMALES / 100 MALES
40.2
MEDIAN AGE
2.9
AVG FAMILY SIZE
2.4
AVG HOUSEHOLD SIZE
$40,253
PER CAPITA INCOME
$98,050
AVG FAMILY INCOME
$74,820
AVG HOUSEHOLD INCOME
33.6%
WAGE / INCOME GAP [ % ]
66.4¢/ $1
WAGE / INCOME GAP [ $ ]
$9,579
FAMILY INCOME DEFICIT
0.44
INEQUALITY / GINI INDEX
14,232
LABOR FORCE [ PEOPLE ]
68.8%
PERCENT IN LABOR FORCE
4.8%
UNEMPLOYMENT RATE
Medina Zip Codes
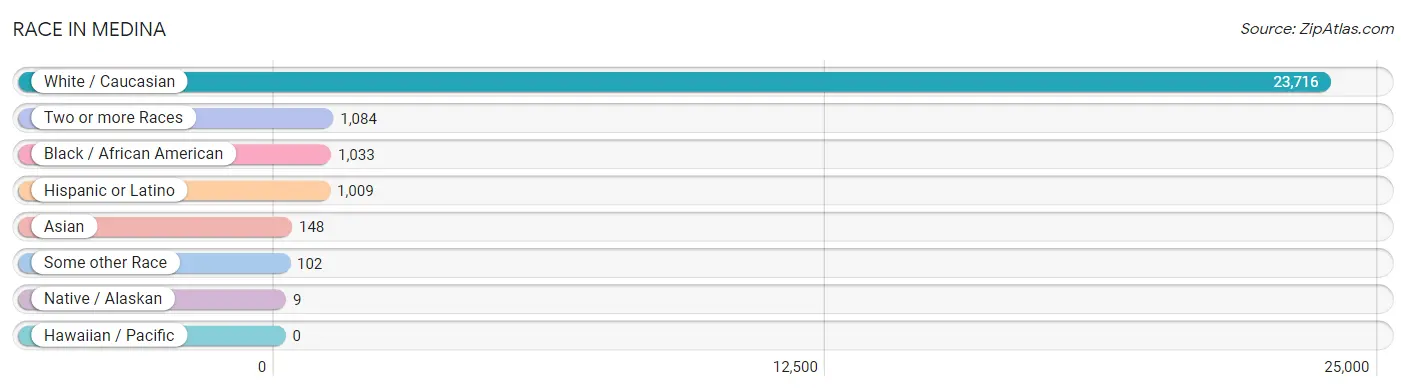
Race in Medina
The most populous races in Medina are White / Caucasian (23,716 | 90.9%), Two or more Races (1,084 | 4.2%), and Black / African American (1,033 | 4.0%).
| Race | # Population | % Population |
| Asian | 148 | 0.6% |
| Black / African American | 1,033 | 4.0% |
| Hawaiian / Pacific | 0 | 0.0% |
| Hispanic or Latino | 1,009 | 3.9% |
| Native / Alaskan | 9 | 0.0% |
| White / Caucasian | 23,716 | 90.9% |
| Two or more Races | 1,084 | 4.2% |
| Some other Race | 102 | 0.4% |
| Total | 26,092 | 100.0% |
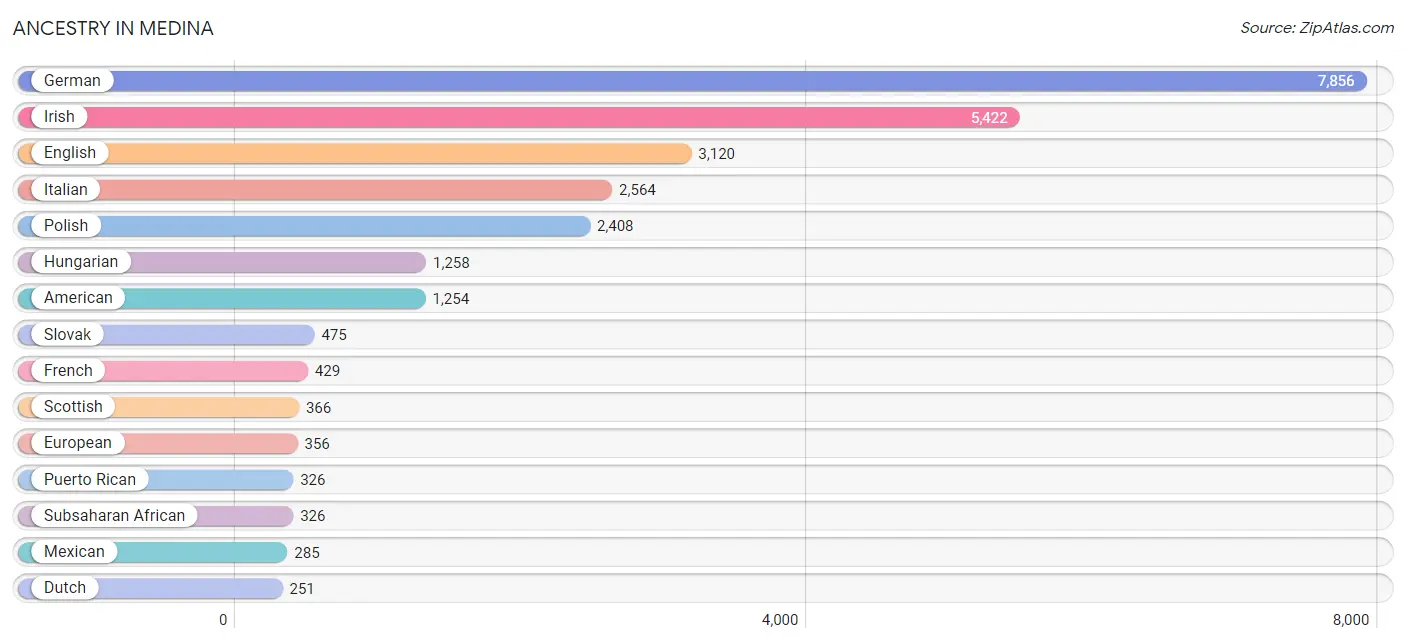
Ancestry in Medina
The most populous ancestries reported in Medina are German (7,856 | 30.1%), Irish (5,422 | 20.8%), English (3,120 | 12.0%), Italian (2,564 | 9.8%), and Polish (2,408 | 9.2%), together accounting for 81.9% of all Medina residents.
| Ancestry | # Population | % Population |
| African | 181 | 0.7% |
| American | 1,254 | 4.8% |
| Arab | 68 | 0.3% |
| Argentinean | 58 | 0.2% |
| Armenian | 39 | 0.2% |
| Australian | 29 | 0.1% |
| Austrian | 29 | 0.1% |
| Bhutanese | 15 | 0.1% |
| British | 69 | 0.3% |
| Bulgarian | 7 | 0.0% |
| Burmese | 27 | 0.1% |
| Canadian | 54 | 0.2% |
| Celtic | 36 | 0.1% |
| Central American | 130 | 0.5% |
| Cherokee | 76 | 0.3% |
| Chippewa | 56 | 0.2% |
| Colombian | 111 | 0.4% |
| Cree | 5 | 0.0% |
| Croatian | 97 | 0.4% |
| Cuban | 16 | 0.1% |
| Czech | 217 | 0.8% |
| Czechoslovakian | 75 | 0.3% |
| Danish | 13 | 0.1% |
| Dutch | 251 | 1.0% |
| Eastern European | 234 | 0.9% |
| Ecuadorian | 14 | 0.1% |
| English | 3,120 | 12.0% |
| Ethiopian | 4 | 0.0% |
| European | 356 | 1.4% |
| Finnish | 15 | 0.1% |
| French | 429 | 1.6% |
| French Canadian | 29 | 0.1% |
| German | 7,856 | 30.1% |
| Greek | 120 | 0.5% |
| Hungarian | 1,258 | 4.8% |
| Indian (Asian) | 14 | 0.1% |
| Irish | 5,422 | 20.8% |
| Italian | 2,564 | 9.8% |
| Korean | 103 | 0.4% |
| Latvian | 18 | 0.1% |
| Lebanese | 66 | 0.3% |
| Lithuanian | 13 | 0.1% |
| Mexican | 285 | 1.1% |
| Nicaraguan | 28 | 0.1% |
| Nigerian | 80 | 0.3% |
| Northern European | 120 | 0.5% |
| Norwegian | 134 | 0.5% |
| Pennsylvania German | 41 | 0.2% |
| Peruvian | 9 | 0.0% |
| Polish | 2,408 | 9.2% |
| Portuguese | 76 | 0.3% |
| Puerto Rican | 326 | 1.3% |
| Romanian | 60 | 0.2% |
| Russian | 93 | 0.4% |
| Salvadoran | 102 | 0.4% |
| Scandinavian | 14 | 0.1% |
| Scotch-Irish | 243 | 0.9% |
| Scottish | 366 | 1.4% |
| Serbian | 91 | 0.4% |
| Slavic | 26 | 0.1% |
| Slovak | 475 | 1.8% |
| Slovene | 145 | 0.6% |
| South American | 201 | 0.8% |
| Spaniard | 31 | 0.1% |
| Subsaharan African | 326 | 1.3% |
| Swedish | 94 | 0.4% |
| Swiss | 161 | 0.6% |
| Thai | 77 | 0.3% |
| Ukrainian | 181 | 0.7% |
| Venezuelan | 9 | 0.0% |
| Welsh | 174 | 0.7% |
| Yugoslavian | 7 | 0.0% | View All 72 Rows |
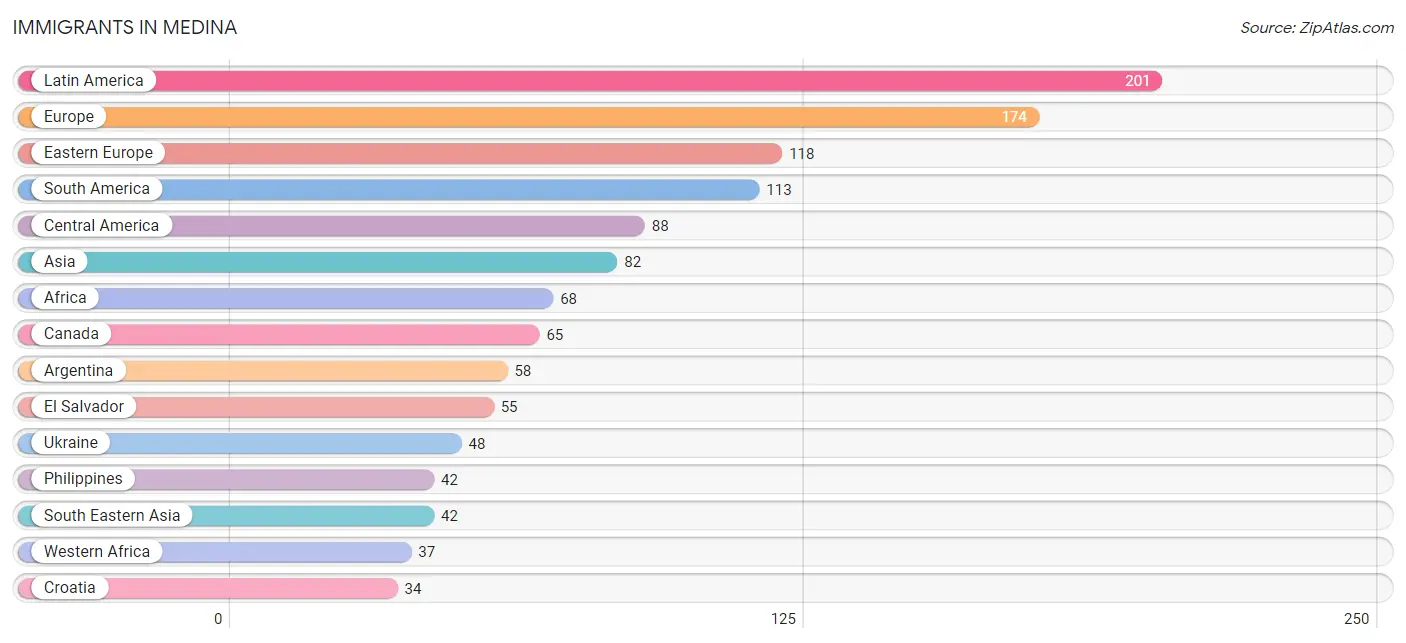
Immigrants in Medina
The most numerous immigrant groups reported in Medina came from Latin America (201 | 0.8%), Europe (174 | 0.7%), Eastern Europe (118 | 0.4%), South America (113 | 0.4%), and Central America (88 | 0.3%), together accounting for 2.7% of all Medina residents.
| Immigration Origin | # Population | % Population |
| Africa | 68 | 0.3% |
| Argentina | 58 | 0.2% |
| Asia | 82 | 0.3% |
| Bulgaria | 4 | 0.0% |
| Canada | 65 | 0.3% |
| Central America | 88 | 0.3% |
| China | 7 | 0.0% |
| Colombia | 23 | 0.1% |
| Croatia | 34 | 0.1% |
| Czechoslovakia | 9 | 0.0% |
| Eastern Africa | 31 | 0.1% |
| Eastern Asia | 8 | 0.0% |
| Eastern Europe | 118 | 0.4% |
| Ecuador | 14 | 0.1% |
| El Salvador | 55 | 0.2% |
| Ethiopia | 4 | 0.0% |
| Europe | 174 | 0.7% |
| Germany | 32 | 0.1% |
| Greece | 5 | 0.0% |
| India | 29 | 0.1% |
| Ireland | 8 | 0.0% |
| Israel | 2 | 0.0% |
| Japan | 1 | 0.0% |
| Latin America | 201 | 0.8% |
| Mexico | 19 | 0.1% |
| Nicaragua | 14 | 0.1% |
| Northern Europe | 8 | 0.0% |
| Pakistan | 1 | 0.0% |
| Peru | 9 | 0.0% |
| Philippines | 42 | 0.2% |
| Romania | 13 | 0.1% |
| South America | 113 | 0.4% |
| South Central Asia | 30 | 0.1% |
| South Eastern Asia | 42 | 0.2% |
| Southern Europe | 16 | 0.1% |
| Spain | 11 | 0.0% |
| Ukraine | 48 | 0.2% |
| Venezuela | 9 | 0.0% |
| Western Africa | 37 | 0.1% |
| Western Asia | 2 | 0.0% |
| Western Europe | 32 | 0.1% | View All 41 Rows |
Sex and Age in Medina
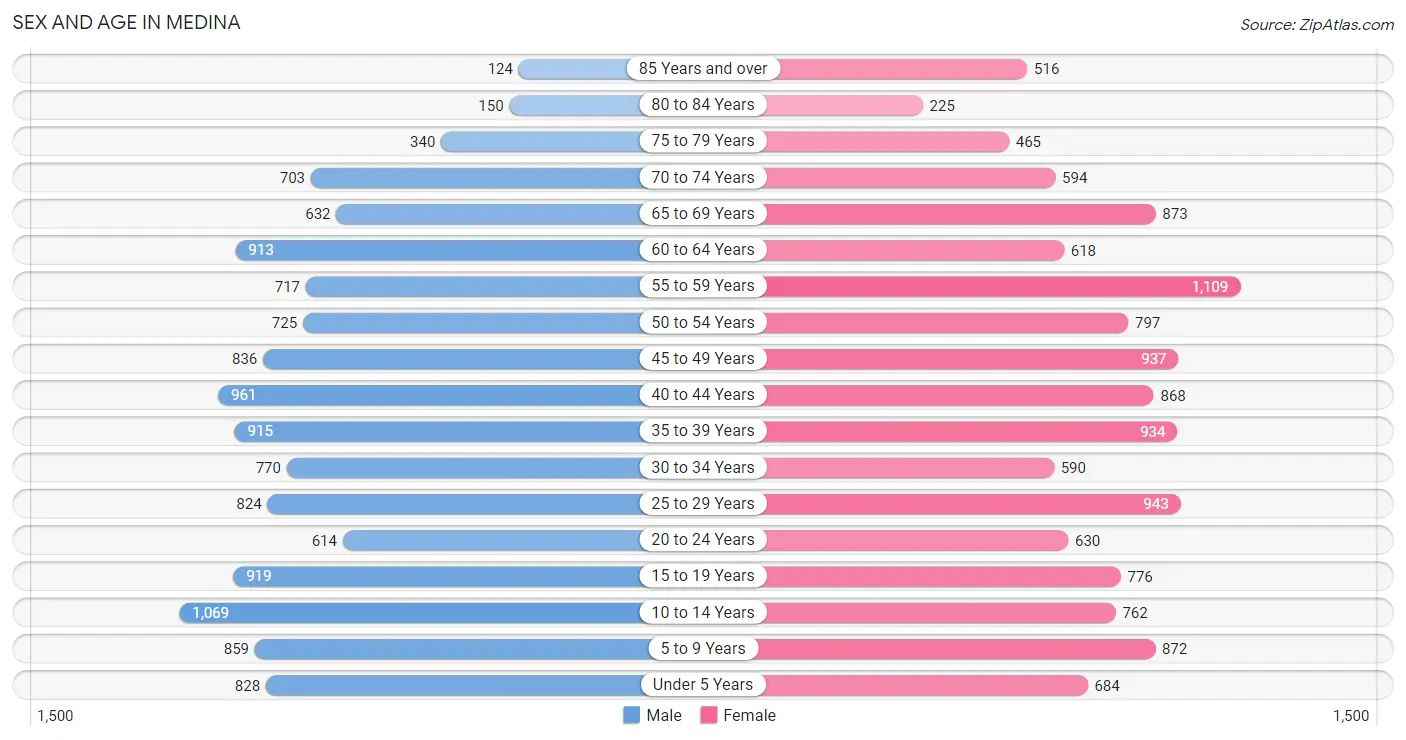
Sex and Age in Medina
The most populous age groups in Medina are 10 to 14 Years (1,069 | 8.3%) for men and 55 to 59 Years (1,109 | 8.4%) for women.
| Age Bracket | Male | Female |
| Under 5 Years | 828 (6.4%) | 684 (5.2%) |
| 5 to 9 Years | 859 (6.7%) | 872 (6.6%) |
| 10 to 14 Years | 1,069 (8.3%) | 762 (5.8%) |
| 15 to 19 Years | 919 (7.1%) | 776 (5.9%) |
| 20 to 24 Years | 614 (4.8%) | 630 (4.8%) |
| 25 to 29 Years | 824 (6.4%) | 943 (7.1%) |
| 30 to 34 Years | 770 (6.0%) | 590 (4.5%) |
| 35 to 39 Years | 915 (7.1%) | 934 (7.1%) |
| 40 to 44 Years | 961 (7.4%) | 868 (6.6%) |
| 45 to 49 Years | 836 (6.5%) | 937 (7.1%) |
| 50 to 54 Years | 725 (5.6%) | 797 (6.0%) |
| 55 to 59 Years | 717 (5.6%) | 1,109 (8.4%) |
| 60 to 64 Years | 913 (7.1%) | 618 (4.7%) |
| 65 to 69 Years | 632 (4.9%) | 873 (6.6%) |
| 70 to 74 Years | 703 (5.4%) | 594 (4.5%) |
| 75 to 79 Years | 340 (2.6%) | 465 (3.5%) |
| 80 to 84 Years | 150 (1.2%) | 225 (1.7%) |
| 85 Years and over | 124 (1.0%) | 516 (3.9%) |
| Total | 12,899 (100.0%) | 13,193 (100.0%) |
Families and Households in Medina
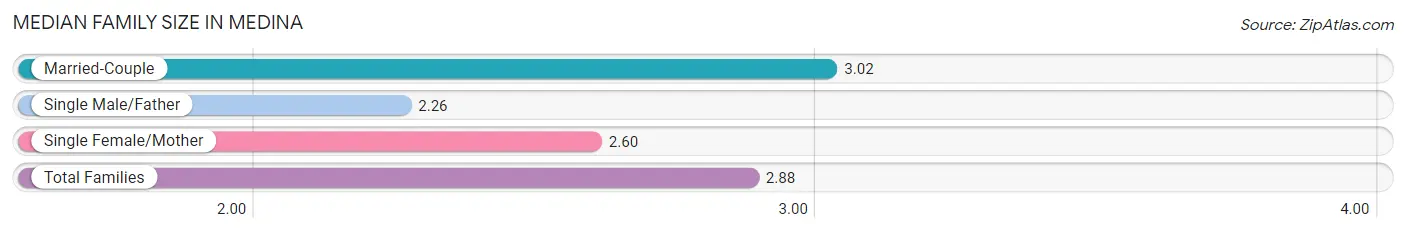
Median Family Size in Medina
The median family size in Medina is 2.88 persons per family, with married-couple families (5,290 | 72.6%) accounting for the largest median family size of 3.02 persons per family. On the other hand, single male/father families (687 | 9.4%) represent the smallest median family size with 2.26 persons per family.
| Family Type | # Families | Family Size |
| Married-Couple | 5,290 (72.6%) | 3.02 |
| Single Male/Father | 687 (9.4%) | 2.26 |
| Single Female/Mother | 1,311 (18.0%) | 2.60 |
| Total Families | 7,288 (100.0%) | 2.88 |
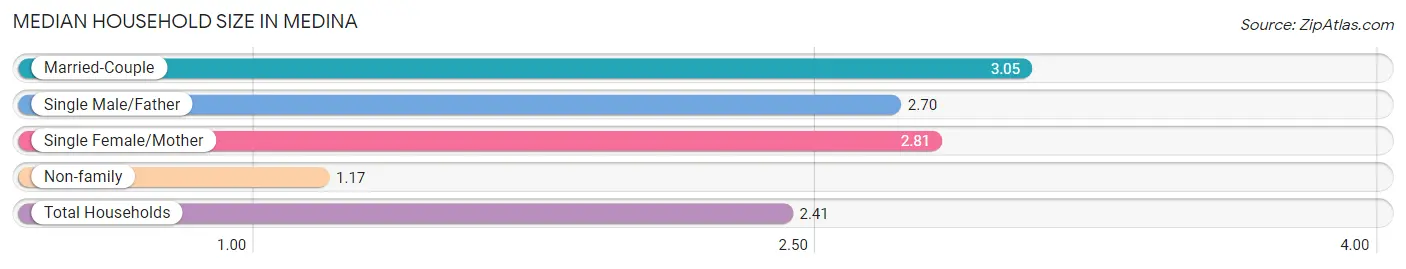
Median Household Size in Medina
The median household size in Medina is 2.41 persons per household, with married-couple households (5,290 | 49.8%) accounting for the largest median household size of 3.05 persons per household. non-family households (3,332 | 31.4%) represent the smallest median household size with 1.17 persons per household.
| Household Type | # Households | Household Size |
| Married-Couple | 5,290 (49.8%) | 3.05 |
| Single Male/Father | 687 (6.5%) | 2.70 |
| Single Female/Mother | 1,311 (12.3%) | 2.81 |
| Non-family | 3,332 (31.4%) | 1.17 |
| Total Households | 10,620 (100.0%) | 2.41 |
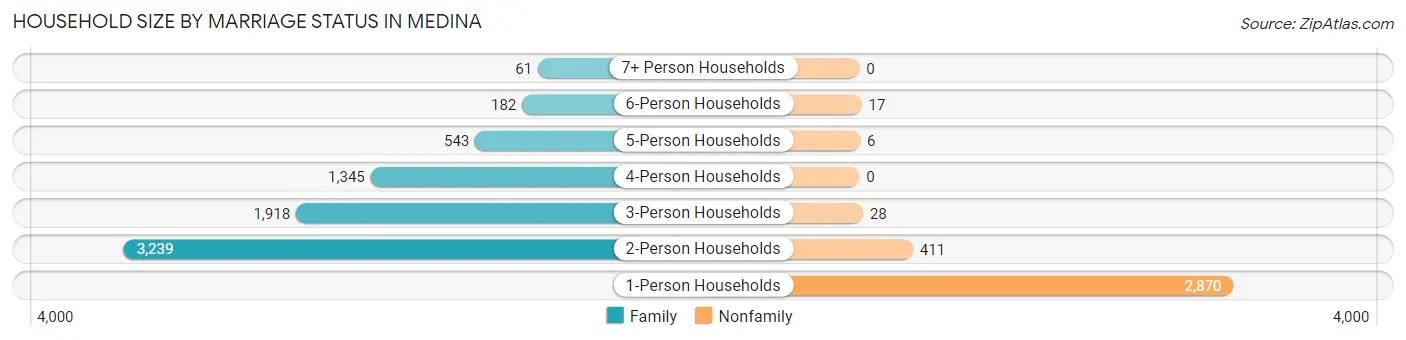
Household Size by Marriage Status in Medina
Out of a total of 10,620 households in Medina, 7,288 (68.6%) are family households, while 3,332 (31.4%) are nonfamily households. The most numerous type of family households are 2-person households, comprising 3,239, and the most common type of nonfamily households are 1-person households, comprising 2,870.
| Household Size | Family Households | Nonfamily Households |
| 1-Person Households | - | 2,870 (27.0%) |
| 2-Person Households | 3,239 (30.5%) | 411 (3.9%) |
| 3-Person Households | 1,918 (18.1%) | 28 (0.3%) |
| 4-Person Households | 1,345 (12.7%) | 0 (0.0%) |
| 5-Person Households | 543 (5.1%) | 6 (0.1%) |
| 6-Person Households | 182 (1.7%) | 17 (0.2%) |
| 7+ Person Households | 61 (0.6%) | 0 (0.0%) |
| Total | 7,288 (68.6%) | 3,332 (31.4%) |
Female Fertility in Medina
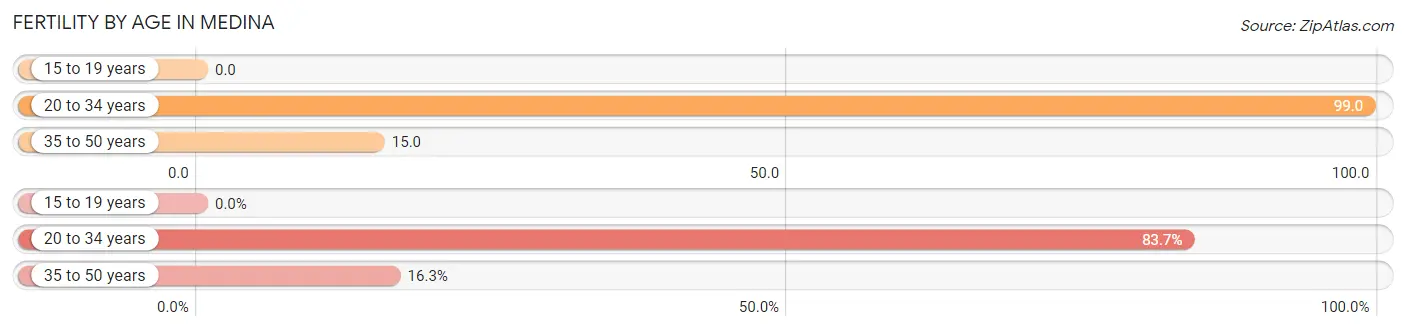
Fertility by Age in Medina
Average fertility rate in Medina is 44.0 births per 1,000 women. Women in the age bracket of 20 to 34 years have the highest fertility rate with 99.0 births per 1,000 women. Women in the age bracket of 20 to 34 years acount for 83.7% of all women with births.
| Age Bracket | Women with Births | Births / 1,000 Women |
| 15 to 19 years | 0 (0.0%) | 0.0 |
| 20 to 34 years | 215 (83.7%) | 99.0 |
| 35 to 50 years | 42 (16.3%) | 15.0 |
| Total | 257 (100.0%) | 44.0 |
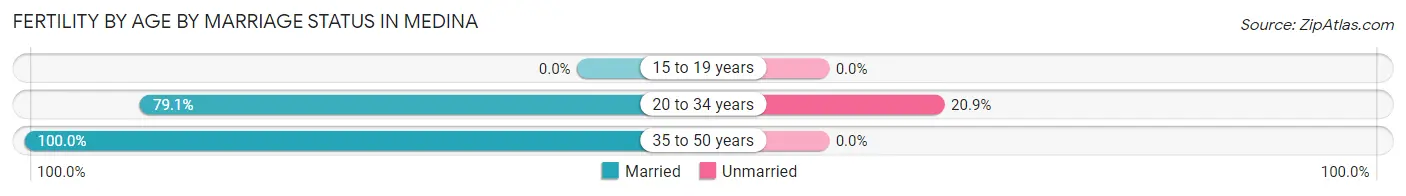
Fertility by Age by Marriage Status in Medina
82.5% of women with births (257) in Medina are married. The highest percentage of unmarried women with births falls into 20 to 34 years age bracket with 20.9% of them unmarried at the time of birth, while the lowest percentage of unmarried women with births belong to 35 to 50 years age bracket with 0.0% of them unmarried.
| Age Bracket | Married | Unmarried |
| 15 to 19 years | 0 (0.0%) | 0 (0.0%) |
| 20 to 34 years | 170 (79.1%) | 45 (20.9%) |
| 35 to 50 years | 42 (100.0%) | 0 (0.0%) |
| Total | 212 (82.5%) | 45 (17.5%) |
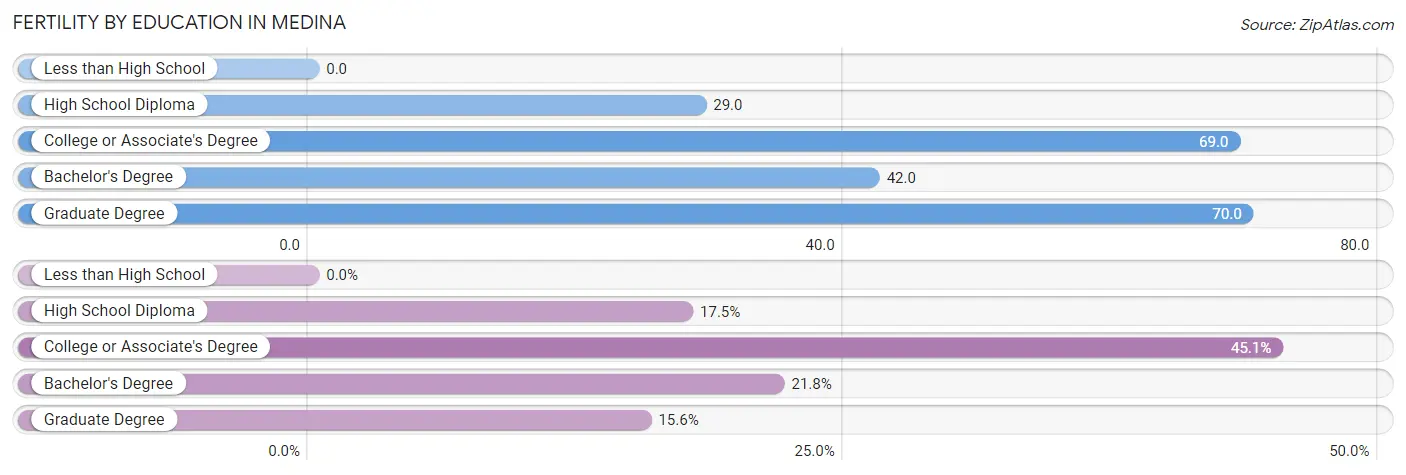
Fertility by Education in Medina
| Educational Attainment | Women with Births | Births / 1,000 Women |
| Less than High School | 0 (0.0%) | 0.0 |
| High School Diploma | 45 (17.5%) | 29.0 |
| College or Associate's Degree | 116 (45.1%) | 69.0 |
| Bachelor's Degree | 56 (21.8%) | 42.0 |
| Graduate Degree | 40 (15.6%) | 70.0 |
| Total | 257 (100.0%) | 44.0 |
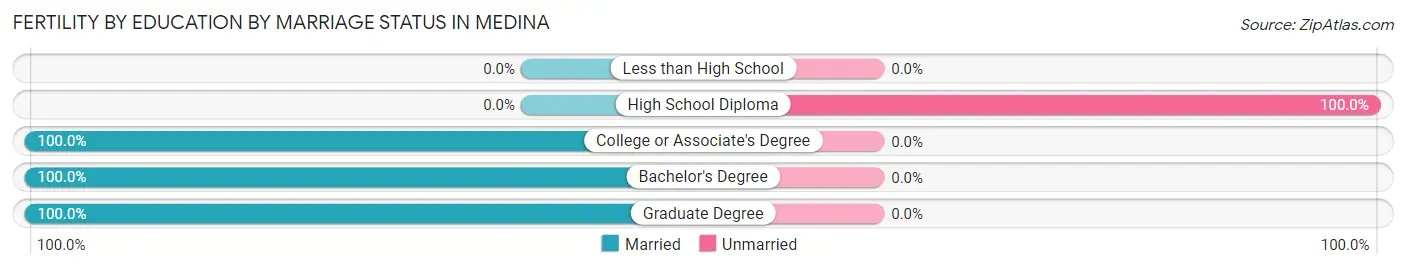
Fertility by Education by Marriage Status in Medina
17.5% of women with births in Medina are unmarried. Women with the educational attainment of college or associate's degree are most likely to be married with 100.0% of them married at childbirth, while women with the educational attainment of high school diploma are least likely to be married with 100.0% of them unmarried at childbirth.
| Educational Attainment | Married | Unmarried |
| Less than High School | 0 (0.0%) | 0 (0.0%) |
| High School Diploma | 0 (0.0%) | 45 (100.0%) |
| College or Associate's Degree | 116 (100.0%) | 0 (0.0%) |
| Bachelor's Degree | 56 (100.0%) | 0 (0.0%) |
| Graduate Degree | 40 (100.0%) | 0 (0.0%) |
| Total | 212 (82.5%) | 45 (17.5%) |
Income in Medina
Income Overview in Medina
Per Capita Income in Medina is $40,253, while median incomes of families and households are $98,050 and $74,820 respectively.
| Characteristic | Number | Measure |
| Per Capita Income | 26,092 | $40,253 |
| Median Family Income | 7,288 | $98,050 |
| Mean Family Income | 7,288 | $114,977 |
| Median Household Income | 10,620 | $74,820 |
| Mean Household Income | 10,620 | $96,918 |
| Income Deficit | 7,288 | $9,579 |
| Wage / Income Gap (%) | 26,092 | 33.63% |
| Wage / Income Gap ($) | 26,092 | 66.37¢ per $1 |
| Gini / Inequality Index | 26,092 | 0.44 |
Earnings by Sex in Medina
Average Earnings in Medina are $46,086, $57,224 for men and $37,982 for women, a difference of 33.6%.
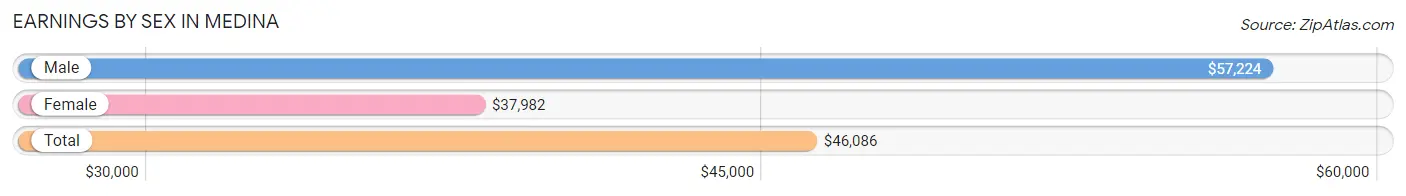
| Sex | Number | Average Earnings |
| Male | 7,376 (49.9%) | $57,224 |
| Female | 7,417 (50.1%) | $37,982 |
| Total | 14,793 (100.0%) | $46,086 |
Earnings by Sex by Income Bracket in Medina
The most common earnings brackets in Medina are $100,000+ for men (1,312 | 17.8%) and $55,000 to $64,999 for women (674 | 9.1%).
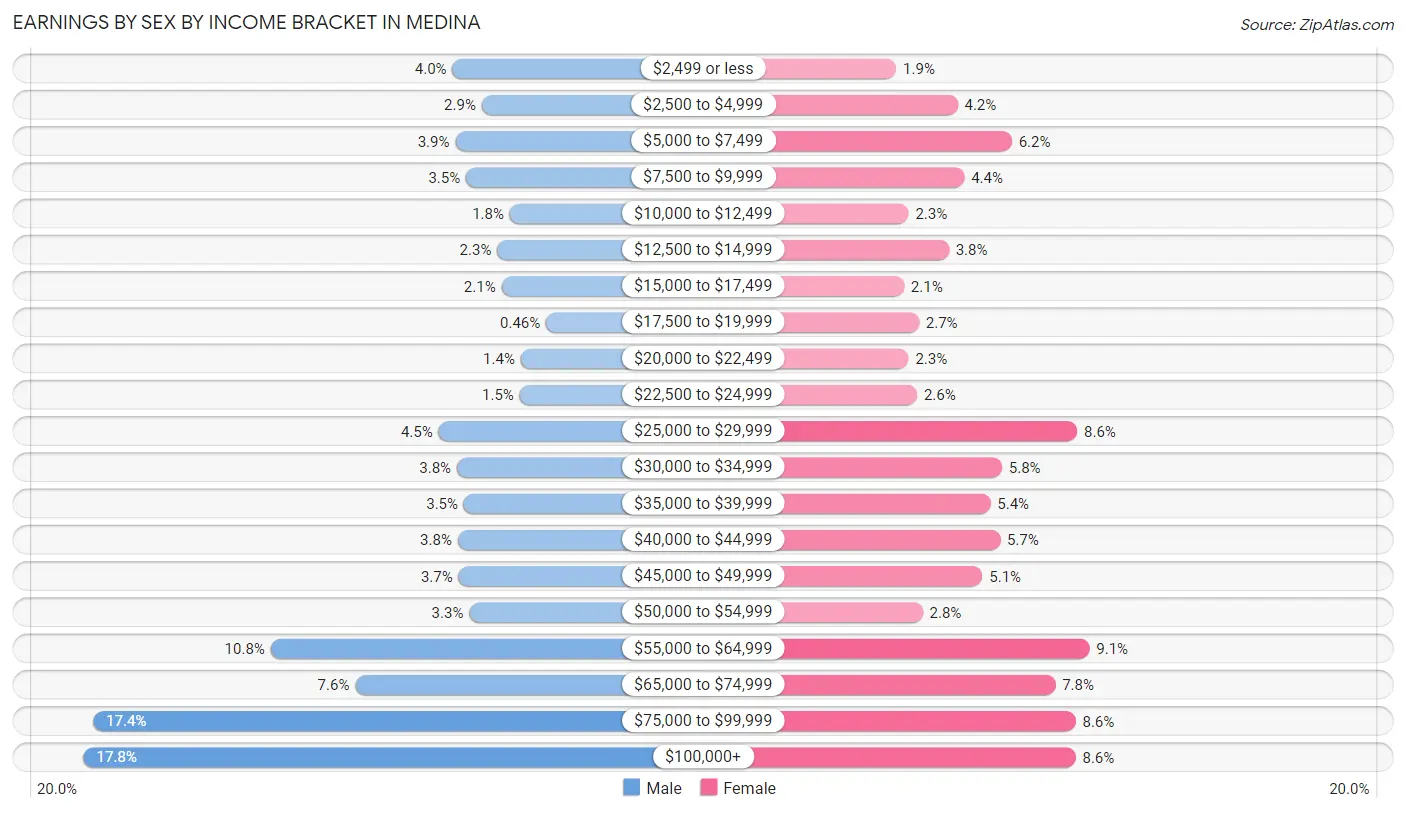
| Income | Male | Female |
| $2,499 or less | 293 (4.0%) | 137 (1.8%) |
| $2,500 to $4,999 | 212 (2.9%) | 308 (4.2%) |
| $5,000 to $7,499 | 285 (3.9%) | 458 (6.2%) |
| $7,500 to $9,999 | 255 (3.5%) | 326 (4.4%) |
| $10,000 to $12,499 | 134 (1.8%) | 171 (2.3%) |
| $12,500 to $14,999 | 169 (2.3%) | 283 (3.8%) |
| $15,000 to $17,499 | 157 (2.1%) | 159 (2.1%) |
| $17,500 to $19,999 | 34 (0.5%) | 200 (2.7%) |
| $20,000 to $22,499 | 104 (1.4%) | 171 (2.3%) |
| $22,500 to $24,999 | 107 (1.5%) | 195 (2.6%) |
| $25,000 to $29,999 | 331 (4.5%) | 640 (8.6%) |
| $30,000 to $34,999 | 280 (3.8%) | 431 (5.8%) |
| $35,000 to $39,999 | 261 (3.5%) | 399 (5.4%) |
| $40,000 to $44,999 | 278 (3.8%) | 426 (5.7%) |
| $45,000 to $49,999 | 276 (3.7%) | 377 (5.1%) |
| $50,000 to $54,999 | 246 (3.3%) | 211 (2.8%) |
| $55,000 to $64,999 | 795 (10.8%) | 674 (9.1%) |
| $65,000 to $74,999 | 561 (7.6%) | 579 (7.8%) |
| $75,000 to $99,999 | 1,286 (17.4%) | 636 (8.6%) |
| $100,000+ | 1,312 (17.8%) | 636 (8.6%) |
| Total | 7,376 (100.0%) | 7,417 (100.0%) |
Earnings by Sex by Educational Attainment in Medina
Average earnings in Medina are $63,735 for men and $43,000 for women, a difference of 32.5%. Men with an educational attainment of graduate degree enjoy the highest average annual earnings of $93,889, while those with high school diploma education earn the least with $52,729. Women with an educational attainment of graduate degree earn the most with the average annual earnings of $77,115, while those with high school diploma education have the smallest earnings of $25,729.
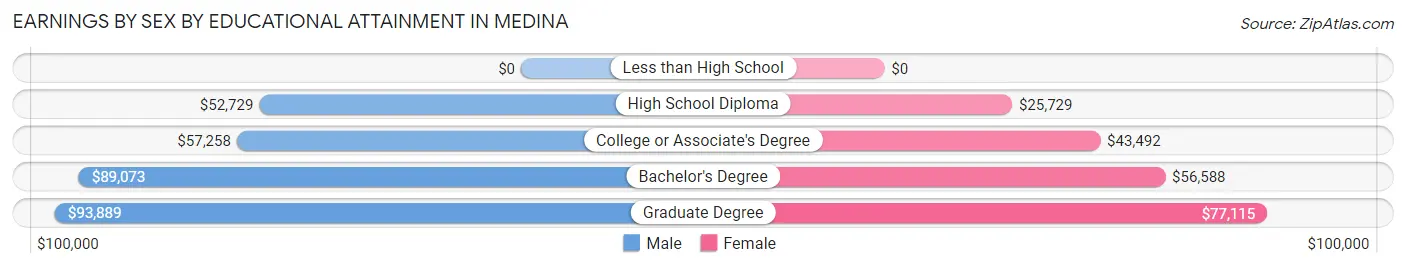
| Educational Attainment | Male Income | Female Income |
| Less than High School | - | - |
| High School Diploma | $52,729 | $25,729 |
| College or Associate's Degree | $57,258 | $43,492 |
| Bachelor's Degree | $89,073 | $56,588 |
| Graduate Degree | $93,889 | $77,115 |
| Total | $63,735 | $43,000 |
Family Income in Medina
Family Income Brackets in Medina
According to the Medina family income data, there are 1,684 families falling into the $100,000 to $149,999 income range, which is the most common income bracket and makes up 23.1% of all families. Conversely, the $10,000 to $14,999 income bracket is the least frequent group with only 80 families (1.1%) belonging to this category.
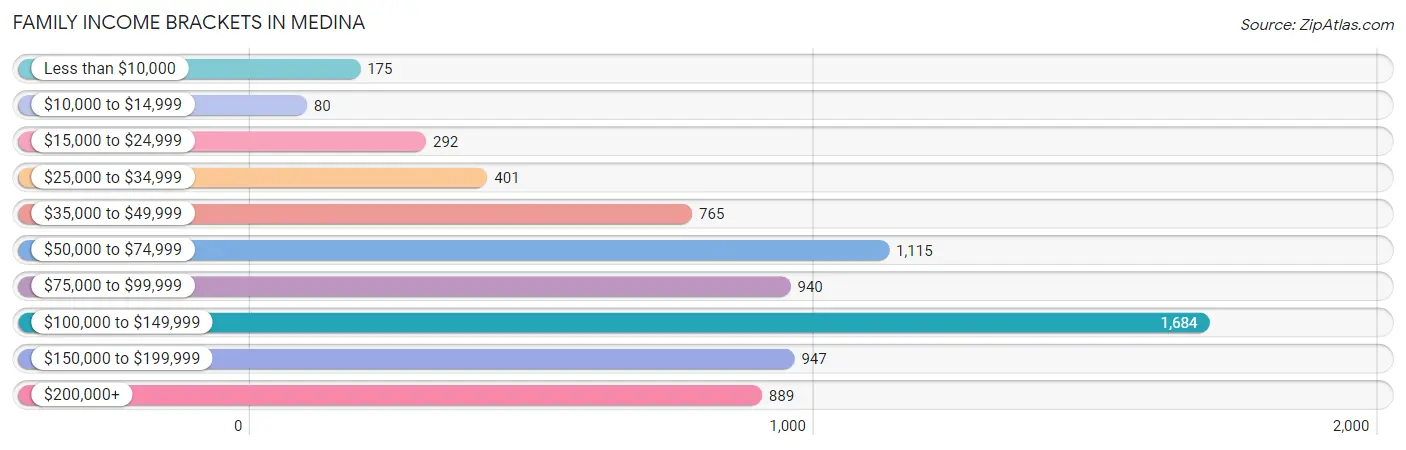
| Income Bracket | # Families | % Families |
| Less than $10,000 | 175 | 2.4% |
| $10,000 to $14,999 | 80 | 1.1% |
| $15,000 to $24,999 | 292 | 4.0% |
| $25,000 to $34,999 | 401 | 5.5% |
| $35,000 to $49,999 | 765 | 10.5% |
| $50,000 to $74,999 | 1,115 | 15.3% |
| $75,000 to $99,999 | 940 | 12.9% |
| $100,000 to $149,999 | 1,684 | 23.1% |
| $150,000 to $199,999 | 947 | 13.0% |
| $200,000+ | 889 | 12.2% |
Family Income by Famaliy Size in Medina
5-person families (457 | 6.3%) account for the highest median family income in Medina with $136,161 per family, while 2-person families (3,585 | 49.2%) have the highest median income of $43,566 per family member.
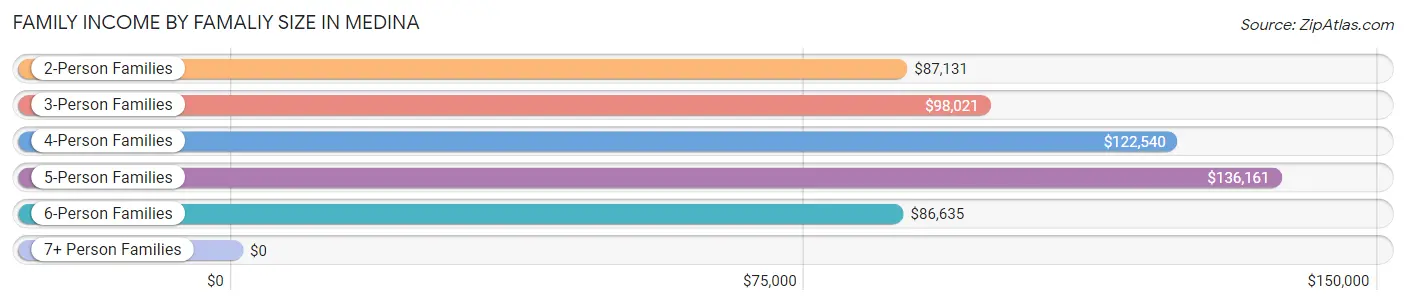
| Income Bracket | # Families | Median Income |
| 2-Person Families | 3,585 (49.2%) | $87,131 |
| 3-Person Families | 1,761 (24.2%) | $98,021 |
| 4-Person Families | 1,277 (17.5%) | $122,540 |
| 5-Person Families | 457 (6.3%) | $136,161 |
| 6-Person Families | 167 (2.3%) | $86,635 |
| 7+ Person Families | 41 (0.6%) | $0 |
| Total | 7,288 (100.0%) | $98,050 |
Family Income by Number of Earners in Medina
The median family income in Medina is $98,050, with families comprising 3+ earners (753) having the highest median family income of $149,107, while families with 1 earner (2,488) have the lowest median family income of $53,043, accounting for 10.3% and 34.1% of families, respectively.
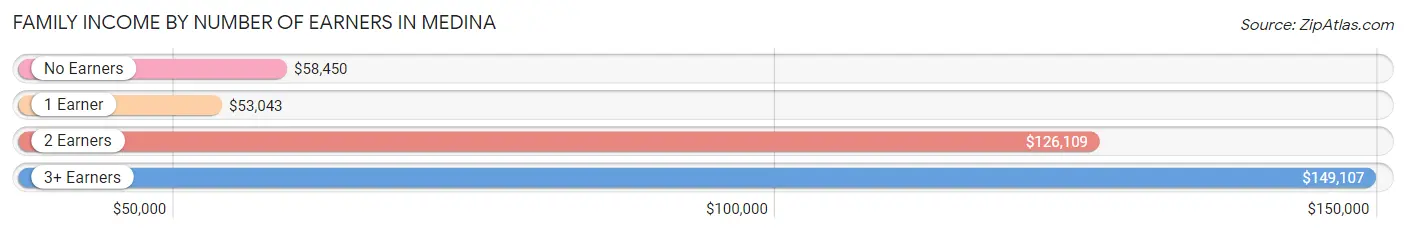
| Number of Earners | # Families | Median Income |
| No Earners | 752 (10.3%) | $58,450 |
| 1 Earner | 2,488 (34.1%) | $53,043 |
| 2 Earners | 3,295 (45.2%) | $126,109 |
| 3+ Earners | 753 (10.3%) | $149,107 |
| Total | 7,288 (100.0%) | $98,050 |
Household Income in Medina
Household Income Brackets in Medina
With 2,060 households falling in the category, the $100,000 to $149,999 income range is the most frequent in Medina, accounting for 19.4% of all households. In contrast, only 308 households (2.9%) fall into the $10,000 to $14,999 income bracket, making it the least populous group.
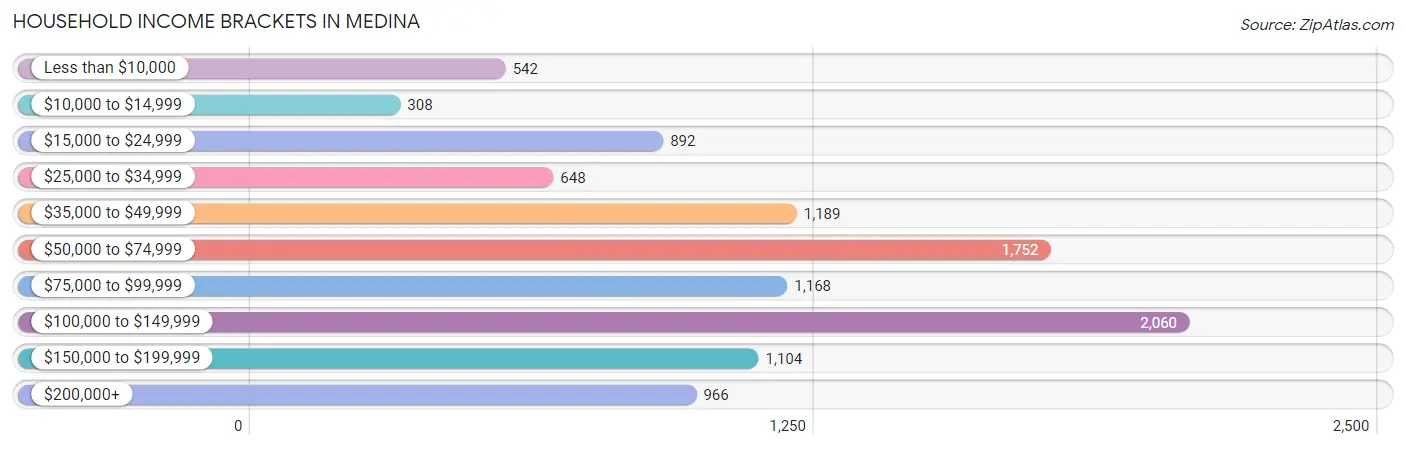
| Income Bracket | # Households | % Households |
| Less than $10,000 | 542 | 5.1% |
| $10,000 to $14,999 | 308 | 2.9% |
| $15,000 to $24,999 | 892 | 8.4% |
| $25,000 to $34,999 | 648 | 6.1% |
| $35,000 to $49,999 | 1,189 | 11.2% |
| $50,000 to $74,999 | 1,752 | 16.5% |
| $75,000 to $99,999 | 1,168 | 11.0% |
| $100,000 to $149,999 | 2,060 | 19.4% |
| $150,000 to $199,999 | 1,104 | 10.4% |
| $200,000+ | 966 | 9.1% |
Household Income by Householder Age in Medina
The median household income in Medina is $74,820, with the highest median household income of $95,250 found in the 45 to 64 years age bracket for the primary householder. A total of 3,715 households (35.0%) fall into this category. Meanwhile, the 15 to 24 years age bracket for the primary householder has the lowest median household income of $34,750, with 394 households (3.7%) in this group.
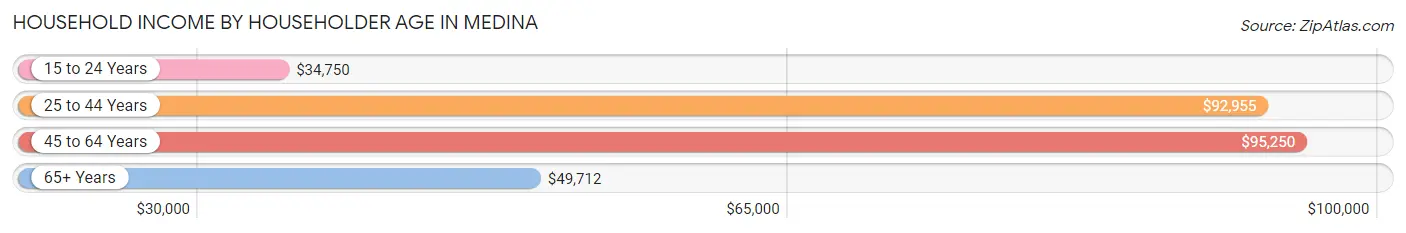
| Income Bracket | # Households | Median Income |
| 15 to 24 Years | 394 (3.7%) | $34,750 |
| 25 to 44 Years | 3,588 (33.8%) | $92,955 |
| 45 to 64 Years | 3,715 (35.0%) | $95,250 |
| 65+ Years | 2,923 (27.5%) | $49,712 |
| Total | 10,620 (100.0%) | $74,820 |
Poverty in Medina
Income Below Poverty by Sex and Age in Medina
With 7.4% poverty level for males and 10.4% for females among the residents of Medina, 18 to 24 year old males and under 5 year old females are the most vulnerable to poverty, with 164 males (17.5%) and 186 females (27.8%) in their respective age groups living below the poverty level.
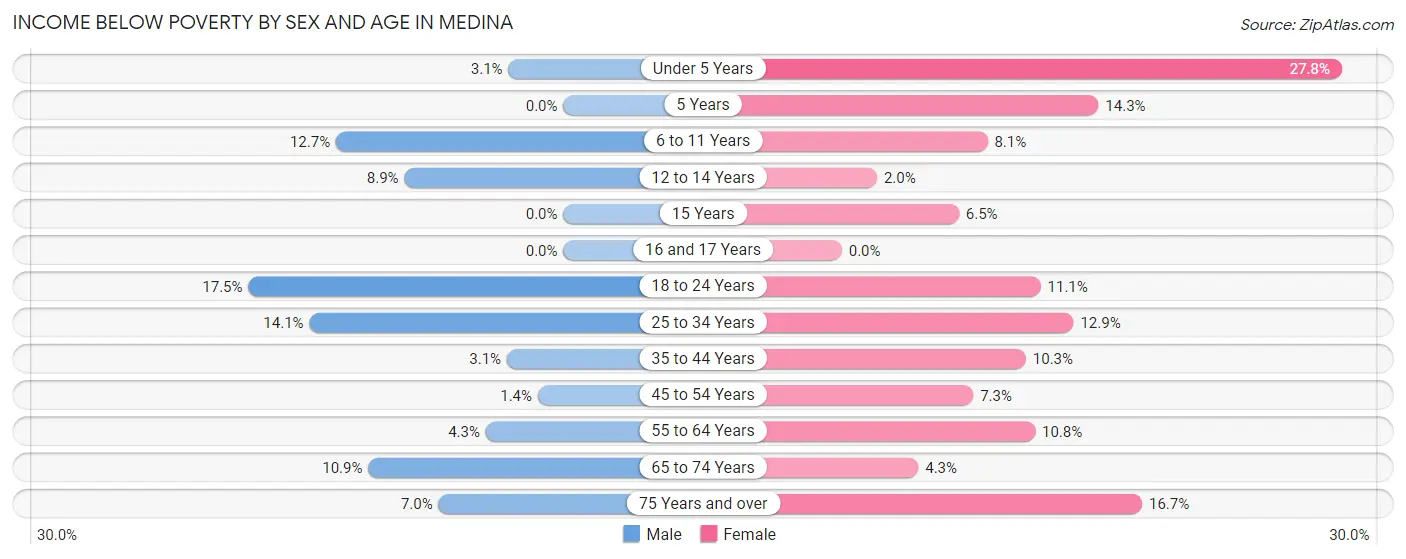
| Age Bracket | Male | Female |
| Under 5 Years | 25 (3.1%) | 186 (27.8%) |
| 5 Years | 0 (0.0%) | 26 (14.3%) |
| 6 to 11 Years | 146 (12.7%) | 74 (8.1%) |
| 12 to 14 Years | 43 (8.8%) | 10 (2.0%) |
| 15 Years | 0 (0.0%) | 9 (6.5%) |
| 16 and 17 Years | 0 (0.0%) | 0 (0.0%) |
| 18 to 24 Years | 164 (17.5%) | 121 (11.1%) |
| 25 to 34 Years | 220 (14.1%) | 194 (12.9%) |
| 35 to 44 Years | 58 (3.1%) | 183 (10.2%) |
| 45 to 54 Years | 22 (1.4%) | 127 (7.3%) |
| 55 to 64 Years | 70 (4.3%) | 185 (10.8%) |
| 65 to 74 Years | 145 (10.9%) | 62 (4.3%) |
| 75 Years and over | 38 (7.0%) | 170 (16.7%) |
| Total | 931 (7.4%) | 1,347 (10.4%) |
Income Above Poverty by Sex and Age in Medina
According to the poverty statistics in Medina, males aged 5 years and females aged 16 and 17 years are the age groups that are most secure financially, with 100.0% of males and 100.0% of females in these age groups living above the poverty line.
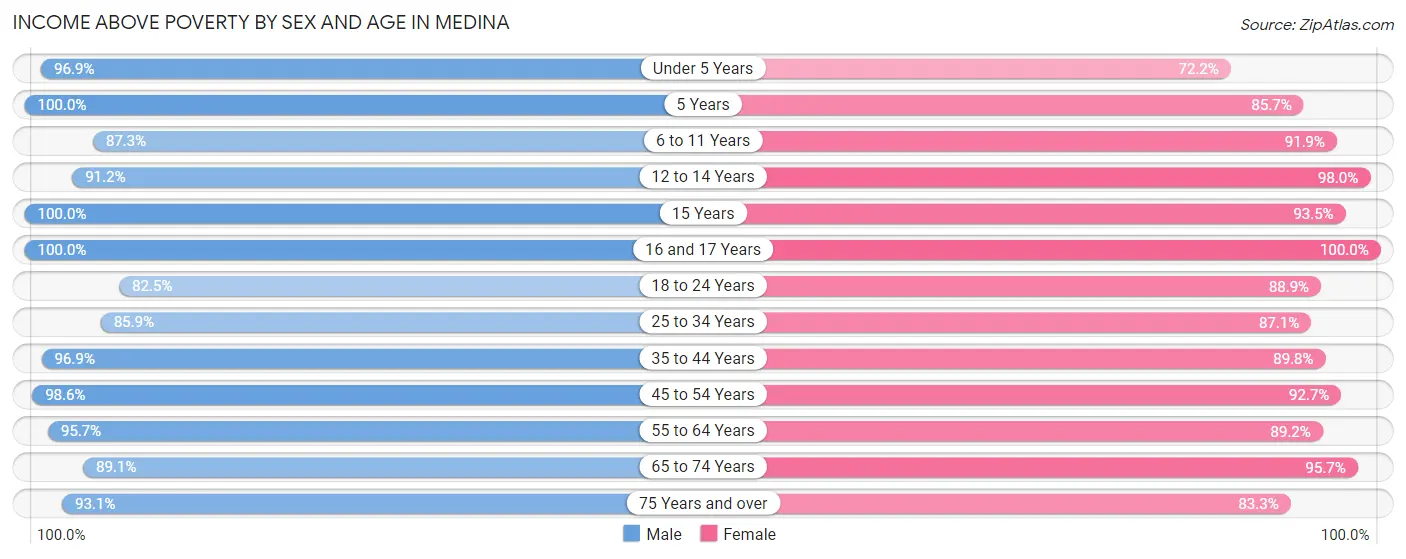
| Age Bracket | Male | Female |
| Under 5 Years | 793 (96.9%) | 482 (72.2%) |
| 5 Years | 204 (100.0%) | 156 (85.7%) |
| 6 to 11 Years | 1,007 (87.3%) | 839 (91.9%) |
| 12 to 14 Years | 443 (91.1%) | 499 (98.0%) |
| 15 Years | 188 (100.0%) | 129 (93.5%) |
| 16 and 17 Years | 345 (100.0%) | 172 (100.0%) |
| 18 to 24 Years | 771 (82.5%) | 972 (88.9%) |
| 25 to 34 Years | 1,336 (85.9%) | 1,310 (87.1%) |
| 35 to 44 Years | 1,787 (96.9%) | 1,603 (89.7%) |
| 45 to 54 Years | 1,523 (98.6%) | 1,607 (92.7%) |
| 55 to 64 Years | 1,550 (95.7%) | 1,535 (89.2%) |
| 65 to 74 Years | 1,190 (89.1%) | 1,392 (95.7%) |
| 75 Years and over | 509 (93.0%) | 847 (83.3%) |
| Total | 11,646 (92.6%) | 11,543 (89.5%) |
Income Below Poverty Among Married-Couple Families in Medina
The poverty statistics for married-couple families in Medina show that 2.3% or 124 of the total 5,290 families live below the poverty line. Families with 3 or 4 children have the highest poverty rate of 4.8%, comprising of 18 families. On the other hand, families with 5 or more children have the lowest poverty rate of 0.0%, which includes 0 families.
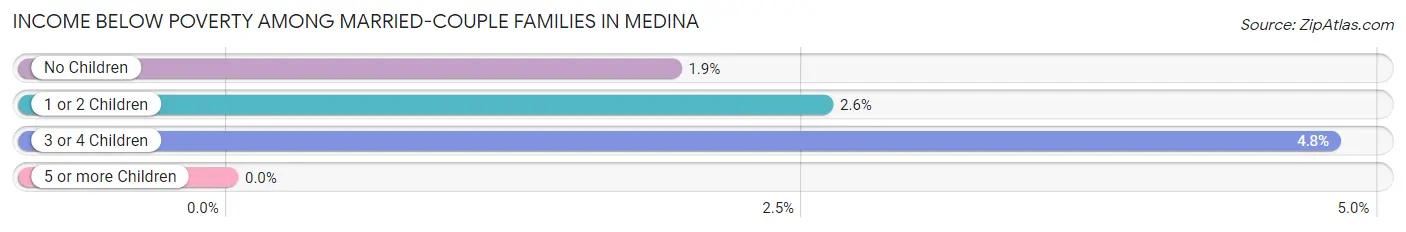
| Children | Above Poverty | Below Poverty |
| No Children | 2,999 (98.1%) | 59 (1.9%) |
| 1 or 2 Children | 1,769 (97.4%) | 47 (2.6%) |
| 3 or 4 Children | 357 (95.2%) | 18 (4.8%) |
| 5 or more Children | 41 (100.0%) | 0 (0.0%) |
| Total | 5,166 (97.7%) | 124 (2.3%) |
Income Below Poverty Among Single-Parent Households in Medina
According to the poverty data in Medina, 8.3% or 57 single-father households and 25.2% or 330 single-mother households are living below the poverty line. Among single-father households, those with 3 or 4 children have the highest poverty rate, with 38 households (84.4%) experiencing poverty. Likewise, among single-mother households, those with 1 or 2 children have the highest poverty rate, with 259 households (31.1%) falling below the poverty line.
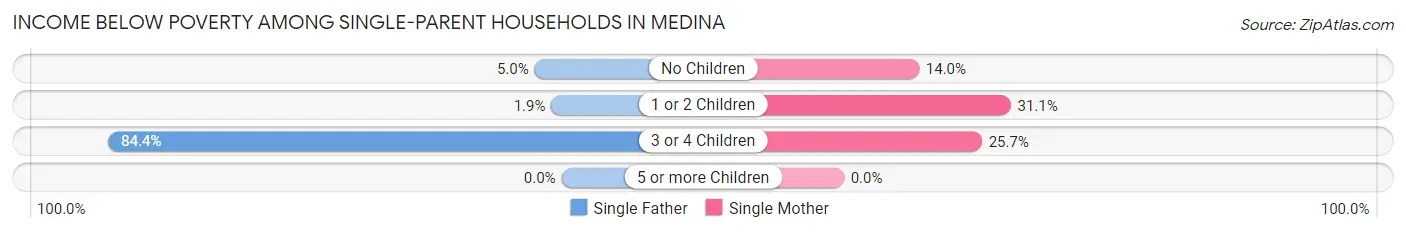
| Children | Single Father | Single Mother |
| No Children | 11 (5.0%) | 62 (14.0%) |
| 1 or 2 Children | 8 (1.9%) | 259 (31.1%) |
| 3 or 4 Children | 38 (84.4%) | 9 (25.7%) |
| 5 or more Children | 0 (0.0%) | 0 (0.0%) |
| Total | 57 (8.3%) | 330 (25.2%) |
Income Below Poverty Among Married-Couple vs Single-Parent Households in Medina
The poverty data for Medina shows that 124 of the married-couple family households (2.3%) and 387 of the single-parent households (19.4%) are living below the poverty level. Within the married-couple family households, those with 3 or 4 children have the highest poverty rate, with 18 households (4.8%) falling below the poverty line. Among the single-parent households, those with 3 or 4 children have the highest poverty rate, with 47 household (58.8%) living below poverty.
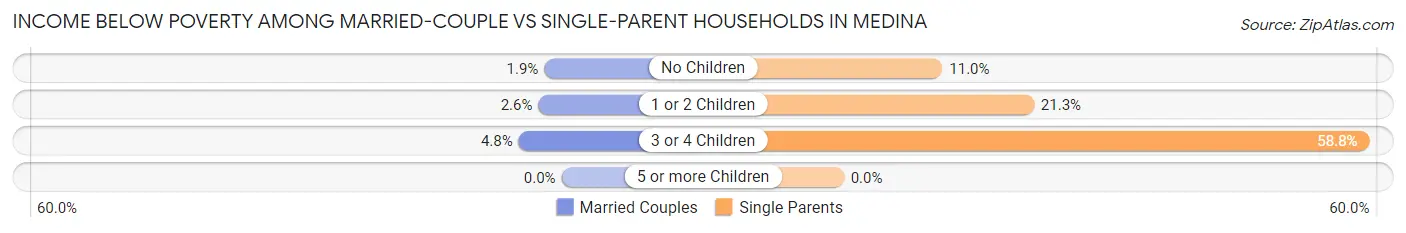
| Children | Married-Couple Families | Single-Parent Households |
| No Children | 59 (1.9%) | 73 (11.0%) |
| 1 or 2 Children | 47 (2.6%) | 267 (21.3%) |
| 3 or 4 Children | 18 (4.8%) | 47 (58.8%) |
| 5 or more Children | 0 (0.0%) | 0 (0.0%) |
| Total | 124 (2.3%) | 387 (19.4%) |
Employment Characteristics in Medina
Employment by Class of Employer in Medina
Among the 13,367 employed individuals in Medina, private company employees (9,739 | 72.9%), not-for-profit organizations (1,447 | 10.8%), and local government employees (946 | 7.1%) make up the most common classes of employment.
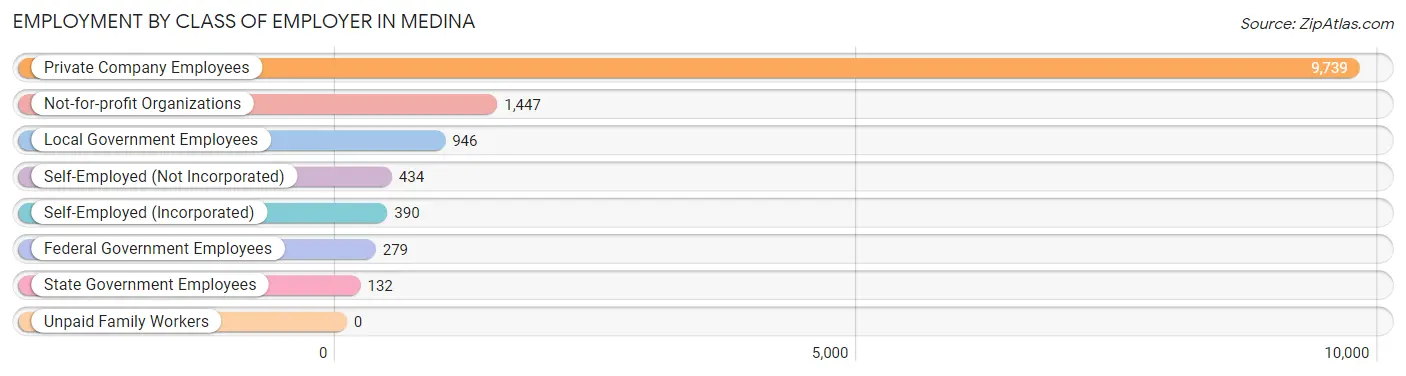
| Employer Class | # Employees | % Employees |
| Private Company Employees | 9,739 | 72.9% |
| Self-Employed (Incorporated) | 390 | 2.9% |
| Self-Employed (Not Incorporated) | 434 | 3.3% |
| Not-for-profit Organizations | 1,447 | 10.8% |
| Local Government Employees | 946 | 7.1% |
| State Government Employees | 132 | 1.0% |
| Federal Government Employees | 279 | 2.1% |
| Unpaid Family Workers | 0 | 0.0% |
| Total | 13,367 | 100.0% |
Employment Status by Age in Medina
According to the labor force statistics for Medina, out of the total population over 16 years of age (20,686), 68.8% or 14,232 individuals are in the labor force, with 4.8% or 683 of them unemployed. The age group with the highest labor force participation rate is 45 to 54 years, with 89.3% or 2,942 individuals in the labor force. Within the labor force, the 20 to 24 years age range has the highest percentage of unemployed individuals, with 19.9% or 206 of them being unemployed.
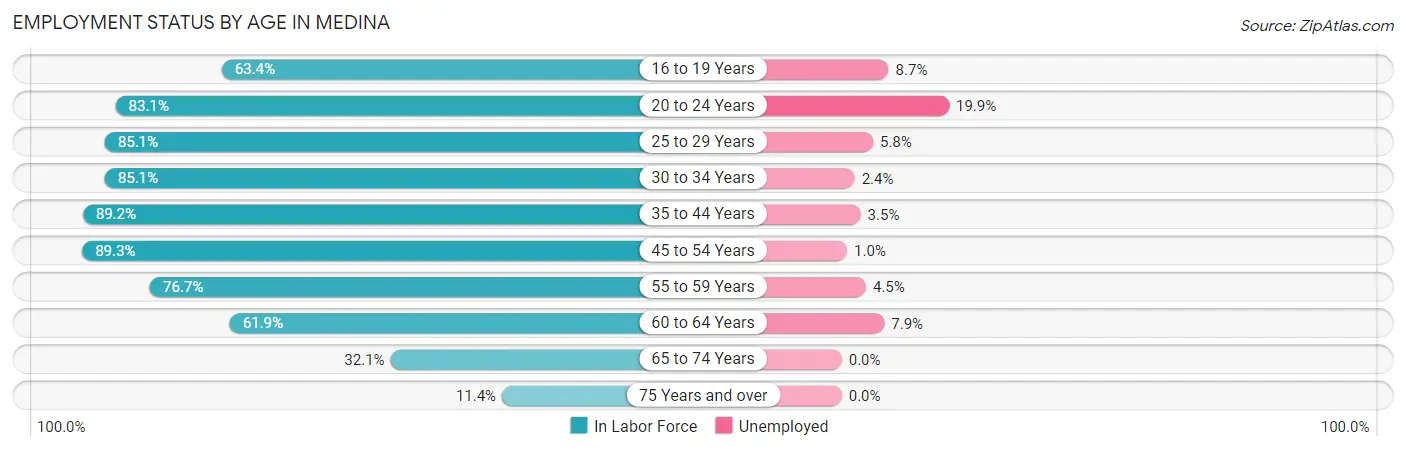
| Age Bracket | In Labor Force | Unemployed |
| 16 to 19 Years | 864 (63.4%) | 75 (8.7%) |
| 20 to 24 Years | 1,034 (83.1%) | 206 (19.9%) |
| 25 to 29 Years | 1,504 (85.1%) | 87 (5.8%) |
| 30 to 34 Years | 1,157 (85.1%) | 28 (2.4%) |
| 35 to 44 Years | 3,281 (89.2%) | 115 (3.5%) |
| 45 to 54 Years | 2,942 (89.3%) | 29 (1.0%) |
| 55 to 59 Years | 1,401 (76.7%) | 63 (4.5%) |
| 60 to 64 Years | 948 (61.9%) | 75 (7.9%) |
| 65 to 74 Years | 899 (32.1%) | 0 (0.0%) |
| 75 Years and over | 207 (11.4%) | 0 (0.0%) |
| Total | 14,232 (68.8%) | 683 (4.8%) |
Employment Status by Educational Attainment in Medina
According to labor force statistics for Medina, 83.5% of individuals (11,237) out of the total population between 25 and 64 years of age (13,457) are in the labor force, with 3.5% or 393 of them being unemployed. The group with the highest labor force participation rate are those with the educational attainment of bachelor's degree or higher, with 91.2% or 4,653 individuals in the labor force. Within the labor force, individuals with less than high school education have the highest percentage of unemployment, with 18.5% or 44 of them being unemployed.
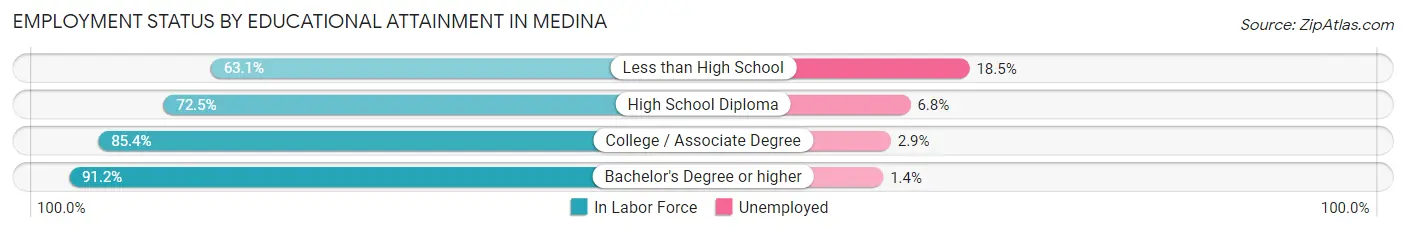
| Educational Attainment | In Labor Force | Unemployed |
| Less than High School | 238 (63.1%) | 70 (18.5%) |
| High School Diploma | 2,662 (72.5%) | 250 (6.8%) |
| College / Associate Degree | 3,677 (85.4%) | 125 (2.9%) |
| Bachelor's Degree or higher | 4,653 (91.2%) | 71 (1.4%) |
| Total | 11,237 (83.5%) | 471 (3.5%) |
Employment Occupations by Sex in Medina
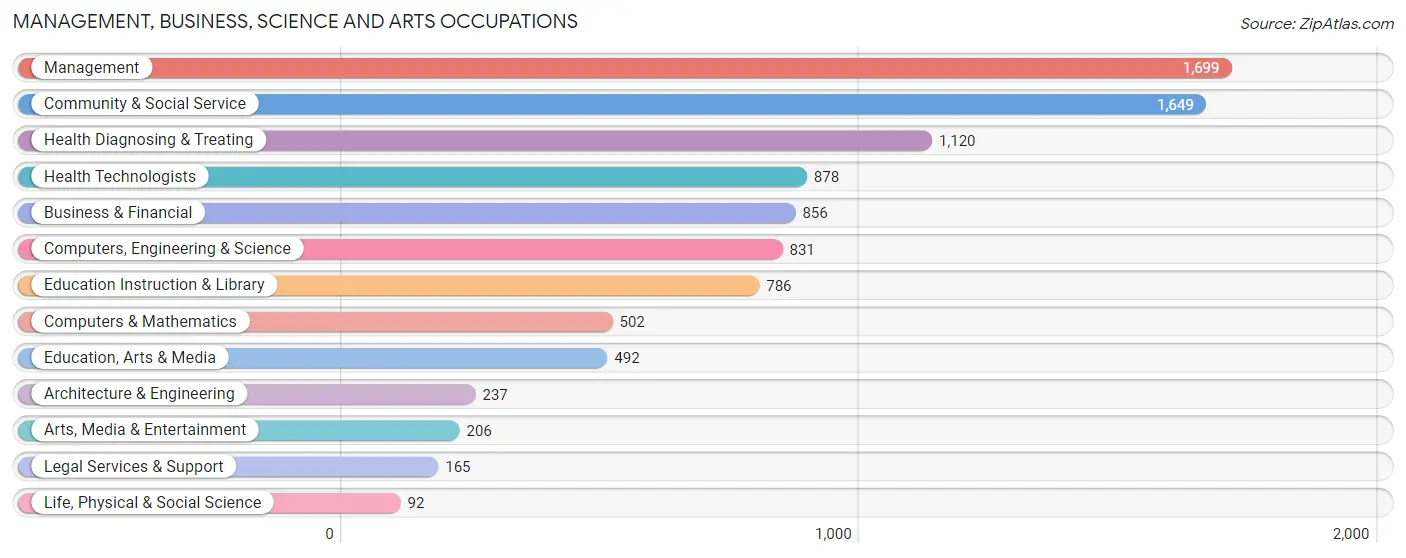
Management, Business, Science and Arts Occupations
The most common Management, Business, Science and Arts occupations in Medina are Management (1,699 | 12.5%), Community & Social Service (1,649 | 12.2%), Health Diagnosing & Treating (1,120 | 8.3%), Health Technologists (878 | 6.5%), and Business & Financial (856 | 6.3%).
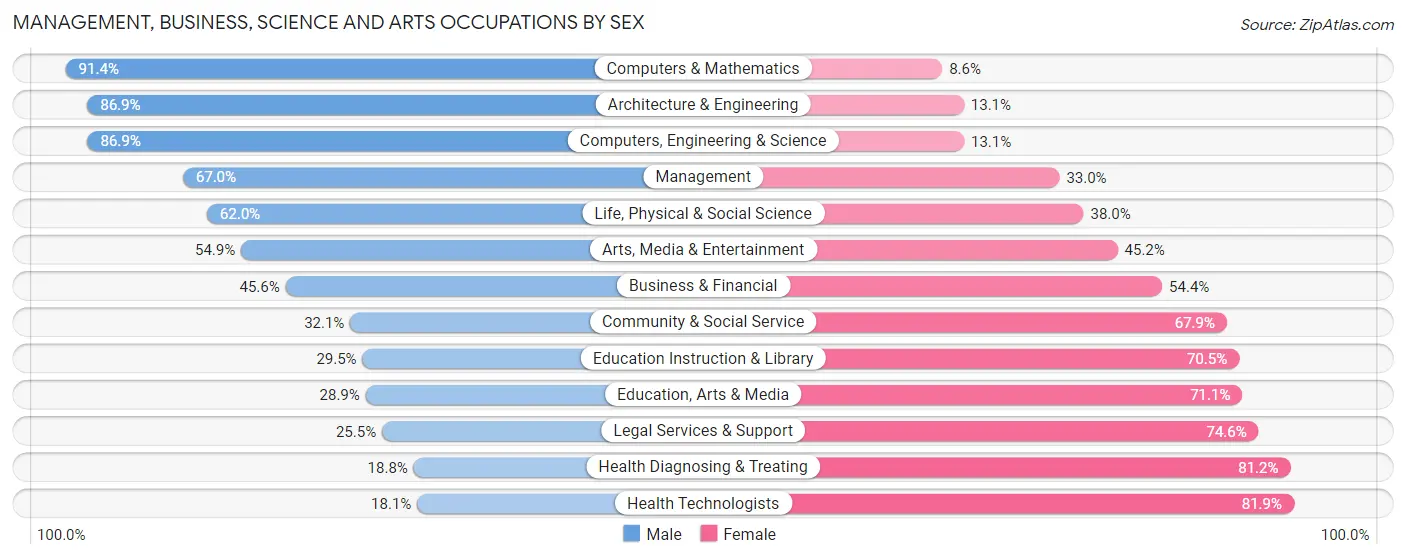
Management, Business, Science and Arts Occupations by Sex
Within the Management, Business, Science and Arts occupations in Medina, the most male-oriented occupations are Computers & Mathematics (91.4%), Architecture & Engineering (86.9%), and Computers, Engineering & Science (86.9%), while the most female-oriented occupations are Health Technologists (81.9%), Health Diagnosing & Treating (81.2%), and Legal Services & Support (74.6%).
| Occupation | Male | Female |
| Management | 1,138 (67.0%) | 561 (33.0%) |
| Business & Financial | 390 (45.6%) | 466 (54.4%) |
| Computers, Engineering & Science | 722 (86.9%) | 109 (13.1%) |
| Computers & Mathematics | 459 (91.4%) | 43 (8.6%) |
| Architecture & Engineering | 206 (86.9%) | 31 (13.1%) |
| Life, Physical & Social Science | 57 (62.0%) | 35 (38.0%) |
| Community & Social Service | 529 (32.1%) | 1,120 (67.9%) |
| Education, Arts & Media | 142 (28.9%) | 350 (71.1%) |
| Legal Services & Support | 42 (25.5%) | 123 (74.6%) |
| Education Instruction & Library | 232 (29.5%) | 554 (70.5%) |
| Arts, Media & Entertainment | 113 (54.8%) | 93 (45.2%) |
| Health Diagnosing & Treating | 211 (18.8%) | 909 (81.2%) |
| Health Technologists | 159 (18.1%) | 719 (81.9%) |
| Total (Category) | 2,990 (48.6%) | 3,165 (51.4%) |
| Total (Overall) | 6,625 (48.9%) | 6,926 (51.1%) |
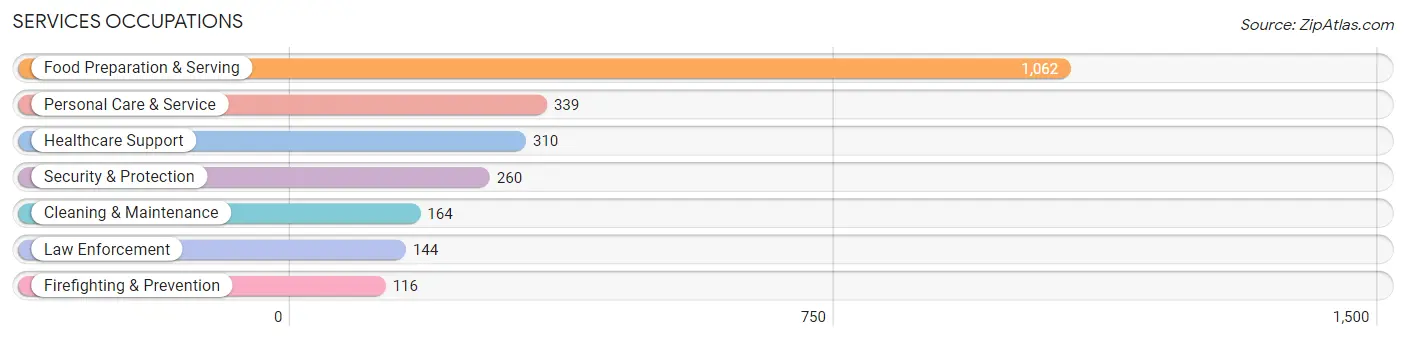
Services Occupations
The most common Services occupations in Medina are Food Preparation & Serving (1,062 | 7.8%), Personal Care & Service (339 | 2.5%), Healthcare Support (310 | 2.3%), Security & Protection (260 | 1.9%), and Cleaning & Maintenance (164 | 1.2%).
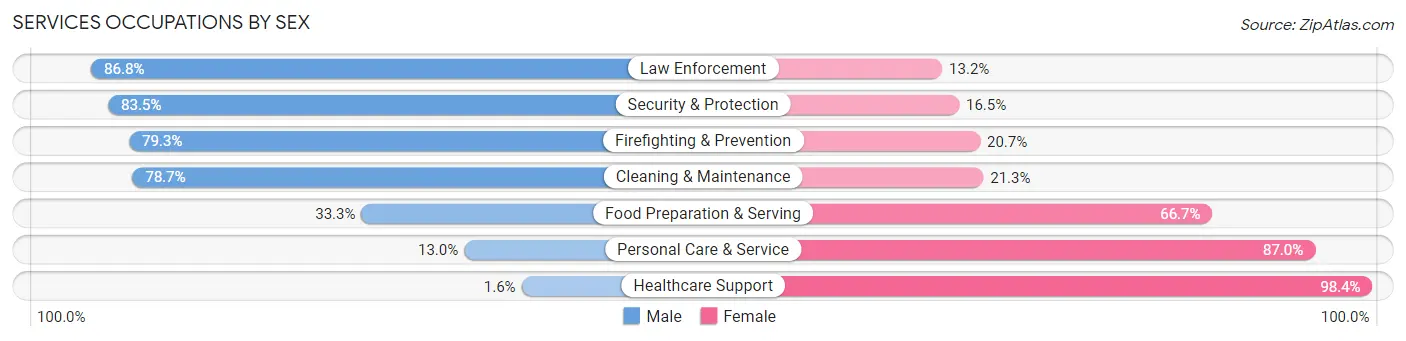
Services Occupations by Sex
Within the Services occupations in Medina, the most male-oriented occupations are Law Enforcement (86.8%), Security & Protection (83.5%), and Firefighting & Prevention (79.3%), while the most female-oriented occupations are Healthcare Support (98.4%), Personal Care & Service (87.0%), and Food Preparation & Serving (66.7%).
| Occupation | Male | Female |
| Healthcare Support | 5 (1.6%) | 305 (98.4%) |
| Security & Protection | 217 (83.5%) | 43 (16.5%) |
| Firefighting & Prevention | 92 (79.3%) | 24 (20.7%) |
| Law Enforcement | 125 (86.8%) | 19 (13.2%) |
| Food Preparation & Serving | 354 (33.3%) | 708 (66.7%) |
| Cleaning & Maintenance | 129 (78.7%) | 35 (21.3%) |
| Personal Care & Service | 44 (13.0%) | 295 (87.0%) |
| Total (Category) | 749 (35.1%) | 1,386 (64.9%) |
| Total (Overall) | 6,625 (48.9%) | 6,926 (51.1%) |
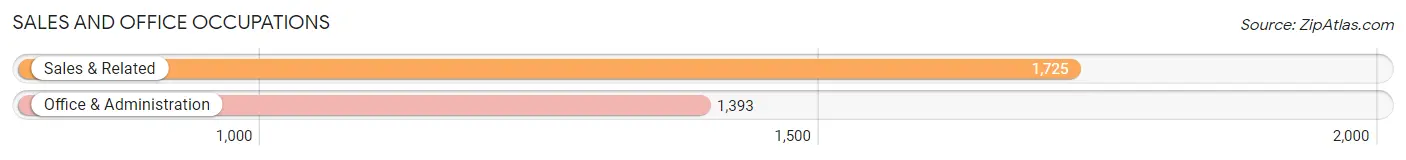
Sales and Office Occupations
The most common Sales and Office occupations in Medina are Sales & Related (1,725 | 12.7%), and Office & Administration (1,393 | 10.3%).
Sales and Office Occupations by Sex
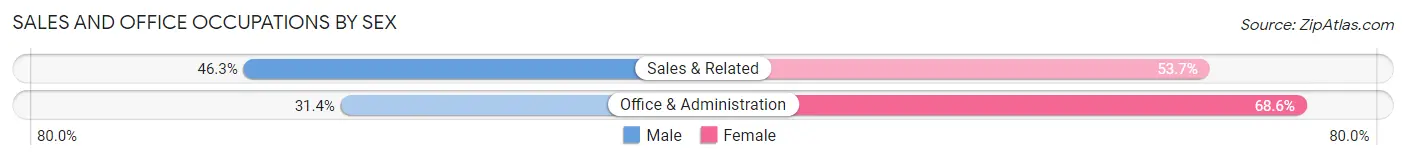
| Occupation | Male | Female |
| Sales & Related | 799 (46.3%) | 926 (53.7%) |
| Office & Administration | 437 (31.4%) | 956 (68.6%) |
| Total (Category) | 1,236 (39.6%) | 1,882 (60.4%) |
| Total (Overall) | 6,625 (48.9%) | 6,926 (51.1%) |
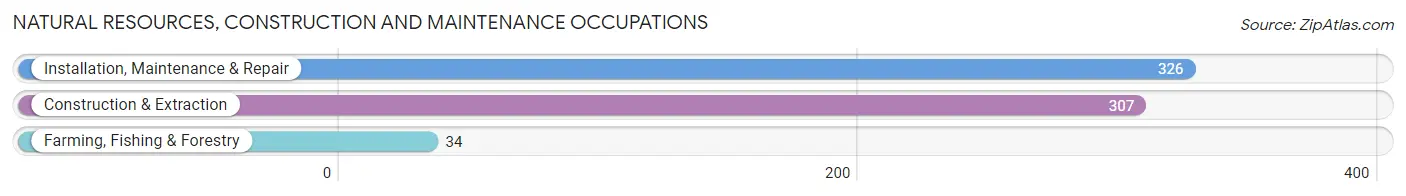
Natural Resources, Construction and Maintenance Occupations
The most common Natural Resources, Construction and Maintenance occupations in Medina are Installation, Maintenance & Repair (326 | 2.4%), Construction & Extraction (307 | 2.3%), and Farming, Fishing & Forestry (34 | 0.3%).
Natural Resources, Construction and Maintenance Occupations by Sex
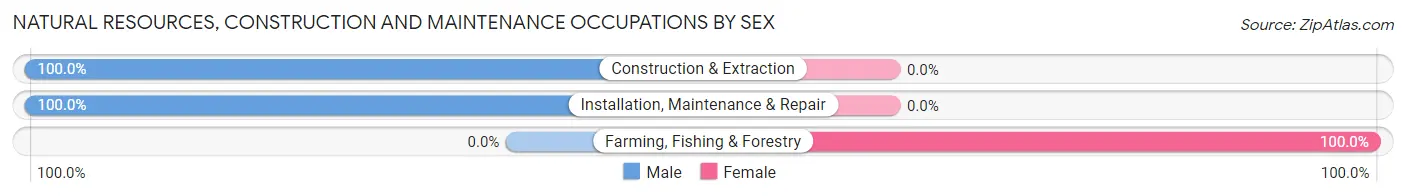
| Occupation | Male | Female |
| Farming, Fishing & Forestry | 0 (0.0%) | 34 (100.0%) |
| Construction & Extraction | 307 (100.0%) | 0 (0.0%) |
| Installation, Maintenance & Repair | 326 (100.0%) | 0 (0.0%) |
| Total (Category) | 633 (94.9%) | 34 (5.1%) |
| Total (Overall) | 6,625 (48.9%) | 6,926 (51.1%) |
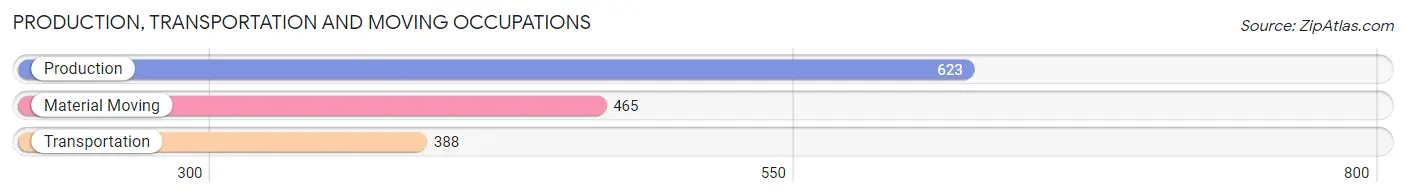
Production, Transportation and Moving Occupations
The most common Production, Transportation and Moving occupations in Medina are Production (623 | 4.6%), Material Moving (465 | 3.4%), and Transportation (388 | 2.9%).
Production, Transportation and Moving Occupations by Sex
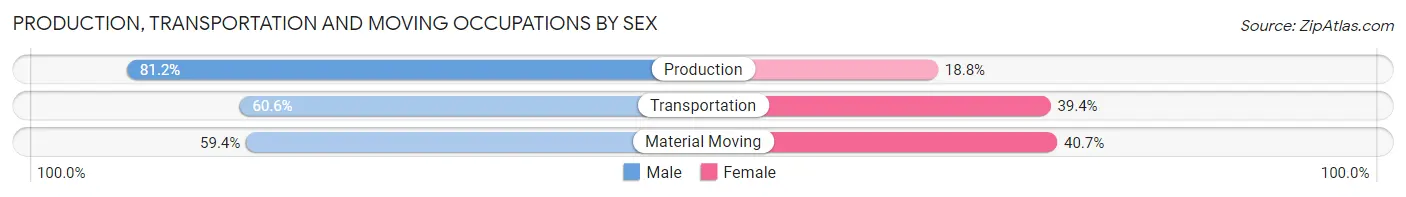
| Occupation | Male | Female |
| Production | 506 (81.2%) | 117 (18.8%) |
| Transportation | 235 (60.6%) | 153 (39.4%) |
| Material Moving | 276 (59.4%) | 189 (40.6%) |
| Total (Category) | 1,017 (68.9%) | 459 (31.1%) |
| Total (Overall) | 6,625 (48.9%) | 6,926 (51.1%) |
Employment Industries by Sex in Medina
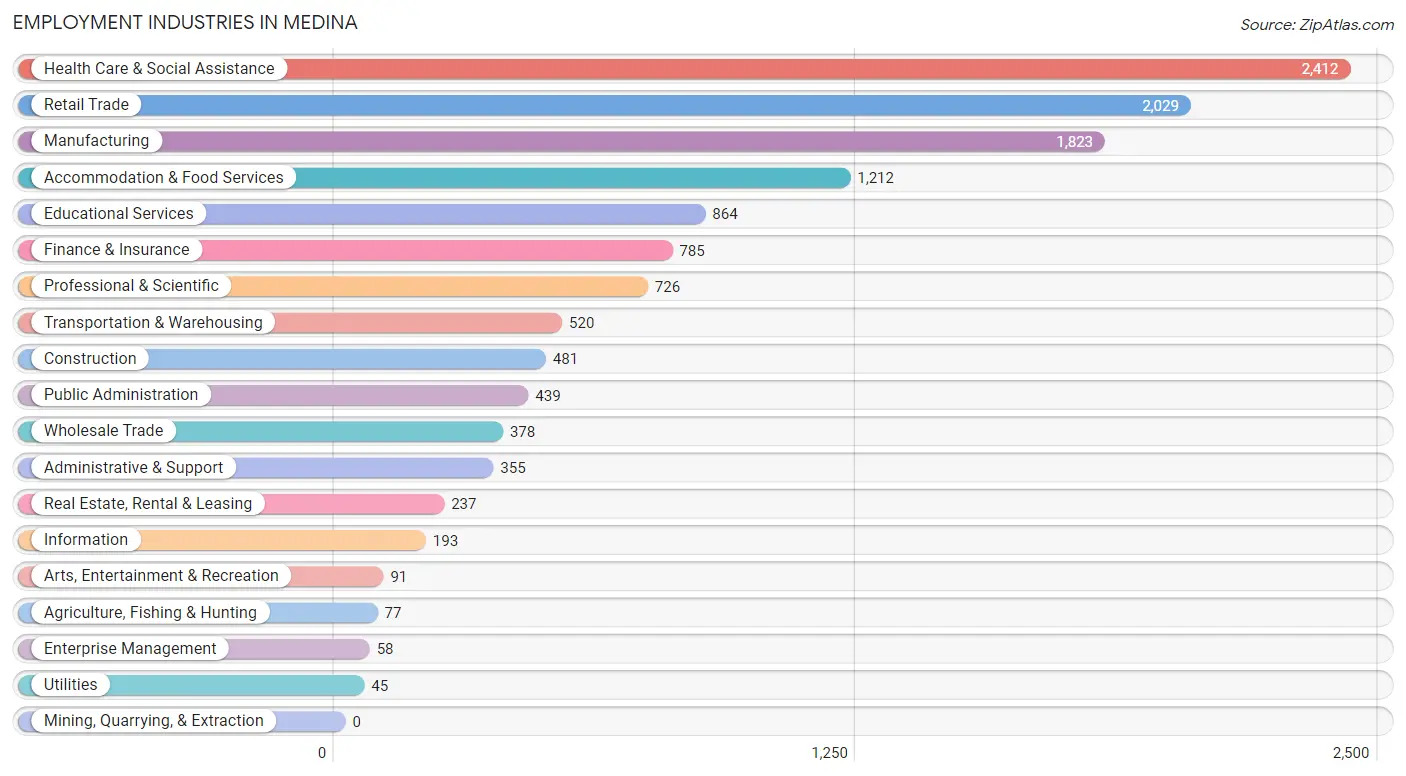
Employment Industries in Medina
The major employment industries in Medina include Health Care & Social Assistance (2,412 | 17.8%), Retail Trade (2,029 | 15.0%), Manufacturing (1,823 | 13.5%), Accommodation & Food Services (1,212 | 8.9%), and Educational Services (864 | 6.4%).
Employment Industries by Sex in Medina
The Medina industries that see more men than women are Utilities (100.0%), Construction (90.6%), and Manufacturing (77.6%), whereas the industries that tend to have a higher number of women are Health Care & Social Assistance (80.1%), Educational Services (71.9%), and Enterprise Management (67.2%).
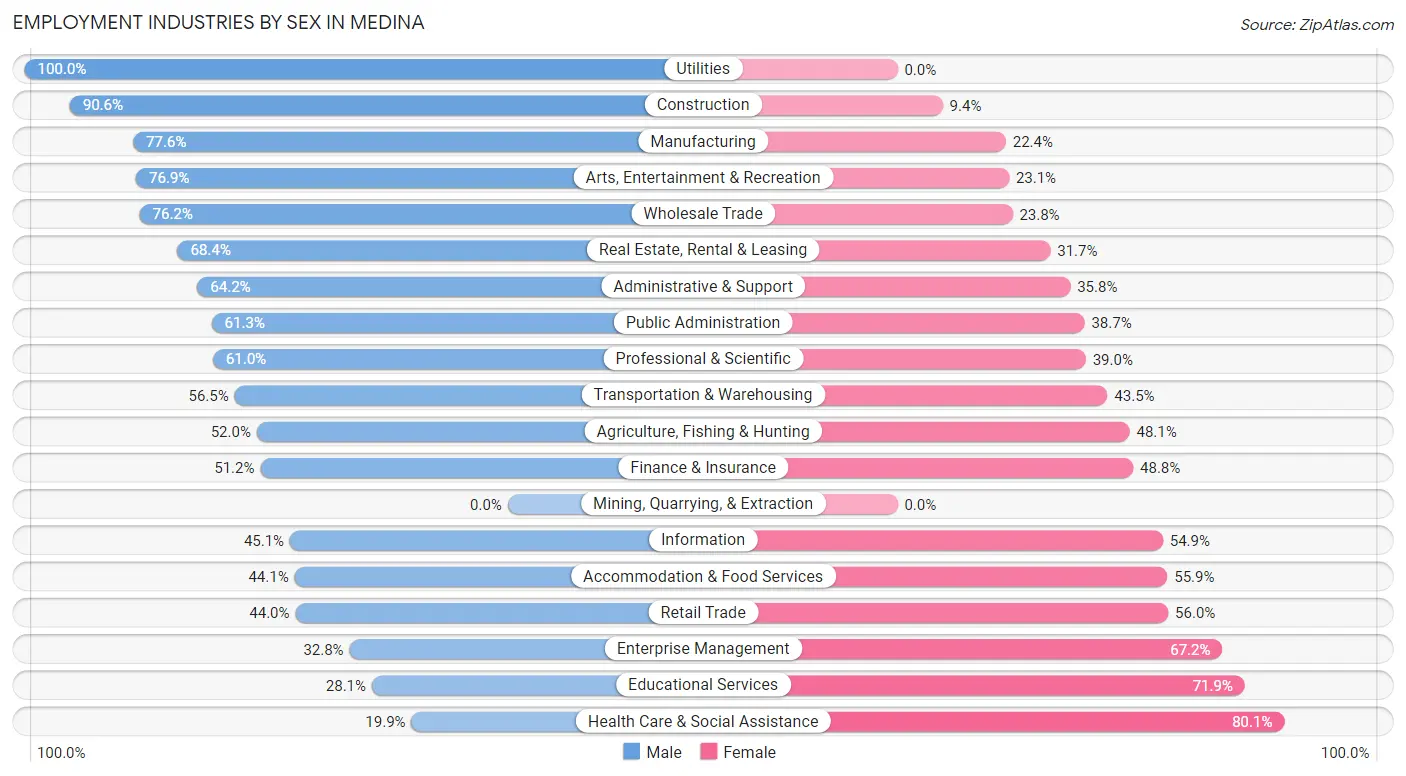
| Industry | Male | Female |
| Agriculture, Fishing & Hunting | 40 (51.9%) | 37 (48.0%) |
| Mining, Quarrying, & Extraction | 0 (0.0%) | 0 (0.0%) |
| Construction | 436 (90.6%) | 45 (9.4%) |
| Manufacturing | 1,414 (77.6%) | 409 (22.4%) |
| Wholesale Trade | 288 (76.2%) | 90 (23.8%) |
| Retail Trade | 892 (44.0%) | 1,137 (56.0%) |
| Transportation & Warehousing | 294 (56.5%) | 226 (43.5%) |
| Utilities | 45 (100.0%) | 0 (0.0%) |
| Information | 87 (45.1%) | 106 (54.9%) |
| Finance & Insurance | 402 (51.2%) | 383 (48.8%) |
| Real Estate, Rental & Leasing | 162 (68.3%) | 75 (31.7%) |
| Professional & Scientific | 443 (61.0%) | 283 (39.0%) |
| Enterprise Management | 19 (32.8%) | 39 (67.2%) |
| Administrative & Support | 228 (64.2%) | 127 (35.8%) |
| Educational Services | 243 (28.1%) | 621 (71.9%) |
| Health Care & Social Assistance | 481 (19.9%) | 1,931 (80.1%) |
| Arts, Entertainment & Recreation | 70 (76.9%) | 21 (23.1%) |
| Accommodation & Food Services | 535 (44.1%) | 677 (55.9%) |
| Public Administration | 269 (61.3%) | 170 (38.7%) |
| Total | 6,625 (48.9%) | 6,926 (51.1%) |
Education in Medina
School Enrollment in Medina
The most common levels of schooling among the 6,138 students in Medina are high school (1,559 | 25.4%), elementary school (1,249 | 20.3%), and middle school (1,242 | 20.2%).
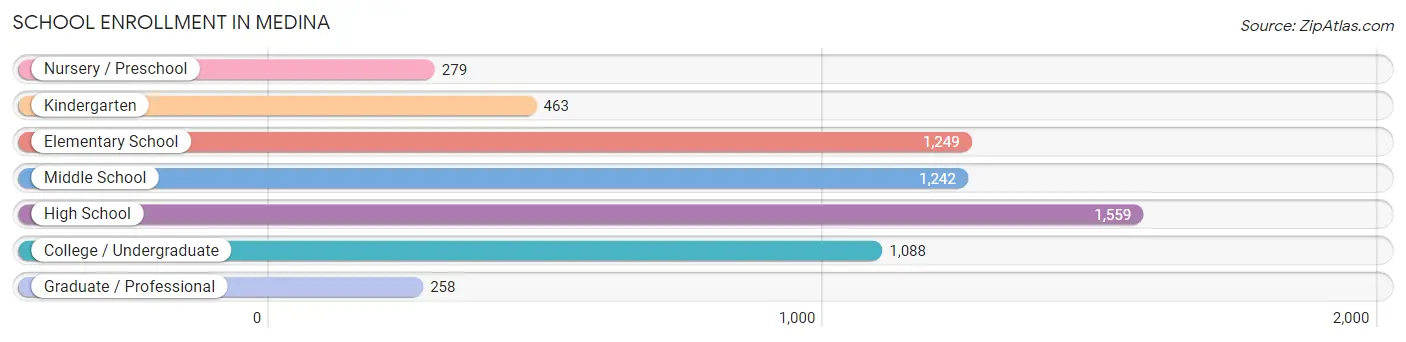
| School Level | # Students | % Students |
| Nursery / Preschool | 279 | 4.5% |
| Kindergarten | 463 | 7.5% |
| Elementary School | 1,249 | 20.3% |
| Middle School | 1,242 | 20.2% |
| High School | 1,559 | 25.4% |
| College / Undergraduate | 1,088 | 17.7% |
| Graduate / Professional | 258 | 4.2% |
| Total | 6,138 | 100.0% |
School Enrollment by Age by Funding Source in Medina
Out of a total of 6,138 students who are enrolled in schools in Medina, 890 (14.5%) attend a private institution, while the remaining 5,248 (85.5%) are enrolled in public schools. The age group of 25 to 34 year olds has the highest likelihood of being enrolled in private schools, with 134 (32.3% in the age bracket) enrolled. Conversely, the age group of 18 to 19 year olds has the lowest likelihood of being enrolled in a private school, with 566 (94.0% in the age bracket) attending a public institution.
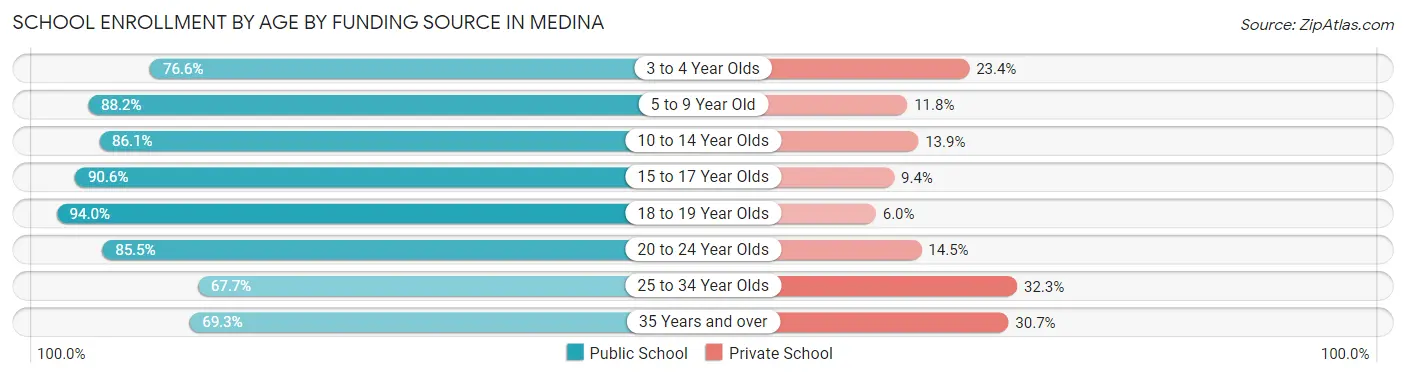
| Age Bracket | Public School | Private School |
| 3 to 4 Year Olds | 154 (76.6%) | 47 (23.4%) |
| 5 to 9 Year Old | 1,362 (88.2%) | 183 (11.8%) |
| 10 to 14 Year Olds | 1,500 (86.1%) | 242 (13.9%) |
| 15 to 17 Year Olds | 772 (90.6%) | 80 (9.4%) |
| 18 to 19 Year Olds | 566 (94.0%) | 36 (6.0%) |
| 20 to 24 Year Olds | 378 (85.5%) | 64 (14.5%) |
| 25 to 34 Year Olds | 281 (67.7%) | 134 (32.3%) |
| 35 Years and over | 235 (69.3%) | 104 (30.7%) |
| Total | 5,248 (85.5%) | 890 (14.5%) |
Educational Attainment by Field of Study in Medina
Business (1,235 | 18.0%), education (1,068 | 15.6%), science & technology (832 | 12.1%), engineering (545 | 7.9%), and computers & mathematics (495 | 7.2%) are the most common fields of study among 6,865 individuals in Medina who have obtained a bachelor's degree or higher.
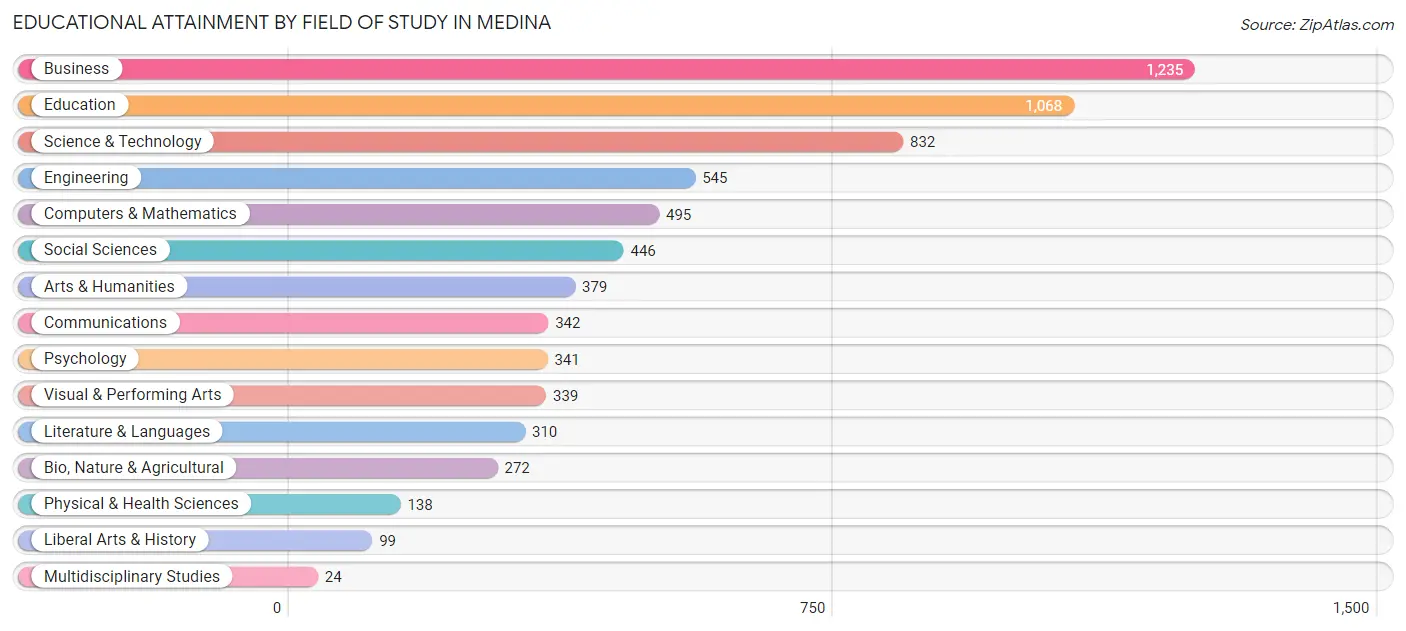
| Field of Study | # Graduates | % Graduates |
| Computers & Mathematics | 495 | 7.2% |
| Bio, Nature & Agricultural | 272 | 4.0% |
| Physical & Health Sciences | 138 | 2.0% |
| Psychology | 341 | 5.0% |
| Social Sciences | 446 | 6.5% |
| Engineering | 545 | 7.9% |
| Multidisciplinary Studies | 24 | 0.4% |
| Science & Technology | 832 | 12.1% |
| Business | 1,235 | 18.0% |
| Education | 1,068 | 15.6% |
| Literature & Languages | 310 | 4.5% |
| Liberal Arts & History | 99 | 1.4% |
| Visual & Performing Arts | 339 | 4.9% |
| Communications | 342 | 5.0% |
| Arts & Humanities | 379 | 5.5% |
| Total | 6,865 | 100.0% |
Transportation & Commute in Medina
Vehicle Availability by Sex in Medina
The most prevalent vehicle ownership categories in Medina are males with 2 vehicles (3,269, accounting for 50.0%) and females with 2 vehicles (2,899, making up 47.8%).
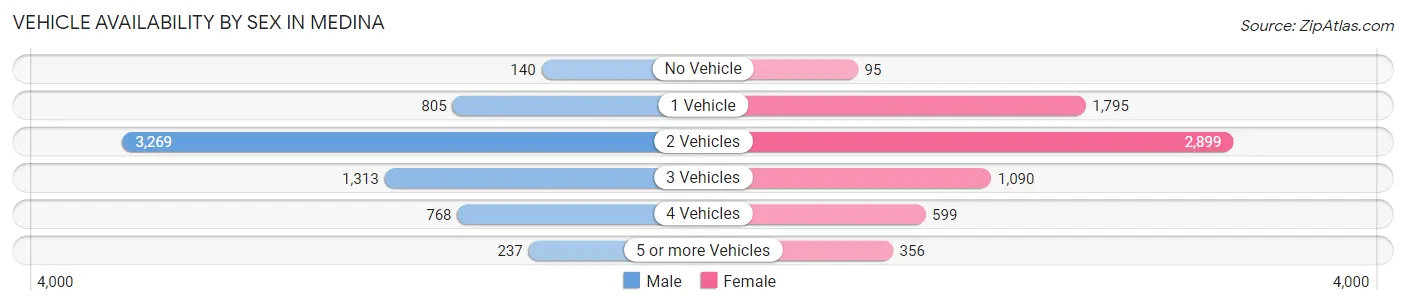
| Vehicles Available | Male | Female |
| No Vehicle | 140 (2.1%) | 95 (1.4%) |
| 1 Vehicle | 805 (12.3%) | 1,795 (26.3%) |
| 2 Vehicles | 3,269 (50.0%) | 2,899 (42.4%) |
| 3 Vehicles | 1,313 (20.1%) | 1,090 (16.0%) |
| 4 Vehicles | 768 (11.8%) | 599 (8.8%) |
| 5 or more Vehicles | 237 (3.6%) | 356 (5.2%) |
| Total | 6,532 (100.0%) | 6,834 (100.0%) |
Commute Time in Medina
The most frequently occuring commute durations in Medina are 10 to 14 minutes (2,086 commuters, 17.5%), 5 to 9 minutes (1,720 commuters, 14.4%), and 45 to 59 minutes (1,408 commuters, 11.8%).
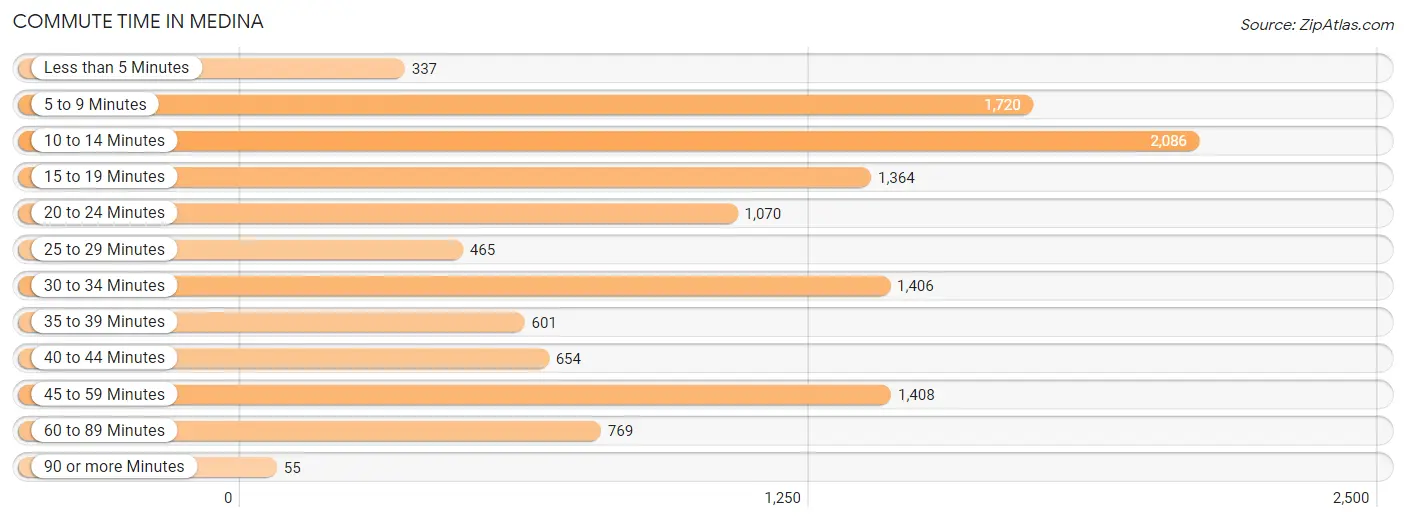
| Commute Time | # Commuters | % Commuters |
| Less than 5 Minutes | 337 | 2.8% |
| 5 to 9 Minutes | 1,720 | 14.4% |
| 10 to 14 Minutes | 2,086 | 17.5% |
| 15 to 19 Minutes | 1,364 | 11.4% |
| 20 to 24 Minutes | 1,070 | 9.0% |
| 25 to 29 Minutes | 465 | 3.9% |
| 30 to 34 Minutes | 1,406 | 11.8% |
| 35 to 39 Minutes | 601 | 5.0% |
| 40 to 44 Minutes | 654 | 5.5% |
| 45 to 59 Minutes | 1,408 | 11.8% |
| 60 to 89 Minutes | 769 | 6.4% |
| 90 or more Minutes | 55 | 0.5% |
Commute Time by Sex in Medina
The most common commute times in Medina are 45 to 59 minutes (924 commuters, 15.9%) for males and 10 to 14 minutes (1,247 commuters, 20.4%) for females.
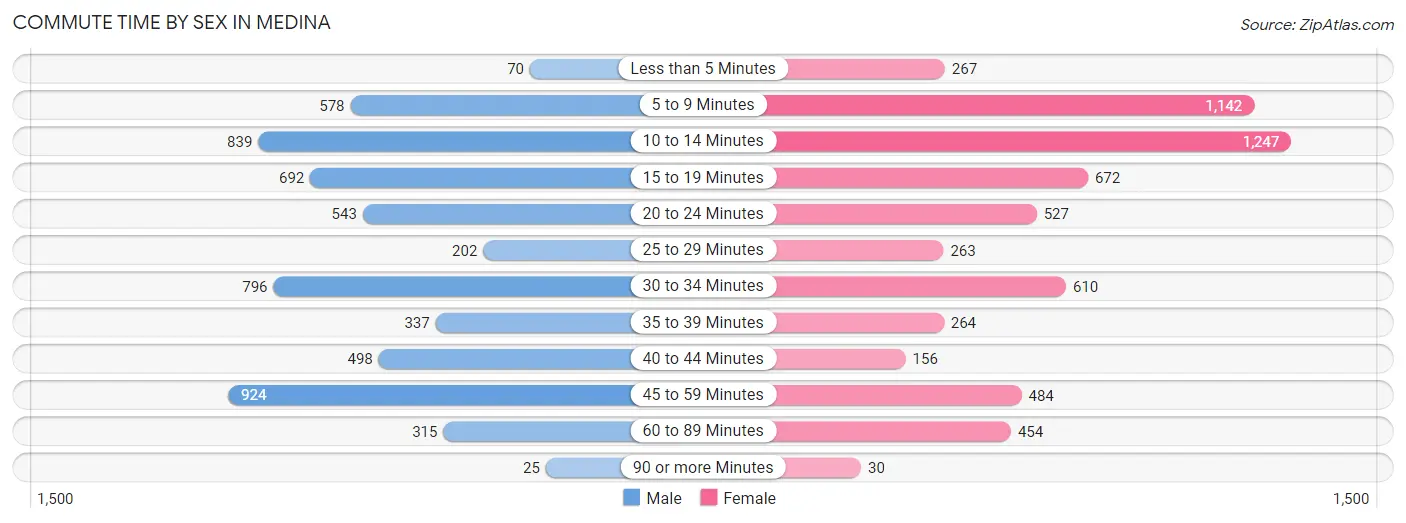
| Commute Time | Male | Female |
| Less than 5 Minutes | 70 (1.2%) | 267 (4.4%) |
| 5 to 9 Minutes | 578 (9.9%) | 1,142 (18.7%) |
| 10 to 14 Minutes | 839 (14.4%) | 1,247 (20.4%) |
| 15 to 19 Minutes | 692 (11.9%) | 672 (11.0%) |
| 20 to 24 Minutes | 543 (9.3%) | 527 (8.6%) |
| 25 to 29 Minutes | 202 (3.5%) | 263 (4.3%) |
| 30 to 34 Minutes | 796 (13.7%) | 610 (10.0%) |
| 35 to 39 Minutes | 337 (5.8%) | 264 (4.3%) |
| 40 to 44 Minutes | 498 (8.6%) | 156 (2.5%) |
| 45 to 59 Minutes | 924 (15.9%) | 484 (7.9%) |
| 60 to 89 Minutes | 315 (5.4%) | 454 (7.4%) |
| 90 or more Minutes | 25 (0.4%) | 30 (0.5%) |
Time of Departure to Work by Sex in Medina
The most frequent times of departure to work in Medina are 7:00 AM to 7:29 AM (989, 17.0%) for males and 7:00 AM to 7:29 AM (1,272, 20.8%) for females.
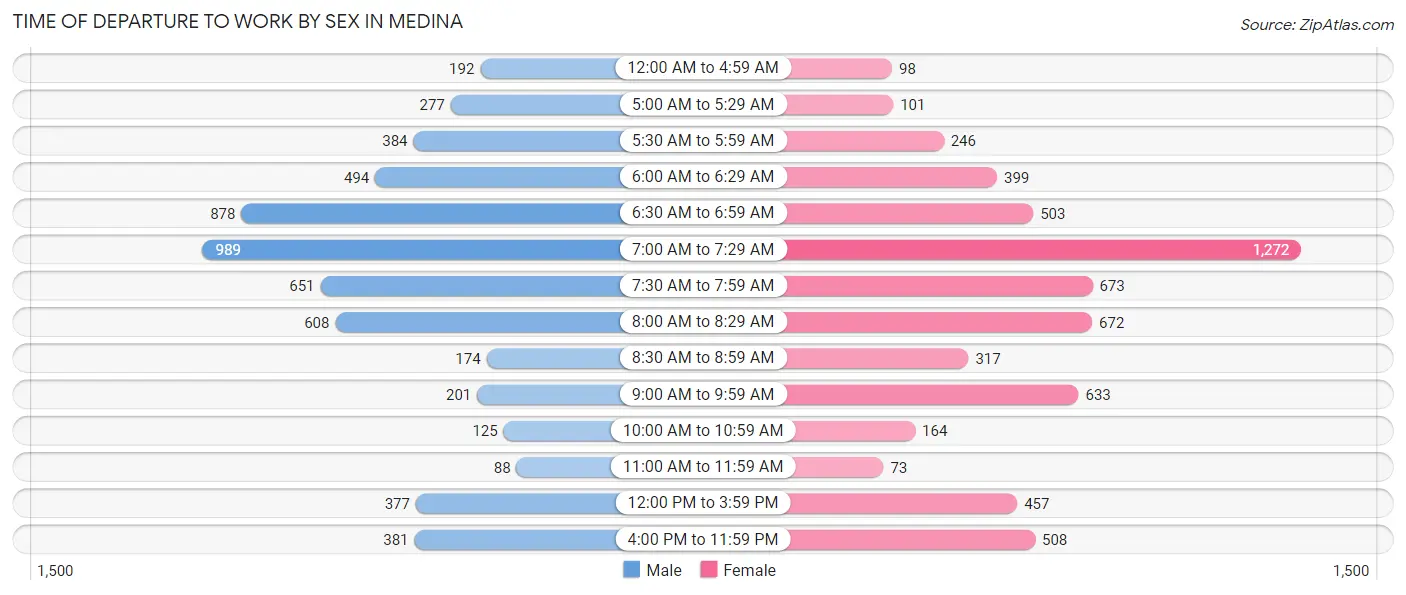
| Time of Departure | Male | Female |
| 12:00 AM to 4:59 AM | 192 (3.3%) | 98 (1.6%) |
| 5:00 AM to 5:29 AM | 277 (4.8%) | 101 (1.7%) |
| 5:30 AM to 5:59 AM | 384 (6.6%) | 246 (4.0%) |
| 6:00 AM to 6:29 AM | 494 (8.5%) | 399 (6.5%) |
| 6:30 AM to 6:59 AM | 878 (15.1%) | 503 (8.2%) |
| 7:00 AM to 7:29 AM | 989 (17.0%) | 1,272 (20.8%) |
| 7:30 AM to 7:59 AM | 651 (11.2%) | 673 (11.0%) |
| 8:00 AM to 8:29 AM | 608 (10.4%) | 672 (11.0%) |
| 8:30 AM to 8:59 AM | 174 (3.0%) | 317 (5.2%) |
| 9:00 AM to 9:59 AM | 201 (3.5%) | 633 (10.3%) |
| 10:00 AM to 10:59 AM | 125 (2.1%) | 164 (2.7%) |
| 11:00 AM to 11:59 AM | 88 (1.5%) | 73 (1.2%) |
| 12:00 PM to 3:59 PM | 377 (6.5%) | 457 (7.5%) |
| 4:00 PM to 11:59 PM | 381 (6.6%) | 508 (8.3%) |
| Total | 5,819 (100.0%) | 6,116 (100.0%) |
Housing Occupancy in Medina
Occupancy by Ownership in Medina
Of the total 10,620 dwellings in Medina, owner-occupied units account for 7,357 (69.3%), while renter-occupied units make up 3,263 (30.7%).
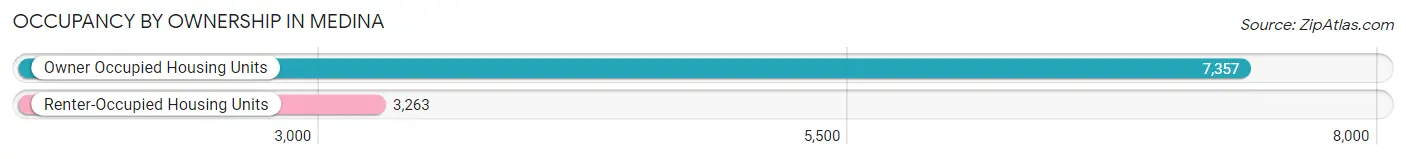
| Occupancy | # Housing Units | % Housing Units |
| Owner Occupied Housing Units | 7,357 | 69.3% |
| Renter-Occupied Housing Units | 3,263 | 30.7% |
| Total Occupied Housing Units | 10,620 | 100.0% |
Occupancy by Household Size in Medina
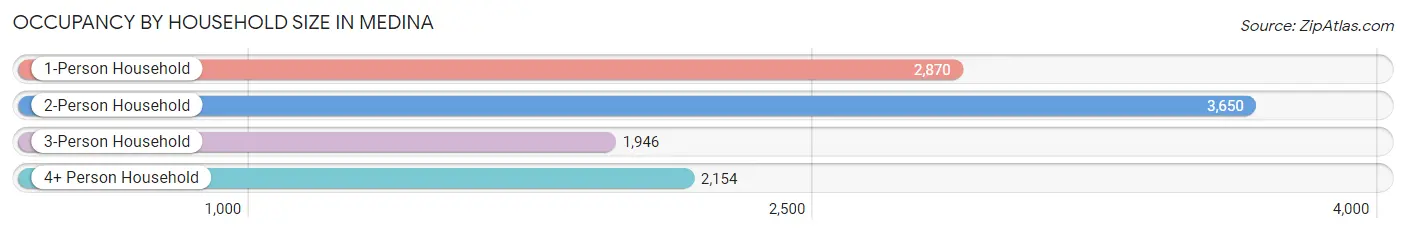
| Household Size | # Housing Units | % Housing Units |
| 1-Person Household | 2,870 | 27.0% |
| 2-Person Household | 3,650 | 34.4% |
| 3-Person Household | 1,946 | 18.3% |
| 4+ Person Household | 2,154 | 20.3% |
| Total Housing Units | 10,620 | 100.0% |
Occupancy by Ownership by Household Size in Medina
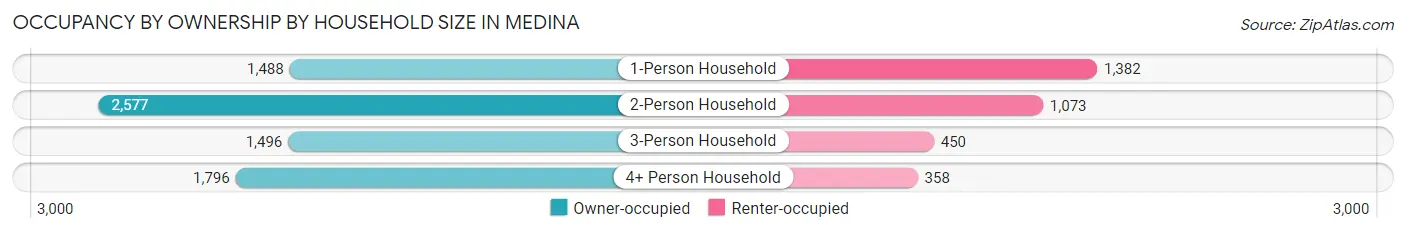
| Household Size | Owner-occupied | Renter-occupied |
| 1-Person Household | 1,488 (51.8%) | 1,382 (48.1%) |
| 2-Person Household | 2,577 (70.6%) | 1,073 (29.4%) |
| 3-Person Household | 1,496 (76.9%) | 450 (23.1%) |
| 4+ Person Household | 1,796 (83.4%) | 358 (16.6%) |
| Total Housing Units | 7,357 (69.3%) | 3,263 (30.7%) |
Occupancy by Educational Attainment in Medina
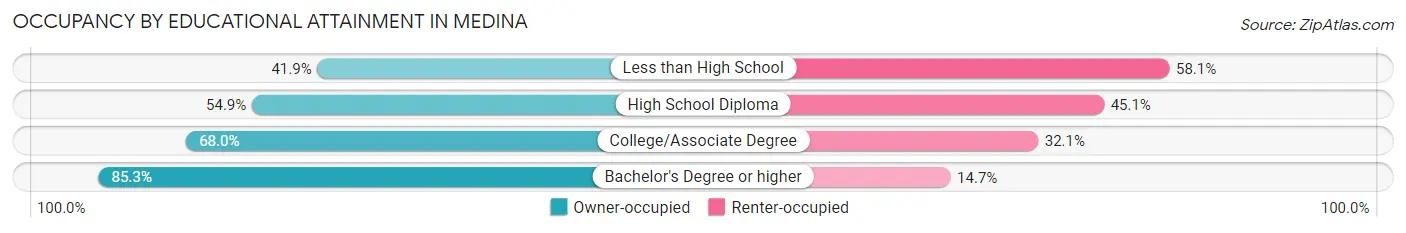
| Household Size | Owner-occupied | Renter-occupied |
| Less than High School | 161 (41.9%) | 223 (58.1%) |
| High School Diploma | 1,723 (54.9%) | 1,416 (45.1%) |
| College/Associate Degree | 2,279 (67.9%) | 1,075 (32.1%) |
| Bachelor's Degree or higher | 3,194 (85.3%) | 549 (14.7%) |
Occupancy by Age of Householder in Medina
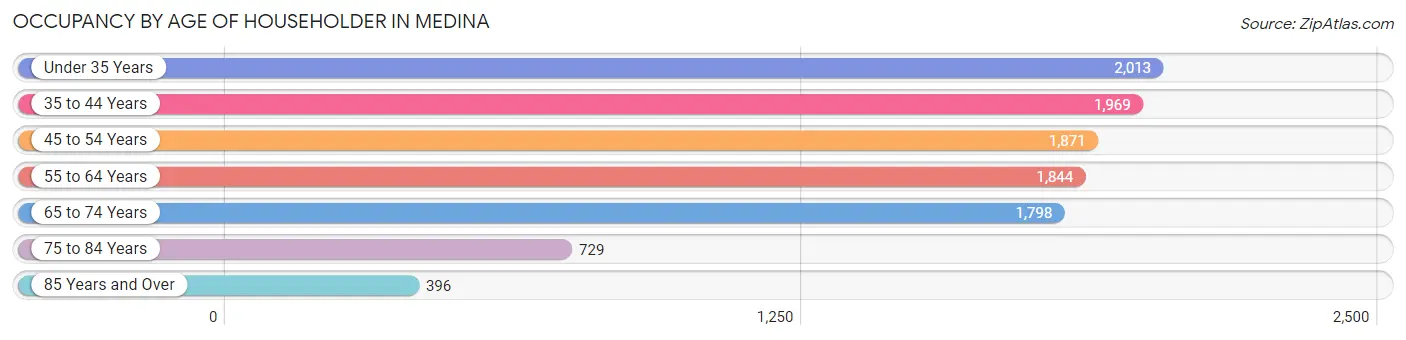
| Age Bracket | # Households | % Households |
| Under 35 Years | 2,013 | 19.0% |
| 35 to 44 Years | 1,969 | 18.5% |
| 45 to 54 Years | 1,871 | 17.6% |
| 55 to 64 Years | 1,844 | 17.4% |
| 65 to 74 Years | 1,798 | 16.9% |
| 75 to 84 Years | 729 | 6.9% |
| 85 Years and Over | 396 | 3.7% |
| Total | 10,620 | 100.0% |
Housing Finances in Medina
Median Income by Occupancy in Medina
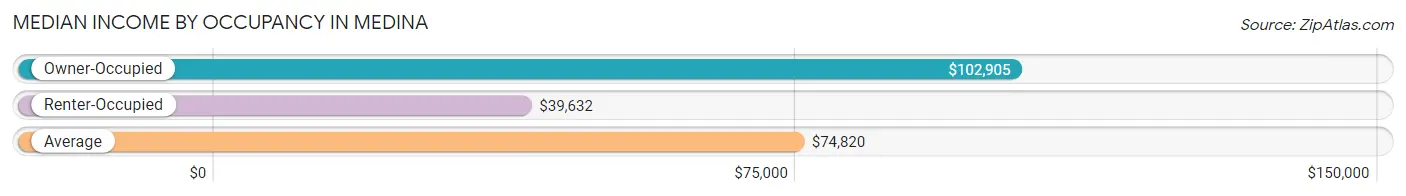
| Occupancy Type | # Households | Median Income |
| Owner-Occupied | 7,357 (69.3%) | $102,905 |
| Renter-Occupied | 3,263 (30.7%) | $39,632 |
| Average | 10,620 (100.0%) | $74,820 |
Occupancy by Householder Income Bracket in Medina
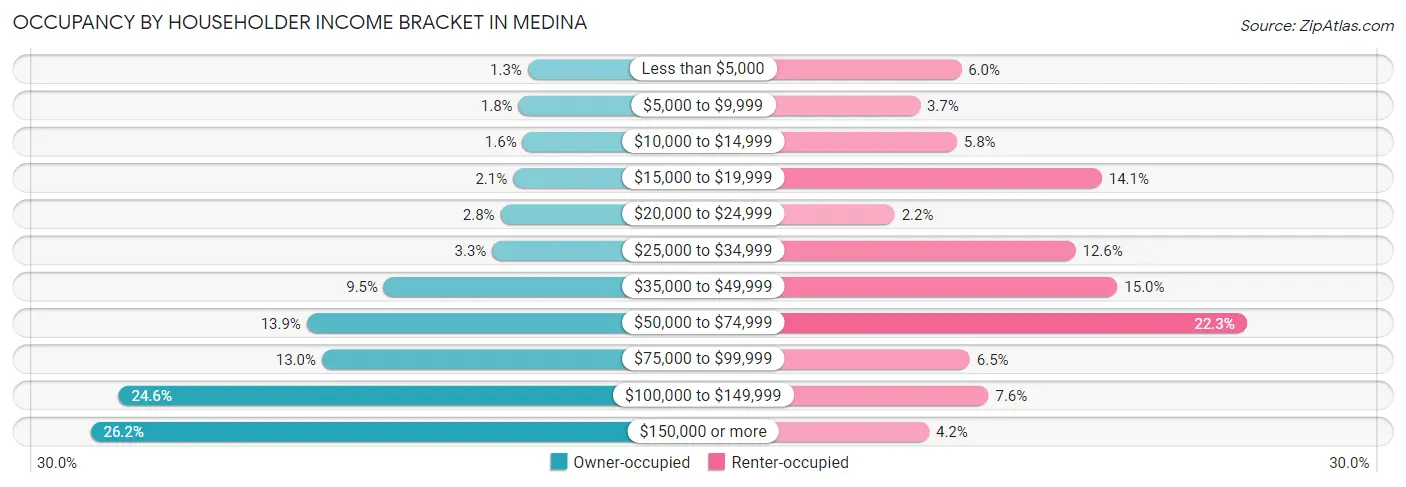
| Income Bracket | Owner-occupied | Renter-occupied |
| Less than $5,000 | 92 (1.3%) | 197 (6.0%) |
| $5,000 to $9,999 | 131 (1.8%) | 120 (3.7%) |
| $10,000 to $14,999 | 114 (1.5%) | 189 (5.8%) |
| $15,000 to $19,999 | 154 (2.1%) | 459 (14.1%) |
| $20,000 to $24,999 | 207 (2.8%) | 73 (2.2%) |
| $25,000 to $34,999 | 241 (3.3%) | 410 (12.6%) |
| $35,000 to $49,999 | 697 (9.5%) | 488 (15.0%) |
| $50,000 to $74,999 | 1,021 (13.9%) | 729 (22.3%) |
| $75,000 to $99,999 | 958 (13.0%) | 213 (6.5%) |
| $100,000 to $149,999 | 1,812 (24.6%) | 248 (7.6%) |
| $150,000 or more | 1,930 (26.2%) | 137 (4.2%) |
| Total | 7,357 (100.0%) | 3,263 (100.0%) |
Monthly Housing Cost Tiers in Medina
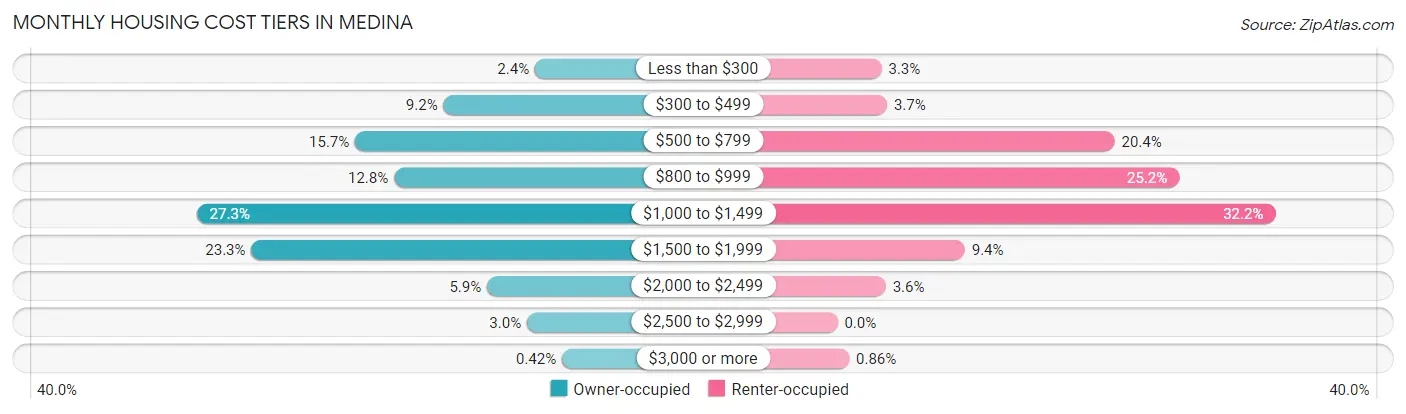
| Monthly Cost | Owner-occupied | Renter-occupied |
| Less than $300 | 177 (2.4%) | 106 (3.3%) |
| $300 to $499 | 673 (9.1%) | 119 (3.6%) |
| $500 to $799 | 1,152 (15.7%) | 666 (20.4%) |
| $800 to $999 | 941 (12.8%) | 821 (25.2%) |
| $1,000 to $1,499 | 2,011 (27.3%) | 1,052 (32.2%) |
| $1,500 to $1,999 | 1,714 (23.3%) | 306 (9.4%) |
| $2,000 to $2,499 | 437 (5.9%) | 116 (3.6%) |
| $2,500 to $2,999 | 221 (3.0%) | 0 (0.0%) |
| $3,000 or more | 31 (0.4%) | 28 (0.9%) |
| Total | 7,357 (100.0%) | 3,263 (100.0%) |
Physical Housing Characteristics in Medina
Housing Structures in Medina
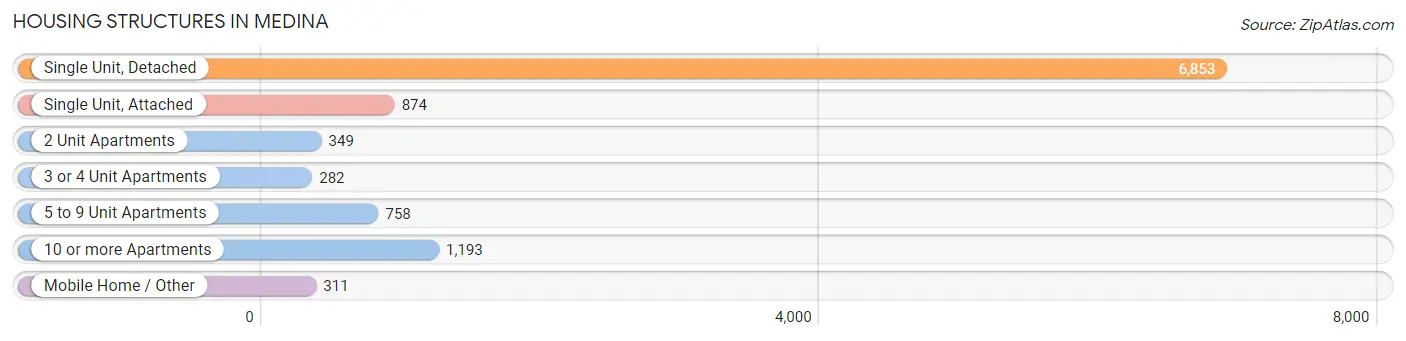
| Structure Type | # Housing Units | % Housing Units |
| Single Unit, Detached | 6,853 | 64.5% |
| Single Unit, Attached | 874 | 8.2% |
| 2 Unit Apartments | 349 | 3.3% |
| 3 or 4 Unit Apartments | 282 | 2.7% |
| 5 to 9 Unit Apartments | 758 | 7.1% |
| 10 or more Apartments | 1,193 | 11.2% |
| Mobile Home / Other | 311 | 2.9% |
| Total | 10,620 | 100.0% |
Housing Structures by Occupancy in Medina
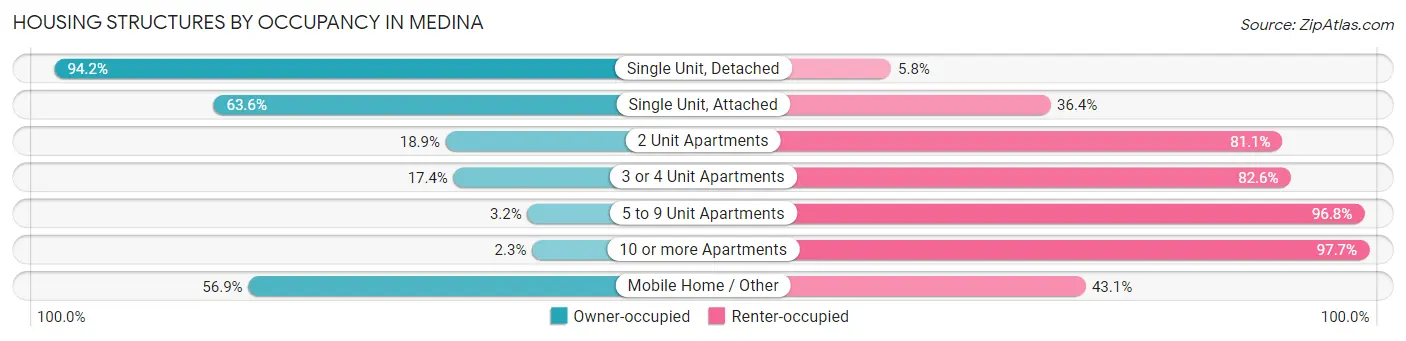
| Structure Type | Owner-occupied | Renter-occupied |
| Single Unit, Detached | 6,458 (94.2%) | 395 (5.8%) |
| Single Unit, Attached | 556 (63.6%) | 318 (36.4%) |
| 2 Unit Apartments | 66 (18.9%) | 283 (81.1%) |
| 3 or 4 Unit Apartments | 49 (17.4%) | 233 (82.6%) |
| 5 to 9 Unit Apartments | 24 (3.2%) | 734 (96.8%) |
| 10 or more Apartments | 27 (2.3%) | 1,166 (97.7%) |
| Mobile Home / Other | 177 (56.9%) | 134 (43.1%) |
| Total | 7,357 (69.3%) | 3,263 (30.7%) |
Housing Structures by Number of Rooms in Medina
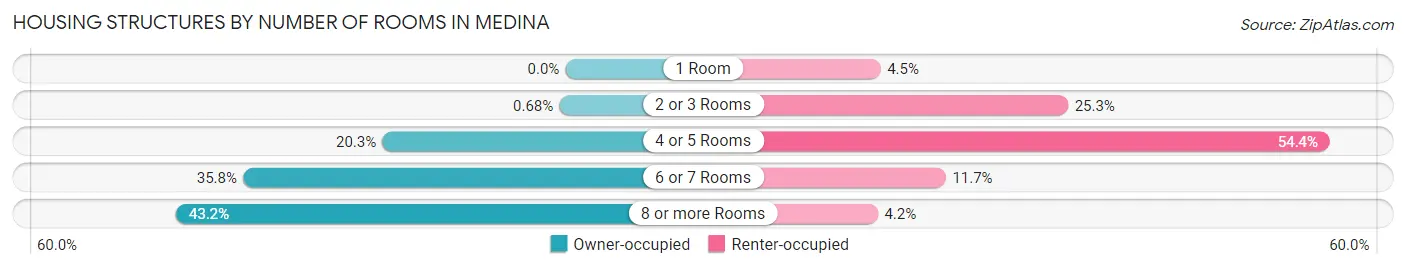
| Number of Rooms | Owner-occupied | Renter-occupied |
| 1 Room | 0 (0.0%) | 146 (4.5%) |
| 2 or 3 Rooms | 50 (0.7%) | 825 (25.3%) |
| 4 or 5 Rooms | 1,496 (20.3%) | 1,774 (54.4%) |
| 6 or 7 Rooms | 2,632 (35.8%) | 382 (11.7%) |
| 8 or more Rooms | 3,179 (43.2%) | 136 (4.2%) |
| Total | 7,357 (100.0%) | 3,263 (100.0%) |
Housing Structure by Heating Type in Medina
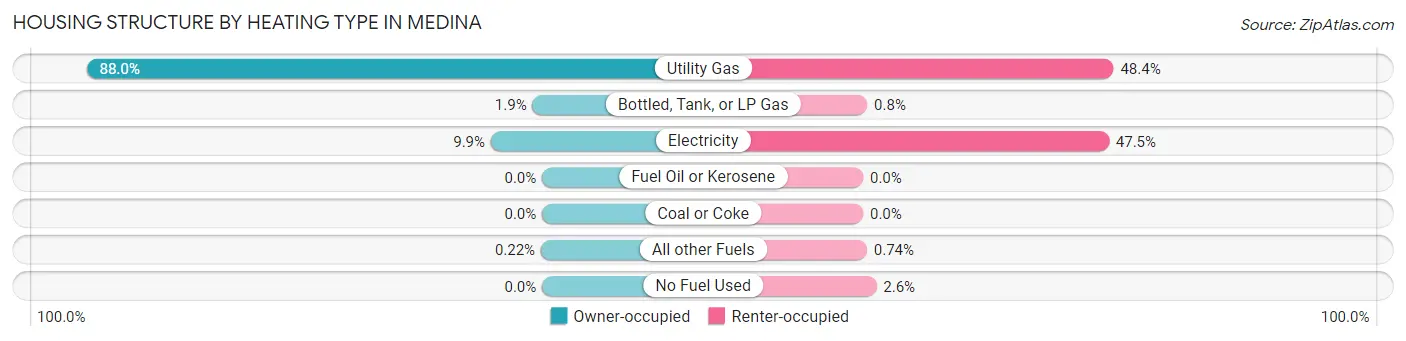
| Heating Type | Owner-occupied | Renter-occupied |
| Utility Gas | 6,476 (88.0%) | 1,579 (48.4%) |
| Bottled, Tank, or LP Gas | 137 (1.9%) | 26 (0.8%) |
| Electricity | 728 (9.9%) | 1,550 (47.5%) |
| Fuel Oil or Kerosene | 0 (0.0%) | 0 (0.0%) |
| Coal or Coke | 0 (0.0%) | 0 (0.0%) |
| All other Fuels | 16 (0.2%) | 24 (0.7%) |
| No Fuel Used | 0 (0.0%) | 84 (2.6%) |
| Total | 7,357 (100.0%) | 3,263 (100.0%) |
Household Vehicle Usage in Medina
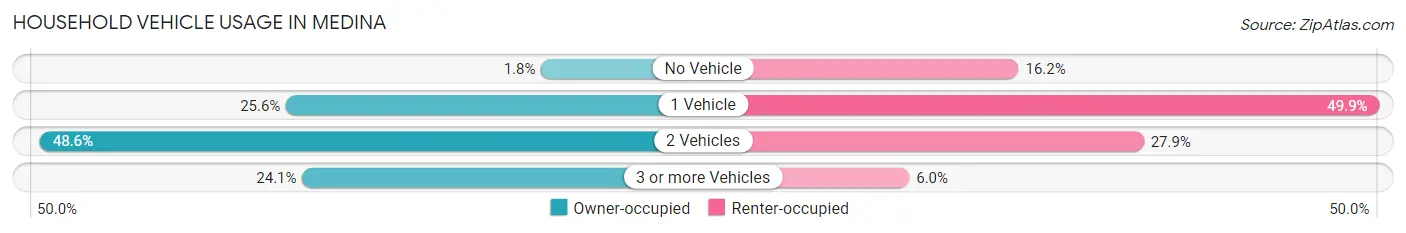
| Vehicles per Household | Owner-occupied | Renter-occupied |
| No Vehicle | 130 (1.8%) | 529 (16.2%) |
| 1 Vehicle | 1,882 (25.6%) | 1,628 (49.9%) |
| 2 Vehicles | 3,574 (48.6%) | 910 (27.9%) |
| 3 or more Vehicles | 1,771 (24.1%) | 196 (6.0%) |
| Total | 7,357 (100.0%) | 3,263 (100.0%) |
Real Estate & Mortgages in Medina
Real Estate and Mortgage Overview in Medina
| Characteristic | Without Mortgage | With Mortgage |
| Housing Units | 2,129 | 5,228 |
| Median Property Value | $204,700 | $213,000 |
| Median Household Income | $76,158 | $1,422 |
| Monthly Housing Costs | $542 | $31 |
| Real Estate Taxes | $2,796 | $51 |
Property Value by Mortgage Status in Medina
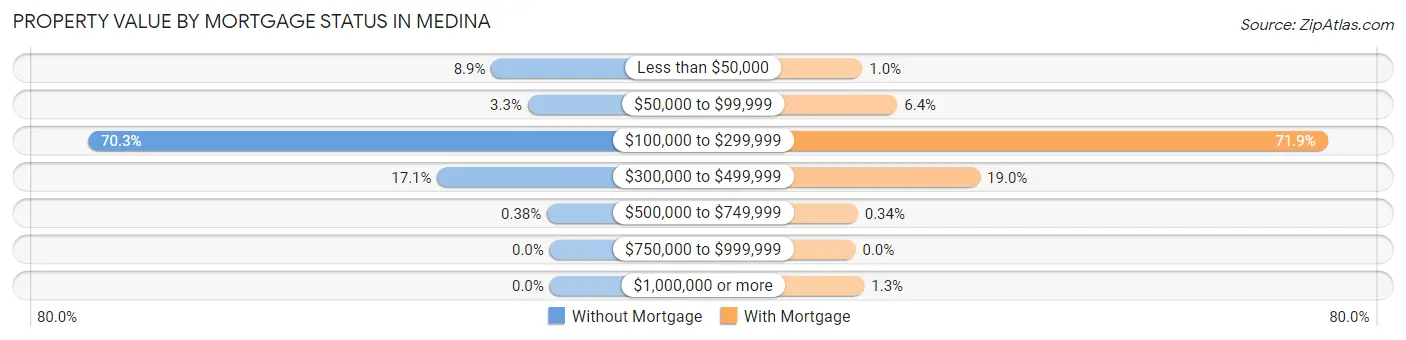
| Property Value | Without Mortgage | With Mortgage |
| Less than $50,000 | 189 (8.9%) | 54 (1.0%) |
| $50,000 to $99,999 | 71 (3.3%) | 333 (6.4%) |
| $100,000 to $299,999 | 1,497 (70.3%) | 3,760 (71.9%) |
| $300,000 to $499,999 | 364 (17.1%) | 993 (19.0%) |
| $500,000 to $749,999 | 8 (0.4%) | 18 (0.3%) |
| $750,000 to $999,999 | 0 (0.0%) | 0 (0.0%) |
| $1,000,000 or more | 0 (0.0%) | 70 (1.3%) |
| Total | 2,129 (100.0%) | 5,228 (100.0%) |
Household Income by Mortgage Status in Medina
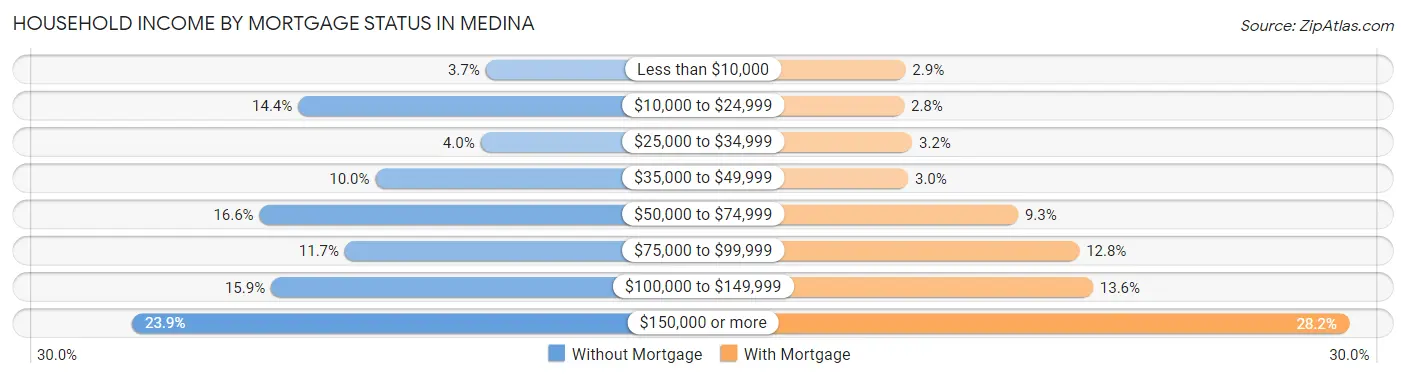
| Household Income | Without Mortgage | With Mortgage |
| Less than $10,000 | 78 (3.7%) | 149 (2.9%) |
| $10,000 to $24,999 | 306 (14.4%) | 145 (2.8%) |
| $25,000 to $34,999 | 84 (4.0%) | 169 (3.2%) |
| $35,000 to $49,999 | 212 (10.0%) | 157 (3.0%) |
| $50,000 to $74,999 | 353 (16.6%) | 485 (9.3%) |
| $75,000 to $99,999 | 249 (11.7%) | 668 (12.8%) |
| $100,000 to $149,999 | 339 (15.9%) | 709 (13.6%) |
| $150,000 or more | 508 (23.9%) | 1,473 (28.2%) |
| Total | 2,129 (100.0%) | 5,228 (100.0%) |
Property Value to Household Income Ratio in Medina
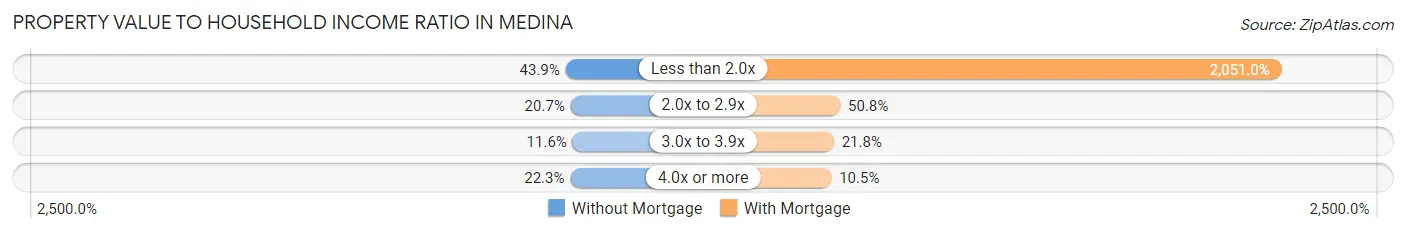
| Value-to-Income Ratio | Without Mortgage | With Mortgage |
| Less than 2.0x | 935 (43.9%) | 107,226 (2,051.0%) |
| 2.0x to 2.9x | 441 (20.7%) | 2,656 (50.8%) |
| 3.0x to 3.9x | 246 (11.6%) | 1,140 (21.8%) |
| 4.0x or more | 474 (22.3%) | 548 (10.5%) |
| Total | 2,129 (100.0%) | 5,228 (100.0%) |
Real Estate Taxes by Mortgage Status in Medina
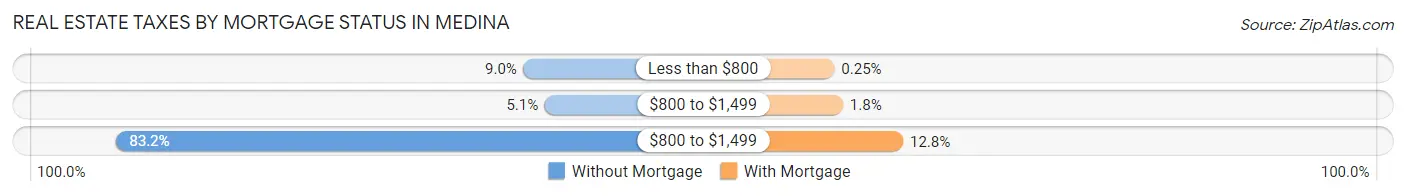
| Property Taxes | Without Mortgage | With Mortgage |
| Less than $800 | 192 (9.0%) | 13 (0.3%) |
| $800 to $1,499 | 109 (5.1%) | 94 (1.8%) |
| $800 to $1,499 | 1,772 (83.2%) | 668 (12.8%) |
| Total | 2,129 (100.0%) | 5,228 (100.0%) |
Health & Disability in Medina
Health Insurance Coverage by Age in Medina
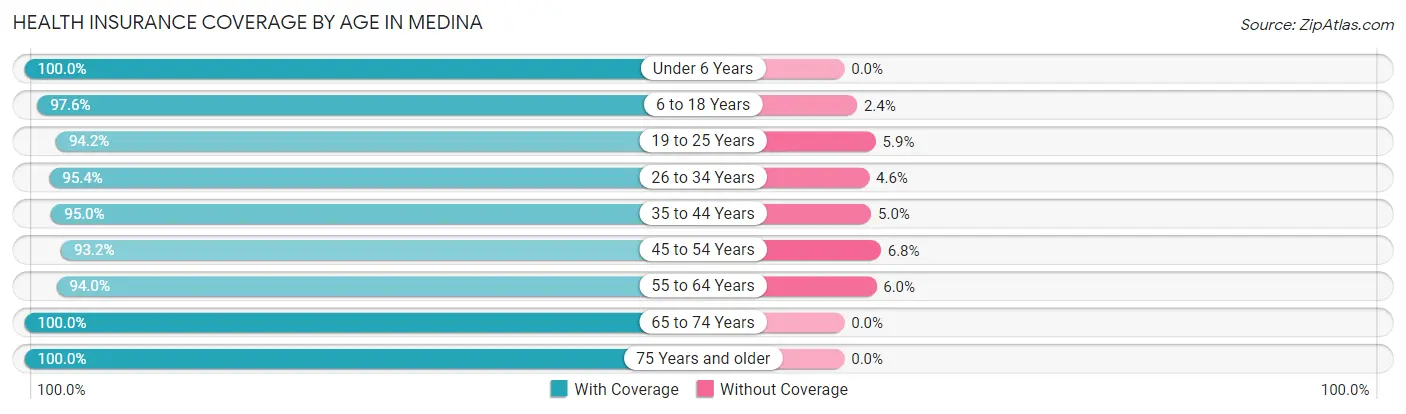
| Age Bracket | With Coverage | Without Coverage |
| Under 6 Years | 1,917 (100.0%) | 0 (0.0%) |
| 6 to 18 Years | 4,519 (97.6%) | 109 (2.4%) |
| 19 to 25 Years | 1,578 (94.2%) | 98 (5.9%) |
| 26 to 34 Years | 2,655 (95.4%) | 129 (4.6%) |
| 35 to 44 Years | 3,442 (95.0%) | 181 (5.0%) |
| 45 to 54 Years | 3,056 (93.2%) | 223 (6.8%) |
| 55 to 64 Years | 3,141 (94.0%) | 199 (6.0%) |
| 65 to 74 Years | 2,789 (100.0%) | 0 (0.0%) |
| 75 Years and older | 1,564 (100.0%) | 0 (0.0%) |
| Total | 24,661 (96.3%) | 939 (3.7%) |
Health Insurance Coverage by Citizenship Status in Medina
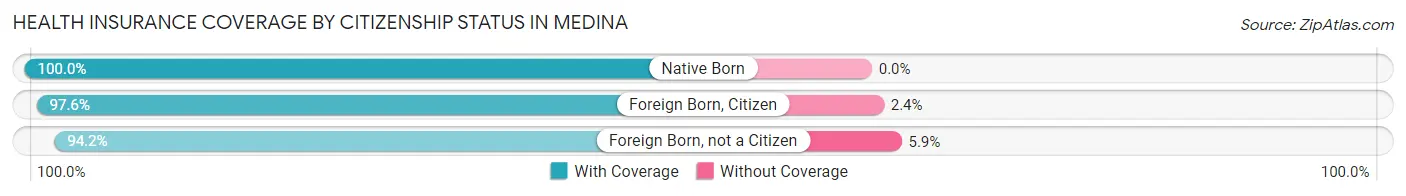
| Citizenship Status | With Coverage | Without Coverage |
| Native Born | 1,917 (100.0%) | 0 (0.0%) |
| Foreign Born, Citizen | 4,519 (97.6%) | 109 (2.4%) |
| Foreign Born, not a Citizen | 1,578 (94.2%) | 98 (5.9%) |
Health Insurance Coverage by Household Income in Medina
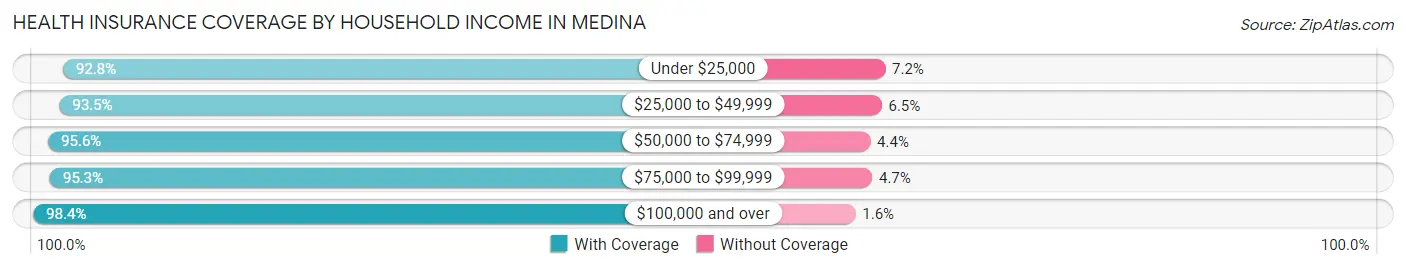
| Household Income | With Coverage | Without Coverage |
| Under $25,000 | 2,343 (92.8%) | 181 (7.2%) |
| $25,000 to $49,999 | 3,345 (93.5%) | 233 (6.5%) |
| $50,000 to $74,999 | 4,131 (95.6%) | 189 (4.4%) |
| $75,000 to $99,999 | 2,821 (95.3%) | 140 (4.7%) |
| $100,000 and over | 12,011 (98.4%) | 196 (1.6%) |
Public vs Private Health Insurance Coverage by Age in Medina
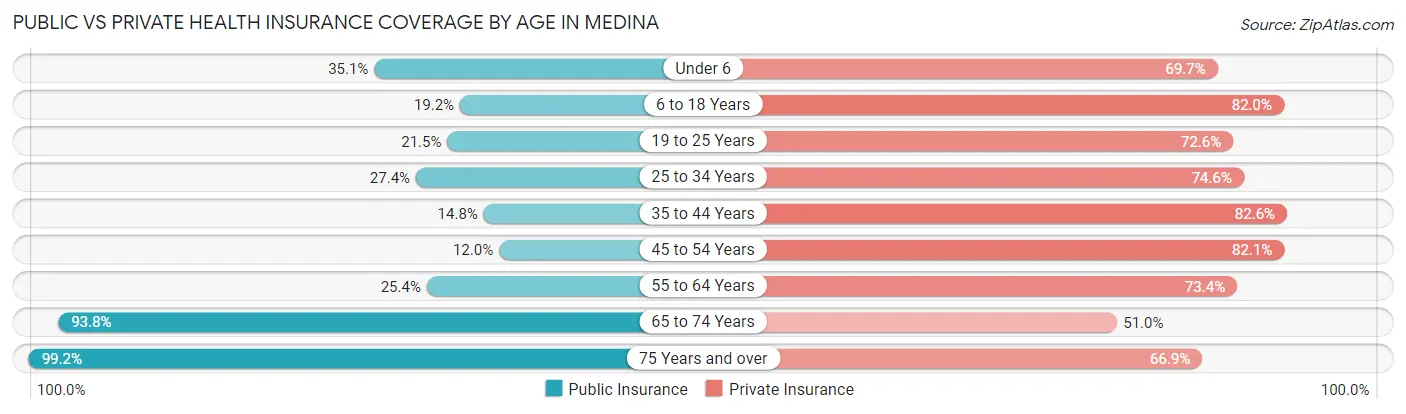
| Age Bracket | Public Insurance | Private Insurance |
| Under 6 | 673 (35.1%) | 1,337 (69.7%) |
| 6 to 18 Years | 888 (19.2%) | 3,797 (82.0%) |
| 19 to 25 Years | 361 (21.5%) | 1,217 (72.6%) |
| 25 to 34 Years | 762 (27.4%) | 2,077 (74.6%) |
| 35 to 44 Years | 536 (14.8%) | 2,993 (82.6%) |
| 45 to 54 Years | 392 (11.9%) | 2,692 (82.1%) |
| 55 to 64 Years | 847 (25.4%) | 2,450 (73.4%) |
| 65 to 74 Years | 2,615 (93.8%) | 1,421 (50.9%) |
| 75 Years and over | 1,552 (99.2%) | 1,046 (66.9%) |
| Total | 8,626 (33.7%) | 19,030 (74.3%) |
Disability Status by Sex by Age in Medina
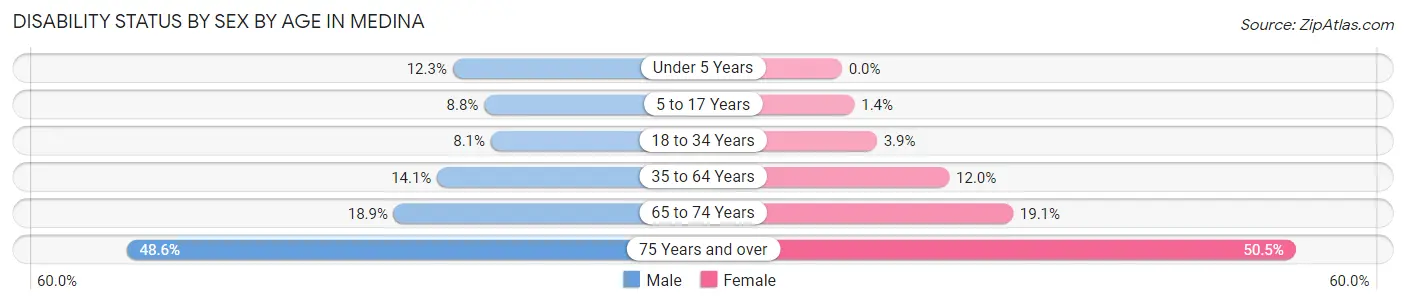
| Age Bracket | Male | Female |
| Under 5 Years | 102 (12.3%) | 0 (0.0%) |
| 5 to 17 Years | 217 (8.8%) | 27 (1.4%) |
| 18 to 34 Years | 201 (8.1%) | 101 (3.9%) |
| 35 to 64 Years | 703 (14.1%) | 626 (11.9%) |
| 65 to 74 Years | 252 (18.9%) | 277 (19.1%) |
| 75 Years and over | 266 (48.6%) | 514 (50.5%) |
Disability Class by Sex by Age in Medina
Disability Class: Hearing Difficulty
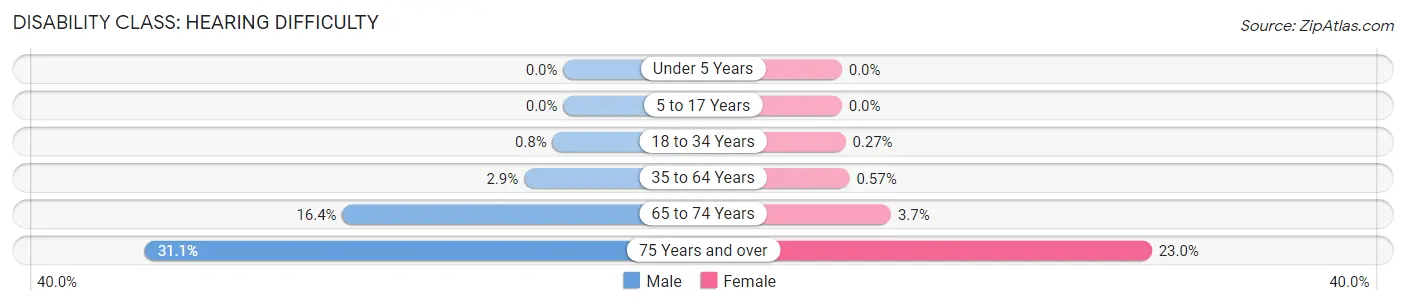
| Age Bracket | Male | Female |
| Under 5 Years | 0 (0.0%) | 0 (0.0%) |
| 5 to 17 Years | 0 (0.0%) | 0 (0.0%) |
| 18 to 34 Years | 20 (0.8%) | 7 (0.3%) |
| 35 to 64 Years | 146 (2.9%) | 30 (0.6%) |
| 65 to 74 Years | 219 (16.4%) | 53 (3.6%) |
| 75 Years and over | 170 (31.1%) | 234 (23.0%) |
Disability Class: Vision Difficulty
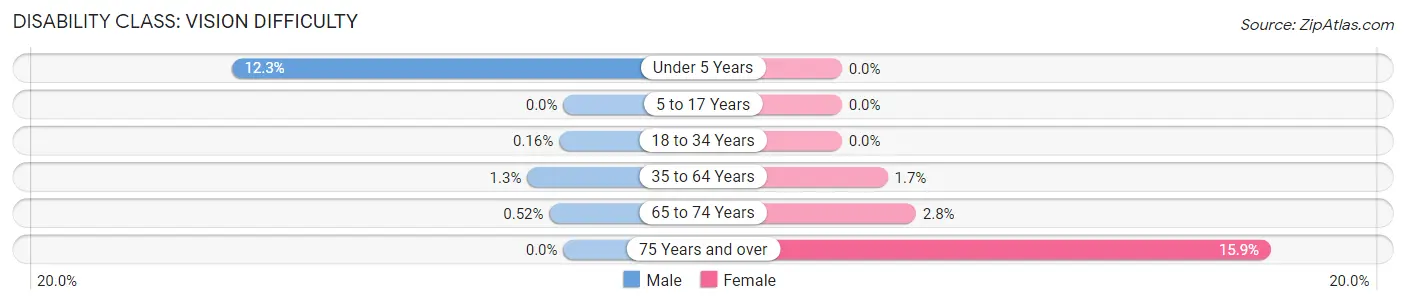
| Age Bracket | Male | Female |
| Under 5 Years | 102 (12.3%) | 0 (0.0%) |
| 5 to 17 Years | 0 (0.0%) | 0 (0.0%) |
| 18 to 34 Years | 4 (0.2%) | 0 (0.0%) |
| 35 to 64 Years | 67 (1.3%) | 89 (1.7%) |
| 65 to 74 Years | 7 (0.5%) | 40 (2.8%) |
| 75 Years and over | 0 (0.0%) | 162 (15.9%) |
Disability Class: Cognitive Difficulty
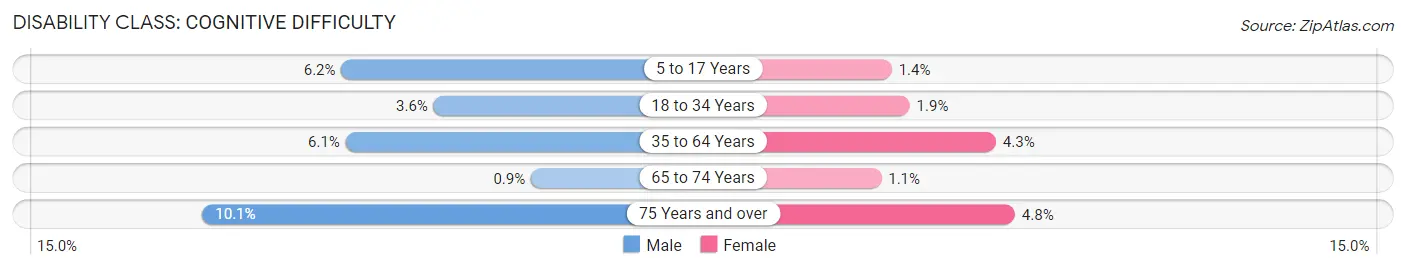
| Age Bracket | Male | Female |
| 5 to 17 Years | 152 (6.2%) | 27 (1.4%) |
| 18 to 34 Years | 90 (3.6%) | 49 (1.9%) |
| 35 to 64 Years | 303 (6.1%) | 225 (4.3%) |
| 65 to 74 Years | 12 (0.9%) | 16 (1.1%) |
| 75 Years and over | 55 (10.1%) | 49 (4.8%) |
Disability Class: Ambulatory Difficulty
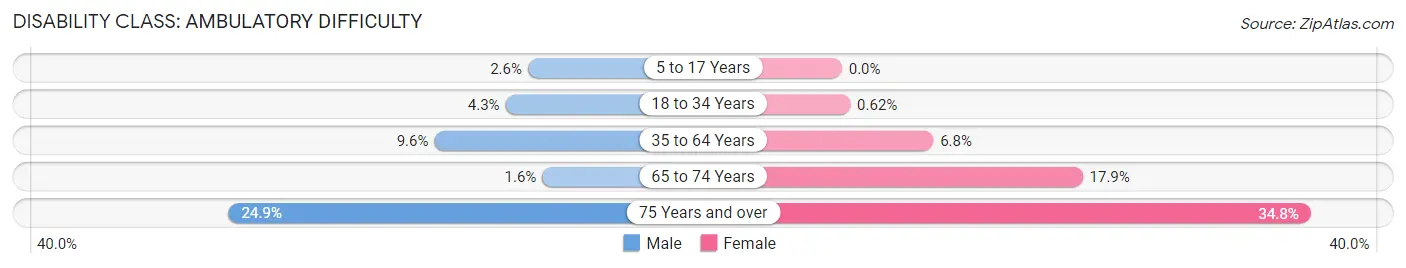
| Age Bracket | Male | Female |
| 5 to 17 Years | 65 (2.6%) | 0 (0.0%) |
| 18 to 34 Years | 107 (4.3%) | 16 (0.6%) |
| 35 to 64 Years | 479 (9.6%) | 356 (6.8%) |
| 65 to 74 Years | 21 (1.6%) | 260 (17.9%) |
| 75 Years and over | 136 (24.9%) | 354 (34.8%) |
Disability Class: Self-Care Difficulty
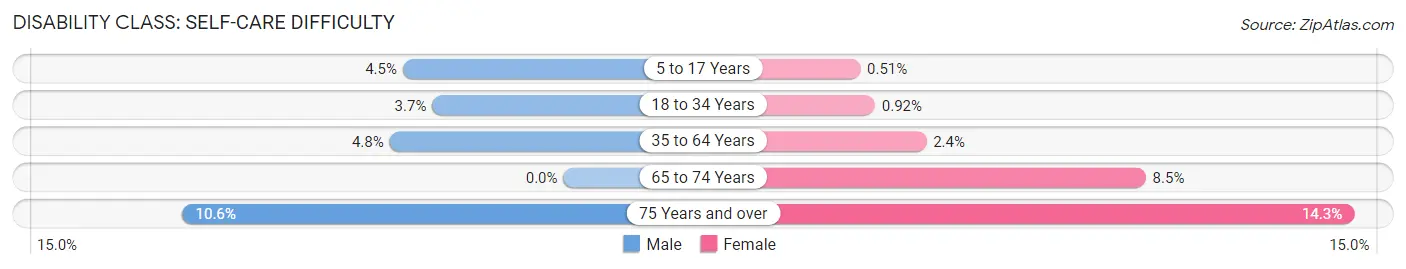
| Age Bracket | Male | Female |
| 5 to 17 Years | 110 (4.5%) | 10 (0.5%) |
| 18 to 34 Years | 91 (3.6%) | 24 (0.9%) |
| 35 to 64 Years | 242 (4.8%) | 123 (2.4%) |
| 65 to 74 Years | 0 (0.0%) | 123 (8.5%) |
| 75 Years and over | 58 (10.6%) | 145 (14.3%) |
Technology Access in Medina
Computing Device Access in Medina
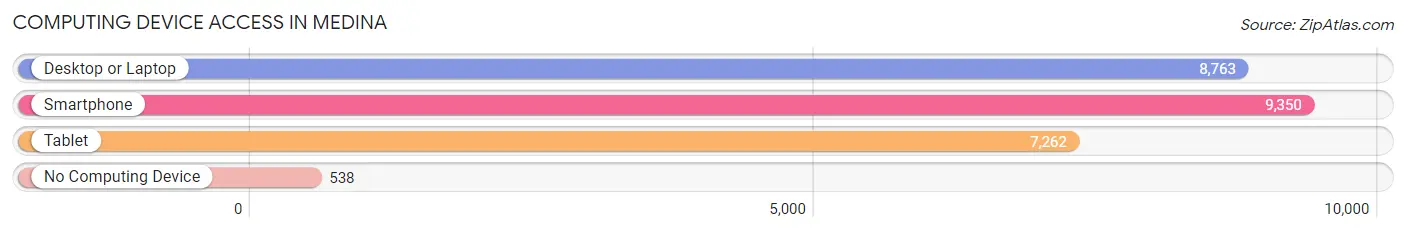
| Device Type | # Households | % Households |
| Desktop or Laptop | 8,763 | 82.5% |
| Smartphone | 9,350 | 88.0% |
| Tablet | 7,262 | 68.4% |
| No Computing Device | 538 | 5.1% |
| Total | 10,620 | 100.0% |
Internet Access in Medina
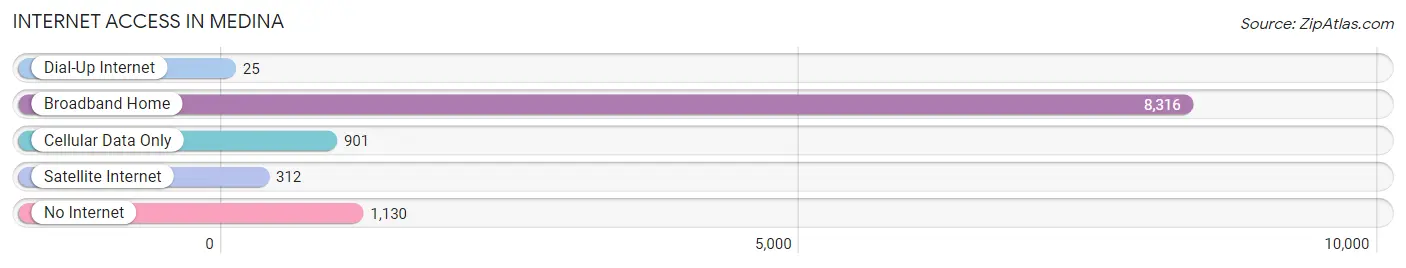
| Internet Type | # Households | % Households |
| Dial-Up Internet | 25 | 0.2% |
| Broadband Home | 8,316 | 78.3% |
| Cellular Data Only | 901 | 8.5% |
| Satellite Internet | 312 | 2.9% |
| No Internet | 1,130 | 10.6% |
| Total | 10,620 | 100.0% |
Medina Summary
Medina is a city located in the U.S. state of Ohio, in Medina County. It is situated approximately 30 miles south of Cleveland and is part of the Greater Cleveland Metropolitan Area. The city has a population of 26,678 as of the 2010 census, making it the county seat of Medina County.
History
The area that is now Medina was first settled in 1818 by John Smith, who built a log cabin near the present-day intersection of North Court Street and West Smith Road. The area was originally known as Smith's Corners, and was later renamed Medina in 1819 after the city of Medina in Saudi Arabia. The city was officially incorporated in 1835.
In the late 19th century, Medina was a popular stop on the Underground Railroad, with many runaway slaves passing through the city on their way to freedom in Canada. The city was also home to several prominent abolitionists, including John Brown and Harriet Beecher Stowe.
Geography
Medina is located at 41°9'25"N 81°51'45"W (41.156944, -81.862500). According to the United States Census Bureau, the city has a total area of 8.7 square miles (22.5 km2), of which 8.6 square miles (22.3 km2) is land and 0.1 square miles (0.2 km2) is water.
Economy
Medina's economy is largely based on manufacturing and retail. The city is home to several large manufacturing companies, including the Medina Manufacturing Company, which produces automotive parts, and the Medina Tool and Die Company, which produces industrial tools and machinery. The city is also home to several retail stores, including the Medina Mall, which is the largest shopping center in the city.
Demographics
As of the 2010 census, there were 26,678 people, 10,845 households, and 7,072 families residing in the city. The population density was 3,092.3 people per square mile (1,193.2/km2). There were 11,717 housing units at an average density of 1,360.3 per square mile (525.2/km2). The racial makeup of the city was 94.2% White, 1.7% African American, 0.2% Native American, 1.3% Asian, 0.1% Pacific Islander, 0.9% from other races, and 1.6% from two or more races. Hispanic or Latino of any race were 3.2% of the population.
There were 10,845 households, out of which 32.2% had children under the age of 18 living with them, 51.2% were married couples living together, 11.7% had a female householder with no husband present, and 32.7% were non-families. 27.2% of all households were made up of individuals, and 10.2% had someone living alone who was 65 years of age or older. The average household size was 2.45 and the average family size was 2.98.
In the city, the population was spread out, with 25.2% under the age of 18, 7.7% from 18 to 24, 30.2% from 25 to 44, 22.3% from 45 to 64, and 14.6% who were 65 years of age or older. The median age was 37 years. For every 100 females, there were 93.2 males. For every 100 females age 18 and over, there were 89.7 males.
The median income for a household in the city was $45,945, and the median income for a family was $54,945. Males had a median income of $41,845 versus $30,945 for females. The per capita income for the city was $22,945. About 4.2% of families and 6.2% of the population were below the poverty line, including 8.2% of those under age 18 and 5.2% of those age 65 or over.
Common Questions
What is the Total Population of Medina?
Total Population of Medina is 26,092.
What is the Total Male Population of Medina?
Total Male Population of Medina is 12,899.
What is the Total Female Population of Medina?
Total Female Population of Medina is 13,193.
What is the Ratio of Males per 100 Females in Medina?
There are 97.77 Males per 100 Females in Medina.
What is the Ratio of Females per 100 Males in Medina?
There are 102.28 Females per 100 Males in Medina.
What is the Median Population Age in Medina?
Median Population Age in Medina is 40.2 Years.
What is the Average Family Size in Medina
Average Family Size in Medina is 2.9 People.
What is the Average Household Size in Medina
Average Household Size in Medina is 2.4 People.
What is Per Capita Income in Medina?
Per Capita income in Medina is $40,253.
What is the Median Family Income in Medina?
Median Family Income in Medina is $98,050.
What is the Median Household income in Medina?
Median Household Income in Medina is $74,820.
What is Income or Wage Gap in Medina?
Income or Wage Gap in Medina is 33.6%.
Women in Medina earn 66.4 cents for every dollar earned by a man.
What is Family Income Deficit in Medina?
Family Income Deficit in Medina is $9,579.
Families that are below poverty line in Medina earn $9,579 less on average than the poverty threshold level.
What is Inequality or Gini Index in Medina?
Inequality or Gini Index in Medina is 0.44.
How Large is the Labor Force in Medina?
There are 14,232 People in the Labor Forcein in Medina.
What is the Percentage of People in the Labor Force in Medina?
68.8% of People are in the Labor Force in Medina.
What is the Unemployment Rate in Medina?
Unemployment Rate in Medina is 4.8%.