Mount Carmel, OH
Mount Carmel Map
Mount Carmel Overview
4,924
TOTAL POPULATION
2,296
MALE POPULATION
2,628
FEMALE POPULATION
87.37
MALES / 100 FEMALES
114.46
FEMALES / 100 MALES
38.8
MEDIAN AGE
2.9
AVG FAMILY SIZE
2.3
AVG HOUSEHOLD SIZE
$35,796
PER CAPITA INCOME
$74,896
AVG FAMILY INCOME
$65,000
AVG HOUSEHOLD INCOME
2.8%
WAGE / INCOME GAP [ % ]
97.2¢/ $1
WAGE / INCOME GAP [ $ ]
0.42
INEQUALITY / GINI INDEX
3,015
LABOR FORCE [ PEOPLE ]
76.0%
PERCENT IN LABOR FORCE
1.0%
UNEMPLOYMENT RATE
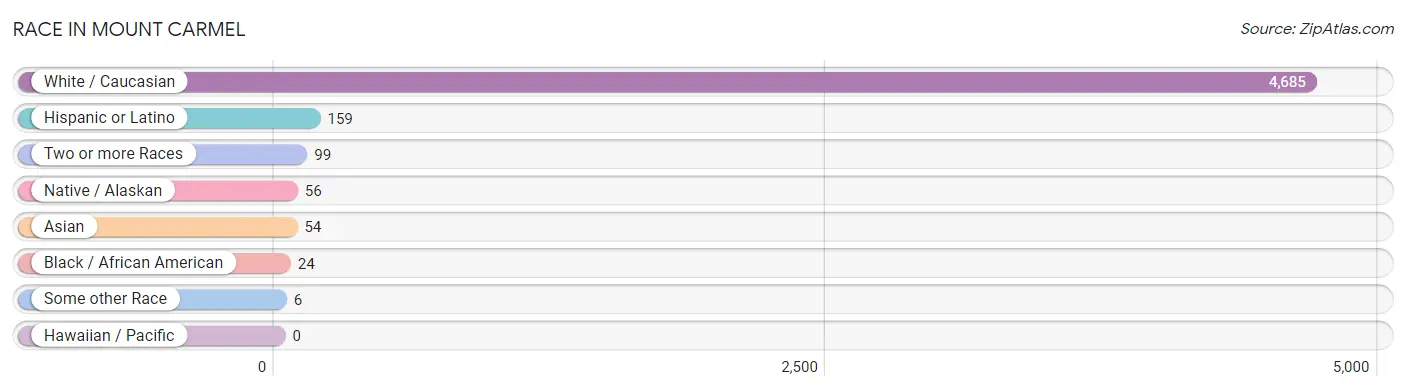
Race in Mount Carmel
The most populous races in Mount Carmel are White / Caucasian (4,685 | 95.2%), Hispanic or Latino (159 | 3.2%), and Two or more Races (99 | 2.0%).
| Race | # Population | % Population |
| Asian | 54 | 1.1% |
| Black / African American | 24 | 0.5% |
| Hawaiian / Pacific | 0 | 0.0% |
| Hispanic or Latino | 159 | 3.2% |
| Native / Alaskan | 56 | 1.1% |
| White / Caucasian | 4,685 | 95.2% |
| Two or more Races | 99 | 2.0% |
| Some other Race | 6 | 0.1% |
| Total | 4,924 | 100.0% |
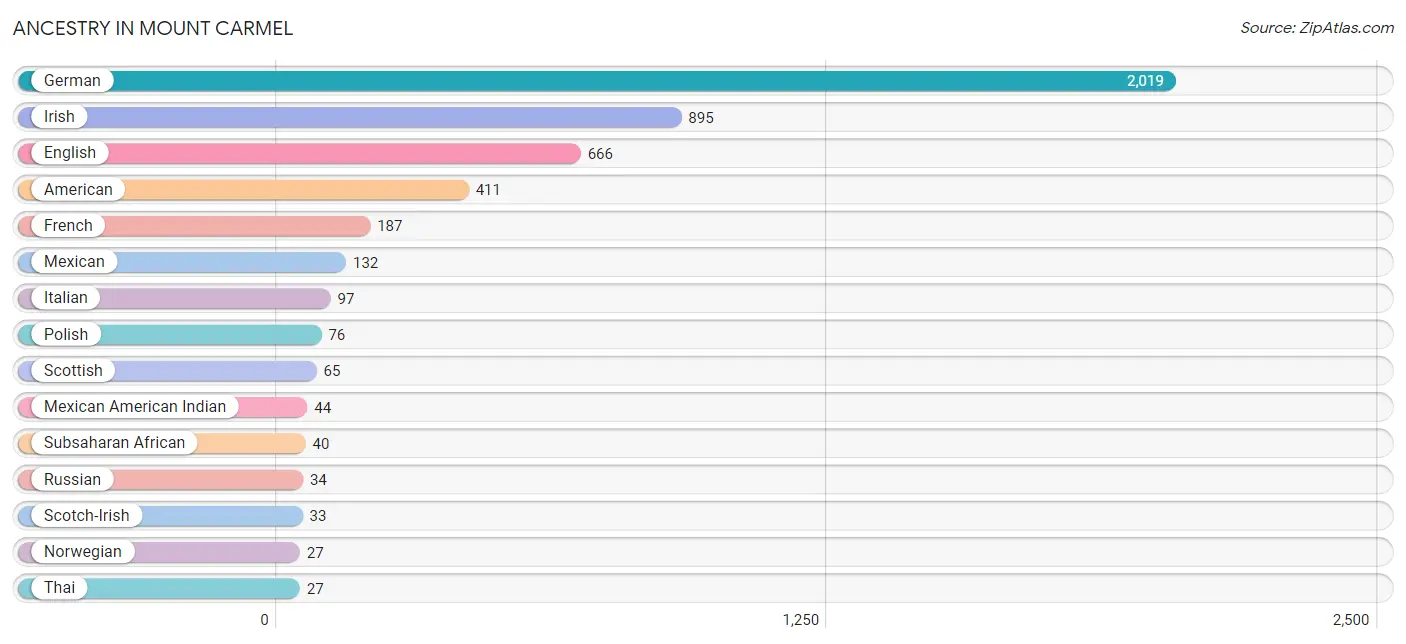
Ancestry in Mount Carmel
The most populous ancestries reported in Mount Carmel are German (2,019 | 41.0%), Irish (895 | 18.2%), English (666 | 13.5%), American (411 | 8.4%), and French (187 | 3.8%), together accounting for 84.9% of all Mount Carmel residents.
| Ancestry | # Population | % Population |
| American | 411 | 8.4% |
| Austrian | 7 | 0.1% |
| Burmese | 1 | 0.0% |
| Central American | 5 | 0.1% |
| Cherokee | 6 | 0.1% |
| Czech | 19 | 0.4% |
| Eastern European | 8 | 0.2% |
| English | 666 | 13.5% |
| European | 16 | 0.3% |
| French | 187 | 3.8% |
| German | 2,019 | 41.0% |
| Greek | 9 | 0.2% |
| Honduran | 5 | 0.1% |
| Hungarian | 8 | 0.2% |
| Irish | 895 | 18.2% |
| Italian | 97 | 2.0% |
| Lithuanian | 6 | 0.1% |
| Mexican | 132 | 2.7% |
| Mexican American Indian | 44 | 0.9% |
| Northern European | 20 | 0.4% |
| Norwegian | 27 | 0.5% |
| Pakistani | 26 | 0.5% |
| Peruvian | 11 | 0.2% |
| Polish | 76 | 1.5% |
| Russian | 34 | 0.7% |
| Scandinavian | 20 | 0.4% |
| Scotch-Irish | 33 | 0.7% |
| Scottish | 65 | 1.3% |
| South American | 11 | 0.2% |
| Spanish | 11 | 0.2% |
| Subsaharan African | 40 | 0.8% |
| Thai | 27 | 0.5% |
| Welsh | 7 | 0.1% |
| Yugoslavian | 9 | 0.2% | View All 34 Rows |
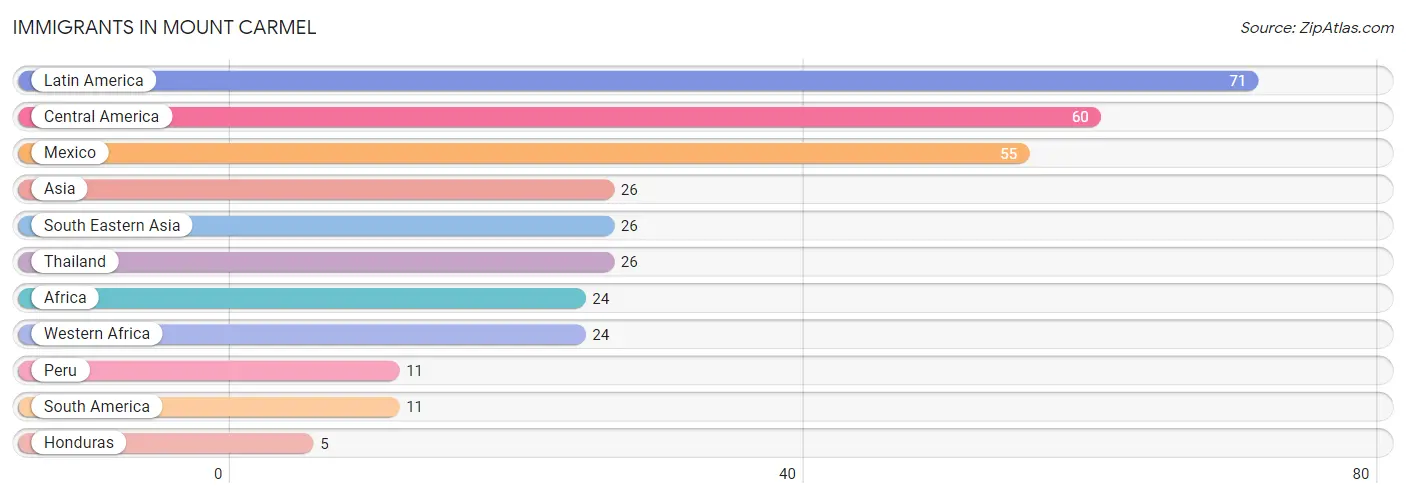
Immigrants in Mount Carmel
The most numerous immigrant groups reported in Mount Carmel came from Latin America (71 | 1.4%), Central America (60 | 1.2%), Mexico (55 | 1.1%), Asia (26 | 0.5%), and South Eastern Asia (26 | 0.5%), together accounting for 4.8% of all Mount Carmel residents.
| Immigration Origin | # Population | % Population |
| Africa | 24 | 0.5% |
| Asia | 26 | 0.5% |
| Central America | 60 | 1.2% |
| Honduras | 5 | 0.1% |
| Latin America | 71 | 1.4% |
| Mexico | 55 | 1.1% |
| Peru | 11 | 0.2% |
| South America | 11 | 0.2% |
| South Eastern Asia | 26 | 0.5% |
| Thailand | 26 | 0.5% |
| Western Africa | 24 | 0.5% | View All 11 Rows |
Sex and Age in Mount Carmel
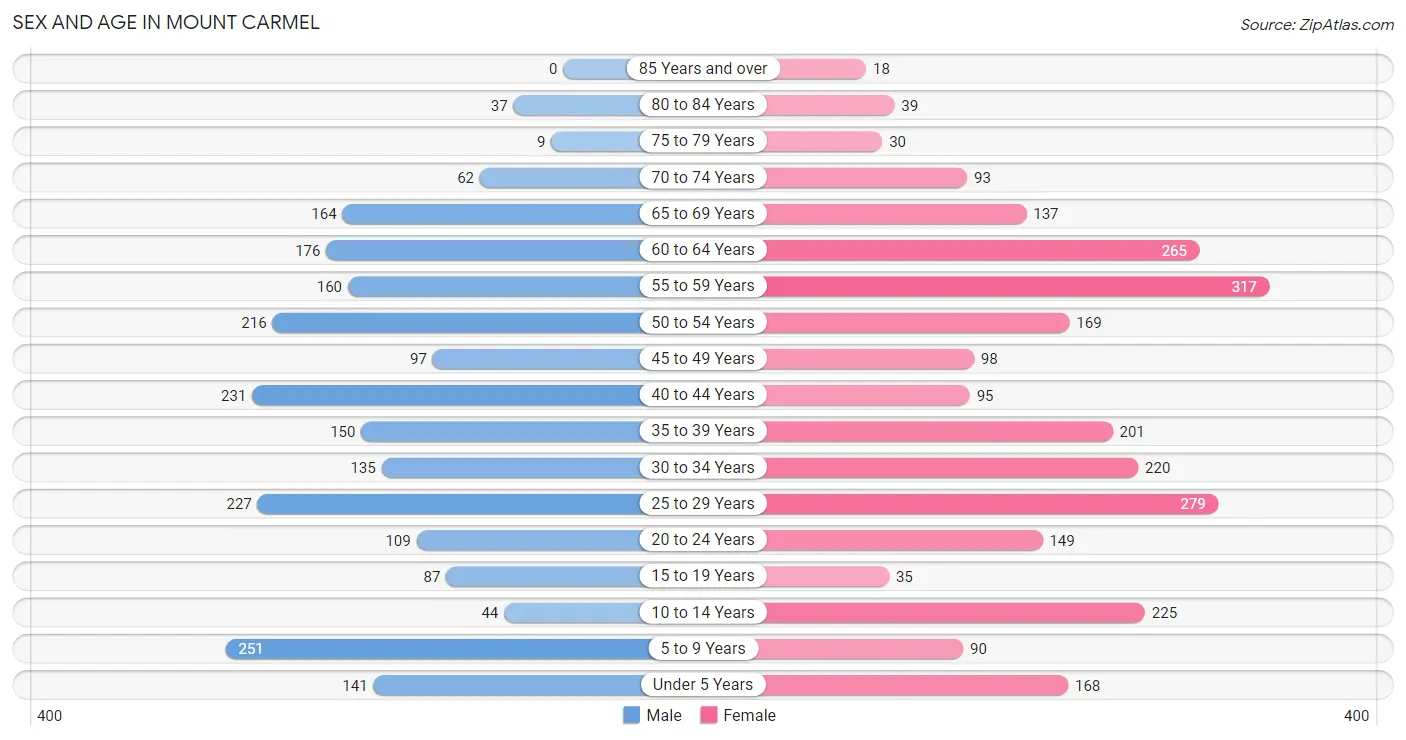
Sex and Age in Mount Carmel
The most populous age groups in Mount Carmel are 5 to 9 Years (251 | 10.9%) for men and 55 to 59 Years (317 | 12.1%) for women.
| Age Bracket | Male | Female |
| Under 5 Years | 141 (6.1%) | 168 (6.4%) |
| 5 to 9 Years | 251 (10.9%) | 90 (3.4%) |
| 10 to 14 Years | 44 (1.9%) | 225 (8.6%) |
| 15 to 19 Years | 87 (3.8%) | 35 (1.3%) |
| 20 to 24 Years | 109 (4.8%) | 149 (5.7%) |
| 25 to 29 Years | 227 (9.9%) | 279 (10.6%) |
| 30 to 34 Years | 135 (5.9%) | 220 (8.4%) |
| 35 to 39 Years | 150 (6.5%) | 201 (7.6%) |
| 40 to 44 Years | 231 (10.1%) | 95 (3.6%) |
| 45 to 49 Years | 97 (4.2%) | 98 (3.7%) |
| 50 to 54 Years | 216 (9.4%) | 169 (6.4%) |
| 55 to 59 Years | 160 (7.0%) | 317 (12.1%) |
| 60 to 64 Years | 176 (7.7%) | 265 (10.1%) |
| 65 to 69 Years | 164 (7.1%) | 137 (5.2%) |
| 70 to 74 Years | 62 (2.7%) | 93 (3.5%) |
| 75 to 79 Years | 9 (0.4%) | 30 (1.1%) |
| 80 to 84 Years | 37 (1.6%) | 39 (1.5%) |
| 85 Years and over | 0 (0.0%) | 18 (0.7%) |
| Total | 2,296 (100.0%) | 2,628 (100.0%) |
Families and Households in Mount Carmel
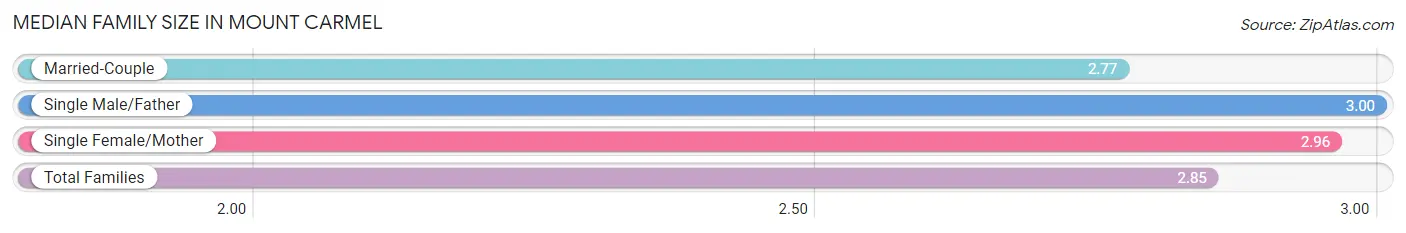
Median Family Size in Mount Carmel
The median family size in Mount Carmel is 2.85 persons per family, with single male/father families (151 | 11.8%) accounting for the largest median family size of 3 persons per family. On the other hand, married-couple families (785 | 61.2%) represent the smallest median family size with 2.77 persons per family.
| Family Type | # Families | Family Size |
| Married-Couple | 785 (61.2%) | 2.77 |
| Single Male/Father | 151 (11.8%) | 3.00 |
| Single Female/Mother | 347 (27.1%) | 2.96 |
| Total Families | 1,283 (100.0%) | 2.85 |
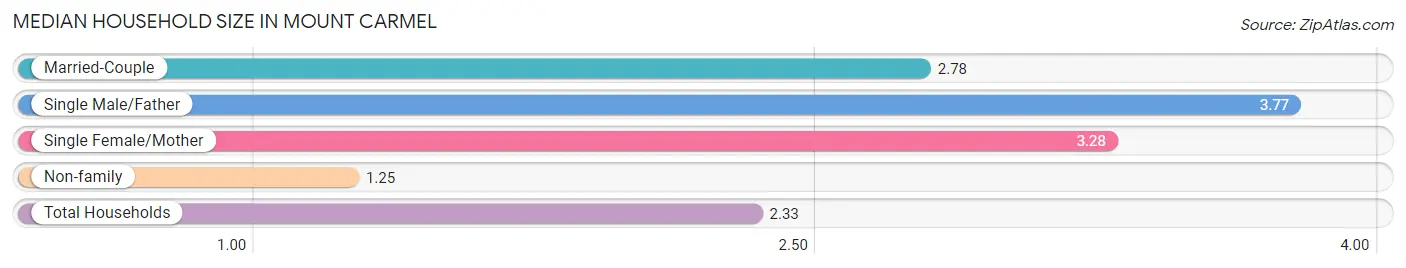
Median Household Size in Mount Carmel
The median household size in Mount Carmel is 2.33 persons per household, with single male/father households (151 | 7.2%) accounting for the largest median household size of 3.77 persons per household. non-family households (827 | 39.2%) represent the smallest median household size with 1.25 persons per household.
| Household Type | # Households | Household Size |
| Married-Couple | 785 (37.2%) | 2.78 |
| Single Male/Father | 151 (7.2%) | 3.77 |
| Single Female/Mother | 347 (16.5%) | 3.28 |
| Non-family | 827 (39.2%) | 1.25 |
| Total Households | 2,110 (100.0%) | 2.33 |
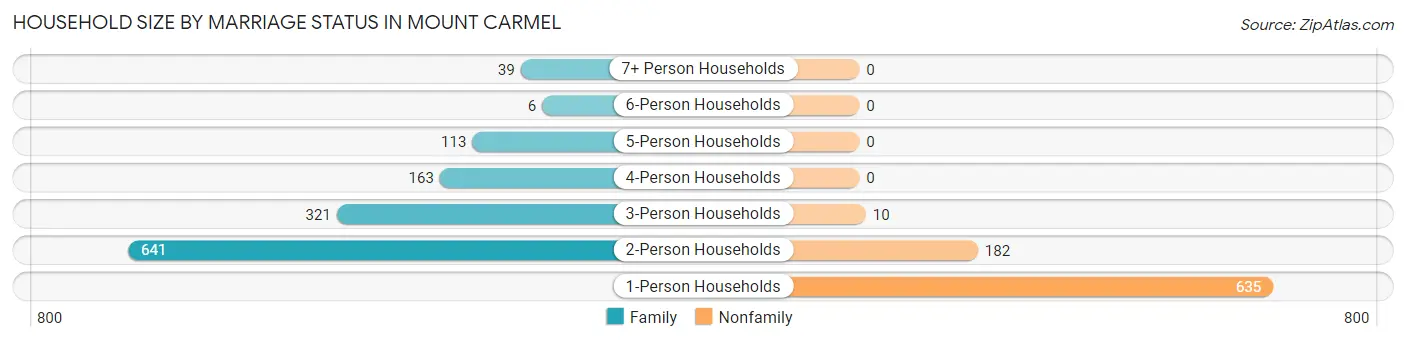
Household Size by Marriage Status in Mount Carmel
Out of a total of 2,110 households in Mount Carmel, 1,283 (60.8%) are family households, while 827 (39.2%) are nonfamily households. The most numerous type of family households are 2-person households, comprising 641, and the most common type of nonfamily households are 1-person households, comprising 635.
| Household Size | Family Households | Nonfamily Households |
| 1-Person Households | - | 635 (30.1%) |
| 2-Person Households | 641 (30.4%) | 182 (8.6%) |
| 3-Person Households | 321 (15.2%) | 10 (0.5%) |
| 4-Person Households | 163 (7.7%) | 0 (0.0%) |
| 5-Person Households | 113 (5.4%) | 0 (0.0%) |
| 6-Person Households | 6 (0.3%) | 0 (0.0%) |
| 7+ Person Households | 39 (1.8%) | 0 (0.0%) |
| Total | 1,283 (60.8%) | 827 (39.2%) |
Female Fertility in Mount Carmel
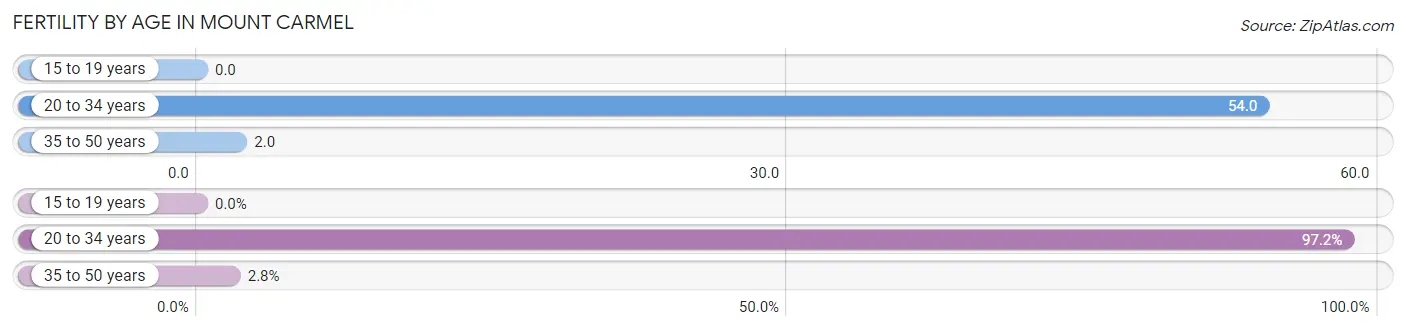
Fertility by Age in Mount Carmel
Average fertility rate in Mount Carmel is 32.0 births per 1,000 women. Women in the age bracket of 20 to 34 years have the highest fertility rate with 54.0 births per 1,000 women. Women in the age bracket of 20 to 34 years acount for 97.2% of all women with births.
| Age Bracket | Women with Births | Births / 1,000 Women |
| 15 to 19 years | 0 (0.0%) | 0.0 |
| 20 to 34 years | 35 (97.2%) | 54.0 |
| 35 to 50 years | 1 (2.8%) | 2.0 |
| Total | 36 (100.0%) | 32.0 |
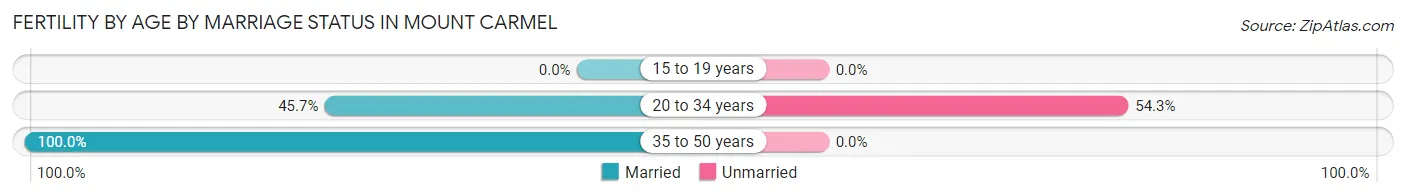
Fertility by Age by Marriage Status in Mount Carmel
47.2% of women with births (36) in Mount Carmel are married. The highest percentage of unmarried women with births falls into 20 to 34 years age bracket with 54.3% of them unmarried at the time of birth, while the lowest percentage of unmarried women with births belong to 35 to 50 years age bracket with 0.0% of them unmarried.
| Age Bracket | Married | Unmarried |
| 15 to 19 years | 0 (0.0%) | 0 (0.0%) |
| 20 to 34 years | 16 (45.7%) | 19 (54.3%) |
| 35 to 50 years | 1 (100.0%) | 0 (0.0%) |
| Total | 17 (47.2%) | 19 (52.8%) |
Fertility by Education in Mount Carmel

| Educational Attainment | Women with Births | Births / 1,000 Women |
| Less than High School | 0 (0.0%) | 0.0 |
| High School Diploma | 29 (80.6%) | 68.0 |
| College or Associate's Degree | 0 (0.0%) | 0.0 |
| Bachelor's Degree | 7 (19.4%) | 23.0 |
| Graduate Degree | 0 (0.0%) | 0.0 |
| Total | 36 (100.0%) | 32.0 |
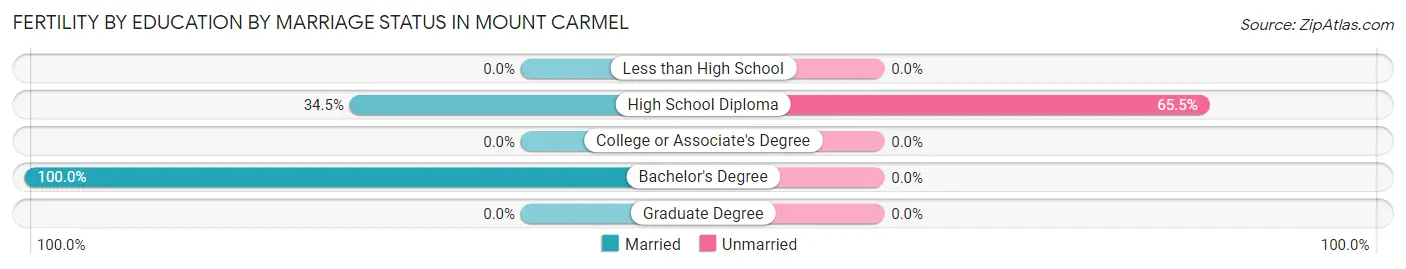
Fertility by Education by Marriage Status in Mount Carmel
52.8% of women with births in Mount Carmel are unmarried. Women with the educational attainment of bachelor's degree are most likely to be married with 100.0% of them married at childbirth, while women with the educational attainment of high school diploma are least likely to be married with 65.5% of them unmarried at childbirth.
| Educational Attainment | Married | Unmarried |
| Less than High School | 0 (0.0%) | 0 (0.0%) |
| High School Diploma | 10 (34.5%) | 19 (65.5%) |
| College or Associate's Degree | 0 (0.0%) | 0 (0.0%) |
| Bachelor's Degree | 7 (100.0%) | 0 (0.0%) |
| Graduate Degree | 0 (0.0%) | 0 (0.0%) |
| Total | 17 (47.2%) | 19 (52.8%) |
Income in Mount Carmel
Income Overview in Mount Carmel
Per Capita Income in Mount Carmel is $35,796, while median incomes of families and households are $74,896 and $65,000 respectively.
| Characteristic | Number | Measure |
| Per Capita Income | 4,924 | $35,796 |
| Median Family Income | 1,283 | $74,896 |
| Mean Family Income | 1,283 | $91,437 |
| Median Household Income | 2,110 | $65,000 |
| Mean Household Income | 2,110 | $81,846 |
| Income Deficit | 1,283 | $0 |
| Wage / Income Gap (%) | 4,924 | 2.77% |
| Wage / Income Gap ($) | 4,924 | 97.23¢ per $1 |
| Gini / Inequality Index | 4,924 | 0.42 |
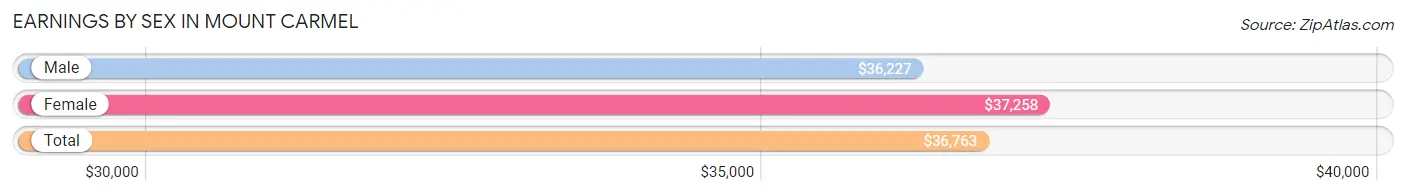
Earnings by Sex in Mount Carmel
Average Earnings in Mount Carmel are $36,763, $36,227 for men and $37,258 for women, a difference of 2.8%.
| Sex | Number | Average Earnings |
| Male | 1,532 (48.3%) | $36,227 |
| Female | 1,639 (51.7%) | $37,258 |
| Total | 3,171 (100.0%) | $36,763 |
Earnings by Sex by Income Bracket in Mount Carmel
The most common earnings brackets in Mount Carmel are $75,000 to $99,999 for men (251 | 16.4%) and $40,000 to $44,999 for women (178 | 10.9%).
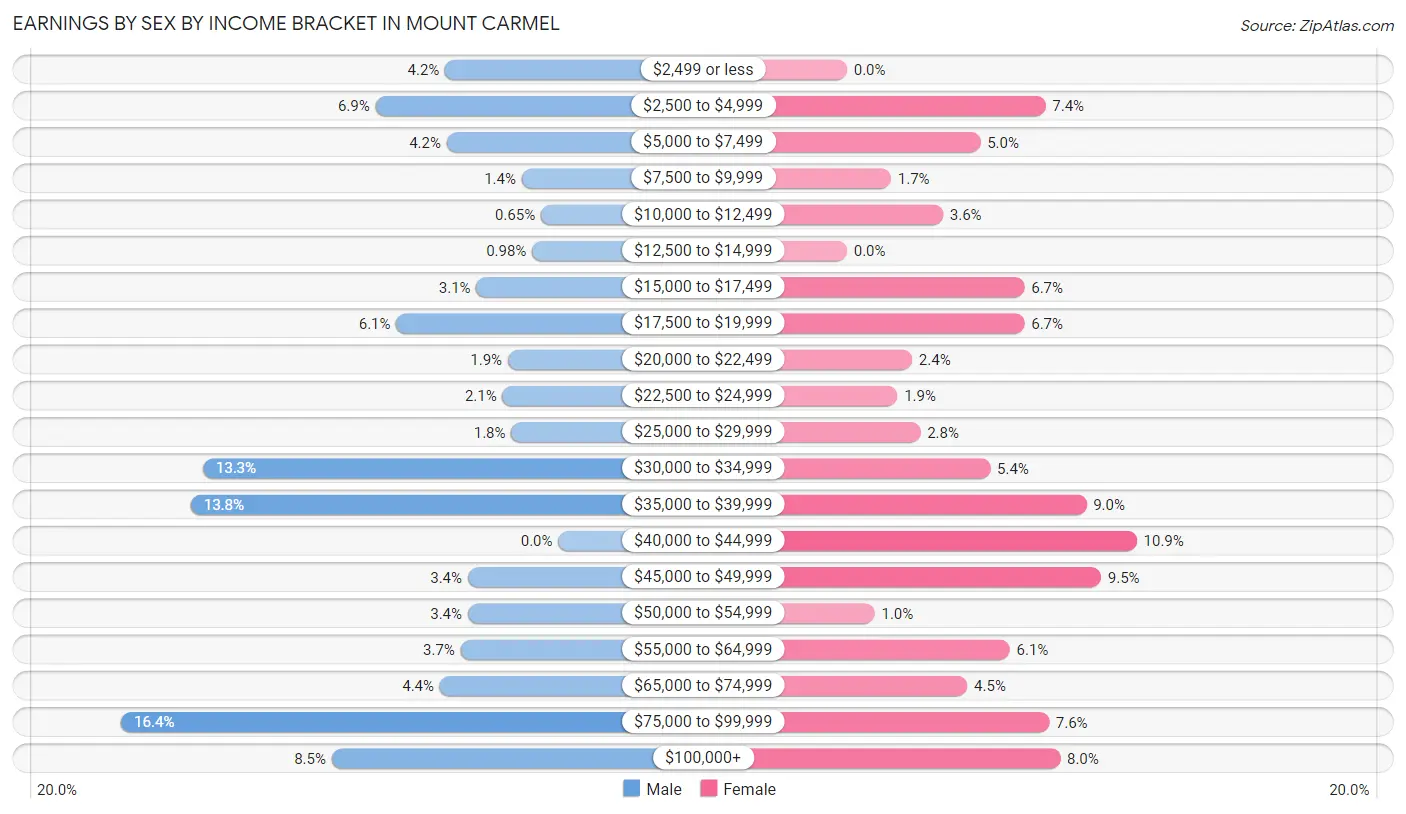
| Income | Male | Female |
| $2,499 or less | 65 (4.2%) | 0 (0.0%) |
| $2,500 to $4,999 | 105 (6.9%) | 122 (7.4%) |
| $5,000 to $7,499 | 64 (4.2%) | 82 (5.0%) |
| $7,500 to $9,999 | 21 (1.4%) | 27 (1.7%) |
| $10,000 to $12,499 | 10 (0.6%) | 59 (3.6%) |
| $12,500 to $14,999 | 15 (1.0%) | 0 (0.0%) |
| $15,000 to $17,499 | 47 (3.1%) | 109 (6.7%) |
| $17,500 to $19,999 | 93 (6.1%) | 109 (6.7%) |
| $20,000 to $22,499 | 29 (1.9%) | 40 (2.4%) |
| $22,500 to $24,999 | 32 (2.1%) | 31 (1.9%) |
| $25,000 to $29,999 | 27 (1.8%) | 45 (2.8%) |
| $30,000 to $34,999 | 204 (13.3%) | 88 (5.4%) |
| $35,000 to $39,999 | 211 (13.8%) | 147 (9.0%) |
| $40,000 to $44,999 | 0 (0.0%) | 178 (10.9%) |
| $45,000 to $49,999 | 52 (3.4%) | 156 (9.5%) |
| $50,000 to $54,999 | 52 (3.4%) | 17 (1.0%) |
| $55,000 to $64,999 | 56 (3.7%) | 100 (6.1%) |
| $65,000 to $74,999 | 68 (4.4%) | 74 (4.5%) |
| $75,000 to $99,999 | 251 (16.4%) | 124 (7.6%) |
| $100,000+ | 130 (8.5%) | 131 (8.0%) |
| Total | 1,532 (100.0%) | 1,639 (100.0%) |
Earnings by Sex by Educational Attainment in Mount Carmel
Average earnings in Mount Carmel are $37,125 for men and $40,947 for women, a difference of 9.3%. Men with an educational attainment of bachelor's degree enjoy the highest average annual earnings of $72,708, while those with less than high school education earn the least with $31,592. Women with an educational attainment of graduate degree earn the most with the average annual earnings of $115,870, while those with college or associate's degree education have the smallest earnings of $36,672.
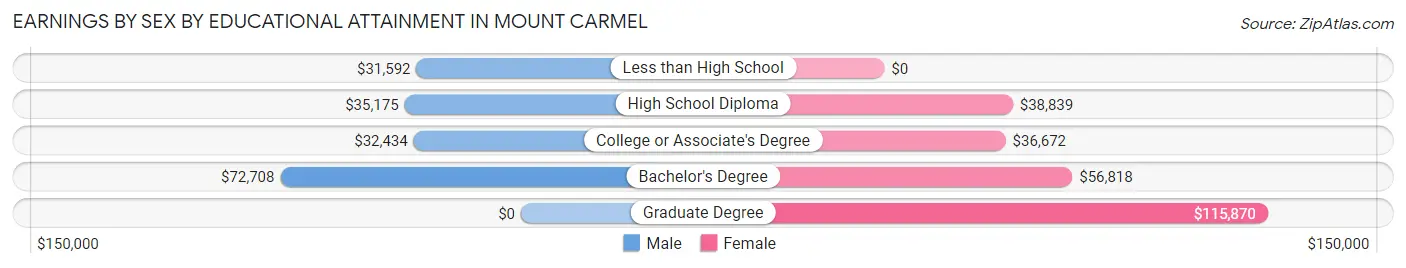
| Educational Attainment | Male Income | Female Income |
| Less than High School | $31,592 | $0 |
| High School Diploma | $35,175 | $38,839 |
| College or Associate's Degree | $32,434 | $36,672 |
| Bachelor's Degree | $72,708 | $56,818 |
| Graduate Degree | - | - |
| Total | $37,125 | $40,947 |
Family Income in Mount Carmel
Family Income Brackets in Mount Carmel
According to the Mount Carmel family income data, there are 343 families falling into the $50,000 to $74,999 income range, which is the most common income bracket and makes up 26.7% of all families. Conversely, the $10,000 to $14,999 income bracket is the least frequent group with only 15 families (1.2%) belonging to this category.
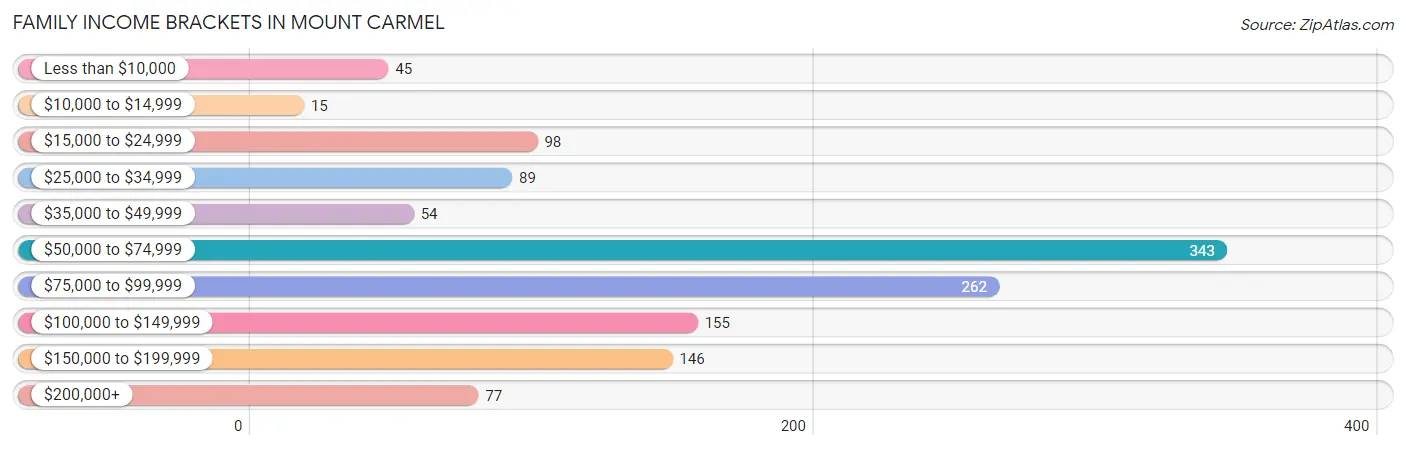
| Income Bracket | # Families | % Families |
| Less than $10,000 | 45 | 3.5% |
| $10,000 to $14,999 | 15 | 1.2% |
| $15,000 to $24,999 | 98 | 7.6% |
| $25,000 to $34,999 | 89 | 6.9% |
| $35,000 to $49,999 | 54 | 4.2% |
| $50,000 to $74,999 | 343 | 26.7% |
| $75,000 to $99,999 | 262 | 20.4% |
| $100,000 to $149,999 | 155 | 12.1% |
| $150,000 to $199,999 | 146 | 11.4% |
| $200,000+ | 77 | 6.0% |
Family Income by Famaliy Size in Mount Carmel
7+ person families (22 | 1.7%) account for the highest median family income in Mount Carmel with $125,417 per family, while 2-person families (670 | 52.2%) have the highest median income of $36,736 per family member.
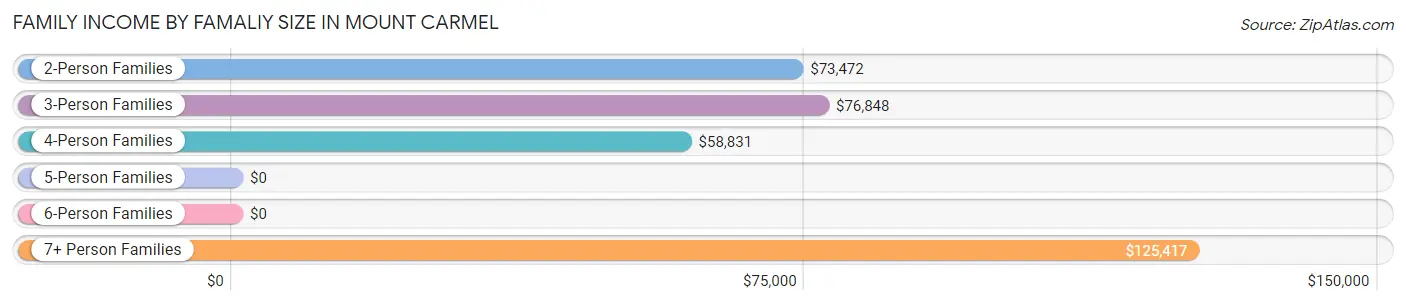
| Income Bracket | # Families | Median Income |
| 2-Person Families | 670 (52.2%) | $73,472 |
| 3-Person Families | 382 (29.8%) | $76,848 |
| 4-Person Families | 129 (10.1%) | $58,831 |
| 5-Person Families | 80 (6.2%) | $0 |
| 6-Person Families | 0 (0.0%) | $0 |
| 7+ Person Families | 22 (1.7%) | $125,417 |
| Total | 1,283 (100.0%) | $74,896 |
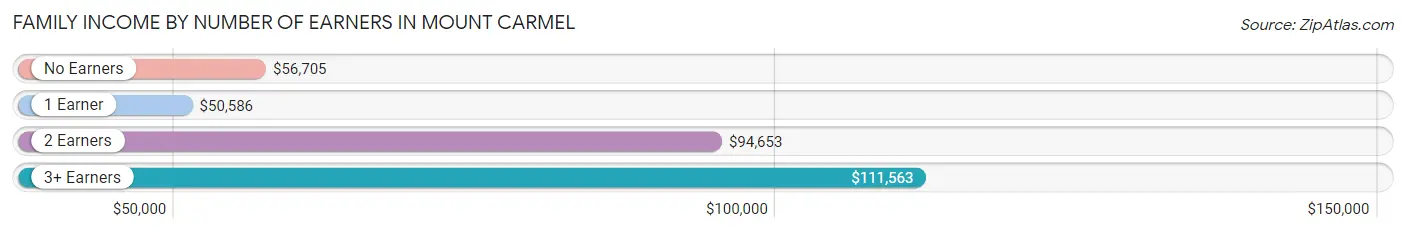
Family Income by Number of Earners in Mount Carmel
The median family income in Mount Carmel is $74,896, with families comprising 3+ earners (102) having the highest median family income of $111,563, while families with 1 earner (498) have the lowest median family income of $50,586, accounting for 8.0% and 38.8% of families, respectively.
| Number of Earners | # Families | Median Income |
| No Earners | 76 (5.9%) | $56,705 |
| 1 Earner | 498 (38.8%) | $50,586 |
| 2 Earners | 607 (47.3%) | $94,653 |
| 3+ Earners | 102 (8.0%) | $111,563 |
| Total | 1,283 (100.0%) | $74,896 |
Household Income in Mount Carmel
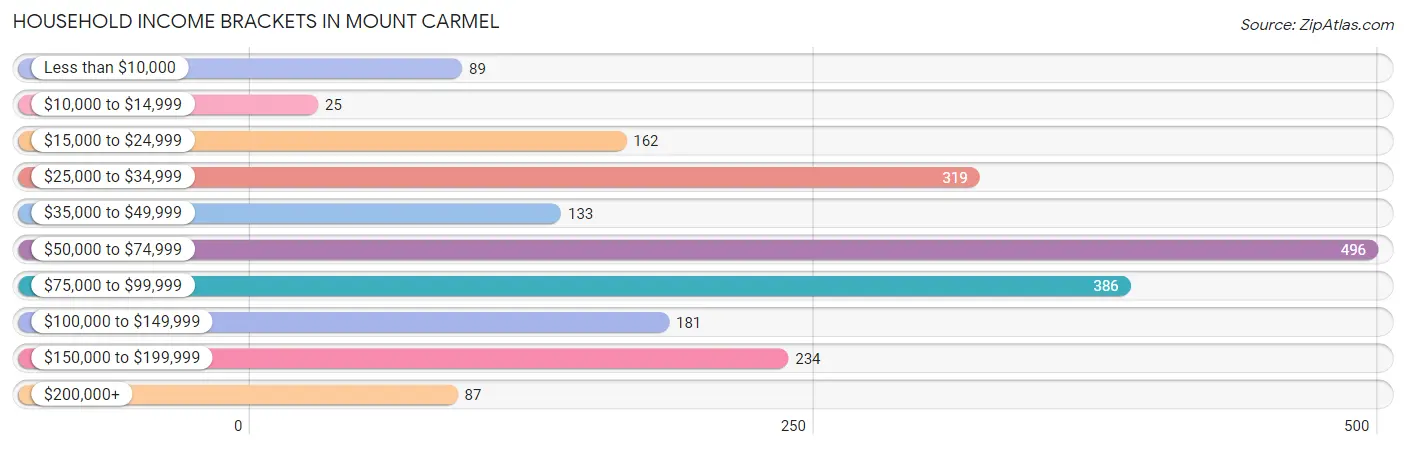
Household Income Brackets in Mount Carmel
With 496 households falling in the category, the $50,000 to $74,999 income range is the most frequent in Mount Carmel, accounting for 23.5% of all households. In contrast, only 25 households (1.2%) fall into the $10,000 to $14,999 income bracket, making it the least populous group.
| Income Bracket | # Households | % Households |
| Less than $10,000 | 89 | 4.2% |
| $10,000 to $14,999 | 25 | 1.2% |
| $15,000 to $24,999 | 162 | 7.7% |
| $25,000 to $34,999 | 319 | 15.1% |
| $35,000 to $49,999 | 133 | 6.3% |
| $50,000 to $74,999 | 496 | 23.5% |
| $75,000 to $99,999 | 386 | 18.3% |
| $100,000 to $149,999 | 181 | 8.6% |
| $150,000 to $199,999 | 234 | 11.1% |
| $200,000+ | 87 | 4.1% |
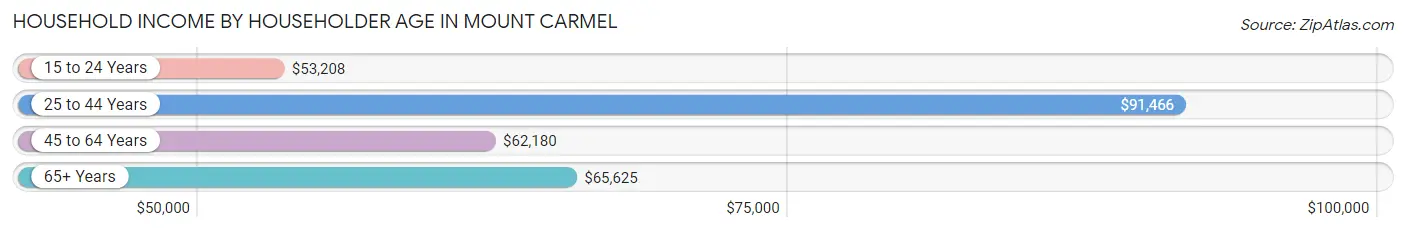
Household Income by Householder Age in Mount Carmel
The median household income in Mount Carmel is $65,000, with the highest median household income of $91,466 found in the 25 to 44 years age bracket for the primary householder. A total of 669 households (31.7%) fall into this category. Meanwhile, the 15 to 24 years age bracket for the primary householder has the lowest median household income of $53,208, with 149 households (7.1%) in this group.
| Income Bracket | # Households | Median Income |
| 15 to 24 Years | 149 (7.1%) | $53,208 |
| 25 to 44 Years | 669 (31.7%) | $91,466 |
| 45 to 64 Years | 827 (39.2%) | $62,180 |
| 65+ Years | 465 (22.0%) | $65,625 |
| Total | 2,110 (100.0%) | $65,000 |
Poverty in Mount Carmel
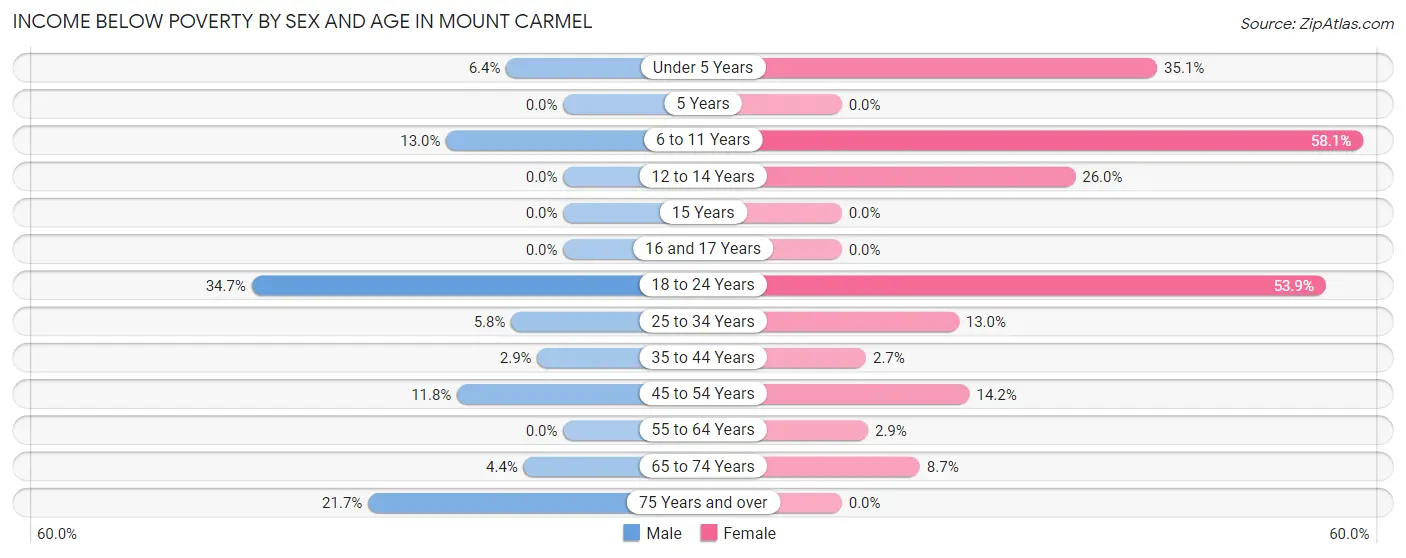
Income Below Poverty by Sex and Age in Mount Carmel
With 7.4% poverty level for males and 16.8% for females among the residents of Mount Carmel, 18 to 24 year old males and 6 to 11 year old females are the most vulnerable to poverty, with 42 males (34.7%) and 119 females (58.1%) in their respective age groups living below the poverty level.
| Age Bracket | Male | Female |
| Under 5 Years | 8 (6.4%) | 59 (35.1%) |
| 5 Years | 0 (0.0%) | 0 (0.0%) |
| 6 to 11 Years | 30 (13.0%) | 119 (58.1%) |
| 12 to 14 Years | 0 (0.0%) | 26 (26.0%) |
| 15 Years | 0 (0.0%) | 0 (0.0%) |
| 16 and 17 Years | 0 (0.0%) | 0 (0.0%) |
| 18 to 24 Years | 42 (34.7%) | 90 (53.9%) |
| 25 to 34 Years | 21 (5.8%) | 65 (13.0%) |
| 35 to 44 Years | 11 (2.9%) | 8 (2.7%) |
| 45 to 54 Years | 37 (11.8%) | 38 (14.2%) |
| 55 to 64 Years | 0 (0.0%) | 17 (2.9%) |
| 65 to 74 Years | 10 (4.4%) | 20 (8.7%) |
| 75 Years and over | 10 (21.7%) | 0 (0.0%) |
| Total | 169 (7.4%) | 442 (16.8%) |
Income Above Poverty by Sex and Age in Mount Carmel
According to the poverty statistics in Mount Carmel, males aged 5 years and females aged 5 years are the age groups that are most secure financially, with 100.0% of males and 100.0% of females in these age groups living above the poverty line.
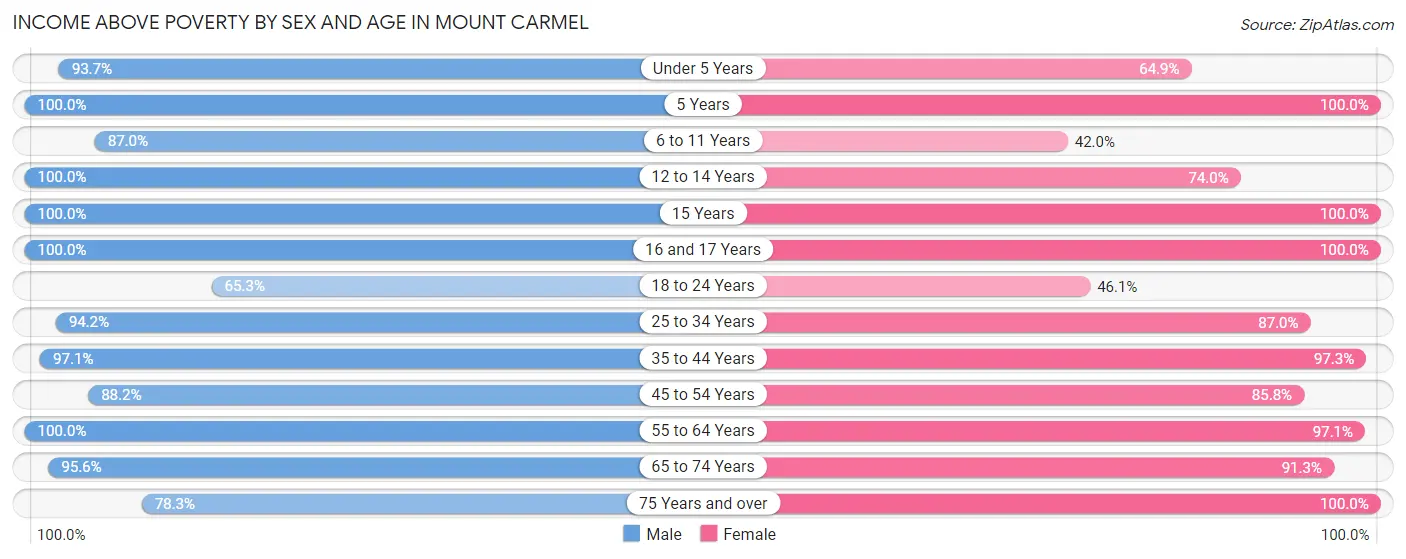
| Age Bracket | Male | Female |
| Under 5 Years | 118 (93.6%) | 109 (64.9%) |
| 5 Years | 58 (100.0%) | 10 (100.0%) |
| 6 to 11 Years | 200 (87.0%) | 86 (41.9%) |
| 12 to 14 Years | 7 (100.0%) | 74 (74.0%) |
| 15 Years | 31 (100.0%) | 7 (100.0%) |
| 16 and 17 Years | 44 (100.0%) | 10 (100.0%) |
| 18 to 24 Years | 79 (65.3%) | 77 (46.1%) |
| 25 to 34 Years | 341 (94.2%) | 434 (87.0%) |
| 35 to 44 Years | 370 (97.1%) | 288 (97.3%) |
| 45 to 54 Years | 276 (88.2%) | 229 (85.8%) |
| 55 to 64 Years | 336 (100.0%) | 565 (97.1%) |
| 65 to 74 Years | 216 (95.6%) | 210 (91.3%) |
| 75 Years and over | 36 (78.3%) | 87 (100.0%) |
| Total | 2,112 (92.6%) | 2,186 (83.2%) |
Income Below Poverty Among Married-Couple Families in Mount Carmel
The poverty statistics for married-couple families in Mount Carmel show that 3.6% or 28 of the total 785 families live below the poverty line. Families with no children have the highest poverty rate of 5.6%, comprising of 28 families. On the other hand, families with 1 or 2 children have the lowest poverty rate of 0.0%, which includes 0 families.
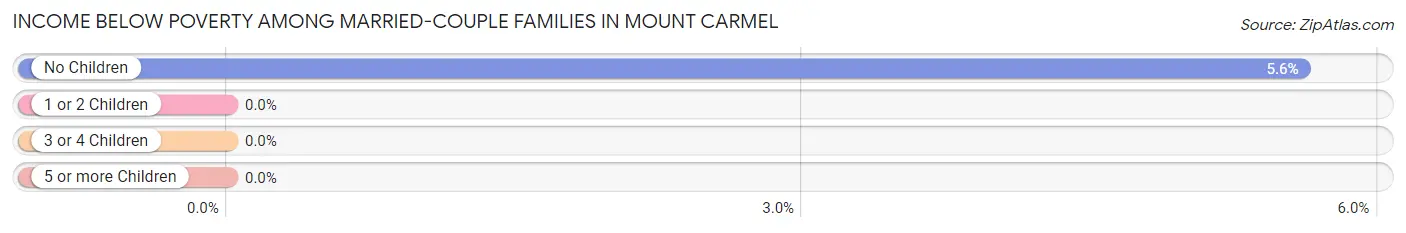
| Children | Above Poverty | Below Poverty |
| No Children | 472 (94.4%) | 28 (5.6%) |
| 1 or 2 Children | 232 (100.0%) | 0 (0.0%) |
| 3 or 4 Children | 44 (100.0%) | 0 (0.0%) |
| 5 or more Children | 9 (100.0%) | 0 (0.0%) |
| Total | 757 (96.4%) | 28 (3.6%) |
Income Below Poverty Among Single-Parent Households in Mount Carmel
According to the poverty data in Mount Carmel, 7.3% or 11 single-father households and 34.3% or 119 single-mother households are living below the poverty line. Among single-father households, those with 1 or 2 children have the highest poverty rate, with 11 households (19.3%) experiencing poverty. Likewise, among single-mother households, those with 3 or 4 children have the highest poverty rate, with 21 households (100.0%) falling below the poverty line.
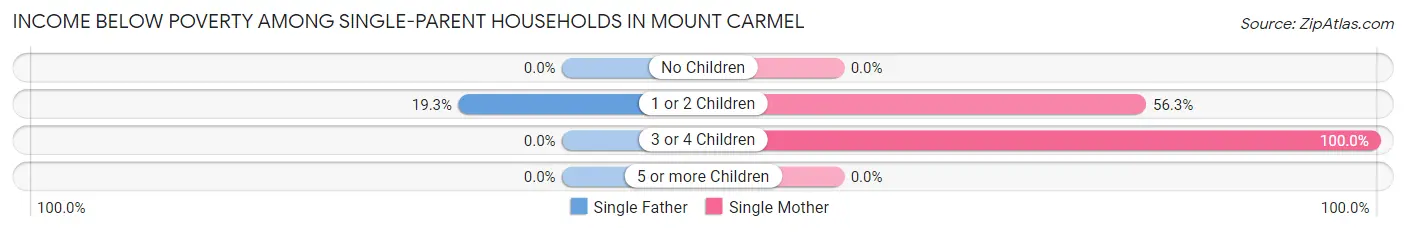
| Children | Single Father | Single Mother |
| No Children | 0 (0.0%) | 0 (0.0%) |
| 1 or 2 Children | 11 (19.3%) | 98 (56.3%) |
| 3 or 4 Children | 0 (0.0%) | 21 (100.0%) |
| 5 or more Children | 0 (0.0%) | 0 (0.0%) |
| Total | 11 (7.3%) | 119 (34.3%) |
Income Below Poverty Among Married-Couple vs Single-Parent Households in Mount Carmel
The poverty data for Mount Carmel shows that 28 of the married-couple family households (3.6%) and 130 of the single-parent households (26.1%) are living below the poverty level. Within the married-couple family households, those with no children have the highest poverty rate, with 28 households (5.6%) falling below the poverty line. Among the single-parent households, those with 3 or 4 children have the highest poverty rate, with 21 household (100.0%) living below poverty.
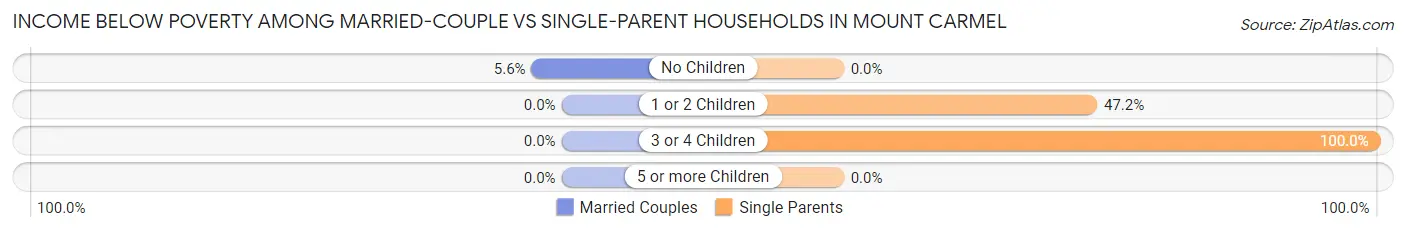
| Children | Married-Couple Families | Single-Parent Households |
| No Children | 28 (5.6%) | 0 (0.0%) |
| 1 or 2 Children | 0 (0.0%) | 109 (47.2%) |
| 3 or 4 Children | 0 (0.0%) | 21 (100.0%) |
| 5 or more Children | 0 (0.0%) | 0 (0.0%) |
| Total | 28 (3.6%) | 130 (26.1%) |
Employment Characteristics in Mount Carmel
Employment by Class of Employer in Mount Carmel
Among the 2,879 employed individuals in Mount Carmel, private company employees (2,175 | 75.5%), not-for-profit organizations (248 | 8.6%), and self-employed (not incorporated) (214 | 7.4%) make up the most common classes of employment.
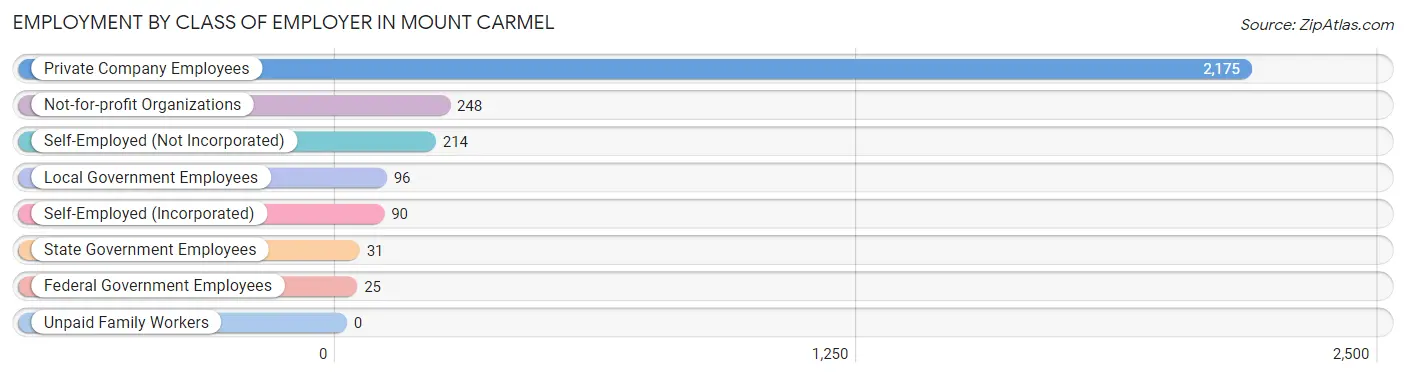
| Employer Class | # Employees | % Employees |
| Private Company Employees | 2,175 | 75.5% |
| Self-Employed (Incorporated) | 90 | 3.1% |
| Self-Employed (Not Incorporated) | 214 | 7.4% |
| Not-for-profit Organizations | 248 | 8.6% |
| Local Government Employees | 96 | 3.3% |
| State Government Employees | 31 | 1.1% |
| Federal Government Employees | 25 | 0.9% |
| Unpaid Family Workers | 0 | 0.0% |
| Total | 2,879 | 100.0% |
Employment Status by Age in Mount Carmel
According to the labor force statistics for Mount Carmel, out of the total population over 16 years of age (3,967), 76.0% or 3,015 individuals are in the labor force, with 1.0% or 30 of them unemployed. The age group with the highest labor force participation rate is 55 to 59 years, with 98.3% or 469 individuals in the labor force. Within the labor force, the 20 to 24 years age range has the highest percentage of unemployed individuals, with 9.4% or 22 of them being unemployed.
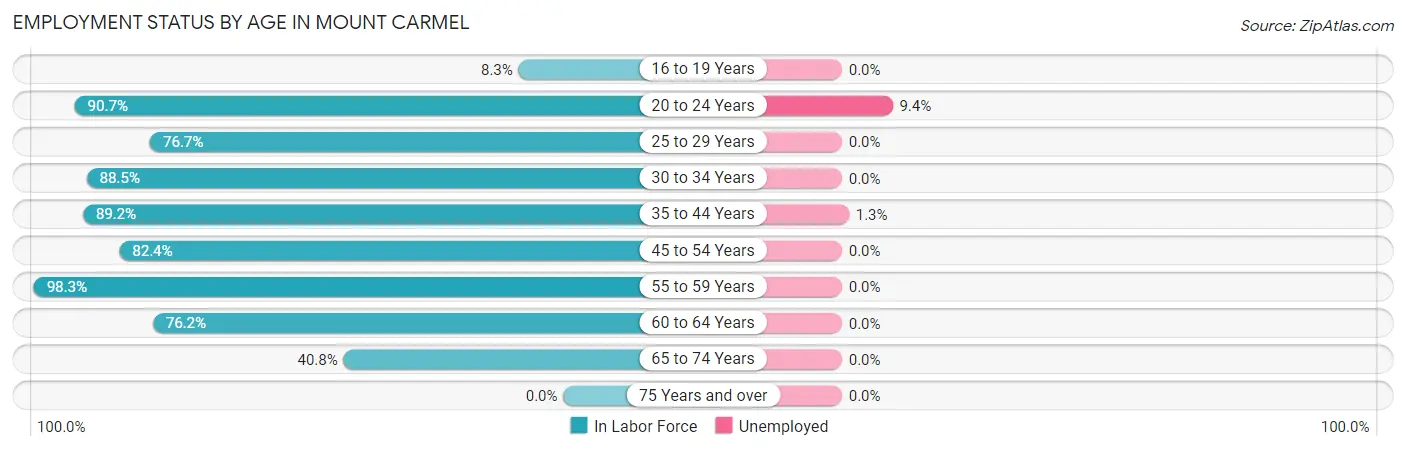
| Age Bracket | In Labor Force | Unemployed |
| 16 to 19 Years | 7 (8.3%) | 0 (0.0%) |
| 20 to 24 Years | 234 (90.7%) | 22 (9.4%) |
| 25 to 29 Years | 388 (76.7%) | 0 (0.0%) |
| 30 to 34 Years | 314 (88.5%) | 0 (0.0%) |
| 35 to 44 Years | 604 (89.2%) | 8 (1.3%) |
| 45 to 54 Years | 478 (82.4%) | 0 (0.0%) |
| 55 to 59 Years | 469 (98.3%) | 0 (0.0%) |
| 60 to 64 Years | 336 (76.2%) | 0 (0.0%) |
| 65 to 74 Years | 186 (40.8%) | 0 (0.0%) |
| 75 Years and over | 0 (0.0%) | 0 (0.0%) |
| Total | 3,015 (76.0%) | 30 (1.0%) |
Employment Status by Educational Attainment in Mount Carmel
According to labor force statistics for Mount Carmel, 85.3% of individuals (2,590) out of the total population between 25 and 64 years of age (3,036) are in the labor force, with 0.3% or 8 of them being unemployed. The group with the highest labor force participation rate are those with the educational attainment of bachelor's degree or higher, with 92.1% or 677 individuals in the labor force. Within the labor force, individuals with college / associate degree education have the highest percentage of unemployment, with 0.9% or 8 of them being unemployed.
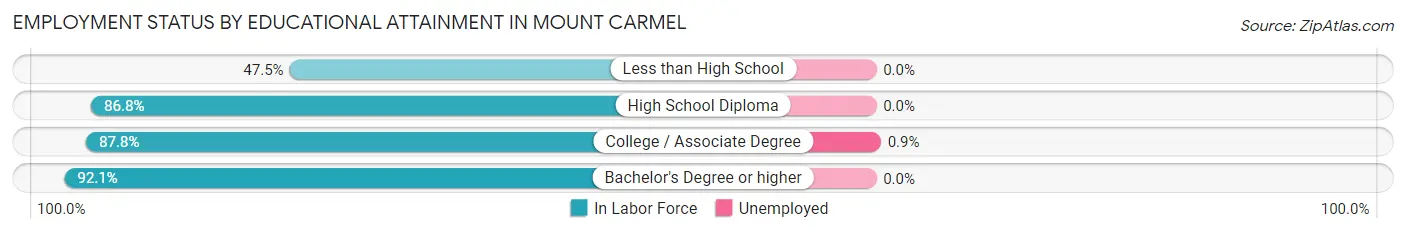
| Educational Attainment | In Labor Force | Unemployed |
| Less than High School | 115 (47.5%) | 0 (0.0%) |
| High School Diploma | 938 (86.8%) | 0 (0.0%) |
| College / Associate Degree | 859 (87.8%) | 9 (0.9%) |
| Bachelor's Degree or higher | 677 (92.1%) | 0 (0.0%) |
| Total | 2,590 (85.3%) | 9 (0.3%) |
Employment Occupations by Sex in Mount Carmel
Management, Business, Science and Arts Occupations
The most common Management, Business, Science and Arts occupations in Mount Carmel are Management (261 | 8.7%), Community & Social Service (254 | 8.5%), Education Instruction & Library (213 | 7.1%), Business & Financial (169 | 5.7%), and Computers, Engineering & Science (133 | 4.4%).
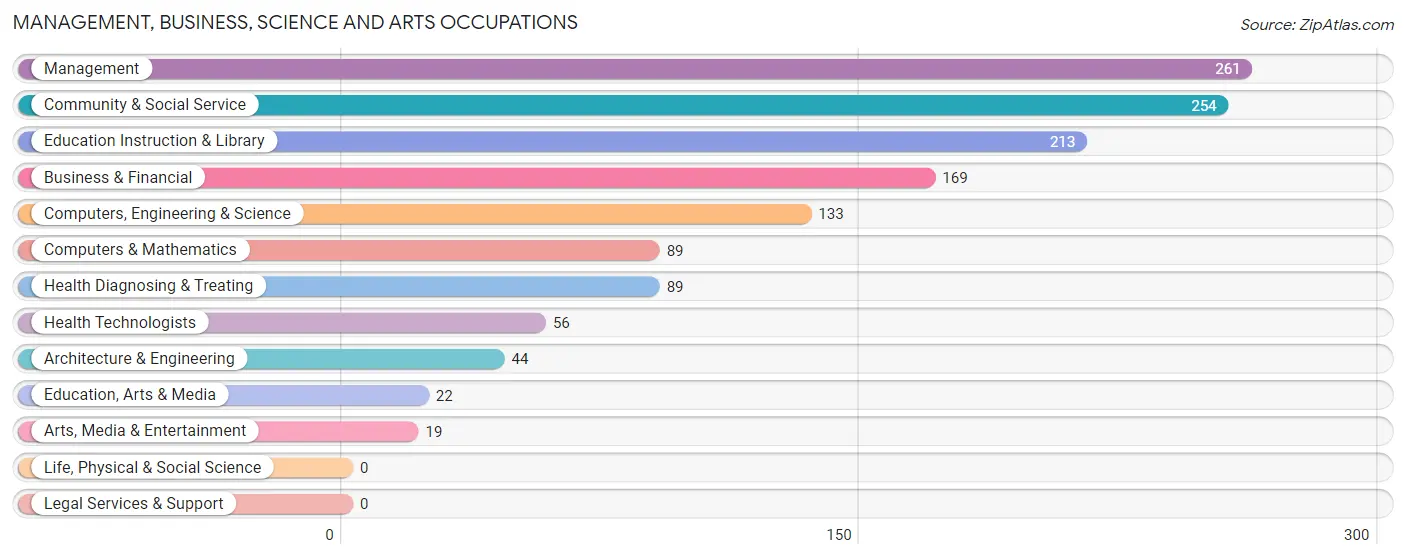
Management, Business, Science and Arts Occupations by Sex
Within the Management, Business, Science and Arts occupations in Mount Carmel, the most male-oriented occupations are Computers & Mathematics (100.0%), Computers, Engineering & Science (92.5%), and Architecture & Engineering (77.3%), while the most female-oriented occupations are Health Technologists (100.0%), Health Diagnosing & Treating (91.0%), and Business & Financial (78.1%).

| Occupation | Male | Female |
| Management | 187 (71.7%) | 74 (28.3%) |
| Business & Financial | 37 (21.9%) | 132 (78.1%) |
| Computers, Engineering & Science | 123 (92.5%) | 10 (7.5%) |
| Computers & Mathematics | 89 (100.0%) | 0 (0.0%) |
| Architecture & Engineering | 34 (77.3%) | 10 (22.7%) |
| Life, Physical & Social Science | 0 (0.0%) | 0 (0.0%) |
| Community & Social Service | 67 (26.4%) | 187 (73.6%) |
| Education, Arts & Media | 11 (50.0%) | 11 (50.0%) |
| Legal Services & Support | 0 (0.0%) | 0 (0.0%) |
| Education Instruction & Library | 47 (22.1%) | 166 (77.9%) |
| Arts, Media & Entertainment | 9 (47.4%) | 10 (52.6%) |
| Health Diagnosing & Treating | 8 (9.0%) | 81 (91.0%) |
| Health Technologists | 0 (0.0%) | 56 (100.0%) |
| Total (Category) | 422 (46.6%) | 484 (53.4%) |
| Total (Overall) | 1,421 (47.6%) | 1,565 (52.4%) |
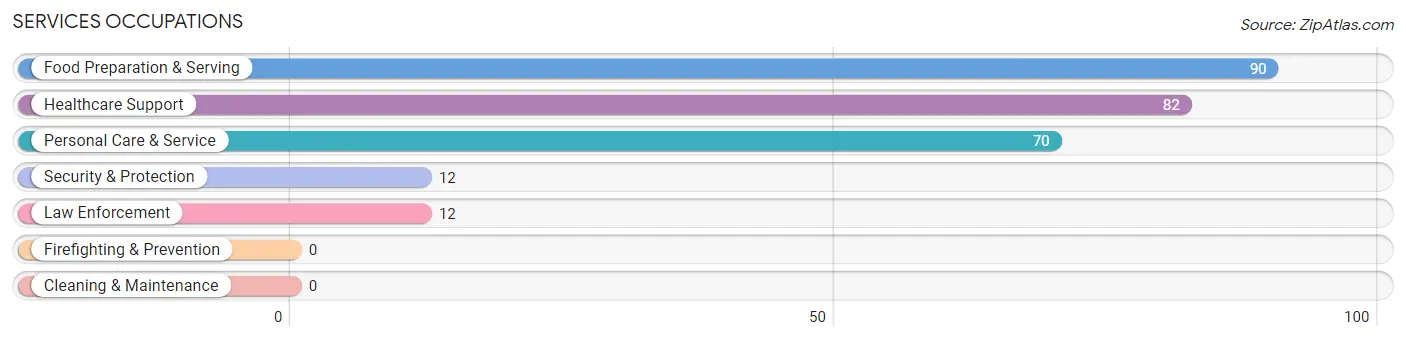
Services Occupations
The most common Services occupations in Mount Carmel are Food Preparation & Serving (90 | 3.0%), Healthcare Support (82 | 2.8%), Personal Care & Service (70 | 2.3%), Security & Protection (12 | 0.4%), and Law Enforcement (12 | 0.4%).
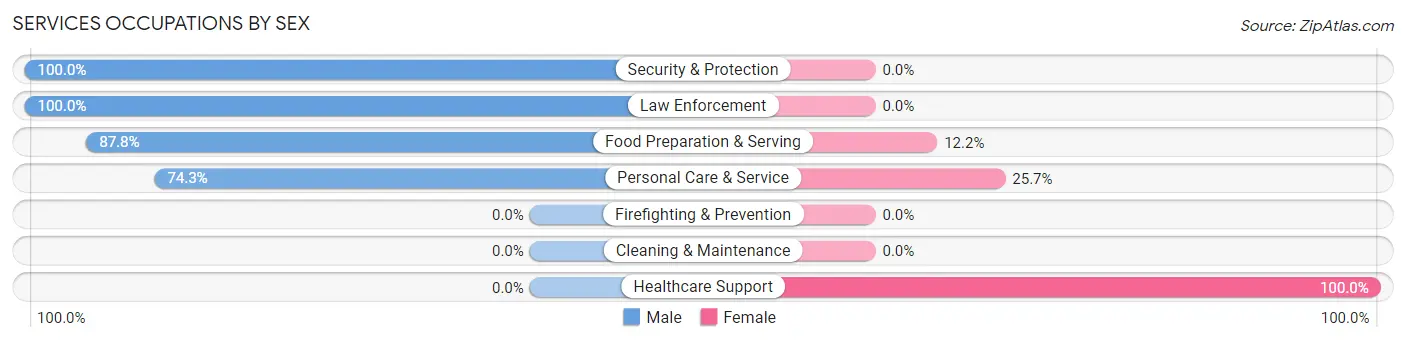
Services Occupations by Sex
Within the Services occupations in Mount Carmel, the most male-oriented occupations are Security & Protection (100.0%), Law Enforcement (100.0%), and Food Preparation & Serving (87.8%), while the most female-oriented occupations are Healthcare Support (100.0%), Personal Care & Service (25.7%), and Food Preparation & Serving (12.2%).
| Occupation | Male | Female |
| Healthcare Support | 0 (0.0%) | 82 (100.0%) |
| Security & Protection | 12 (100.0%) | 0 (0.0%) |
| Firefighting & Prevention | 0 (0.0%) | 0 (0.0%) |
| Law Enforcement | 12 (100.0%) | 0 (0.0%) |
| Food Preparation & Serving | 79 (87.8%) | 11 (12.2%) |
| Cleaning & Maintenance | 0 (0.0%) | 0 (0.0%) |
| Personal Care & Service | 52 (74.3%) | 18 (25.7%) |
| Total (Category) | 143 (56.3%) | 111 (43.7%) |
| Total (Overall) | 1,421 (47.6%) | 1,565 (52.4%) |
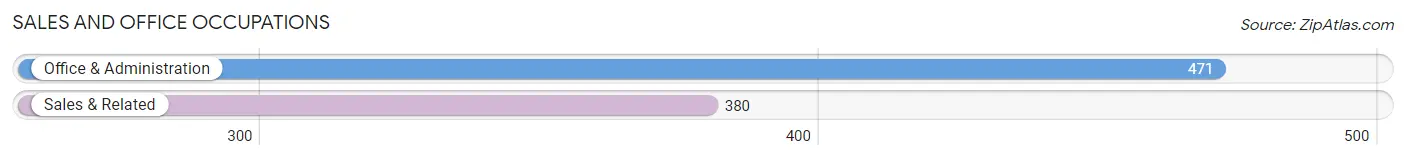
Sales and Office Occupations
The most common Sales and Office occupations in Mount Carmel are Office & Administration (471 | 15.8%), and Sales & Related (380 | 12.7%).
Sales and Office Occupations by Sex
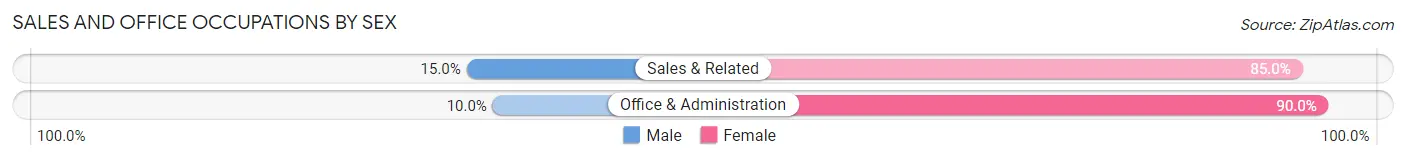
| Occupation | Male | Female |
| Sales & Related | 57 (15.0%) | 323 (85.0%) |
| Office & Administration | 47 (10.0%) | 424 (90.0%) |
| Total (Category) | 104 (12.2%) | 747 (87.8%) |
| Total (Overall) | 1,421 (47.6%) | 1,565 (52.4%) |
Natural Resources, Construction and Maintenance Occupations
The most common Natural Resources, Construction and Maintenance occupations in Mount Carmel are Construction & Extraction (294 | 9.9%), and Installation, Maintenance & Repair (89 | 3.0%).
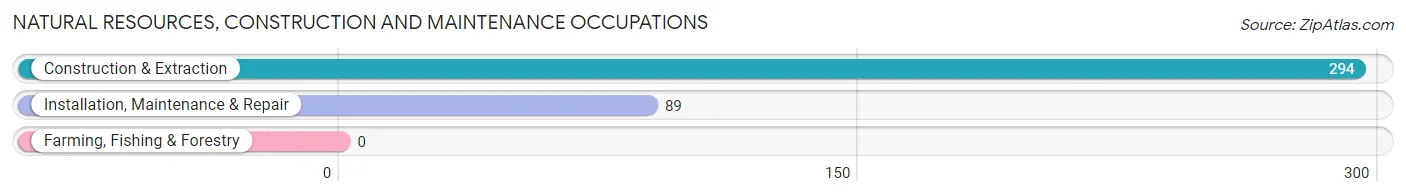
Natural Resources, Construction and Maintenance Occupations by Sex
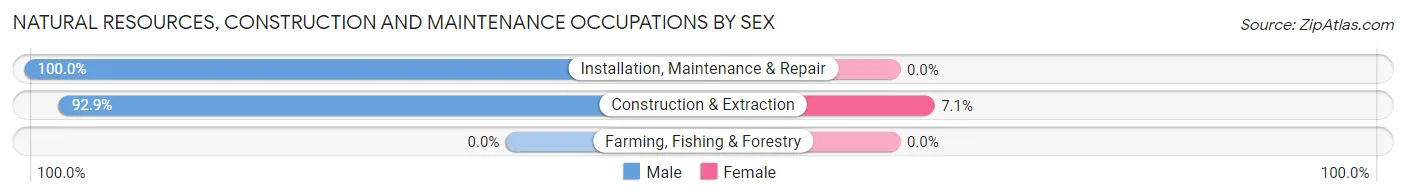
| Occupation | Male | Female |
| Farming, Fishing & Forestry | 0 (0.0%) | 0 (0.0%) |
| Construction & Extraction | 273 (92.9%) | 21 (7.1%) |
| Installation, Maintenance & Repair | 89 (100.0%) | 0 (0.0%) |
| Total (Category) | 362 (94.5%) | 21 (5.5%) |
| Total (Overall) | 1,421 (47.6%) | 1,565 (52.4%) |
Production, Transportation and Moving Occupations
The most common Production, Transportation and Moving occupations in Mount Carmel are Material Moving (218 | 7.3%), Production (215 | 7.2%), and Transportation (159 | 5.3%).
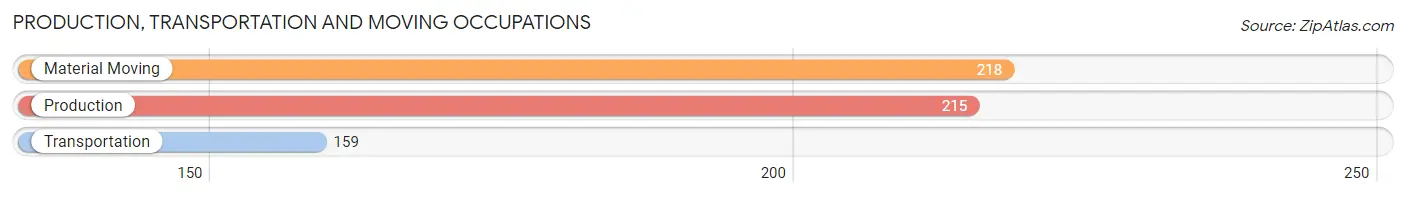
Production, Transportation and Moving Occupations by Sex

| Occupation | Male | Female |
| Production | 124 (57.7%) | 91 (42.3%) |
| Transportation | 113 (71.1%) | 46 (28.9%) |
| Material Moving | 153 (70.2%) | 65 (29.8%) |
| Total (Category) | 390 (65.9%) | 202 (34.1%) |
| Total (Overall) | 1,421 (47.6%) | 1,565 (52.4%) |
Employment Industries by Sex in Mount Carmel
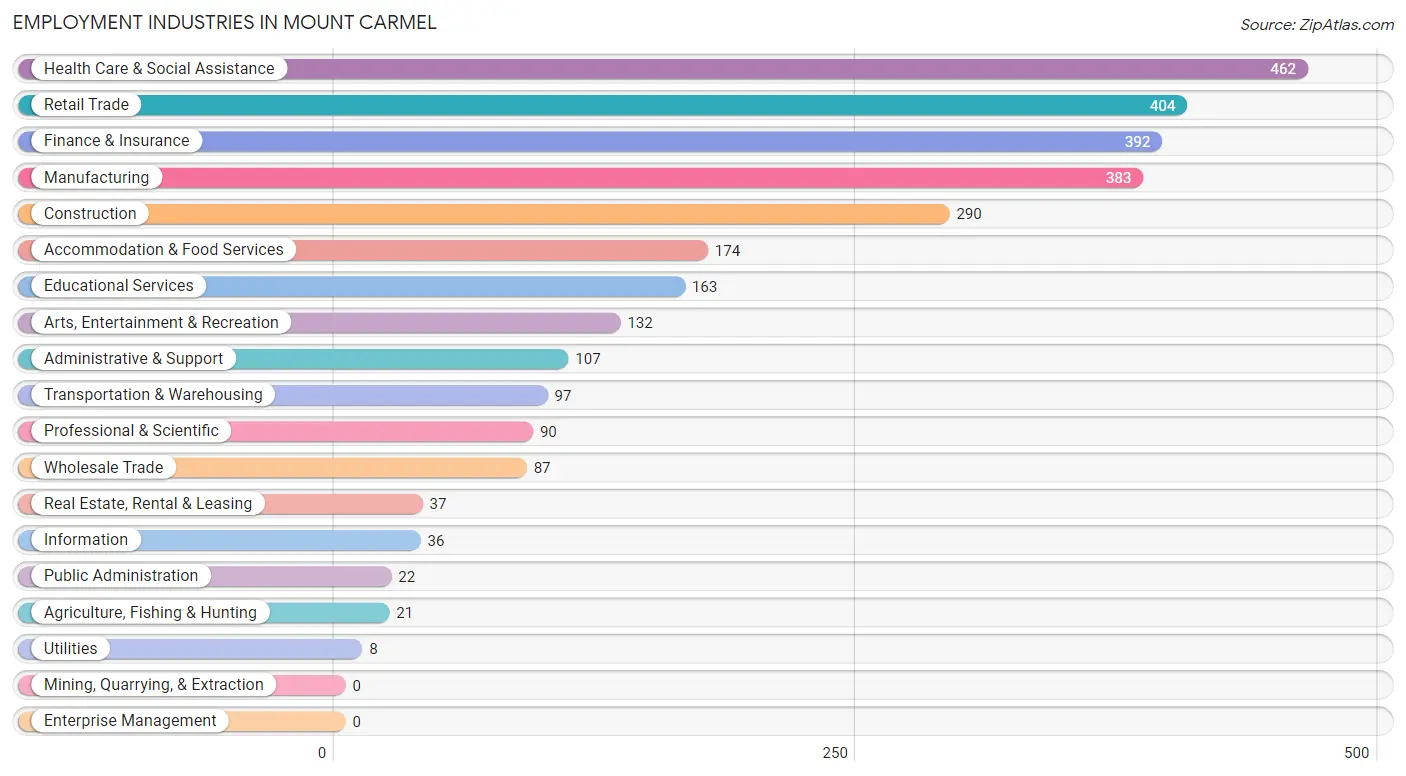
Employment Industries in Mount Carmel
The major employment industries in Mount Carmel include Health Care & Social Assistance (462 | 15.5%), Retail Trade (404 | 13.5%), Finance & Insurance (392 | 13.1%), Manufacturing (383 | 12.8%), and Construction (290 | 9.7%).
Employment Industries by Sex in Mount Carmel
The Mount Carmel industries that see more men than women are Agriculture, Fishing & Hunting (100.0%), Utilities (100.0%), and Construction (96.9%), whereas the industries that tend to have a higher number of women are Health Care & Social Assistance (81.4%), Real Estate, Rental & Leasing (73.0%), and Retail Trade (70.1%).
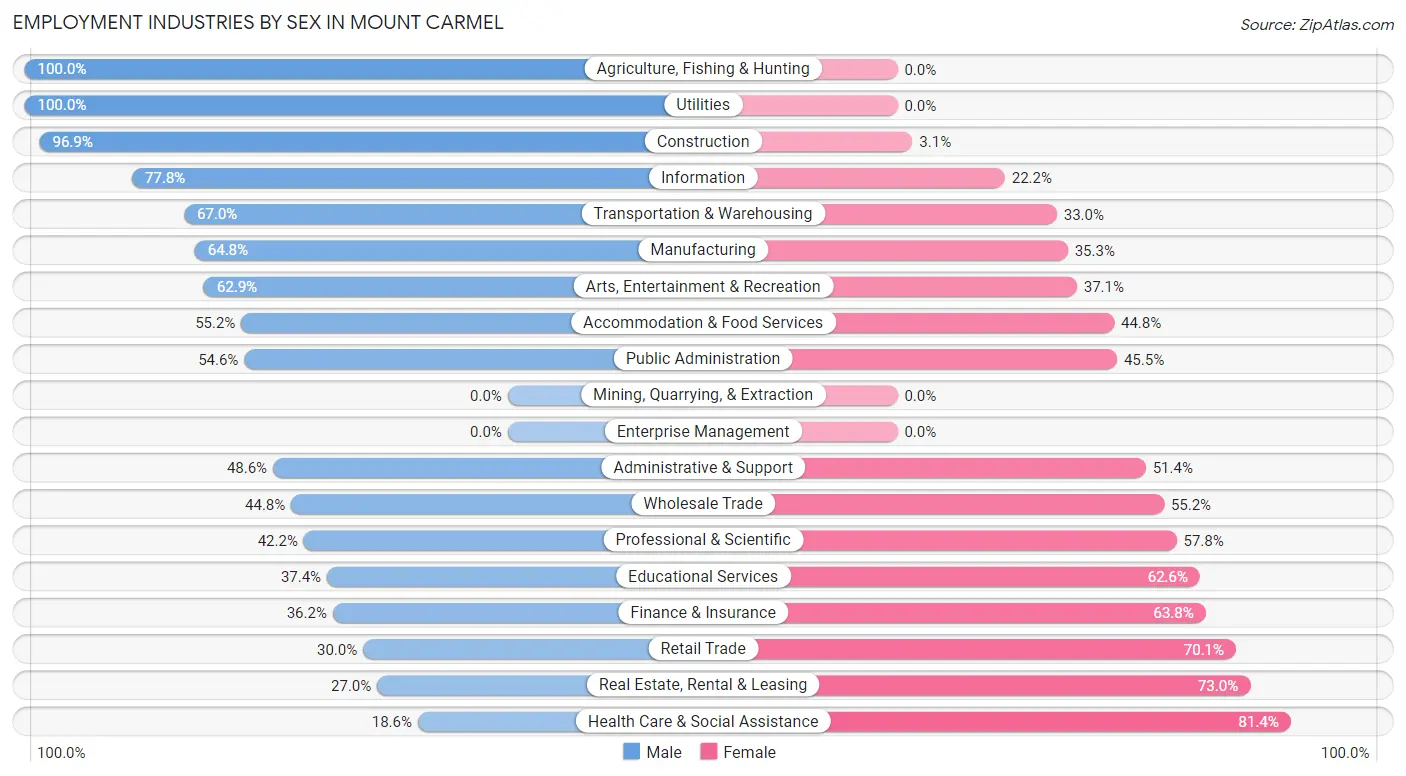
| Industry | Male | Female |
| Agriculture, Fishing & Hunting | 21 (100.0%) | 0 (0.0%) |
| Mining, Quarrying, & Extraction | 0 (0.0%) | 0 (0.0%) |
| Construction | 281 (96.9%) | 9 (3.1%) |
| Manufacturing | 248 (64.7%) | 135 (35.2%) |
| Wholesale Trade | 39 (44.8%) | 48 (55.2%) |
| Retail Trade | 121 (29.9%) | 283 (70.1%) |
| Transportation & Warehousing | 65 (67.0%) | 32 (33.0%) |
| Utilities | 8 (100.0%) | 0 (0.0%) |
| Information | 28 (77.8%) | 8 (22.2%) |
| Finance & Insurance | 142 (36.2%) | 250 (63.8%) |
| Real Estate, Rental & Leasing | 10 (27.0%) | 27 (73.0%) |
| Professional & Scientific | 38 (42.2%) | 52 (57.8%) |
| Enterprise Management | 0 (0.0%) | 0 (0.0%) |
| Administrative & Support | 52 (48.6%) | 55 (51.4%) |
| Educational Services | 61 (37.4%) | 102 (62.6%) |
| Health Care & Social Assistance | 86 (18.6%) | 376 (81.4%) |
| Arts, Entertainment & Recreation | 83 (62.9%) | 49 (37.1%) |
| Accommodation & Food Services | 96 (55.2%) | 78 (44.8%) |
| Public Administration | 12 (54.5%) | 10 (45.5%) |
| Total | 1,421 (47.6%) | 1,565 (52.4%) |
Education in Mount Carmel
School Enrollment in Mount Carmel
The most common levels of schooling among the 937 students in Mount Carmel are elementary school (244 | 26.0%), middle school (225 | 24.0%), and kindergarten (134 | 14.3%).

| School Level | # Students | % Students |
| Nursery / Preschool | 108 | 11.5% |
| Kindergarten | 134 | 14.3% |
| Elementary School | 244 | 26.0% |
| Middle School | 225 | 24.0% |
| High School | 117 | 12.5% |
| College / Undergraduate | 79 | 8.4% |
| Graduate / Professional | 30 | 3.2% |
| Total | 937 | 100.0% |
School Enrollment by Age by Funding Source in Mount Carmel
Out of a total of 937 students who are enrolled in schools in Mount Carmel, 170 (18.1%) attend a private institution, while the remaining 767 (81.9%) are enrolled in public schools. The age group of 3 to 4 year olds has the highest likelihood of being enrolled in private schools, with 83 (76.8% in the age bracket) enrolled. Conversely, the age group of 18 to 19 year olds has the lowest likelihood of being enrolled in a private school, with 18 (100.0% in the age bracket) attending a public institution.
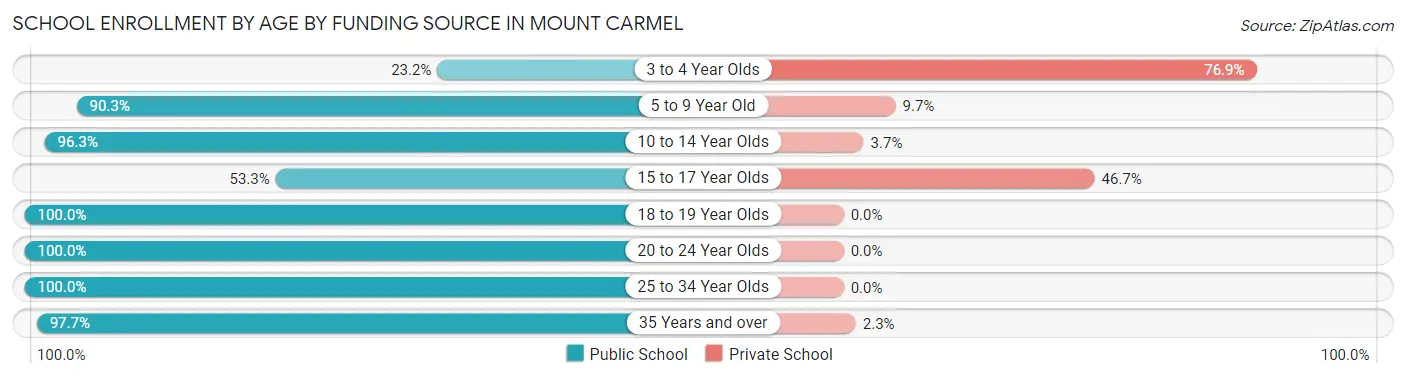
| Age Bracket | Public School | Private School |
| 3 to 4 Year Olds | 25 (23.2%) | 83 (76.8%) |
| 5 to 9 Year Old | 308 (90.3%) | 33 (9.7%) |
| 10 to 14 Year Olds | 259 (96.3%) | 10 (3.7%) |
| 15 to 17 Year Olds | 49 (53.3%) | 43 (46.7%) |
| 18 to 19 Year Olds | 18 (100.0%) | 0 (0.0%) |
| 20 to 24 Year Olds | 43 (100.0%) | 0 (0.0%) |
| 25 to 34 Year Olds | 22 (100.0%) | 0 (0.0%) |
| 35 Years and over | 43 (97.7%) | 1 (2.3%) |
| Total | 767 (81.9%) | 170 (18.1%) |
Educational Attainment by Field of Study in Mount Carmel
Business (278 | 33.5%), education (118 | 14.2%), liberal arts & history (113 | 13.6%), bio, nature & agricultural (77 | 9.3%), and science & technology (66 | 8.0%) are the most common fields of study among 829 individuals in Mount Carmel who have obtained a bachelor's degree or higher.
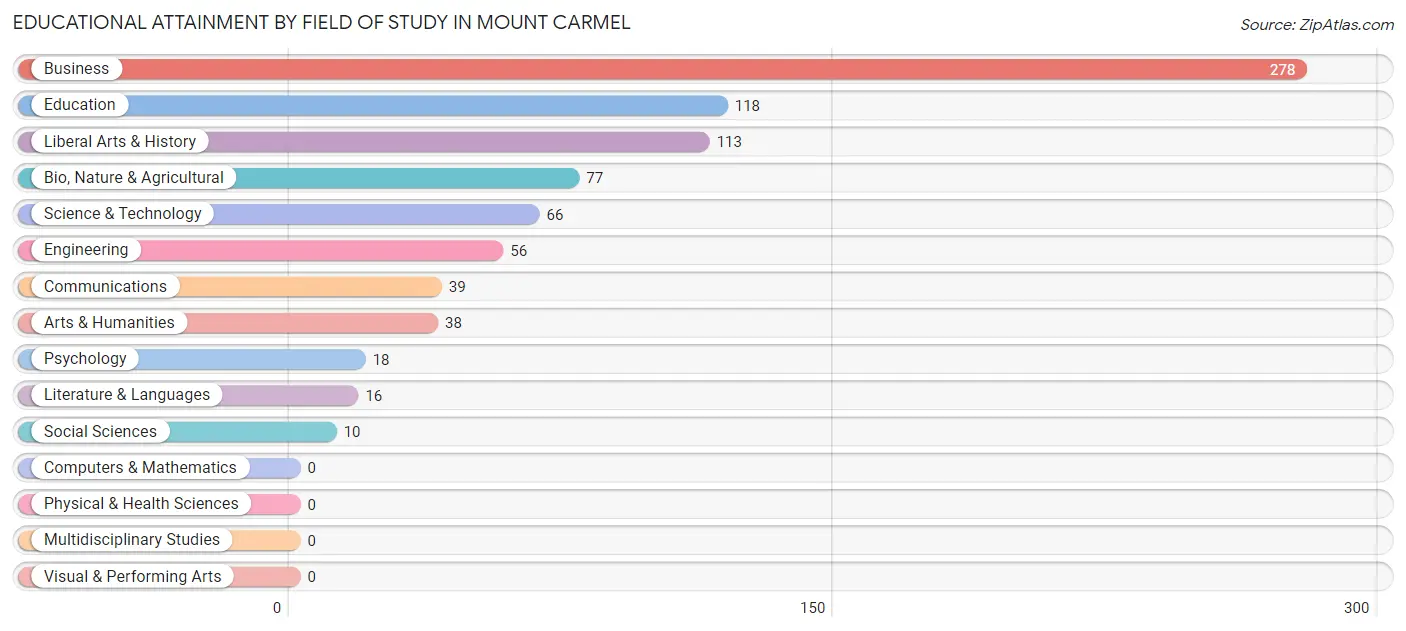
| Field of Study | # Graduates | % Graduates |
| Computers & Mathematics | 0 | 0.0% |
| Bio, Nature & Agricultural | 77 | 9.3% |
| Physical & Health Sciences | 0 | 0.0% |
| Psychology | 18 | 2.2% |
| Social Sciences | 10 | 1.2% |
| Engineering | 56 | 6.8% |
| Multidisciplinary Studies | 0 | 0.0% |
| Science & Technology | 66 | 8.0% |
| Business | 278 | 33.5% |
| Education | 118 | 14.2% |
| Literature & Languages | 16 | 1.9% |
| Liberal Arts & History | 113 | 13.6% |
| Visual & Performing Arts | 0 | 0.0% |
| Communications | 39 | 4.7% |
| Arts & Humanities | 38 | 4.6% |
| Total | 829 | 100.0% |
Transportation & Commute in Mount Carmel
Vehicle Availability by Sex in Mount Carmel
The most prevalent vehicle ownership categories in Mount Carmel are males with 2 vehicles (598, accounting for 44.2%) and females with 2 vehicles (629, making up 39.2%).
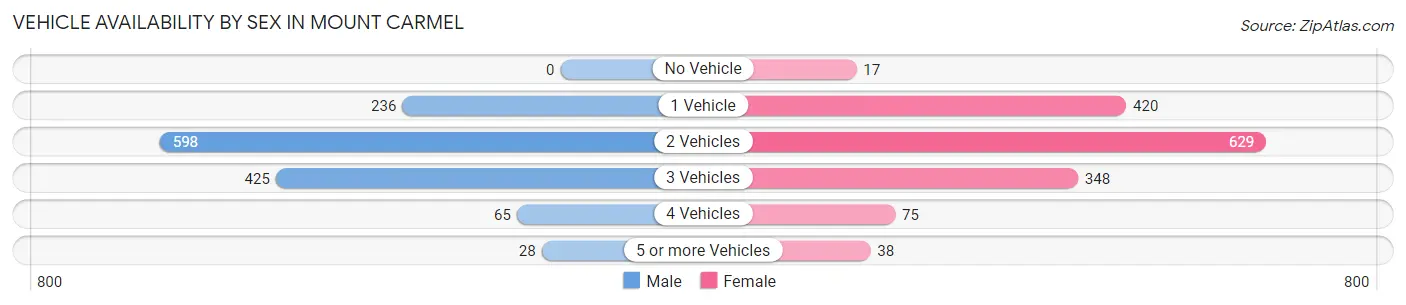
| Vehicles Available | Male | Female |
| No Vehicle | 0 (0.0%) | 17 (1.1%) |
| 1 Vehicle | 236 (17.5%) | 420 (27.5%) |
| 2 Vehicles | 598 (44.2%) | 629 (41.2%) |
| 3 Vehicles | 425 (31.4%) | 348 (22.8%) |
| 4 Vehicles | 65 (4.8%) | 75 (4.9%) |
| 5 or more Vehicles | 28 (2.1%) | 38 (2.5%) |
| Total | 1,352 (100.0%) | 1,527 (100.0%) |
Commute Time in Mount Carmel
The most frequently occuring commute durations in Mount Carmel are 30 to 34 minutes (520 commuters, 20.6%), 20 to 24 minutes (337 commuters, 13.4%), and 15 to 19 minutes (335 commuters, 13.3%).
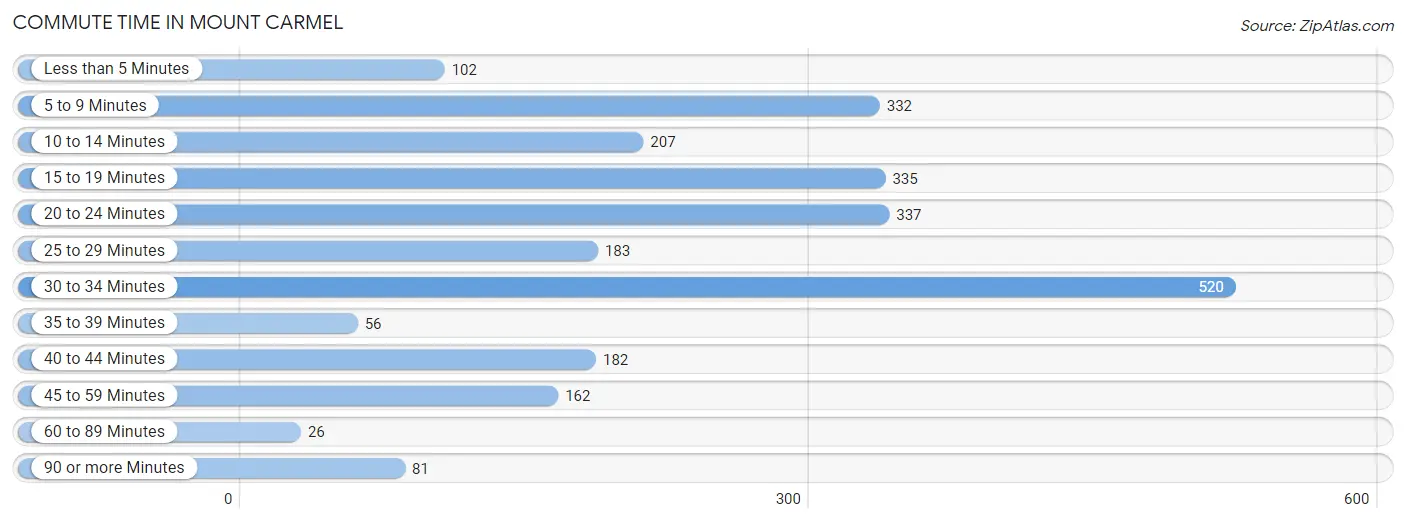
| Commute Time | # Commuters | % Commuters |
| Less than 5 Minutes | 102 | 4.0% |
| 5 to 9 Minutes | 332 | 13.2% |
| 10 to 14 Minutes | 207 | 8.2% |
| 15 to 19 Minutes | 335 | 13.3% |
| 20 to 24 Minutes | 337 | 13.4% |
| 25 to 29 Minutes | 183 | 7.2% |
| 30 to 34 Minutes | 520 | 20.6% |
| 35 to 39 Minutes | 56 | 2.2% |
| 40 to 44 Minutes | 182 | 7.2% |
| 45 to 59 Minutes | 162 | 6.4% |
| 60 to 89 Minutes | 26 | 1.0% |
| 90 or more Minutes | 81 | 3.2% |
Commute Time by Sex in Mount Carmel
The most common commute times in Mount Carmel are 30 to 34 minutes (271 commuters, 24.3%) for males and 30 to 34 minutes (249 commuters, 17.7%) for females.
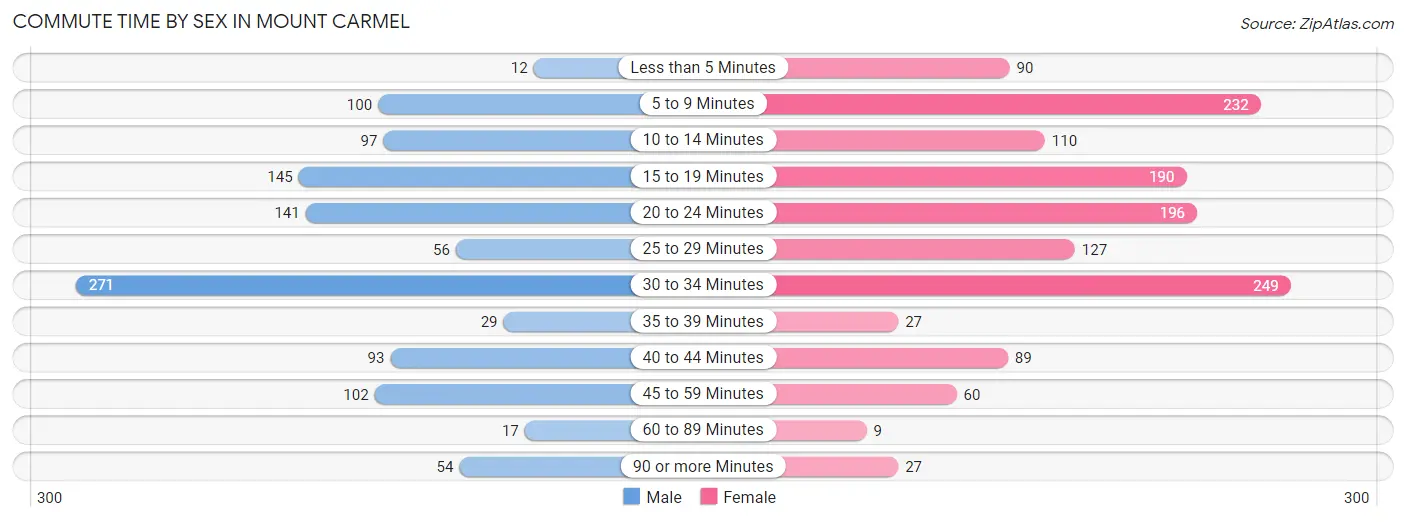
| Commute Time | Male | Female |
| Less than 5 Minutes | 12 (1.1%) | 90 (6.4%) |
| 5 to 9 Minutes | 100 (8.9%) | 232 (16.5%) |
| 10 to 14 Minutes | 97 (8.7%) | 110 (7.8%) |
| 15 to 19 Minutes | 145 (13.0%) | 190 (13.5%) |
| 20 to 24 Minutes | 141 (12.6%) | 196 (13.9%) |
| 25 to 29 Minutes | 56 (5.0%) | 127 (9.0%) |
| 30 to 34 Minutes | 271 (24.3%) | 249 (17.7%) |
| 35 to 39 Minutes | 29 (2.6%) | 27 (1.9%) |
| 40 to 44 Minutes | 93 (8.3%) | 89 (6.3%) |
| 45 to 59 Minutes | 102 (9.1%) | 60 (4.3%) |
| 60 to 89 Minutes | 17 (1.5%) | 9 (0.6%) |
| 90 or more Minutes | 54 (4.8%) | 27 (1.9%) |
Time of Departure to Work by Sex in Mount Carmel
The most frequent times of departure to work in Mount Carmel are 8:00 AM to 8:29 AM (182, 16.3%) for males and 6:30 AM to 6:59 AM (333, 23.7%) for females.
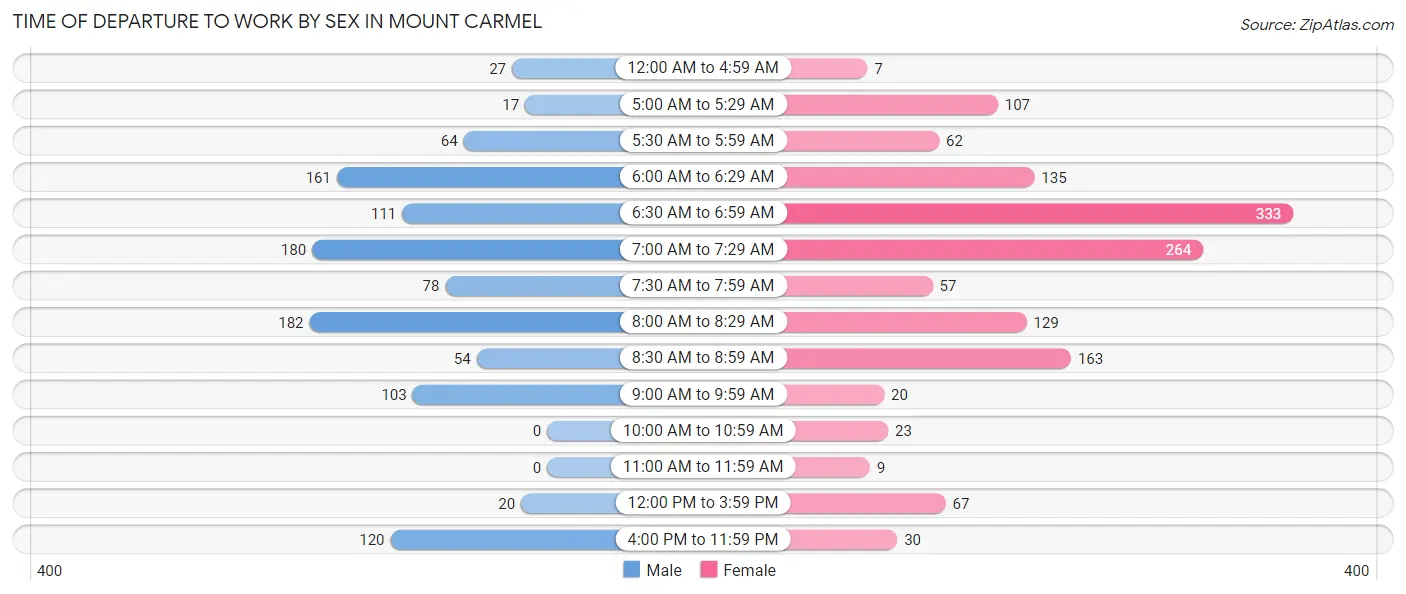
| Time of Departure | Male | Female |
| 12:00 AM to 4:59 AM | 27 (2.4%) | 7 (0.5%) |
| 5:00 AM to 5:29 AM | 17 (1.5%) | 107 (7.6%) |
| 5:30 AM to 5:59 AM | 64 (5.7%) | 62 (4.4%) |
| 6:00 AM to 6:29 AM | 161 (14.4%) | 135 (9.6%) |
| 6:30 AM to 6:59 AM | 111 (9.9%) | 333 (23.7%) |
| 7:00 AM to 7:29 AM | 180 (16.1%) | 264 (18.8%) |
| 7:30 AM to 7:59 AM | 78 (7.0%) | 57 (4.1%) |
| 8:00 AM to 8:29 AM | 182 (16.3%) | 129 (9.2%) |
| 8:30 AM to 8:59 AM | 54 (4.8%) | 163 (11.6%) |
| 9:00 AM to 9:59 AM | 103 (9.2%) | 20 (1.4%) |
| 10:00 AM to 10:59 AM | 0 (0.0%) | 23 (1.6%) |
| 11:00 AM to 11:59 AM | 0 (0.0%) | 9 (0.6%) |
| 12:00 PM to 3:59 PM | 20 (1.8%) | 67 (4.8%) |
| 4:00 PM to 11:59 PM | 120 (10.7%) | 30 (2.1%) |
| Total | 1,117 (100.0%) | 1,406 (100.0%) |
Housing Occupancy in Mount Carmel
Occupancy by Ownership in Mount Carmel
Of the total 2,110 dwellings in Mount Carmel, owner-occupied units account for 1,344 (63.7%), while renter-occupied units make up 766 (36.3%).
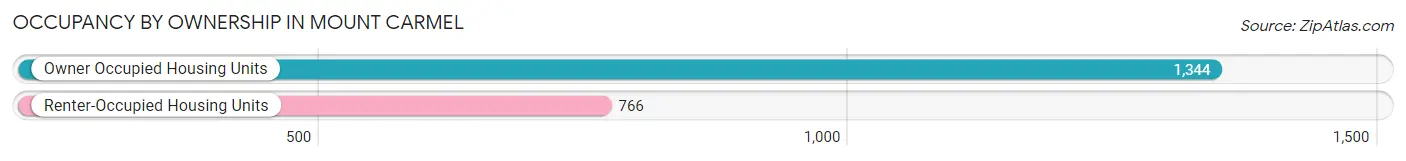
| Occupancy | # Housing Units | % Housing Units |
| Owner Occupied Housing Units | 1,344 | 63.7% |
| Renter-Occupied Housing Units | 766 | 36.3% |
| Total Occupied Housing Units | 2,110 | 100.0% |
Occupancy by Household Size in Mount Carmel
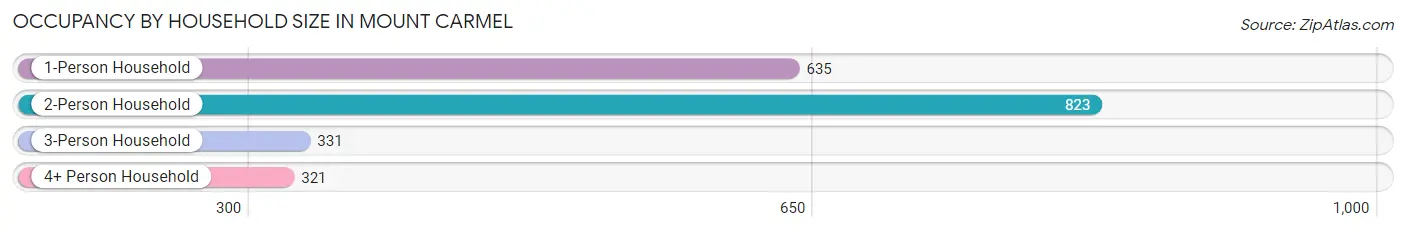
| Household Size | # Housing Units | % Housing Units |
| 1-Person Household | 635 | 30.1% |
| 2-Person Household | 823 | 39.0% |
| 3-Person Household | 331 | 15.7% |
| 4+ Person Household | 321 | 15.2% |
| Total Housing Units | 2,110 | 100.0% |
Occupancy by Ownership by Household Size in Mount Carmel
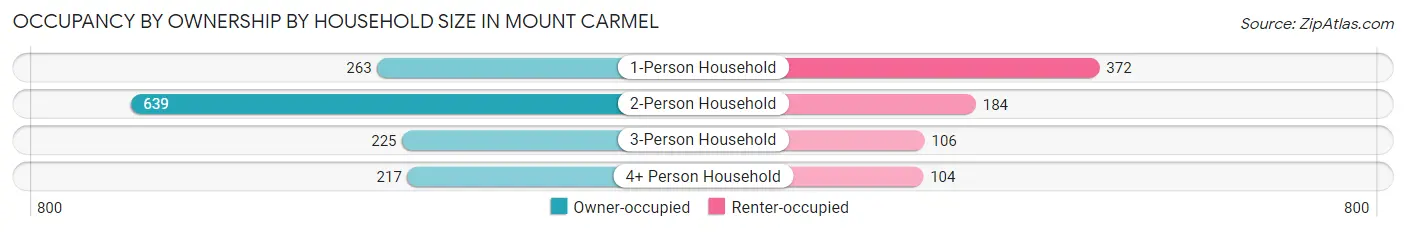
| Household Size | Owner-occupied | Renter-occupied |
| 1-Person Household | 263 (41.4%) | 372 (58.6%) |
| 2-Person Household | 639 (77.6%) | 184 (22.4%) |
| 3-Person Household | 225 (68.0%) | 106 (32.0%) |
| 4+ Person Household | 217 (67.6%) | 104 (32.4%) |
| Total Housing Units | 1,344 (63.7%) | 766 (36.3%) |
Occupancy by Educational Attainment in Mount Carmel
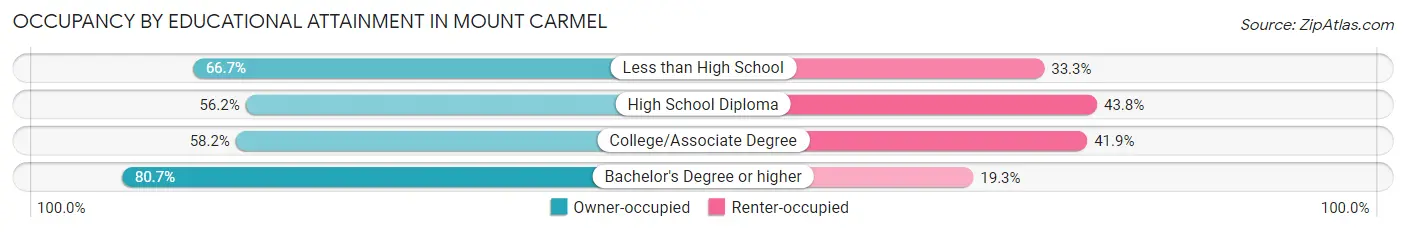
| Household Size | Owner-occupied | Renter-occupied |
| Less than High School | 122 (66.7%) | 61 (33.3%) |
| High School Diploma | 457 (56.2%) | 356 (43.8%) |
| College/Associate Degree | 346 (58.2%) | 249 (41.8%) |
| Bachelor's Degree or higher | 419 (80.7%) | 100 (19.3%) |
Occupancy by Age of Householder in Mount Carmel
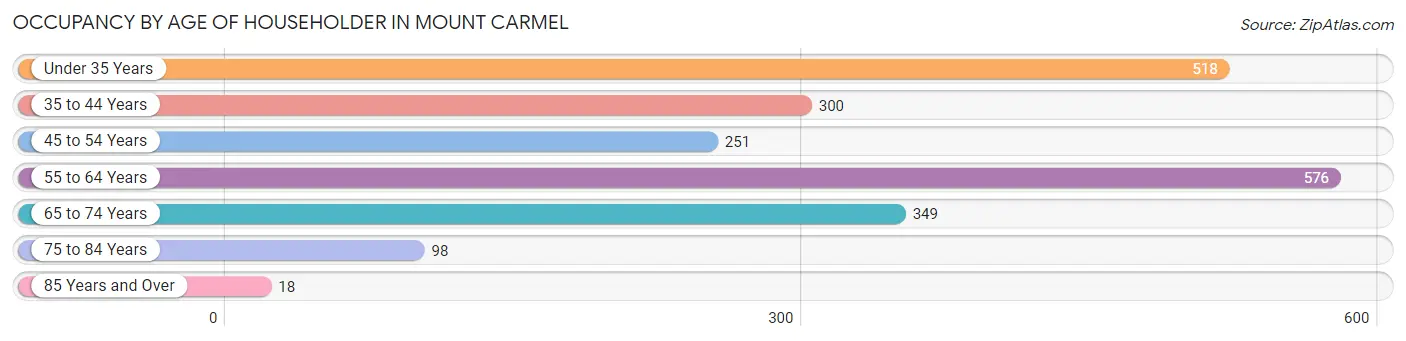
| Age Bracket | # Households | % Households |
| Under 35 Years | 518 | 24.5% |
| 35 to 44 Years | 300 | 14.2% |
| 45 to 54 Years | 251 | 11.9% |
| 55 to 64 Years | 576 | 27.3% |
| 65 to 74 Years | 349 | 16.5% |
| 75 to 84 Years | 98 | 4.6% |
| 85 Years and Over | 18 | 0.9% |
| Total | 2,110 | 100.0% |
Housing Finances in Mount Carmel
Median Income by Occupancy in Mount Carmel
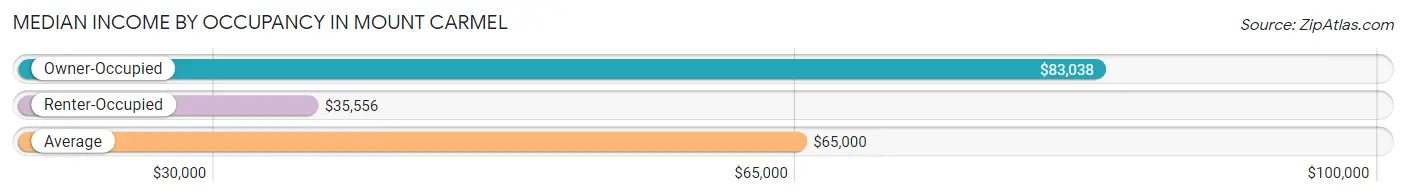
| Occupancy Type | # Households | Median Income |
| Owner-Occupied | 1,344 (63.7%) | $83,038 |
| Renter-Occupied | 766 (36.3%) | $35,556 |
| Average | 2,110 (100.0%) | $65,000 |
Occupancy by Householder Income Bracket in Mount Carmel
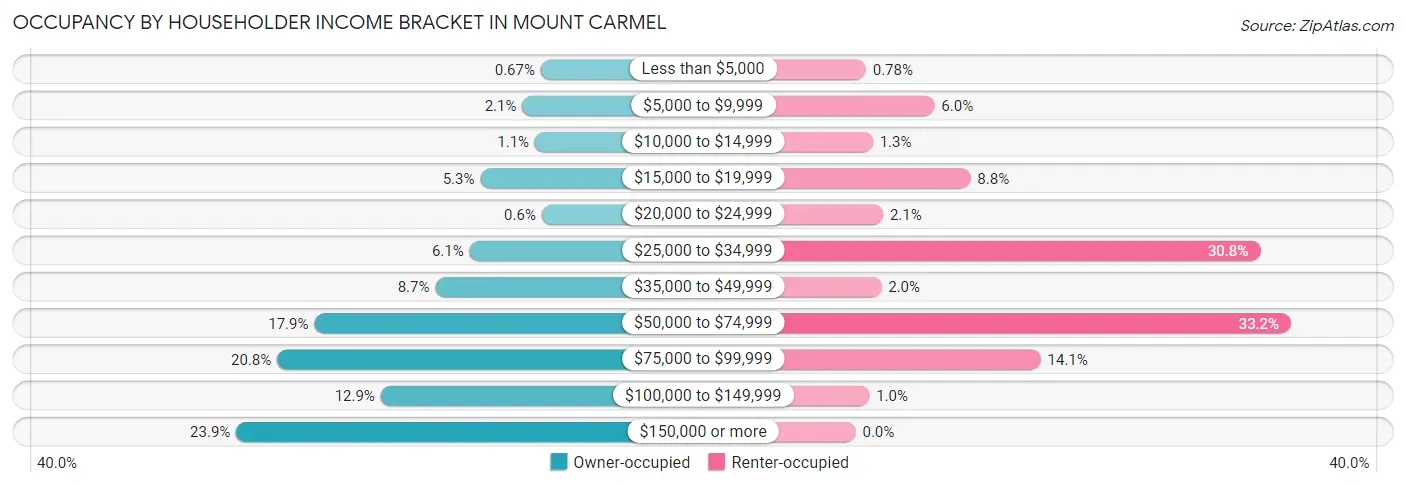
| Income Bracket | Owner-occupied | Renter-occupied |
| Less than $5,000 | 9 (0.7%) | 6 (0.8%) |
| $5,000 to $9,999 | 28 (2.1%) | 46 (6.0%) |
| $10,000 to $14,999 | 15 (1.1%) | 10 (1.3%) |
| $15,000 to $19,999 | 71 (5.3%) | 67 (8.7%) |
| $20,000 to $24,999 | 8 (0.6%) | 16 (2.1%) |
| $25,000 to $34,999 | 82 (6.1%) | 236 (30.8%) |
| $35,000 to $49,999 | 117 (8.7%) | 15 (2.0%) |
| $50,000 to $74,999 | 241 (17.9%) | 254 (33.2%) |
| $75,000 to $99,999 | 279 (20.8%) | 108 (14.1%) |
| $100,000 to $149,999 | 173 (12.9%) | 8 (1.0%) |
| $150,000 or more | 321 (23.9%) | 0 (0.0%) |
| Total | 1,344 (100.0%) | 766 (100.0%) |
Monthly Housing Cost Tiers in Mount Carmel
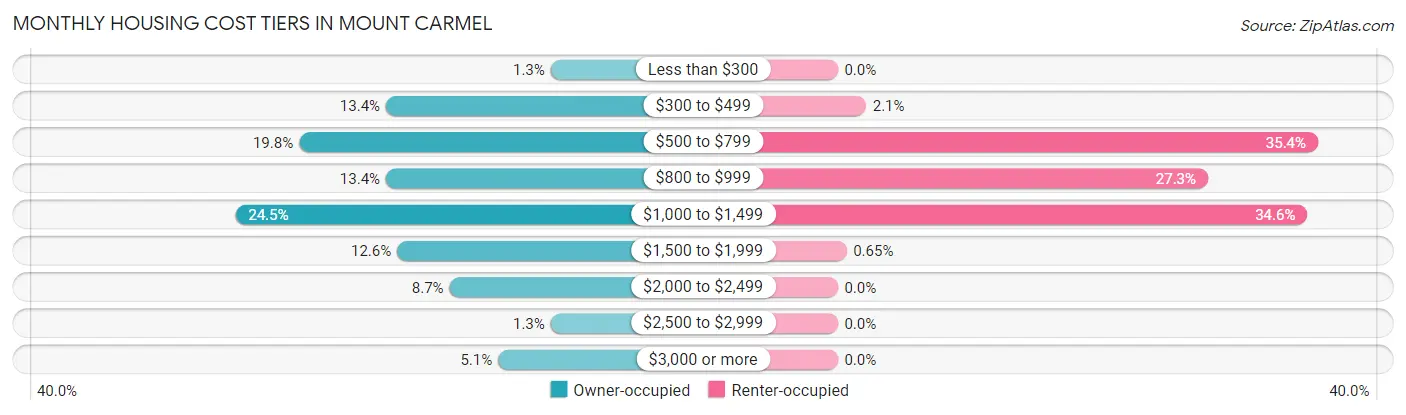
| Monthly Cost | Owner-occupied | Renter-occupied |
| Less than $300 | 17 (1.3%) | 0 (0.0%) |
| $300 to $499 | 180 (13.4%) | 16 (2.1%) |
| $500 to $799 | 266 (19.8%) | 271 (35.4%) |
| $800 to $999 | 180 (13.4%) | 209 (27.3%) |
| $1,000 to $1,499 | 329 (24.5%) | 265 (34.6%) |
| $1,500 to $1,999 | 169 (12.6%) | 5 (0.6%) |
| $2,000 to $2,499 | 117 (8.7%) | 0 (0.0%) |
| $2,500 to $2,999 | 17 (1.3%) | 0 (0.0%) |
| $3,000 or more | 69 (5.1%) | 0 (0.0%) |
| Total | 1,344 (100.0%) | 766 (100.0%) |
Physical Housing Characteristics in Mount Carmel
Housing Structures in Mount Carmel
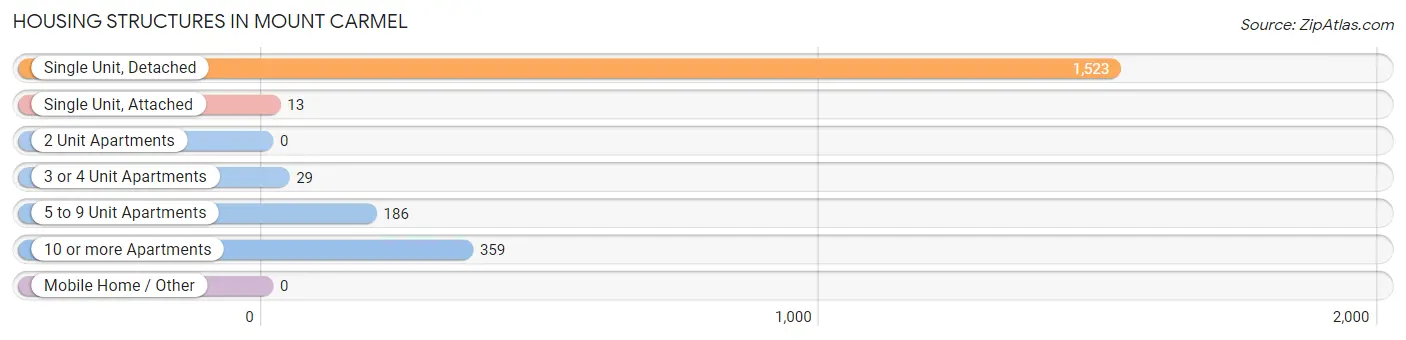
| Structure Type | # Housing Units | % Housing Units |
| Single Unit, Detached | 1,523 | 72.2% |
| Single Unit, Attached | 13 | 0.6% |
| 2 Unit Apartments | 0 | 0.0% |
| 3 or 4 Unit Apartments | 29 | 1.4% |
| 5 to 9 Unit Apartments | 186 | 8.8% |
| 10 or more Apartments | 359 | 17.0% |
| Mobile Home / Other | 0 | 0.0% |
| Total | 2,110 | 100.0% |
Housing Structures by Occupancy in Mount Carmel
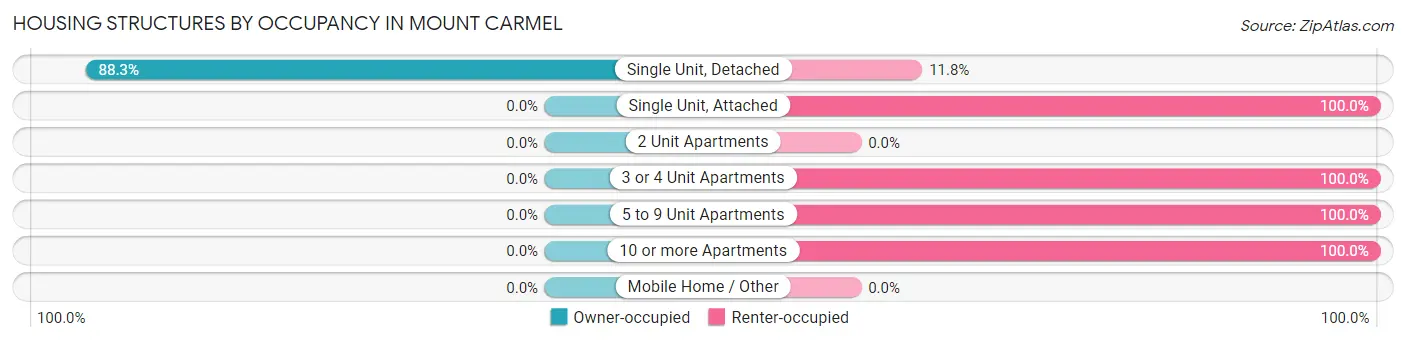
| Structure Type | Owner-occupied | Renter-occupied |
| Single Unit, Detached | 1,344 (88.2%) | 179 (11.7%) |
| Single Unit, Attached | 0 (0.0%) | 13 (100.0%) |
| 2 Unit Apartments | 0 (0.0%) | 0 (0.0%) |
| 3 or 4 Unit Apartments | 0 (0.0%) | 29 (100.0%) |
| 5 to 9 Unit Apartments | 0 (0.0%) | 186 (100.0%) |
| 10 or more Apartments | 0 (0.0%) | 359 (100.0%) |
| Mobile Home / Other | 0 (0.0%) | 0 (0.0%) |
| Total | 1,344 (63.7%) | 766 (36.3%) |
Housing Structures by Number of Rooms in Mount Carmel
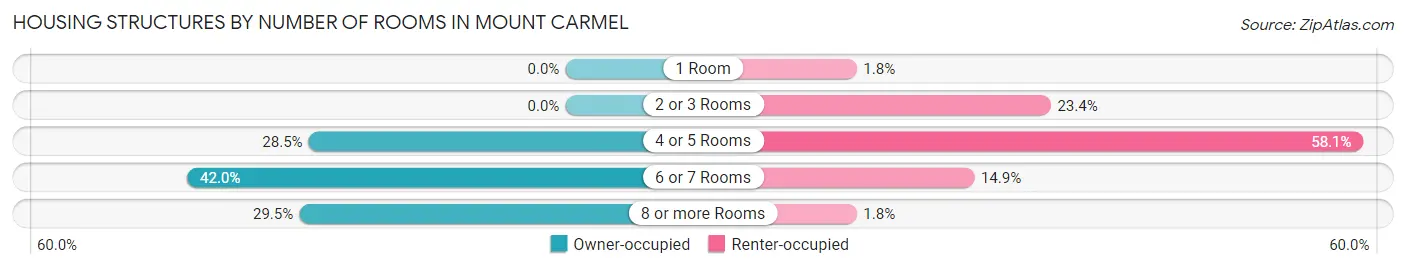
| Number of Rooms | Owner-occupied | Renter-occupied |
| 1 Room | 0 (0.0%) | 14 (1.8%) |
| 2 or 3 Rooms | 0 (0.0%) | 179 (23.4%) |
| 4 or 5 Rooms | 383 (28.5%) | 445 (58.1%) |
| 6 or 7 Rooms | 564 (42.0%) | 114 (14.9%) |
| 8 or more Rooms | 397 (29.5%) | 14 (1.8%) |
| Total | 1,344 (100.0%) | 766 (100.0%) |
Housing Structure by Heating Type in Mount Carmel
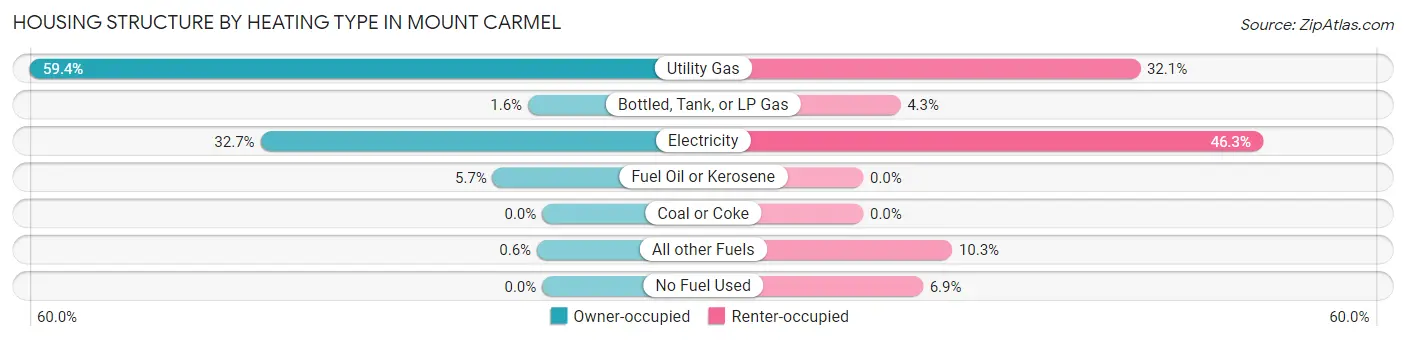
| Heating Type | Owner-occupied | Renter-occupied |
| Utility Gas | 798 (59.4%) | 246 (32.1%) |
| Bottled, Tank, or LP Gas | 22 (1.6%) | 33 (4.3%) |
| Electricity | 439 (32.7%) | 355 (46.3%) |
| Fuel Oil or Kerosene | 77 (5.7%) | 0 (0.0%) |
| Coal or Coke | 0 (0.0%) | 0 (0.0%) |
| All other Fuels | 8 (0.6%) | 79 (10.3%) |
| No Fuel Used | 0 (0.0%) | 53 (6.9%) |
| Total | 1,344 (100.0%) | 766 (100.0%) |
Household Vehicle Usage in Mount Carmel
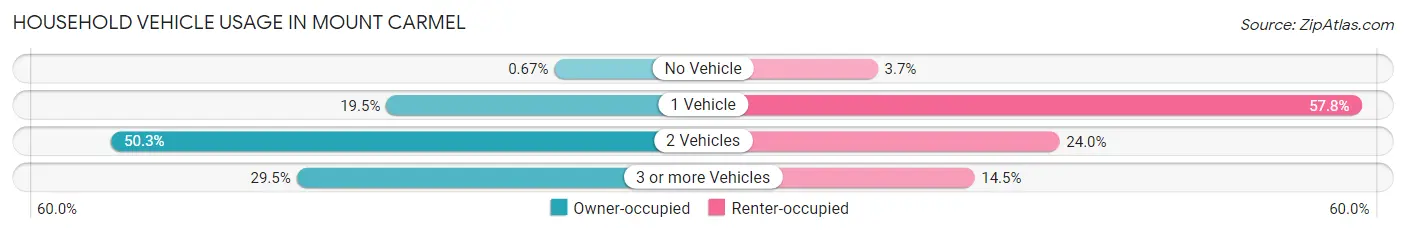
| Vehicles per Household | Owner-occupied | Renter-occupied |
| No Vehicle | 9 (0.7%) | 28 (3.7%) |
| 1 Vehicle | 262 (19.5%) | 443 (57.8%) |
| 2 Vehicles | 676 (50.3%) | 184 (24.0%) |
| 3 or more Vehicles | 397 (29.5%) | 111 (14.5%) |
| Total | 1,344 (100.0%) | 766 (100.0%) |
Real Estate & Mortgages in Mount Carmel
Real Estate and Mortgage Overview in Mount Carmel
| Characteristic | Without Mortgage | With Mortgage |
| Housing Units | 458 | 886 |
| Median Property Value | $158,500 | $200,700 |
| Median Household Income | $48,472 | $278 |
| Monthly Housing Costs | $521 | $69 |
| Real Estate Taxes | $2,420 | $15 |
Property Value by Mortgage Status in Mount Carmel
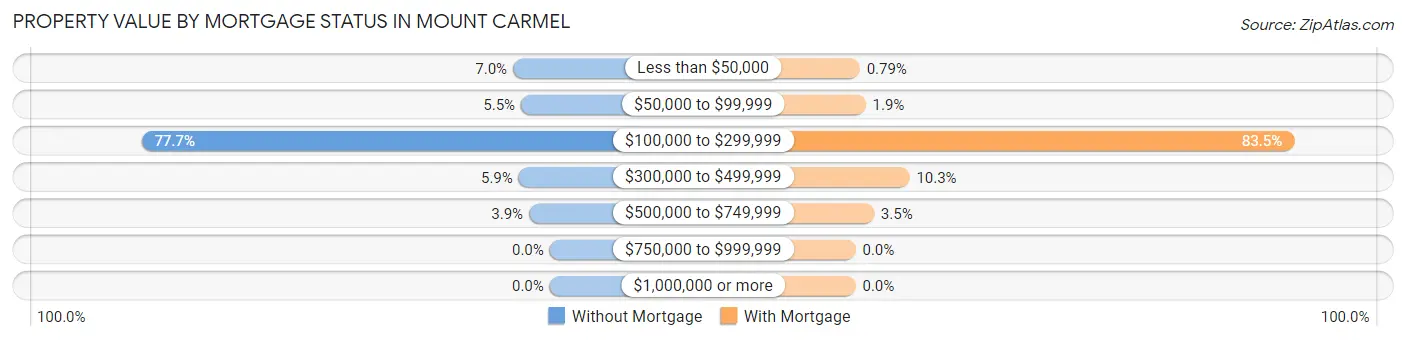
| Property Value | Without Mortgage | With Mortgage |
| Less than $50,000 | 32 (7.0%) | 7 (0.8%) |
| $50,000 to $99,999 | 25 (5.5%) | 17 (1.9%) |
| $100,000 to $299,999 | 356 (77.7%) | 740 (83.5%) |
| $300,000 to $499,999 | 27 (5.9%) | 91 (10.3%) |
| $500,000 to $749,999 | 18 (3.9%) | 31 (3.5%) |
| $750,000 to $999,999 | 0 (0.0%) | 0 (0.0%) |
| $1,000,000 or more | 0 (0.0%) | 0 (0.0%) |
| Total | 458 (100.0%) | 886 (100.0%) |
Household Income by Mortgage Status in Mount Carmel
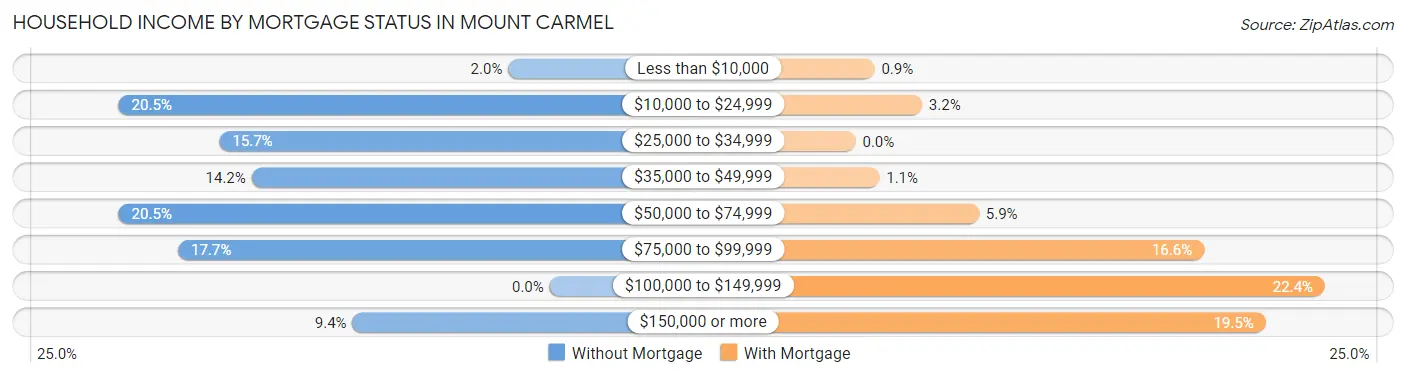
| Household Income | Without Mortgage | With Mortgage |
| Less than $10,000 | 9 (2.0%) | 8 (0.9%) |
| $10,000 to $24,999 | 94 (20.5%) | 28 (3.2%) |
| $25,000 to $34,999 | 72 (15.7%) | 0 (0.0%) |
| $35,000 to $49,999 | 65 (14.2%) | 10 (1.1%) |
| $50,000 to $74,999 | 94 (20.5%) | 52 (5.9%) |
| $75,000 to $99,999 | 81 (17.7%) | 147 (16.6%) |
| $100,000 to $149,999 | 0 (0.0%) | 198 (22.4%) |
| $150,000 or more | 43 (9.4%) | 173 (19.5%) |
| Total | 458 (100.0%) | 886 (100.0%) |
Property Value to Household Income Ratio in Mount Carmel

| Value-to-Income Ratio | Without Mortgage | With Mortgage |
| Less than 2.0x | 97 (21.2%) | 103,167 (11,644.1%) |
| 2.0x to 2.9x | 160 (34.9%) | 399 (45.0%) |
| 3.0x to 3.9x | 29 (6.3%) | 308 (34.8%) |
| 4.0x or more | 163 (35.6%) | 73 (8.2%) |
| Total | 458 (100.0%) | 886 (100.0%) |
Real Estate Taxes by Mortgage Status in Mount Carmel
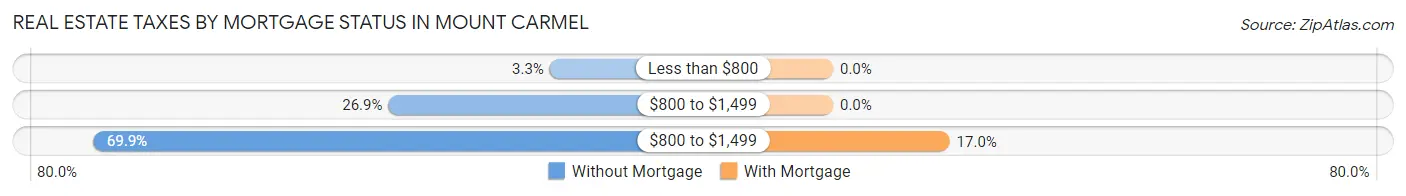
| Property Taxes | Without Mortgage | With Mortgage |
| Less than $800 | 15 (3.3%) | 0 (0.0%) |
| $800 to $1,499 | 123 (26.9%) | 0 (0.0%) |
| $800 to $1,499 | 320 (69.9%) | 151 (17.0%) |
| Total | 458 (100.0%) | 886 (100.0%) |
Health & Disability in Mount Carmel
Health Insurance Coverage by Age in Mount Carmel
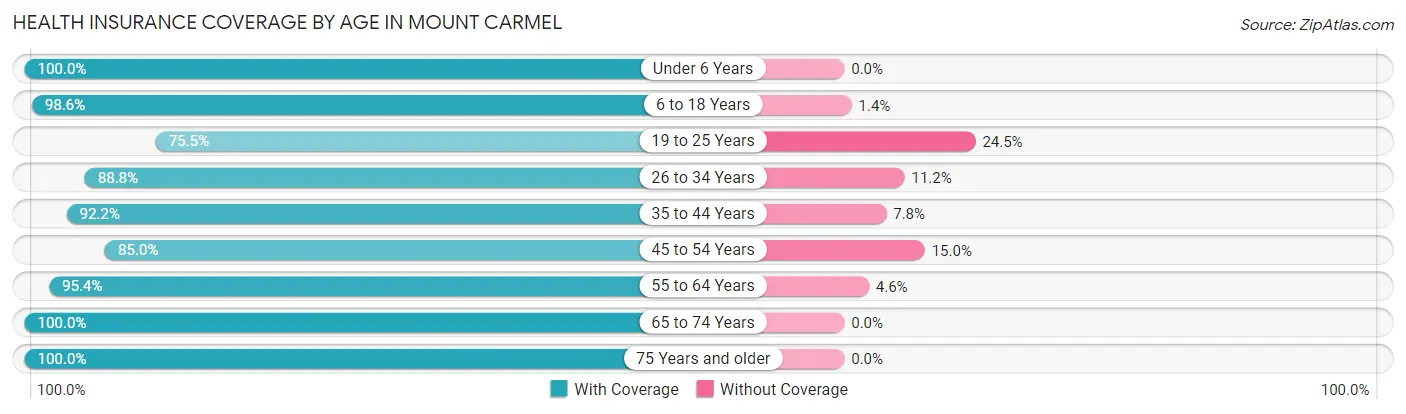
| Age Bracket | With Coverage | Without Coverage |
| Under 6 Years | 377 (100.0%) | 0 (0.0%) |
| 6 to 18 Years | 655 (98.6%) | 9 (1.4%) |
| 19 to 25 Years | 281 (75.5%) | 91 (24.5%) |
| 26 to 34 Years | 663 (88.8%) | 84 (11.2%) |
| 35 to 44 Years | 624 (92.2%) | 53 (7.8%) |
| 45 to 54 Years | 493 (85.0%) | 87 (15.0%) |
| 55 to 64 Years | 876 (95.4%) | 42 (4.6%) |
| 65 to 74 Years | 456 (100.0%) | 0 (0.0%) |
| 75 Years and older | 133 (100.0%) | 0 (0.0%) |
| Total | 4,558 (92.6%) | 366 (7.4%) |
Health Insurance Coverage by Citizenship Status in Mount Carmel
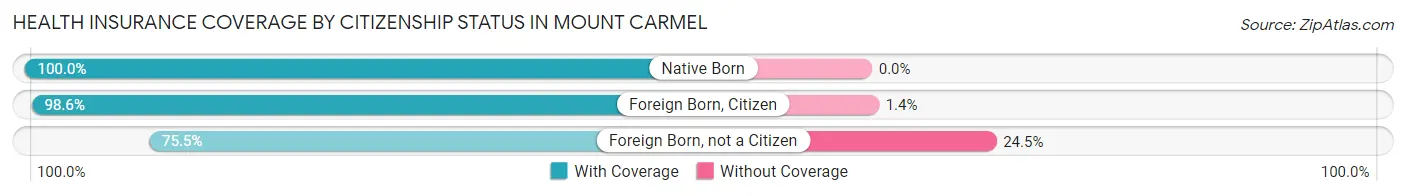
| Citizenship Status | With Coverage | Without Coverage |
| Native Born | 377 (100.0%) | 0 (0.0%) |
| Foreign Born, Citizen | 655 (98.6%) | 9 (1.4%) |
| Foreign Born, not a Citizen | 281 (75.5%) | 91 (24.5%) |
Health Insurance Coverage by Household Income in Mount Carmel
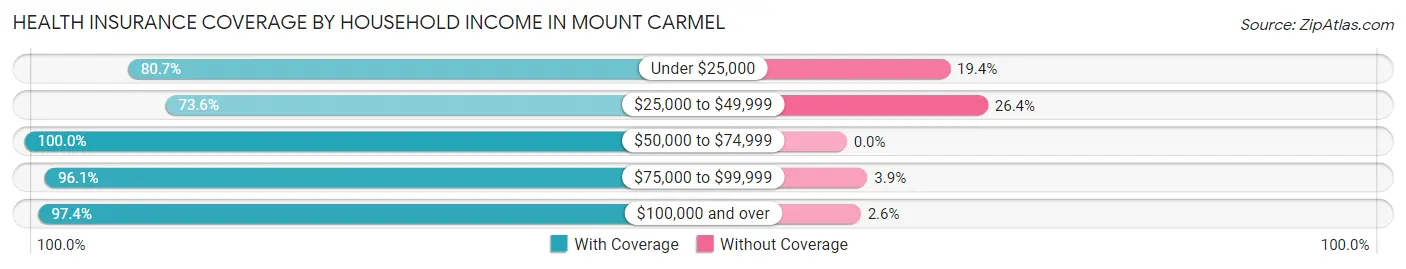
| Household Income | With Coverage | Without Coverage |
| Under $25,000 | 321 (80.6%) | 77 (19.4%) |
| $25,000 to $49,999 | 579 (73.6%) | 208 (26.4%) |
| $50,000 to $74,999 | 1,117 (100.0%) | 0 (0.0%) |
| $75,000 to $99,999 | 971 (96.1%) | 39 (3.9%) |
| $100,000 and over | 1,570 (97.4%) | 42 (2.6%) |
Public vs Private Health Insurance Coverage by Age in Mount Carmel
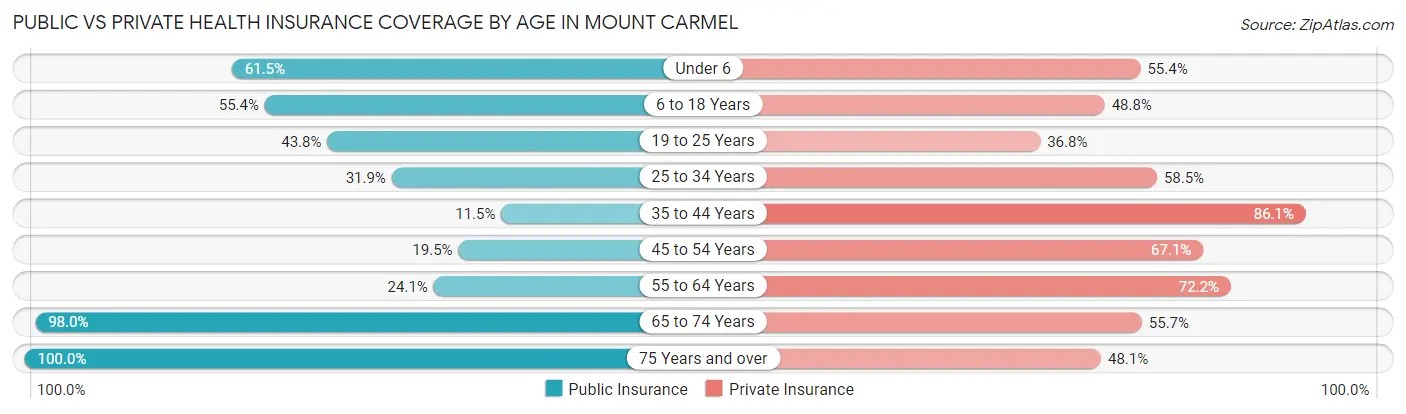
| Age Bracket | Public Insurance | Private Insurance |
| Under 6 | 232 (61.5%) | 209 (55.4%) |
| 6 to 18 Years | 368 (55.4%) | 324 (48.8%) |
| 19 to 25 Years | 163 (43.8%) | 137 (36.8%) |
| 25 to 34 Years | 238 (31.9%) | 437 (58.5%) |
| 35 to 44 Years | 78 (11.5%) | 583 (86.1%) |
| 45 to 54 Years | 113 (19.5%) | 389 (67.1%) |
| 55 to 64 Years | 221 (24.1%) | 663 (72.2%) |
| 65 to 74 Years | 447 (98.0%) | 254 (55.7%) |
| 75 Years and over | 133 (100.0%) | 64 (48.1%) |
| Total | 1,993 (40.5%) | 3,060 (62.1%) |
Disability Status by Sex by Age in Mount Carmel
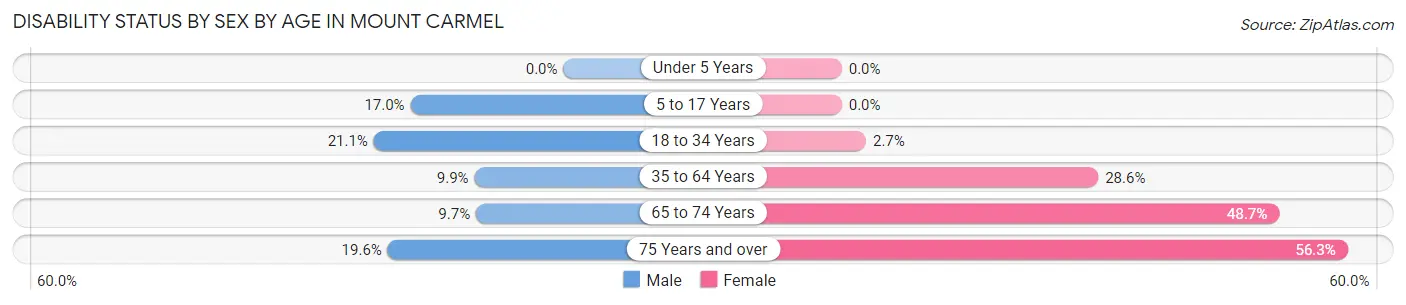
| Age Bracket | Male | Female |
| Under 5 Years | 0 (0.0%) | 0 (0.0%) |
| 5 to 17 Years | 63 (17.0%) | 0 (0.0%) |
| 18 to 34 Years | 102 (21.1%) | 18 (2.7%) |
| 35 to 64 Years | 102 (9.9%) | 327 (28.6%) |
| 65 to 74 Years | 22 (9.7%) | 112 (48.7%) |
| 75 Years and over | 9 (19.6%) | 49 (56.3%) |
Disability Class by Sex by Age in Mount Carmel
Disability Class: Hearing Difficulty
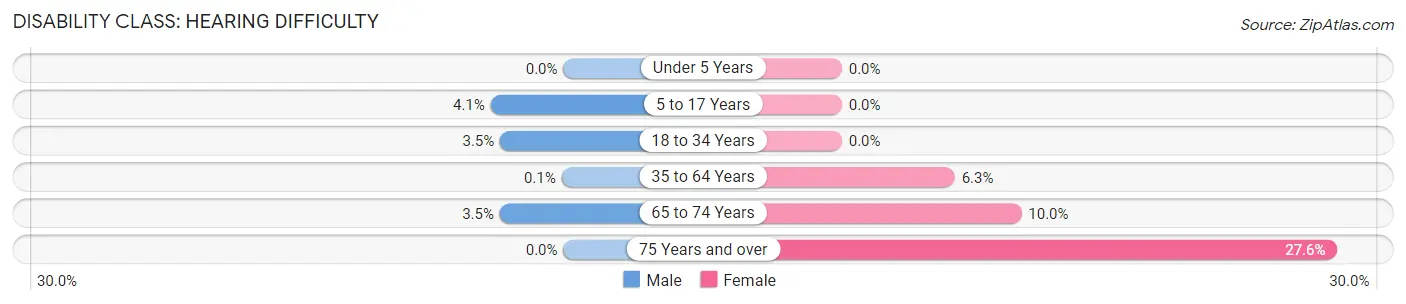
| Age Bracket | Male | Female |
| Under 5 Years | 0 (0.0%) | 0 (0.0%) |
| 5 to 17 Years | 15 (4.1%) | 0 (0.0%) |
| 18 to 34 Years | 17 (3.5%) | 0 (0.0%) |
| 35 to 64 Years | 1 (0.1%) | 72 (6.3%) |
| 65 to 74 Years | 8 (3.5%) | 23 (10.0%) |
| 75 Years and over | 0 (0.0%) | 24 (27.6%) |
Disability Class: Vision Difficulty
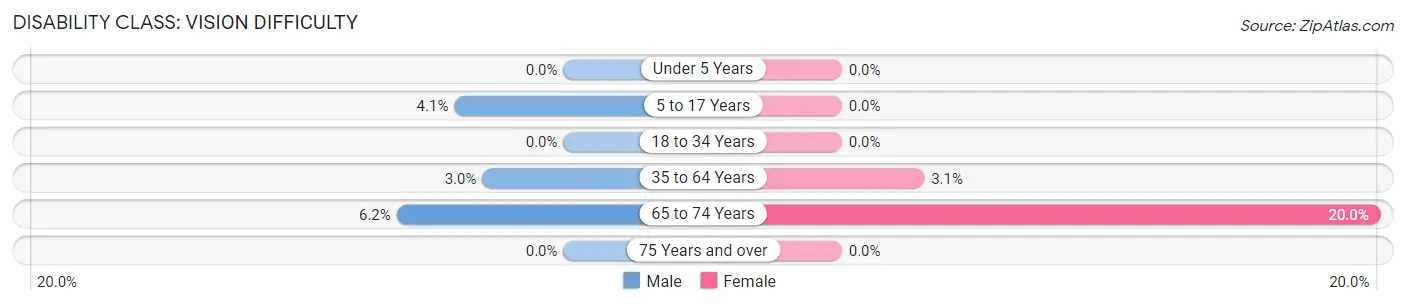
| Age Bracket | Male | Female |
| Under 5 Years | 0 (0.0%) | 0 (0.0%) |
| 5 to 17 Years | 15 (4.1%) | 0 (0.0%) |
| 18 to 34 Years | 0 (0.0%) | 0 (0.0%) |
| 35 to 64 Years | 31 (3.0%) | 35 (3.1%) |
| 65 to 74 Years | 14 (6.2%) | 46 (20.0%) |
| 75 Years and over | 0 (0.0%) | 0 (0.0%) |
Disability Class: Cognitive Difficulty
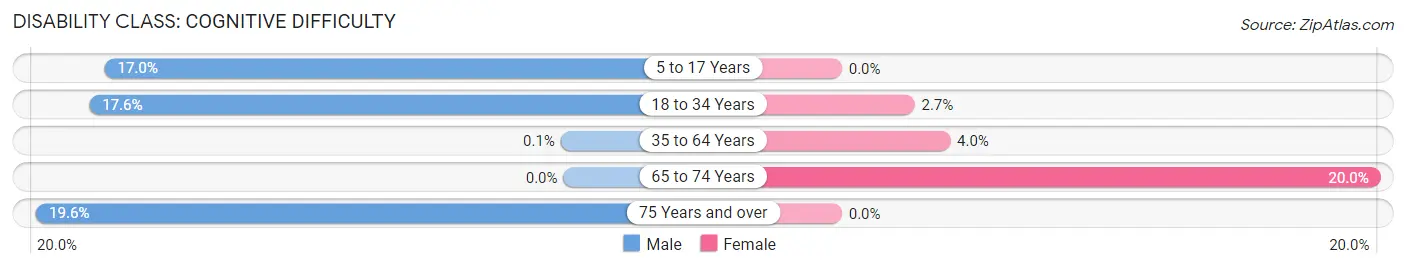
| Age Bracket | Male | Female |
| 5 to 17 Years | 63 (17.0%) | 0 (0.0%) |
| 18 to 34 Years | 85 (17.6%) | 18 (2.7%) |
| 35 to 64 Years | 1 (0.1%) | 46 (4.0%) |
| 65 to 74 Years | 0 (0.0%) | 46 (20.0%) |
| 75 Years and over | 9 (19.6%) | 0 (0.0%) |
Disability Class: Ambulatory Difficulty
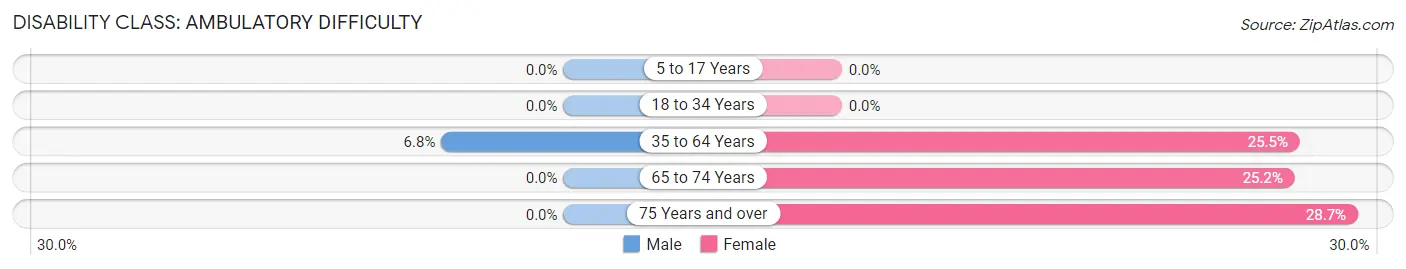
| Age Bracket | Male | Female |
| 5 to 17 Years | 0 (0.0%) | 0 (0.0%) |
| 18 to 34 Years | 0 (0.0%) | 0 (0.0%) |
| 35 to 64 Years | 70 (6.8%) | 292 (25.5%) |
| 65 to 74 Years | 0 (0.0%) | 58 (25.2%) |
| 75 Years and over | 0 (0.0%) | 25 (28.7%) |
Disability Class: Self-Care Difficulty
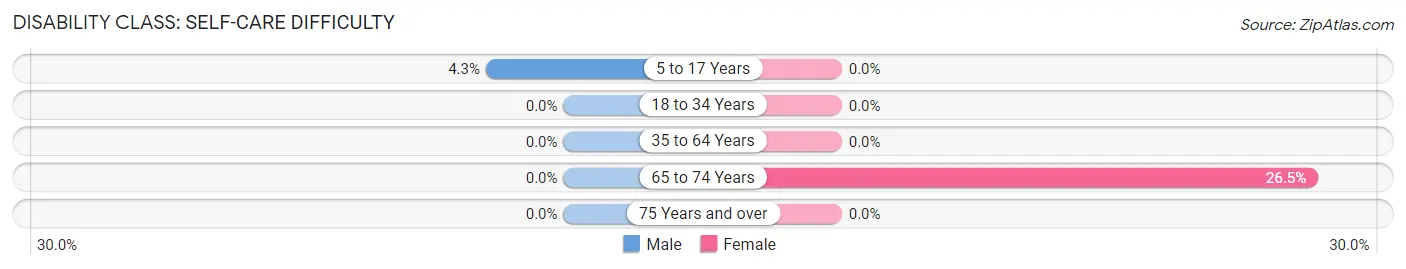
| Age Bracket | Male | Female |
| 5 to 17 Years | 16 (4.3%) | 0 (0.0%) |
| 18 to 34 Years | 0 (0.0%) | 0 (0.0%) |
| 35 to 64 Years | 0 (0.0%) | 0 (0.0%) |
| 65 to 74 Years | 0 (0.0%) | 61 (26.5%) |
| 75 Years and over | 0 (0.0%) | 0 (0.0%) |
Technology Access in Mount Carmel
Computing Device Access in Mount Carmel
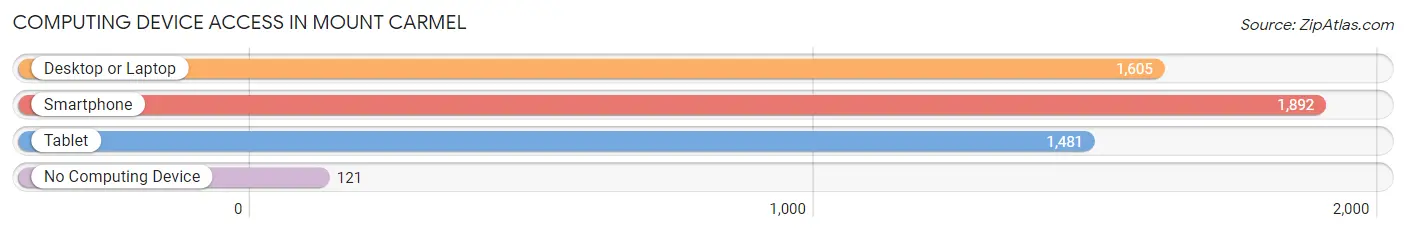
| Device Type | # Households | % Households |
| Desktop or Laptop | 1,605 | 76.1% |
| Smartphone | 1,892 | 89.7% |
| Tablet | 1,481 | 70.2% |
| No Computing Device | 121 | 5.7% |
| Total | 2,110 | 100.0% |
Internet Access in Mount Carmel
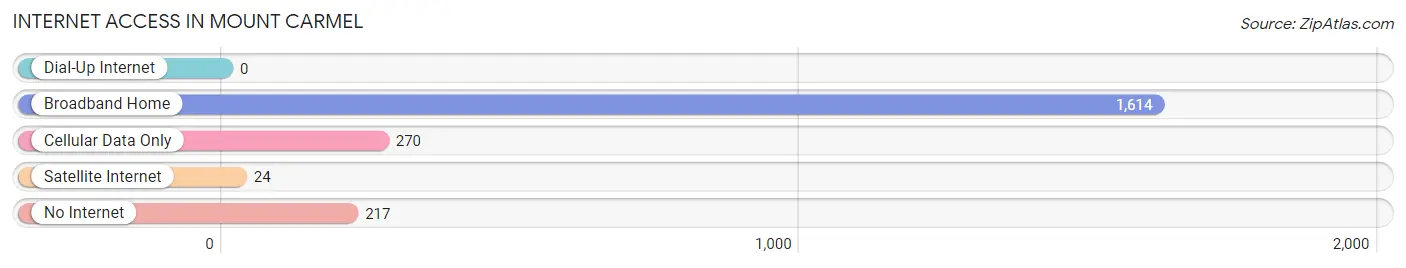
| Internet Type | # Households | % Households |
| Dial-Up Internet | 0 | 0.0% |
| Broadband Home | 1,614 | 76.5% |
| Cellular Data Only | 270 | 12.8% |
| Satellite Internet | 24 | 1.1% |
| No Internet | 217 | 10.3% |
| Total | 2,110 | 100.0% |
Mount Carmel Summary
Carmel, Ohio is a small village located in the southeastern part of the state, in the Appalachian foothills. It is situated in the county of Lawrence, and is part of the Huntington-Ashland Metropolitan Statistical Area. The village has a population of approximately 1,000 people, and is located about 25 miles from the city of Huntington, West Virginia.
History
The area that is now Carmel was first settled in the early 1800s by a group of settlers from Pennsylvania. The village was originally known as “Carmelville”, and was named after the biblical Mount Carmel. The village was officially incorporated in 1845, and the first post office was established in 1846.
In the late 1800s, the village was a thriving center of commerce, with several stores, a hotel, and a blacksmith shop. The village also had a school, a church, and a cemetery. The village was also home to a number of coal mines, which provided employment for many of the residents.
In the early 1900s, the village began to decline as the coal industry began to decline. The village was also affected by the Great Depression, and many of the businesses closed. The village was also affected by the decline of the railroad industry, as the railroad tracks that ran through the village were removed in the 1950s.
Geography
Carmel is located in the southeastern part of the state, in the Appalachian foothills. The village is situated in the county of Lawrence, and is part of the Huntington-Ashland Metropolitan Statistical Area. The village is located about 25 miles from the city of Huntington, West Virginia.
The village is situated on the banks of the Little Sandy River, and is surrounded by rolling hills and forests. The village is located at an elevation of about 1,000 feet above sea level. The climate in the area is generally mild, with temperatures ranging from the low 30s in the winter to the mid-80s in the summer.
Economy
The economy of Carmel is largely based on agriculture and tourism. The village is home to several farms, which produce a variety of crops, including corn, soybeans, and hay. The village is also home to several wineries, which produce a variety of wines.
The village is also home to several small businesses, including restaurants, shops, and a bed and breakfast. The village is also home to a number of antique stores, which attract visitors from all over the region.
Demographics
As of the 2010 census, the population of Carmel was 1,000 people. The racial makeup of the village was 97.2% White, 0.7% African American, 0.2% Native American, 0.2% Asian, 0.2% from other races, and 1.7% from two or more races. Hispanic or Latino of any race were 0.7% of the population.
The median income for a household in the village was $37,500, and the median income for a family was $41,250. The per capita income for the village was $17,845. About 11.2% of families and 13.2% of the population were below the poverty line, including 16.7% of those under age 18 and 8.3% of those age 65 or over.
Common Questions
What is the Total Population of Mount Carmel?
Total Population of Mount Carmel is 4,924.
What is the Total Male Population of Mount Carmel?
Total Male Population of Mount Carmel is 2,296.
What is the Total Female Population of Mount Carmel?
Total Female Population of Mount Carmel is 2,628.
What is the Ratio of Males per 100 Females in Mount Carmel?
There are 87.37 Males per 100 Females in Mount Carmel.
What is the Ratio of Females per 100 Males in Mount Carmel?
There are 114.46 Females per 100 Males in Mount Carmel.
What is the Median Population Age in Mount Carmel?
Median Population Age in Mount Carmel is 38.8 Years.
What is the Average Family Size in Mount Carmel
Average Family Size in Mount Carmel is 2.9 People.
What is the Average Household Size in Mount Carmel
Average Household Size in Mount Carmel is 2.3 People.
What is Per Capita Income in Mount Carmel?
Per Capita income in Mount Carmel is $35,796.
What is the Median Family Income in Mount Carmel?
Median Family Income in Mount Carmel is $74,896.
What is the Median Household income in Mount Carmel?
Median Household Income in Mount Carmel is $65,000.
What is Income or Wage Gap in Mount Carmel?
Income or Wage Gap in Mount Carmel is 2.8%.
Women in Mount Carmel earn 97.2 cents for every dollar earned by a man.
What is Inequality or Gini Index in Mount Carmel?
Inequality or Gini Index in Mount Carmel is 0.42.
How Large is the Labor Force in Mount Carmel?
There are 3,015 People in the Labor Forcein in Mount Carmel.
What is the Percentage of People in the Labor Force in Mount Carmel?
76.0% of People are in the Labor Force in Mount Carmel.
What is the Unemployment Rate in Mount Carmel?
Unemployment Rate in Mount Carmel is 1.0%.