Corbin City, NJ
Corbin City Map
Corbin City Overview
697
TOTAL POPULATION
335
MALE POPULATION
362
FEMALE POPULATION
92.54
MALES / 100 FEMALES
108.06
FEMALES / 100 MALES
33.5
MEDIAN AGE
3.3
AVG FAMILY SIZE
3.0
AVG HOUSEHOLD SIZE
$32,650
PER CAPITA INCOME
$86,875
AVG FAMILY INCOME
$84,500
AVG HOUSEHOLD INCOME
38.3%
WAGE / INCOME GAP [ % ]
61.7¢/ $1
WAGE / INCOME GAP [ $ ]
0.35
INEQUALITY / GINI INDEX
359
LABOR FORCE [ PEOPLE ]
65.3%
PERCENT IN LABOR FORCE
7.8%
UNEMPLOYMENT RATE
Corbin City Area Codes
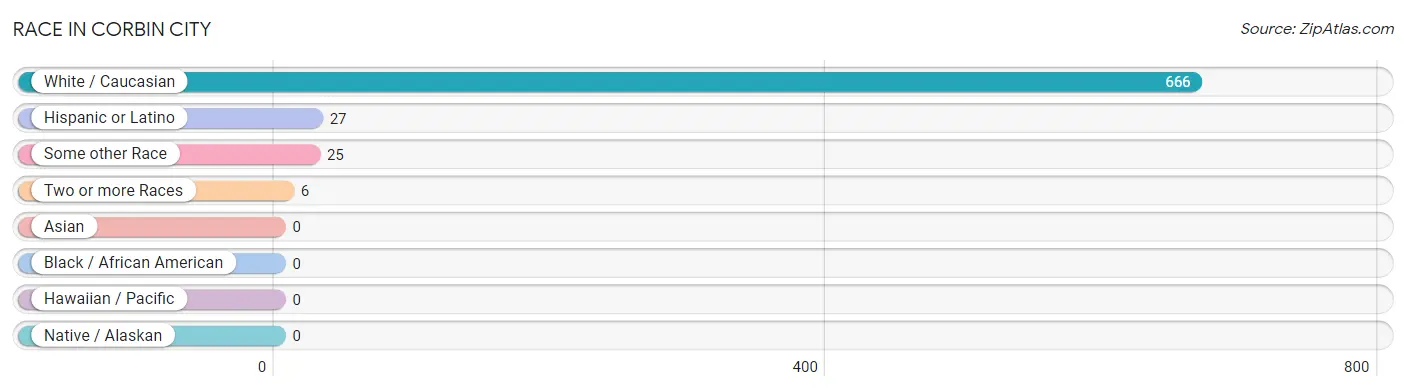
Race in Corbin City
The most populous races in Corbin City are White / Caucasian (666 | 95.6%), Hispanic or Latino (27 | 3.9%), and Some other Race (25 | 3.6%).
| Race | # Population | % Population |
| Asian | 0 | 0.0% |
| Black / African American | 0 | 0.0% |
| Hawaiian / Pacific | 0 | 0.0% |
| Hispanic or Latino | 27 | 3.9% |
| Native / Alaskan | 0 | 0.0% |
| White / Caucasian | 666 | 95.6% |
| Two or more Races | 6 | 0.9% |
| Some other Race | 25 | 3.6% |
| Total | 697 | 100.0% |
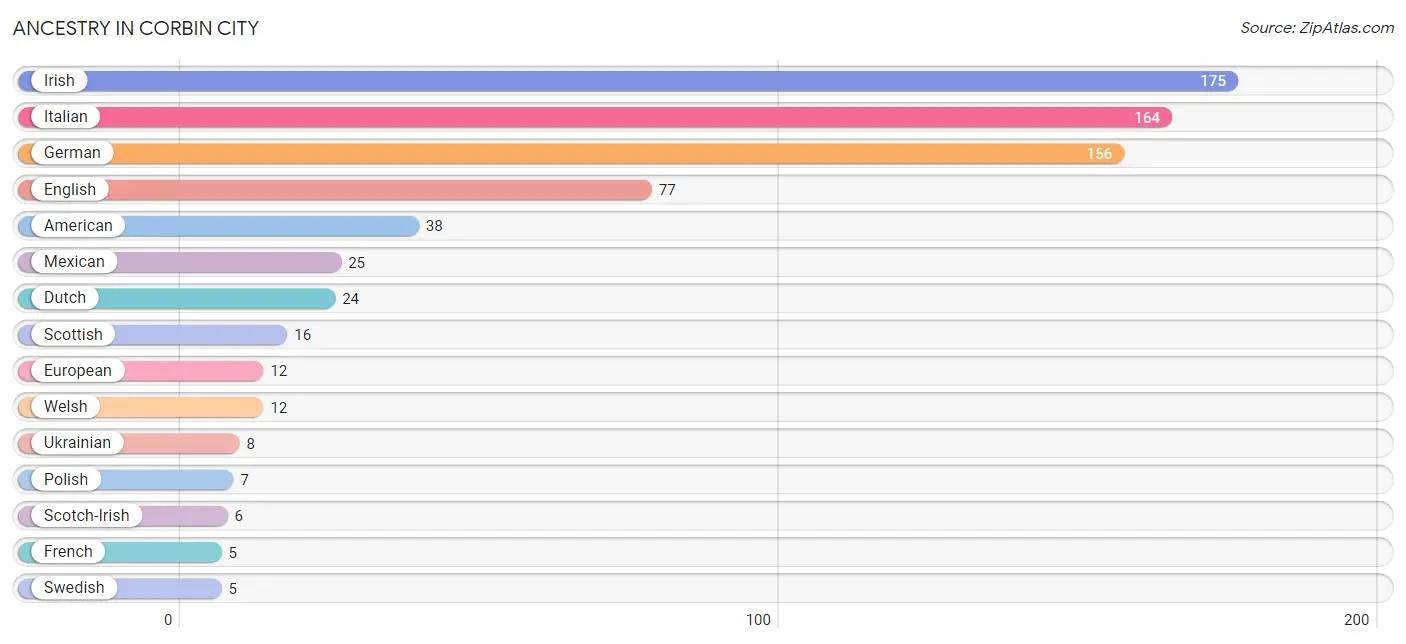
Ancestry in Corbin City
The most populous ancestries reported in Corbin City are Irish (175 | 25.1%), Italian (164 | 23.5%), German (156 | 22.4%), English (77 | 11.1%), and American (38 | 5.4%), together accounting for 87.5% of all Corbin City residents.
| Ancestry | # Population | % Population |
| American | 38 | 5.4% |
| Austrian | 3 | 0.4% |
| British | 3 | 0.4% |
| Canadian | 1 | 0.1% |
| Danish | 2 | 0.3% |
| Dutch | 24 | 3.4% |
| English | 77 | 11.1% |
| European | 12 | 1.7% |
| French | 5 | 0.7% |
| French Canadian | 1 | 0.1% |
| German | 156 | 22.4% |
| Irish | 175 | 25.1% |
| Italian | 164 | 23.5% |
| Mexican | 25 | 3.6% |
| Norwegian | 4 | 0.6% |
| Polish | 7 | 1.0% |
| Russian | 1 | 0.1% |
| Scotch-Irish | 6 | 0.9% |
| Scottish | 16 | 2.3% |
| Spanish | 2 | 0.3% |
| Swedish | 5 | 0.7% |
| Ukrainian | 8 | 1.1% |
| Welsh | 12 | 1.7% | View All 23 Rows |
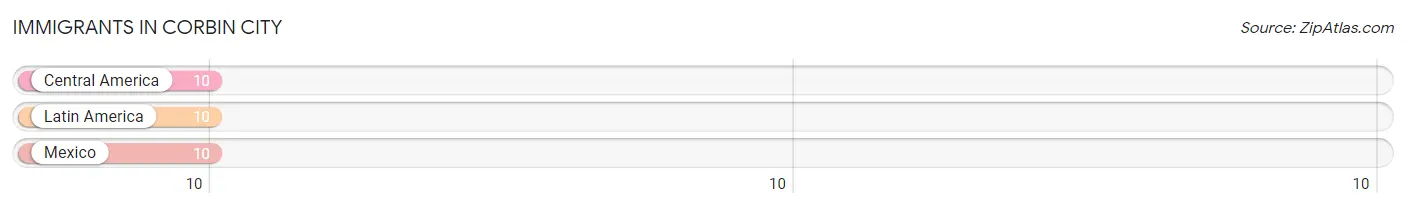
Immigrants in Corbin City
The most numerous immigrant groups reported in Corbin City came from Central America (10 | 1.4%), Latin America (10 | 1.4%), and Mexico (10 | 1.4%), together accounting for 4.3% of all Corbin City residents.
| Immigration Origin | # Population | % Population |
| Central America | 10 | 1.4% |
| Latin America | 10 | 1.4% |
| Mexico | 10 | 1.4% | View All 3 Rows |
Sex and Age in Corbin City
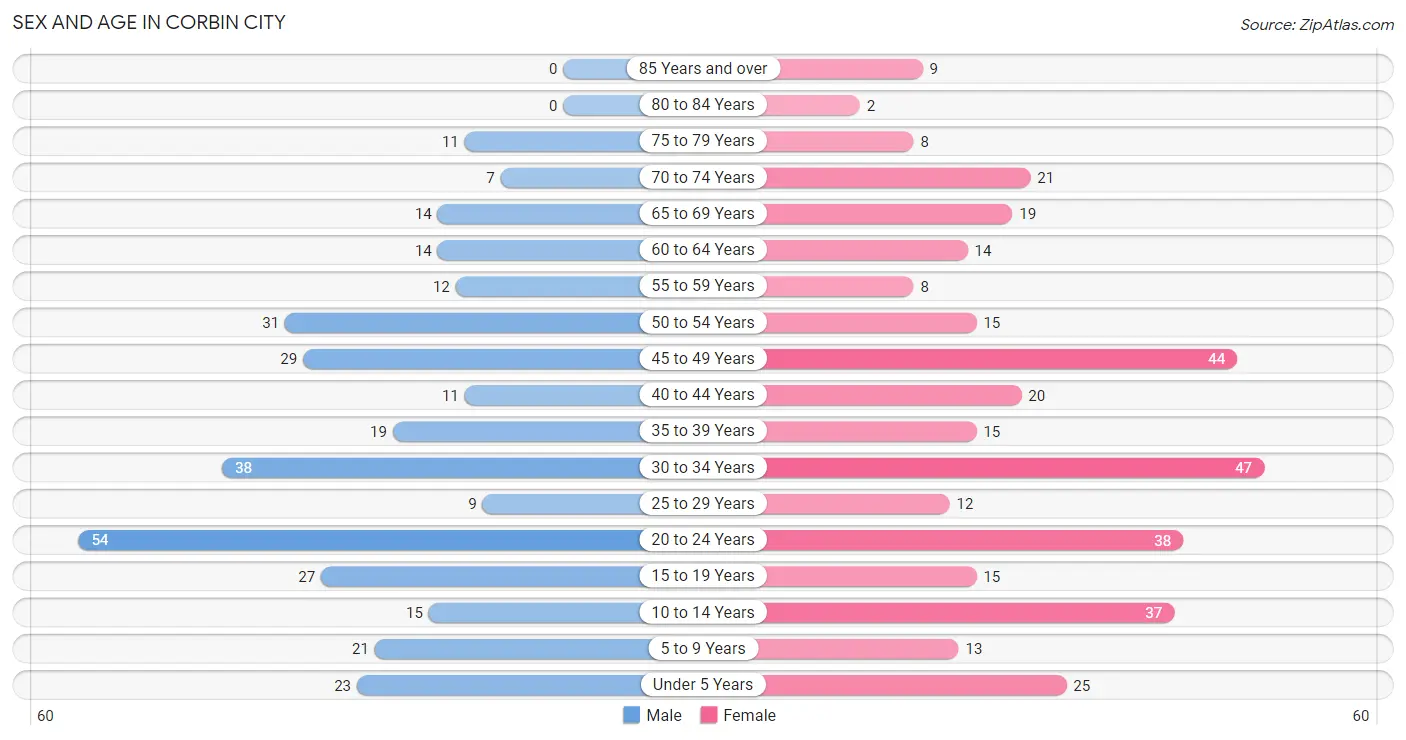
Sex and Age in Corbin City
The most populous age groups in Corbin City are 20 to 24 Years (54 | 16.1%) for men and 30 to 34 Years (47 | 13.0%) for women.
| Age Bracket | Male | Female |
| Under 5 Years | 23 (6.9%) | 25 (6.9%) |
| 5 to 9 Years | 21 (6.3%) | 13 (3.6%) |
| 10 to 14 Years | 15 (4.5%) | 37 (10.2%) |
| 15 to 19 Years | 27 (8.1%) | 15 (4.1%) |
| 20 to 24 Years | 54 (16.1%) | 38 (10.5%) |
| 25 to 29 Years | 9 (2.7%) | 12 (3.3%) |
| 30 to 34 Years | 38 (11.3%) | 47 (13.0%) |
| 35 to 39 Years | 19 (5.7%) | 15 (4.1%) |
| 40 to 44 Years | 11 (3.3%) | 20 (5.5%) |
| 45 to 49 Years | 29 (8.7%) | 44 (12.1%) |
| 50 to 54 Years | 31 (9.2%) | 15 (4.1%) |
| 55 to 59 Years | 12 (3.6%) | 8 (2.2%) |
| 60 to 64 Years | 14 (4.2%) | 14 (3.9%) |
| 65 to 69 Years | 14 (4.2%) | 19 (5.2%) |
| 70 to 74 Years | 7 (2.1%) | 21 (5.8%) |
| 75 to 79 Years | 11 (3.3%) | 8 (2.2%) |
| 80 to 84 Years | 0 (0.0%) | 2 (0.5%) |
| 85 Years and over | 0 (0.0%) | 9 (2.5%) |
| Total | 335 (100.0%) | 362 (100.0%) |
Families and Households in Corbin City
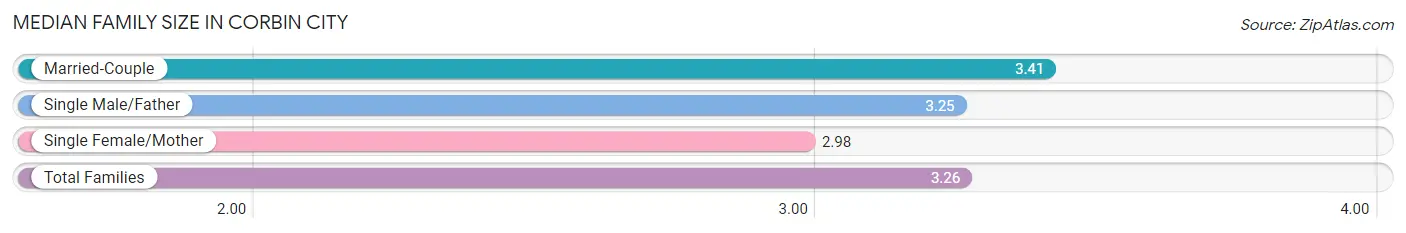
Median Family Size in Corbin City
The median family size in Corbin City is 3.26 persons per family, with married-couple families (111 | 58.7%) accounting for the largest median family size of 3.41 persons per family. On the other hand, single female/mother families (58 | 30.7%) represent the smallest median family size with 2.98 persons per family.
| Family Type | # Families | Family Size |
| Married-Couple | 111 (58.7%) | 3.41 |
| Single Male/Father | 20 (10.6%) | 3.25 |
| Single Female/Mother | 58 (30.7%) | 2.98 |
| Total Families | 189 (100.0%) | 3.26 |
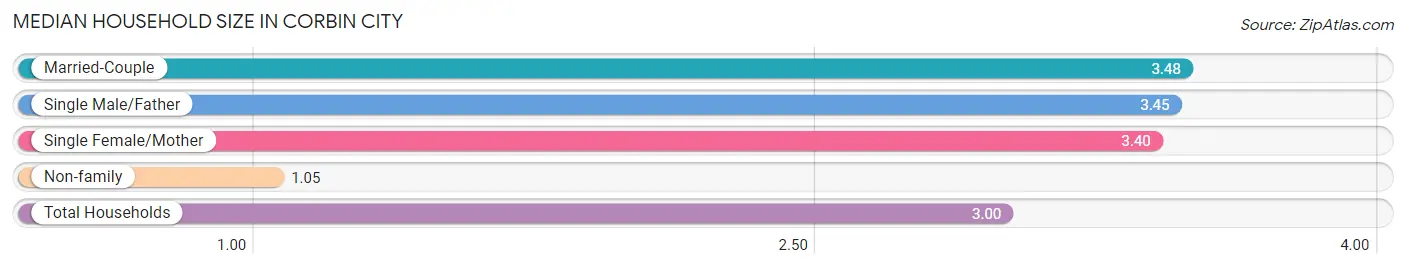
Median Household Size in Corbin City
The median household size in Corbin City is 3.00 persons per household, with married-couple households (111 | 47.8%) accounting for the largest median household size of 3.48 persons per household. non-family households (43 | 18.5%) represent the smallest median household size with 1.05 persons per household.
| Household Type | # Households | Household Size |
| Married-Couple | 111 (47.8%) | 3.48 |
| Single Male/Father | 20 (8.6%) | 3.45 |
| Single Female/Mother | 58 (25.0%) | 3.40 |
| Non-family | 43 (18.5%) | 1.05 |
| Total Households | 232 (100.0%) | 3.00 |
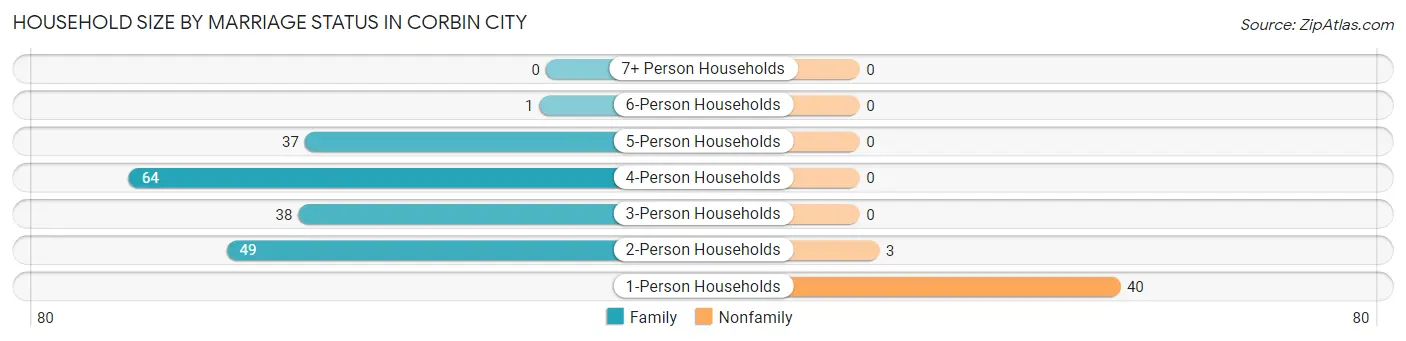
Household Size by Marriage Status in Corbin City
Out of a total of 232 households in Corbin City, 189 (81.5%) are family households, while 43 (18.5%) are nonfamily households. The most numerous type of family households are 4-person households, comprising 64, and the most common type of nonfamily households are 1-person households, comprising 40.
| Household Size | Family Households | Nonfamily Households |
| 1-Person Households | - | 40 (17.2%) |
| 2-Person Households | 49 (21.1%) | 3 (1.3%) |
| 3-Person Households | 38 (16.4%) | 0 (0.0%) |
| 4-Person Households | 64 (27.6%) | 0 (0.0%) |
| 5-Person Households | 37 (16.0%) | 0 (0.0%) |
| 6-Person Households | 1 (0.4%) | 0 (0.0%) |
| 7+ Person Households | 0 (0.0%) | 0 (0.0%) |
| Total | 189 (81.5%) | 43 (18.5%) |
Female Fertility in Corbin City
Fertility by Age in Corbin City
| Age Bracket | Women with Births | Births / 1,000 Women |
| 15 to 19 years | 0 (0.0%) | 0.0 |
| 20 to 34 years | 0 (0.0%) | 0.0 |
| 35 to 50 years | 0 (0.0%) | 0.0 |
| Total | 0 (0.0%) | 0.0 |
Fertility by Age by Marriage Status in Corbin City
| Age Bracket | Married | Unmarried |
| 15 to 19 years | 0 (0.0%) | 0 (0.0%) |
| 20 to 34 years | 0 (0.0%) | 0 (0.0%) |
| 35 to 50 years | 0 (0.0%) | 0 (0.0%) |
| Total | 0 (0.0%) | 0 (0.0%) |
Fertility by Education in Corbin City
| Educational Attainment | Women with Births | Births / 1,000 Women |
| Less than High School | 0 (0.0%) | 0.0 |
| High School Diploma | 0 (0.0%) | 0.0 |
| College or Associate's Degree | 0 (0.0%) | 0.0 |
| Bachelor's Degree | 0 (0.0%) | 0.0 |
| Graduate Degree | 0 (0.0%) | 0.0 |
| Total | 0 (0.0%) | 0.0 |
Fertility by Education by Marriage Status in Corbin City
| Educational Attainment | Married | Unmarried |
| Less than High School | 0 (0.0%) | 0 (0.0%) |
| High School Diploma | 0 (0.0%) | 0 (0.0%) |
| College or Associate's Degree | 0 (0.0%) | 0 (0.0%) |
| Bachelor's Degree | 0 (0.0%) | 0 (0.0%) |
| Graduate Degree | 0 (0.0%) | 0 (0.0%) |
| Total | 0 (0.0%) | 0 (0.0%) |
Income in Corbin City
Income Overview in Corbin City
Per Capita Income in Corbin City is $32,650, while median incomes of families and households are $86,875 and $84,500 respectively.
| Characteristic | Number | Measure |
| Per Capita Income | 697 | $32,650 |
| Median Family Income | 189 | $86,875 |
| Mean Family Income | 189 | $96,848 |
| Median Household Income | 232 | $84,500 |
| Mean Household Income | 232 | $100,104 |
| Income Deficit | 189 | $0 |
| Wage / Income Gap (%) | 697 | 38.33% |
| Wage / Income Gap ($) | 697 | 61.67¢ per $1 |
| Gini / Inequality Index | 697 | 0.35 |
Earnings by Sex in Corbin City
Average Earnings in Corbin City are $33,125, $44,792 for men and $27,625 for women, a difference of 38.3%.
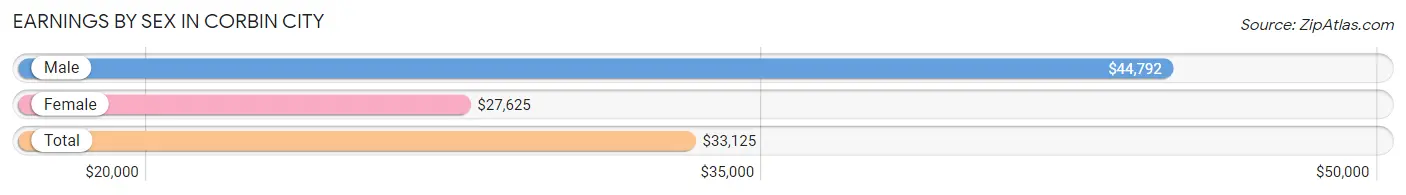
| Sex | Number | Average Earnings |
| Male | 219 (58.2%) | $44,792 |
| Female | 157 (41.8%) | $27,625 |
| Total | 376 (100.0%) | $33,125 |
Earnings by Sex by Income Bracket in Corbin City
The most common earnings brackets in Corbin City are $75,000 to $99,999 for men (38 | 17.3%) and $12,500 to $14,999 for women (27 | 17.2%).
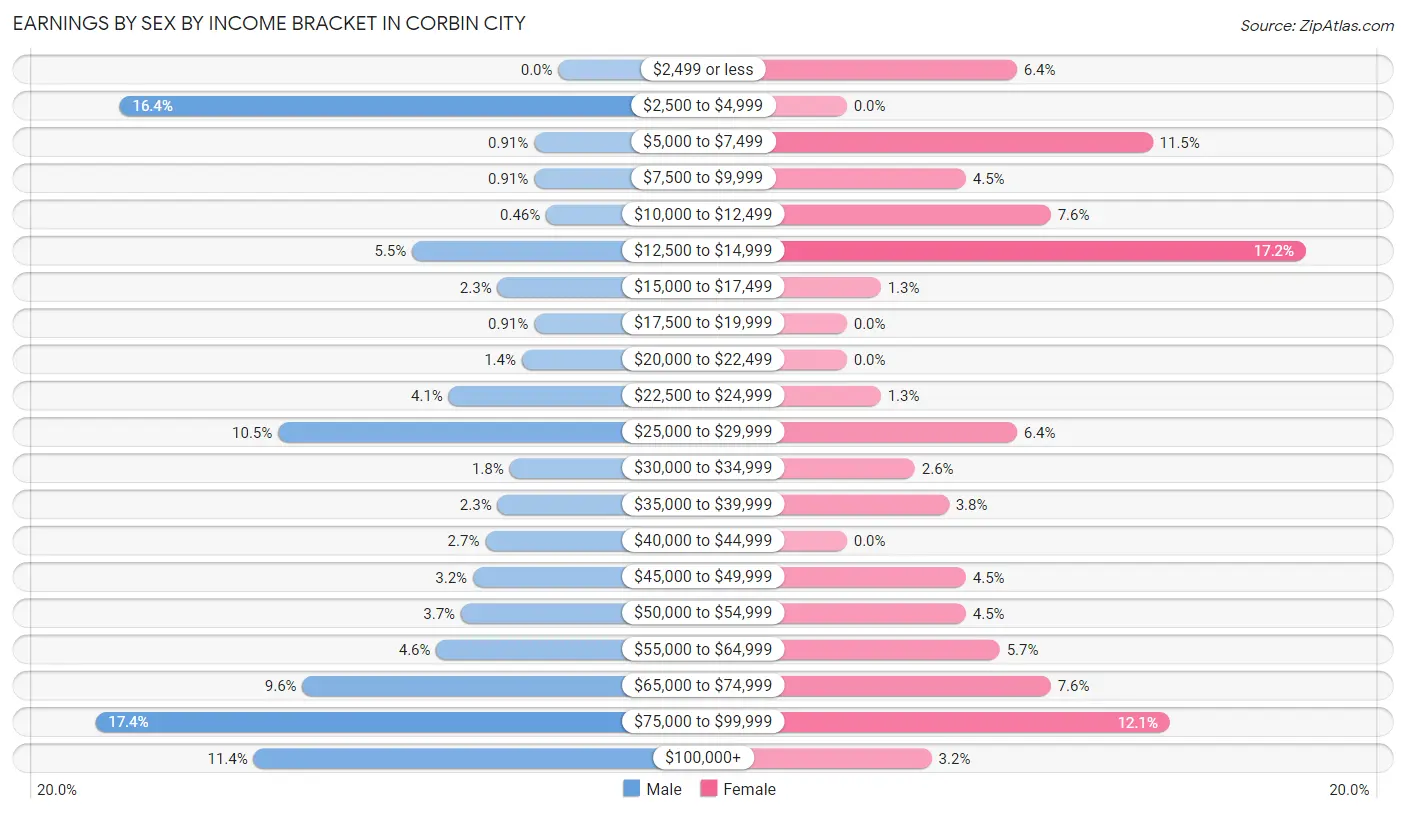
| Income | Male | Female |
| $2,499 or less | 0 (0.0%) | 10 (6.4%) |
| $2,500 to $4,999 | 36 (16.4%) | 0 (0.0%) |
| $5,000 to $7,499 | 2 (0.9%) | 18 (11.5%) |
| $7,500 to $9,999 | 2 (0.9%) | 7 (4.5%) |
| $10,000 to $12,499 | 1 (0.5%) | 12 (7.6%) |
| $12,500 to $14,999 | 12 (5.5%) | 27 (17.2%) |
| $15,000 to $17,499 | 5 (2.3%) | 2 (1.3%) |
| $17,500 to $19,999 | 2 (0.9%) | 0 (0.0%) |
| $20,000 to $22,499 | 3 (1.4%) | 0 (0.0%) |
| $22,500 to $24,999 | 9 (4.1%) | 2 (1.3%) |
| $25,000 to $29,999 | 23 (10.5%) | 10 (6.4%) |
| $30,000 to $34,999 | 4 (1.8%) | 4 (2.5%) |
| $35,000 to $39,999 | 5 (2.3%) | 6 (3.8%) |
| $40,000 to $44,999 | 6 (2.7%) | 0 (0.0%) |
| $45,000 to $49,999 | 7 (3.2%) | 7 (4.5%) |
| $50,000 to $54,999 | 8 (3.6%) | 7 (4.5%) |
| $55,000 to $64,999 | 10 (4.6%) | 9 (5.7%) |
| $65,000 to $74,999 | 21 (9.6%) | 12 (7.6%) |
| $75,000 to $99,999 | 38 (17.3%) | 19 (12.1%) |
| $100,000+ | 25 (11.4%) | 5 (3.2%) |
| Total | 219 (100.0%) | 157 (100.0%) |
Earnings by Sex by Educational Attainment in Corbin City
Average earnings in Corbin City are $64,844 for men and $47,500 for women, a difference of 26.8%. Men with an educational attainment of college or associate's degree enjoy the highest average annual earnings of $67,250, while those with high school diploma education earn the least with $52,500. Women with an educational attainment of graduate degree earn the most with the average annual earnings of $70,000, while those with college or associate's degree education have the smallest earnings of $48,750.
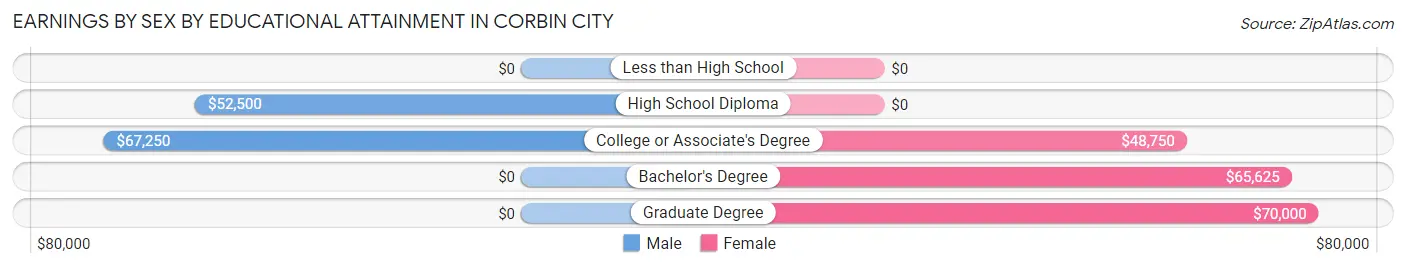
| Educational Attainment | Male Income | Female Income |
| Less than High School | - | - |
| High School Diploma | $52,500 | $0 |
| College or Associate's Degree | $67,250 | $48,750 |
| Bachelor's Degree | - | - |
| Graduate Degree | - | - |
| Total | $64,844 | $47,500 |
Family Income in Corbin City
Family Income Brackets in Corbin City
According to the Corbin City family income data, there are 31 families falling into the $50,000 to $74,999 income range, which is the most common income bracket and makes up 16.4% of all families.
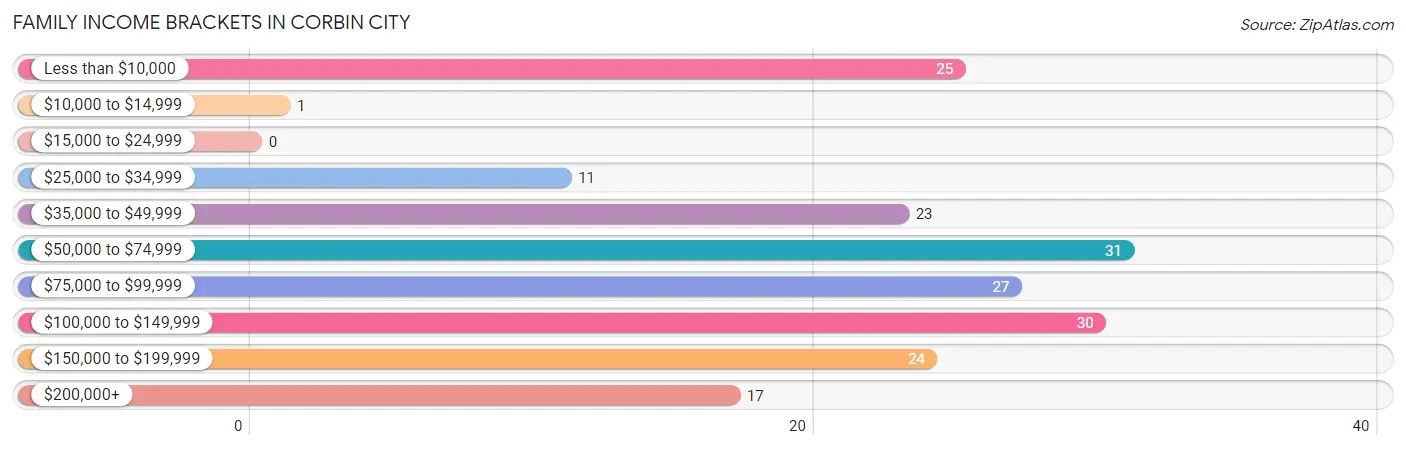
| Income Bracket | # Families | % Families |
| Less than $10,000 | 25 | 13.2% |
| $10,000 to $14,999 | 1 | 0.5% |
| $15,000 to $24,999 | 0 | 0.0% |
| $25,000 to $34,999 | 11 | 5.8% |
| $35,000 to $49,999 | 23 | 12.2% |
| $50,000 to $74,999 | 31 | 16.4% |
| $75,000 to $99,999 | 27 | 14.3% |
| $100,000 to $149,999 | 30 | 15.9% |
| $150,000 to $199,999 | 24 | 12.7% |
| $200,000+ | 17 | 9.0% |
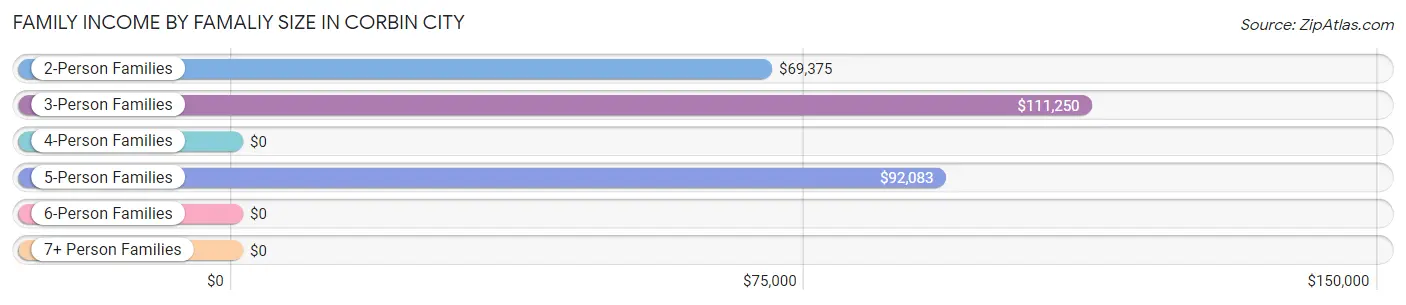
Family Income by Famaliy Size in Corbin City
3-person families (43 | 22.8%) account for the highest median family income in Corbin City with $111,250 per family, while 3-person families (43 | 22.8%) have the highest median income of $37,083 per family member.
| Income Bracket | # Families | Median Income |
| 2-Person Families | 52 (27.5%) | $69,375 |
| 3-Person Families | 43 (22.8%) | $111,250 |
| 4-Person Families | 83 (43.9%) | $0 |
| 5-Person Families | 10 (5.3%) | $92,083 |
| 6-Person Families | 1 (0.5%) | $0 |
| 7+ Person Families | 0 (0.0%) | $0 |
| Total | 189 (100.0%) | $86,875 |
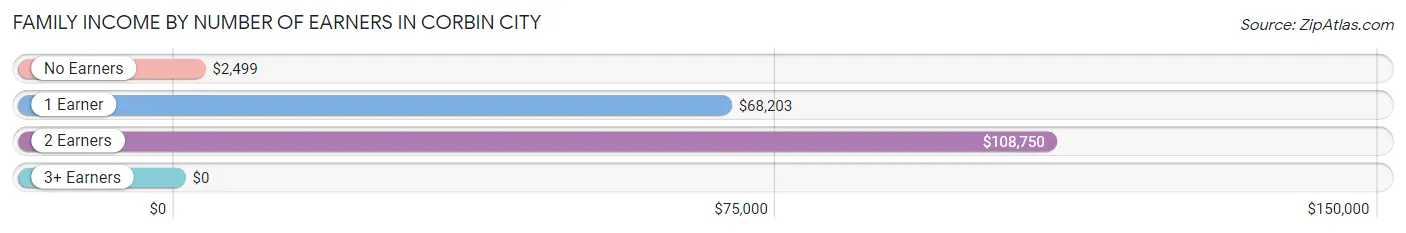
Family Income by Number of Earners in Corbin City
| Number of Earners | # Families | Median Income |
| No Earners | 35 (18.5%) | $2,499 |
| 1 Earner | 45 (23.8%) | $68,203 |
| 2 Earners | 68 (36.0%) | $108,750 |
| 3+ Earners | 41 (21.7%) | $0 |
| Total | 189 (100.0%) | $86,875 |
Household Income in Corbin City
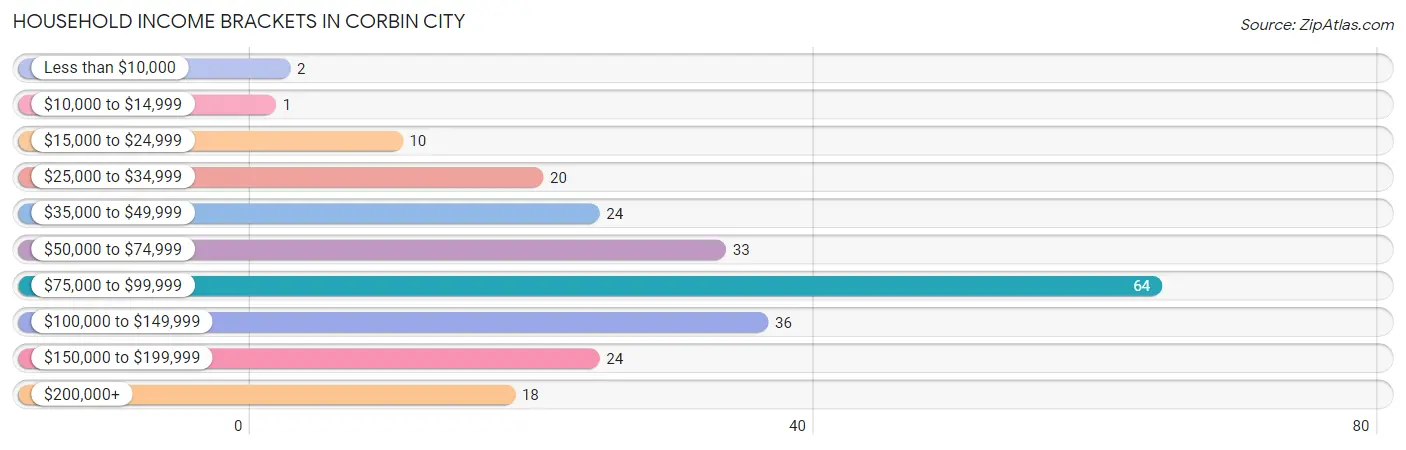
Household Income Brackets in Corbin City
With 64 households falling in the category, the $75,000 to $99,999 income range is the most frequent in Corbin City, accounting for 27.6% of all households. In contrast, only 1 households (0.4%) fall into the $10,000 to $14,999 income bracket, making it the least populous group.
| Income Bracket | # Households | % Households |
| Less than $10,000 | 2 | 0.9% |
| $10,000 to $14,999 | 1 | 0.4% |
| $15,000 to $24,999 | 10 | 4.3% |
| $25,000 to $34,999 | 20 | 8.6% |
| $35,000 to $49,999 | 24 | 10.3% |
| $50,000 to $74,999 | 33 | 14.2% |
| $75,000 to $99,999 | 64 | 27.6% |
| $100,000 to $149,999 | 36 | 15.5% |
| $150,000 to $199,999 | 24 | 10.3% |
| $200,000+ | 18 | 7.8% |
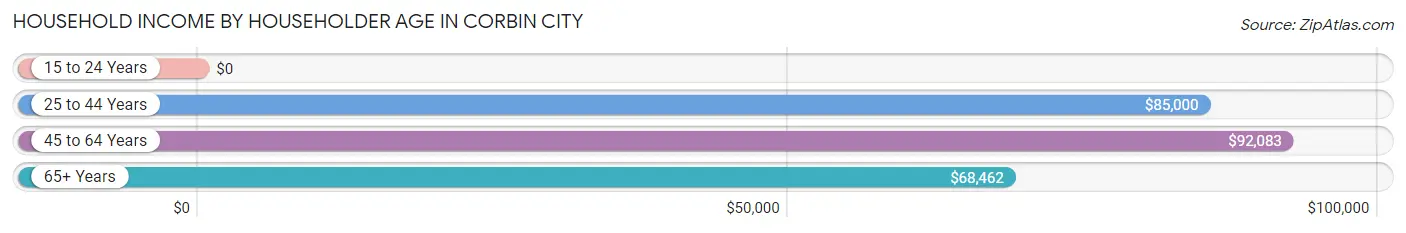
Household Income by Householder Age in Corbin City
The median household income in Corbin City is $84,500, with the highest median household income of $92,083 found in the 45 to 64 years age bracket for the primary householder. A total of 96 households (41.4%) fall into this category.
| Income Bracket | # Households | Median Income |
| 15 to 24 Years | 0 (0.0%) | $0 |
| 25 to 44 Years | 74 (31.9%) | $85,000 |
| 45 to 64 Years | 96 (41.4%) | $92,083 |
| 65+ Years | 62 (26.7%) | $68,462 |
| Total | 232 (100.0%) | $84,500 |
Poverty in Corbin City
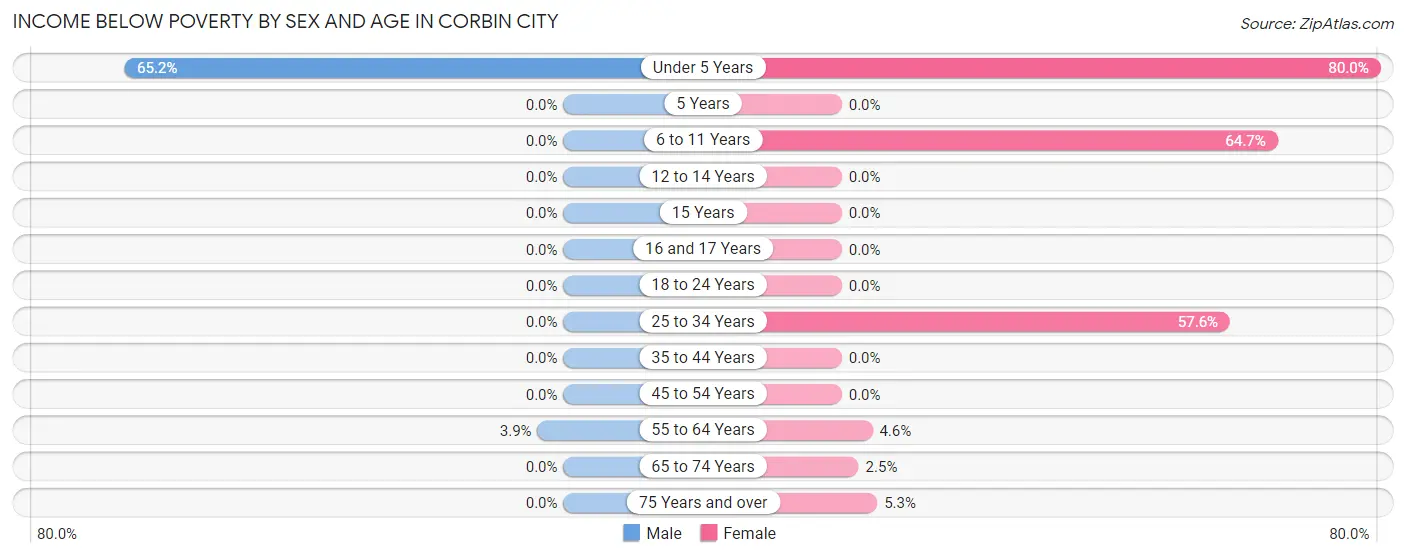
Income Below Poverty by Sex and Age in Corbin City
With 4.8% poverty level for males and 21.8% for females among the residents of Corbin City, under 5 year old males and under 5 year old females are the most vulnerable to poverty, with 15 males (65.2%) and 20 females (80.0%) in their respective age groups living below the poverty level.
| Age Bracket | Male | Female |
| Under 5 Years | 15 (65.2%) | 20 (80.0%) |
| 5 Years | 0 (0.0%) | 0 (0.0%) |
| 6 to 11 Years | 0 (0.0%) | 22 (64.7%) |
| 12 to 14 Years | 0 (0.0%) | 0 (0.0%) |
| 15 Years | 0 (0.0%) | 0 (0.0%) |
| 16 and 17 Years | 0 (0.0%) | 0 (0.0%) |
| 18 to 24 Years | 0 (0.0%) | 0 (0.0%) |
| 25 to 34 Years | 0 (0.0%) | 34 (57.6%) |
| 35 to 44 Years | 0 (0.0%) | 0 (0.0%) |
| 45 to 54 Years | 0 (0.0%) | 0 (0.0%) |
| 55 to 64 Years | 1 (3.8%) | 1 (4.5%) |
| 65 to 74 Years | 0 (0.0%) | 1 (2.5%) |
| 75 Years and over | 0 (0.0%) | 1 (5.3%) |
| Total | 16 (4.8%) | 79 (21.8%) |
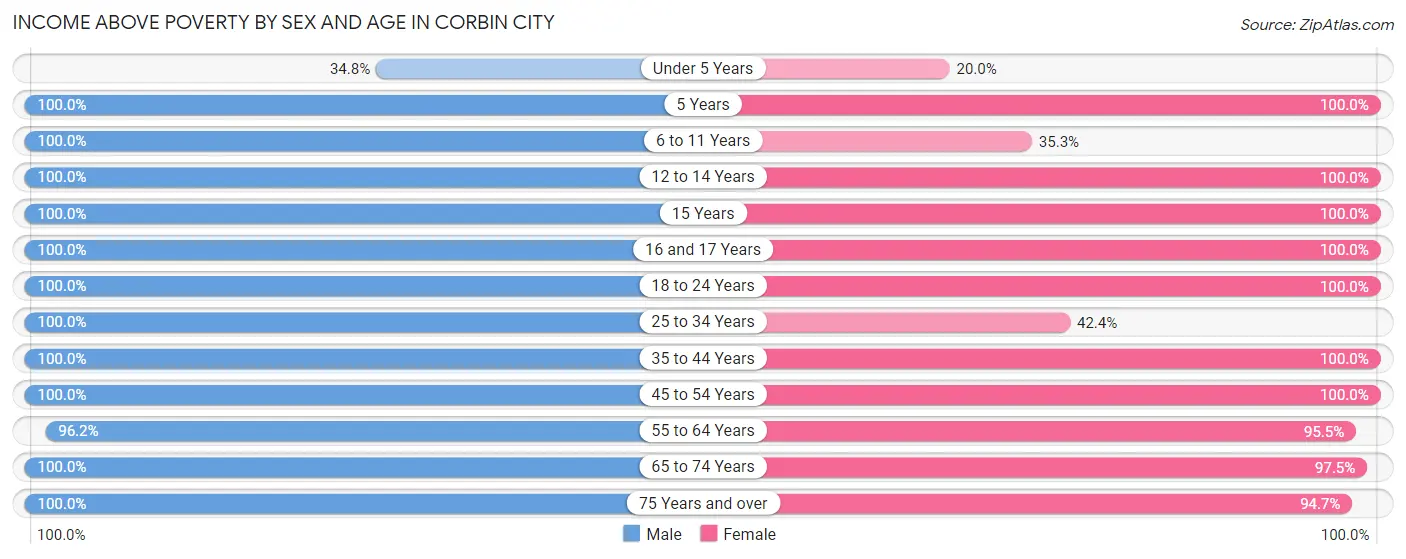
Income Above Poverty by Sex and Age in Corbin City
According to the poverty statistics in Corbin City, males aged 5 years and females aged 5 years are the age groups that are most secure financially, with 100.0% of males and 100.0% of females in these age groups living above the poverty line.
| Age Bracket | Male | Female |
| Under 5 Years | 8 (34.8%) | 5 (20.0%) |
| 5 Years | 8 (100.0%) | 3 (100.0%) |
| 6 to 11 Years | 13 (100.0%) | 12 (35.3%) |
| 12 to 14 Years | 15 (100.0%) | 13 (100.0%) |
| 15 Years | 10 (100.0%) | 3 (100.0%) |
| 16 and 17 Years | 15 (100.0%) | 7 (100.0%) |
| 18 to 24 Years | 56 (100.0%) | 43 (100.0%) |
| 25 to 34 Years | 47 (100.0%) | 25 (42.4%) |
| 35 to 44 Years | 30 (100.0%) | 35 (100.0%) |
| 45 to 54 Years | 60 (100.0%) | 59 (100.0%) |
| 55 to 64 Years | 25 (96.2%) | 21 (95.5%) |
| 65 to 74 Years | 21 (100.0%) | 39 (97.5%) |
| 75 Years and over | 11 (100.0%) | 18 (94.7%) |
| Total | 319 (95.2%) | 283 (78.2%) |
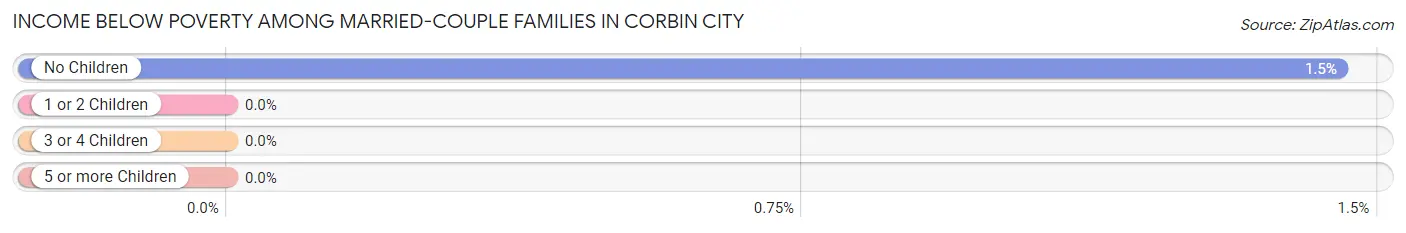
Income Below Poverty Among Married-Couple Families in Corbin City
The poverty statistics for married-couple families in Corbin City show that 0.9% or 1 of the total 111 families live below the poverty line. Families with no children have the highest poverty rate of 1.5%, comprising of 1 families. On the other hand, families with 1 or 2 children have the lowest poverty rate of 0.0%, which includes 0 families.
| Children | Above Poverty | Below Poverty |
| No Children | 68 (98.6%) | 1 (1.5%) |
| 1 or 2 Children | 38 (100.0%) | 0 (0.0%) |
| 3 or 4 Children | 4 (100.0%) | 0 (0.0%) |
| 5 or more Children | 0 (0.0%) | 0 (0.0%) |
| Total | 110 (99.1%) | 1 (0.9%) |
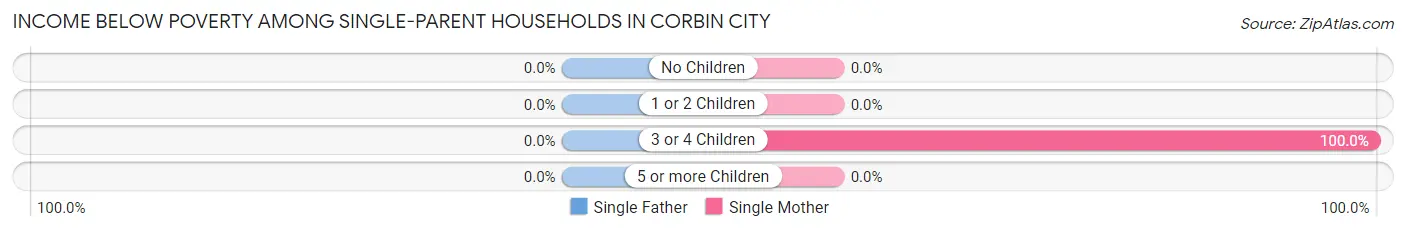
Income Below Poverty Among Single-Parent Households in Corbin City
| Children | Single Father | Single Mother |
| No Children | 0 (0.0%) | 0 (0.0%) |
| 1 or 2 Children | 0 (0.0%) | 0 (0.0%) |
| 3 or 4 Children | 0 (0.0%) | 25 (100.0%) |
| 5 or more Children | 0 (0.0%) | 0 (0.0%) |
| Total | 0 (0.0%) | 25 (43.1%) |
Income Below Poverty Among Married-Couple vs Single-Parent Households in Corbin City
The poverty data for Corbin City shows that 1 of the married-couple family households (0.9%) and 25 of the single-parent households (32.1%) are living below the poverty level. Within the married-couple family households, those with no children have the highest poverty rate, with 1 households (1.5%) falling below the poverty line. Among the single-parent households, those with 3 or 4 children have the highest poverty rate, with 25 household (100.0%) living below poverty.
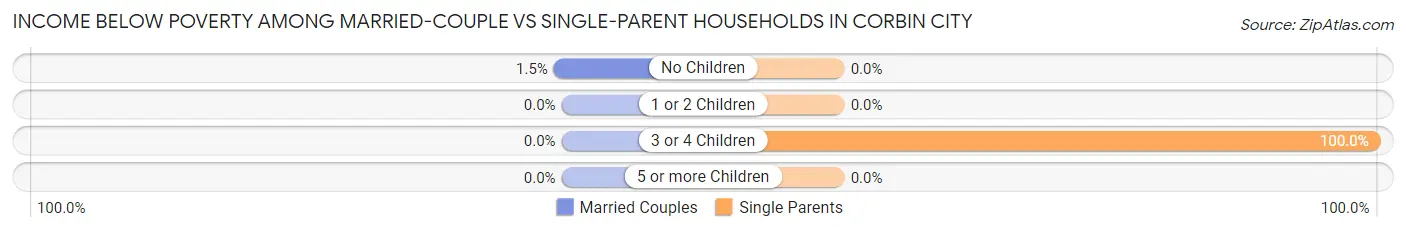
| Children | Married-Couple Families | Single-Parent Households |
| No Children | 1 (1.5%) | 0 (0.0%) |
| 1 or 2 Children | 0 (0.0%) | 0 (0.0%) |
| 3 or 4 Children | 0 (0.0%) | 25 (100.0%) |
| 5 or more Children | 0 (0.0%) | 0 (0.0%) |
| Total | 1 (0.9%) | 25 (32.1%) |
Employment Characteristics in Corbin City
Employment by Class of Employer in Corbin City
Among the 320 employed individuals in Corbin City, private company employees (232 | 72.5%), local government employees (32 | 10.0%), and self-employed (not incorporated) (26 | 8.1%) make up the most common classes of employment.
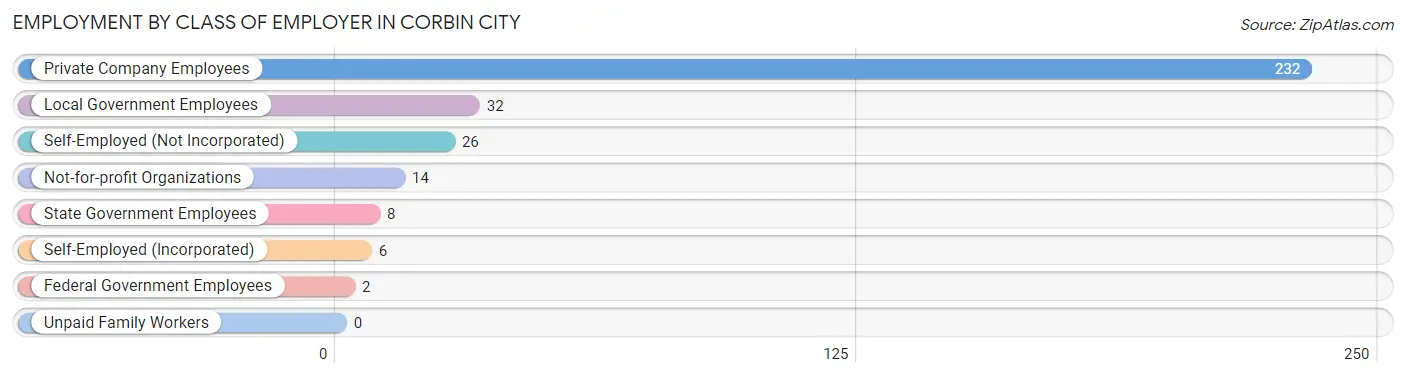
| Employer Class | # Employees | % Employees |
| Private Company Employees | 232 | 72.5% |
| Self-Employed (Incorporated) | 6 | 1.9% |
| Self-Employed (Not Incorporated) | 26 | 8.1% |
| Not-for-profit Organizations | 14 | 4.4% |
| Local Government Employees | 32 | 10.0% |
| State Government Employees | 8 | 2.5% |
| Federal Government Employees | 2 | 0.6% |
| Unpaid Family Workers | 0 | 0.0% |
| Total | 320 | 100.0% |
Employment Status by Age in Corbin City
According to the labor force statistics for Corbin City, out of the total population over 16 years of age (550), 65.3% or 359 individuals are in the labor force, with 7.8% or 28 of them unemployed. The age group with the highest labor force participation rate is 20 to 24 years, with 100.0% or 92 individuals in the labor force. Within the labor force, the 30 to 34 years age range has the highest percentage of unemployed individuals, with 42.1% or 24 of them being unemployed.
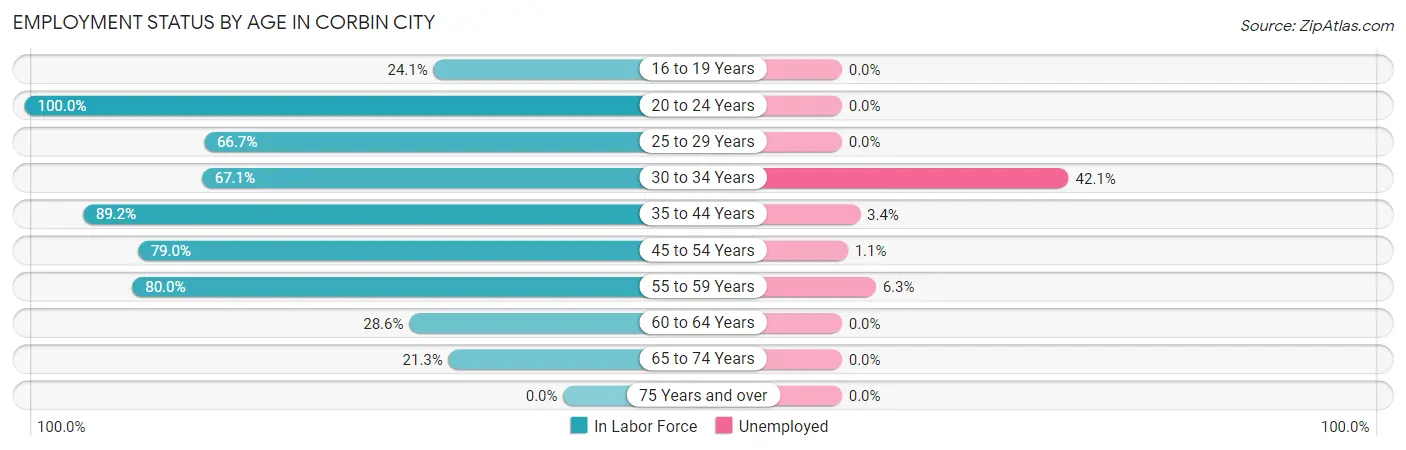
| Age Bracket | In Labor Force | Unemployed |
| 16 to 19 Years | 7 (24.1%) | 0 (0.0%) |
| 20 to 24 Years | 92 (100.0%) | 0 (0.0%) |
| 25 to 29 Years | 14 (66.7%) | 0 (0.0%) |
| 30 to 34 Years | 57 (67.1%) | 24 (42.1%) |
| 35 to 44 Years | 58 (89.2%) | 2 (3.4%) |
| 45 to 54 Years | 94 (79.0%) | 1 (1.1%) |
| 55 to 59 Years | 16 (80.0%) | 1 (6.3%) |
| 60 to 64 Years | 8 (28.6%) | 0 (0.0%) |
| 65 to 74 Years | 13 (21.3%) | 0 (0.0%) |
| 75 Years and over | 0 (0.0%) | 0 (0.0%) |
| Total | 359 (65.3%) | 28 (7.8%) |
Employment Status by Educational Attainment in Corbin City
According to labor force statistics for Corbin City, 73.1% of individuals (247) out of the total population between 25 and 64 years of age (338) are in the labor force, with 11.3% or 28 of them being unemployed. The group with the highest labor force participation rate are those with the educational attainment of bachelor's degree or higher, with 91.4% or 64 individuals in the labor force. Within the labor force, individuals with college / associate degree education have the highest percentage of unemployment, with 31.7% or 26 of them being unemployed.
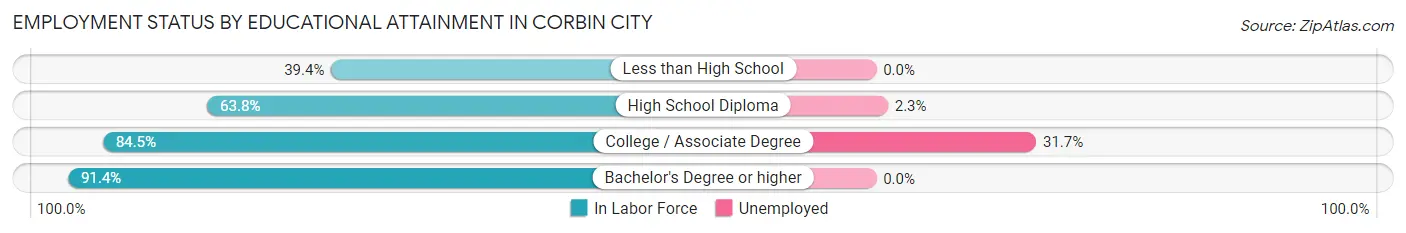
| Educational Attainment | In Labor Force | Unemployed |
| Less than High School | 13 (39.4%) | 0 (0.0%) |
| High School Diploma | 88 (63.8%) | 3 (2.3%) |
| College / Associate Degree | 82 (84.5%) | 31 (31.7%) |
| Bachelor's Degree or higher | 64 (91.4%) | 0 (0.0%) |
| Total | 247 (73.1%) | 38 (11.3%) |
Employment Occupations by Sex in Corbin City
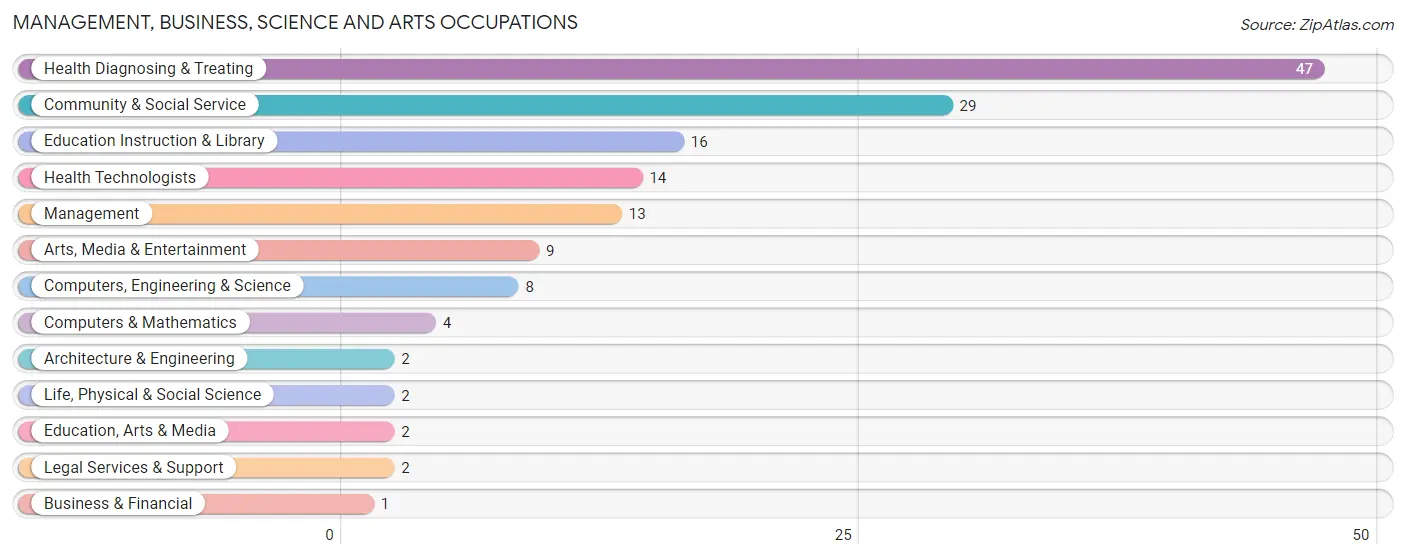
Management, Business, Science and Arts Occupations
The most common Management, Business, Science and Arts occupations in Corbin City are Health Diagnosing & Treating (47 | 14.2%), Community & Social Service (29 | 8.8%), Education Instruction & Library (16 | 4.8%), Health Technologists (14 | 4.2%), and Management (13 | 3.9%).
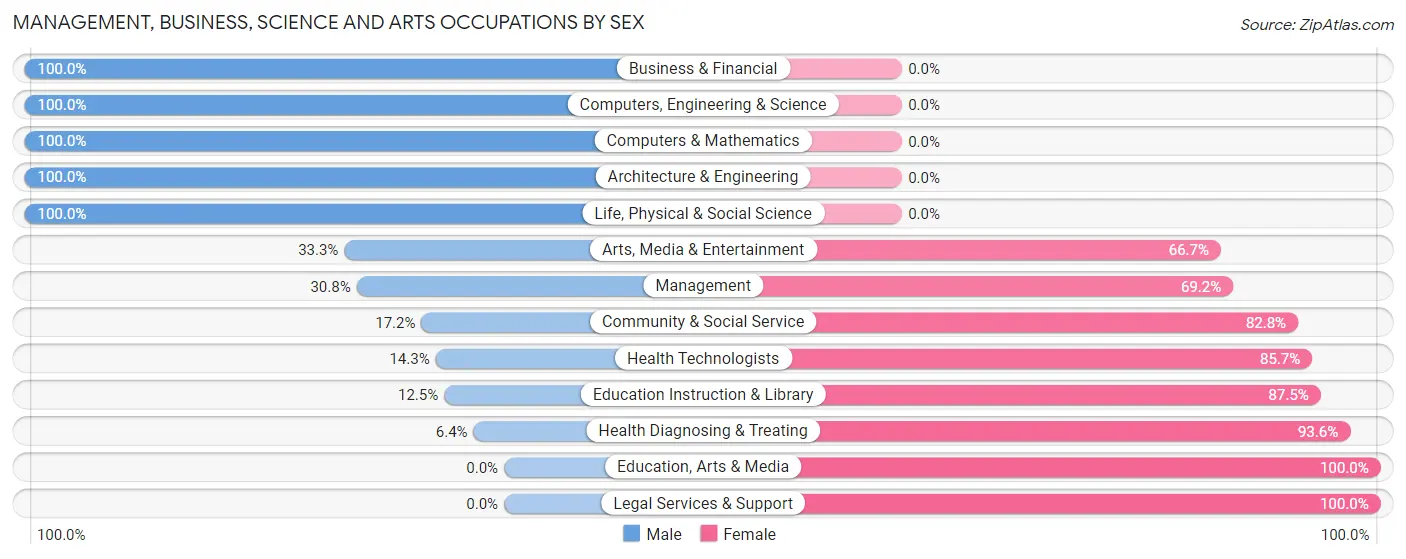
Management, Business, Science and Arts Occupations by Sex
Within the Management, Business, Science and Arts occupations in Corbin City, the most male-oriented occupations are Business & Financial (100.0%), Computers, Engineering & Science (100.0%), and Computers & Mathematics (100.0%), while the most female-oriented occupations are Education, Arts & Media (100.0%), Legal Services & Support (100.0%), and Health Diagnosing & Treating (93.6%).
| Occupation | Male | Female |
| Management | 4 (30.8%) | 9 (69.2%) |
| Business & Financial | 1 (100.0%) | 0 (0.0%) |
| Computers, Engineering & Science | 8 (100.0%) | 0 (0.0%) |
| Computers & Mathematics | 4 (100.0%) | 0 (0.0%) |
| Architecture & Engineering | 2 (100.0%) | 0 (0.0%) |
| Life, Physical & Social Science | 2 (100.0%) | 0 (0.0%) |
| Community & Social Service | 5 (17.2%) | 24 (82.8%) |
| Education, Arts & Media | 0 (0.0%) | 2 (100.0%) |
| Legal Services & Support | 0 (0.0%) | 2 (100.0%) |
| Education Instruction & Library | 2 (12.5%) | 14 (87.5%) |
| Arts, Media & Entertainment | 3 (33.3%) | 6 (66.7%) |
| Health Diagnosing & Treating | 3 (6.4%) | 44 (93.6%) |
| Health Technologists | 2 (14.3%) | 12 (85.7%) |
| Total (Category) | 21 (21.4%) | 77 (78.6%) |
| Total (Overall) | 181 (54.7%) | 150 (45.3%) |
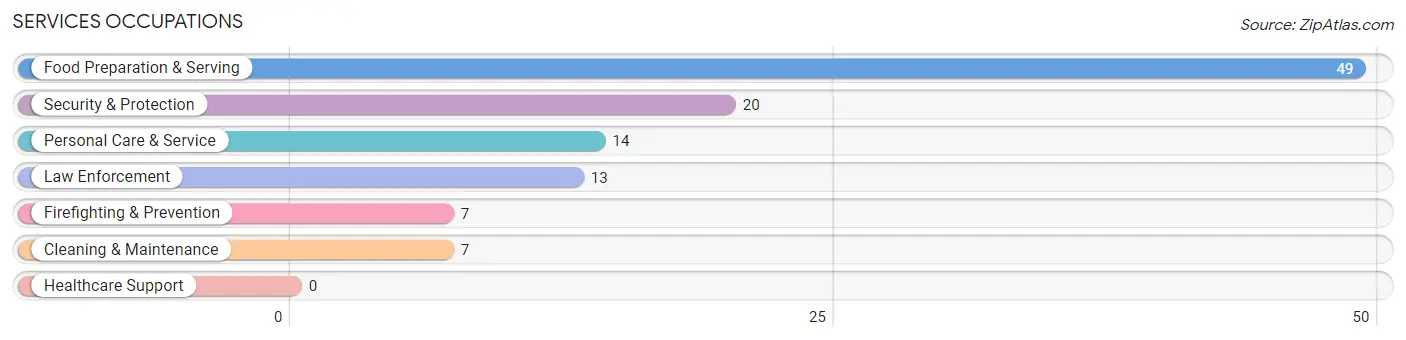
Services Occupations
The most common Services occupations in Corbin City are Food Preparation & Serving (49 | 14.8%), Security & Protection (20 | 6.0%), Personal Care & Service (14 | 4.2%), Law Enforcement (13 | 3.9%), and Firefighting & Prevention (7 | 2.1%).
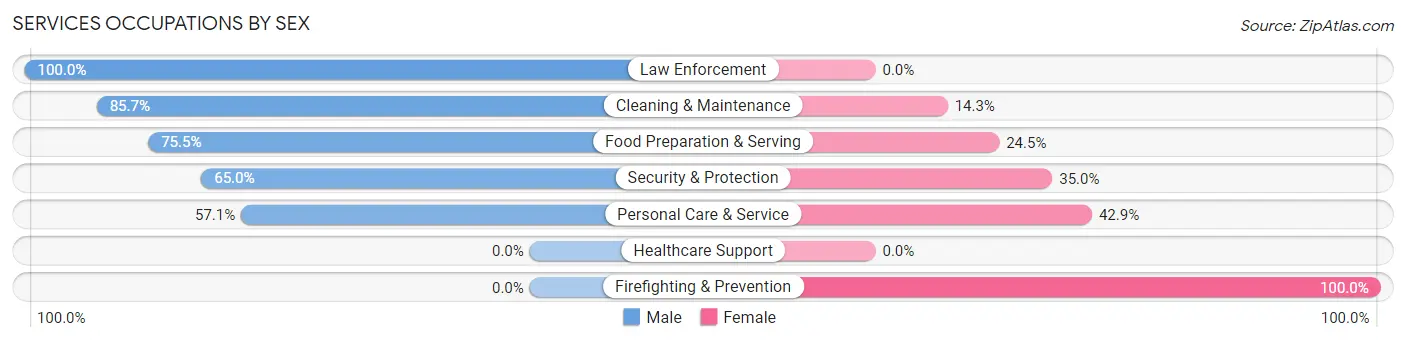
Services Occupations by Sex
Within the Services occupations in Corbin City, the most male-oriented occupations are Law Enforcement (100.0%), Cleaning & Maintenance (85.7%), and Food Preparation & Serving (75.5%), while the most female-oriented occupations are Firefighting & Prevention (100.0%), Personal Care & Service (42.9%), and Security & Protection (35.0%).
| Occupation | Male | Female |
| Healthcare Support | 0 (0.0%) | 0 (0.0%) |
| Security & Protection | 13 (65.0%) | 7 (35.0%) |
| Firefighting & Prevention | 0 (0.0%) | 7 (100.0%) |
| Law Enforcement | 13 (100.0%) | 0 (0.0%) |
| Food Preparation & Serving | 37 (75.5%) | 12 (24.5%) |
| Cleaning & Maintenance | 6 (85.7%) | 1 (14.3%) |
| Personal Care & Service | 8 (57.1%) | 6 (42.9%) |
| Total (Category) | 64 (71.1%) | 26 (28.9%) |
| Total (Overall) | 181 (54.7%) | 150 (45.3%) |
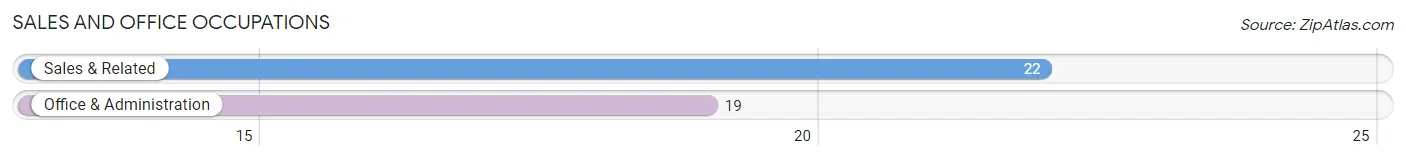
Sales and Office Occupations
The most common Sales and Office occupations in Corbin City are Sales & Related (22 | 6.7%), and Office & Administration (19 | 5.7%).
Sales and Office Occupations by Sex
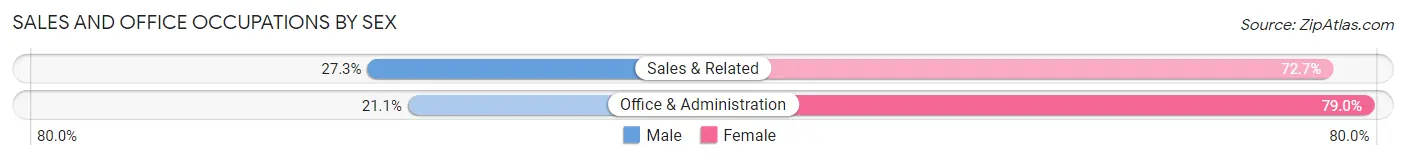
| Occupation | Male | Female |
| Sales & Related | 6 (27.3%) | 16 (72.7%) |
| Office & Administration | 4 (21.0%) | 15 (78.9%) |
| Total (Category) | 10 (24.4%) | 31 (75.6%) |
| Total (Overall) | 181 (54.7%) | 150 (45.3%) |
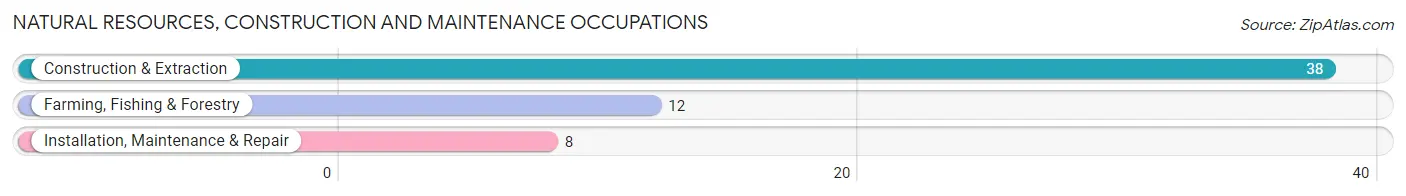
Natural Resources, Construction and Maintenance Occupations
The most common Natural Resources, Construction and Maintenance occupations in Corbin City are Construction & Extraction (38 | 11.5%), Farming, Fishing & Forestry (12 | 3.6%), and Installation, Maintenance & Repair (8 | 2.4%).
Natural Resources, Construction and Maintenance Occupations by Sex
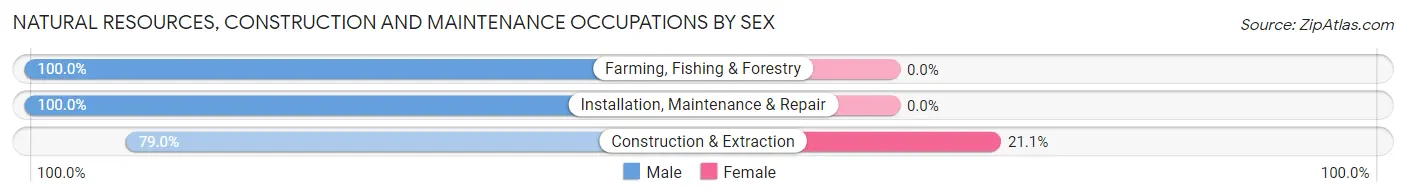
| Occupation | Male | Female |
| Farming, Fishing & Forestry | 12 (100.0%) | 0 (0.0%) |
| Construction & Extraction | 30 (78.9%) | 8 (21.0%) |
| Installation, Maintenance & Repair | 8 (100.0%) | 0 (0.0%) |
| Total (Category) | 50 (86.2%) | 8 (13.8%) |
| Total (Overall) | 181 (54.7%) | 150 (45.3%) |
Production, Transportation and Moving Occupations
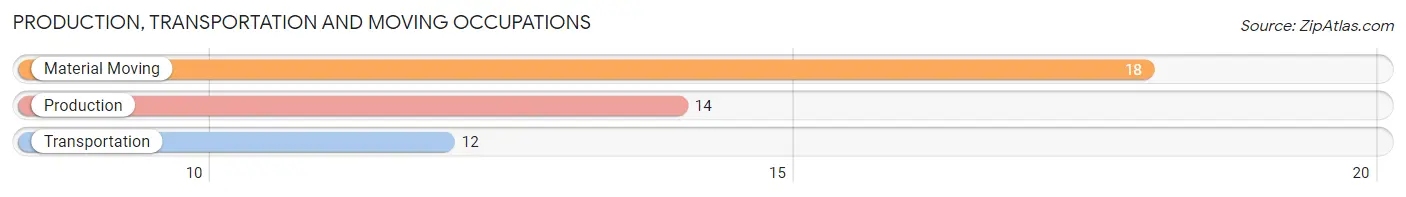
The most common Production, Transportation and Moving occupations in Corbin City are Material Moving (18 | 5.4%), Production (14 | 4.2%), and Transportation (12 | 3.6%).
Production, Transportation and Moving Occupations by Sex
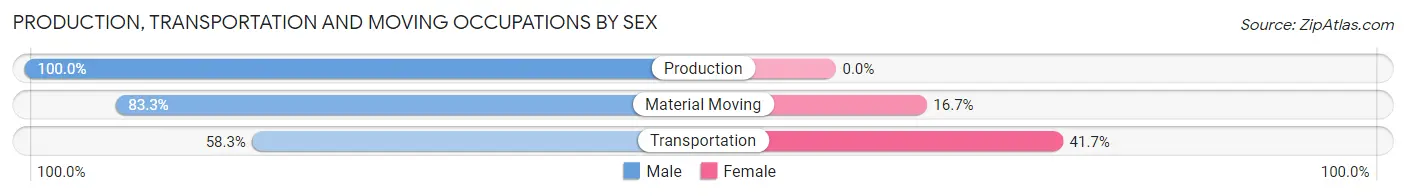
| Occupation | Male | Female |
| Production | 14 (100.0%) | 0 (0.0%) |
| Transportation | 7 (58.3%) | 5 (41.7%) |
| Material Moving | 15 (83.3%) | 3 (16.7%) |
| Total (Category) | 36 (81.8%) | 8 (18.2%) |
| Total (Overall) | 181 (54.7%) | 150 (45.3%) |
Employment Industries by Sex in Corbin City
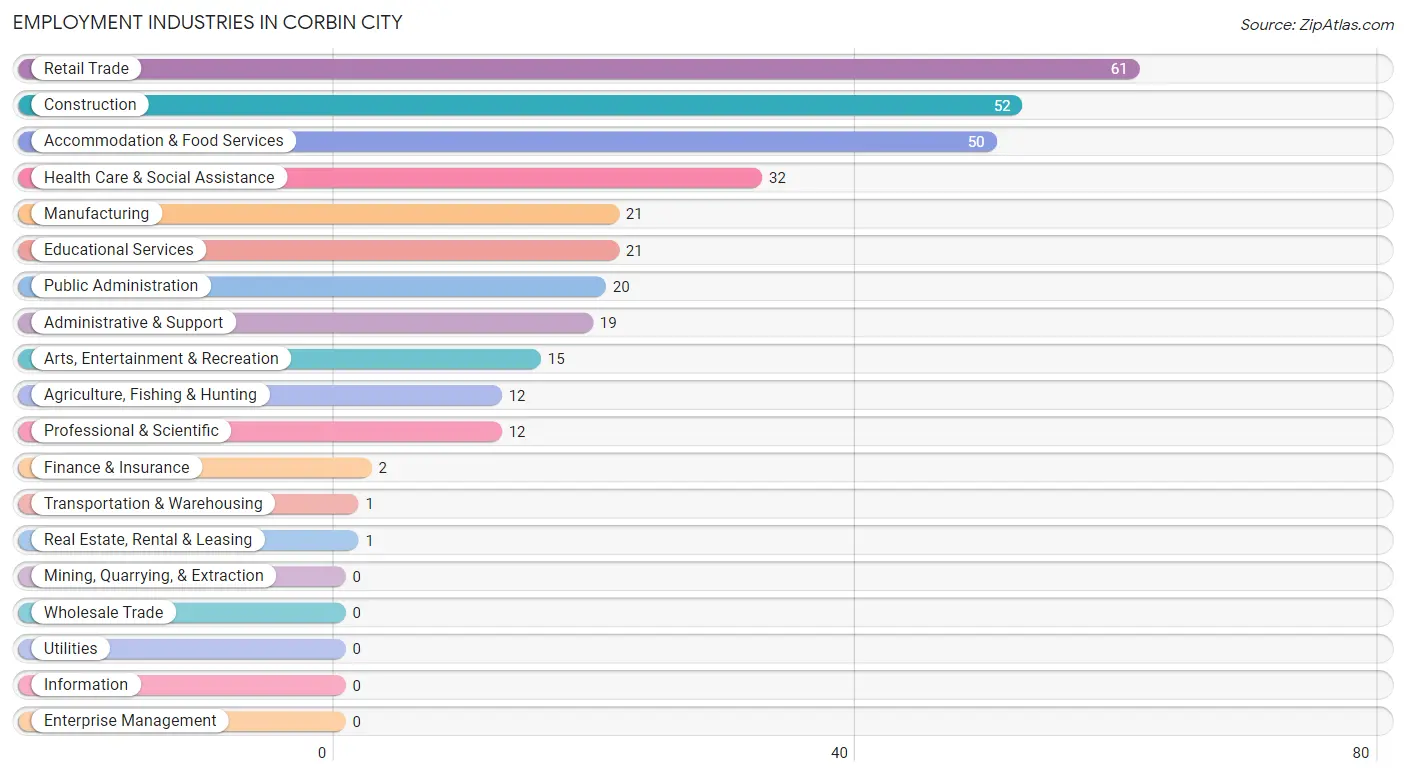
Employment Industries in Corbin City
The major employment industries in Corbin City include Retail Trade (61 | 18.4%), Construction (52 | 15.7%), Accommodation & Food Services (50 | 15.1%), Health Care & Social Assistance (32 | 9.7%), and Manufacturing (21 | 6.3%).
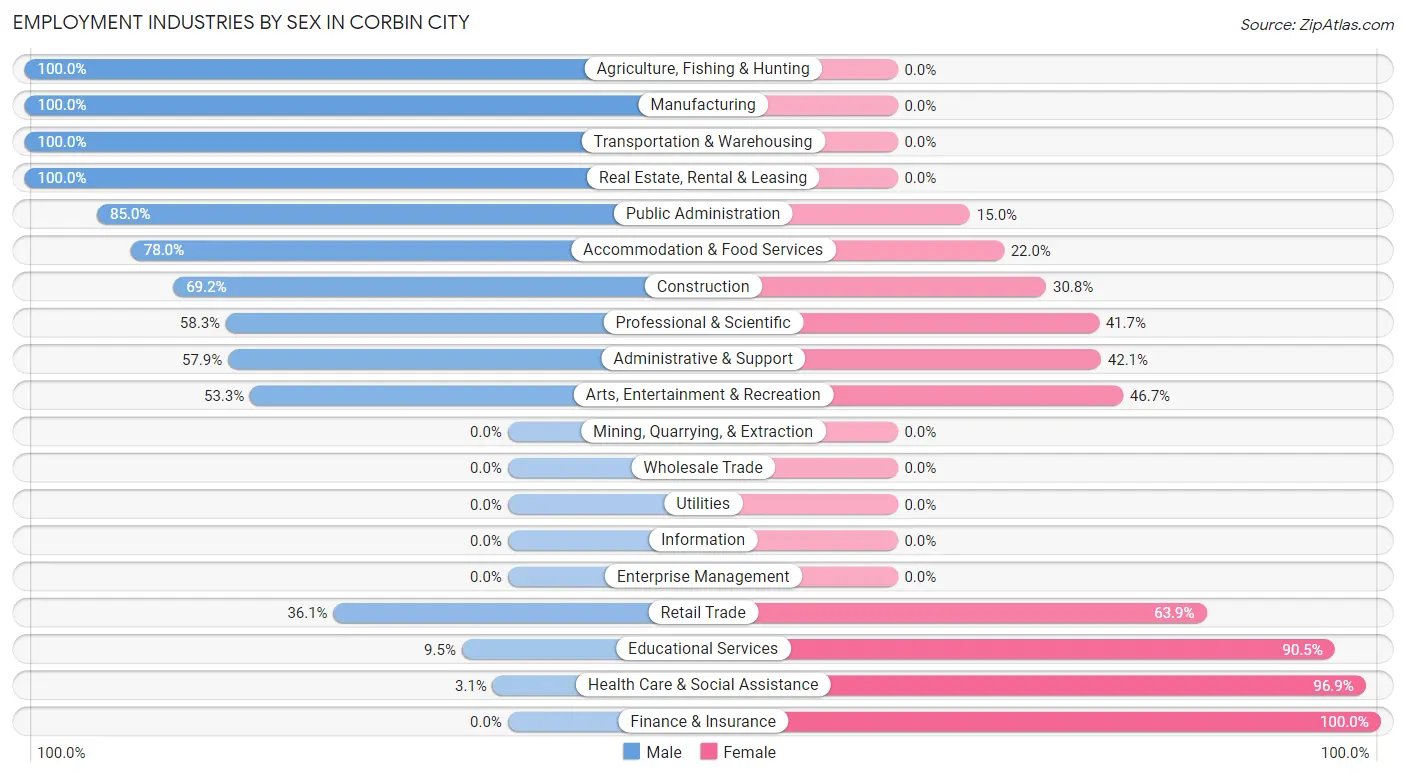
Employment Industries by Sex in Corbin City
The Corbin City industries that see more men than women are Agriculture, Fishing & Hunting (100.0%), Manufacturing (100.0%), and Transportation & Warehousing (100.0%), whereas the industries that tend to have a higher number of women are Finance & Insurance (100.0%), Health Care & Social Assistance (96.9%), and Educational Services (90.5%).
| Industry | Male | Female |
| Agriculture, Fishing & Hunting | 12 (100.0%) | 0 (0.0%) |
| Mining, Quarrying, & Extraction | 0 (0.0%) | 0 (0.0%) |
| Construction | 36 (69.2%) | 16 (30.8%) |
| Manufacturing | 21 (100.0%) | 0 (0.0%) |
| Wholesale Trade | 0 (0.0%) | 0 (0.0%) |
| Retail Trade | 22 (36.1%) | 39 (63.9%) |
| Transportation & Warehousing | 1 (100.0%) | 0 (0.0%) |
| Utilities | 0 (0.0%) | 0 (0.0%) |
| Information | 0 (0.0%) | 0 (0.0%) |
| Finance & Insurance | 0 (0.0%) | 2 (100.0%) |
| Real Estate, Rental & Leasing | 1 (100.0%) | 0 (0.0%) |
| Professional & Scientific | 7 (58.3%) | 5 (41.7%) |
| Enterprise Management | 0 (0.0%) | 0 (0.0%) |
| Administrative & Support | 11 (57.9%) | 8 (42.1%) |
| Educational Services | 2 (9.5%) | 19 (90.5%) |
| Health Care & Social Assistance | 1 (3.1%) | 31 (96.9%) |
| Arts, Entertainment & Recreation | 8 (53.3%) | 7 (46.7%) |
| Accommodation & Food Services | 39 (78.0%) | 11 (22.0%) |
| Public Administration | 17 (85.0%) | 3 (15.0%) |
| Total | 181 (54.7%) | 150 (45.3%) |
Education in Corbin City
School Enrollment in Corbin City
The most common levels of schooling among the 175 students in Corbin City are middle school (52 | 29.7%), high school (37 | 21.1%), and graduate / professional (30 | 17.1%).
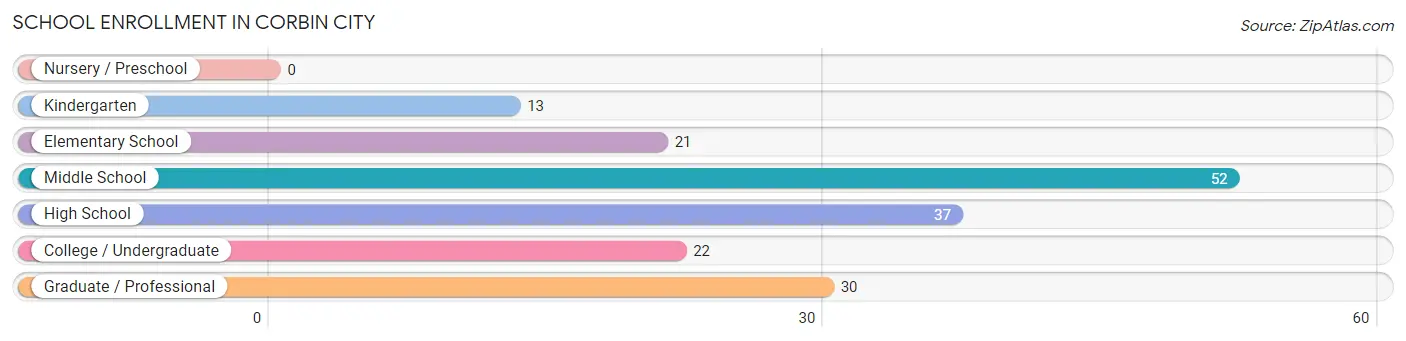
| School Level | # Students | % Students |
| Nursery / Preschool | 0 | 0.0% |
| Kindergarten | 13 | 7.4% |
| Elementary School | 21 | 12.0% |
| Middle School | 52 | 29.7% |
| High School | 37 | 21.1% |
| College / Undergraduate | 22 | 12.6% |
| Graduate / Professional | 30 | 17.1% |
| Total | 175 | 100.0% |
School Enrollment by Age by Funding Source in Corbin City
Out of a total of 175 students who are enrolled in schools in Corbin City, 23 (13.1%) attend a private institution, while the remaining 152 (86.9%) are enrolled in public schools. The age group of 20 to 24 year olds has the highest likelihood of being enrolled in private schools, with 22 (59.5% in the age bracket) enrolled. Conversely, the age group of 5 to 9 year old has the lowest likelihood of being enrolled in a private school, with 34 (100.0% in the age bracket) attending a public institution.
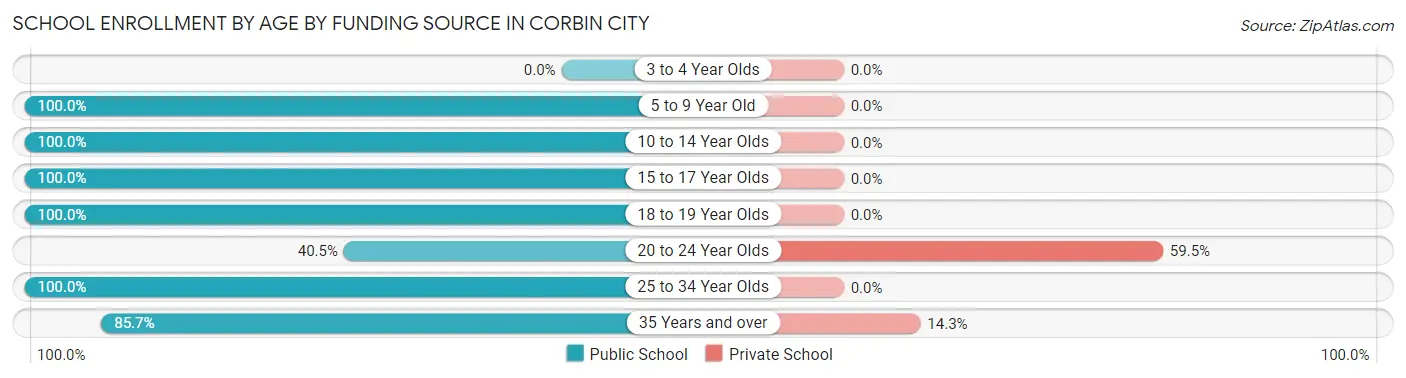
| Age Bracket | Public School | Private School |
| 3 to 4 Year Olds | 0 (0.0%) | 0 (0.0%) |
| 5 to 9 Year Old | 34 (100.0%) | 0 (0.0%) |
| 10 to 14 Year Olds | 52 (100.0%) | 0 (0.0%) |
| 15 to 17 Year Olds | 35 (100.0%) | 0 (0.0%) |
| 18 to 19 Year Olds | 7 (100.0%) | 0 (0.0%) |
| 20 to 24 Year Olds | 15 (40.5%) | 22 (59.5%) |
| 25 to 34 Year Olds | 3 (100.0%) | 0 (0.0%) |
| 35 Years and over | 6 (85.7%) | 1 (14.3%) |
| Total | 152 (86.9%) | 23 (13.1%) |
Educational Attainment by Field of Study in Corbin City
Business (21 | 22.1%), education (16 | 16.8%), science & technology (15 | 15.8%), bio, nature & agricultural (14 | 14.7%), and liberal arts & history (8 | 8.4%) are the most common fields of study among 95 individuals in Corbin City who have obtained a bachelor's degree or higher.
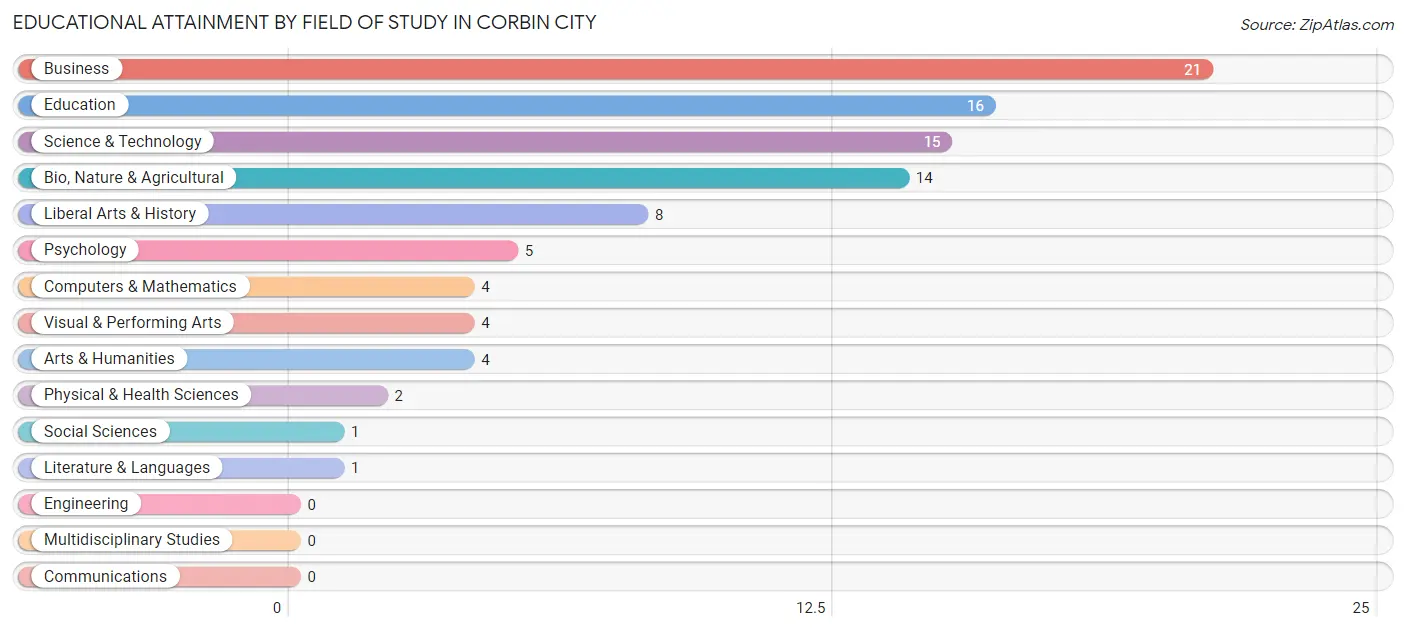
| Field of Study | # Graduates | % Graduates |
| Computers & Mathematics | 4 | 4.2% |
| Bio, Nature & Agricultural | 14 | 14.7% |
| Physical & Health Sciences | 2 | 2.1% |
| Psychology | 5 | 5.3% |
| Social Sciences | 1 | 1.1% |
| Engineering | 0 | 0.0% |
| Multidisciplinary Studies | 0 | 0.0% |
| Science & Technology | 15 | 15.8% |
| Business | 21 | 22.1% |
| Education | 16 | 16.8% |
| Literature & Languages | 1 | 1.1% |
| Liberal Arts & History | 8 | 8.4% |
| Visual & Performing Arts | 4 | 4.2% |
| Communications | 0 | 0.0% |
| Arts & Humanities | 4 | 4.2% |
| Total | 95 | 100.0% |
Transportation & Commute in Corbin City
Vehicle Availability by Sex in Corbin City
The most prevalent vehicle ownership categories in Corbin City are males with 5 or more vehicles (63, accounting for 35.6%) and females with 5 or more vehicles (52, making up 44.1%).
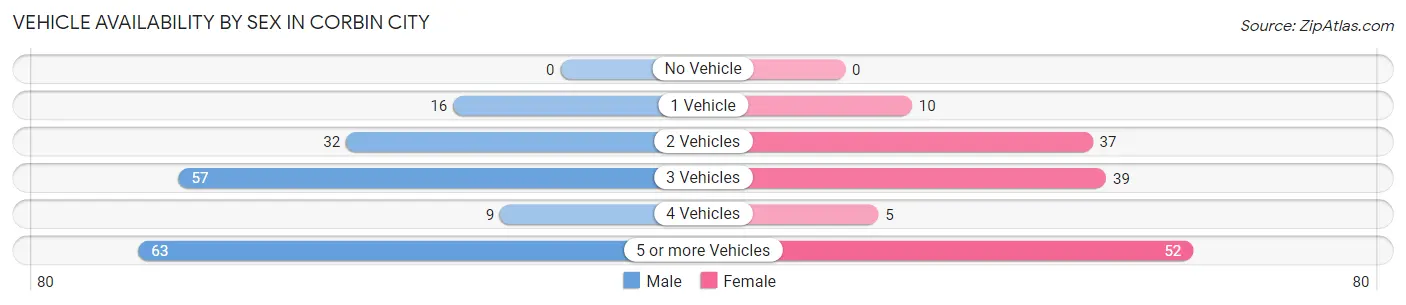
| Vehicles Available | Male | Female |
| No Vehicle | 0 (0.0%) | 0 (0.0%) |
| 1 Vehicle | 16 (9.0%) | 10 (7.0%) |
| 2 Vehicles | 32 (18.1%) | 37 (25.9%) |
| 3 Vehicles | 57 (32.2%) | 39 (27.3%) |
| 4 Vehicles | 9 (5.1%) | 5 (3.5%) |
| 5 or more Vehicles | 63 (35.6%) | 52 (36.4%) |
| Total | 177 (100.0%) | 143 (100.0%) |
Commute Time in Corbin City
The most frequently occuring commute durations in Corbin City are 30 to 34 minutes (126 commuters, 41.4%), 20 to 24 minutes (41 commuters, 13.5%), and 45 to 59 minutes (24 commuters, 7.9%).
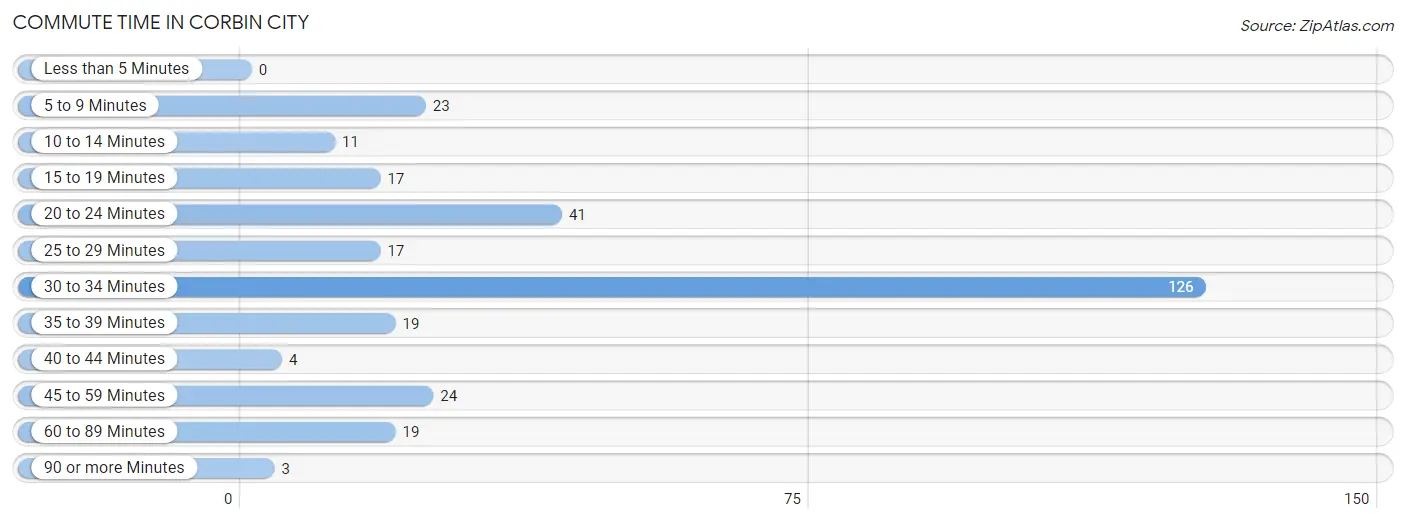
| Commute Time | # Commuters | % Commuters |
| Less than 5 Minutes | 0 | 0.0% |
| 5 to 9 Minutes | 23 | 7.6% |
| 10 to 14 Minutes | 11 | 3.6% |
| 15 to 19 Minutes | 17 | 5.6% |
| 20 to 24 Minutes | 41 | 13.5% |
| 25 to 29 Minutes | 17 | 5.6% |
| 30 to 34 Minutes | 126 | 41.4% |
| 35 to 39 Minutes | 19 | 6.2% |
| 40 to 44 Minutes | 4 | 1.3% |
| 45 to 59 Minutes | 24 | 7.9% |
| 60 to 89 Minutes | 19 | 6.2% |
| 90 or more Minutes | 3 | 1.0% |
Commute Time by Sex in Corbin City
The most common commute times in Corbin City are 30 to 34 minutes (66 commuters, 38.2%) for males and 30 to 34 minutes (60 commuters, 45.8%) for females.
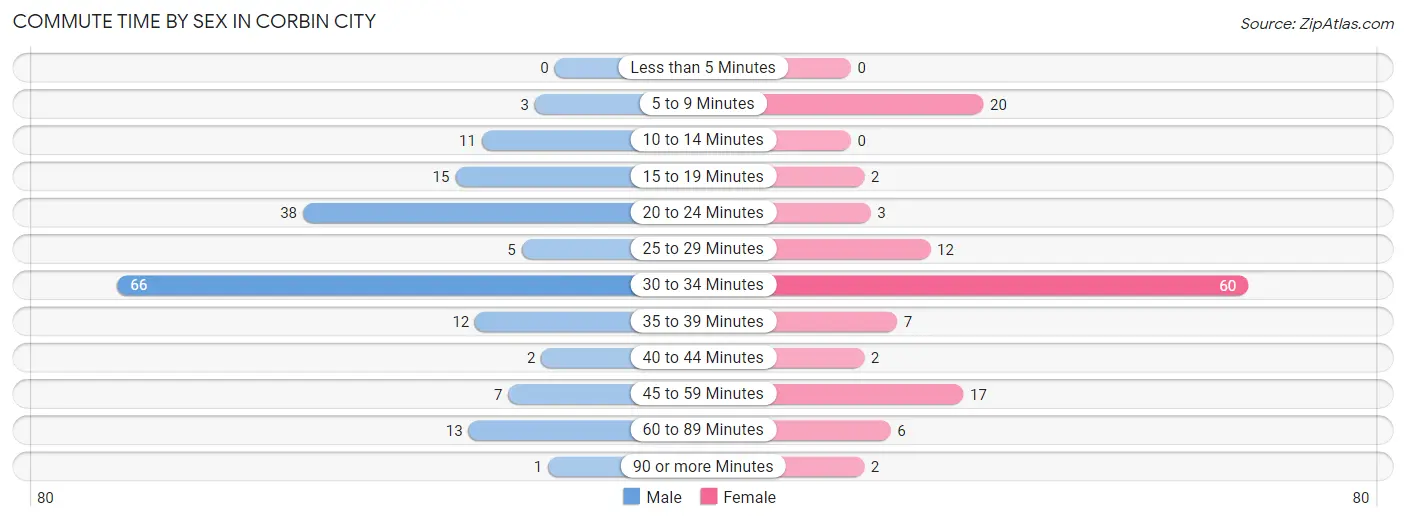
| Commute Time | Male | Female |
| Less than 5 Minutes | 0 (0.0%) | 0 (0.0%) |
| 5 to 9 Minutes | 3 (1.7%) | 20 (15.3%) |
| 10 to 14 Minutes | 11 (6.4%) | 0 (0.0%) |
| 15 to 19 Minutes | 15 (8.7%) | 2 (1.5%) |
| 20 to 24 Minutes | 38 (22.0%) | 3 (2.3%) |
| 25 to 29 Minutes | 5 (2.9%) | 12 (9.2%) |
| 30 to 34 Minutes | 66 (38.2%) | 60 (45.8%) |
| 35 to 39 Minutes | 12 (6.9%) | 7 (5.3%) |
| 40 to 44 Minutes | 2 (1.2%) | 2 (1.5%) |
| 45 to 59 Minutes | 7 (4.1%) | 17 (13.0%) |
| 60 to 89 Minutes | 13 (7.5%) | 6 (4.6%) |
| 90 or more Minutes | 1 (0.6%) | 2 (1.5%) |
Time of Departure to Work by Sex in Corbin City
The most frequent times of departure to work in Corbin City are 9:00 AM to 9:59 AM (72, 41.6%) for males and 12:00 PM to 3:59 PM (37, 28.2%) for females.
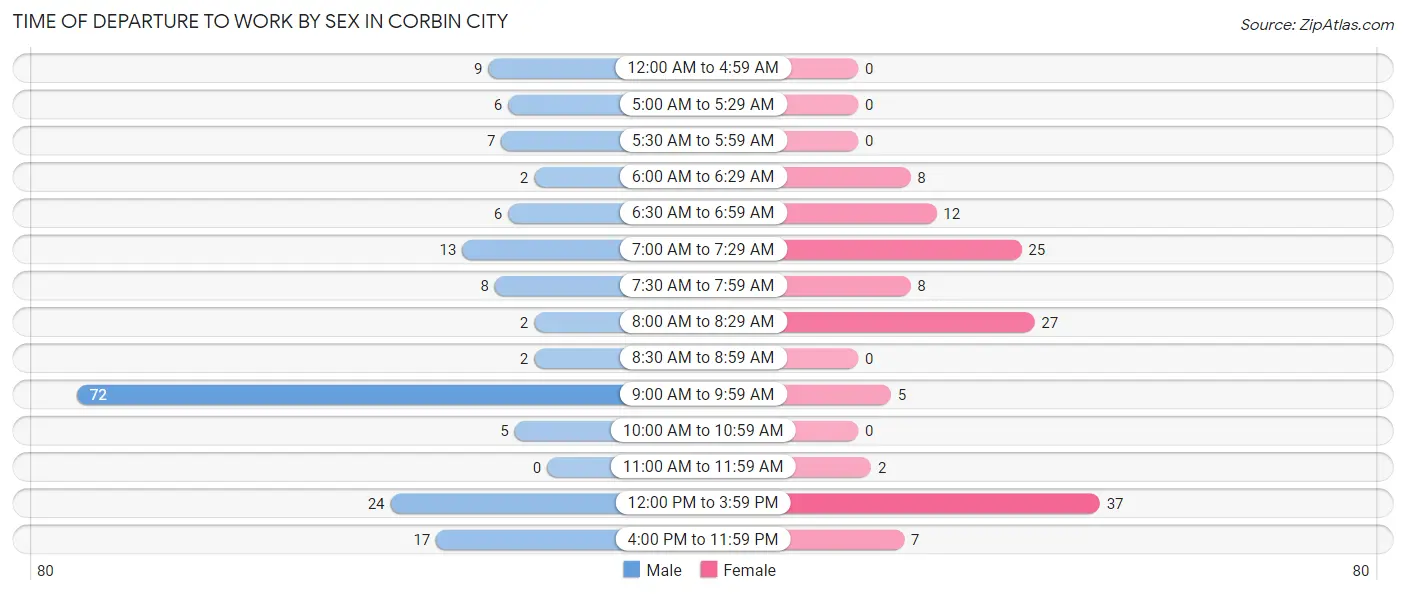
| Time of Departure | Male | Female |
| 12:00 AM to 4:59 AM | 9 (5.2%) | 0 (0.0%) |
| 5:00 AM to 5:29 AM | 6 (3.5%) | 0 (0.0%) |
| 5:30 AM to 5:59 AM | 7 (4.1%) | 0 (0.0%) |
| 6:00 AM to 6:29 AM | 2 (1.2%) | 8 (6.1%) |
| 6:30 AM to 6:59 AM | 6 (3.5%) | 12 (9.2%) |
| 7:00 AM to 7:29 AM | 13 (7.5%) | 25 (19.1%) |
| 7:30 AM to 7:59 AM | 8 (4.6%) | 8 (6.1%) |
| 8:00 AM to 8:29 AM | 2 (1.2%) | 27 (20.6%) |
| 8:30 AM to 8:59 AM | 2 (1.2%) | 0 (0.0%) |
| 9:00 AM to 9:59 AM | 72 (41.6%) | 5 (3.8%) |
| 10:00 AM to 10:59 AM | 5 (2.9%) | 0 (0.0%) |
| 11:00 AM to 11:59 AM | 0 (0.0%) | 2 (1.5%) |
| 12:00 PM to 3:59 PM | 24 (13.9%) | 37 (28.2%) |
| 4:00 PM to 11:59 PM | 17 (9.8%) | 7 (5.3%) |
| Total | 173 (100.0%) | 131 (100.0%) |
Housing Occupancy in Corbin City
Occupancy by Ownership in Corbin City
Of the total 232 dwellings in Corbin City, owner-occupied units account for 200 (86.2%), while renter-occupied units make up 32 (13.8%).
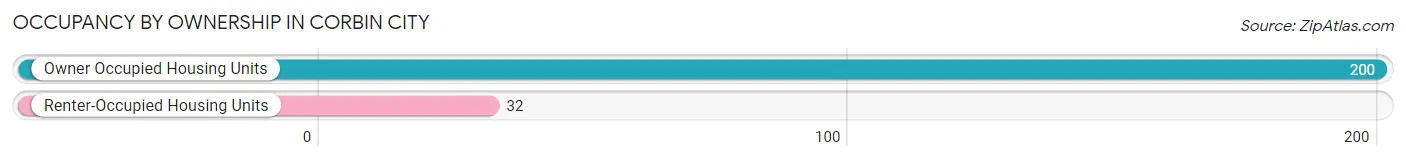
| Occupancy | # Housing Units | % Housing Units |
| Owner Occupied Housing Units | 200 | 86.2% |
| Renter-Occupied Housing Units | 32 | 13.8% |
| Total Occupied Housing Units | 232 | 100.0% |
Occupancy by Household Size in Corbin City
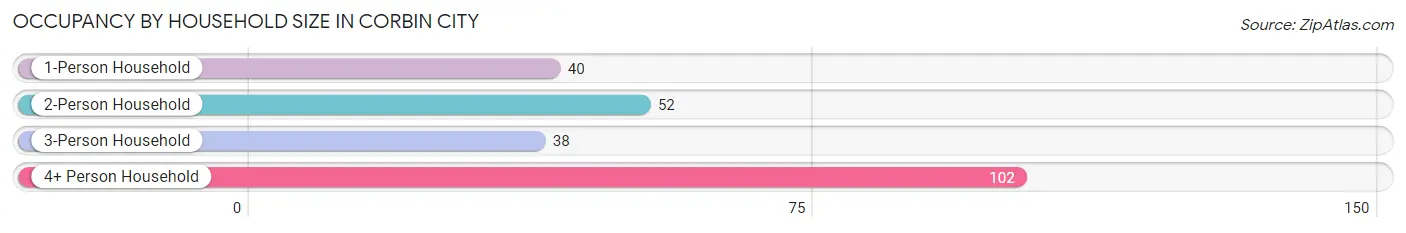
| Household Size | # Housing Units | % Housing Units |
| 1-Person Household | 40 | 17.2% |
| 2-Person Household | 52 | 22.4% |
| 3-Person Household | 38 | 16.4% |
| 4+ Person Household | 102 | 44.0% |
| Total Housing Units | 232 | 100.0% |
Occupancy by Ownership by Household Size in Corbin City
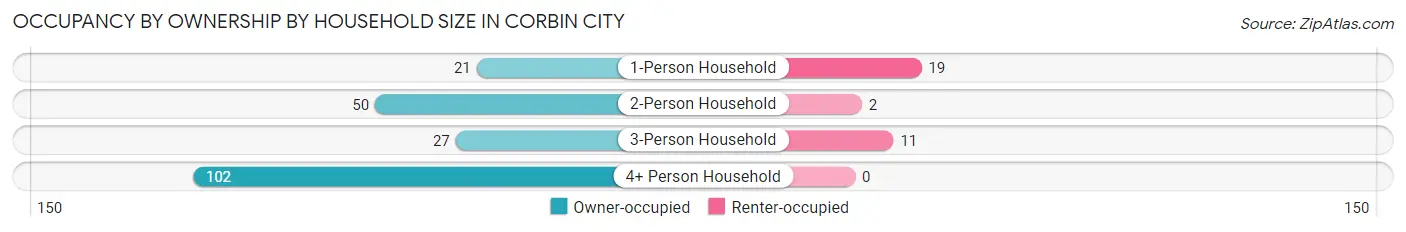
| Household Size | Owner-occupied | Renter-occupied |
| 1-Person Household | 21 (52.5%) | 19 (47.5%) |
| 2-Person Household | 50 (96.2%) | 2 (3.8%) |
| 3-Person Household | 27 (71.1%) | 11 (28.9%) |
| 4+ Person Household | 102 (100.0%) | 0 (0.0%) |
| Total Housing Units | 200 (86.2%) | 32 (13.8%) |
Occupancy by Educational Attainment in Corbin City
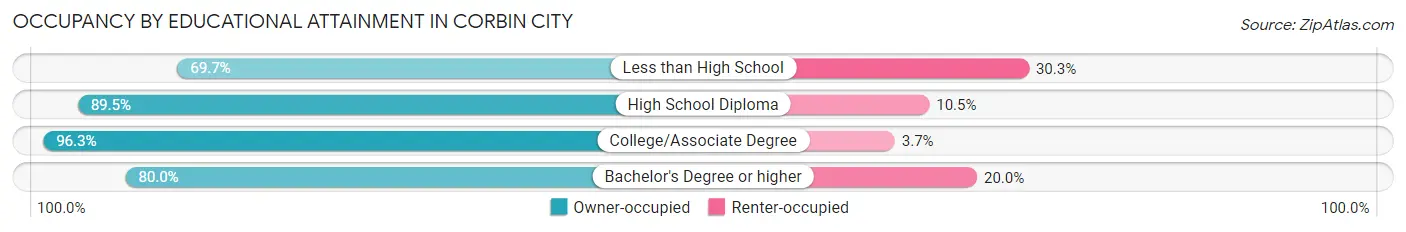
| Household Size | Owner-occupied | Renter-occupied |
| Less than High School | 23 (69.7%) | 10 (30.3%) |
| High School Diploma | 85 (89.5%) | 10 (10.5%) |
| College/Associate Degree | 52 (96.3%) | 2 (3.7%) |
| Bachelor's Degree or higher | 40 (80.0%) | 10 (20.0%) |
Occupancy by Age of Householder in Corbin City
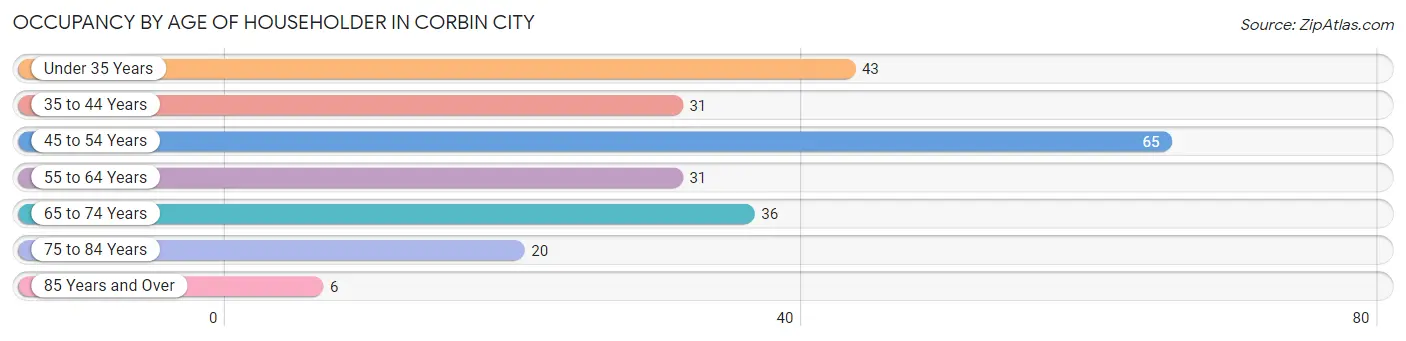
| Age Bracket | # Households | % Households |
| Under 35 Years | 43 | 18.5% |
| 35 to 44 Years | 31 | 13.4% |
| 45 to 54 Years | 65 | 28.0% |
| 55 to 64 Years | 31 | 13.4% |
| 65 to 74 Years | 36 | 15.5% |
| 75 to 84 Years | 20 | 8.6% |
| 85 Years and Over | 6 | 2.6% |
| Total | 232 | 100.0% |
Housing Finances in Corbin City
Median Income by Occupancy in Corbin City
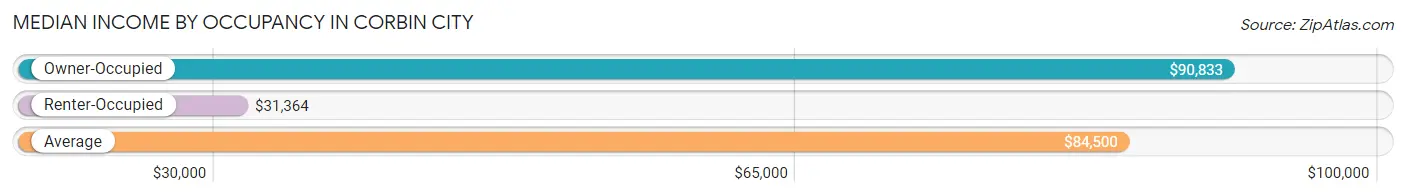
| Occupancy Type | # Households | Median Income |
| Owner-Occupied | 200 (86.2%) | $90,833 |
| Renter-Occupied | 32 (13.8%) | $31,364 |
| Average | 232 (100.0%) | $84,500 |
Occupancy by Householder Income Bracket in Corbin City
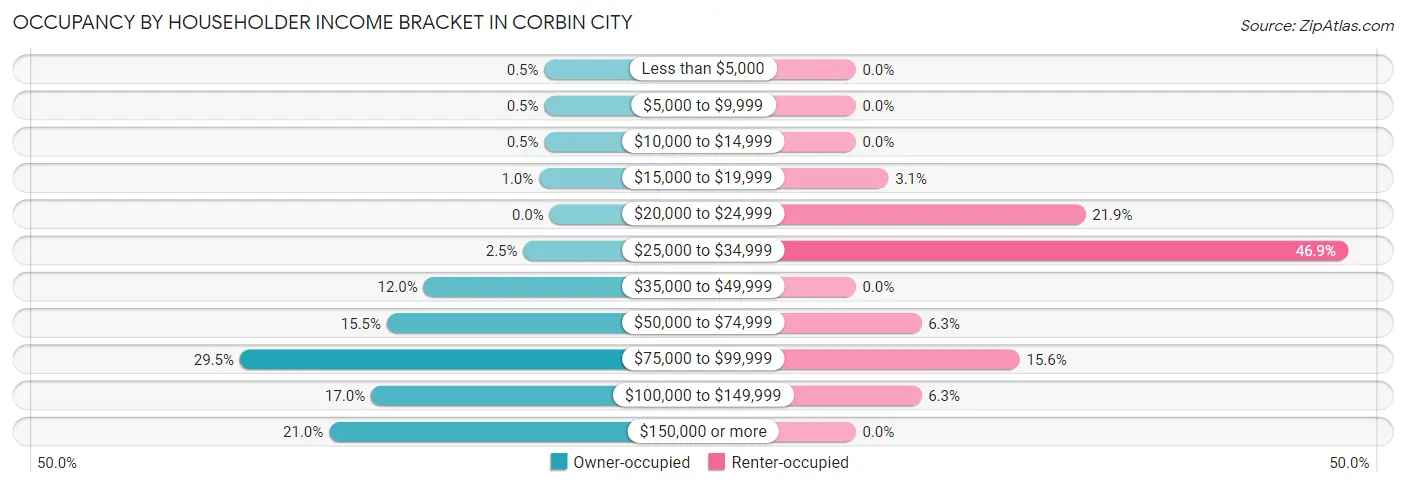
| Income Bracket | Owner-occupied | Renter-occupied |
| Less than $5,000 | 1 (0.5%) | 0 (0.0%) |
| $5,000 to $9,999 | 1 (0.5%) | 0 (0.0%) |
| $10,000 to $14,999 | 1 (0.5%) | 0 (0.0%) |
| $15,000 to $19,999 | 2 (1.0%) | 1 (3.1%) |
| $20,000 to $24,999 | 0 (0.0%) | 7 (21.9%) |
| $25,000 to $34,999 | 5 (2.5%) | 15 (46.9%) |
| $35,000 to $49,999 | 24 (12.0%) | 0 (0.0%) |
| $50,000 to $74,999 | 31 (15.5%) | 2 (6.2%) |
| $75,000 to $99,999 | 59 (29.5%) | 5 (15.6%) |
| $100,000 to $149,999 | 34 (17.0%) | 2 (6.2%) |
| $150,000 or more | 42 (21.0%) | 0 (0.0%) |
| Total | 200 (100.0%) | 32 (100.0%) |
Monthly Housing Cost Tiers in Corbin City
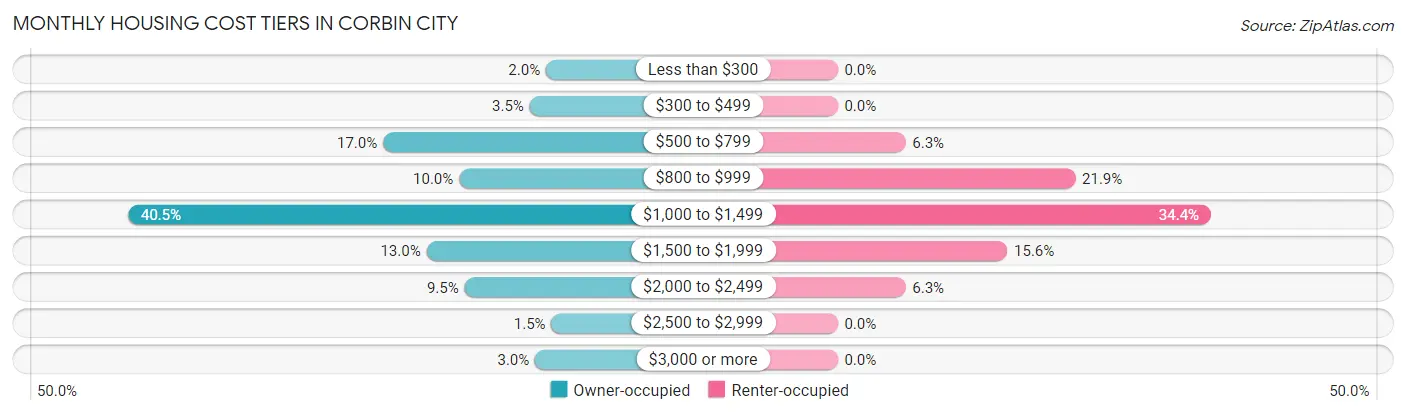
| Monthly Cost | Owner-occupied | Renter-occupied |
| Less than $300 | 4 (2.0%) | 0 (0.0%) |
| $300 to $499 | 7 (3.5%) | 0 (0.0%) |
| $500 to $799 | 34 (17.0%) | 2 (6.2%) |
| $800 to $999 | 20 (10.0%) | 7 (21.9%) |
| $1,000 to $1,499 | 81 (40.5%) | 11 (34.4%) |
| $1,500 to $1,999 | 26 (13.0%) | 5 (15.6%) |
| $2,000 to $2,499 | 19 (9.5%) | 2 (6.2%) |
| $2,500 to $2,999 | 3 (1.5%) | 0 (0.0%) |
| $3,000 or more | 6 (3.0%) | 0 (0.0%) |
| Total | 200 (100.0%) | 32 (100.0%) |
Physical Housing Characteristics in Corbin City
Housing Structures in Corbin City
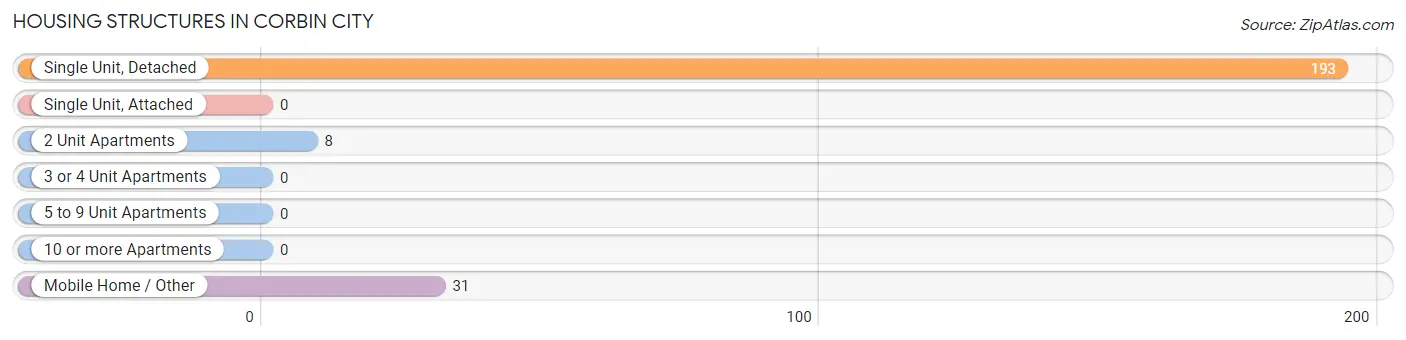
| Structure Type | # Housing Units | % Housing Units |
| Single Unit, Detached | 193 | 83.2% |
| Single Unit, Attached | 0 | 0.0% |
| 2 Unit Apartments | 8 | 3.5% |
| 3 or 4 Unit Apartments | 0 | 0.0% |
| 5 to 9 Unit Apartments | 0 | 0.0% |
| 10 or more Apartments | 0 | 0.0% |
| Mobile Home / Other | 31 | 13.4% |
| Total | 232 | 100.0% |
Housing Structures by Occupancy in Corbin City
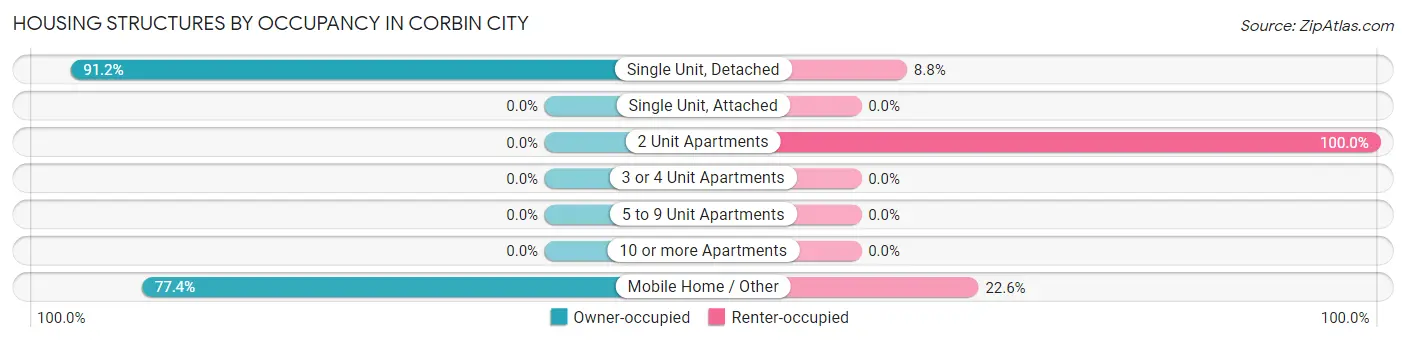
| Structure Type | Owner-occupied | Renter-occupied |
| Single Unit, Detached | 176 (91.2%) | 17 (8.8%) |
| Single Unit, Attached | 0 (0.0%) | 0 (0.0%) |
| 2 Unit Apartments | 0 (0.0%) | 8 (100.0%) |
| 3 or 4 Unit Apartments | 0 (0.0%) | 0 (0.0%) |
| 5 to 9 Unit Apartments | 0 (0.0%) | 0 (0.0%) |
| 10 or more Apartments | 0 (0.0%) | 0 (0.0%) |
| Mobile Home / Other | 24 (77.4%) | 7 (22.6%) |
| Total | 200 (86.2%) | 32 (13.8%) |
Housing Structures by Number of Rooms in Corbin City
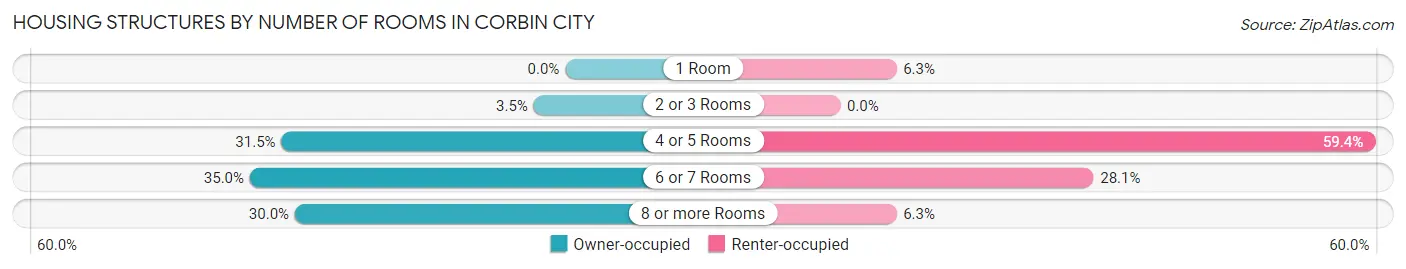
| Number of Rooms | Owner-occupied | Renter-occupied |
| 1 Room | 0 (0.0%) | 2 (6.2%) |
| 2 or 3 Rooms | 7 (3.5%) | 0 (0.0%) |
| 4 or 5 Rooms | 63 (31.5%) | 19 (59.4%) |
| 6 or 7 Rooms | 70 (35.0%) | 9 (28.1%) |
| 8 or more Rooms | 60 (30.0%) | 2 (6.2%) |
| Total | 200 (100.0%) | 32 (100.0%) |
Housing Structure by Heating Type in Corbin City
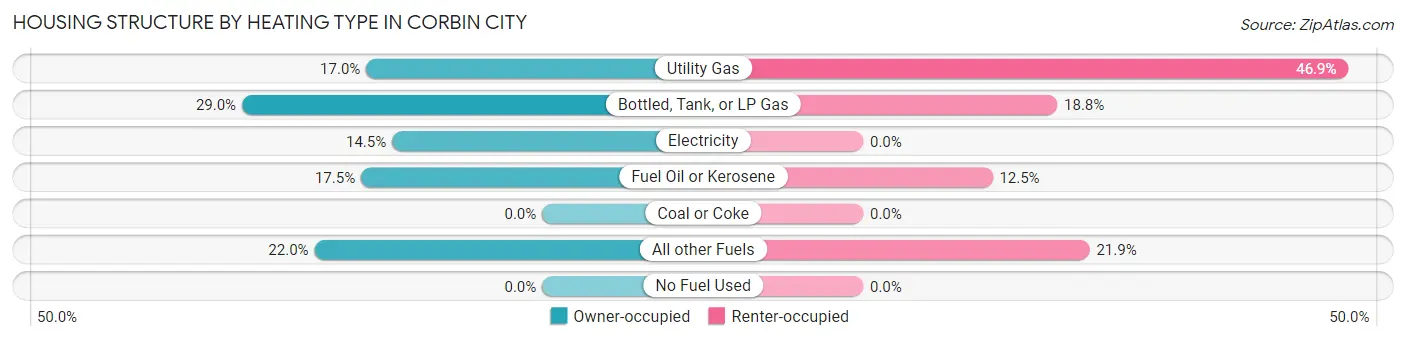
| Heating Type | Owner-occupied | Renter-occupied |
| Utility Gas | 34 (17.0%) | 15 (46.9%) |
| Bottled, Tank, or LP Gas | 58 (29.0%) | 6 (18.8%) |
| Electricity | 29 (14.5%) | 0 (0.0%) |
| Fuel Oil or Kerosene | 35 (17.5%) | 4 (12.5%) |
| Coal or Coke | 0 (0.0%) | 0 (0.0%) |
| All other Fuels | 44 (22.0%) | 7 (21.9%) |
| No Fuel Used | 0 (0.0%) | 0 (0.0%) |
| Total | 200 (100.0%) | 32 (100.0%) |
Household Vehicle Usage in Corbin City
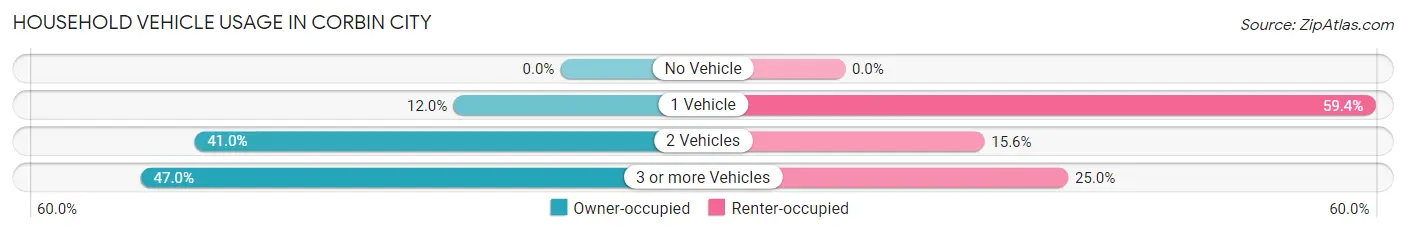
| Vehicles per Household | Owner-occupied | Renter-occupied |
| No Vehicle | 0 (0.0%) | 0 (0.0%) |
| 1 Vehicle | 24 (12.0%) | 19 (59.4%) |
| 2 Vehicles | 82 (41.0%) | 5 (15.6%) |
| 3 or more Vehicles | 94 (47.0%) | 8 (25.0%) |
| Total | 200 (100.0%) | 32 (100.0%) |
Real Estate & Mortgages in Corbin City
Real Estate and Mortgage Overview in Corbin City
| Characteristic | Without Mortgage | With Mortgage |
| Housing Units | 77 | 123 |
| Median Property Value | $185,600 | $232,000 |
| Median Household Income | $92,679 | $31 |
| Monthly Housing Costs | $763 | $6 |
| Real Estate Taxes | $4,219 | $0 |
Property Value by Mortgage Status in Corbin City
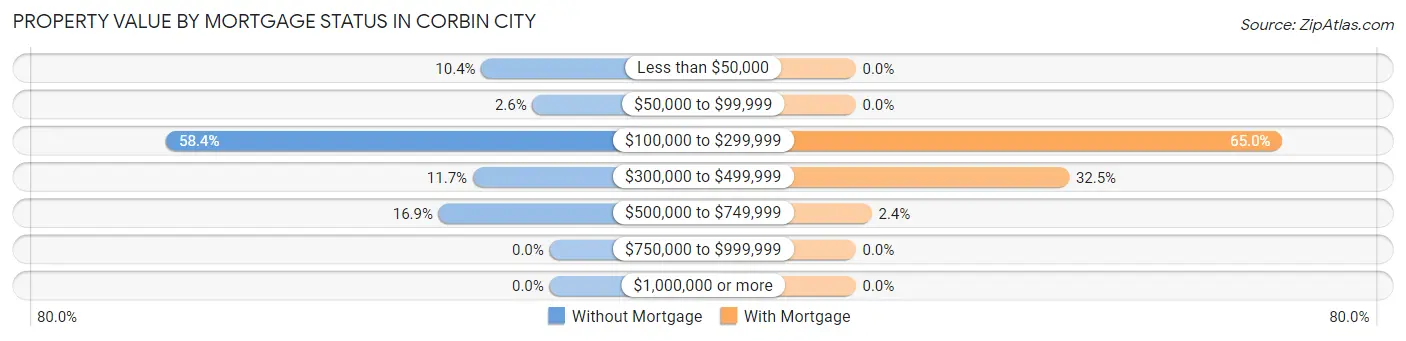
| Property Value | Without Mortgage | With Mortgage |
| Less than $50,000 | 8 (10.4%) | 0 (0.0%) |
| $50,000 to $99,999 | 2 (2.6%) | 0 (0.0%) |
| $100,000 to $299,999 | 45 (58.4%) | 80 (65.0%) |
| $300,000 to $499,999 | 9 (11.7%) | 40 (32.5%) |
| $500,000 to $749,999 | 13 (16.9%) | 3 (2.4%) |
| $750,000 to $999,999 | 0 (0.0%) | 0 (0.0%) |
| $1,000,000 or more | 0 (0.0%) | 0 (0.0%) |
| Total | 77 (100.0%) | 123 (100.0%) |
Household Income by Mortgage Status in Corbin City
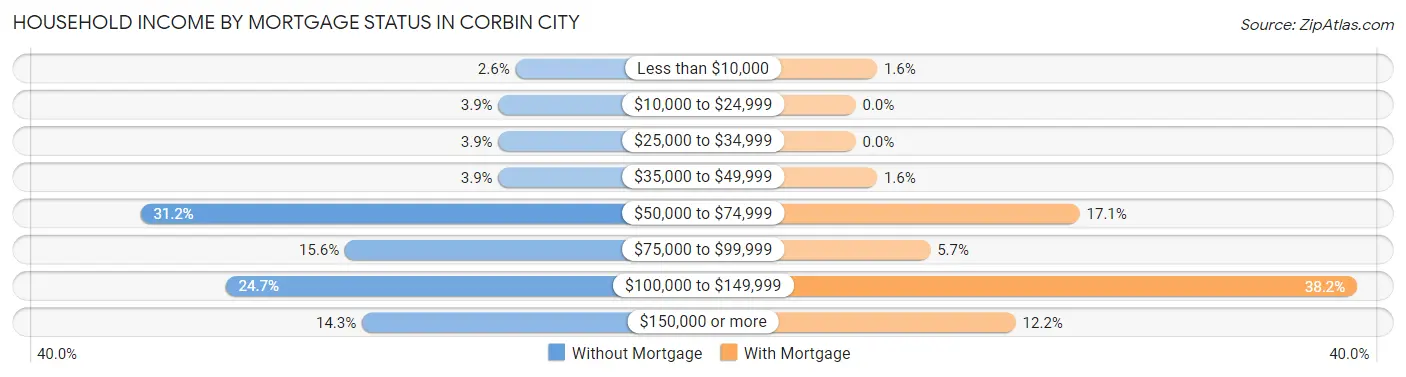
| Household Income | Without Mortgage | With Mortgage |
| Less than $10,000 | 2 (2.6%) | 2 (1.6%) |
| $10,000 to $24,999 | 3 (3.9%) | 0 (0.0%) |
| $25,000 to $34,999 | 3 (3.9%) | 0 (0.0%) |
| $35,000 to $49,999 | 3 (3.9%) | 2 (1.6%) |
| $50,000 to $74,999 | 24 (31.2%) | 21 (17.1%) |
| $75,000 to $99,999 | 12 (15.6%) | 7 (5.7%) |
| $100,000 to $149,999 | 19 (24.7%) | 47 (38.2%) |
| $150,000 or more | 11 (14.3%) | 15 (12.2%) |
| Total | 77 (100.0%) | 123 (100.0%) |
Property Value to Household Income Ratio in Corbin City
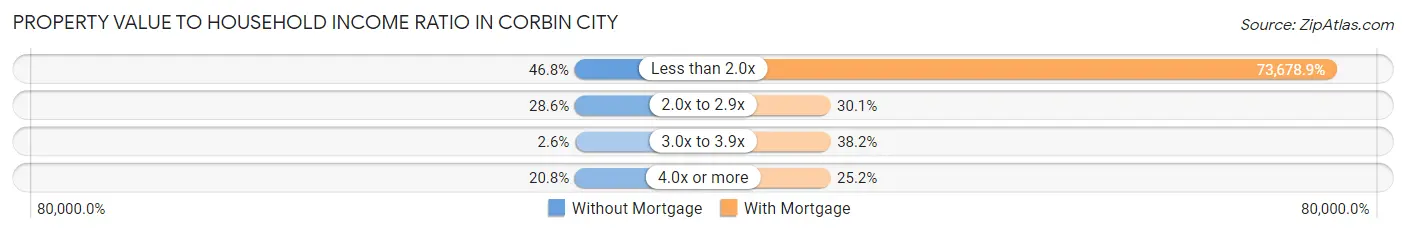
| Value-to-Income Ratio | Without Mortgage | With Mortgage |
| Less than 2.0x | 36 (46.8%) | 90,625 (73,678.9%) |
| 2.0x to 2.9x | 22 (28.6%) | 37 (30.1%) |
| 3.0x to 3.9x | 2 (2.6%) | 47 (38.2%) |
| 4.0x or more | 16 (20.8%) | 31 (25.2%) |
| Total | 77 (100.0%) | 123 (100.0%) |
Real Estate Taxes by Mortgage Status in Corbin City
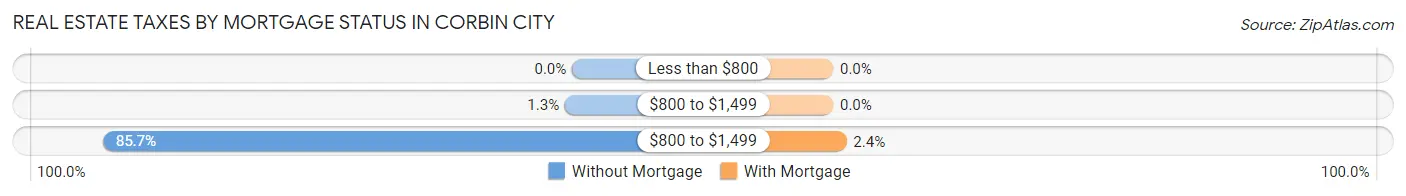
| Property Taxes | Without Mortgage | With Mortgage |
| Less than $800 | 0 (0.0%) | 0 (0.0%) |
| $800 to $1,499 | 1 (1.3%) | 0 (0.0%) |
| $800 to $1,499 | 66 (85.7%) | 3 (2.4%) |
| Total | 77 (100.0%) | 123 (100.0%) |
Health & Disability in Corbin City
Health Insurance Coverage by Age in Corbin City
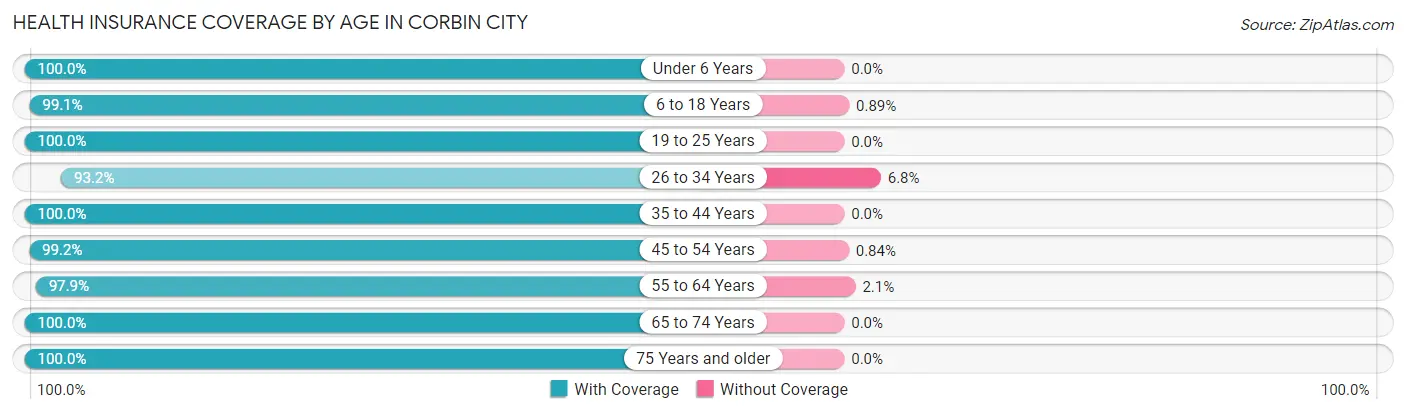
| Age Bracket | With Coverage | Without Coverage |
| Under 6 Years | 59 (100.0%) | 0 (0.0%) |
| 6 to 18 Years | 111 (99.1%) | 1 (0.9%) |
| 19 to 25 Years | 100 (100.0%) | 0 (0.0%) |
| 26 to 34 Years | 96 (93.2%) | 7 (6.8%) |
| 35 to 44 Years | 65 (100.0%) | 0 (0.0%) |
| 45 to 54 Years | 118 (99.2%) | 1 (0.8%) |
| 55 to 64 Years | 47 (97.9%) | 1 (2.1%) |
| 65 to 74 Years | 61 (100.0%) | 0 (0.0%) |
| 75 Years and older | 30 (100.0%) | 0 (0.0%) |
| Total | 687 (98.6%) | 10 (1.4%) |
Health Insurance Coverage by Citizenship Status in Corbin City
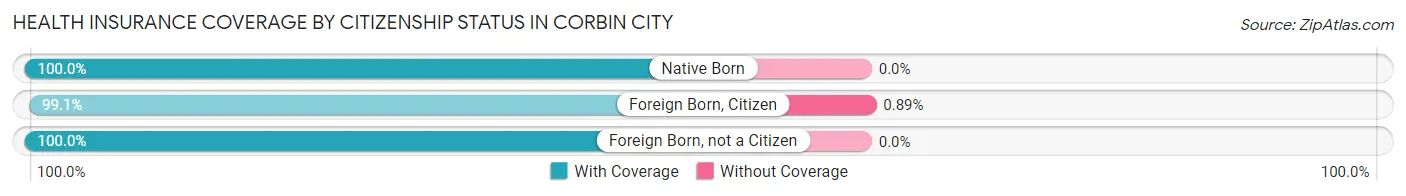
| Citizenship Status | With Coverage | Without Coverage |
| Native Born | 59 (100.0%) | 0 (0.0%) |
| Foreign Born, Citizen | 111 (99.1%) | 1 (0.9%) |
| Foreign Born, not a Citizen | 100 (100.0%) | 0 (0.0%) |
Health Insurance Coverage by Household Income in Corbin City
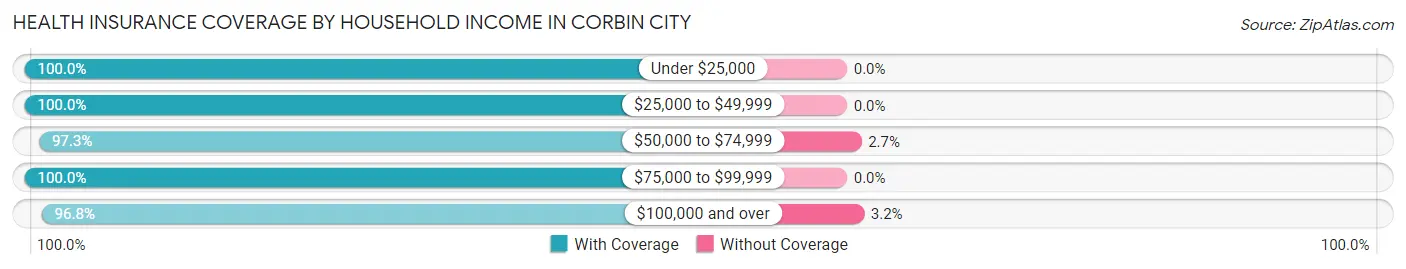
| Household Income | With Coverage | Without Coverage |
| Under $25,000 | 14 (100.0%) | 0 (0.0%) |
| $25,000 to $49,999 | 136 (100.0%) | 0 (0.0%) |
| $50,000 to $74,999 | 72 (97.3%) | 2 (2.7%) |
| $75,000 to $99,999 | 223 (100.0%) | 0 (0.0%) |
| $100,000 and over | 242 (96.8%) | 8 (3.2%) |
Public vs Private Health Insurance Coverage by Age in Corbin City
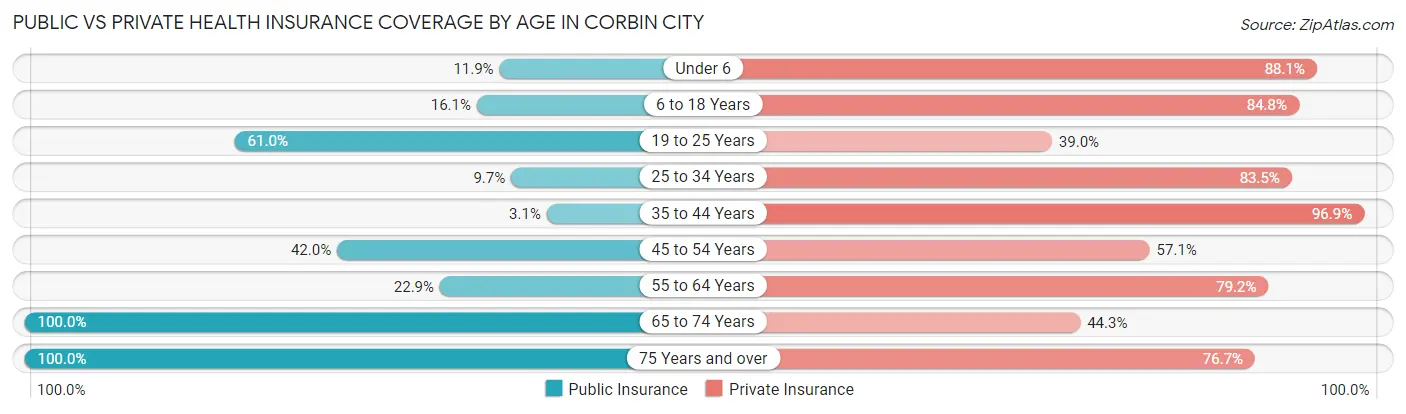
| Age Bracket | Public Insurance | Private Insurance |
| Under 6 | 7 (11.9%) | 52 (88.1%) |
| 6 to 18 Years | 18 (16.1%) | 95 (84.8%) |
| 19 to 25 Years | 61 (61.0%) | 39 (39.0%) |
| 25 to 34 Years | 10 (9.7%) | 86 (83.5%) |
| 35 to 44 Years | 2 (3.1%) | 63 (96.9%) |
| 45 to 54 Years | 50 (42.0%) | 68 (57.1%) |
| 55 to 64 Years | 11 (22.9%) | 38 (79.2%) |
| 65 to 74 Years | 61 (100.0%) | 27 (44.3%) |
| 75 Years and over | 30 (100.0%) | 23 (76.7%) |
| Total | 250 (35.9%) | 491 (70.4%) |
Disability Status by Sex by Age in Corbin City
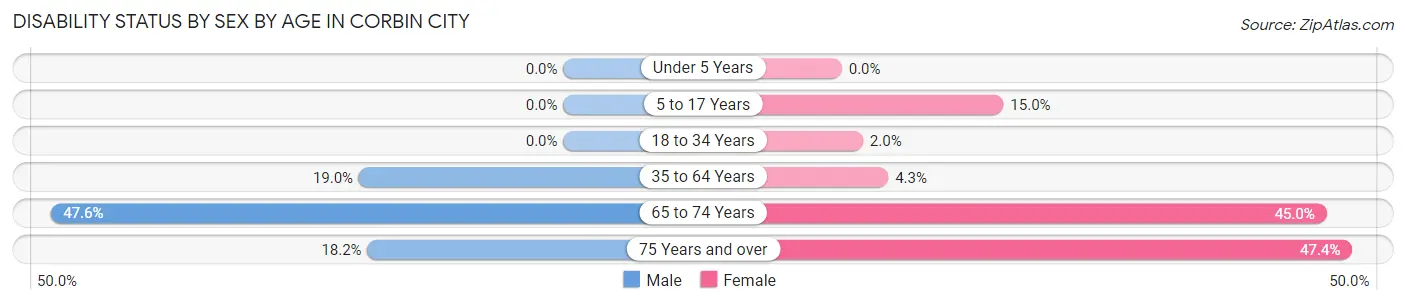
| Age Bracket | Male | Female |
| Under 5 Years | 0 (0.0%) | 0 (0.0%) |
| 5 to 17 Years | 0 (0.0%) | 9 (15.0%) |
| 18 to 34 Years | 0 (0.0%) | 2 (2.0%) |
| 35 to 64 Years | 22 (19.0%) | 5 (4.3%) |
| 65 to 74 Years | 10 (47.6%) | 18 (45.0%) |
| 75 Years and over | 2 (18.2%) | 9 (47.4%) |
Disability Class by Sex by Age in Corbin City
Disability Class: Hearing Difficulty
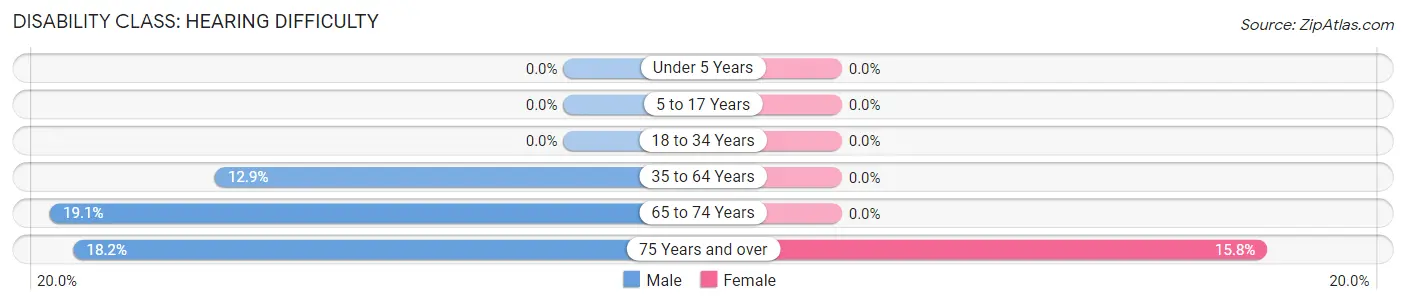
| Age Bracket | Male | Female |
| Under 5 Years | 0 (0.0%) | 0 (0.0%) |
| 5 to 17 Years | 0 (0.0%) | 0 (0.0%) |
| 18 to 34 Years | 0 (0.0%) | 0 (0.0%) |
| 35 to 64 Years | 15 (12.9%) | 0 (0.0%) |
| 65 to 74 Years | 4 (19.1%) | 0 (0.0%) |
| 75 Years and over | 2 (18.2%) | 3 (15.8%) |
Disability Class: Vision Difficulty
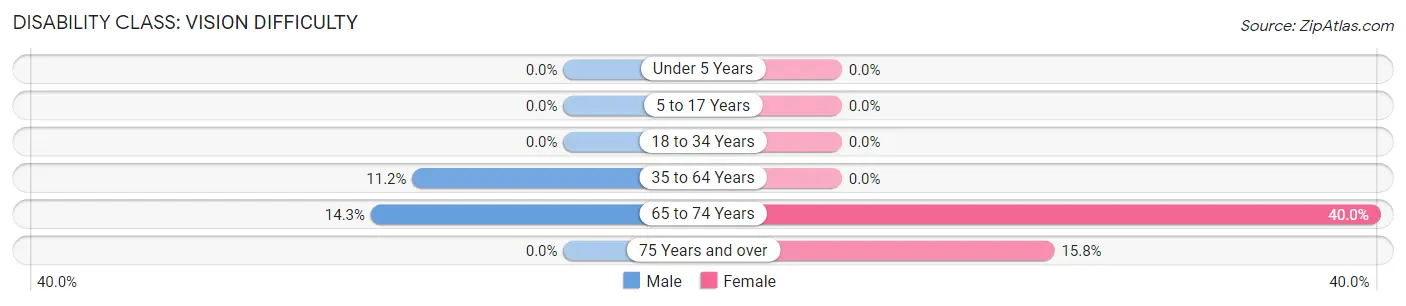
| Age Bracket | Male | Female |
| Under 5 Years | 0 (0.0%) | 0 (0.0%) |
| 5 to 17 Years | 0 (0.0%) | 0 (0.0%) |
| 18 to 34 Years | 0 (0.0%) | 0 (0.0%) |
| 35 to 64 Years | 13 (11.2%) | 0 (0.0%) |
| 65 to 74 Years | 3 (14.3%) | 16 (40.0%) |
| 75 Years and over | 0 (0.0%) | 3 (15.8%) |
Disability Class: Cognitive Difficulty
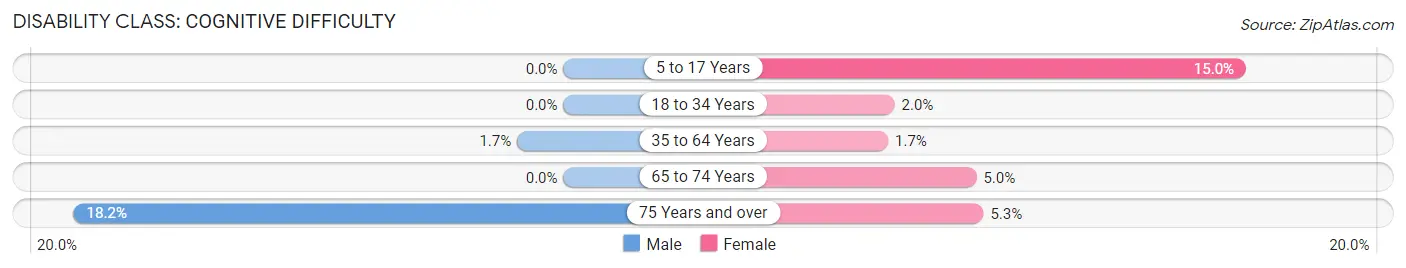
| Age Bracket | Male | Female |
| 5 to 17 Years | 0 (0.0%) | 9 (15.0%) |
| 18 to 34 Years | 0 (0.0%) | 2 (2.0%) |
| 35 to 64 Years | 2 (1.7%) | 2 (1.7%) |
| 65 to 74 Years | 0 (0.0%) | 2 (5.0%) |
| 75 Years and over | 2 (18.2%) | 1 (5.3%) |
Disability Class: Ambulatory Difficulty
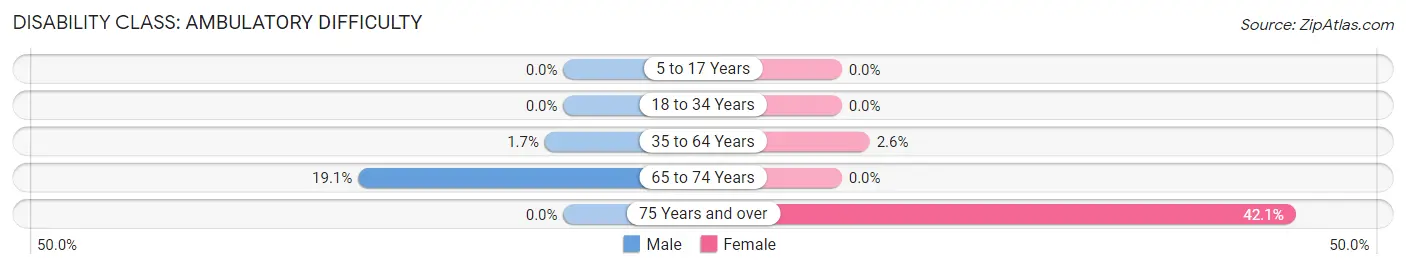
| Age Bracket | Male | Female |
| 5 to 17 Years | 0 (0.0%) | 0 (0.0%) |
| 18 to 34 Years | 0 (0.0%) | 0 (0.0%) |
| 35 to 64 Years | 2 (1.7%) | 3 (2.6%) |
| 65 to 74 Years | 4 (19.1%) | 0 (0.0%) |
| 75 Years and over | 0 (0.0%) | 8 (42.1%) |
Disability Class: Self-Care Difficulty
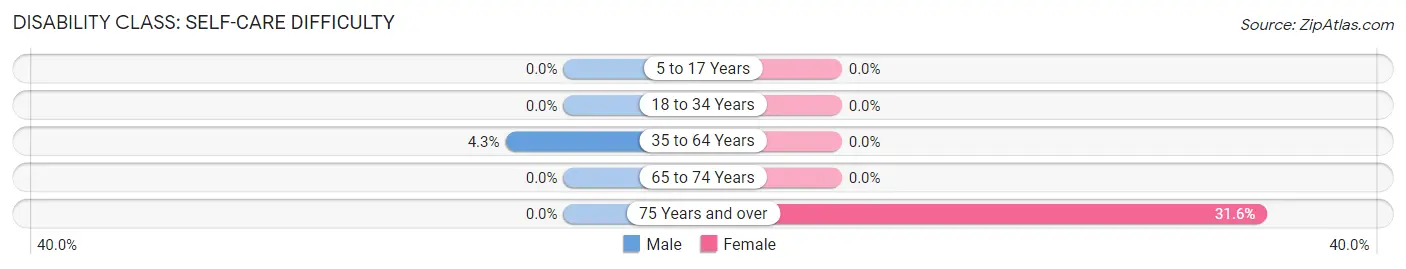
| Age Bracket | Male | Female |
| 5 to 17 Years | 0 (0.0%) | 0 (0.0%) |
| 18 to 34 Years | 0 (0.0%) | 0 (0.0%) |
| 35 to 64 Years | 5 (4.3%) | 0 (0.0%) |
| 65 to 74 Years | 0 (0.0%) | 0 (0.0%) |
| 75 Years and over | 0 (0.0%) | 6 (31.6%) |
Technology Access in Corbin City
Computing Device Access in Corbin City
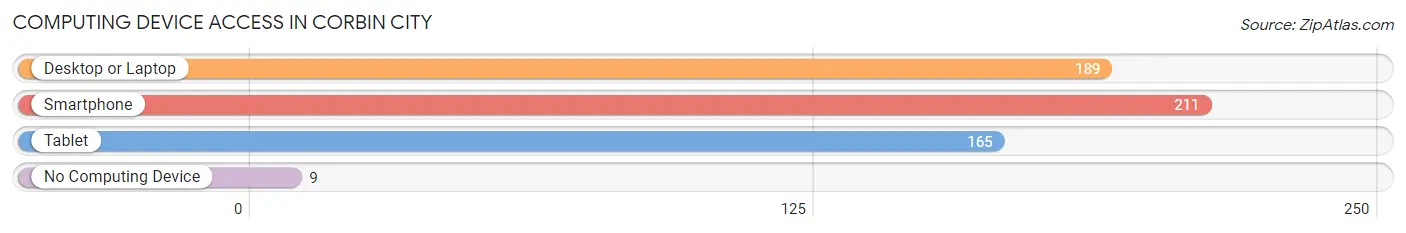
| Device Type | # Households | % Households |
| Desktop or Laptop | 189 | 81.5% |
| Smartphone | 211 | 90.9% |
| Tablet | 165 | 71.1% |
| No Computing Device | 9 | 3.9% |
| Total | 232 | 100.0% |
Internet Access in Corbin City
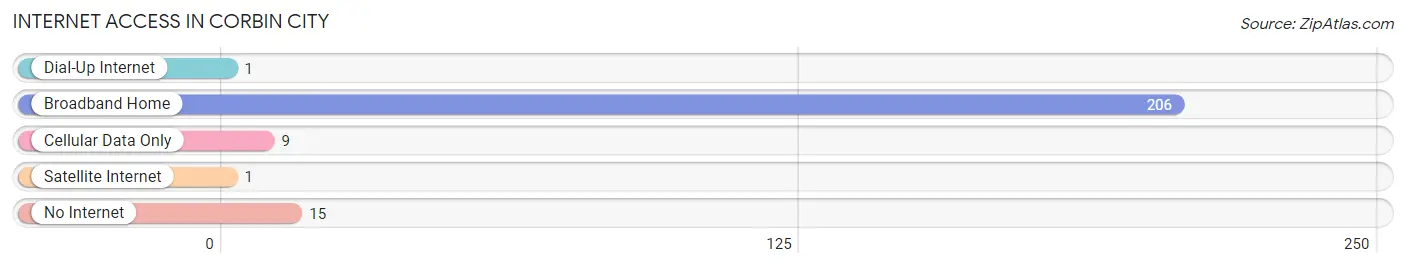
| Internet Type | # Households | % Households |
| Dial-Up Internet | 1 | 0.4% |
| Broadband Home | 206 | 88.8% |
| Cellular Data Only | 9 | 3.9% |
| Satellite Internet | 1 | 0.4% |
| No Internet | 15 | 6.5% |
| Total | 232 | 100.0% |
Corbin City Summary
Corbin City, NJ is a small city located in Atlantic County, New Jersey. It is situated on the Atlantic Ocean, just south of Atlantic City. The city has a population of approximately 2,500 people and covers an area of 1.2 square miles.
History
Corbin City was founded in 1891 by William Corbin, a local businessman. He purchased the land from the local Native American tribe, the Lenni Lenape, and named the city after himself. The city was incorporated in 1895 and quickly became a popular destination for vacationers. The city was known for its beautiful beaches and boardwalk, which attracted many visitors from the surrounding areas.
In the early 1900s, Corbin City experienced a period of rapid growth. The city was home to several large hotels, restaurants, and other businesses. The city also had a thriving fishing industry, which provided employment for many of the city’s residents.
In the 1950s, Corbin City began to decline. The city’s economy was hurt by the decline of the fishing industry and the rise of nearby Atlantic City. The city’s population began to decline as well, and by the 1970s, the city was in a state of decline.
In the 1980s, the city began to experience a resurgence. The city was revitalized by the construction of a new boardwalk and the opening of several new businesses. The city also began to attract new residents, and by the 1990s, the city’s population had grown to its current level.
Geography
Corbin City is located in Atlantic County, New Jersey. It is situated on the Atlantic Ocean, just south of Atlantic City. The city covers an area of 1.2 square miles and is bordered by the towns of Egg Harbor Township, Galloway Township, and Hamilton Township.
The city is located on a barrier island, which is separated from the mainland by a series of marshes and wetlands. The city is home to several beaches, including Corbin Beach, which is the city’s main beach. The city also has several parks, including Corbin Park, which is located on the city’s boardwalk.
Economy
The economy of Corbin City is largely based on tourism. The city is home to several hotels, restaurants, and other businesses that cater to tourists. The city also has a thriving fishing industry, which provides employment for many of the city’s residents.
The city is also home to several manufacturing companies, including a paper mill and a plastics factory. The city also has several retail stores, including a grocery store and a hardware store.
Demographics
As of the 2010 census, the population of Corbin City was 2,500. The city has a diverse population, with a majority of the population being white (77.2%), followed by African American (14.2%), Hispanic (4.2%), and Asian (2.4%). The median household income in the city is $45,000, and the median age is 42.
Conclusion
Corbin City, NJ is a small city located in Atlantic County, New Jersey. It is situated on the Atlantic Ocean, just south of Atlantic City. The city has a population of approximately 2,500 people and covers an area of 1.2 square miles. The city was founded in 1891 and has experienced periods of growth and decline throughout its history. The city’s economy is largely based on tourism, and the city is home to several hotels, restaurants, and other businesses. The city also has a diverse population, with a majority of the population being white.
Common Questions
What is the Total Population of Corbin City?
Total Population of Corbin City is 697.
What is the Total Male Population of Corbin City?
Total Male Population of Corbin City is 335.
What is the Total Female Population of Corbin City?
Total Female Population of Corbin City is 362.
What is the Ratio of Males per 100 Females in Corbin City?
There are 92.54 Males per 100 Females in Corbin City.
What is the Ratio of Females per 100 Males in Corbin City?
There are 108.06 Females per 100 Males in Corbin City.
What is the Median Population Age in Corbin City?
Median Population Age in Corbin City is 33.5 Years.
What is the Average Family Size in Corbin City
Average Family Size in Corbin City is 3.3 People.
What is the Average Household Size in Corbin City
Average Household Size in Corbin City is 3.0 People.
What is Per Capita Income in Corbin City?
Per Capita income in Corbin City is $32,650.
What is the Median Family Income in Corbin City?
Median Family Income in Corbin City is $86,875.
What is the Median Household income in Corbin City?
Median Household Income in Corbin City is $84,500.
What is Income or Wage Gap in Corbin City?
Income or Wage Gap in Corbin City is 38.3%.
Women in Corbin City earn 61.7 cents for every dollar earned by a man.
What is Inequality or Gini Index in Corbin City?
Inequality or Gini Index in Corbin City is 0.35.
How Large is the Labor Force in Corbin City?
There are 359 People in the Labor Forcein in Corbin City.
What is the Percentage of People in the Labor Force in Corbin City?
65.3% of People are in the Labor Force in Corbin City.
What is the Unemployment Rate in Corbin City?
Unemployment Rate in Corbin City is 7.8%.