Merchantville borough, NJ
Merchantville borough Overview
3,800
TOTAL POPULATION
1,930
MALE POPULATION
1,870
FEMALE POPULATION
103.21
MALES / 100 FEMALES
96.89
FEMALES / 100 MALES
36.7
MEDIAN AGE
3.2
AVG FAMILY SIZE
2.6
AVG HOUSEHOLD SIZE
$41,244
PER CAPITA INCOME
$122,083
AVG FAMILY INCOME
$72,375
AVG HOUSEHOLD INCOME
1.7%
WAGE / INCOME GAP [ % ]
98.3¢/ $1
WAGE / INCOME GAP [ $ ]
0.46
INEQUALITY / GINI INDEX
2,144
LABOR FORCE [ PEOPLE ]
69.6%
PERCENT IN LABOR FORCE
2.5%
UNEMPLOYMENT RATE
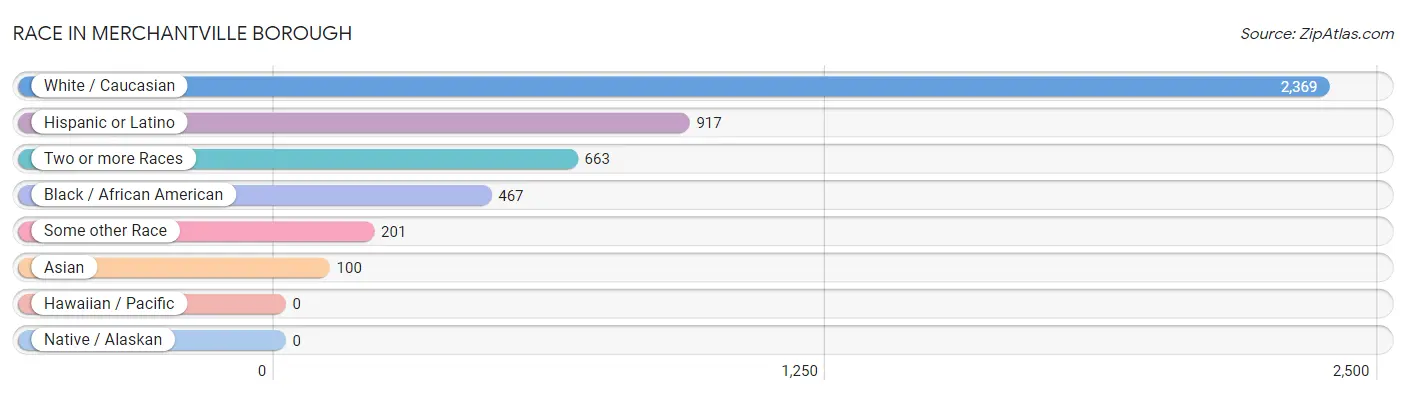
Race in Merchantville borough
The most populous races in Merchantville borough are White / Caucasian (2,369 | 62.3%), Hispanic or Latino (917 | 24.1%), and Two or more Races (663 | 17.4%).
| Race | # Population | % Population |
| Asian | 100 | 2.6% |
| Black / African American | 467 | 12.3% |
| Hawaiian / Pacific | 0 | 0.0% |
| Hispanic or Latino | 917 | 24.1% |
| Native / Alaskan | 0 | 0.0% |
| White / Caucasian | 2,369 | 62.3% |
| Two or more Races | 663 | 17.4% |
| Some other Race | 201 | 5.3% |
| Total | 3,800 | 100.0% |
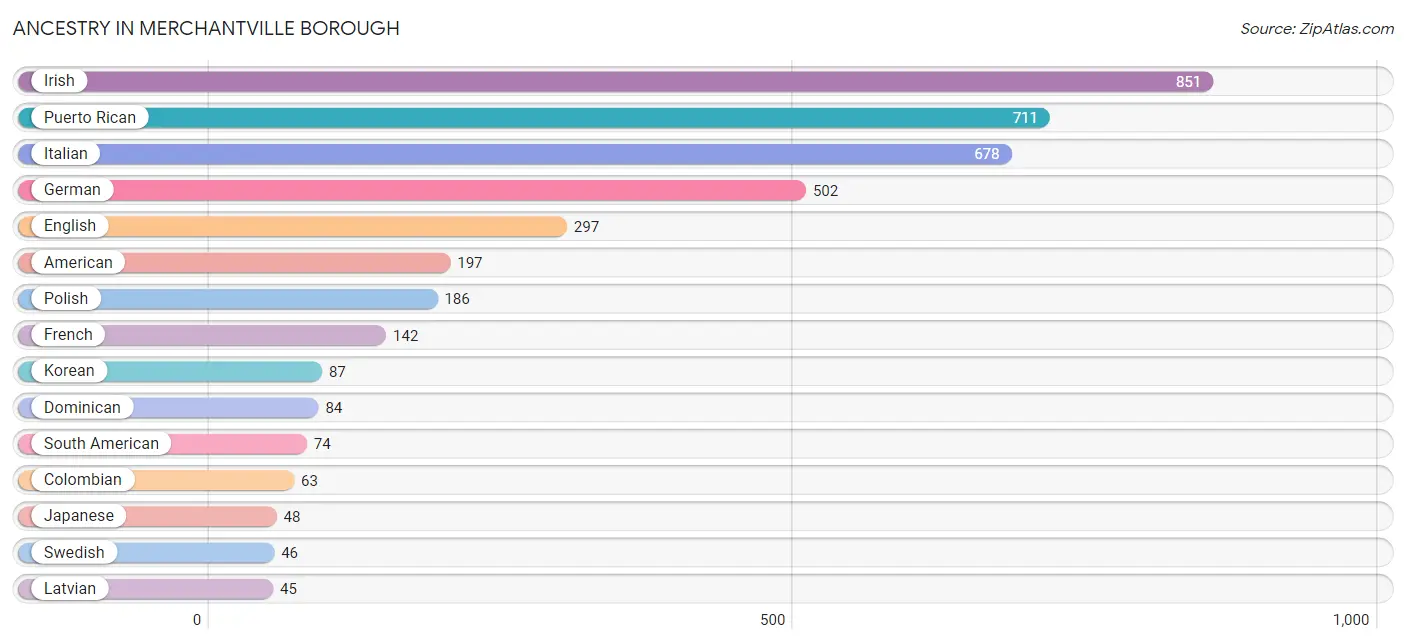
Ancestry in Merchantville borough
The most populous ancestries reported in Merchantville borough are Irish (851 | 22.4%), Puerto Rican (711 | 18.7%), Italian (678 | 17.8%), German (502 | 13.2%), and English (297 | 7.8%), together accounting for 80.0% of all Merchantville borough residents.
| Ancestry | # Population | % Population |
| African | 11 | 0.3% |
| American | 197 | 5.2% |
| Austrian | 15 | 0.4% |
| British | 16 | 0.4% |
| Central American | 34 | 0.9% |
| Colombian | 63 | 1.7% |
| Czechoslovakian | 14 | 0.4% |
| Dominican | 84 | 2.2% |
| Eastern European | 9 | 0.2% |
| Ecuadorian | 11 | 0.3% |
| English | 297 | 7.8% |
| European | 22 | 0.6% |
| French | 142 | 3.7% |
| French Canadian | 32 | 0.8% |
| German | 502 | 13.2% |
| Greek | 36 | 0.9% |
| Guatemalan | 34 | 0.9% |
| Hungarian | 38 | 1.0% |
| Indian (Asian) | 6 | 0.2% |
| Irish | 851 | 22.4% |
| Italian | 678 | 17.8% |
| Japanese | 48 | 1.3% |
| Korean | 87 | 2.3% |
| Latvian | 45 | 1.2% |
| Liberian | 3 | 0.1% |
| Lithuanian | 12 | 0.3% |
| Maltese | 1 | 0.0% |
| Native Hawaiian | 7 | 0.2% |
| Northern European | 11 | 0.3% |
| Norwegian | 6 | 0.2% |
| Pennsylvania German | 18 | 0.5% |
| Polish | 186 | 4.9% |
| Puerto Rican | 711 | 18.7% |
| Russian | 8 | 0.2% |
| Scotch-Irish | 14 | 0.4% |
| Scottish | 37 | 1.0% |
| South American | 74 | 1.9% |
| Spanish | 14 | 0.4% |
| Subsaharan African | 14 | 0.4% |
| Swedish | 46 | 1.2% |
| Swiss | 8 | 0.2% |
| Thai | 4 | 0.1% |
| Vietnamese | 32 | 0.8% | View All 43 Rows |
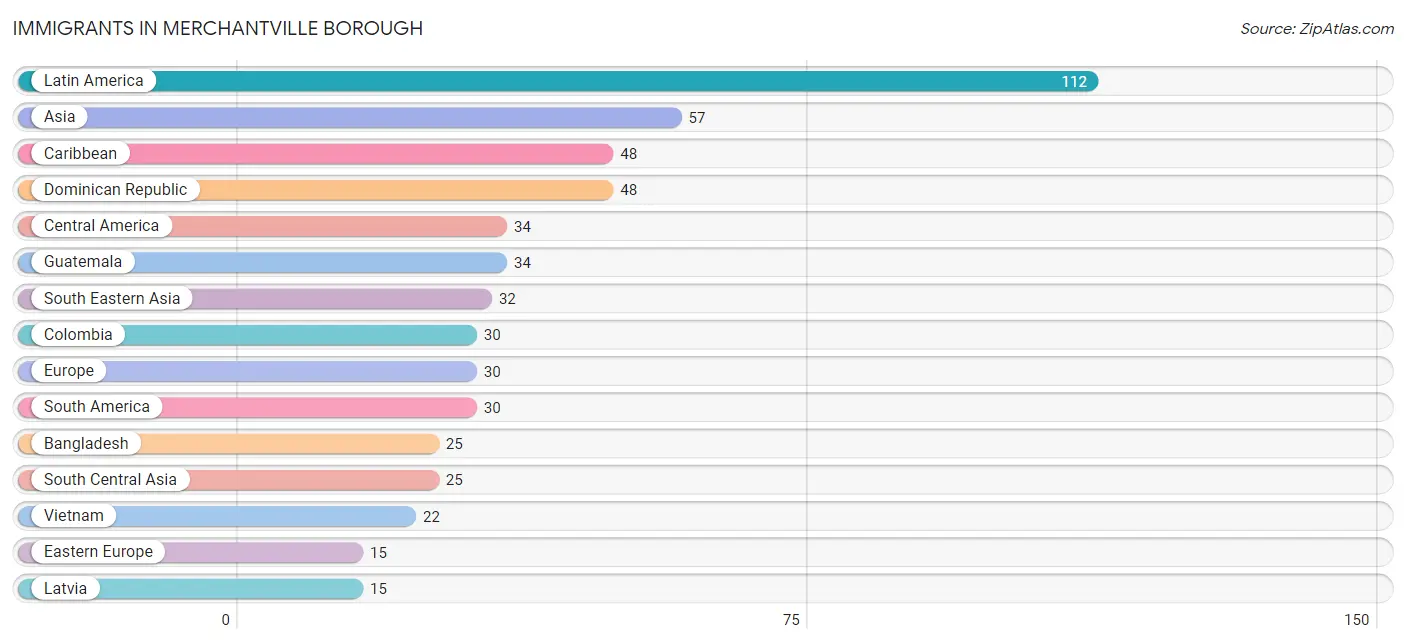
Immigrants in Merchantville borough
The most numerous immigrant groups reported in Merchantville borough came from Latin America (112 | 2.9%), Asia (57 | 1.5%), Caribbean (48 | 1.3%), Dominican Republic (48 | 1.3%), and Central America (34 | 0.9%), together accounting for 7.9% of all Merchantville borough residents.
| Immigration Origin | # Population | % Population |
| Africa | 3 | 0.1% |
| Asia | 57 | 1.5% |
| Bangladesh | 25 | 0.7% |
| Caribbean | 48 | 1.3% |
| Central America | 34 | 0.9% |
| Colombia | 30 | 0.8% |
| Dominican Republic | 48 | 1.3% |
| Eastern Europe | 15 | 0.4% |
| Europe | 30 | 0.8% |
| Guatemala | 34 | 0.9% |
| Italy | 7 | 0.2% |
| Latin America | 112 | 2.9% |
| Latvia | 15 | 0.4% |
| Liberia | 3 | 0.1% |
| Northern Europe | 7 | 0.2% |
| Philippines | 10 | 0.3% |
| South America | 30 | 0.8% |
| South Central Asia | 25 | 0.7% |
| South Eastern Asia | 32 | 0.8% |
| Southern Europe | 8 | 0.2% |
| Vietnam | 22 | 0.6% |
| Western Africa | 3 | 0.1% | View All 22 Rows |
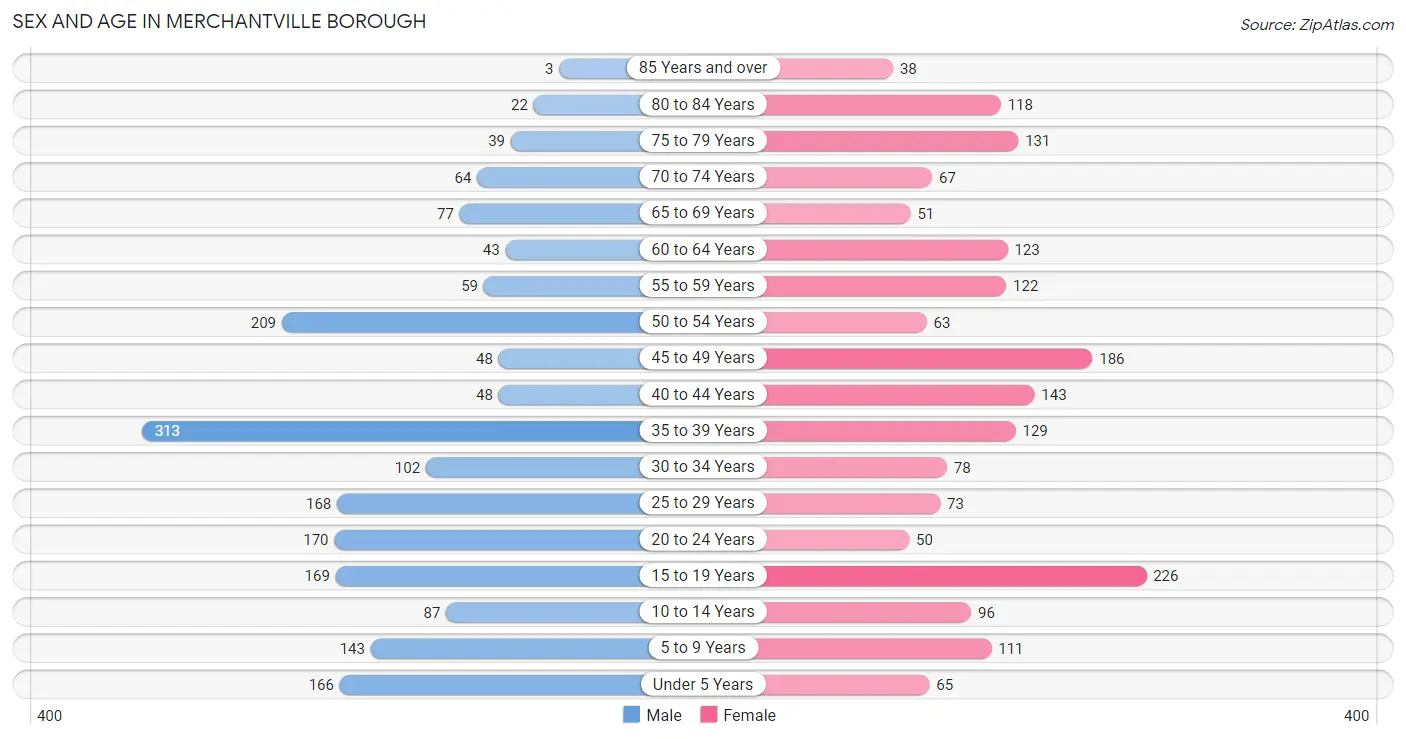
Sex and Age in Merchantville borough
Sex and Age in Merchantville borough
The most populous age groups in Merchantville borough are 35 to 39 Years (313 | 16.2%) for men and 15 to 19 Years (226 | 12.1%) for women.
| Age Bracket | Male | Female |
| Under 5 Years | 166 (8.6%) | 65 (3.5%) |
| 5 to 9 Years | 143 (7.4%) | 111 (5.9%) |
| 10 to 14 Years | 87 (4.5%) | 96 (5.1%) |
| 15 to 19 Years | 169 (8.8%) | 226 (12.1%) |
| 20 to 24 Years | 170 (8.8%) | 50 (2.7%) |
| 25 to 29 Years | 168 (8.7%) | 73 (3.9%) |
| 30 to 34 Years | 102 (5.3%) | 78 (4.2%) |
| 35 to 39 Years | 313 (16.2%) | 129 (6.9%) |
| 40 to 44 Years | 48 (2.5%) | 143 (7.6%) |
| 45 to 49 Years | 48 (2.5%) | 186 (10.0%) |
| 50 to 54 Years | 209 (10.8%) | 63 (3.4%) |
| 55 to 59 Years | 59 (3.1%) | 122 (6.5%) |
| 60 to 64 Years | 43 (2.2%) | 123 (6.6%) |
| 65 to 69 Years | 77 (4.0%) | 51 (2.7%) |
| 70 to 74 Years | 64 (3.3%) | 67 (3.6%) |
| 75 to 79 Years | 39 (2.0%) | 131 (7.0%) |
| 80 to 84 Years | 22 (1.1%) | 118 (6.3%) |
| 85 Years and over | 3 (0.2%) | 38 (2.0%) |
| Total | 1,930 (100.0%) | 1,870 (100.0%) |
Families and Households in Merchantville borough
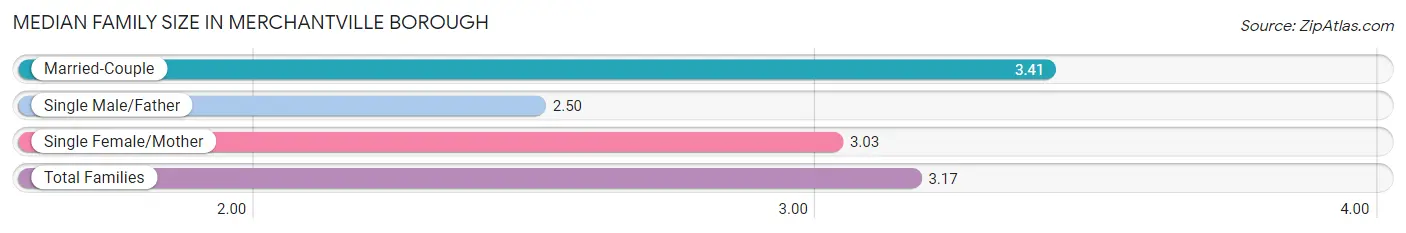
Median Family Size in Merchantville borough
The median family size in Merchantville borough is 3.17 persons per family, with married-couple families (482 | 53.5%) accounting for the largest median family size of 3.41 persons per family. On the other hand, single male/father families (113 | 12.5%) represent the smallest median family size with 2.50 persons per family.
| Family Type | # Families | Family Size |
| Married-Couple | 482 (53.5%) | 3.41 |
| Single Male/Father | 113 (12.5%) | 2.50 |
| Single Female/Mother | 306 (34.0%) | 3.03 |
| Total Families | 901 (100.0%) | 3.17 |
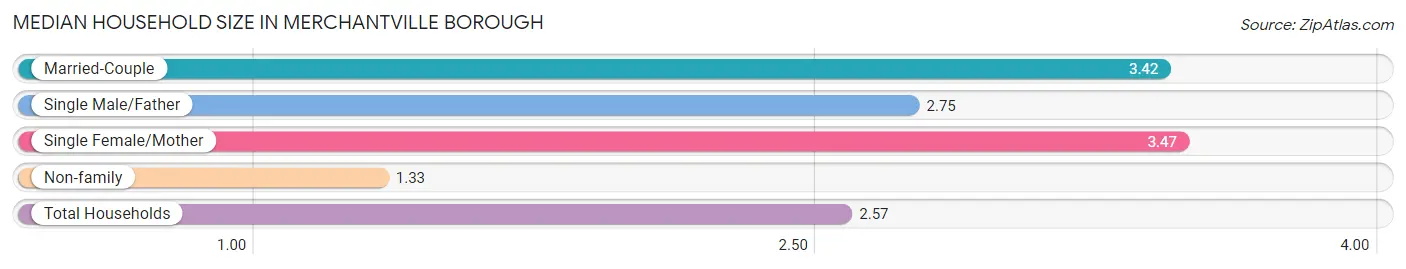
Median Household Size in Merchantville borough
The median household size in Merchantville borough is 2.57 persons per household, with single female/mother households (306 | 20.8%) accounting for the largest median household size of 3.47 persons per household. non-family households (572 | 38.8%) represent the smallest median household size with 1.33 persons per household.
| Household Type | # Households | Household Size |
| Married-Couple | 482 (32.7%) | 3.42 |
| Single Male/Father | 113 (7.7%) | 2.75 |
| Single Female/Mother | 306 (20.8%) | 3.47 |
| Non-family | 572 (38.8%) | 1.33 |
| Total Households | 1,473 (100.0%) | 2.57 |
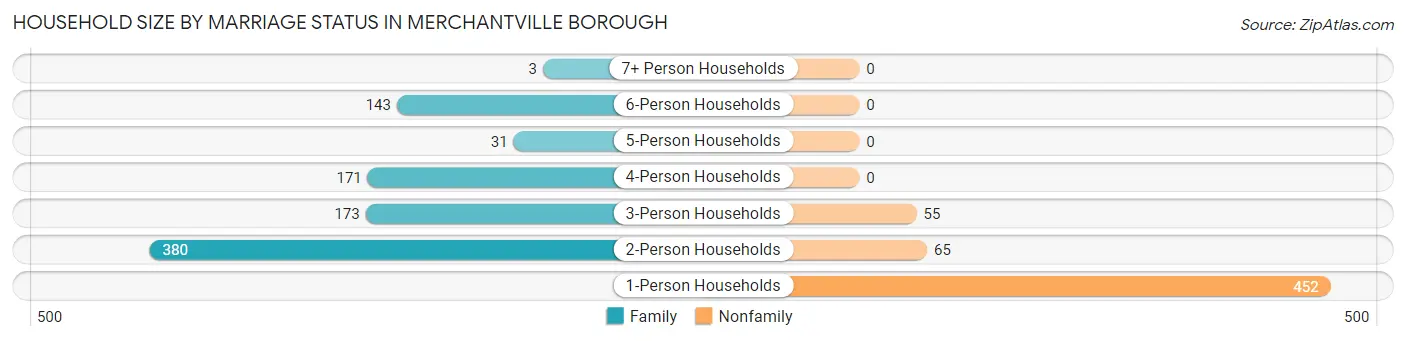
Household Size by Marriage Status in Merchantville borough
Out of a total of 1,473 households in Merchantville borough, 901 (61.2%) are family households, while 572 (38.8%) are nonfamily households. The most numerous type of family households are 2-person households, comprising 380, and the most common type of nonfamily households are 1-person households, comprising 452.
| Household Size | Family Households | Nonfamily Households |
| 1-Person Households | - | 452 (30.7%) |
| 2-Person Households | 380 (25.8%) | 65 (4.4%) |
| 3-Person Households | 173 (11.7%) | 55 (3.7%) |
| 4-Person Households | 171 (11.6%) | 0 (0.0%) |
| 5-Person Households | 31 (2.1%) | 0 (0.0%) |
| 6-Person Households | 143 (9.7%) | 0 (0.0%) |
| 7+ Person Households | 3 (0.2%) | 0 (0.0%) |
| Total | 901 (61.2%) | 572 (38.8%) |
Female Fertility in Merchantville borough
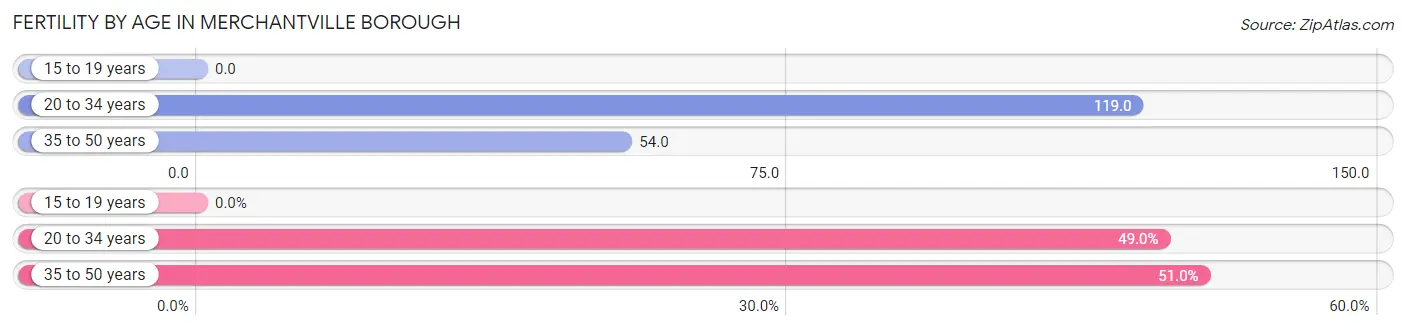
Fertility by Age in Merchantville borough
Average fertility rate in Merchantville borough is 55.0 births per 1,000 women. Women in the age bracket of 20 to 34 years have the highest fertility rate with 119.0 births per 1,000 women. Women in the age bracket of 35 to 50 years acount for 51.0% of all women with births.
| Age Bracket | Women with Births | Births / 1,000 Women |
| 15 to 19 years | 0 (0.0%) | 0.0 |
| 20 to 34 years | 24 (49.0%) | 119.0 |
| 35 to 50 years | 25 (51.0%) | 54.0 |
| Total | 49 (100.0%) | 55.0 |
Fertility by Age by Marriage Status in Merchantville borough
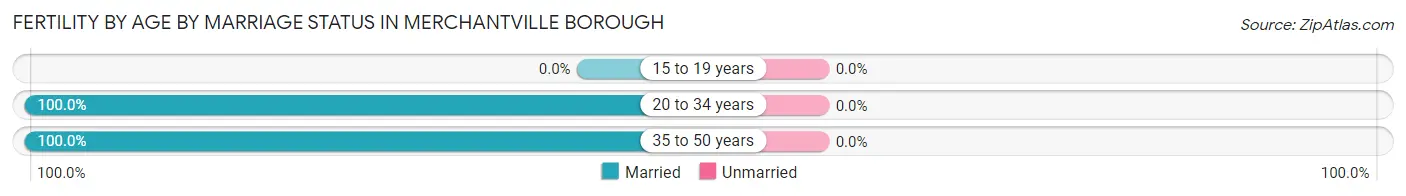
| Age Bracket | Married | Unmarried |
| 15 to 19 years | 0 (0.0%) | 0 (0.0%) |
| 20 to 34 years | 24 (100.0%) | 0 (0.0%) |
| 35 to 50 years | 25 (100.0%) | 0 (0.0%) |
| Total | 49 (100.0%) | 0 (0.0%) |
Fertility by Education in Merchantville borough
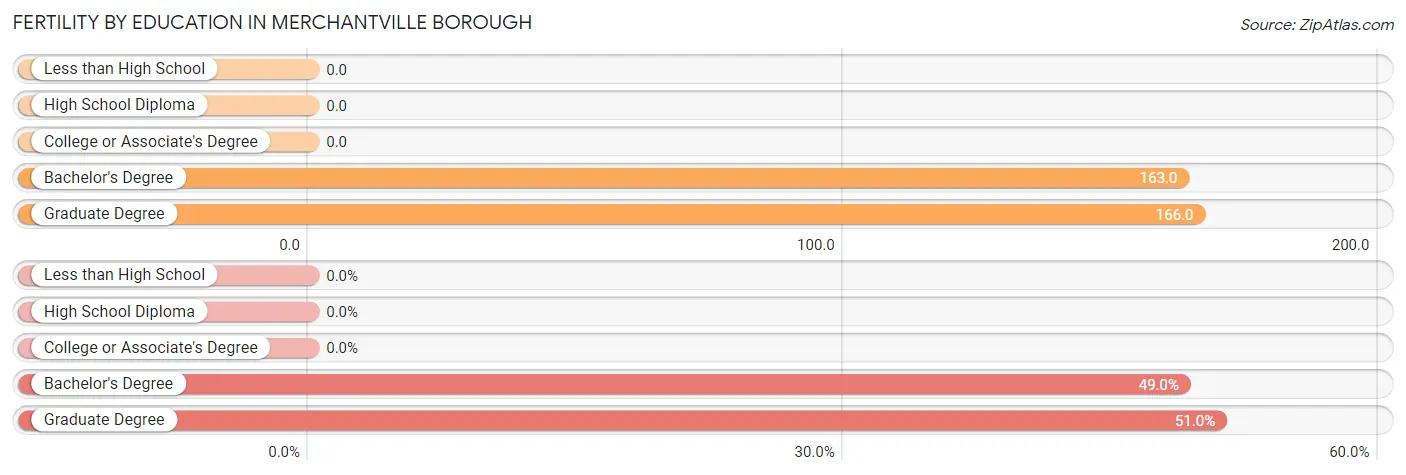
| Educational Attainment | Women with Births | Births / 1,000 Women |
| Less than High School | 0 (0.0%) | 0.0 |
| High School Diploma | 0 (0.0%) | 0.0 |
| College or Associate's Degree | 0 (0.0%) | 0.0 |
| Bachelor's Degree | 24 (49.0%) | 163.0 |
| Graduate Degree | 25 (51.0%) | 166.0 |
| Total | 49 (100.0%) | 55.0 |
Fertility by Education by Marriage Status in Merchantville borough
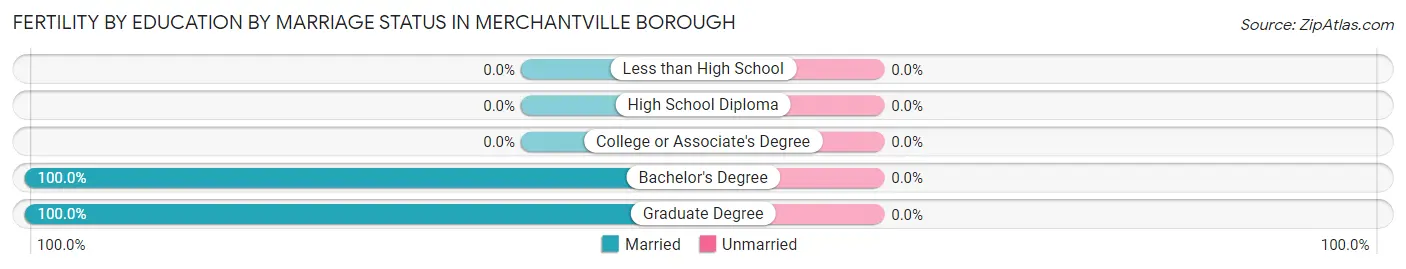
| Educational Attainment | Married | Unmarried |
| Less than High School | 0 (0.0%) | 0 (0.0%) |
| High School Diploma | 0 (0.0%) | 0 (0.0%) |
| College or Associate's Degree | 0 (0.0%) | 0 (0.0%) |
| Bachelor's Degree | 24 (100.0%) | 0 (0.0%) |
| Graduate Degree | 25 (100.0%) | 0 (0.0%) |
| Total | 49 (100.0%) | 0 (0.0%) |
Income in Merchantville borough
Income Overview in Merchantville borough
Per Capita Income in Merchantville borough is $41,244, while median incomes of families and households are $122,083 and $72,375 respectively.
| Characteristic | Number | Measure |
| Per Capita Income | 3,800 | $41,244 |
| Median Family Income | 901 | $122,083 |
| Mean Family Income | 901 | $129,330 |
| Median Household Income | 1,473 | $72,375 |
| Mean Household Income | 1,473 | $105,257 |
| Income Deficit | 901 | $0 |
| Wage / Income Gap (%) | 3,800 | 1.71% |
| Wage / Income Gap ($) | 3,800 | 98.29¢ per $1 |
| Gini / Inequality Index | 3,800 | 0.46 |
Earnings by Sex in Merchantville borough
Average Earnings in Merchantville borough are $46,472, $46,134 for men and $46,939 for women, a difference of 1.7%.
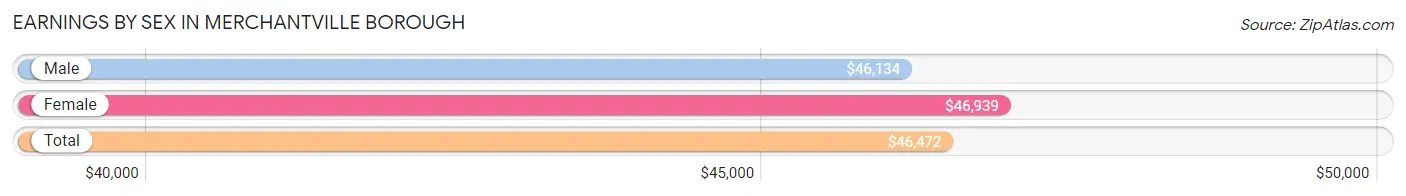
| Sex | Number | Average Earnings |
| Male | 1,160 (53.9%) | $46,134 |
| Female | 993 (46.1%) | $46,939 |
| Total | 2,153 (100.0%) | $46,472 |
Earnings by Sex by Income Bracket in Merchantville borough
The most common earnings brackets in Merchantville borough are $100,000+ for men (221 | 19.1%) and $20,000 to $22,499 for women (144 | 14.5%).
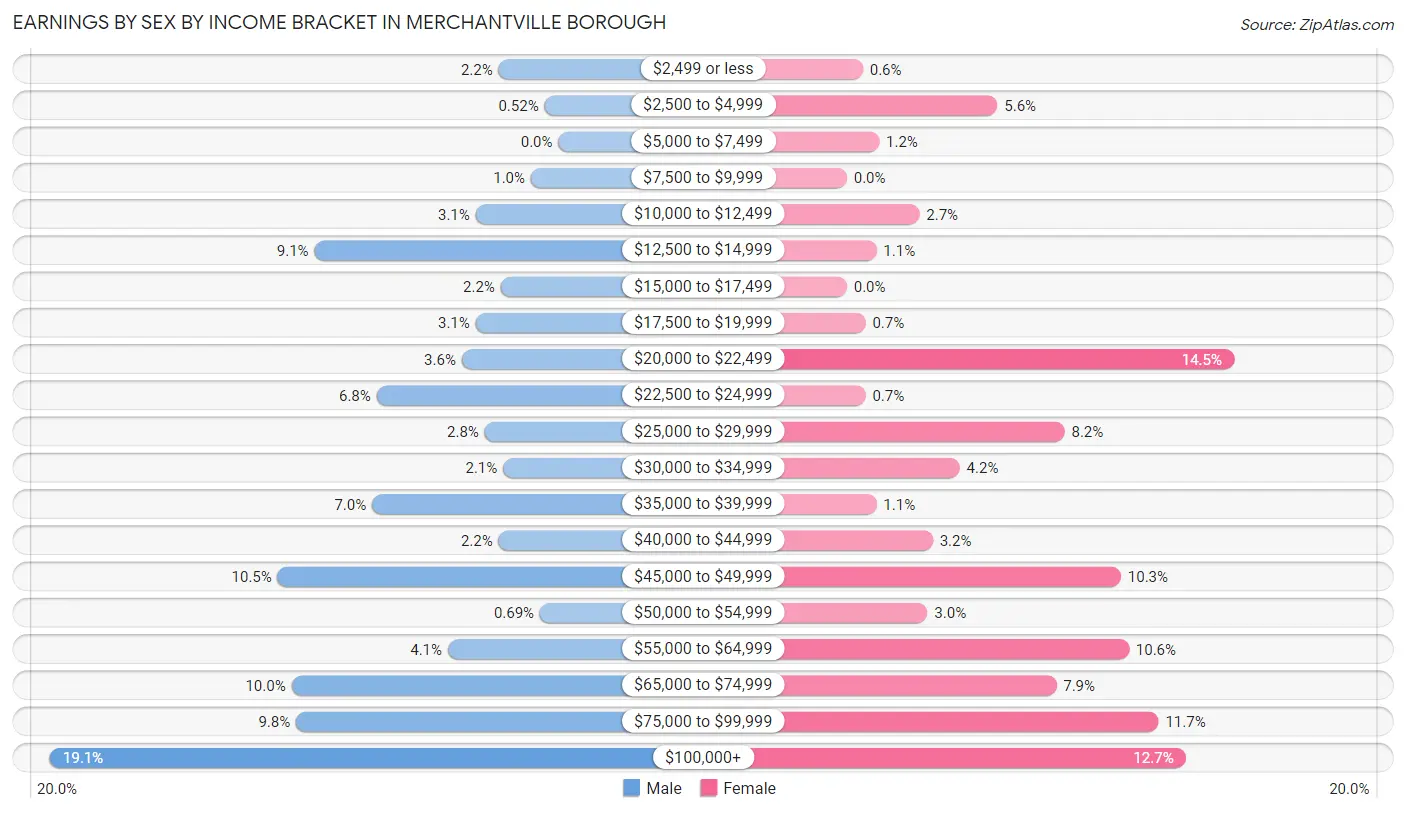
| Income | Male | Female |
| $2,499 or less | 26 (2.2%) | 6 (0.6%) |
| $2,500 to $4,999 | 6 (0.5%) | 56 (5.6%) |
| $5,000 to $7,499 | 0 (0.0%) | 12 (1.2%) |
| $7,500 to $9,999 | 12 (1.0%) | 0 (0.0%) |
| $10,000 to $12,499 | 36 (3.1%) | 27 (2.7%) |
| $12,500 to $14,999 | 106 (9.1%) | 11 (1.1%) |
| $15,000 to $17,499 | 25 (2.2%) | 0 (0.0%) |
| $17,500 to $19,999 | 36 (3.1%) | 7 (0.7%) |
| $20,000 to $22,499 | 42 (3.6%) | 144 (14.5%) |
| $22,500 to $24,999 | 79 (6.8%) | 7 (0.7%) |
| $25,000 to $29,999 | 32 (2.8%) | 81 (8.2%) |
| $30,000 to $34,999 | 24 (2.1%) | 42 (4.2%) |
| $35,000 to $39,999 | 81 (7.0%) | 11 (1.1%) |
| $40,000 to $44,999 | 26 (2.2%) | 32 (3.2%) |
| $45,000 to $49,999 | 122 (10.5%) | 102 (10.3%) |
| $50,000 to $54,999 | 8 (0.7%) | 30 (3.0%) |
| $55,000 to $64,999 | 48 (4.1%) | 105 (10.6%) |
| $65,000 to $74,999 | 116 (10.0%) | 78 (7.9%) |
| $75,000 to $99,999 | 114 (9.8%) | 116 (11.7%) |
| $100,000+ | 221 (19.1%) | 126 (12.7%) |
| Total | 1,160 (100.0%) | 993 (100.0%) |
Earnings by Sex by Educational Attainment in Merchantville borough
Average earnings in Merchantville borough are $51,250 for men and $51,250 for women, a difference of 0.0%. Men with an educational attainment of graduate degree enjoy the highest average annual earnings of $110,455, while those with high school diploma education earn the least with $36,977. Women with an educational attainment of bachelor's degree earn the most with the average annual earnings of $96,406, while those with high school diploma education have the smallest earnings of $28,827.
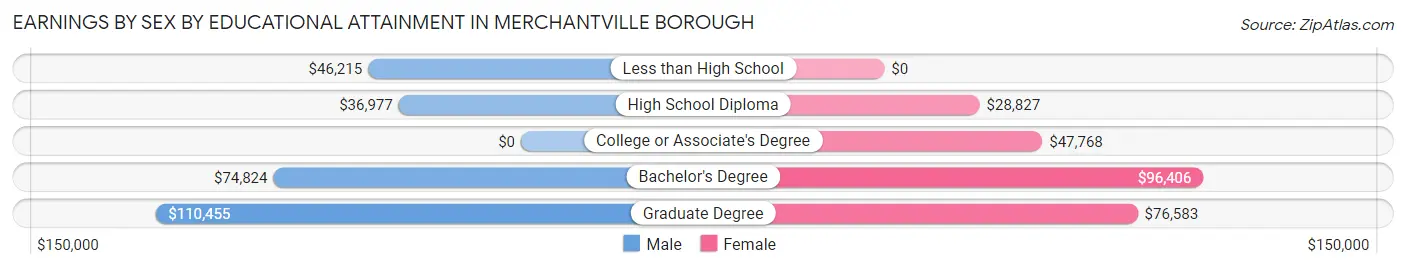
| Educational Attainment | Male Income | Female Income |
| Less than High School | $46,215 | $0 |
| High School Diploma | $36,977 | $28,827 |
| College or Associate's Degree | - | - |
| Bachelor's Degree | $74,824 | $96,406 |
| Graduate Degree | $110,455 | $76,583 |
| Total | $51,250 | $51,250 |
Family Income in Merchantville borough
Family Income Brackets in Merchantville borough
According to the Merchantville borough family income data, there are 215 families falling into the $100,000 to $149,999 income range, which is the most common income bracket and makes up 23.9% of all families.
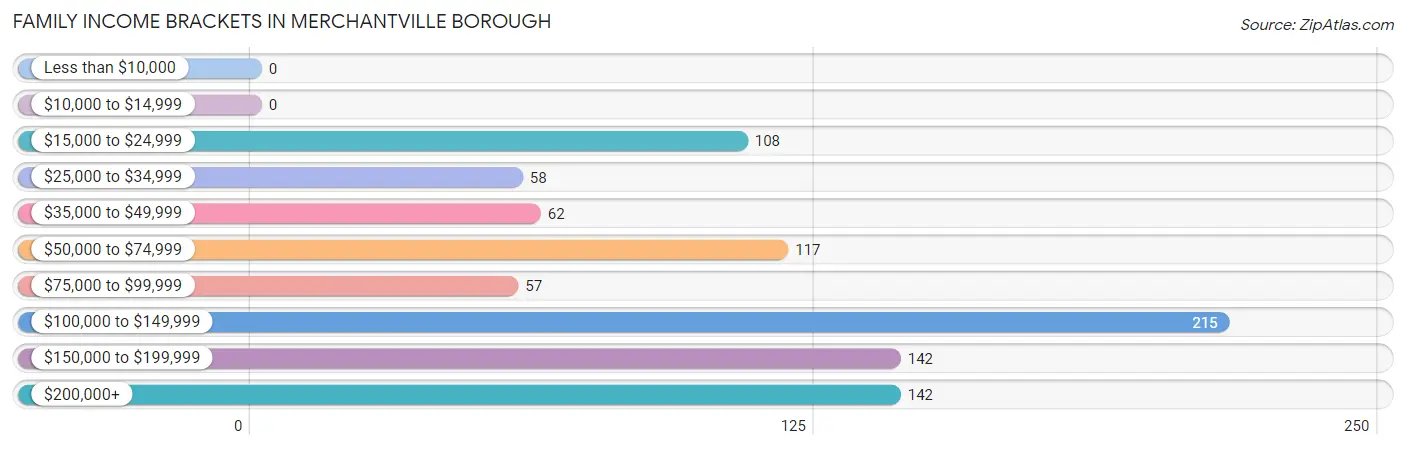
| Income Bracket | # Families | % Families |
| Less than $10,000 | 0 | 0.0% |
| $10,000 to $14,999 | 0 | 0.0% |
| $15,000 to $24,999 | 108 | 12.0% |
| $25,000 to $34,999 | 58 | 6.4% |
| $35,000 to $49,999 | 62 | 6.9% |
| $50,000 to $74,999 | 117 | 13.0% |
| $75,000 to $99,999 | 57 | 6.3% |
| $100,000 to $149,999 | 215 | 23.9% |
| $150,000 to $199,999 | 142 | 15.8% |
| $200,000+ | 142 | 15.8% |
Family Income by Famaliy Size in Merchantville borough
4-person families (155 | 17.2%) account for the highest median family income in Merchantville borough with $164,561 per family, while 2-person families (413 | 45.8%) have the highest median income of $61,569 per family member.
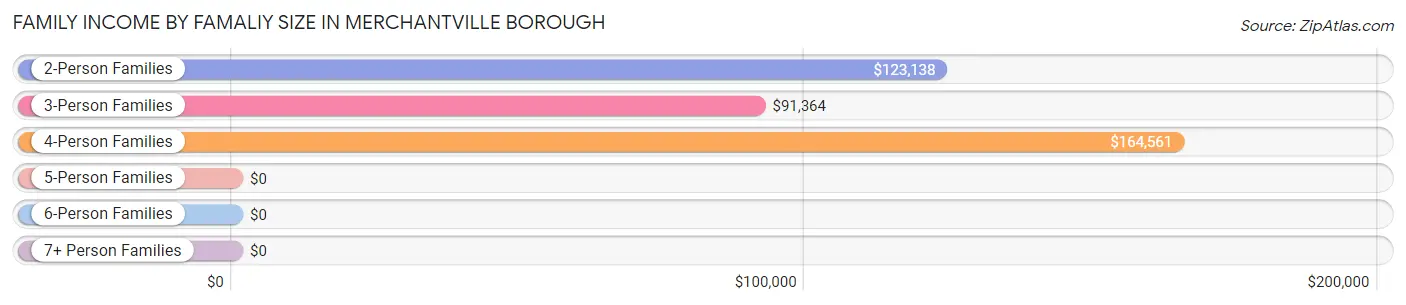
| Income Bracket | # Families | Median Income |
| 2-Person Families | 413 (45.8%) | $123,138 |
| 3-Person Families | 156 (17.3%) | $91,364 |
| 4-Person Families | 155 (17.2%) | $164,561 |
| 5-Person Families | 136 (15.1%) | $0 |
| 6-Person Families | 41 (4.5%) | $0 |
| 7+ Person Families | 0 (0.0%) | $0 |
| Total | 901 (100.0%) | $122,083 |
Family Income by Number of Earners in Merchantville borough
The median family income in Merchantville borough is $122,083, with families comprising 3+ earners (69) having the highest median family income of $163,792, while families with 1 earner (369) have the lowest median family income of $53,125, accounting for 7.7% and 40.9% of families, respectively.
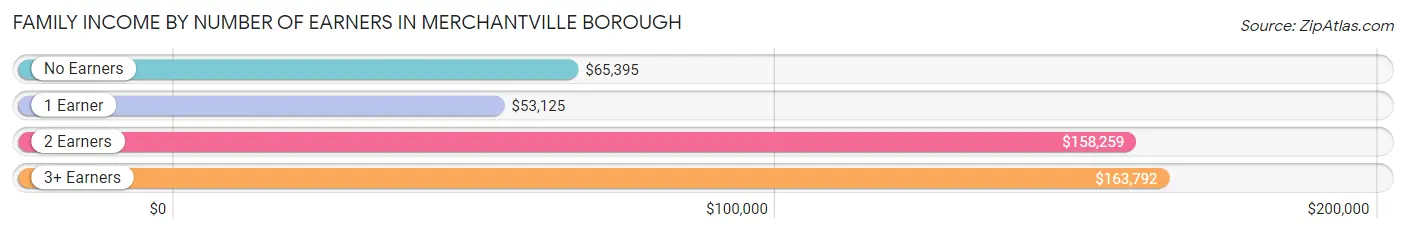
| Number of Earners | # Families | Median Income |
| No Earners | 64 (7.1%) | $65,395 |
| 1 Earner | 369 (40.9%) | $53,125 |
| 2 Earners | 399 (44.3%) | $158,259 |
| 3+ Earners | 69 (7.7%) | $163,792 |
| Total | 901 (100.0%) | $122,083 |
Household Income in Merchantville borough
Household Income Brackets in Merchantville borough
With 265 households falling in the category, the $100,000 to $149,999 income range is the most frequent in Merchantville borough, accounting for 18.0% of all households. In contrast, only 18 households (1.2%) fall into the less than $10,000 income bracket, making it the least populous group.
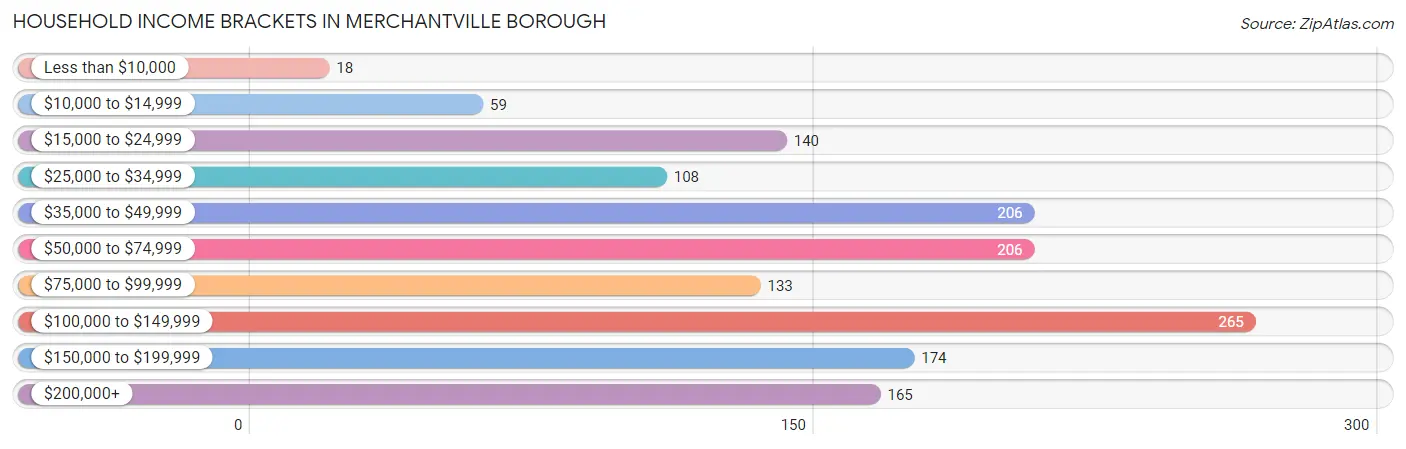
| Income Bracket | # Households | % Households |
| Less than $10,000 | 18 | 1.2% |
| $10,000 to $14,999 | 59 | 4.0% |
| $15,000 to $24,999 | 140 | 9.5% |
| $25,000 to $34,999 | 108 | 7.3% |
| $35,000 to $49,999 | 206 | 14.0% |
| $50,000 to $74,999 | 206 | 14.0% |
| $75,000 to $99,999 | 133 | 9.0% |
| $100,000 to $149,999 | 265 | 18.0% |
| $150,000 to $199,999 | 174 | 11.8% |
| $200,000+ | 165 | 11.2% |
Household Income by Householder Age in Merchantville borough
The median household income in Merchantville borough is $72,375, with the highest median household income of $125,038 found in the 45 to 64 years age bracket for the primary householder. A total of 523 households (35.5%) fall into this category. Meanwhile, the 15 to 24 years age bracket for the primary householder has the lowest median household income of $0, with 28 households (1.9%) in this group.
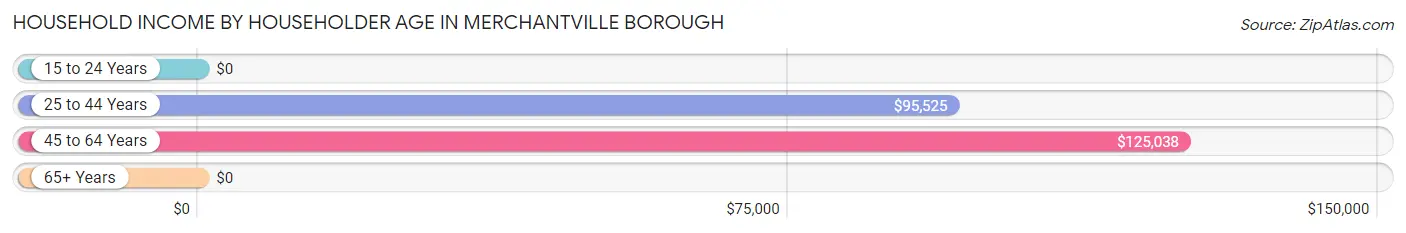
| Income Bracket | # Households | Median Income |
| 15 to 24 Years | 28 (1.9%) | $0 |
| 25 to 44 Years | 507 (34.4%) | $95,525 |
| 45 to 64 Years | 523 (35.5%) | $125,038 |
| 65+ Years | 415 (28.2%) | $0 |
| Total | 1,473 (100.0%) | $72,375 |
Poverty in Merchantville borough
Income Below Poverty by Sex and Age in Merchantville borough
With 18.5% poverty level for males and 13.5% for females among the residents of Merchantville borough, 12 to 14 year old males and 16 and 17 year old females are the most vulnerable to poverty, with 51 males (60.7%) and 109 females (83.2%) in their respective age groups living below the poverty level.
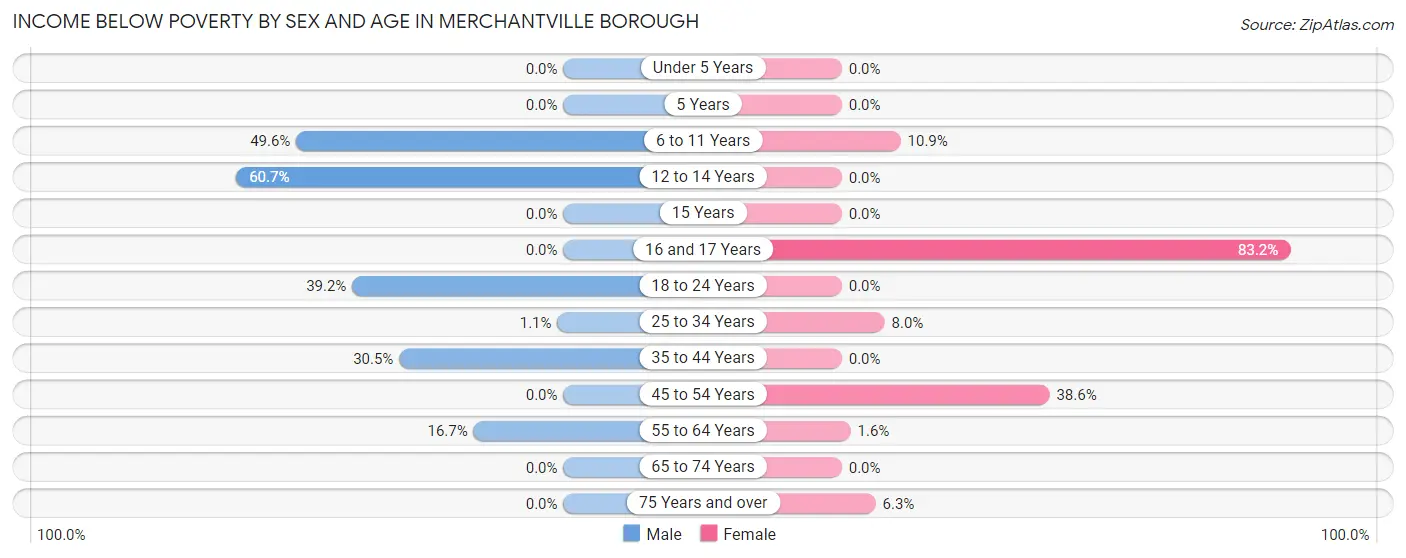
| Age Bracket | Male | Female |
| Under 5 Years | 0 (0.0%) | 0 (0.0%) |
| 5 Years | 0 (0.0%) | 0 (0.0%) |
| 6 to 11 Years | 60 (49.6%) | 13 (10.9%) |
| 12 to 14 Years | 51 (60.7%) | 0 (0.0%) |
| 15 Years | 0 (0.0%) | 0 (0.0%) |
| 16 and 17 Years | 0 (0.0%) | 109 (83.2%) |
| 18 to 24 Years | 116 (39.2%) | 0 (0.0%) |
| 25 to 34 Years | 3 (1.1%) | 12 (8.0%) |
| 35 to 44 Years | 110 (30.5%) | 0 (0.0%) |
| 45 to 54 Years | 0 (0.0%) | 96 (38.6%) |
| 55 to 64 Years | 17 (16.7%) | 4 (1.6%) |
| 65 to 74 Years | 0 (0.0%) | 0 (0.0%) |
| 75 Years and over | 0 (0.0%) | 18 (6.3%) |
| Total | 357 (18.5%) | 252 (13.5%) |
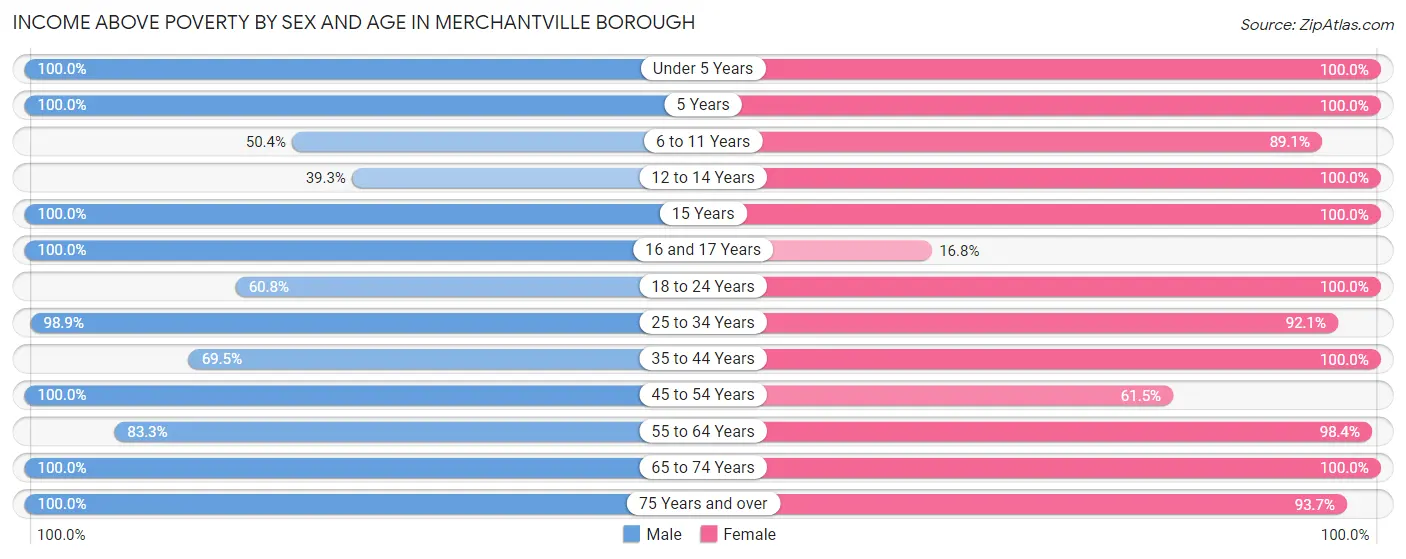
Income Above Poverty by Sex and Age in Merchantville borough
According to the poverty statistics in Merchantville borough, males aged under 5 years and females aged under 5 years are the age groups that are most secure financially, with 100.0% of males and 100.0% of females in these age groups living above the poverty line.
| Age Bracket | Male | Female |
| Under 5 Years | 166 (100.0%) | 65 (100.0%) |
| 5 Years | 25 (100.0%) | 8 (100.0%) |
| 6 to 11 Years | 61 (50.4%) | 106 (89.1%) |
| 12 to 14 Years | 33 (39.3%) | 80 (100.0%) |
| 15 Years | 13 (100.0%) | 38 (100.0%) |
| 16 and 17 Years | 30 (100.0%) | 22 (16.8%) |
| 18 to 24 Years | 180 (60.8%) | 107 (100.0%) |
| 25 to 34 Years | 267 (98.9%) | 139 (92.0%) |
| 35 to 44 Years | 251 (69.5%) | 272 (100.0%) |
| 45 to 54 Years | 257 (100.0%) | 153 (61.5%) |
| 55 to 64 Years | 85 (83.3%) | 241 (98.4%) |
| 65 to 74 Years | 141 (100.0%) | 118 (100.0%) |
| 75 Years and over | 64 (100.0%) | 269 (93.7%) |
| Total | 1,573 (81.5%) | 1,618 (86.5%) |
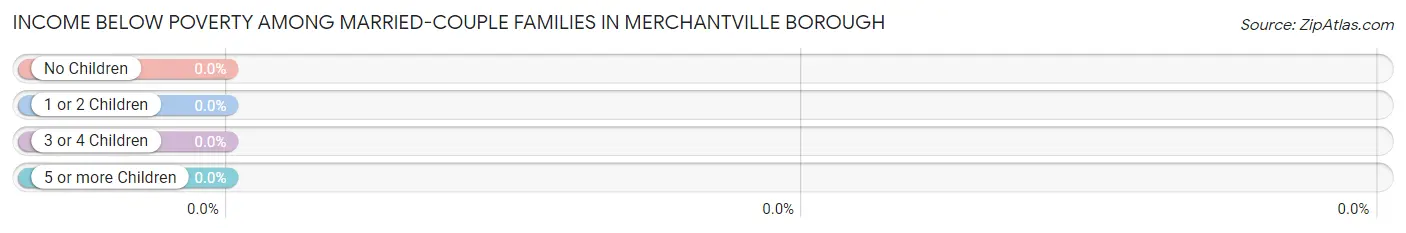
Income Below Poverty Among Married-Couple Families in Merchantville borough
| Children | Above Poverty | Below Poverty |
| No Children | 291 (100.0%) | 0 (0.0%) |
| 1 or 2 Children | 169 (100.0%) | 0 (0.0%) |
| 3 or 4 Children | 22 (100.0%) | 0 (0.0%) |
| 5 or more Children | 0 (0.0%) | 0 (0.0%) |
| Total | 482 (100.0%) | 0 (0.0%) |
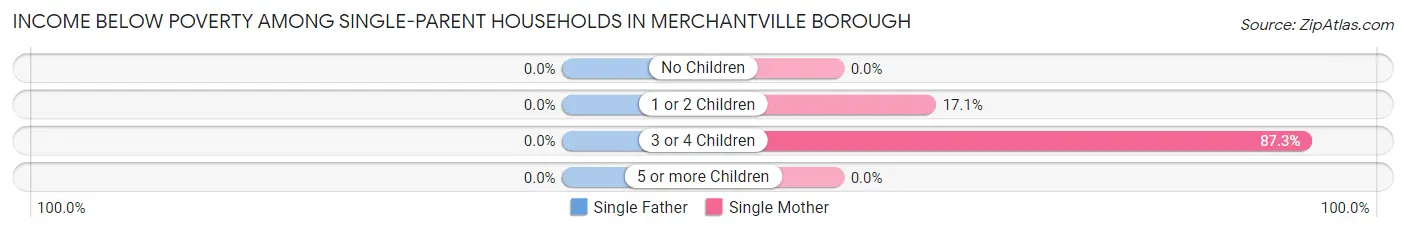
Income Below Poverty Among Single-Parent Households in Merchantville borough
| Children | Single Father | Single Mother |
| No Children | 0 (0.0%) | 0 (0.0%) |
| 1 or 2 Children | 0 (0.0%) | 12 (17.1%) |
| 3 or 4 Children | 0 (0.0%) | 96 (87.3%) |
| 5 or more Children | 0 (0.0%) | 0 (0.0%) |
| Total | 0 (0.0%) | 108 (35.3%) |
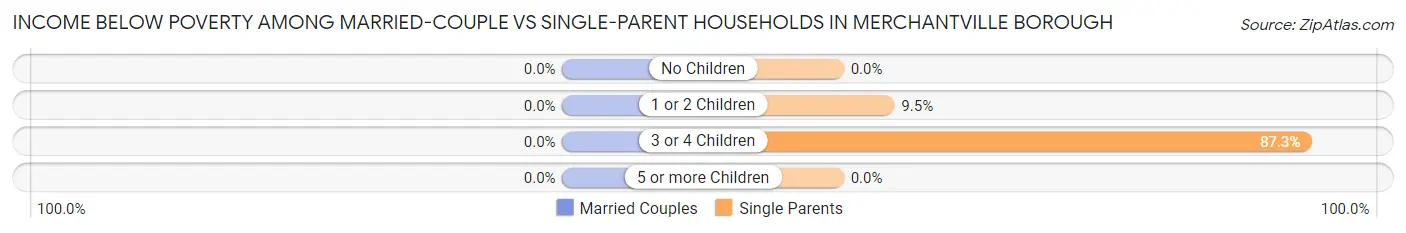
Income Below Poverty Among Married-Couple vs Single-Parent Households in Merchantville borough
| Children | Married-Couple Families | Single-Parent Households |
| No Children | 0 (0.0%) | 0 (0.0%) |
| 1 or 2 Children | 0 (0.0%) | 12 (9.5%) |
| 3 or 4 Children | 0 (0.0%) | 96 (87.3%) |
| 5 or more Children | 0 (0.0%) | 0 (0.0%) |
| Total | 0 (0.0%) | 108 (25.8%) |
Employment Characteristics in Merchantville borough
Employment by Class of Employer in Merchantville borough
Among the 2,000 employed individuals in Merchantville borough, private company employees (1,405 | 70.3%), not-for-profit organizations (142 | 7.1%), and self-employed (not incorporated) (135 | 6.8%) make up the most common classes of employment.
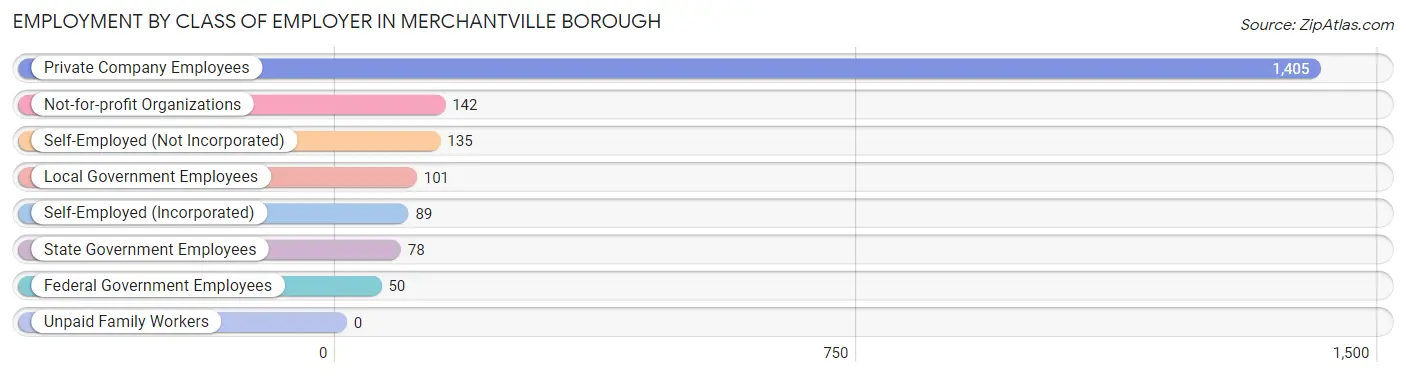
| Employer Class | # Employees | % Employees |
| Private Company Employees | 1,405 | 70.3% |
| Self-Employed (Incorporated) | 89 | 4.4% |
| Self-Employed (Not Incorporated) | 135 | 6.8% |
| Not-for-profit Organizations | 142 | 7.1% |
| Local Government Employees | 101 | 5.1% |
| State Government Employees | 78 | 3.9% |
| Federal Government Employees | 50 | 2.5% |
| Unpaid Family Workers | 0 | 0.0% |
| Total | 2,000 | 100.0% |
Employment Status by Age in Merchantville borough
According to the labor force statistics for Merchantville borough, out of the total population over 16 years of age (3,081), 69.6% or 2,144 individuals are in the labor force, with 2.5% or 54 of them unemployed. The age group with the highest labor force participation rate is 30 to 34 years, with 100.0% or 180 individuals in the labor force. Within the labor force, the 16 to 19 years age range has the highest percentage of unemployed individuals, with 23.4% or 11 of them being unemployed.
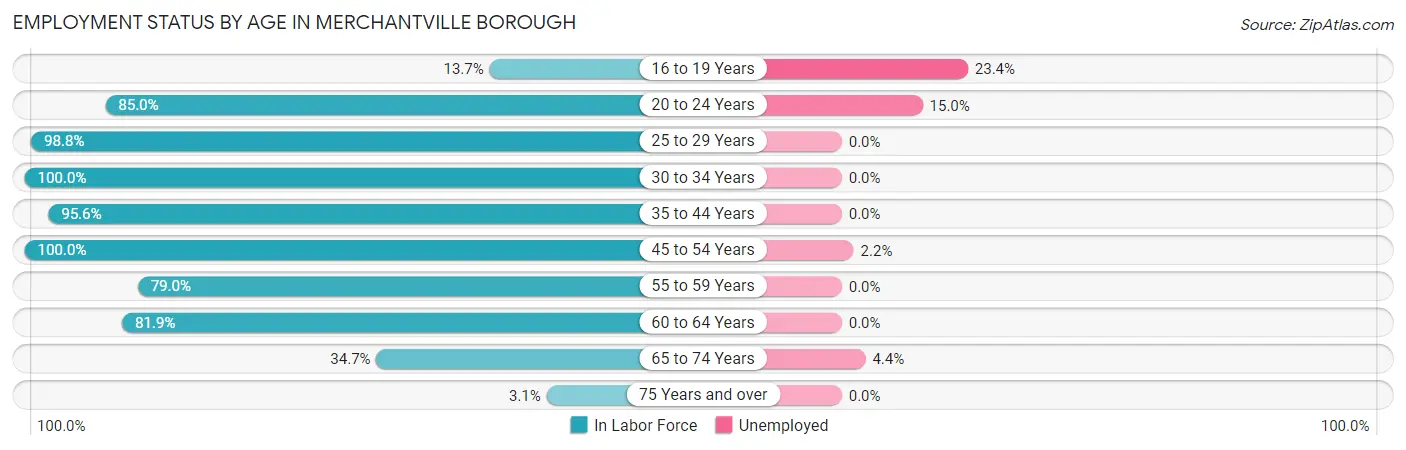
| Age Bracket | In Labor Force | Unemployed |
| 16 to 19 Years | 47 (13.7%) | 11 (23.4%) |
| 20 to 24 Years | 187 (85.0%) | 28 (15.0%) |
| 25 to 29 Years | 238 (98.8%) | 0 (0.0%) |
| 30 to 34 Years | 180 (100.0%) | 0 (0.0%) |
| 35 to 44 Years | 605 (95.6%) | 0 (0.0%) |
| 45 to 54 Years | 506 (100.0%) | 11 (2.2%) |
| 55 to 59 Years | 143 (79.0%) | 0 (0.0%) |
| 60 to 64 Years | 136 (81.9%) | 0 (0.0%) |
| 65 to 74 Years | 90 (34.7%) | 4 (4.4%) |
| 75 Years and over | 11 (3.1%) | 0 (0.0%) |
| Total | 2,144 (69.6%) | 54 (2.5%) |
Employment Status by Educational Attainment in Merchantville borough
According to labor force statistics for Merchantville borough, 94.8% of individuals (1,808) out of the total population between 25 and 64 years of age (1,907) are in the labor force, with 0.6% or 11 of them being unemployed. The group with the highest labor force participation rate are those with the educational attainment of bachelor's degree or higher, with 97.0% or 671 individuals in the labor force. Within the labor force, individuals with bachelor's degree or higher education have the highest percentage of unemployment, with 1.6% or 11 of them being unemployed.
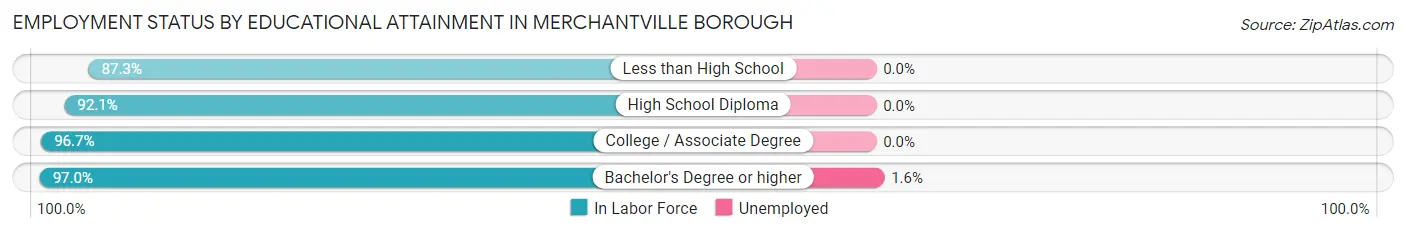
| Educational Attainment | In Labor Force | Unemployed |
| Less than High School | 117 (87.3%) | 0 (0.0%) |
| High School Diploma | 515 (92.1%) | 0 (0.0%) |
| College / Associate Degree | 505 (96.7%) | 0 (0.0%) |
| Bachelor's Degree or higher | 671 (97.0%) | 11 (1.6%) |
| Total | 1,808 (94.8%) | 11 (0.6%) |
Employment Occupations by Sex in Merchantville borough
Management, Business, Science and Arts Occupations
The most common Management, Business, Science and Arts occupations in Merchantville borough are Management (240 | 11.5%), Community & Social Service (198 | 9.5%), Education Instruction & Library (142 | 6.8%), Computers, Engineering & Science (135 | 6.5%), and Business & Financial (108 | 5.2%).

Management, Business, Science and Arts Occupations by Sex
Within the Management, Business, Science and Arts occupations in Merchantville borough, the most male-oriented occupations are Legal Services & Support (100.0%), Management (60.8%), and Computers & Mathematics (54.5%), while the most female-oriented occupations are Health Technologists (100.0%), Education, Arts & Media (93.8%), and Health Diagnosing & Treating (86.9%).
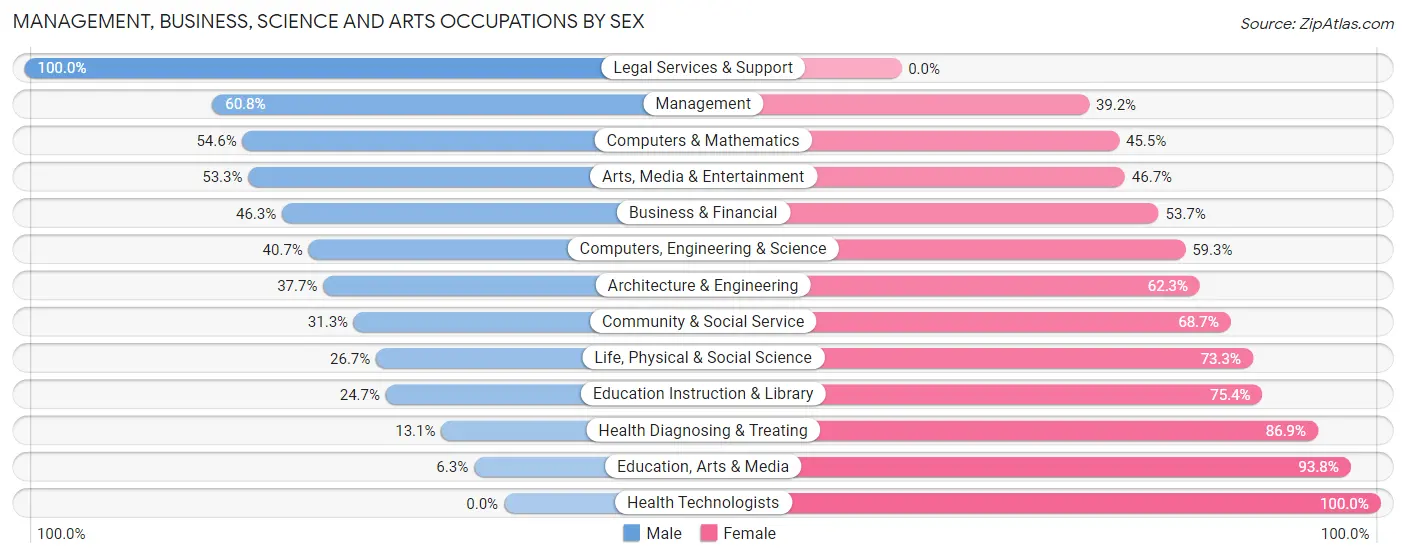
| Occupation | Male | Female |
| Management | 146 (60.8%) | 94 (39.2%) |
| Business & Financial | 50 (46.3%) | 58 (53.7%) |
| Computers, Engineering & Science | 55 (40.7%) | 80 (59.3%) |
| Computers & Mathematics | 24 (54.5%) | 20 (45.5%) |
| Architecture & Engineering | 23 (37.7%) | 38 (62.3%) |
| Life, Physical & Social Science | 8 (26.7%) | 22 (73.3%) |
| Community & Social Service | 62 (31.3%) | 136 (68.7%) |
| Education, Arts & Media | 1 (6.2%) | 15 (93.8%) |
| Legal Services & Support | 10 (100.0%) | 0 (0.0%) |
| Education Instruction & Library | 35 (24.6%) | 107 (75.3%) |
| Arts, Media & Entertainment | 16 (53.3%) | 14 (46.7%) |
| Health Diagnosing & Treating | 14 (13.1%) | 93 (86.9%) |
| Health Technologists | 0 (0.0%) | 45 (100.0%) |
| Total (Category) | 327 (41.5%) | 461 (58.5%) |
| Total (Overall) | 1,118 (53.5%) | 971 (46.5%) |
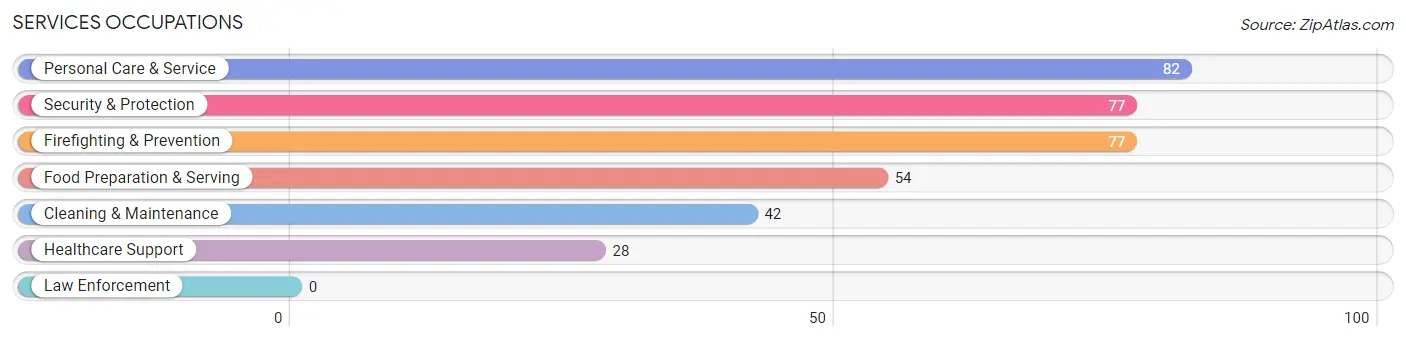
Services Occupations
The most common Services occupations in Merchantville borough are Personal Care & Service (82 | 3.9%), Security & Protection (77 | 3.7%), Firefighting & Prevention (77 | 3.7%), Food Preparation & Serving (54 | 2.6%), and Cleaning & Maintenance (42 | 2.0%).
Services Occupations by Sex
Within the Services occupations in Merchantville borough, the most male-oriented occupations are Cleaning & Maintenance (80.9%), Food Preparation & Serving (79.6%), and Security & Protection (76.6%), while the most female-oriented occupations are Healthcare Support (100.0%), Personal Care & Service (100.0%), and Security & Protection (23.4%).
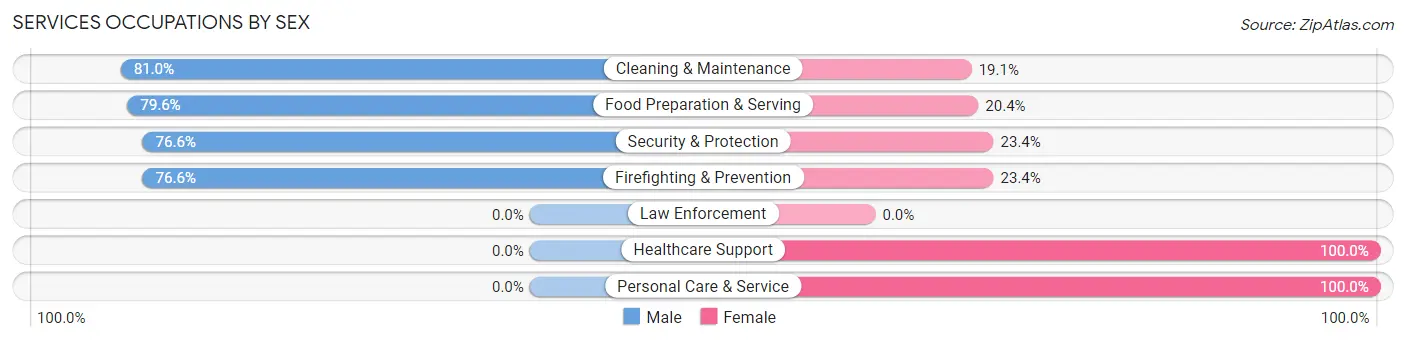
| Occupation | Male | Female |
| Healthcare Support | 0 (0.0%) | 28 (100.0%) |
| Security & Protection | 59 (76.6%) | 18 (23.4%) |
| Firefighting & Prevention | 59 (76.6%) | 18 (23.4%) |
| Law Enforcement | 0 (0.0%) | 0 (0.0%) |
| Food Preparation & Serving | 43 (79.6%) | 11 (20.4%) |
| Cleaning & Maintenance | 34 (80.9%) | 8 (19.1%) |
| Personal Care & Service | 0 (0.0%) | 82 (100.0%) |
| Total (Category) | 136 (48.1%) | 147 (51.9%) |
| Total (Overall) | 1,118 (53.5%) | 971 (46.5%) |
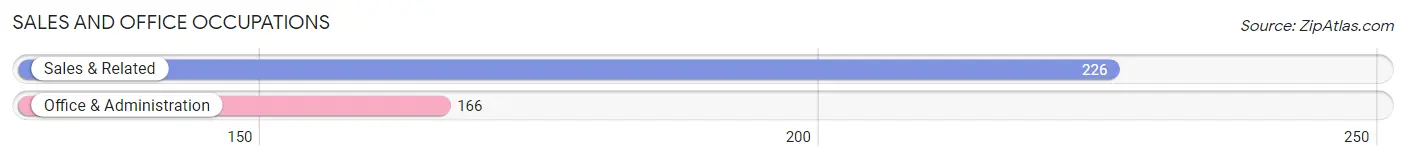
Sales and Office Occupations
The most common Sales and Office occupations in Merchantville borough are Sales & Related (226 | 10.8%), and Office & Administration (166 | 8.0%).
Sales and Office Occupations by Sex
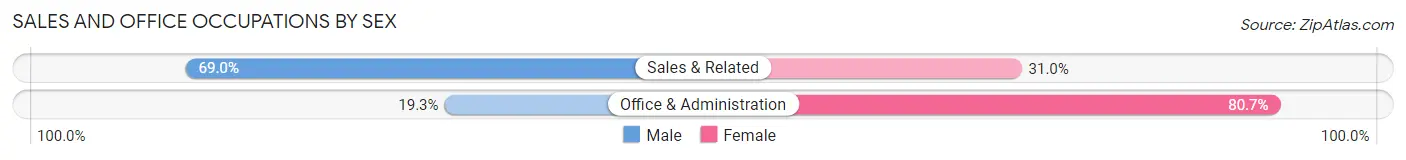
| Occupation | Male | Female |
| Sales & Related | 156 (69.0%) | 70 (31.0%) |
| Office & Administration | 32 (19.3%) | 134 (80.7%) |
| Total (Category) | 188 (48.0%) | 204 (52.0%) |
| Total (Overall) | 1,118 (53.5%) | 971 (46.5%) |
Natural Resources, Construction and Maintenance Occupations
The most common Natural Resources, Construction and Maintenance occupations in Merchantville borough are Construction & Extraction (86 | 4.1%), Farming, Fishing & Forestry (30 | 1.4%), and Installation, Maintenance & Repair (7 | 0.3%).

Natural Resources, Construction and Maintenance Occupations by Sex

| Occupation | Male | Female |
| Farming, Fishing & Forestry | 30 (100.0%) | 0 (0.0%) |
| Construction & Extraction | 86 (100.0%) | 0 (0.0%) |
| Installation, Maintenance & Repair | 0 (0.0%) | 7 (100.0%) |
| Total (Category) | 116 (94.3%) | 7 (5.7%) |
| Total (Overall) | 1,118 (53.5%) | 971 (46.5%) |
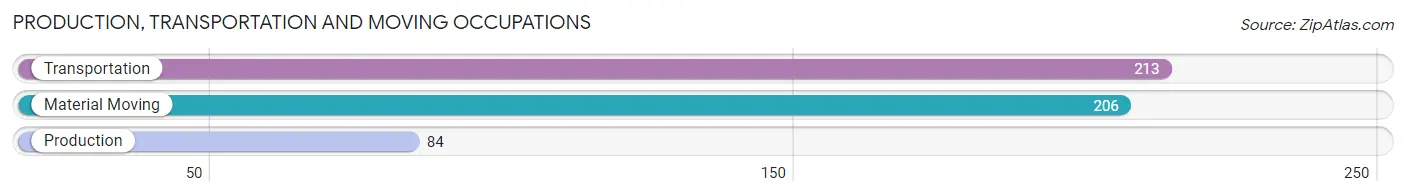
Production, Transportation and Moving Occupations
The most common Production, Transportation and Moving occupations in Merchantville borough are Transportation (213 | 10.2%), Material Moving (206 | 9.9%), and Production (84 | 4.0%).
Production, Transportation and Moving Occupations by Sex
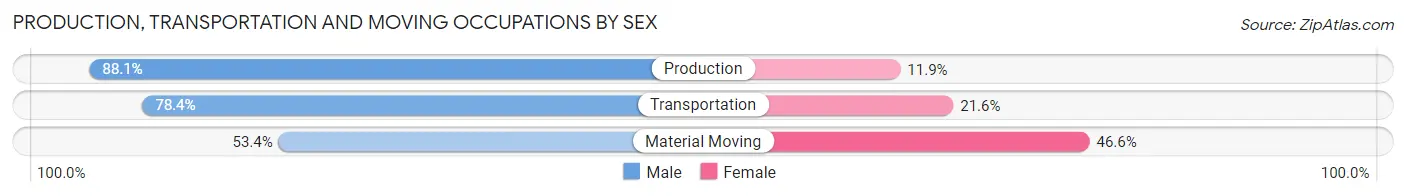
| Occupation | Male | Female |
| Production | 74 (88.1%) | 10 (11.9%) |
| Transportation | 167 (78.4%) | 46 (21.6%) |
| Material Moving | 110 (53.4%) | 96 (46.6%) |
| Total (Category) | 351 (69.8%) | 152 (30.2%) |
| Total (Overall) | 1,118 (53.5%) | 971 (46.5%) |
Employment Industries by Sex in Merchantville borough
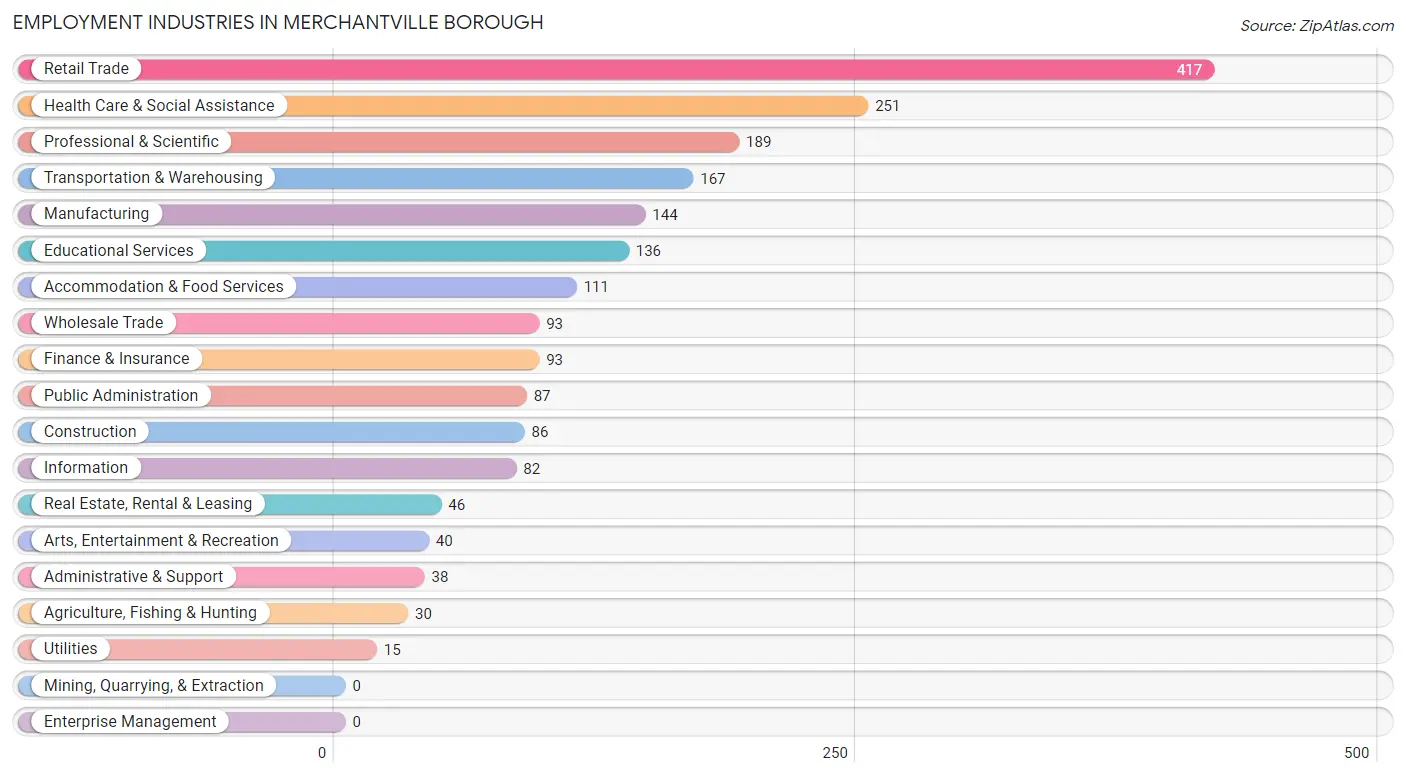
Employment Industries in Merchantville borough
The major employment industries in Merchantville borough include Retail Trade (417 | 20.0%), Health Care & Social Assistance (251 | 12.0%), Professional & Scientific (189 | 9.0%), Transportation & Warehousing (167 | 8.0%), and Manufacturing (144 | 6.9%).
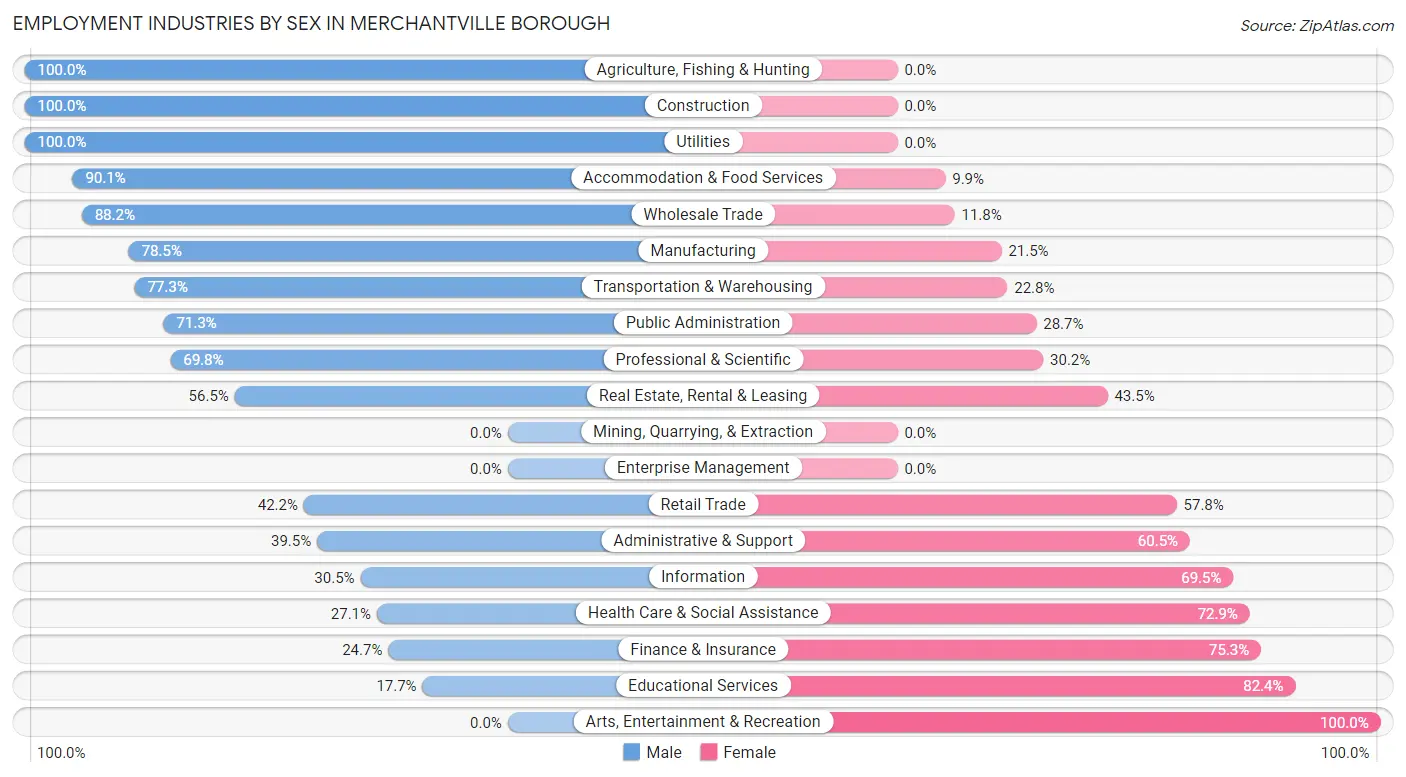
Employment Industries by Sex in Merchantville borough
The Merchantville borough industries that see more men than women are Agriculture, Fishing & Hunting (100.0%), Construction (100.0%), and Utilities (100.0%), whereas the industries that tend to have a higher number of women are Arts, Entertainment & Recreation (100.0%), Educational Services (82.4%), and Finance & Insurance (75.3%).
| Industry | Male | Female |
| Agriculture, Fishing & Hunting | 30 (100.0%) | 0 (0.0%) |
| Mining, Quarrying, & Extraction | 0 (0.0%) | 0 (0.0%) |
| Construction | 86 (100.0%) | 0 (0.0%) |
| Manufacturing | 113 (78.5%) | 31 (21.5%) |
| Wholesale Trade | 82 (88.2%) | 11 (11.8%) |
| Retail Trade | 176 (42.2%) | 241 (57.8%) |
| Transportation & Warehousing | 129 (77.2%) | 38 (22.8%) |
| Utilities | 15 (100.0%) | 0 (0.0%) |
| Information | 25 (30.5%) | 57 (69.5%) |
| Finance & Insurance | 23 (24.7%) | 70 (75.3%) |
| Real Estate, Rental & Leasing | 26 (56.5%) | 20 (43.5%) |
| Professional & Scientific | 132 (69.8%) | 57 (30.2%) |
| Enterprise Management | 0 (0.0%) | 0 (0.0%) |
| Administrative & Support | 15 (39.5%) | 23 (60.5%) |
| Educational Services | 24 (17.6%) | 112 (82.4%) |
| Health Care & Social Assistance | 68 (27.1%) | 183 (72.9%) |
| Arts, Entertainment & Recreation | 0 (0.0%) | 40 (100.0%) |
| Accommodation & Food Services | 100 (90.1%) | 11 (9.9%) |
| Public Administration | 62 (71.3%) | 25 (28.7%) |
| Total | 1,118 (53.5%) | 971 (46.5%) |
Education in Merchantville borough
School Enrollment in Merchantville borough
The most common levels of schooling among the 987 students in Merchantville borough are high school (315 | 31.9%), middle school (183 | 18.5%), and elementary school (180 | 18.2%).
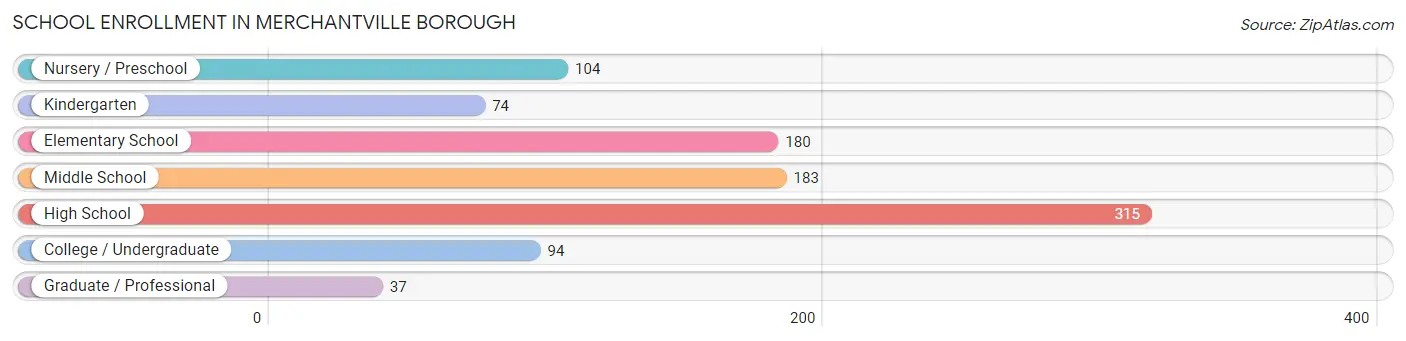
| School Level | # Students | % Students |
| Nursery / Preschool | 104 | 10.5% |
| Kindergarten | 74 | 7.5% |
| Elementary School | 180 | 18.2% |
| Middle School | 183 | 18.5% |
| High School | 315 | 31.9% |
| College / Undergraduate | 94 | 9.5% |
| Graduate / Professional | 37 | 3.7% |
| Total | 987 | 100.0% |
School Enrollment by Age by Funding Source in Merchantville borough
Out of a total of 987 students who are enrolled in schools in Merchantville borough, 195 (19.8%) attend a private institution, while the remaining 792 (80.2%) are enrolled in public schools. The age group of 25 to 34 year olds has the highest likelihood of being enrolled in private schools, with 32 (100.0% in the age bracket) enrolled. Conversely, the age group of 18 to 19 year olds has the lowest likelihood of being enrolled in a private school, with 121 (95.3% in the age bracket) attending a public institution.
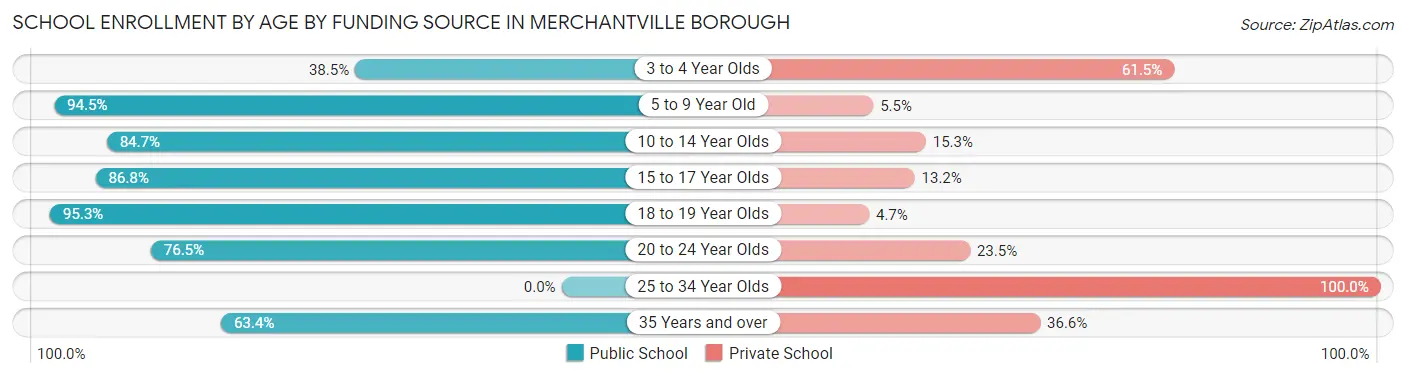
| Age Bracket | Public School | Private School |
| 3 to 4 Year Olds | 40 (38.5%) | 64 (61.5%) |
| 5 to 9 Year Old | 240 (94.5%) | 14 (5.5%) |
| 10 to 14 Year Olds | 155 (84.7%) | 28 (15.3%) |
| 15 to 17 Year Olds | 184 (86.8%) | 28 (13.2%) |
| 18 to 19 Year Olds | 121 (95.3%) | 6 (4.7%) |
| 20 to 24 Year Olds | 26 (76.5%) | 8 (23.5%) |
| 25 to 34 Year Olds | 0 (0.0%) | 32 (100.0%) |
| 35 Years and over | 26 (63.4%) | 15 (36.6%) |
| Total | 792 (80.2%) | 195 (19.8%) |
Educational Attainment by Field of Study in Merchantville borough
Business (166 | 19.7%), communications (106 | 12.6%), education (96 | 11.4%), social sciences (76 | 9.0%), and visual & performing arts (70 | 8.3%) are the most common fields of study among 842 individuals in Merchantville borough who have obtained a bachelor's degree or higher.
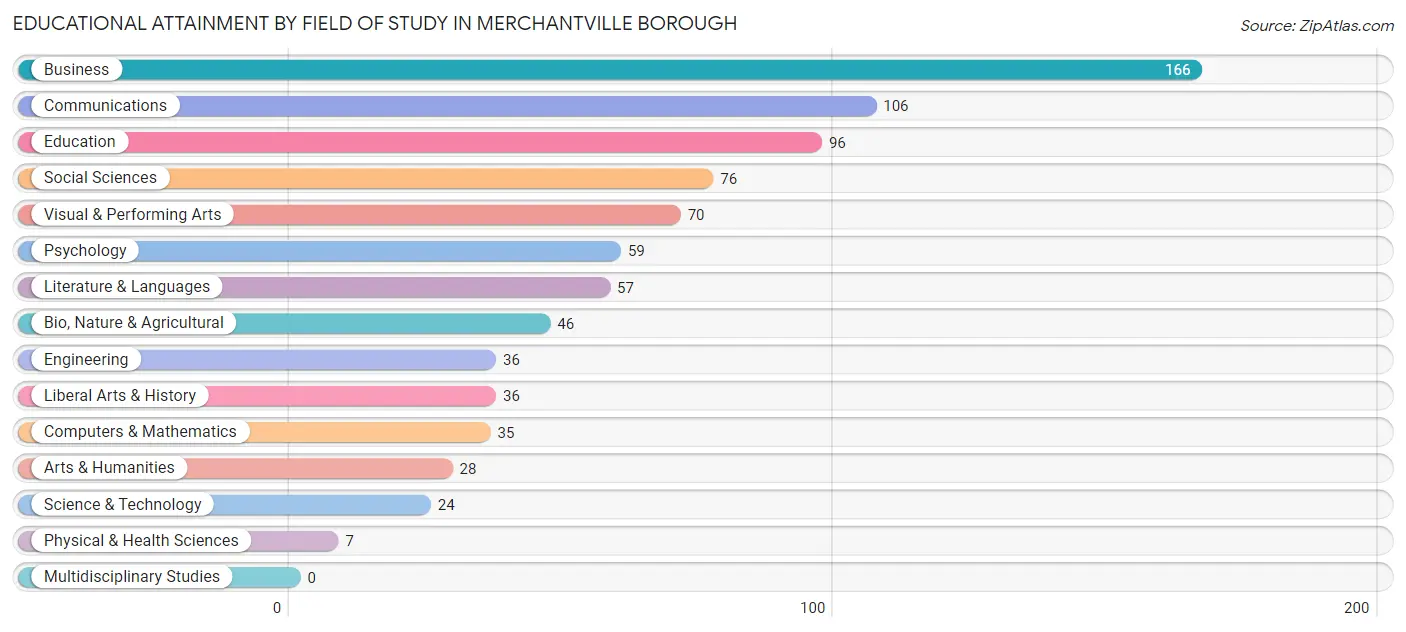
| Field of Study | # Graduates | % Graduates |
| Computers & Mathematics | 35 | 4.2% |
| Bio, Nature & Agricultural | 46 | 5.5% |
| Physical & Health Sciences | 7 | 0.8% |
| Psychology | 59 | 7.0% |
| Social Sciences | 76 | 9.0% |
| Engineering | 36 | 4.3% |
| Multidisciplinary Studies | 0 | 0.0% |
| Science & Technology | 24 | 2.9% |
| Business | 166 | 19.7% |
| Education | 96 | 11.4% |
| Literature & Languages | 57 | 6.8% |
| Liberal Arts & History | 36 | 4.3% |
| Visual & Performing Arts | 70 | 8.3% |
| Communications | 106 | 12.6% |
| Arts & Humanities | 28 | 3.3% |
| Total | 842 | 100.0% |
Transportation & Commute in Merchantville borough
Vehicle Availability by Sex in Merchantville borough
The most prevalent vehicle ownership categories in Merchantville borough are males with 2 vehicles (476, accounting for 43.8%) and females with 2 vehicles (387, making up 52.2%).
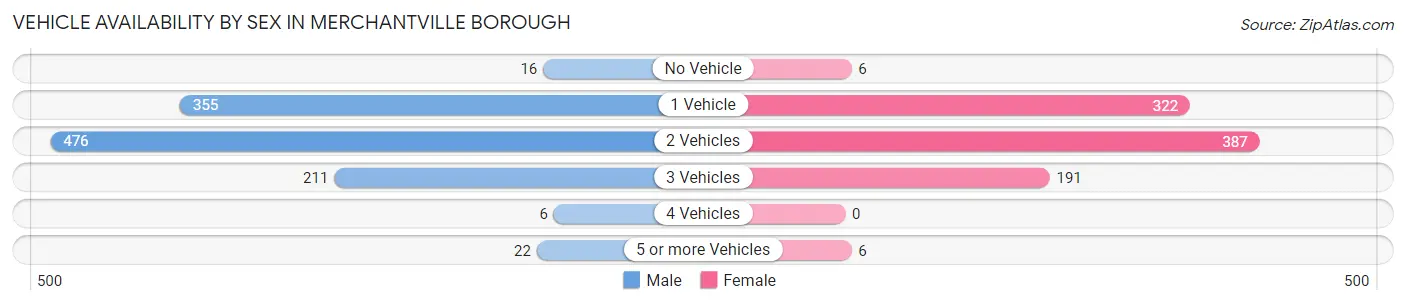
| Vehicles Available | Male | Female |
| No Vehicle | 16 (1.5%) | 6 (0.7%) |
| 1 Vehicle | 355 (32.7%) | 322 (35.3%) |
| 2 Vehicles | 476 (43.8%) | 387 (42.4%) |
| 3 Vehicles | 211 (19.4%) | 191 (20.9%) |
| 4 Vehicles | 6 (0.5%) | 0 (0.0%) |
| 5 or more Vehicles | 22 (2.0%) | 6 (0.7%) |
| Total | 1,086 (100.0%) | 912 (100.0%) |
Commute Time in Merchantville borough
The most frequently occuring commute durations in Merchantville borough are 15 to 19 minutes (375 commuters, 22.3%), 10 to 14 minutes (298 commuters, 17.7%), and 20 to 24 minutes (272 commuters, 16.2%).
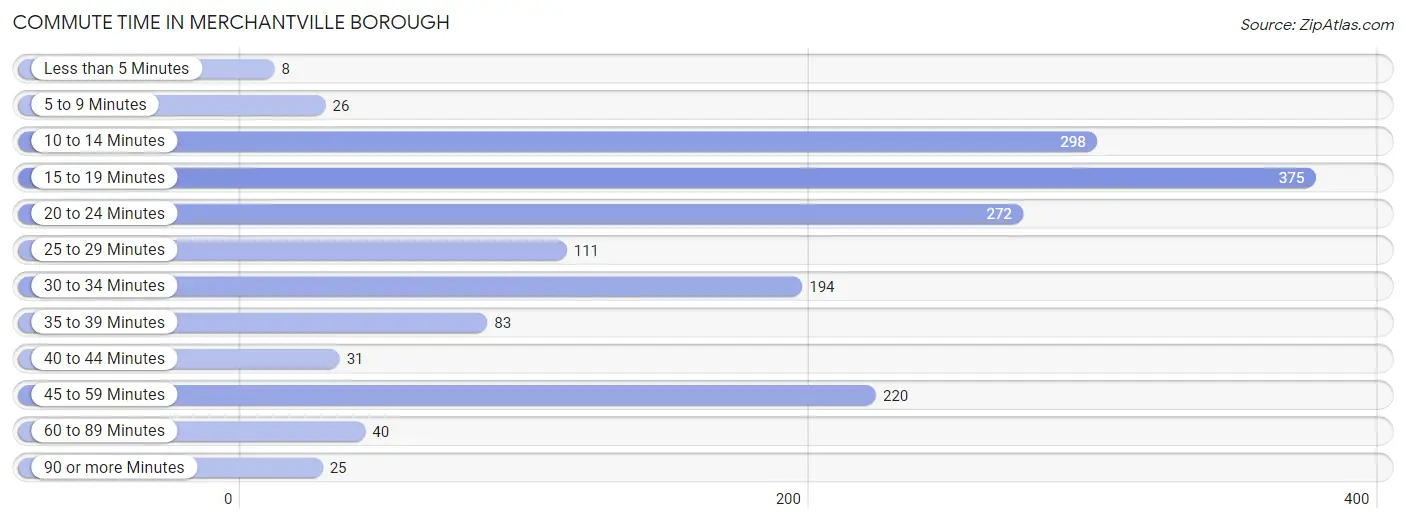
| Commute Time | # Commuters | % Commuters |
| Less than 5 Minutes | 8 | 0.5% |
| 5 to 9 Minutes | 26 | 1.5% |
| 10 to 14 Minutes | 298 | 17.7% |
| 15 to 19 Minutes | 375 | 22.3% |
| 20 to 24 Minutes | 272 | 16.2% |
| 25 to 29 Minutes | 111 | 6.6% |
| 30 to 34 Minutes | 194 | 11.5% |
| 35 to 39 Minutes | 83 | 4.9% |
| 40 to 44 Minutes | 31 | 1.8% |
| 45 to 59 Minutes | 220 | 13.1% |
| 60 to 89 Minutes | 40 | 2.4% |
| 90 or more Minutes | 25 | 1.5% |
Commute Time by Sex in Merchantville borough
The most common commute times in Merchantville borough are 20 to 24 minutes (198 commuters, 21.6%) for males and 15 to 19 minutes (239 commuters, 31.2%) for females.
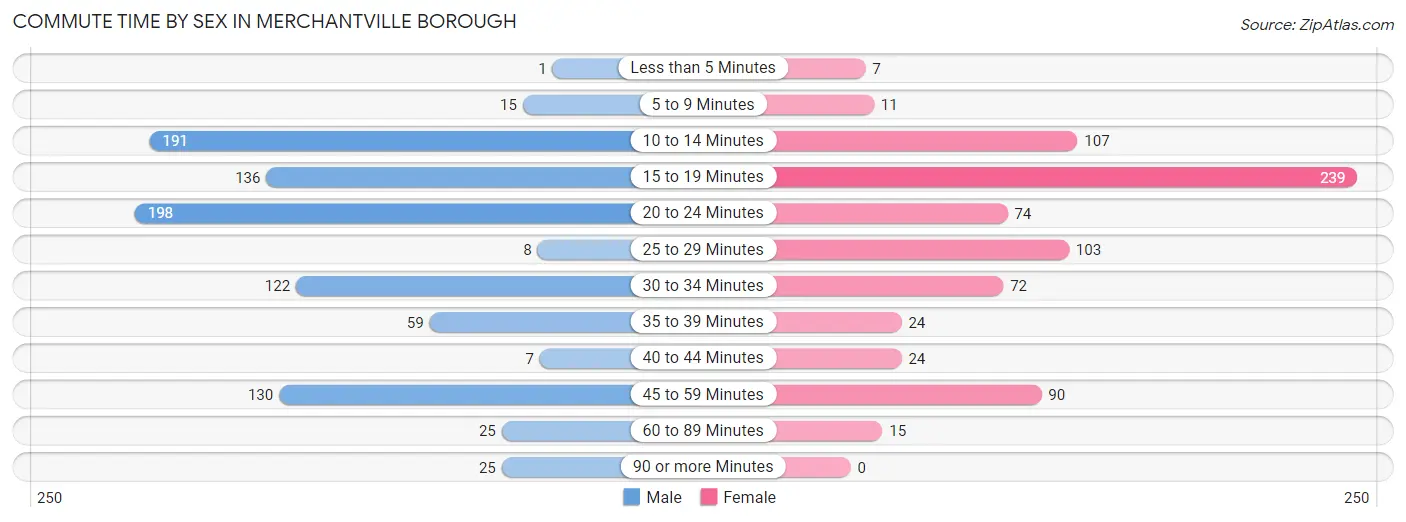
| Commute Time | Male | Female |
| Less than 5 Minutes | 1 (0.1%) | 7 (0.9%) |
| 5 to 9 Minutes | 15 (1.6%) | 11 (1.4%) |
| 10 to 14 Minutes | 191 (20.8%) | 107 (14.0%) |
| 15 to 19 Minutes | 136 (14.8%) | 239 (31.2%) |
| 20 to 24 Minutes | 198 (21.6%) | 74 (9.7%) |
| 25 to 29 Minutes | 8 (0.9%) | 103 (13.5%) |
| 30 to 34 Minutes | 122 (13.3%) | 72 (9.4%) |
| 35 to 39 Minutes | 59 (6.4%) | 24 (3.1%) |
| 40 to 44 Minutes | 7 (0.8%) | 24 (3.1%) |
| 45 to 59 Minutes | 130 (14.2%) | 90 (11.7%) |
| 60 to 89 Minutes | 25 (2.7%) | 15 (2.0%) |
| 90 or more Minutes | 25 (2.7%) | 0 (0.0%) |
Time of Departure to Work by Sex in Merchantville borough
The most frequent times of departure to work in Merchantville borough are 4:00 PM to 11:59 PM (198, 21.6%) for males and 8:00 AM to 8:29 AM (165, 21.5%) for females.
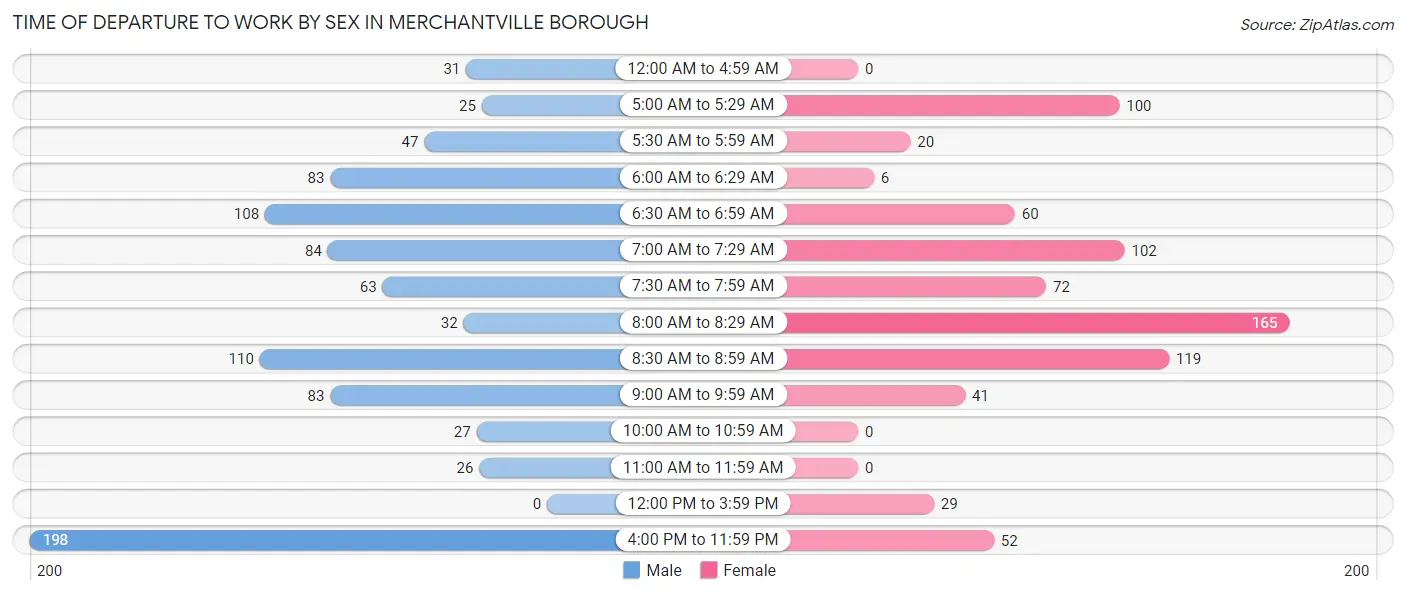
| Time of Departure | Male | Female |
| 12:00 AM to 4:59 AM | 31 (3.4%) | 0 (0.0%) |
| 5:00 AM to 5:29 AM | 25 (2.7%) | 100 (13.1%) |
| 5:30 AM to 5:59 AM | 47 (5.1%) | 20 (2.6%) |
| 6:00 AM to 6:29 AM | 83 (9.0%) | 6 (0.8%) |
| 6:30 AM to 6:59 AM | 108 (11.8%) | 60 (7.8%) |
| 7:00 AM to 7:29 AM | 84 (9.2%) | 102 (13.3%) |
| 7:30 AM to 7:59 AM | 63 (6.9%) | 72 (9.4%) |
| 8:00 AM to 8:29 AM | 32 (3.5%) | 165 (21.5%) |
| 8:30 AM to 8:59 AM | 110 (12.0%) | 119 (15.5%) |
| 9:00 AM to 9:59 AM | 83 (9.0%) | 41 (5.3%) |
| 10:00 AM to 10:59 AM | 27 (2.9%) | 0 (0.0%) |
| 11:00 AM to 11:59 AM | 26 (2.8%) | 0 (0.0%) |
| 12:00 PM to 3:59 PM | 0 (0.0%) | 29 (3.8%) |
| 4:00 PM to 11:59 PM | 198 (21.6%) | 52 (6.8%) |
| Total | 917 (100.0%) | 766 (100.0%) |
Housing Occupancy in Merchantville borough
Occupancy by Ownership in Merchantville borough
Of the total 1,473 dwellings in Merchantville borough, owner-occupied units account for 884 (60.0%), while renter-occupied units make up 589 (40.0%).
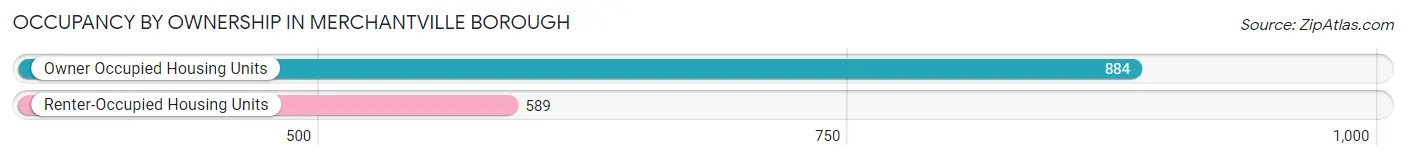
| Occupancy | # Housing Units | % Housing Units |
| Owner Occupied Housing Units | 884 | 60.0% |
| Renter-Occupied Housing Units | 589 | 40.0% |
| Total Occupied Housing Units | 1,473 | 100.0% |
Occupancy by Household Size in Merchantville borough
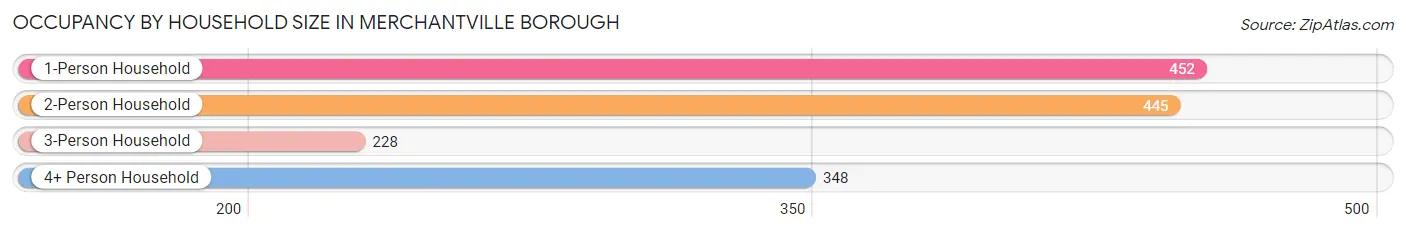
| Household Size | # Housing Units | % Housing Units |
| 1-Person Household | 452 | 30.7% |
| 2-Person Household | 445 | 30.2% |
| 3-Person Household | 228 | 15.5% |
| 4+ Person Household | 348 | 23.6% |
| Total Housing Units | 1,473 | 100.0% |
Occupancy by Ownership by Household Size in Merchantville borough
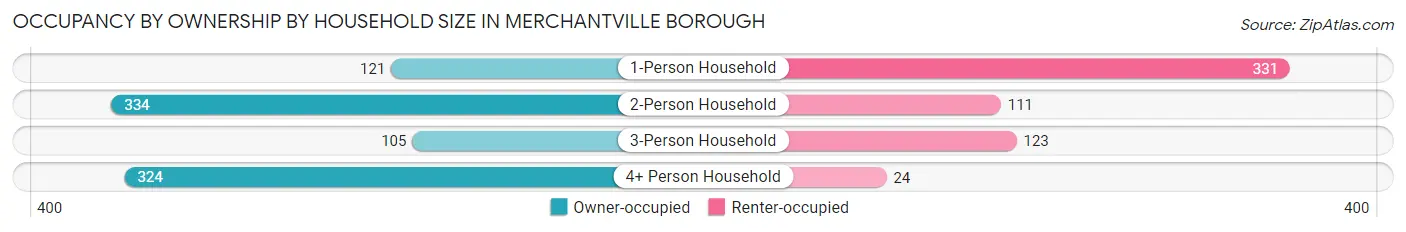
| Household Size | Owner-occupied | Renter-occupied |
| 1-Person Household | 121 (26.8%) | 331 (73.2%) |
| 2-Person Household | 334 (75.1%) | 111 (24.9%) |
| 3-Person Household | 105 (46.1%) | 123 (53.9%) |
| 4+ Person Household | 324 (93.1%) | 24 (6.9%) |
| Total Housing Units | 884 (60.0%) | 589 (40.0%) |
Occupancy by Educational Attainment in Merchantville borough
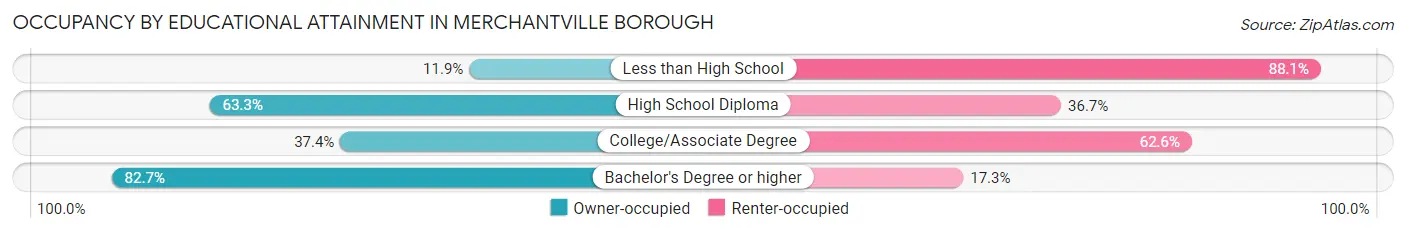
| Household Size | Owner-occupied | Renter-occupied |
| Less than High School | 14 (11.9%) | 104 (88.1%) |
| High School Diploma | 278 (63.3%) | 161 (36.7%) |
| College/Associate Degree | 137 (37.4%) | 229 (62.6%) |
| Bachelor's Degree or higher | 455 (82.7%) | 95 (17.3%) |
Occupancy by Age of Householder in Merchantville borough
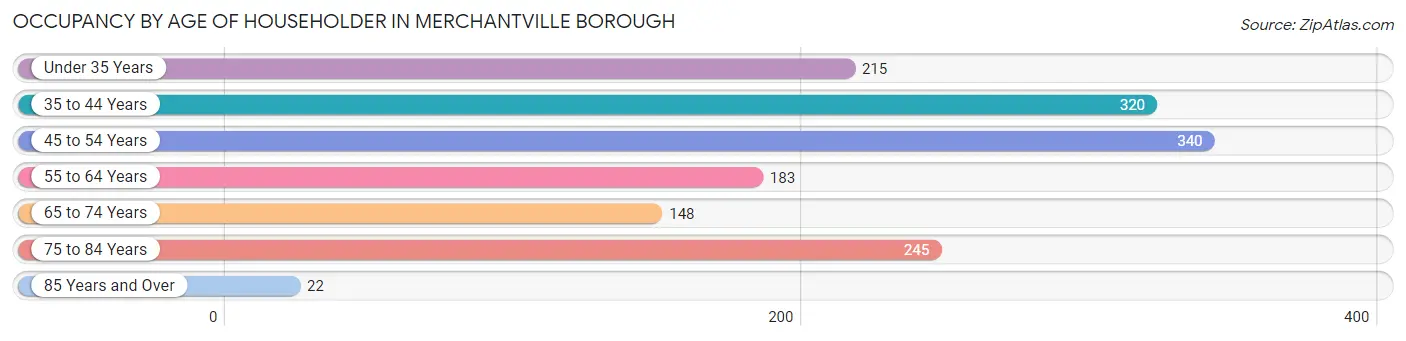
| Age Bracket | # Households | % Households |
| Under 35 Years | 215 | 14.6% |
| 35 to 44 Years | 320 | 21.7% |
| 45 to 54 Years | 340 | 23.1% |
| 55 to 64 Years | 183 | 12.4% |
| 65 to 74 Years | 148 | 10.1% |
| 75 to 84 Years | 245 | 16.6% |
| 85 Years and Over | 22 | 1.5% |
| Total | 1,473 | 100.0% |
Housing Finances in Merchantville borough
Median Income by Occupancy in Merchantville borough
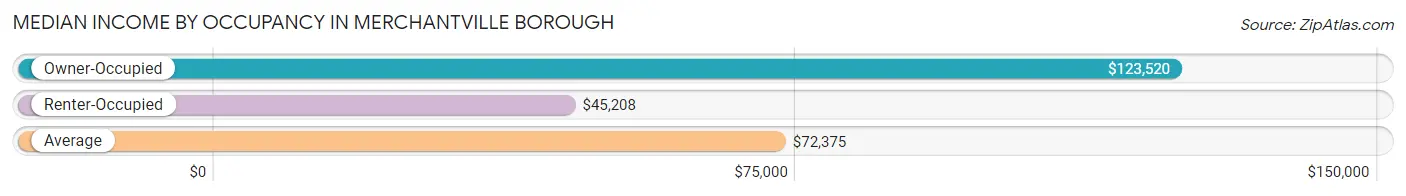
| Occupancy Type | # Households | Median Income |
| Owner-Occupied | 884 (60.0%) | $123,520 |
| Renter-Occupied | 589 (40.0%) | $45,208 |
| Average | 1,473 (100.0%) | $72,375 |
Occupancy by Householder Income Bracket in Merchantville borough
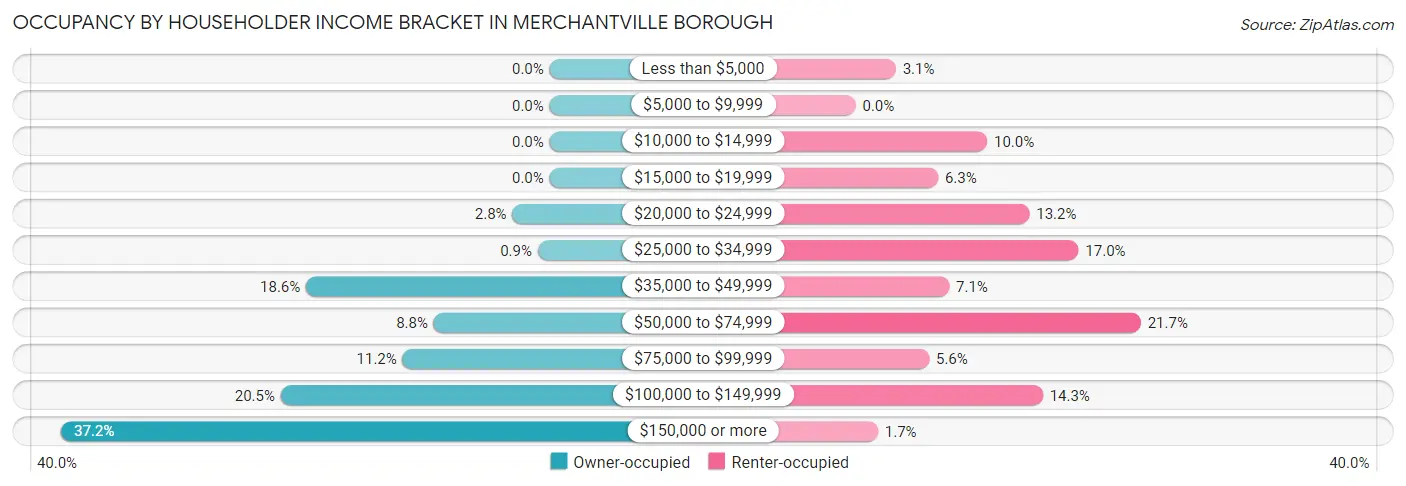
| Income Bracket | Owner-occupied | Renter-occupied |
| Less than $5,000 | 0 (0.0%) | 18 (3.1%) |
| $5,000 to $9,999 | 0 (0.0%) | 0 (0.0%) |
| $10,000 to $14,999 | 0 (0.0%) | 59 (10.0%) |
| $15,000 to $19,999 | 0 (0.0%) | 37 (6.3%) |
| $20,000 to $24,999 | 25 (2.8%) | 78 (13.2%) |
| $25,000 to $34,999 | 8 (0.9%) | 100 (17.0%) |
| $35,000 to $49,999 | 164 (18.5%) | 42 (7.1%) |
| $50,000 to $74,999 | 78 (8.8%) | 128 (21.7%) |
| $75,000 to $99,999 | 99 (11.2%) | 33 (5.6%) |
| $100,000 to $149,999 | 181 (20.5%) | 84 (14.3%) |
| $150,000 or more | 329 (37.2%) | 10 (1.7%) |
| Total | 884 (100.0%) | 589 (100.0%) |
Monthly Housing Cost Tiers in Merchantville borough
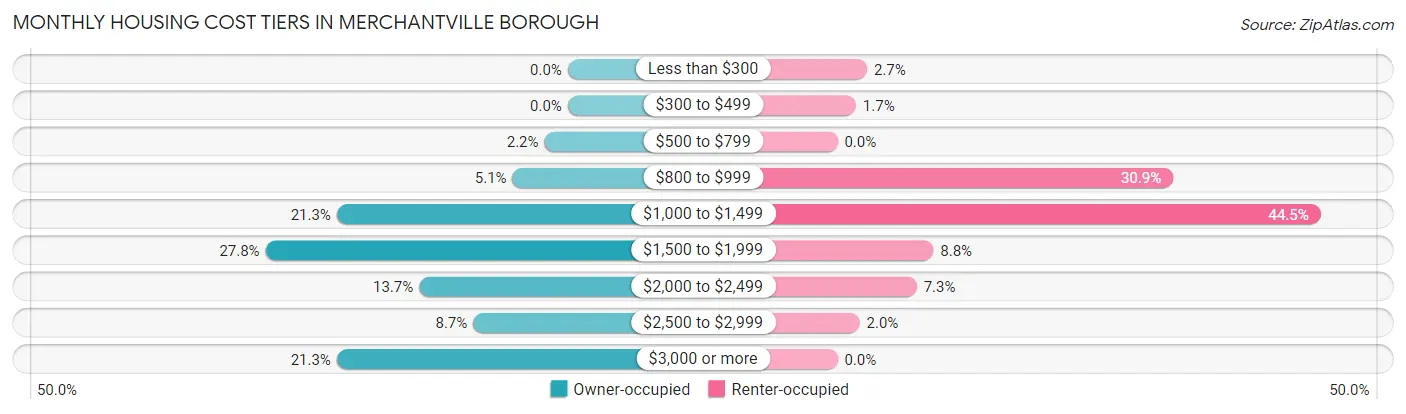
| Monthly Cost | Owner-occupied | Renter-occupied |
| Less than $300 | 0 (0.0%) | 16 (2.7%) |
| $300 to $499 | 0 (0.0%) | 10 (1.7%) |
| $500 to $799 | 19 (2.1%) | 0 (0.0%) |
| $800 to $999 | 45 (5.1%) | 182 (30.9%) |
| $1,000 to $1,499 | 188 (21.3%) | 262 (44.5%) |
| $1,500 to $1,999 | 246 (27.8%) | 52 (8.8%) |
| $2,000 to $2,499 | 121 (13.7%) | 43 (7.3%) |
| $2,500 to $2,999 | 77 (8.7%) | 12 (2.0%) |
| $3,000 or more | 188 (21.3%) | 0 (0.0%) |
| Total | 884 (100.0%) | 589 (100.0%) |
Physical Housing Characteristics in Merchantville borough
Housing Structures in Merchantville borough
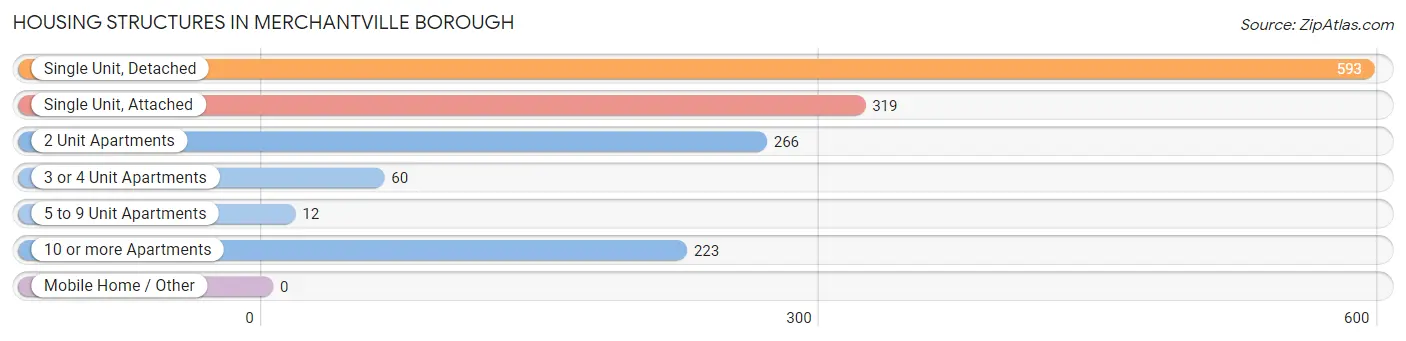
| Structure Type | # Housing Units | % Housing Units |
| Single Unit, Detached | 593 | 40.3% |
| Single Unit, Attached | 319 | 21.7% |
| 2 Unit Apartments | 266 | 18.1% |
| 3 or 4 Unit Apartments | 60 | 4.1% |
| 5 to 9 Unit Apartments | 12 | 0.8% |
| 10 or more Apartments | 223 | 15.1% |
| Mobile Home / Other | 0 | 0.0% |
| Total | 1,473 | 100.0% |
Housing Structures by Occupancy in Merchantville borough
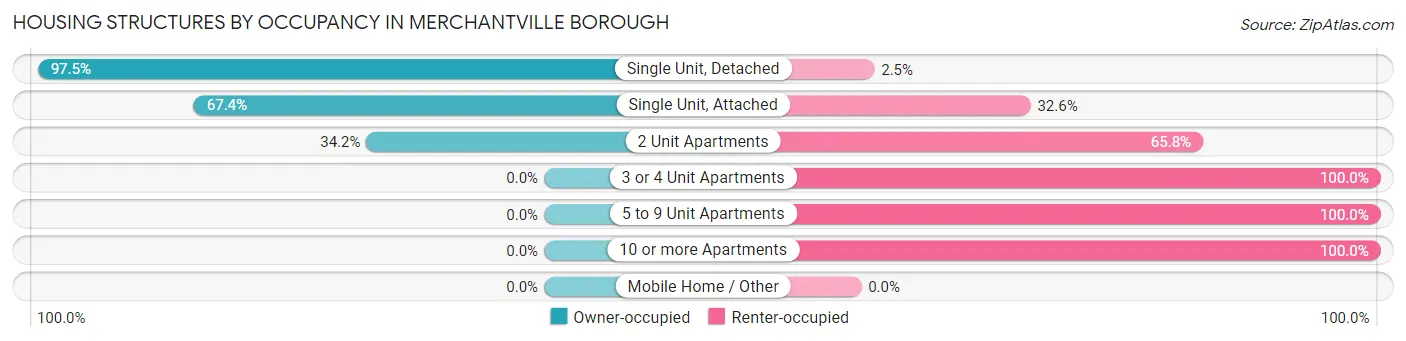
| Structure Type | Owner-occupied | Renter-occupied |
| Single Unit, Detached | 578 (97.5%) | 15 (2.5%) |
| Single Unit, Attached | 215 (67.4%) | 104 (32.6%) |
| 2 Unit Apartments | 91 (34.2%) | 175 (65.8%) |
| 3 or 4 Unit Apartments | 0 (0.0%) | 60 (100.0%) |
| 5 to 9 Unit Apartments | 0 (0.0%) | 12 (100.0%) |
| 10 or more Apartments | 0 (0.0%) | 223 (100.0%) |
| Mobile Home / Other | 0 (0.0%) | 0 (0.0%) |
| Total | 884 (60.0%) | 589 (40.0%) |
Housing Structures by Number of Rooms in Merchantville borough
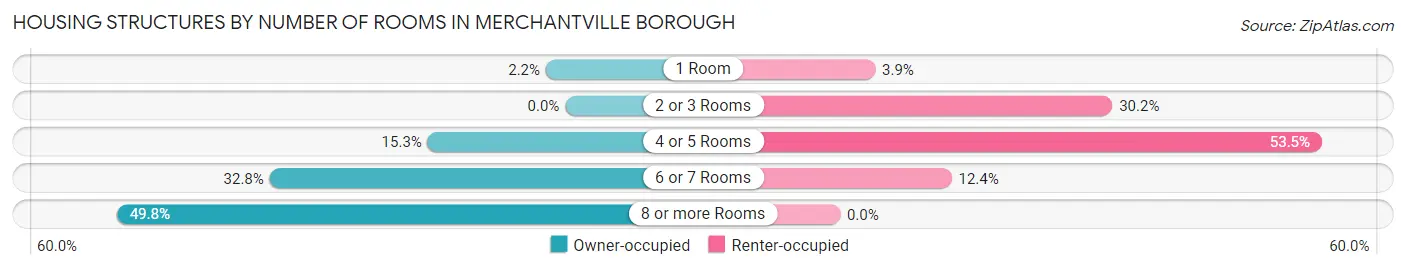
| Number of Rooms | Owner-occupied | Renter-occupied |
| 1 Room | 19 (2.1%) | 23 (3.9%) |
| 2 or 3 Rooms | 0 (0.0%) | 178 (30.2%) |
| 4 or 5 Rooms | 135 (15.3%) | 315 (53.5%) |
| 6 or 7 Rooms | 290 (32.8%) | 73 (12.4%) |
| 8 or more Rooms | 440 (49.8%) | 0 (0.0%) |
| Total | 884 (100.0%) | 589 (100.0%) |
Housing Structure by Heating Type in Merchantville borough
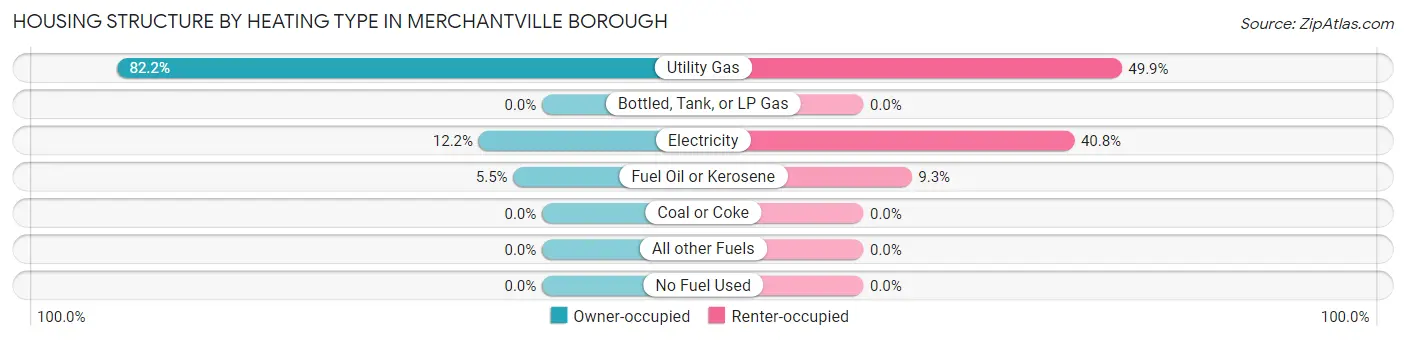
| Heating Type | Owner-occupied | Renter-occupied |
| Utility Gas | 727 (82.2%) | 294 (49.9%) |
| Bottled, Tank, or LP Gas | 0 (0.0%) | 0 (0.0%) |
| Electricity | 108 (12.2%) | 240 (40.7%) |
| Fuel Oil or Kerosene | 49 (5.5%) | 55 (9.3%) |
| Coal or Coke | 0 (0.0%) | 0 (0.0%) |
| All other Fuels | 0 (0.0%) | 0 (0.0%) |
| No Fuel Used | 0 (0.0%) | 0 (0.0%) |
| Total | 884 (100.0%) | 589 (100.0%) |
Household Vehicle Usage in Merchantville borough
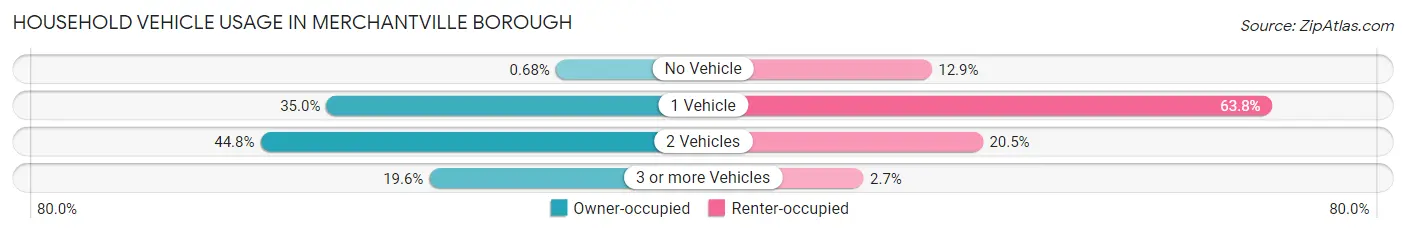
| Vehicles per Household | Owner-occupied | Renter-occupied |
| No Vehicle | 6 (0.7%) | 76 (12.9%) |
| 1 Vehicle | 309 (34.9%) | 376 (63.8%) |
| 2 Vehicles | 396 (44.8%) | 121 (20.5%) |
| 3 or more Vehicles | 173 (19.6%) | 16 (2.7%) |
| Total | 884 (100.0%) | 589 (100.0%) |
Real Estate & Mortgages in Merchantville borough
Real Estate and Mortgage Overview in Merchantville borough
| Characteristic | Without Mortgage | With Mortgage |
| Housing Units | 196 | 688 |
| Median Property Value | $242,900 | $301,300 |
| Median Household Income | $84,107 | $297 |
| Monthly Housing Costs | $1,175 | $188 |
| Real Estate Taxes | $9,357 | $0 |
Property Value by Mortgage Status in Merchantville borough
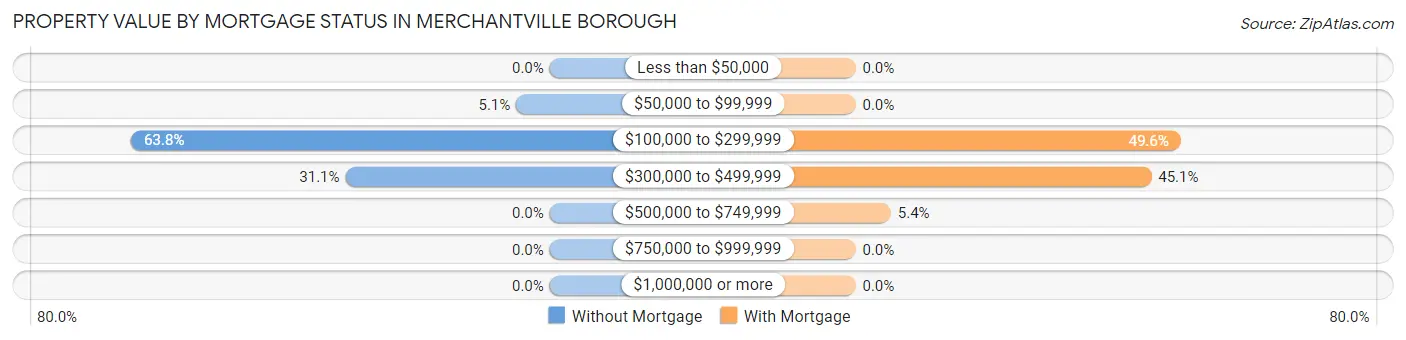
| Property Value | Without Mortgage | With Mortgage |
| Less than $50,000 | 0 (0.0%) | 0 (0.0%) |
| $50,000 to $99,999 | 10 (5.1%) | 0 (0.0%) |
| $100,000 to $299,999 | 125 (63.8%) | 341 (49.6%) |
| $300,000 to $499,999 | 61 (31.1%) | 310 (45.1%) |
| $500,000 to $749,999 | 0 (0.0%) | 37 (5.4%) |
| $750,000 to $999,999 | 0 (0.0%) | 0 (0.0%) |
| $1,000,000 or more | 0 (0.0%) | 0 (0.0%) |
| Total | 196 (100.0%) | 688 (100.0%) |
Household Income by Mortgage Status in Merchantville borough
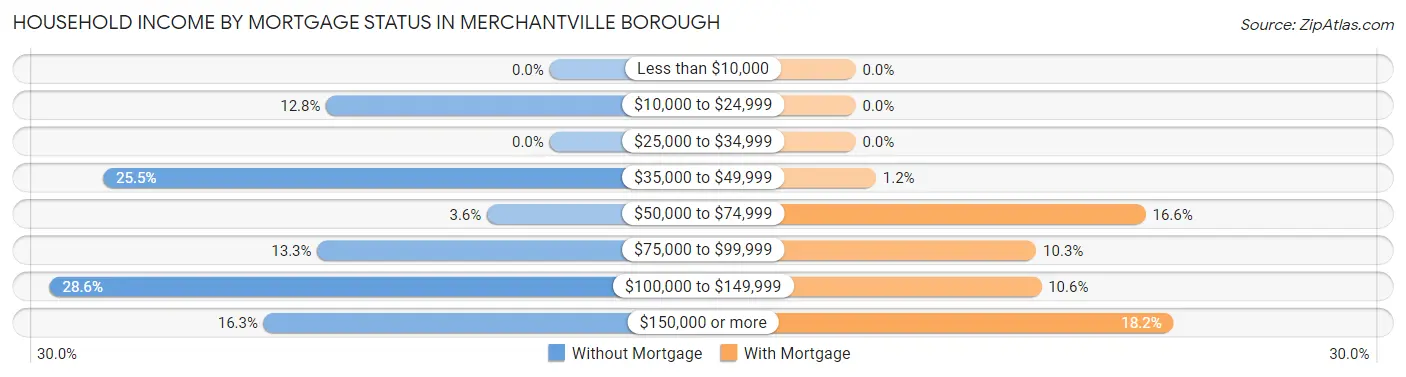
| Household Income | Without Mortgage | With Mortgage |
| Less than $10,000 | 0 (0.0%) | 0 (0.0%) |
| $10,000 to $24,999 | 25 (12.8%) | 0 (0.0%) |
| $25,000 to $34,999 | 0 (0.0%) | 0 (0.0%) |
| $35,000 to $49,999 | 50 (25.5%) | 8 (1.2%) |
| $50,000 to $74,999 | 7 (3.6%) | 114 (16.6%) |
| $75,000 to $99,999 | 26 (13.3%) | 71 (10.3%) |
| $100,000 to $149,999 | 56 (28.6%) | 73 (10.6%) |
| $150,000 or more | 32 (16.3%) | 125 (18.2%) |
| Total | 196 (100.0%) | 688 (100.0%) |
Property Value to Household Income Ratio in Merchantville borough
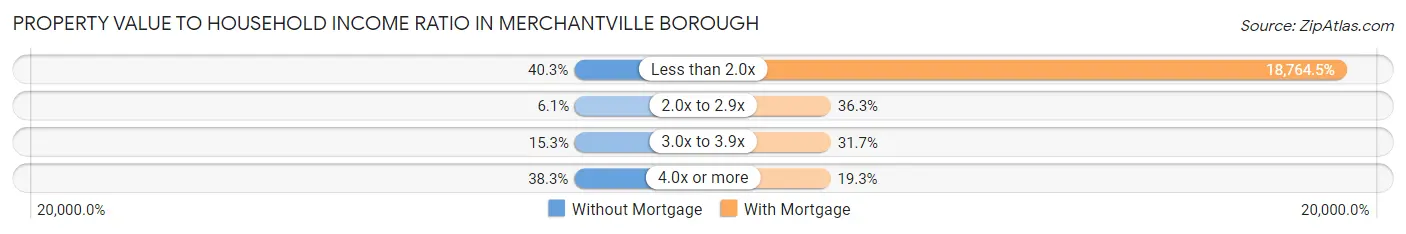
| Value-to-Income Ratio | Without Mortgage | With Mortgage |
| Less than 2.0x | 79 (40.3%) | 129,100 (18,764.5%) |
| 2.0x to 2.9x | 12 (6.1%) | 250 (36.3%) |
| 3.0x to 3.9x | 30 (15.3%) | 218 (31.7%) |
| 4.0x or more | 75 (38.3%) | 133 (19.3%) |
| Total | 196 (100.0%) | 688 (100.0%) |
Real Estate Taxes by Mortgage Status in Merchantville borough
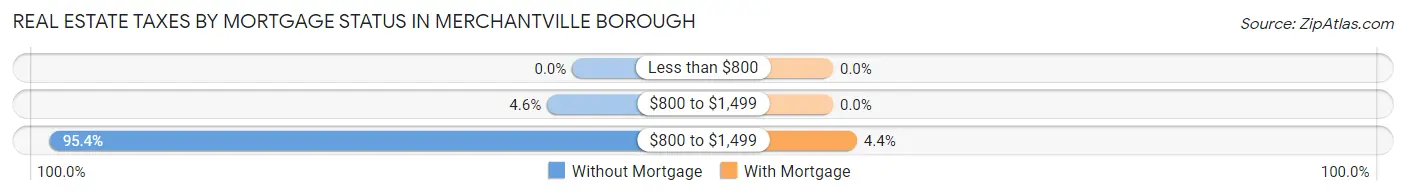
| Property Taxes | Without Mortgage | With Mortgage |
| Less than $800 | 0 (0.0%) | 0 (0.0%) |
| $800 to $1,499 | 9 (4.6%) | 0 (0.0%) |
| $800 to $1,499 | 187 (95.4%) | 30 (4.4%) |
| Total | 196 (100.0%) | 688 (100.0%) |
Health & Disability in Merchantville borough
Health Insurance Coverage by Age in Merchantville borough
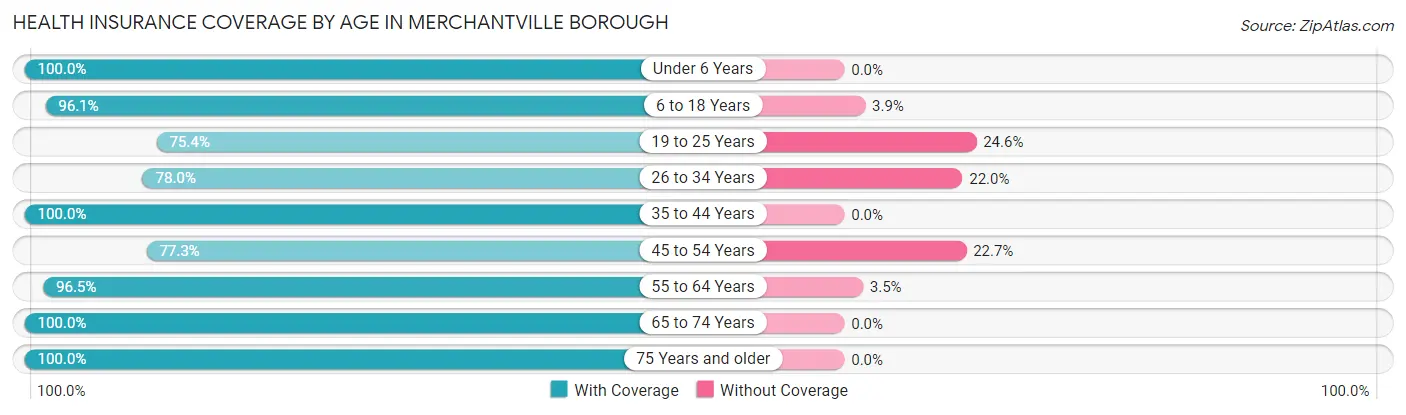
| Age Bracket | With Coverage | Without Coverage |
| Under 6 Years | 264 (100.0%) | 0 (0.0%) |
| 6 to 18 Years | 744 (96.1%) | 30 (3.9%) |
| 19 to 25 Years | 187 (75.4%) | 61 (24.6%) |
| 26 to 34 Years | 326 (78.0%) | 92 (22.0%) |
| 35 to 44 Years | 633 (100.0%) | 0 (0.0%) |
| 45 to 54 Years | 391 (77.3%) | 115 (22.7%) |
| 55 to 64 Years | 335 (96.5%) | 12 (3.5%) |
| 65 to 74 Years | 259 (100.0%) | 0 (0.0%) |
| 75 Years and older | 351 (100.0%) | 0 (0.0%) |
| Total | 3,490 (91.8%) | 310 (8.2%) |
Health Insurance Coverage by Citizenship Status in Merchantville borough
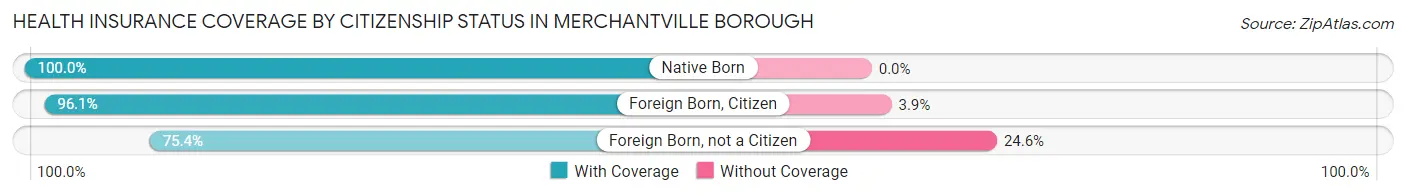
| Citizenship Status | With Coverage | Without Coverage |
| Native Born | 264 (100.0%) | 0 (0.0%) |
| Foreign Born, Citizen | 744 (96.1%) | 30 (3.9%) |
| Foreign Born, not a Citizen | 187 (75.4%) | 61 (24.6%) |
Health Insurance Coverage by Household Income in Merchantville borough
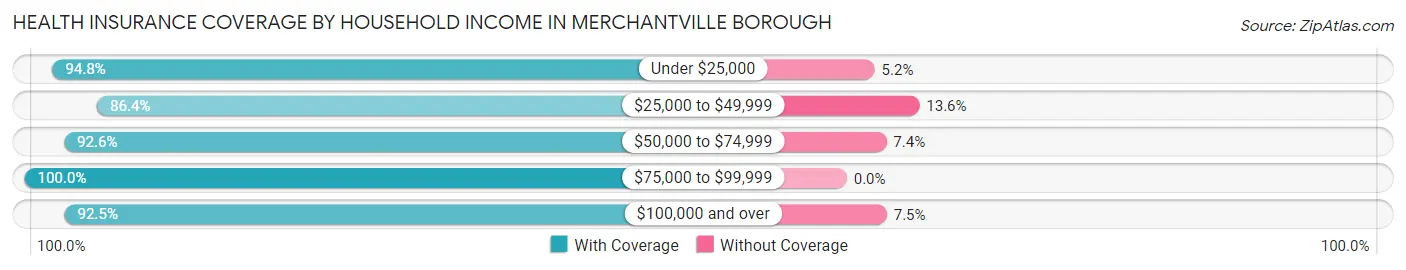
| Household Income | With Coverage | Without Coverage |
| Under $25,000 | 218 (94.8%) | 12 (5.2%) |
| $25,000 to $49,999 | 756 (86.4%) | 119 (13.6%) |
| $50,000 to $74,999 | 499 (92.6%) | 40 (7.4%) |
| $75,000 to $99,999 | 281 (100.0%) | 0 (0.0%) |
| $100,000 and over | 1,717 (92.5%) | 139 (7.5%) |
Public vs Private Health Insurance Coverage by Age in Merchantville borough
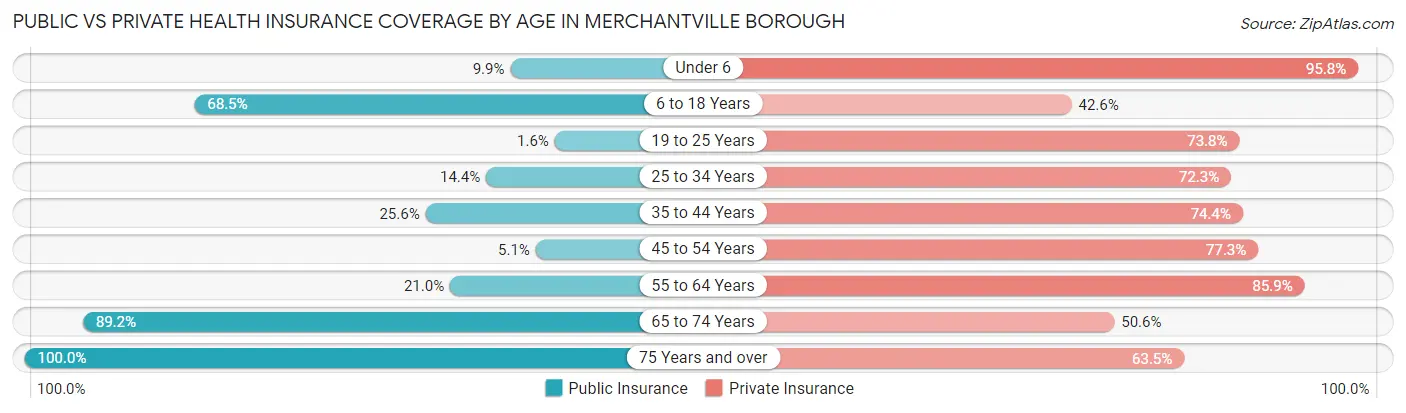
| Age Bracket | Public Insurance | Private Insurance |
| Under 6 | 26 (9.9%) | 253 (95.8%) |
| 6 to 18 Years | 530 (68.5%) | 330 (42.6%) |
| 19 to 25 Years | 4 (1.6%) | 183 (73.8%) |
| 25 to 34 Years | 60 (14.3%) | 302 (72.3%) |
| 35 to 44 Years | 162 (25.6%) | 471 (74.4%) |
| 45 to 54 Years | 26 (5.1%) | 391 (77.3%) |
| 55 to 64 Years | 73 (21.0%) | 298 (85.9%) |
| 65 to 74 Years | 231 (89.2%) | 131 (50.6%) |
| 75 Years and over | 351 (100.0%) | 223 (63.5%) |
| Total | 1,463 (38.5%) | 2,582 (67.9%) |
Disability Status by Sex by Age in Merchantville borough
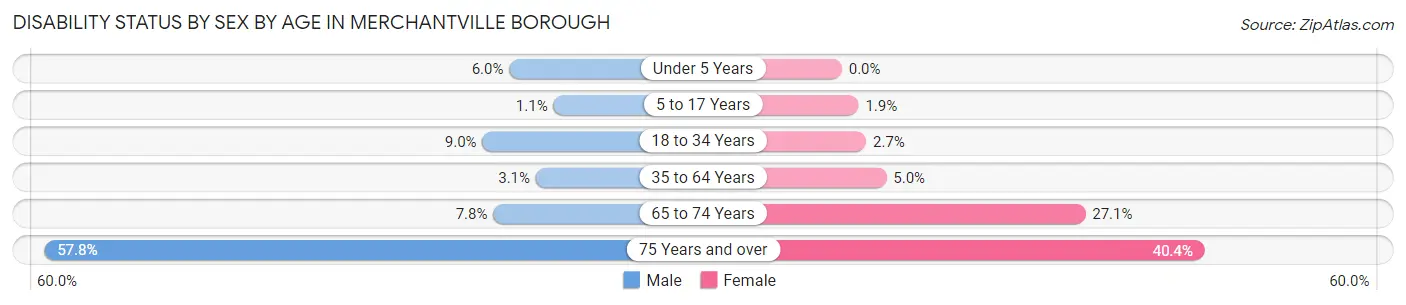
| Age Bracket | Male | Female |
| Under 5 Years | 10 (6.0%) | 0 (0.0%) |
| 5 to 17 Years | 3 (1.1%) | 7 (1.9%) |
| 18 to 34 Years | 51 (9.0%) | 7 (2.7%) |
| 35 to 64 Years | 22 (3.1%) | 38 (5.0%) |
| 65 to 74 Years | 11 (7.8%) | 32 (27.1%) |
| 75 Years and over | 37 (57.8%) | 116 (40.4%) |
Disability Class by Sex by Age in Merchantville borough
Disability Class: Hearing Difficulty
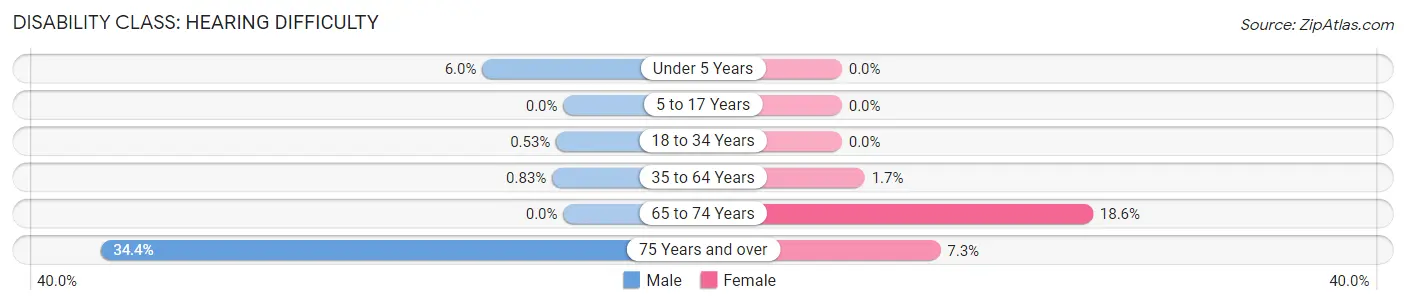
| Age Bracket | Male | Female |
| Under 5 Years | 10 (6.0%) | 0 (0.0%) |
| 5 to 17 Years | 0 (0.0%) | 0 (0.0%) |
| 18 to 34 Years | 3 (0.5%) | 0 (0.0%) |
| 35 to 64 Years | 6 (0.8%) | 13 (1.7%) |
| 65 to 74 Years | 0 (0.0%) | 22 (18.6%) |
| 75 Years and over | 22 (34.4%) | 21 (7.3%) |
Disability Class: Vision Difficulty
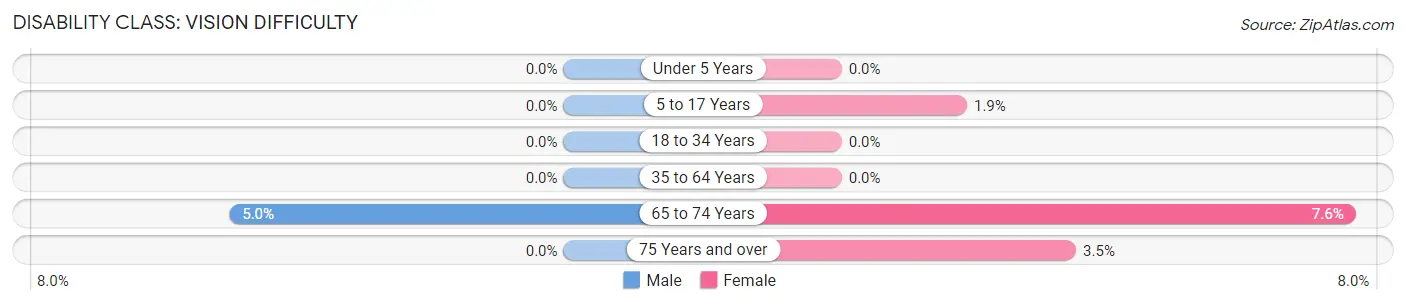
| Age Bracket | Male | Female |
| Under 5 Years | 0 (0.0%) | 0 (0.0%) |
| 5 to 17 Years | 0 (0.0%) | 7 (1.9%) |
| 18 to 34 Years | 0 (0.0%) | 0 (0.0%) |
| 35 to 64 Years | 0 (0.0%) | 0 (0.0%) |
| 65 to 74 Years | 7 (5.0%) | 9 (7.6%) |
| 75 Years and over | 0 (0.0%) | 10 (3.5%) |
Disability Class: Cognitive Difficulty
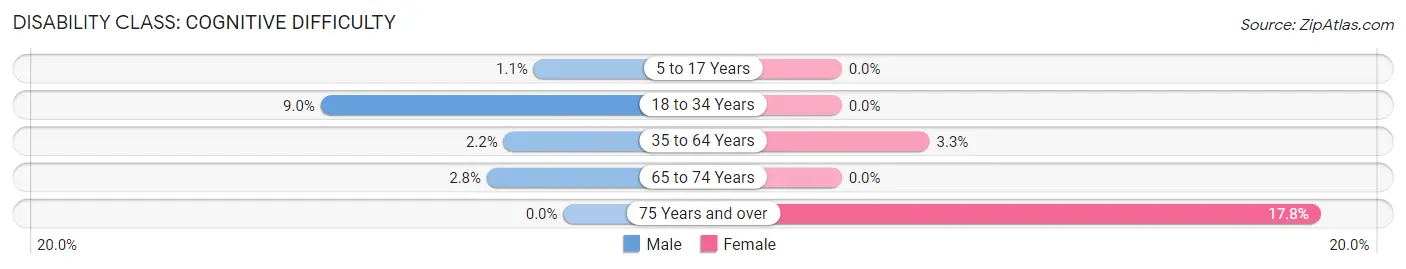
| Age Bracket | Male | Female |
| 5 to 17 Years | 3 (1.1%) | 0 (0.0%) |
| 18 to 34 Years | 51 (9.0%) | 0 (0.0%) |
| 35 to 64 Years | 16 (2.2%) | 25 (3.3%) |
| 65 to 74 Years | 4 (2.8%) | 0 (0.0%) |
| 75 Years and over | 0 (0.0%) | 51 (17.8%) |
Disability Class: Ambulatory Difficulty
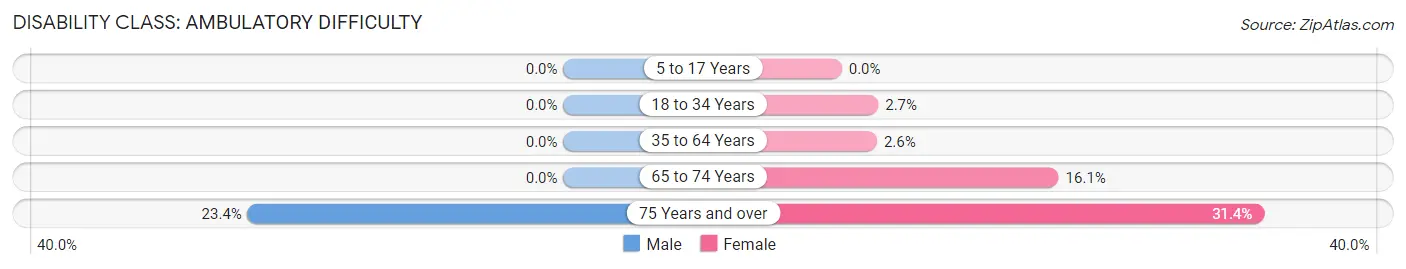
| Age Bracket | Male | Female |
| 5 to 17 Years | 0 (0.0%) | 0 (0.0%) |
| 18 to 34 Years | 0 (0.0%) | 7 (2.7%) |
| 35 to 64 Years | 0 (0.0%) | 20 (2.6%) |
| 65 to 74 Years | 0 (0.0%) | 19 (16.1%) |
| 75 Years and over | 15 (23.4%) | 90 (31.4%) |
Disability Class: Self-Care Difficulty
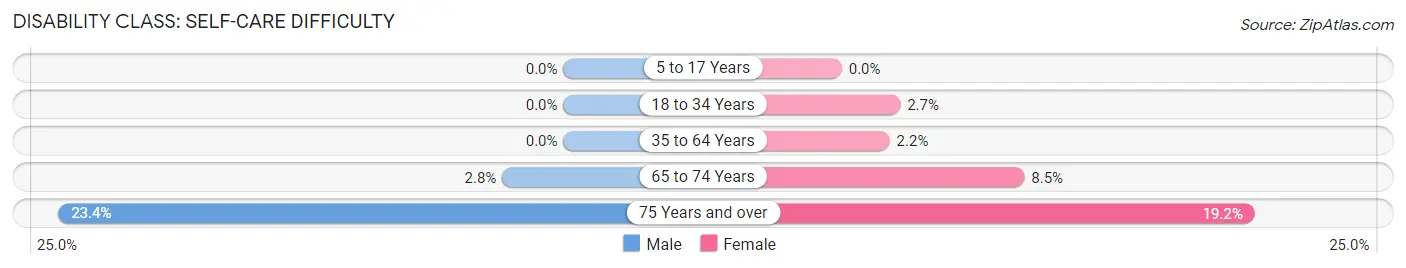
| Age Bracket | Male | Female |
| 5 to 17 Years | 0 (0.0%) | 0 (0.0%) |
| 18 to 34 Years | 0 (0.0%) | 7 (2.7%) |
| 35 to 64 Years | 0 (0.0%) | 17 (2.2%) |
| 65 to 74 Years | 4 (2.8%) | 10 (8.5%) |
| 75 Years and over | 15 (23.4%) | 55 (19.2%) |
Technology Access in Merchantville borough
Computing Device Access in Merchantville borough
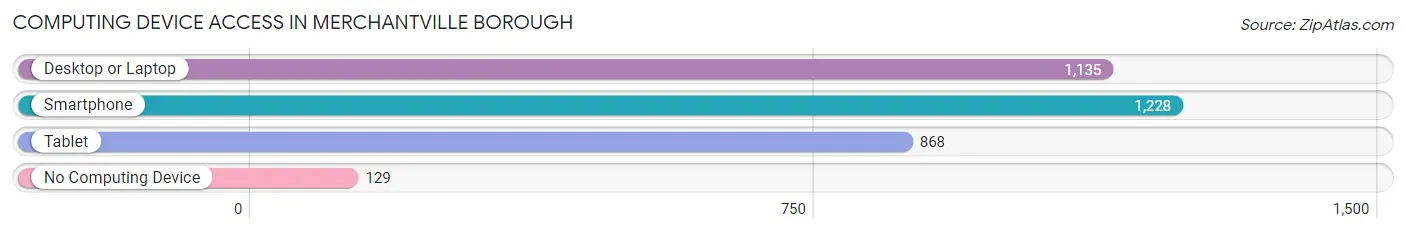
| Device Type | # Households | % Households |
| Desktop or Laptop | 1,135 | 77.0% |
| Smartphone | 1,228 | 83.4% |
| Tablet | 868 | 58.9% |
| No Computing Device | 129 | 8.8% |
| Total | 1,473 | 100.0% |
Internet Access in Merchantville borough
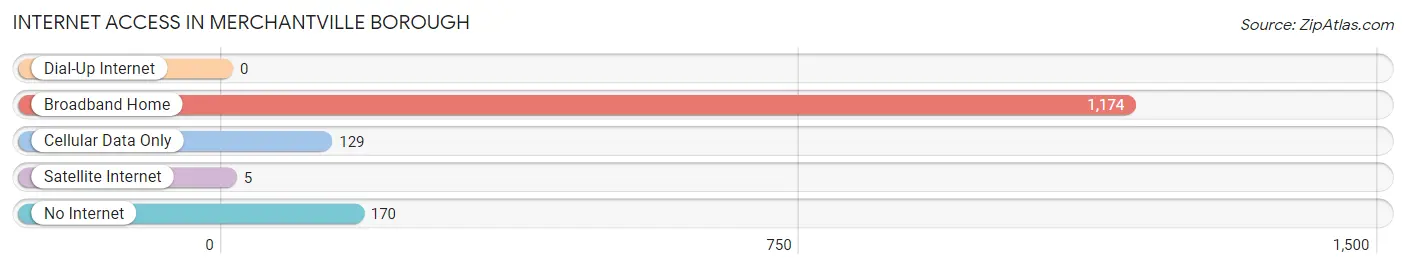
| Internet Type | # Households | % Households |
| Dial-Up Internet | 0 | 0.0% |
| Broadband Home | 1,174 | 79.7% |
| Cellular Data Only | 129 | 8.8% |
| Satellite Internet | 5 | 0.3% |
| No Internet | 170 | 11.5% |
| Total | 1,473 | 100.0% |
Merchantville borough Summary
Merchantville Borough is a small borough located in Camden County, New Jersey. It is situated on the north side of the Delaware River, just south of Philadelphia. The borough was incorporated in 1891 and is home to a population of approximately 3,800 people.
Geography
Merchantville Borough is located in the center of Camden County, New Jersey. It is bordered by Pennsauken Township to the north, Cherry Hill Township to the east, Pennsauken Township to the south, and the City of Camden to the west. The borough is situated on the north side of the Delaware River, just south of Philadelphia. The total area of the borough is 0.8 square miles, with 0.7 square miles of land and 0.1 square miles of water. The borough is located in the humid subtropical climate zone, with hot, humid summers and cold, wet winters.
History
Merchantville Borough was originally part of the Township of Stockton, which was established in 1844. In 1891, the borough was incorporated as a separate municipality. The borough was named after the Merchant family, who were prominent landowners in the area. The borough was originally a rural farming community, but in the early 20th century, it began to develop into a residential suburb of Philadelphia. The borough was home to a number of large estates, including the Merchant Estate, which was built in 1891 and is now listed on the National Register of Historic Places.
Economy
The economy of Merchantville Borough is largely based on retail and services. The borough is home to a number of small businesses, including restaurants, shops, and professional services. The borough is also home to a number of large employers, including the Camden County Board of Social Services, the Camden County Health Department, and the Camden County Office of Emergency Management.
Demographics
As of the 2010 census, the population of Merchantville Borough was 3,821. The racial makeup of the borough was 79.2% White, 11.3% African American, 0.3% Native American, 2.2% Asian, and 6.9% from other races. Hispanic or Latino of any race were 8.3% of the population. The median household income was $60,938, and the median family income was $71,917. The per capita income was $27,945.
Conclusion
Merchantville Borough is a small borough located in Camden County, New Jersey. It is situated on the north side of the Delaware River, just south of Philadelphia. The borough was incorporated in 1891 and is home to a population of approximately 3,800 people. The economy of Merchantville Borough is largely based on retail and services, and the borough is home to a number of small businesses and large employers. The racial makeup of the borough is 79.2% White, 11.3% African American, 0.3% Native American, 2.2% Asian, and 6.9% from other races. The median household income was $60,938, and the median family income was $71,917.
Common Questions
What is the Total Population of Merchantville borough?
Total Population of Merchantville borough is 3,800.
What is the Total Male Population of Merchantville borough?
Total Male Population of Merchantville borough is 1,930.
What is the Total Female Population of Merchantville borough?
Total Female Population of Merchantville borough is 1,870.
What is the Ratio of Males per 100 Females in Merchantville borough?
There are 103.21 Males per 100 Females in Merchantville borough.
What is the Ratio of Females per 100 Males in Merchantville borough?
There are 96.89 Females per 100 Males in Merchantville borough.
What is the Median Population Age in Merchantville borough?
Median Population Age in Merchantville borough is 36.7 Years.
What is the Average Family Size in Merchantville borough
Average Family Size in Merchantville borough is 3.2 People.
What is the Average Household Size in Merchantville borough
Average Household Size in Merchantville borough is 2.6 People.
What is Per Capita Income in Merchantville borough?
Per Capita income in Merchantville borough is $41,244.
What is the Median Family Income in Merchantville borough?
Median Family Income in Merchantville borough is $122,083.
What is the Median Household income in Merchantville borough?
Median Household Income in Merchantville borough is $72,375.
What is Income or Wage Gap in Merchantville borough?
Income or Wage Gap in Merchantville borough is 1.7%.
Women in Merchantville borough earn 98.3 cents for every dollar earned by a man.
What is Inequality or Gini Index in Merchantville borough?
Inequality or Gini Index in Merchantville borough is 0.46.
How Large is the Labor Force in Merchantville borough?
There are 2,144 People in the Labor Forcein in Merchantville borough.
What is the Percentage of People in the Labor Force in Merchantville borough?
69.6% of People are in the Labor Force in Merchantville borough.
What is the Unemployment Rate in Merchantville borough?
Unemployment Rate in Merchantville borough is 2.5%.