Westville borough, NJ
Westville borough Overview
4,276
TOTAL POPULATION
2,019
MALE POPULATION
2,257
FEMALE POPULATION
89.46
MALES / 100 FEMALES
111.79
FEMALES / 100 MALES
41.8
MEDIAN AGE
3.0
AVG FAMILY SIZE
2.2
AVG HOUSEHOLD SIZE
$37,296
PER CAPITA INCOME
$88,354
AVG FAMILY INCOME
$63,000
AVG HOUSEHOLD INCOME
6.4%
WAGE / INCOME GAP [ % ]
93.6¢/ $1
WAGE / INCOME GAP [ $ ]
0.47
INEQUALITY / GINI INDEX
2,385
LABOR FORCE [ PEOPLE ]
69.3%
PERCENT IN LABOR FORCE
6.3%
UNEMPLOYMENT RATE
Race in Westville borough
The most populous races in Westville borough are White / Caucasian (3,020 | 70.6%), Black / African American (779 | 18.2%), and Hispanic or Latino (407 | 9.5%).
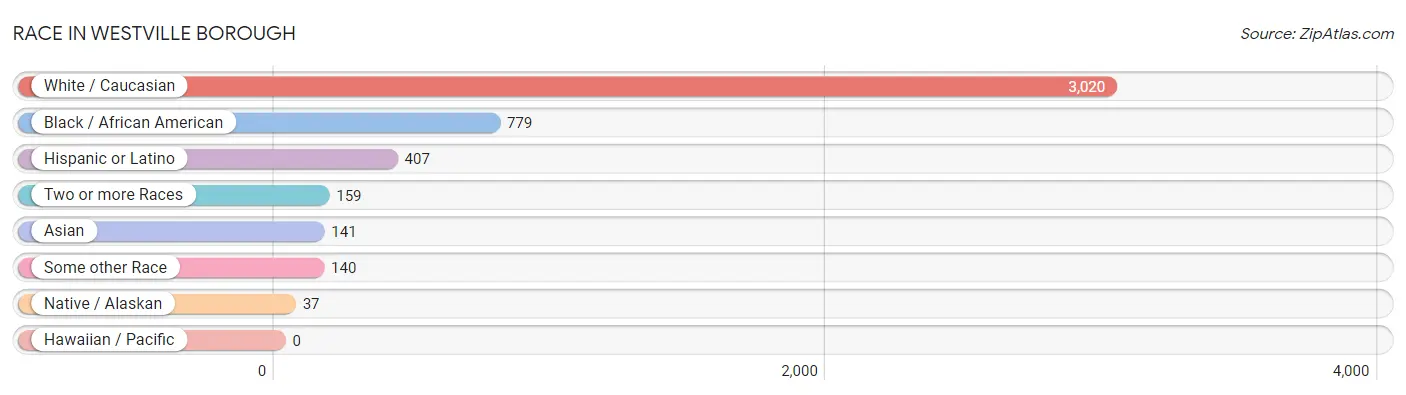
| Race | # Population | % Population |
| Asian | 141 | 3.3% |
| Black / African American | 779 | 18.2% |
| Hawaiian / Pacific | 0 | 0.0% |
| Hispanic or Latino | 407 | 9.5% |
| Native / Alaskan | 37 | 0.9% |
| White / Caucasian | 3,020 | 70.6% |
| Two or more Races | 159 | 3.7% |
| Some other Race | 140 | 3.3% |
| Total | 4,276 | 100.0% |
Ancestry in Westville borough
The most populous ancestries reported in Westville borough are Irish (978 | 22.9%), German (794 | 18.6%), Italian (518 | 12.1%), English (265 | 6.2%), and Polish (247 | 5.8%), together accounting for 65.5% of all Westville borough residents.
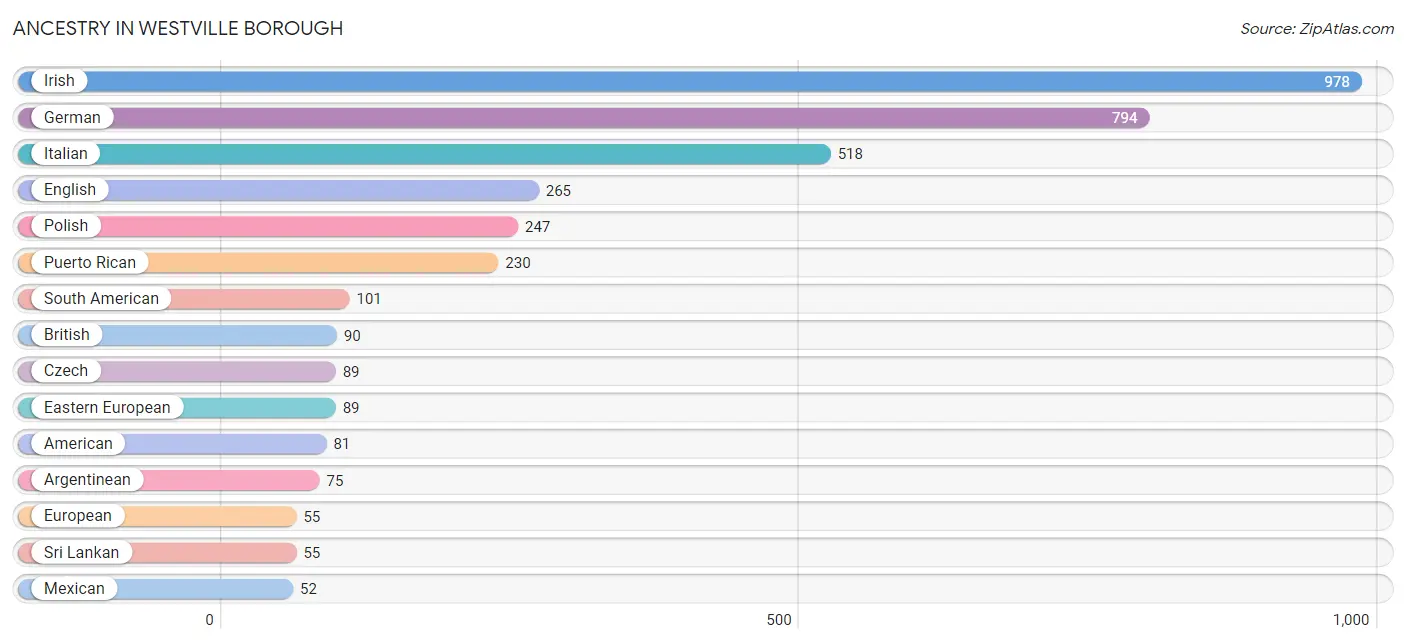
| Ancestry | # Population | % Population |
| African | 42 | 1.0% |
| American | 81 | 1.9% |
| Argentinean | 75 | 1.8% |
| Austrian | 6 | 0.1% |
| British | 90 | 2.1% |
| Central American | 10 | 0.2% |
| Central American Indian | 27 | 0.6% |
| Cherokee | 13 | 0.3% |
| Colombian | 13 | 0.3% |
| Czech | 89 | 2.1% |
| Danish | 7 | 0.2% |
| Dominican | 14 | 0.3% |
| Dutch | 8 | 0.2% |
| Eastern European | 89 | 2.1% |
| English | 265 | 6.2% |
| European | 55 | 1.3% |
| French | 14 | 0.3% |
| French Canadian | 12 | 0.3% |
| German | 794 | 18.6% |
| Greek | 30 | 0.7% |
| Guatemalan | 10 | 0.2% |
| Hungarian | 7 | 0.2% |
| Irish | 978 | 22.9% |
| Italian | 518 | 12.1% |
| Jamaican | 32 | 0.7% |
| Korean | 1 | 0.0% |
| Lithuanian | 38 | 0.9% |
| Mexican | 52 | 1.2% |
| Norwegian | 23 | 0.5% |
| Pakistani | 12 | 0.3% |
| Pennsylvania German | 10 | 0.2% |
| Polish | 247 | 5.8% |
| Puerto Rican | 230 | 5.4% |
| Russian | 10 | 0.2% |
| Scotch-Irish | 10 | 0.2% |
| Scottish | 23 | 0.5% |
| South American | 101 | 2.4% |
| Sri Lankan | 55 | 1.3% |
| Subsaharan African | 42 | 1.0% |
| Swedish | 14 | 0.3% |
| Swiss | 4 | 0.1% |
| Ukrainian | 13 | 0.3% |
| Venezuelan | 13 | 0.3% |
| Welsh | 16 | 0.4% | View All 44 Rows |
Immigrants in Westville borough
The most numerous immigrant groups reported in Westville borough came from Latin America (124 | 2.9%), Asia (110 | 2.6%), Pakistan (103 | 2.4%), South Central Asia (103 | 2.4%), and South America (55 | 1.3%), together accounting for 11.6% of all Westville borough residents.
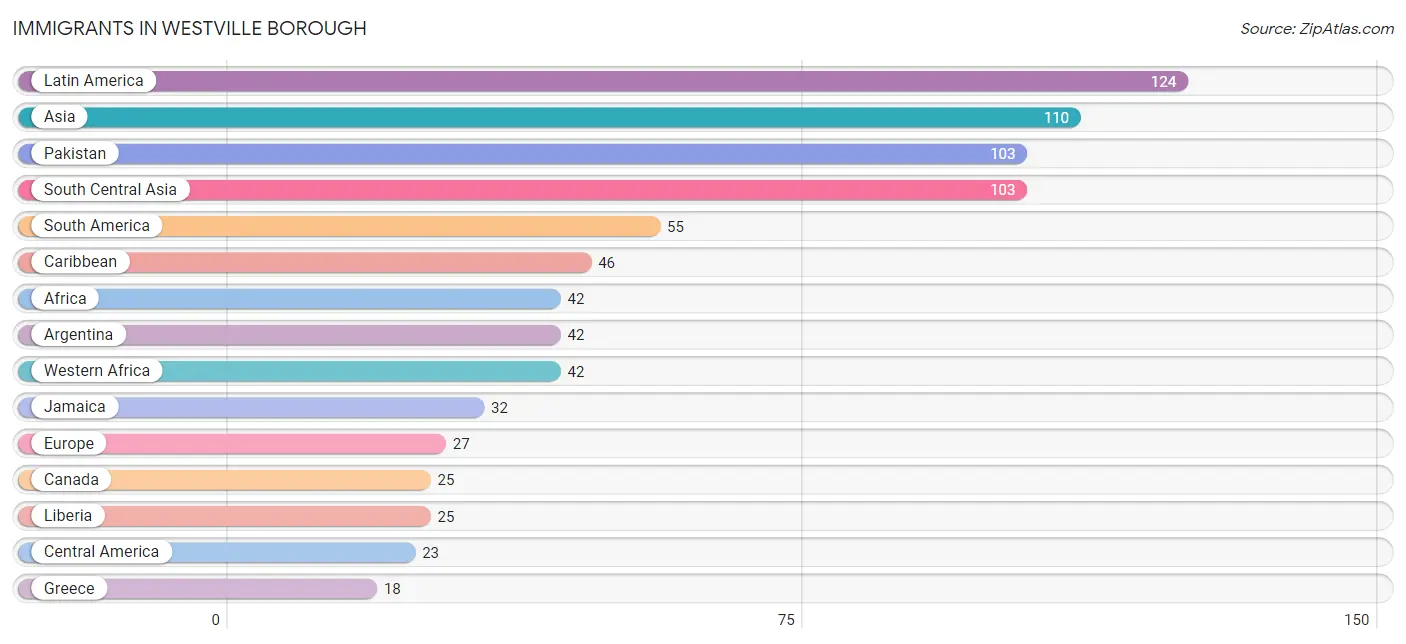
| Immigration Origin | # Population | % Population |
| Africa | 42 | 1.0% |
| Argentina | 42 | 1.0% |
| Asia | 110 | 2.6% |
| Canada | 25 | 0.6% |
| Caribbean | 46 | 1.1% |
| Central America | 23 | 0.5% |
| Colombia | 13 | 0.3% |
| Dominican Republic | 14 | 0.3% |
| Europe | 27 | 0.6% |
| Greece | 18 | 0.4% |
| Guatemala | 10 | 0.2% |
| Jamaica | 32 | 0.7% |
| Latin America | 124 | 2.9% |
| Liberia | 25 | 0.6% |
| Mexico | 13 | 0.3% |
| Netherlands | 9 | 0.2% |
| Pakistan | 103 | 2.4% |
| Philippines | 1 | 0.0% |
| South America | 55 | 1.3% |
| South Central Asia | 103 | 2.4% |
| South Eastern Asia | 7 | 0.2% |
| Southern Europe | 18 | 0.4% |
| Vietnam | 6 | 0.1% |
| Western Africa | 42 | 1.0% |
| Western Europe | 9 | 0.2% | View All 25 Rows |
Sex and Age in Westville borough
Sex and Age in Westville borough
The most populous age groups in Westville borough are 45 to 49 Years (223 | 11.1%) for men and 50 to 54 Years (274 | 12.1%) for women.
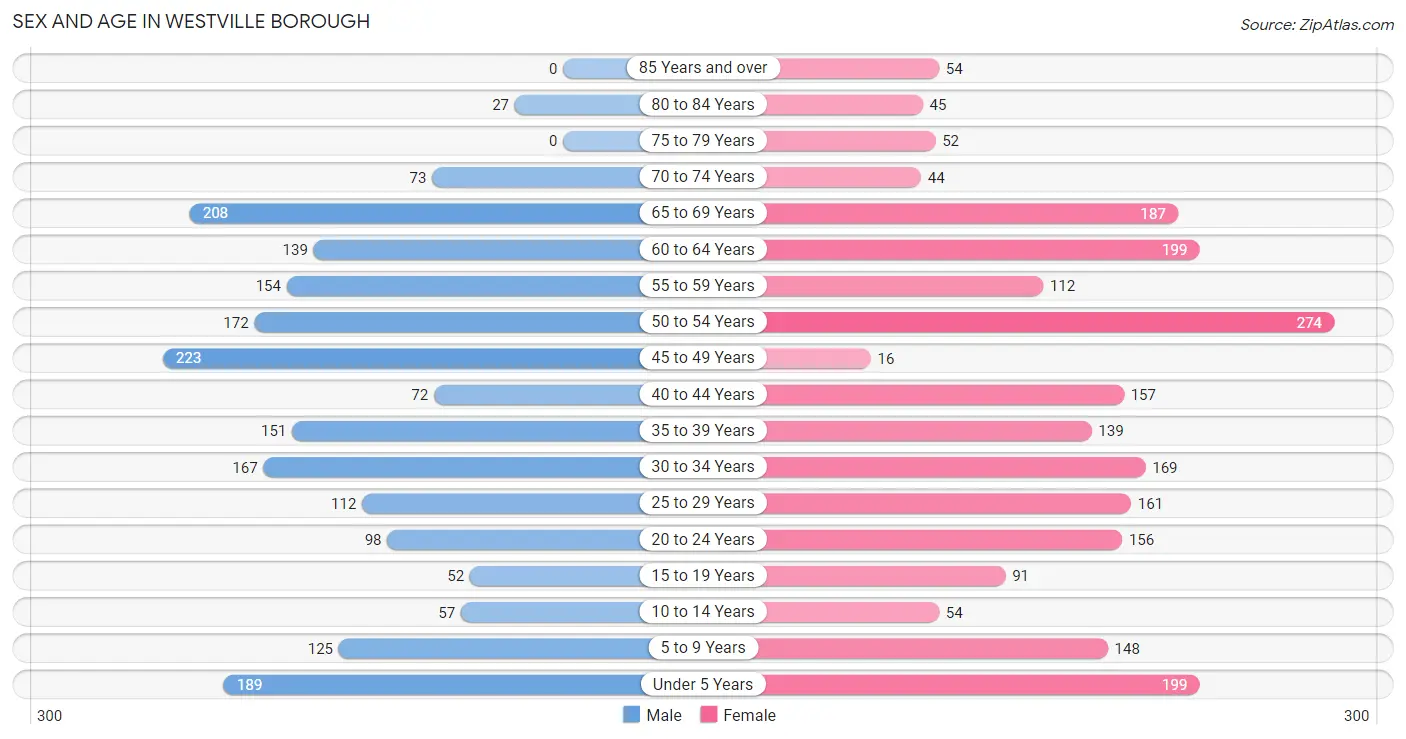
| Age Bracket | Male | Female |
| Under 5 Years | 189 (9.4%) | 199 (8.8%) |
| 5 to 9 Years | 125 (6.2%) | 148 (6.6%) |
| 10 to 14 Years | 57 (2.8%) | 54 (2.4%) |
| 15 to 19 Years | 52 (2.6%) | 91 (4.0%) |
| 20 to 24 Years | 98 (4.9%) | 156 (6.9%) |
| 25 to 29 Years | 112 (5.6%) | 161 (7.1%) |
| 30 to 34 Years | 167 (8.3%) | 169 (7.5%) |
| 35 to 39 Years | 151 (7.5%) | 139 (6.2%) |
| 40 to 44 Years | 72 (3.6%) | 157 (7.0%) |
| 45 to 49 Years | 223 (11.1%) | 16 (0.7%) |
| 50 to 54 Years | 172 (8.5%) | 274 (12.1%) |
| 55 to 59 Years | 154 (7.6%) | 112 (5.0%) |
| 60 to 64 Years | 139 (6.9%) | 199 (8.8%) |
| 65 to 69 Years | 208 (10.3%) | 187 (8.3%) |
| 70 to 74 Years | 73 (3.6%) | 44 (1.9%) |
| 75 to 79 Years | 0 (0.0%) | 52 (2.3%) |
| 80 to 84 Years | 27 (1.3%) | 45 (2.0%) |
| 85 Years and over | 0 (0.0%) | 54 (2.4%) |
| Total | 2,019 (100.0%) | 2,257 (100.0%) |
Families and Households in Westville borough
Median Family Size in Westville borough
The median family size in Westville borough is 3.02 persons per family, with married-couple families (598 | 56.3%) accounting for the largest median family size of 3.16 persons per family. On the other hand, single male/father families (106 | 10.0%) represent the smallest median family size with 2.40 persons per family.
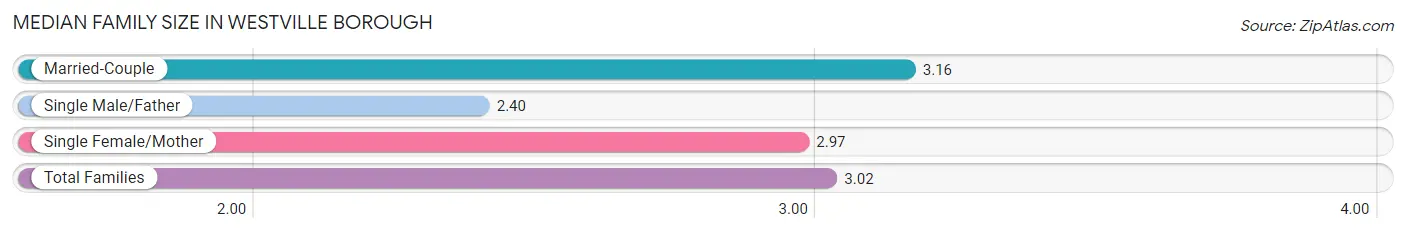
| Family Type | # Families | Family Size |
| Married-Couple | 598 (56.3%) | 3.16 |
| Single Male/Father | 106 (10.0%) | 2.40 |
| Single Female/Mother | 358 (33.7%) | 2.97 |
| Total Families | 1,062 (100.0%) | 3.02 |
Median Household Size in Westville borough
The median household size in Westville borough is 2.23 persons per household, with single female/mother households (358 | 18.7%) accounting for the largest median household size of 3.21 persons per household. non-family households (848 | 44.4%) represent the smallest median household size with 1.10 persons per household.
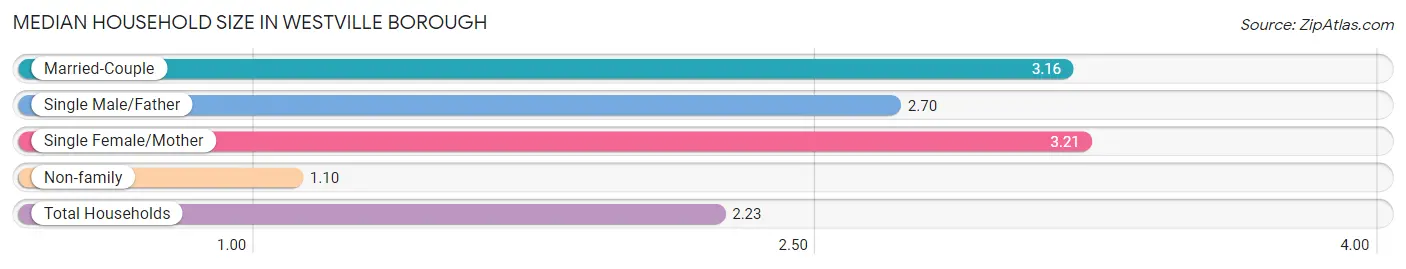
| Household Type | # Households | Household Size |
| Married-Couple | 598 (31.3%) | 3.16 |
| Single Male/Father | 106 (5.6%) | 2.70 |
| Single Female/Mother | 358 (18.7%) | 3.21 |
| Non-family | 848 (44.4%) | 1.10 |
| Total Households | 1,910 (100.0%) | 2.23 |
Household Size by Marriage Status in Westville borough
Out of a total of 1,910 households in Westville borough, 1,062 (55.6%) are family households, while 848 (44.4%) are nonfamily households. The most numerous type of family households are 2-person households, comprising 420, and the most common type of nonfamily households are 1-person households, comprising 757.
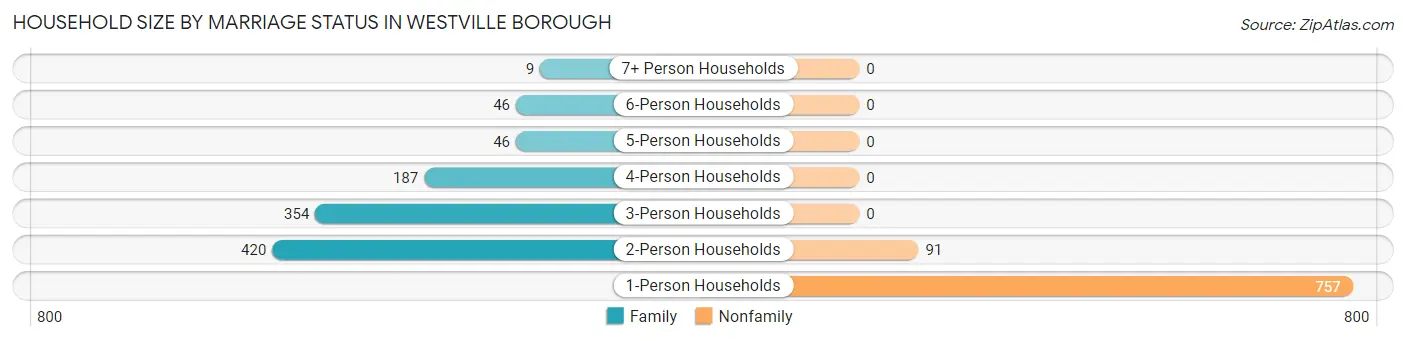
| Household Size | Family Households | Nonfamily Households |
| 1-Person Households | - | 757 (39.6%) |
| 2-Person Households | 420 (22.0%) | 91 (4.8%) |
| 3-Person Households | 354 (18.5%) | 0 (0.0%) |
| 4-Person Households | 187 (9.8%) | 0 (0.0%) |
| 5-Person Households | 46 (2.4%) | 0 (0.0%) |
| 6-Person Households | 46 (2.4%) | 0 (0.0%) |
| 7+ Person Households | 9 (0.5%) | 0 (0.0%) |
| Total | 1,062 (55.6%) | 848 (44.4%) |
Female Fertility in Westville borough
Fertility by Age in Westville borough
Average fertility rate in Westville borough is 177.0 births per 1,000 women. Women in the age bracket of 20 to 34 years have the highest fertility rate with 292.0 births per 1,000 women. Women in the age bracket of 20 to 34 years acount for 89.3% of all women with births.
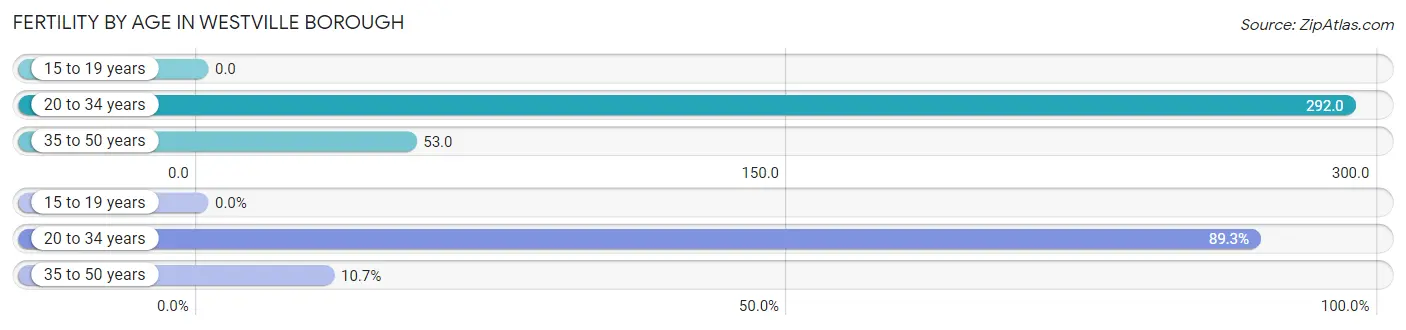
| Age Bracket | Women with Births | Births / 1,000 Women |
| 15 to 19 years | 0 (0.0%) | 0.0 |
| 20 to 34 years | 142 (89.3%) | 292.0 |
| 35 to 50 years | 17 (10.7%) | 53.0 |
| Total | 159 (100.0%) | 177.0 |
Fertility by Age by Marriage Status in Westville borough
49.7% of women with births (159) in Westville borough are married. The highest percentage of unmarried women with births falls into 35 to 50 years age bracket with 100.0% of them unmarried at the time of birth, while the lowest percentage of unmarried women with births belong to 20 to 34 years age bracket with 44.4% of them unmarried.
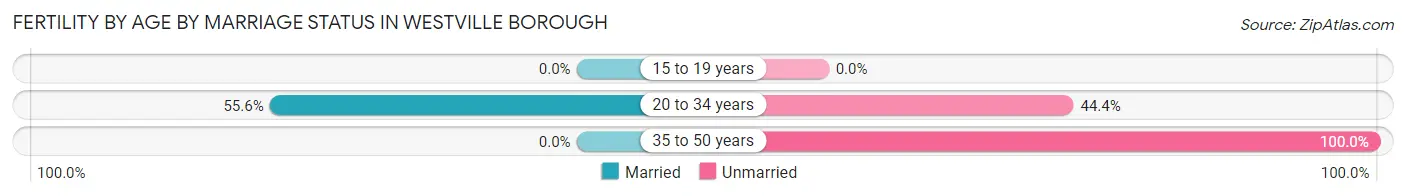
| Age Bracket | Married | Unmarried |
| 15 to 19 years | 0 (0.0%) | 0 (0.0%) |
| 20 to 34 years | 79 (55.6%) | 63 (44.4%) |
| 35 to 50 years | 0 (0.0%) | 17 (100.0%) |
| Total | 79 (49.7%) | 80 (50.3%) |
Fertility by Education in Westville borough
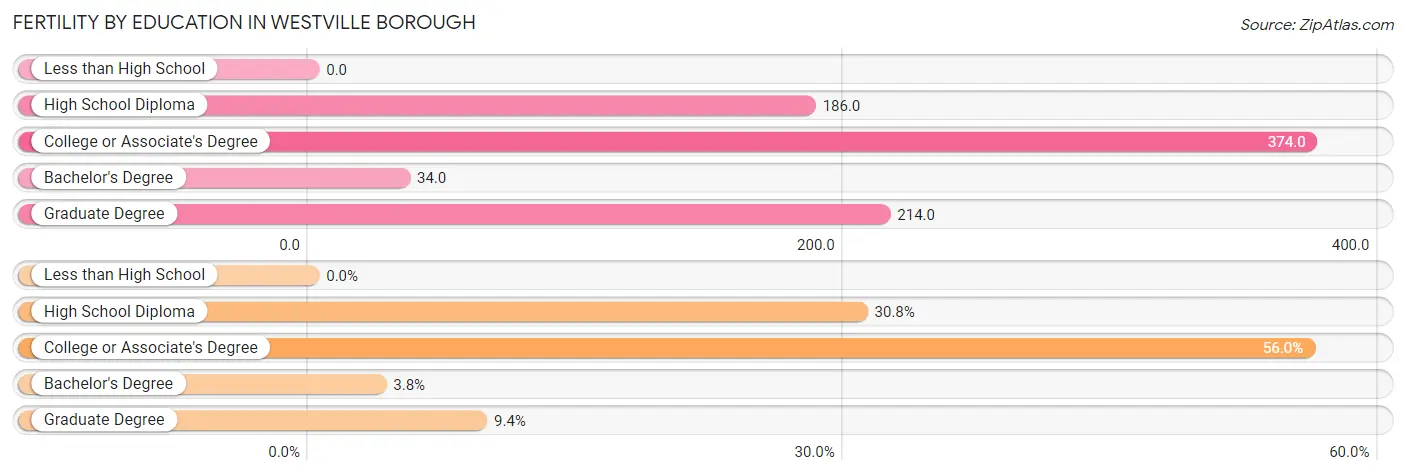
| Educational Attainment | Women with Births | Births / 1,000 Women |
| Less than High School | 0 (0.0%) | 0.0 |
| High School Diploma | 49 (30.8%) | 186.0 |
| College or Associate's Degree | 89 (56.0%) | 374.0 |
| Bachelor's Degree | 6 (3.8%) | 34.0 |
| Graduate Degree | 15 (9.4%) | 214.0 |
| Total | 159 (100.0%) | 177.0 |
Fertility by Education by Marriage Status in Westville borough
50.3% of women with births in Westville borough are unmarried. Women with the educational attainment of bachelor's degree are most likely to be married with 100.0% of them married at childbirth, while women with the educational attainment of high school diploma are least likely to be married with 73.5% of them unmarried at childbirth.
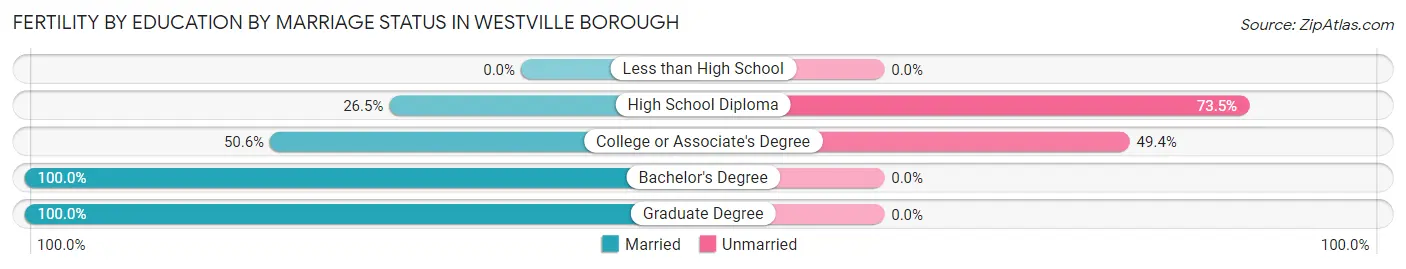
| Educational Attainment | Married | Unmarried |
| Less than High School | 0 (0.0%) | 0 (0.0%) |
| High School Diploma | 13 (26.5%) | 36 (73.5%) |
| College or Associate's Degree | 45 (50.6%) | 44 (49.4%) |
| Bachelor's Degree | 6 (100.0%) | 0 (0.0%) |
| Graduate Degree | 15 (100.0%) | 0 (0.0%) |
| Total | 79 (49.7%) | 80 (50.3%) |
Income in Westville borough
Income Overview in Westville borough
Per Capita Income in Westville borough is $37,296, while median incomes of families and households are $88,354 and $63,000 respectively.
| Characteristic | Number | Measure |
| Per Capita Income | 4,276 | $37,296 |
| Median Family Income | 1,062 | $88,354 |
| Mean Family Income | 1,062 | $106,478 |
| Median Household Income | 1,910 | $63,000 |
| Mean Household Income | 1,910 | $82,031 |
| Income Deficit | 1,062 | $0 |
| Wage / Income Gap (%) | 4,276 | 6.37% |
| Wage / Income Gap ($) | 4,276 | 93.63¢ per $1 |
| Gini / Inequality Index | 4,276 | 0.47 |
Earnings by Sex in Westville borough
Average Earnings in Westville borough are $41,980, $43,711 for men and $40,928 for women, a difference of 6.4%.
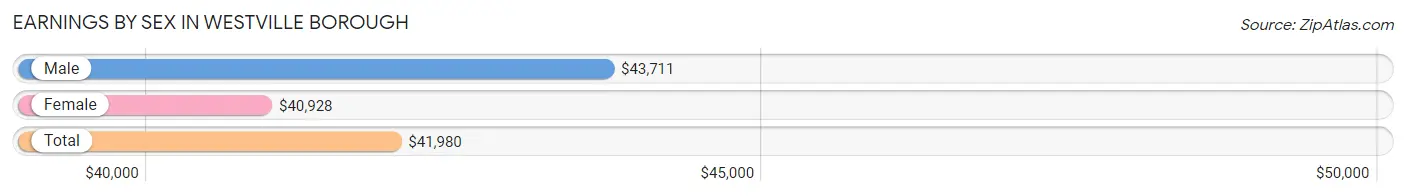
| Sex | Number | Average Earnings |
| Male | 1,247 (50.5%) | $43,711 |
| Female | 1,221 (49.5%) | $40,928 |
| Total | 2,468 (100.0%) | $41,980 |
Earnings by Sex by Income Bracket in Westville borough
The most common earnings brackets in Westville borough are $75,000 to $99,999 for men (238 | 19.1%) and $65,000 to $74,999 for women (139 | 11.4%).
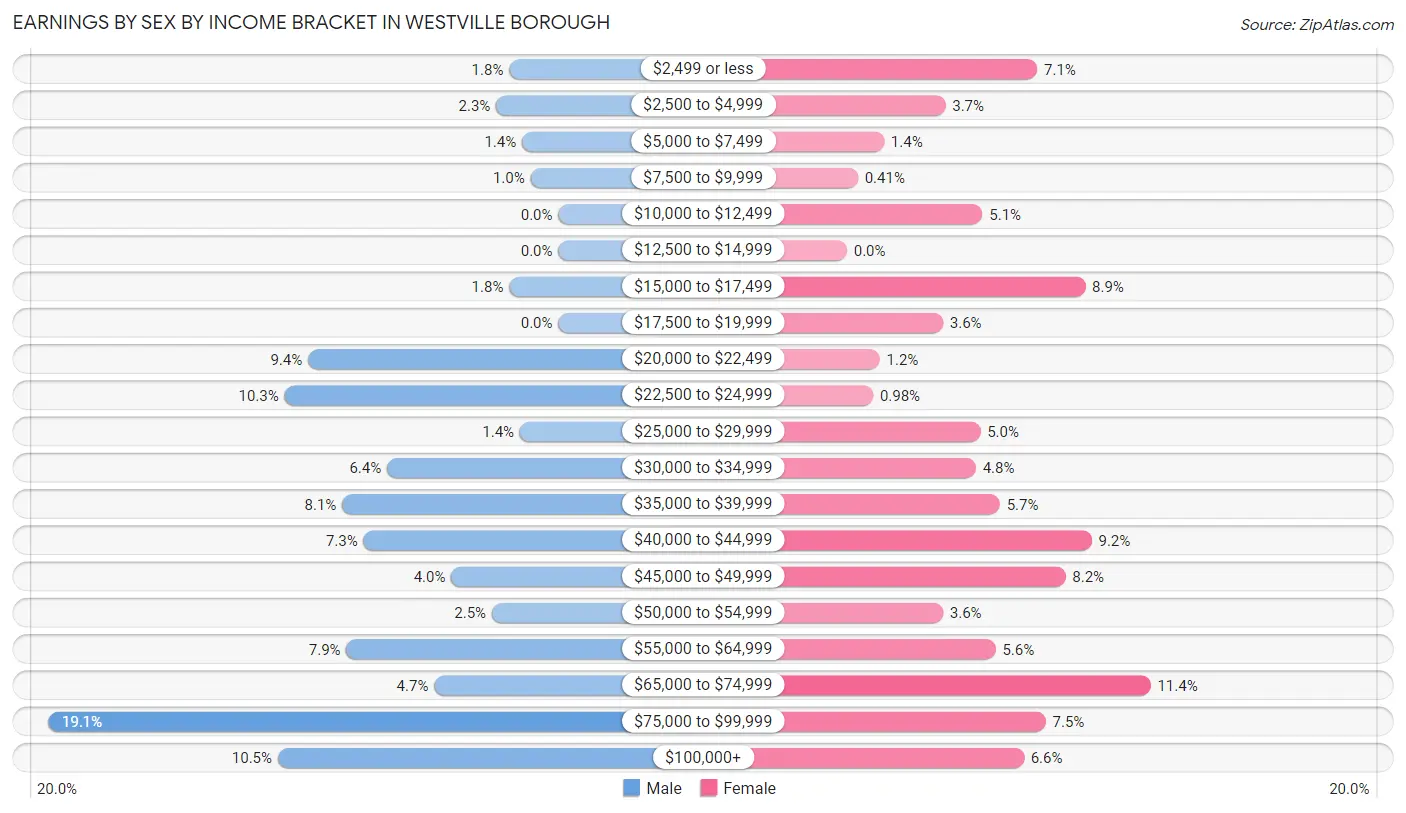
| Income | Male | Female |
| $2,499 or less | 23 (1.8%) | 87 (7.1%) |
| $2,500 to $4,999 | 29 (2.3%) | 45 (3.7%) |
| $5,000 to $7,499 | 17 (1.4%) | 17 (1.4%) |
| $7,500 to $9,999 | 13 (1.0%) | 5 (0.4%) |
| $10,000 to $12,499 | 0 (0.0%) | 62 (5.1%) |
| $12,500 to $14,999 | 0 (0.0%) | 0 (0.0%) |
| $15,000 to $17,499 | 23 (1.8%) | 109 (8.9%) |
| $17,500 to $19,999 | 0 (0.0%) | 44 (3.6%) |
| $20,000 to $22,499 | 117 (9.4%) | 15 (1.2%) |
| $22,500 to $24,999 | 128 (10.3%) | 12 (1.0%) |
| $25,000 to $29,999 | 18 (1.4%) | 61 (5.0%) |
| $30,000 to $34,999 | 80 (6.4%) | 59 (4.8%) |
| $35,000 to $39,999 | 101 (8.1%) | 70 (5.7%) |
| $40,000 to $44,999 | 91 (7.3%) | 112 (9.2%) |
| $45,000 to $49,999 | 50 (4.0%) | 100 (8.2%) |
| $50,000 to $54,999 | 31 (2.5%) | 44 (3.6%) |
| $55,000 to $64,999 | 99 (7.9%) | 68 (5.6%) |
| $65,000 to $74,999 | 58 (4.6%) | 139 (11.4%) |
| $75,000 to $99,999 | 238 (19.1%) | 91 (7.4%) |
| $100,000+ | 131 (10.5%) | 81 (6.6%) |
| Total | 1,247 (100.0%) | 1,221 (100.0%) |
Earnings by Sex by Educational Attainment in Westville borough
Average earnings in Westville borough are $48,300 for men and $45,099 for women, a difference of 6.6%. Men with an educational attainment of graduate degree enjoy the highest average annual earnings of $99,896, while those with college or associate's degree education earn the least with $42,212. Women with an educational attainment of bachelor's degree earn the most with the average annual earnings of $61,306, while those with high school diploma education have the smallest earnings of $37,500.
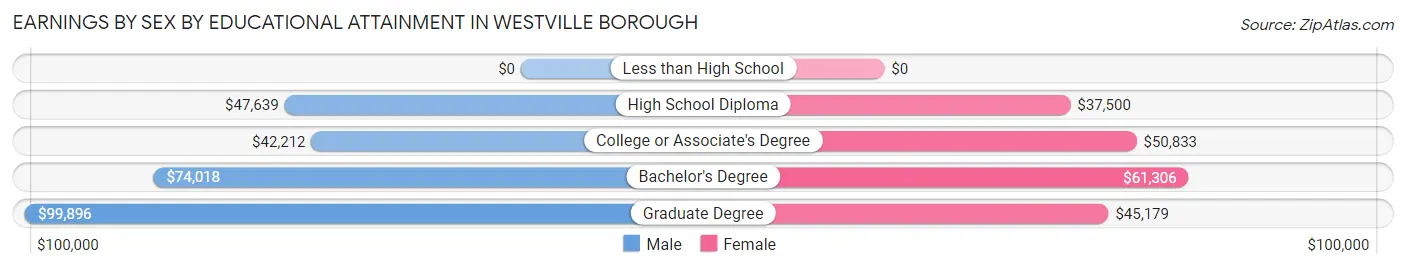
| Educational Attainment | Male Income | Female Income |
| Less than High School | - | - |
| High School Diploma | $47,639 | $37,500 |
| College or Associate's Degree | $42,212 | $50,833 |
| Bachelor's Degree | $74,018 | $61,306 |
| Graduate Degree | $99,896 | $45,179 |
| Total | $48,300 | $45,099 |
Family Income in Westville borough
Family Income Brackets in Westville borough
According to the Westville borough family income data, there are 303 families falling into the $100,000 to $149,999 income range, which is the most common income bracket and makes up 28.5% of all families.
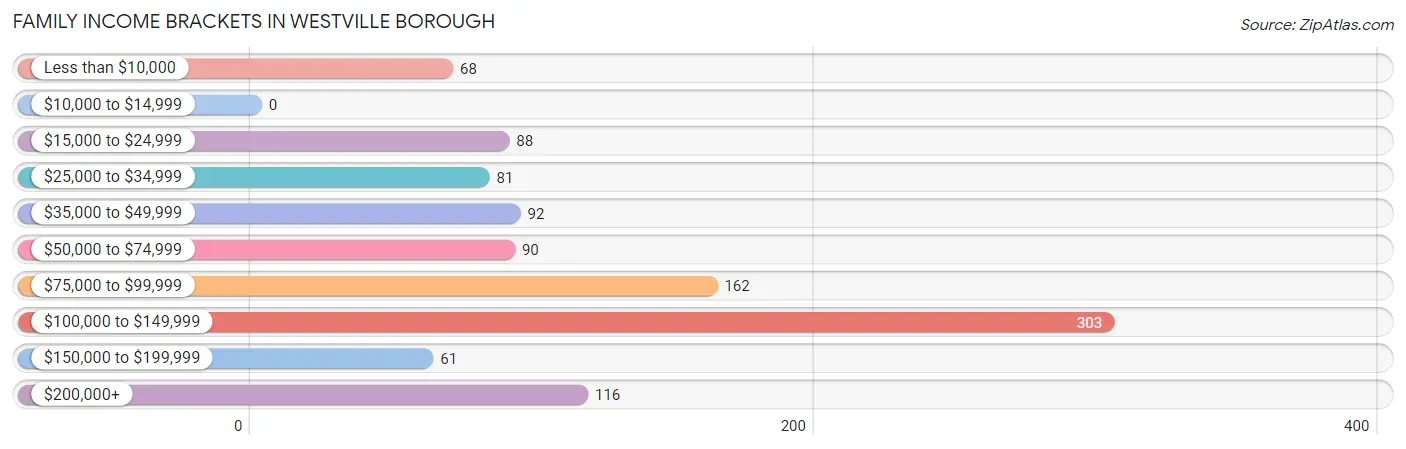
| Income Bracket | # Families | % Families |
| Less than $10,000 | 68 | 6.4% |
| $10,000 to $14,999 | 0 | 0.0% |
| $15,000 to $24,999 | 88 | 8.3% |
| $25,000 to $34,999 | 81 | 7.6% |
| $35,000 to $49,999 | 92 | 8.7% |
| $50,000 to $74,999 | 90 | 8.5% |
| $75,000 to $99,999 | 162 | 15.3% |
| $100,000 to $149,999 | 303 | 28.5% |
| $150,000 to $199,999 | 61 | 5.7% |
| $200,000+ | 116 | 10.9% |
Family Income by Famaliy Size in Westville borough
6-person families (33 | 3.1%) account for the highest median family income in Westville borough with $225,956 per family, while 2-person families (496 | 46.7%) have the highest median income of $44,768 per family member.
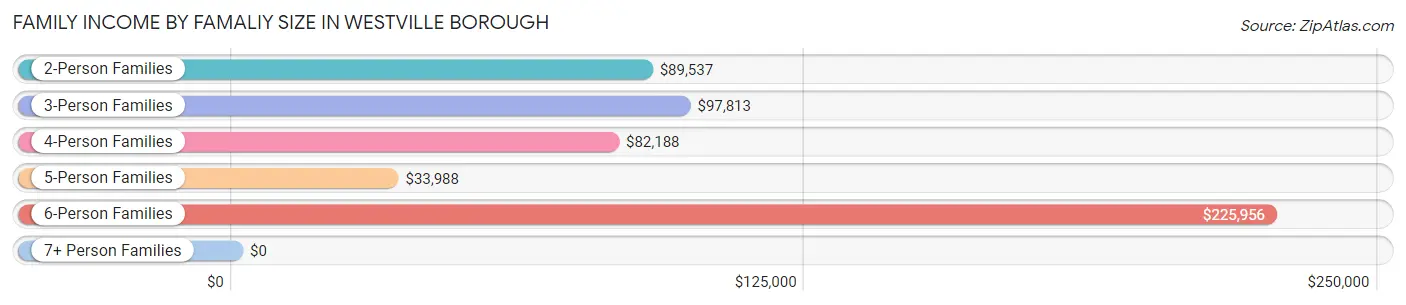
| Income Bracket | # Families | Median Income |
| 2-Person Families | 496 (46.7%) | $89,537 |
| 3-Person Families | 306 (28.8%) | $97,813 |
| 4-Person Families | 159 (15.0%) | $82,188 |
| 5-Person Families | 59 (5.6%) | $33,988 |
| 6-Person Families | 33 (3.1%) | $225,956 |
| 7+ Person Families | 9 (0.9%) | $0 |
| Total | 1,062 (100.0%) | $88,354 |
Family Income by Number of Earners in Westville borough
The median family income in Westville borough is $88,354, with families comprising 3+ earners (141) having the highest median family income of $171,719, while families with no earners (110) have the lowest median family income of $33,333, accounting for 13.3% and 10.4% of families, respectively.
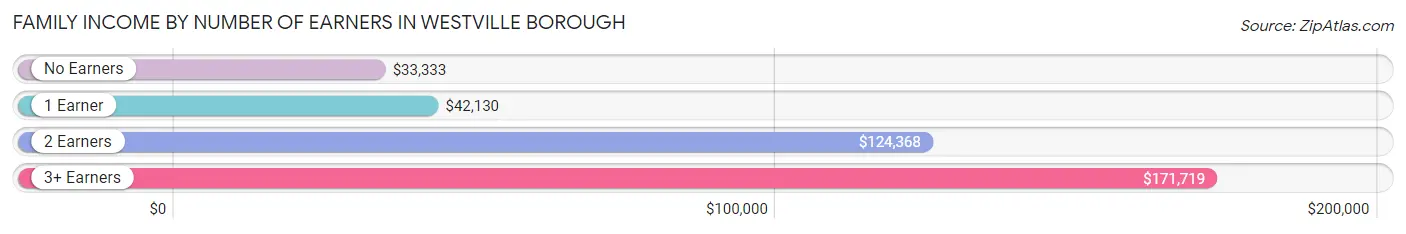
| Number of Earners | # Families | Median Income |
| No Earners | 110 (10.4%) | $33,333 |
| 1 Earner | 354 (33.3%) | $42,130 |
| 2 Earners | 457 (43.0%) | $124,368 |
| 3+ Earners | 141 (13.3%) | $171,719 |
| Total | 1,062 (100.0%) | $88,354 |
Household Income in Westville borough
Household Income Brackets in Westville borough
With 456 households falling in the category, the $100,000 to $149,999 income range is the most frequent in Westville borough, accounting for 23.9% of all households. In contrast, only 76 households (4.0%) fall into the $150,000 to $199,999 income bracket, making it the least populous group.
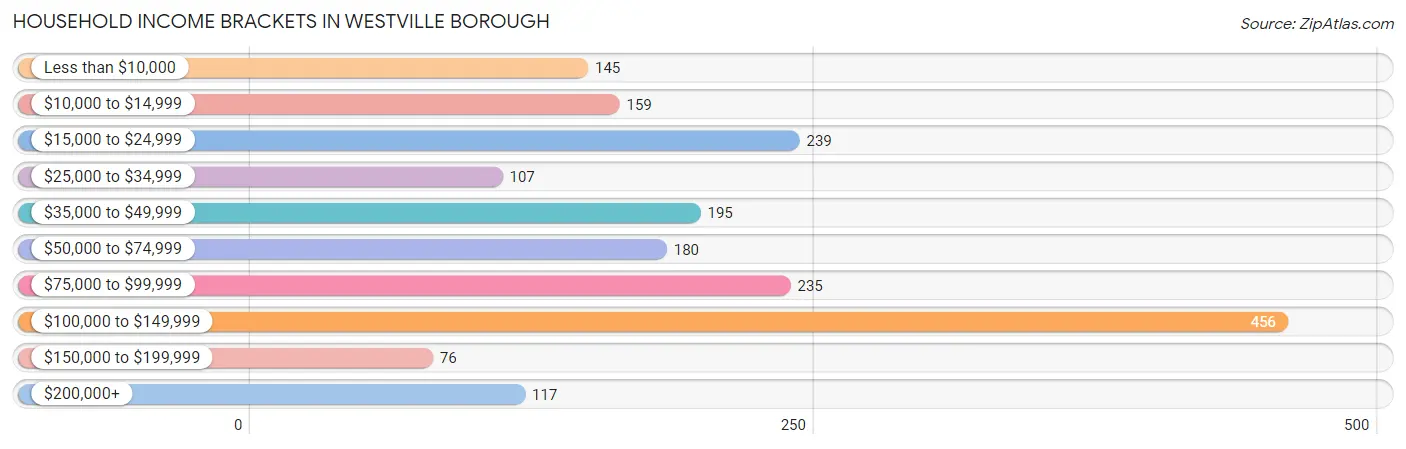
| Income Bracket | # Households | % Households |
| Less than $10,000 | 145 | 7.6% |
| $10,000 to $14,999 | 159 | 8.3% |
| $15,000 to $24,999 | 239 | 12.5% |
| $25,000 to $34,999 | 107 | 5.6% |
| $35,000 to $49,999 | 195 | 10.2% |
| $50,000 to $74,999 | 180 | 9.4% |
| $75,000 to $99,999 | 235 | 12.3% |
| $100,000 to $149,999 | 456 | 23.9% |
| $150,000 to $199,999 | 76 | 4.0% |
| $200,000+ | 117 | 6.1% |
Household Income by Householder Age in Westville borough
The median household income in Westville borough is $63,000, with the highest median household income of $82,115 found in the 25 to 44 years age bracket for the primary householder. A total of 536 households (28.1%) fall into this category. Meanwhile, the 15 to 24 years age bracket for the primary householder has the lowest median household income of $36,118, with 101 households (5.3%) in this group.
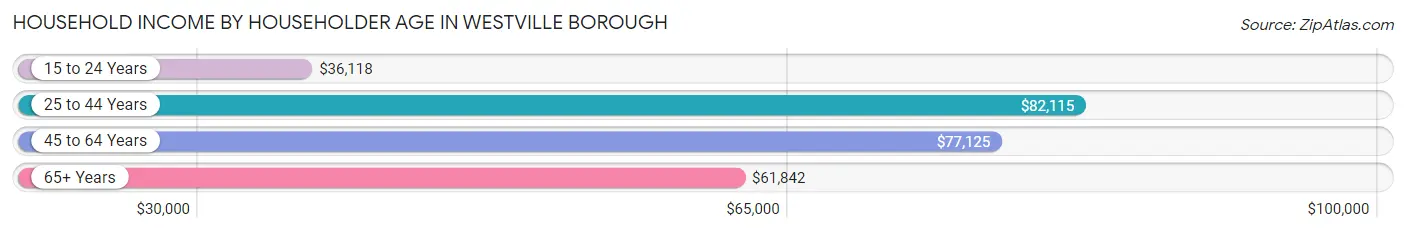
| Income Bracket | # Households | Median Income |
| 15 to 24 Years | 101 (5.3%) | $36,118 |
| 25 to 44 Years | 536 (28.1%) | $82,115 |
| 45 to 64 Years | 873 (45.7%) | $77,125 |
| 65+ Years | 400 (20.9%) | $61,842 |
| Total | 1,910 (100.0%) | $63,000 |
Poverty in Westville borough
Income Below Poverty by Sex and Age in Westville borough
With 12.0% poverty level for males and 24.9% for females among the residents of Westville borough, 6 to 11 year old males and 6 to 11 year old females are the most vulnerable to poverty, with 42 males (32.1%) and 113 females (66.9%) in their respective age groups living below the poverty level.
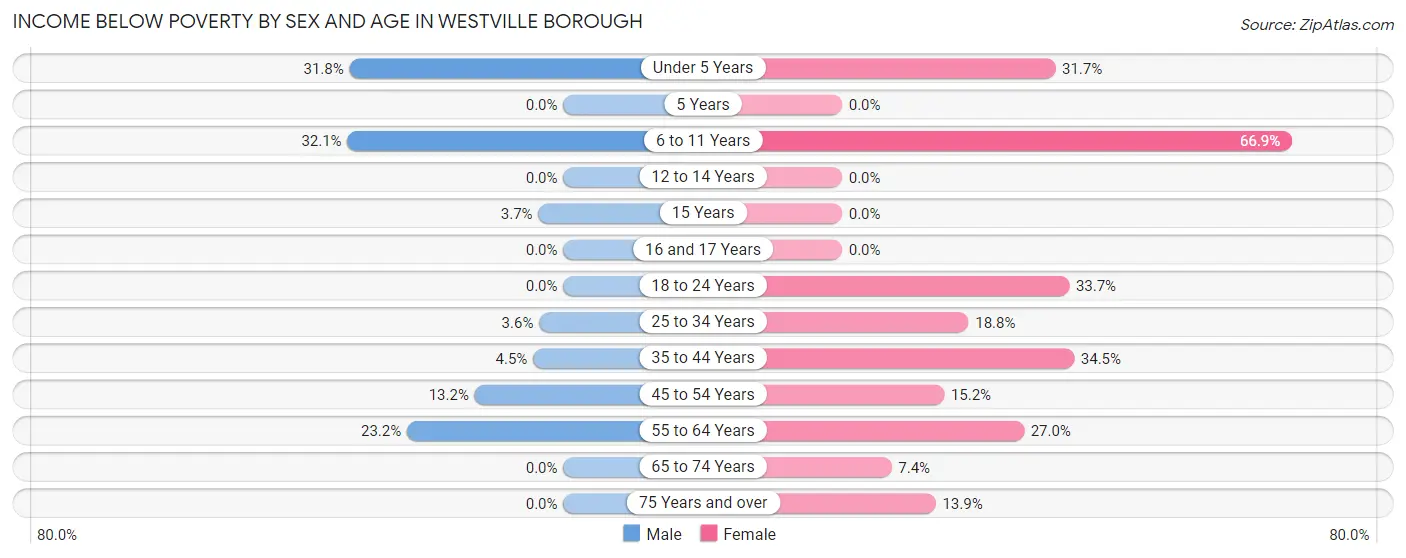
| Age Bracket | Male | Female |
| Under 5 Years | 60 (31.8%) | 63 (31.7%) |
| 5 Years | 0 (0.0%) | 0 (0.0%) |
| 6 to 11 Years | 42 (32.1%) | 113 (66.9%) |
| 12 to 14 Years | 0 (0.0%) | 0 (0.0%) |
| 15 Years | 1 (3.7%) | 0 (0.0%) |
| 16 and 17 Years | 0 (0.0%) | 0 (0.0%) |
| 18 to 24 Years | 0 (0.0%) | 57 (33.7%) |
| 25 to 34 Years | 10 (3.6%) | 62 (18.8%) |
| 35 to 44 Years | 10 (4.5%) | 102 (34.5%) |
| 45 to 54 Years | 52 (13.2%) | 44 (15.2%) |
| 55 to 64 Years | 68 (23.2%) | 84 (27.0%) |
| 65 to 74 Years | 0 (0.0%) | 17 (7.4%) |
| 75 Years and over | 0 (0.0%) | 21 (13.9%) |
| Total | 243 (12.0%) | 563 (24.9%) |
Income Above Poverty by Sex and Age in Westville borough
According to the poverty statistics in Westville borough, males aged 5 years and females aged 5 years are the age groups that are most secure financially, with 100.0% of males and 100.0% of females in these age groups living above the poverty line.
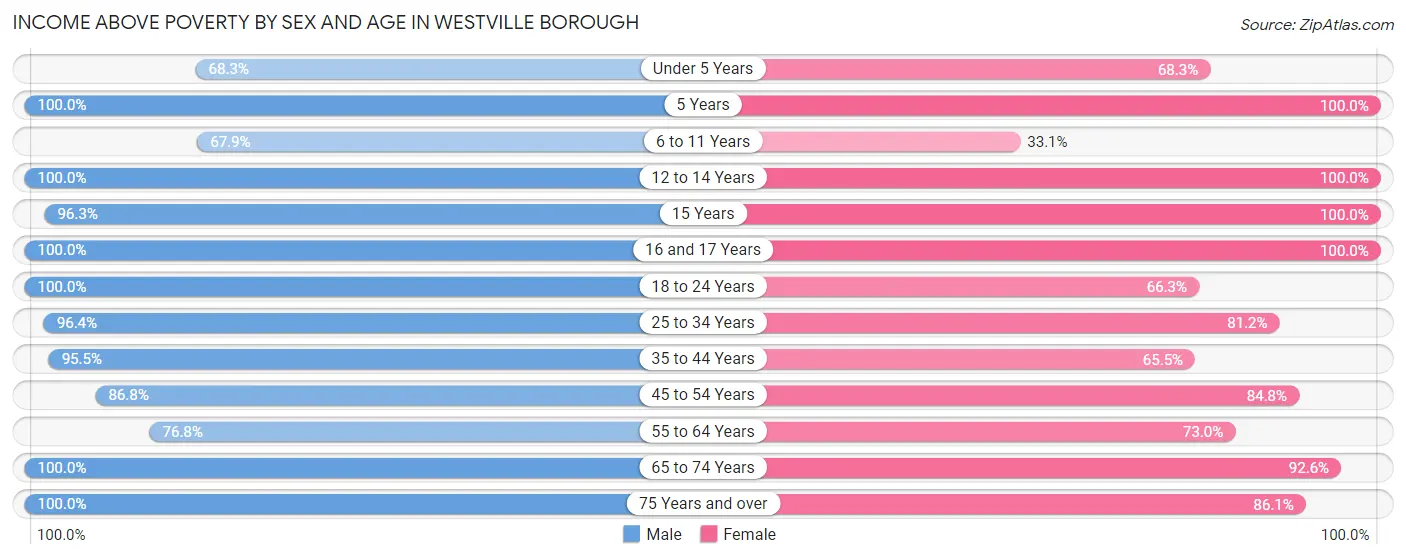
| Age Bracket | Male | Female |
| Under 5 Years | 129 (68.2%) | 136 (68.3%) |
| 5 Years | 25 (100.0%) | 14 (100.0%) |
| 6 to 11 Years | 89 (67.9%) | 56 (33.1%) |
| 12 to 14 Years | 26 (100.0%) | 19 (100.0%) |
| 15 Years | 26 (96.3%) | 36 (100.0%) |
| 16 and 17 Years | 25 (100.0%) | 42 (100.0%) |
| 18 to 24 Years | 98 (100.0%) | 112 (66.3%) |
| 25 to 34 Years | 269 (96.4%) | 268 (81.2%) |
| 35 to 44 Years | 213 (95.5%) | 194 (65.5%) |
| 45 to 54 Years | 343 (86.8%) | 246 (84.8%) |
| 55 to 64 Years | 225 (76.8%) | 227 (73.0%) |
| 65 to 74 Years | 281 (100.0%) | 214 (92.6%) |
| 75 Years and over | 27 (100.0%) | 130 (86.1%) |
| Total | 1,776 (88.0%) | 1,694 (75.1%) |
Income Below Poverty Among Married-Couple Families in Westville borough
The poverty statistics for married-couple families in Westville borough show that 2.5% or 15 of the total 598 families live below the poverty line. Families with 1 or 2 children have the highest poverty rate of 4.5%, comprising of 11 families. On the other hand, families with 3 or 4 children have the lowest poverty rate of 0.0%, which includes 0 families.
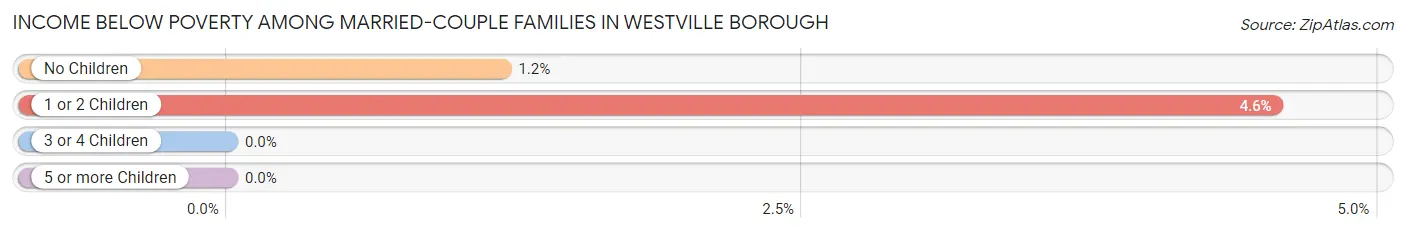
| Children | Above Poverty | Below Poverty |
| No Children | 333 (98.8%) | 4 (1.2%) |
| 1 or 2 Children | 231 (95.5%) | 11 (4.5%) |
| 3 or 4 Children | 10 (100.0%) | 0 (0.0%) |
| 5 or more Children | 9 (100.0%) | 0 (0.0%) |
| Total | 583 (97.5%) | 15 (2.5%) |
Income Below Poverty Among Single-Parent Households in Westville borough
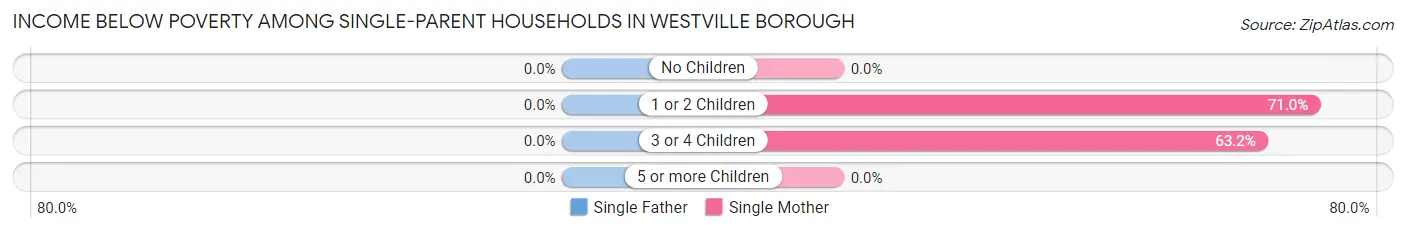
| Children | Single Father | Single Mother |
| No Children | 0 (0.0%) | 0 (0.0%) |
| 1 or 2 Children | 0 (0.0%) | 110 (71.0%) |
| 3 or 4 Children | 0 (0.0%) | 36 (63.2%) |
| 5 or more Children | 0 (0.0%) | 0 (0.0%) |
| Total | 0 (0.0%) | 146 (40.8%) |
Income Below Poverty Among Married-Couple vs Single-Parent Households in Westville borough
The poverty data for Westville borough shows that 15 of the married-couple family households (2.5%) and 146 of the single-parent households (31.5%) are living below the poverty level. Within the married-couple family households, those with 1 or 2 children have the highest poverty rate, with 11 households (4.5%) falling below the poverty line. Among the single-parent households, those with 3 or 4 children have the highest poverty rate, with 36 household (63.2%) living below poverty.
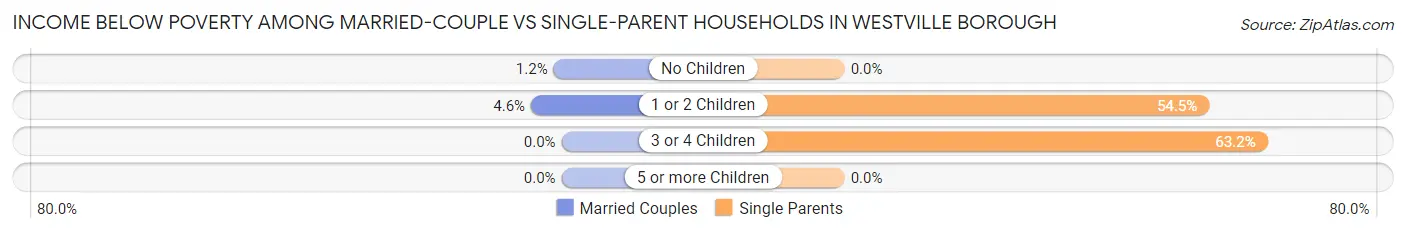
| Children | Married-Couple Families | Single-Parent Households |
| No Children | 4 (1.2%) | 0 (0.0%) |
| 1 or 2 Children | 11 (4.5%) | 110 (54.5%) |
| 3 or 4 Children | 0 (0.0%) | 36 (63.2%) |
| 5 or more Children | 0 (0.0%) | 0 (0.0%) |
| Total | 15 (2.5%) | 146 (31.5%) |
Employment Characteristics in Westville borough
Employment by Class of Employer in Westville borough
Among the 2,190 employed individuals in Westville borough, private company employees (1,404 | 64.1%), not-for-profit organizations (239 | 10.9%), and self-employed (not incorporated) (219 | 10.0%) make up the most common classes of employment.
| Employer Class | # Employees | % Employees |
| Private Company Employees | 1,404 | 64.1% |
| Self-Employed (Incorporated) | 41 | 1.9% |
| Self-Employed (Not Incorporated) | 219 | 10.0% |
| Not-for-profit Organizations | 239 | 10.9% |
| Local Government Employees | 151 | 6.9% |
| State Government Employees | 136 | 6.2% |
| Federal Government Employees | 0 | 0.0% |
| Unpaid Family Workers | 0 | 0.0% |
| Total | 2,190 | 100.0% |
Employment Status by Age in Westville borough
According to the labor force statistics for Westville borough, out of the total population over 16 years of age (3,441), 69.3% or 2,385 individuals are in the labor force, with 6.3% or 150 of them unemployed. The age group with the highest labor force participation rate is 25 to 29 years, with 96.0% or 262 individuals in the labor force. Within the labor force, the 65 to 74 years age range has the highest percentage of unemployed individuals, with 16.4% or 36 of them being unemployed.
| Age Bracket | In Labor Force | Unemployed |
| 16 to 19 Years | 24 (30.0%) | 0 (0.0%) |
| 20 to 24 Years | 223 (87.8%) | 14 (6.3%) |
| 25 to 29 Years | 262 (96.0%) | 0 (0.0%) |
| 30 to 34 Years | 284 (84.5%) | 13 (4.6%) |
| 35 to 44 Years | 426 (82.1%) | 66 (15.5%) |
| 45 to 54 Years | 589 (86.0%) | 10 (1.7%) |
| 55 to 59 Years | 173 (65.0%) | 0 (0.0%) |
| 60 to 64 Years | 183 (54.1%) | 12 (6.6%) |
| 65 to 74 Years | 220 (43.0%) | 36 (16.4%) |
| 75 Years and over | 1 (0.6%) | 0 (0.0%) |
| Total | 2,385 (69.3%) | 150 (6.3%) |
Employment Status by Educational Attainment in Westville borough
According to labor force statistics for Westville borough, 79.3% of individuals (1,917) out of the total population between 25 and 64 years of age (2,417) are in the labor force, with 5.3% or 102 of them being unemployed. The group with the highest labor force participation rate are those with the educational attainment of bachelor's degree or higher, with 97.9% or 457 individuals in the labor force. Within the labor force, individuals with high school diploma education have the highest percentage of unemployment, with 9.9% or 62 of them being unemployed.
| Educational Attainment | In Labor Force | Unemployed |
| Less than High School | 103 (73.6%) | 12 (8.7%) |
| High School Diploma | 625 (75.4%) | 82 (9.9%) |
| College / Associate Degree | 732 (74.6%) | 23 (2.3%) |
| Bachelor's Degree or higher | 457 (97.9%) | 13 (2.8%) |
| Total | 1,917 (79.3%) | 128 (5.3%) |
Employment Occupations by Sex in Westville borough
Management, Business, Science and Arts Occupations
The most common Management, Business, Science and Arts occupations in Westville borough are Management (240 | 10.7%), Community & Social Service (189 | 8.5%), Health Diagnosing & Treating (153 | 6.9%), Computers, Engineering & Science (105 | 4.7%), and Education Instruction & Library (104 | 4.7%).
Management, Business, Science and Arts Occupations by Sex
Within the Management, Business, Science and Arts occupations in Westville borough, the most male-oriented occupations are Architecture & Engineering (100.0%), Computers, Engineering & Science (78.1%), and Life, Physical & Social Science (77.4%), while the most female-oriented occupations are Education Instruction & Library (100.0%), Education, Arts & Media (93.3%), and Community & Social Service (80.4%).
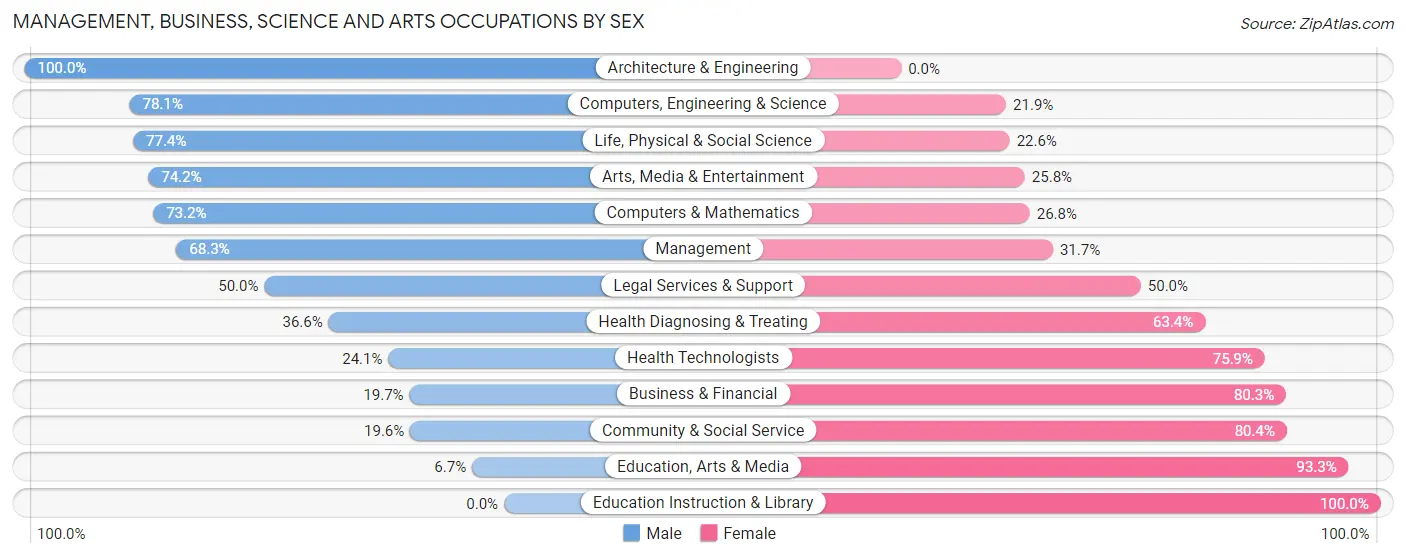
| Occupation | Male | Female |
| Management | 164 (68.3%) | 76 (31.7%) |
| Business & Financial | 14 (19.7%) | 57 (80.3%) |
| Computers, Engineering & Science | 82 (78.1%) | 23 (21.9%) |
| Computers & Mathematics | 30 (73.2%) | 11 (26.8%) |
| Architecture & Engineering | 11 (100.0%) | 0 (0.0%) |
| Life, Physical & Social Science | 41 (77.4%) | 12 (22.6%) |
| Community & Social Service | 37 (19.6%) | 152 (80.4%) |
| Education, Arts & Media | 2 (6.7%) | 28 (93.3%) |
| Legal Services & Support | 12 (50.0%) | 12 (50.0%) |
| Education Instruction & Library | 0 (0.0%) | 104 (100.0%) |
| Arts, Media & Entertainment | 23 (74.2%) | 8 (25.8%) |
| Health Diagnosing & Treating | 56 (36.6%) | 97 (63.4%) |
| Health Technologists | 14 (24.1%) | 44 (75.9%) |
| Total (Category) | 353 (46.6%) | 405 (53.4%) |
| Total (Overall) | 1,136 (50.8%) | 1,098 (49.1%) |
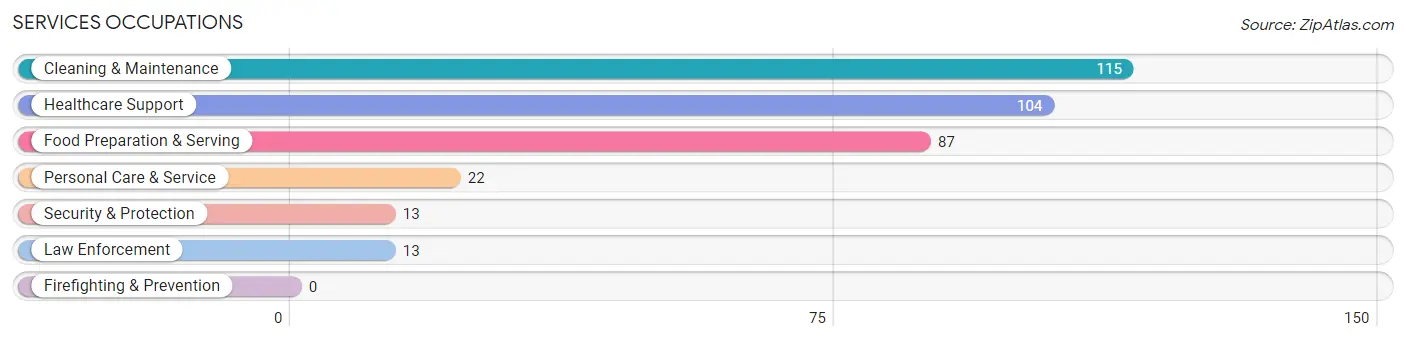
Services Occupations
The most common Services occupations in Westville borough are Cleaning & Maintenance (115 | 5.1%), Healthcare Support (104 | 4.7%), Food Preparation & Serving (87 | 3.9%), Personal Care & Service (22 | 1.0%), and Security & Protection (13 | 0.6%).
Services Occupations by Sex
Within the Services occupations in Westville borough, the most male-oriented occupations are Security & Protection (100.0%), Law Enforcement (100.0%), and Healthcare Support (46.2%), while the most female-oriented occupations are Food Preparation & Serving (100.0%), Personal Care & Service (100.0%), and Cleaning & Maintenance (55.6%).
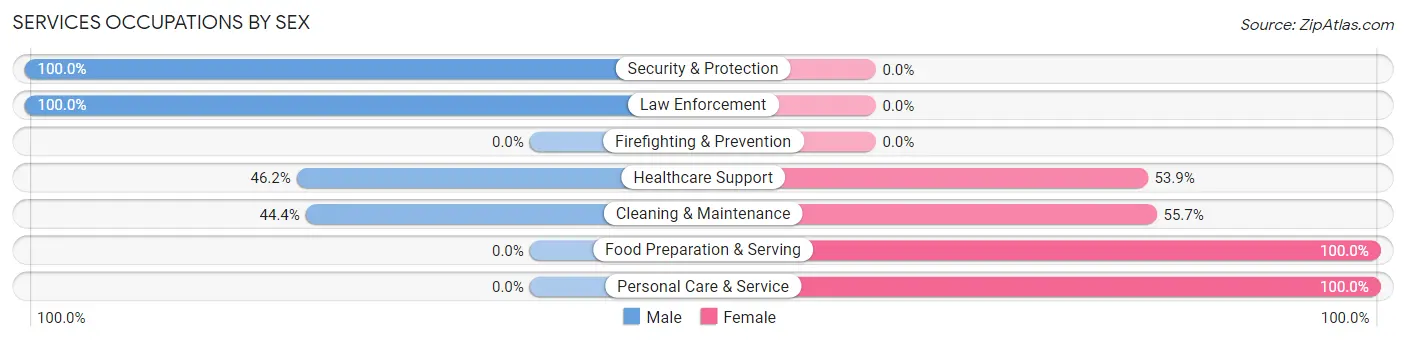
| Occupation | Male | Female |
| Healthcare Support | 48 (46.2%) | 56 (53.8%) |
| Security & Protection | 13 (100.0%) | 0 (0.0%) |
| Firefighting & Prevention | 0 (0.0%) | 0 (0.0%) |
| Law Enforcement | 13 (100.0%) | 0 (0.0%) |
| Food Preparation & Serving | 0 (0.0%) | 87 (100.0%) |
| Cleaning & Maintenance | 51 (44.4%) | 64 (55.6%) |
| Personal Care & Service | 0 (0.0%) | 22 (100.0%) |
| Total (Category) | 112 (32.8%) | 229 (67.2%) |
| Total (Overall) | 1,136 (50.8%) | 1,098 (49.1%) |
Sales and Office Occupations
The most common Sales and Office occupations in Westville borough are Office & Administration (346 | 15.5%), and Sales & Related (159 | 7.1%).

Sales and Office Occupations by Sex
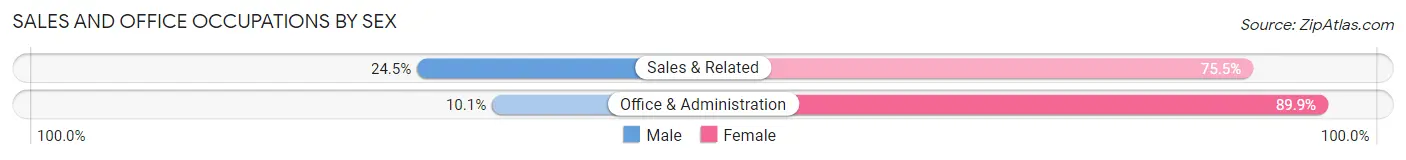
| Occupation | Male | Female |
| Sales & Related | 39 (24.5%) | 120 (75.5%) |
| Office & Administration | 35 (10.1%) | 311 (89.9%) |
| Total (Category) | 74 (14.6%) | 431 (85.4%) |
| Total (Overall) | 1,136 (50.8%) | 1,098 (49.1%) |
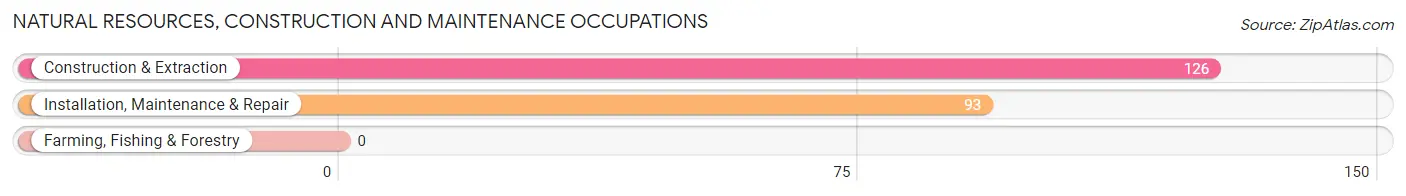
Natural Resources, Construction and Maintenance Occupations
The most common Natural Resources, Construction and Maintenance occupations in Westville borough are Construction & Extraction (126 | 5.6%), and Installation, Maintenance & Repair (93 | 4.2%).
Natural Resources, Construction and Maintenance Occupations by Sex
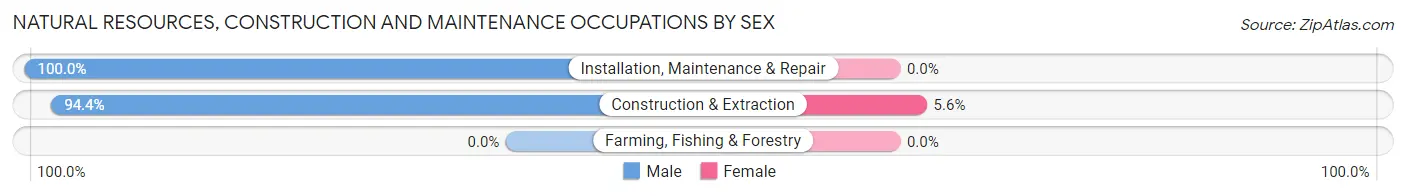
| Occupation | Male | Female |
| Farming, Fishing & Forestry | 0 (0.0%) | 0 (0.0%) |
| Construction & Extraction | 119 (94.4%) | 7 (5.6%) |
| Installation, Maintenance & Repair | 93 (100.0%) | 0 (0.0%) |
| Total (Category) | 212 (96.8%) | 7 (3.2%) |
| Total (Overall) | 1,136 (50.8%) | 1,098 (49.1%) |
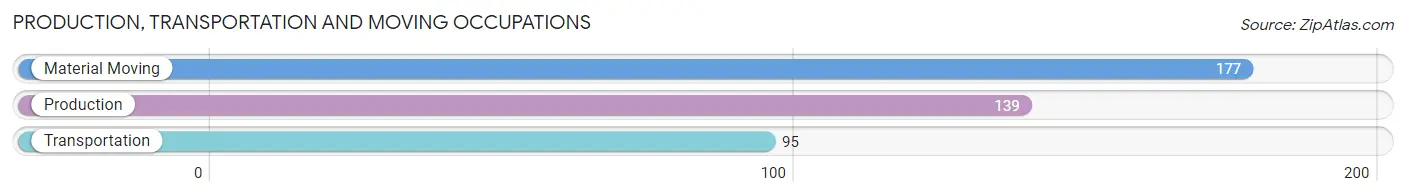
Production, Transportation and Moving Occupations
The most common Production, Transportation and Moving occupations in Westville borough are Material Moving (177 | 7.9%), Production (139 | 6.2%), and Transportation (95 | 4.3%).
Production, Transportation and Moving Occupations by Sex
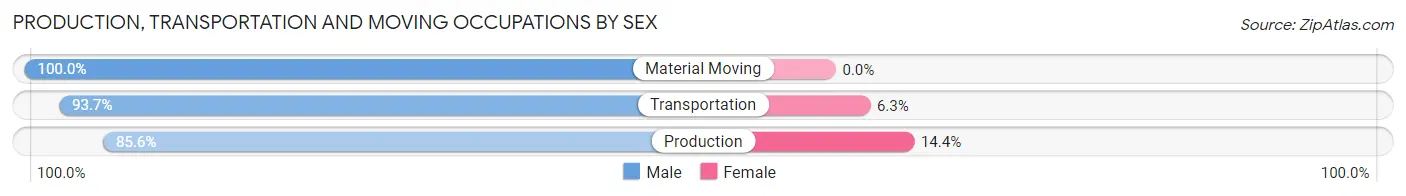
| Occupation | Male | Female |
| Production | 119 (85.6%) | 20 (14.4%) |
| Transportation | 89 (93.7%) | 6 (6.3%) |
| Material Moving | 177 (100.0%) | 0 (0.0%) |
| Total (Category) | 385 (93.7%) | 26 (6.3%) |
| Total (Overall) | 1,136 (50.8%) | 1,098 (49.1%) |
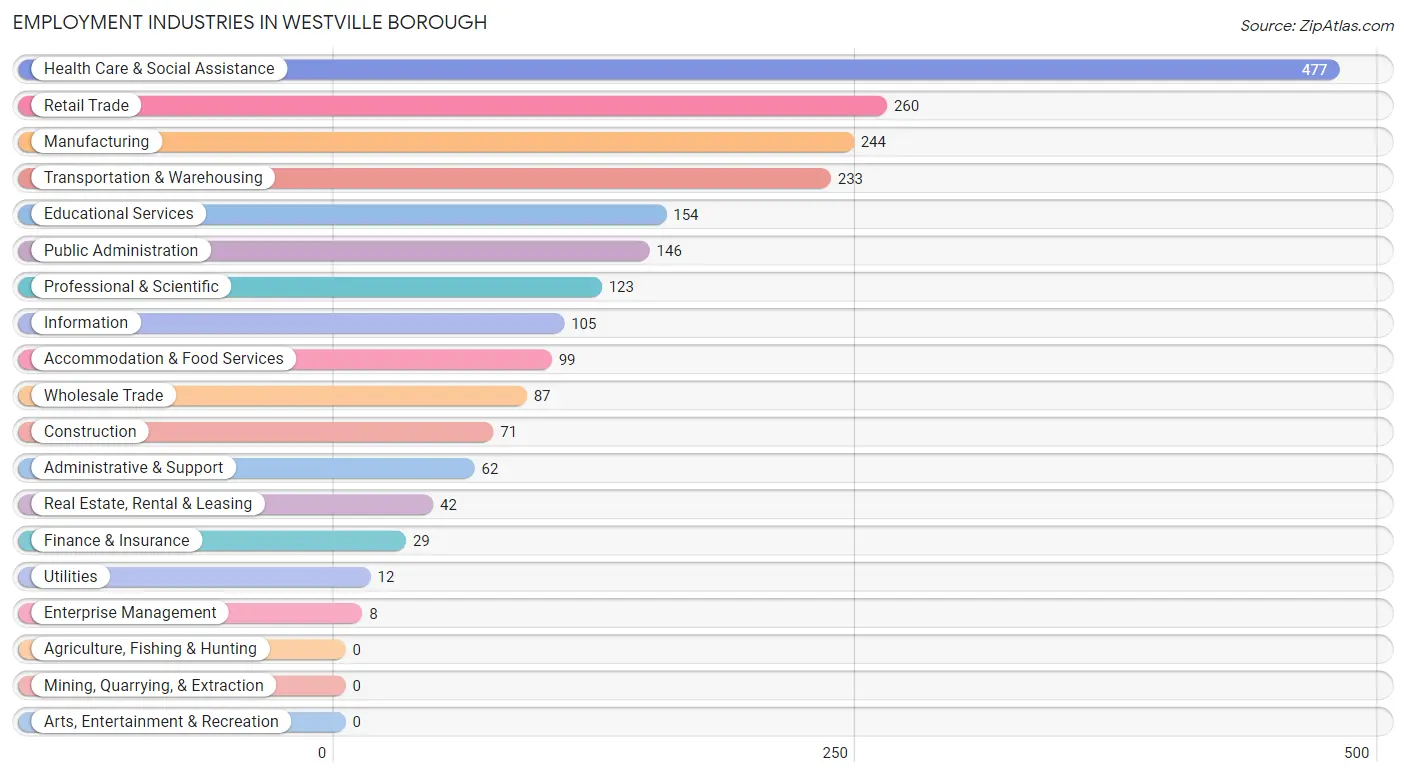
Employment Industries by Sex in Westville borough
Employment Industries in Westville borough
The major employment industries in Westville borough include Health Care & Social Assistance (477 | 21.3%), Retail Trade (260 | 11.6%), Manufacturing (244 | 10.9%), Transportation & Warehousing (233 | 10.4%), and Educational Services (154 | 6.9%).
Employment Industries by Sex in Westville borough
The Westville borough industries that see more men than women are Construction (100.0%), Utilities (100.0%), and Transportation & Warehousing (79.0%), whereas the industries that tend to have a higher number of women are Finance & Insurance (100.0%), Enterprise Management (100.0%), and Educational Services (100.0%).
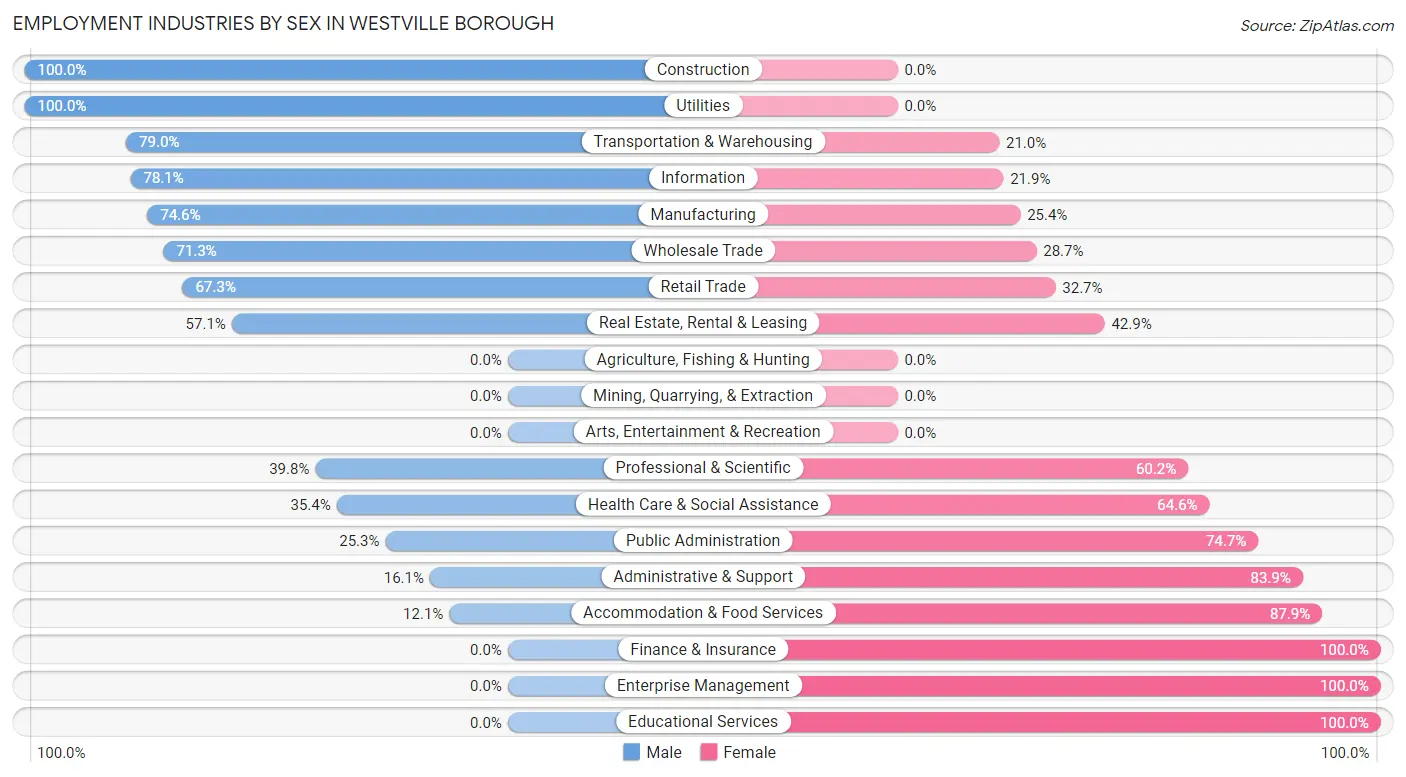
| Industry | Male | Female |
| Agriculture, Fishing & Hunting | 0 (0.0%) | 0 (0.0%) |
| Mining, Quarrying, & Extraction | 0 (0.0%) | 0 (0.0%) |
| Construction | 71 (100.0%) | 0 (0.0%) |
| Manufacturing | 182 (74.6%) | 62 (25.4%) |
| Wholesale Trade | 62 (71.3%) | 25 (28.7%) |
| Retail Trade | 175 (67.3%) | 85 (32.7%) |
| Transportation & Warehousing | 184 (79.0%) | 49 (21.0%) |
| Utilities | 12 (100.0%) | 0 (0.0%) |
| Information | 82 (78.1%) | 23 (21.9%) |
| Finance & Insurance | 0 (0.0%) | 29 (100.0%) |
| Real Estate, Rental & Leasing | 24 (57.1%) | 18 (42.9%) |
| Professional & Scientific | 49 (39.8%) | 74 (60.2%) |
| Enterprise Management | 0 (0.0%) | 8 (100.0%) |
| Administrative & Support | 10 (16.1%) | 52 (83.9%) |
| Educational Services | 0 (0.0%) | 154 (100.0%) |
| Health Care & Social Assistance | 169 (35.4%) | 308 (64.6%) |
| Arts, Entertainment & Recreation | 0 (0.0%) | 0 (0.0%) |
| Accommodation & Food Services | 12 (12.1%) | 87 (87.9%) |
| Public Administration | 37 (25.3%) | 109 (74.7%) |
| Total | 1,136 (50.8%) | 1,098 (49.1%) |
Education in Westville borough
School Enrollment in Westville borough
The most common levels of schooling among the 637 students in Westville borough are elementary school (245 | 38.5%), high school (130 | 20.4%), and middle school (85 | 13.3%).
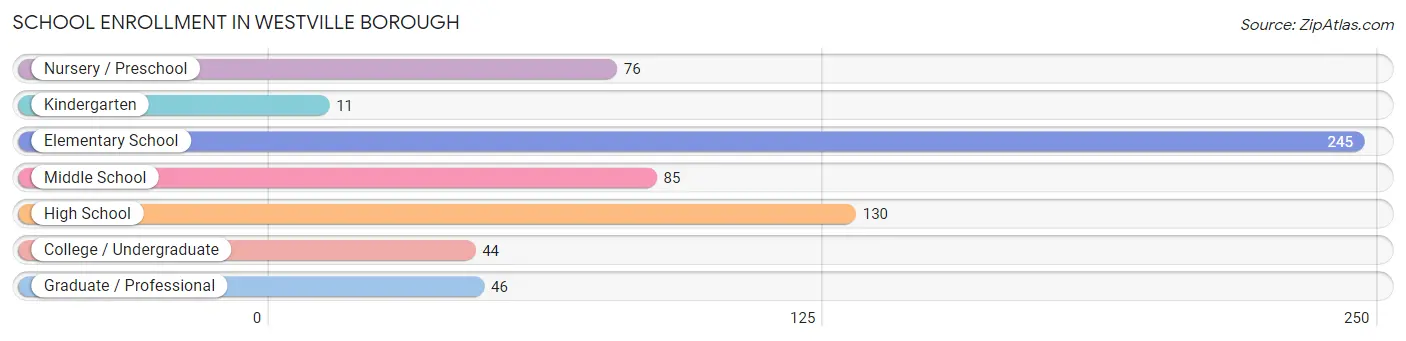
| School Level | # Students | % Students |
| Nursery / Preschool | 76 | 11.9% |
| Kindergarten | 11 | 1.7% |
| Elementary School | 245 | 38.5% |
| Middle School | 85 | 13.3% |
| High School | 130 | 20.4% |
| College / Undergraduate | 44 | 6.9% |
| Graduate / Professional | 46 | 7.2% |
| Total | 637 | 100.0% |
School Enrollment by Age by Funding Source in Westville borough
Out of a total of 637 students who are enrolled in schools in Westville borough, 64 (10.0%) attend a private institution, while the remaining 573 (90.0%) are enrolled in public schools. The age group of 18 to 19 year olds has the highest likelihood of being enrolled in private schools, with 13 (100.0% in the age bracket) enrolled. Conversely, the age group of 3 to 4 year olds has the lowest likelihood of being enrolled in a private school, with 62 (100.0% in the age bracket) attending a public institution.
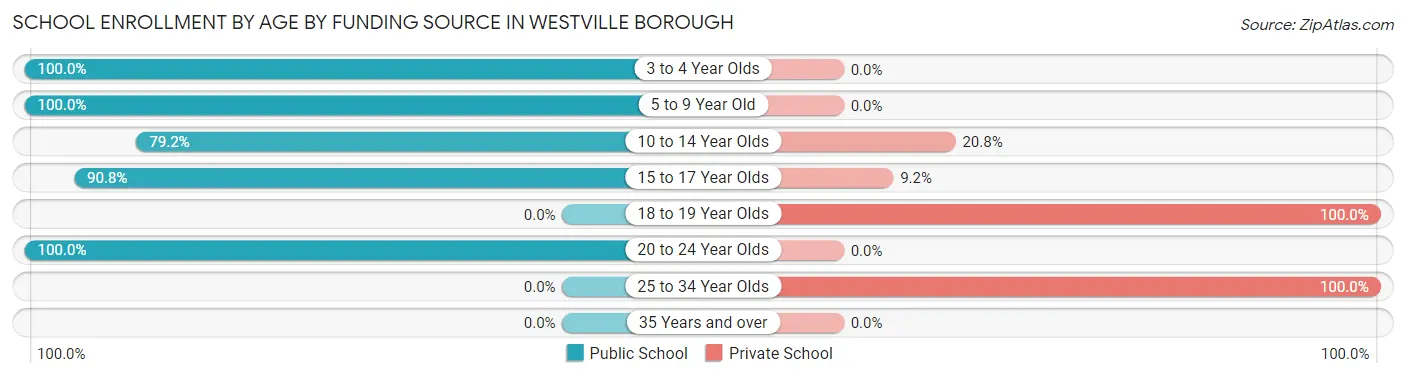
| Age Bracket | Public School | Private School |
| 3 to 4 Year Olds | 62 (100.0%) | 0 (0.0%) |
| 5 to 9 Year Old | 259 (100.0%) | 0 (0.0%) |
| 10 to 14 Year Olds | 76 (79.2%) | 20 (20.8%) |
| 15 to 17 Year Olds | 118 (90.8%) | 12 (9.2%) |
| 18 to 19 Year Olds | 0 (0.0%) | 13 (100.0%) |
| 20 to 24 Year Olds | 58 (100.0%) | 0 (0.0%) |
| 25 to 34 Year Olds | 0 (0.0%) | 19 (100.0%) |
| 35 Years and over | 0 (0.0%) | 0 (0.0%) |
| Total | 573 (90.0%) | 64 (10.0%) |
Educational Attainment by Field of Study in Westville borough
Science & technology (95 | 13.6%), business (92 | 13.1%), arts & humanities (83 | 11.8%), communications (75 | 10.7%), and liberal arts & history (67 | 9.6%) are the most common fields of study among 701 individuals in Westville borough who have obtained a bachelor's degree or higher.
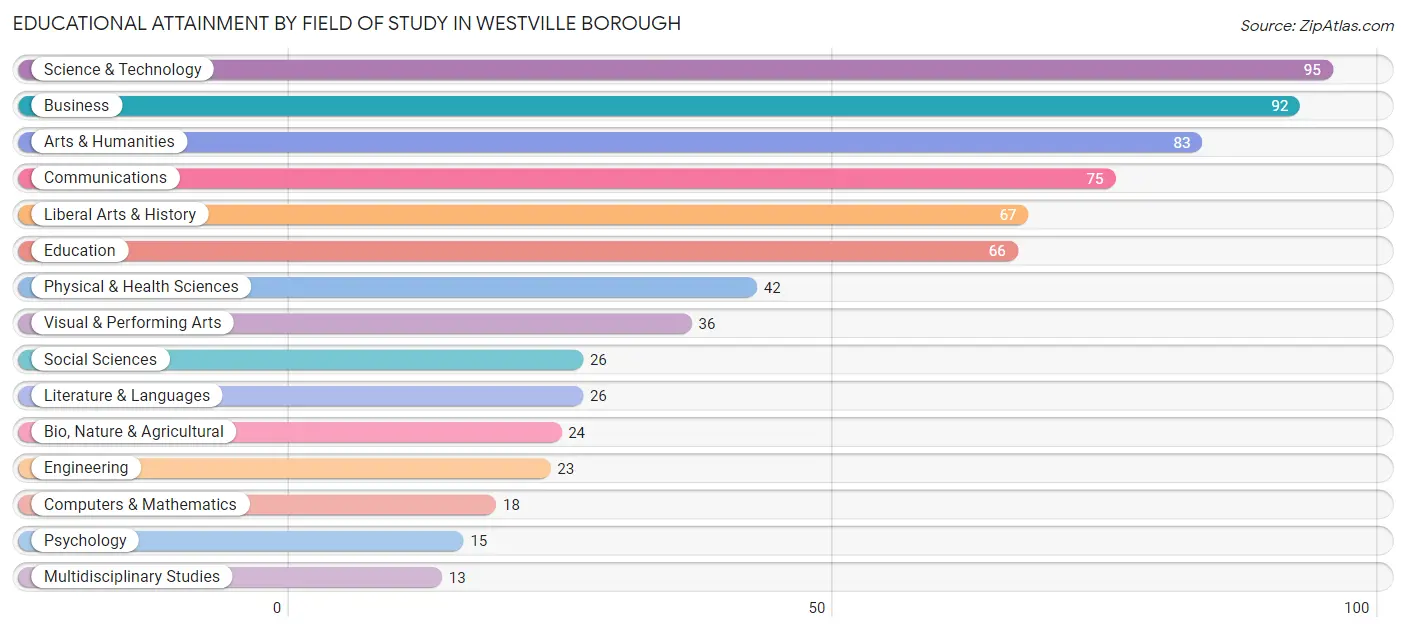
| Field of Study | # Graduates | % Graduates |
| Computers & Mathematics | 18 | 2.6% |
| Bio, Nature & Agricultural | 24 | 3.4% |
| Physical & Health Sciences | 42 | 6.0% |
| Psychology | 15 | 2.1% |
| Social Sciences | 26 | 3.7% |
| Engineering | 23 | 3.3% |
| Multidisciplinary Studies | 13 | 1.8% |
| Science & Technology | 95 | 13.6% |
| Business | 92 | 13.1% |
| Education | 66 | 9.4% |
| Literature & Languages | 26 | 3.7% |
| Liberal Arts & History | 67 | 9.6% |
| Visual & Performing Arts | 36 | 5.1% |
| Communications | 75 | 10.7% |
| Arts & Humanities | 83 | 11.8% |
| Total | 701 | 100.0% |
Transportation & Commute in Westville borough
Vehicle Availability by Sex in Westville borough
The most prevalent vehicle ownership categories in Westville borough are males with 2 vehicles (523, accounting for 46.5%) and females with 2 vehicles (595, making up 49.4%).
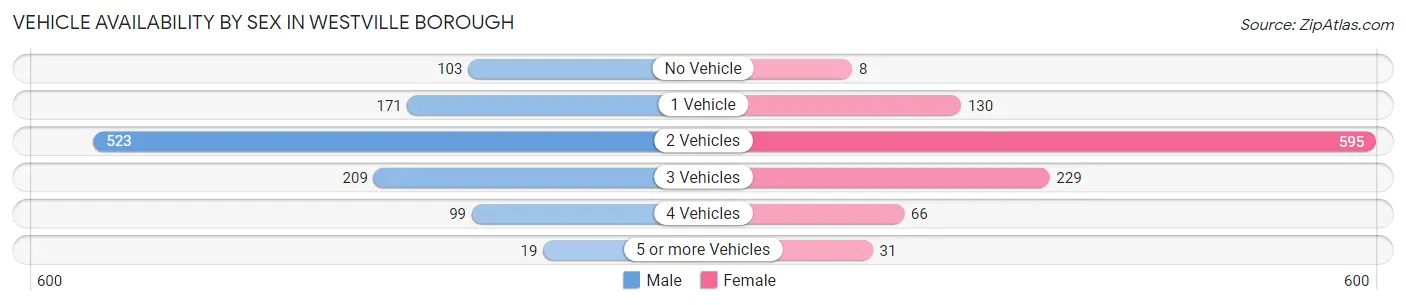
| Vehicles Available | Male | Female |
| No Vehicle | 103 (9.2%) | 8 (0.8%) |
| 1 Vehicle | 171 (15.2%) | 130 (12.3%) |
| 2 Vehicles | 523 (46.5%) | 595 (56.2%) |
| 3 Vehicles | 209 (18.6%) | 229 (21.6%) |
| 4 Vehicles | 99 (8.8%) | 66 (6.2%) |
| 5 or more Vehicles | 19 (1.7%) | 31 (2.9%) |
| Total | 1,124 (100.0%) | 1,059 (100.0%) |
Commute Time in Westville borough
The most frequently occuring commute durations in Westville borough are 15 to 19 minutes (456 commuters, 22.0%), 20 to 24 minutes (319 commuters, 15.4%), and 30 to 34 minutes (318 commuters, 15.3%).
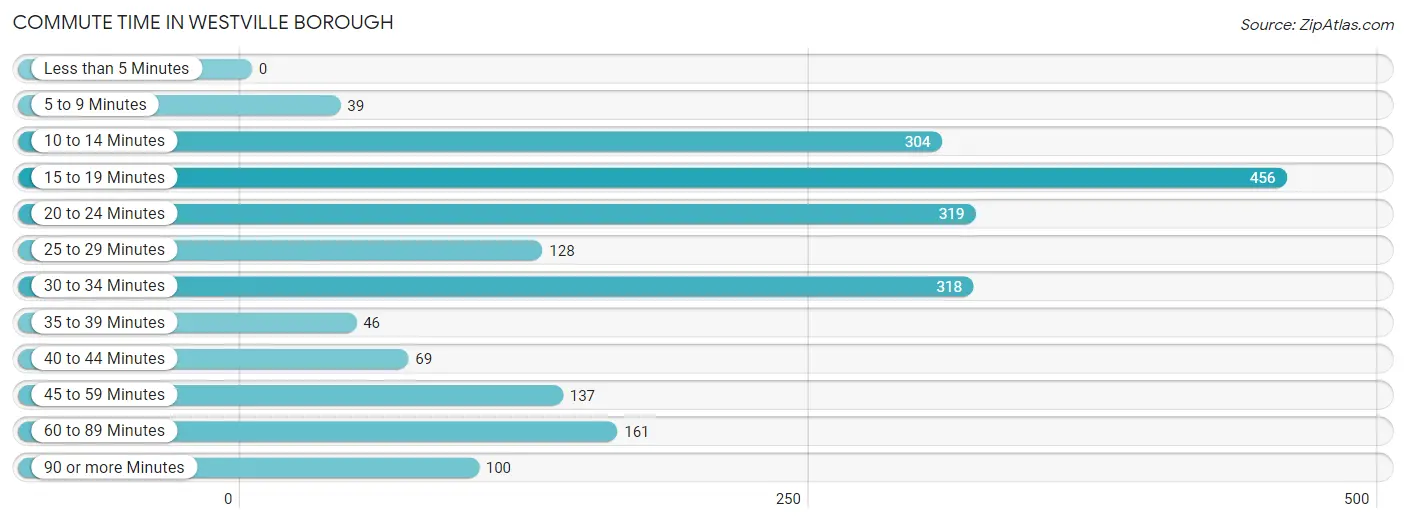
| Commute Time | # Commuters | % Commuters |
| Less than 5 Minutes | 0 | 0.0% |
| 5 to 9 Minutes | 39 | 1.9% |
| 10 to 14 Minutes | 304 | 14.6% |
| 15 to 19 Minutes | 456 | 22.0% |
| 20 to 24 Minutes | 319 | 15.4% |
| 25 to 29 Minutes | 128 | 6.2% |
| 30 to 34 Minutes | 318 | 15.3% |
| 35 to 39 Minutes | 46 | 2.2% |
| 40 to 44 Minutes | 69 | 3.3% |
| 45 to 59 Minutes | 137 | 6.6% |
| 60 to 89 Minutes | 161 | 7.7% |
| 90 or more Minutes | 100 | 4.8% |
Commute Time by Sex in Westville borough
The most common commute times in Westville borough are 10 to 14 minutes (207 commuters, 19.4%) for males and 15 to 19 minutes (298 commuters, 29.6%) for females.
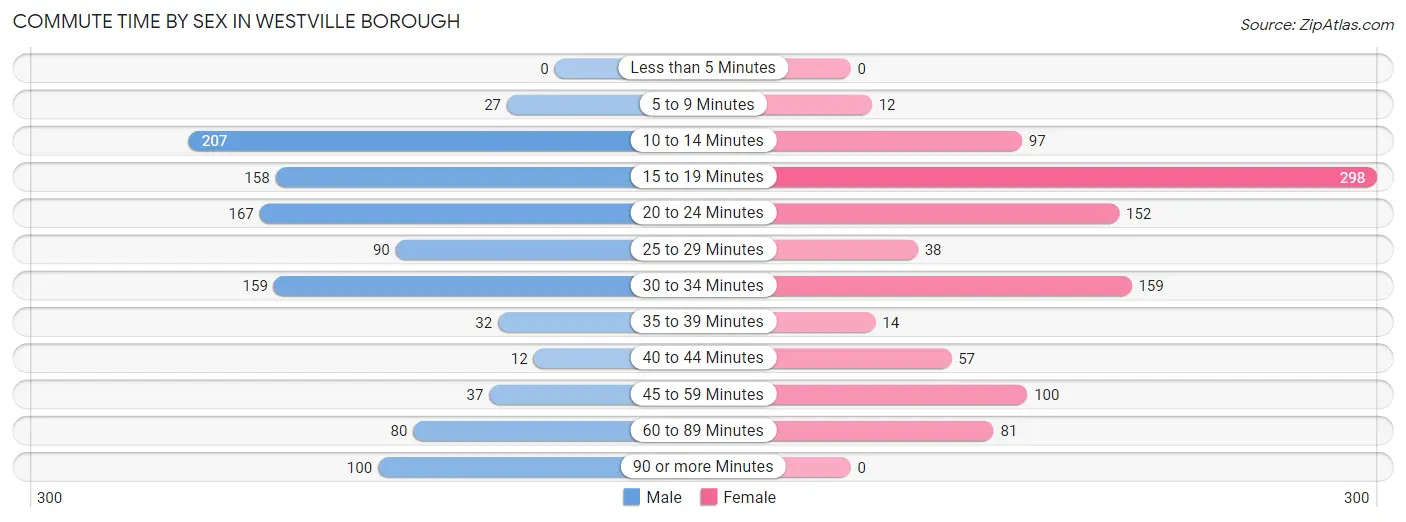
| Commute Time | Male | Female |
| Less than 5 Minutes | 0 (0.0%) | 0 (0.0%) |
| 5 to 9 Minutes | 27 (2.5%) | 12 (1.2%) |
| 10 to 14 Minutes | 207 (19.4%) | 97 (9.6%) |
| 15 to 19 Minutes | 158 (14.8%) | 298 (29.6%) |
| 20 to 24 Minutes | 167 (15.6%) | 152 (15.1%) |
| 25 to 29 Minutes | 90 (8.4%) | 38 (3.8%) |
| 30 to 34 Minutes | 159 (14.9%) | 159 (15.8%) |
| 35 to 39 Minutes | 32 (3.0%) | 14 (1.4%) |
| 40 to 44 Minutes | 12 (1.1%) | 57 (5.7%) |
| 45 to 59 Minutes | 37 (3.5%) | 100 (9.9%) |
| 60 to 89 Minutes | 80 (7.5%) | 81 (8.0%) |
| 90 or more Minutes | 100 (9.3%) | 0 (0.0%) |
Time of Departure to Work by Sex in Westville borough
The most frequent times of departure to work in Westville borough are 6:00 AM to 6:29 AM (187, 17.5%) for males and 8:00 AM to 8:29 AM (229, 22.7%) for females.
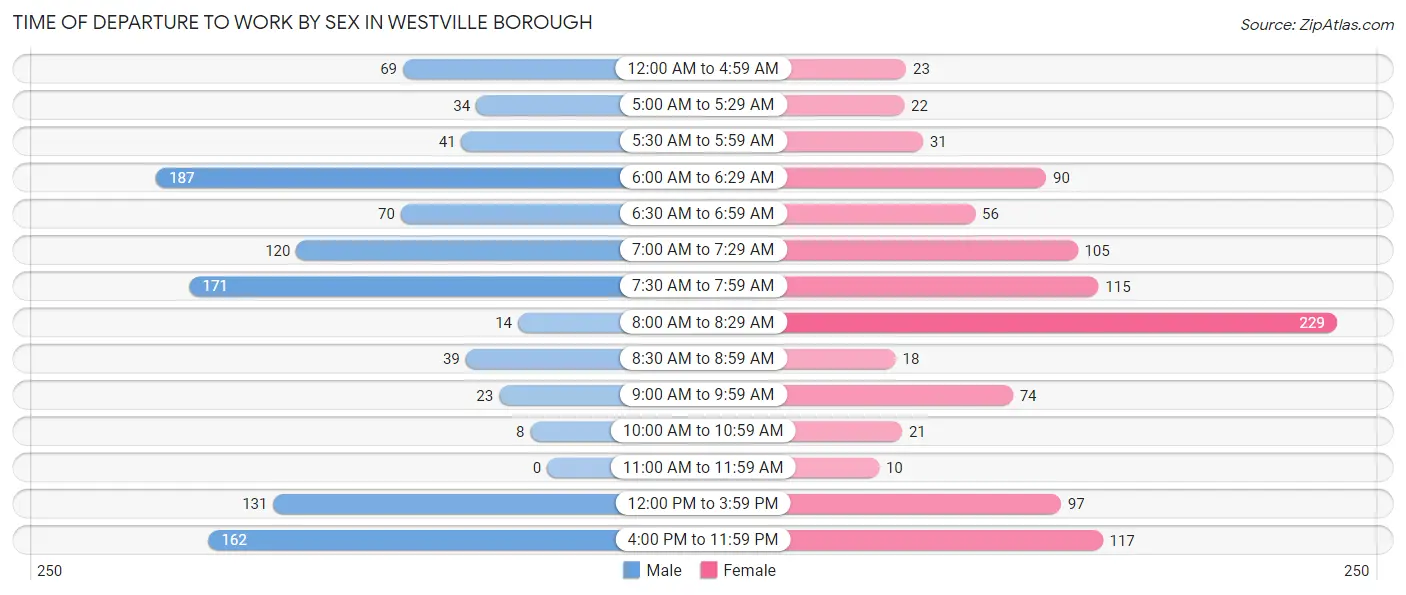
| Time of Departure | Male | Female |
| 12:00 AM to 4:59 AM | 69 (6.5%) | 23 (2.3%) |
| 5:00 AM to 5:29 AM | 34 (3.2%) | 22 (2.2%) |
| 5:30 AM to 5:59 AM | 41 (3.8%) | 31 (3.1%) |
| 6:00 AM to 6:29 AM | 187 (17.5%) | 90 (8.9%) |
| 6:30 AM to 6:59 AM | 70 (6.6%) | 56 (5.6%) |
| 7:00 AM to 7:29 AM | 120 (11.2%) | 105 (10.4%) |
| 7:30 AM to 7:59 AM | 171 (16.0%) | 115 (11.4%) |
| 8:00 AM to 8:29 AM | 14 (1.3%) | 229 (22.7%) |
| 8:30 AM to 8:59 AM | 39 (3.6%) | 18 (1.8%) |
| 9:00 AM to 9:59 AM | 23 (2.1%) | 74 (7.3%) |
| 10:00 AM to 10:59 AM | 8 (0.7%) | 21 (2.1%) |
| 11:00 AM to 11:59 AM | 0 (0.0%) | 10 (1.0%) |
| 12:00 PM to 3:59 PM | 131 (12.2%) | 97 (9.6%) |
| 4:00 PM to 11:59 PM | 162 (15.1%) | 117 (11.6%) |
| Total | 1,069 (100.0%) | 1,008 (100.0%) |
Housing Occupancy in Westville borough
Occupancy by Ownership in Westville borough
Of the total 1,910 dwellings in Westville borough, owner-occupied units account for 1,131 (59.2%), while renter-occupied units make up 779 (40.8%).
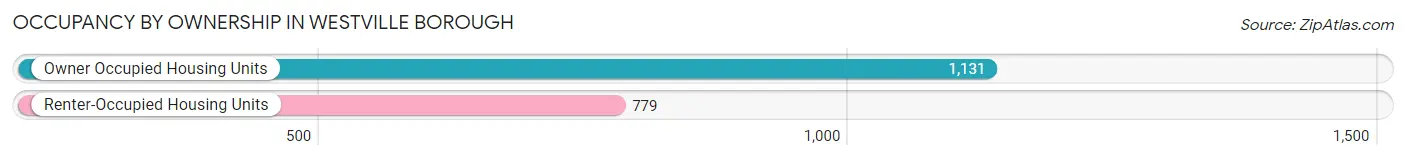
| Occupancy | # Housing Units | % Housing Units |
| Owner Occupied Housing Units | 1,131 | 59.2% |
| Renter-Occupied Housing Units | 779 | 40.8% |
| Total Occupied Housing Units | 1,910 | 100.0% |
Occupancy by Household Size in Westville borough
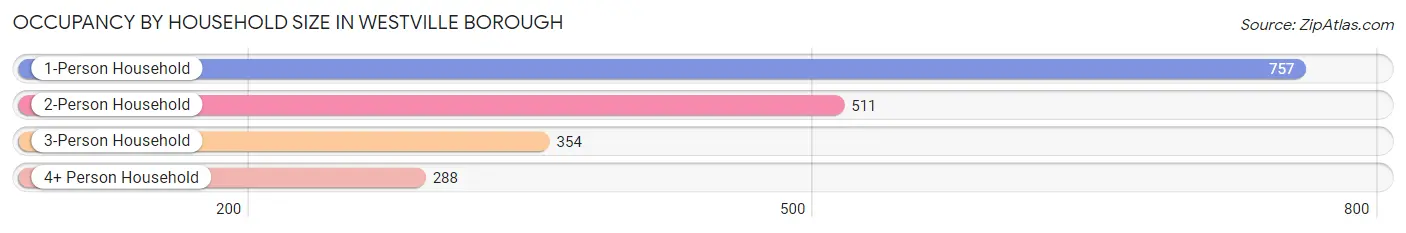
| Household Size | # Housing Units | % Housing Units |
| 1-Person Household | 757 | 39.6% |
| 2-Person Household | 511 | 26.8% |
| 3-Person Household | 354 | 18.5% |
| 4+ Person Household | 288 | 15.1% |
| Total Housing Units | 1,910 | 100.0% |
Occupancy by Ownership by Household Size in Westville borough
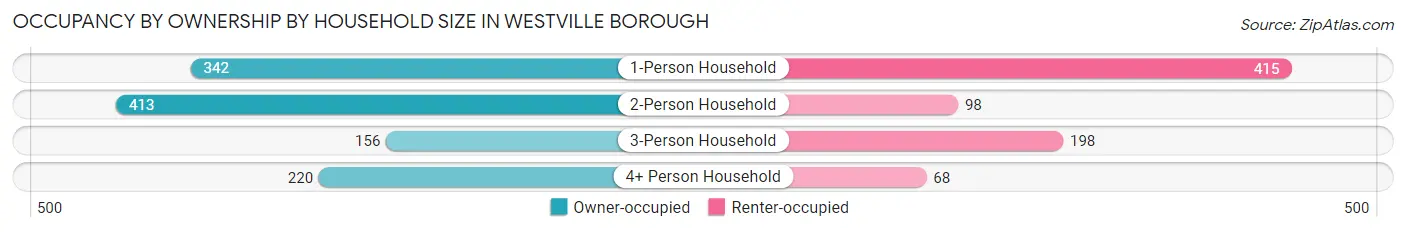
| Household Size | Owner-occupied | Renter-occupied |
| 1-Person Household | 342 (45.2%) | 415 (54.8%) |
| 2-Person Household | 413 (80.8%) | 98 (19.2%) |
| 3-Person Household | 156 (44.1%) | 198 (55.9%) |
| 4+ Person Household | 220 (76.4%) | 68 (23.6%) |
| Total Housing Units | 1,131 (59.2%) | 779 (40.8%) |
Occupancy by Educational Attainment in Westville borough
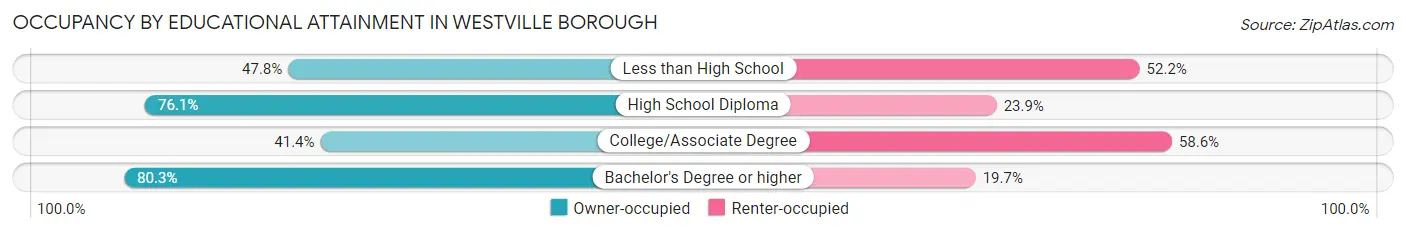
| Household Size | Owner-occupied | Renter-occupied |
| Less than High School | 64 (47.8%) | 70 (52.2%) |
| High School Diploma | 465 (76.1%) | 146 (23.9%) |
| College/Associate Degree | 354 (41.4%) | 502 (58.6%) |
| Bachelor's Degree or higher | 248 (80.3%) | 61 (19.7%) |
Occupancy by Age of Householder in Westville borough
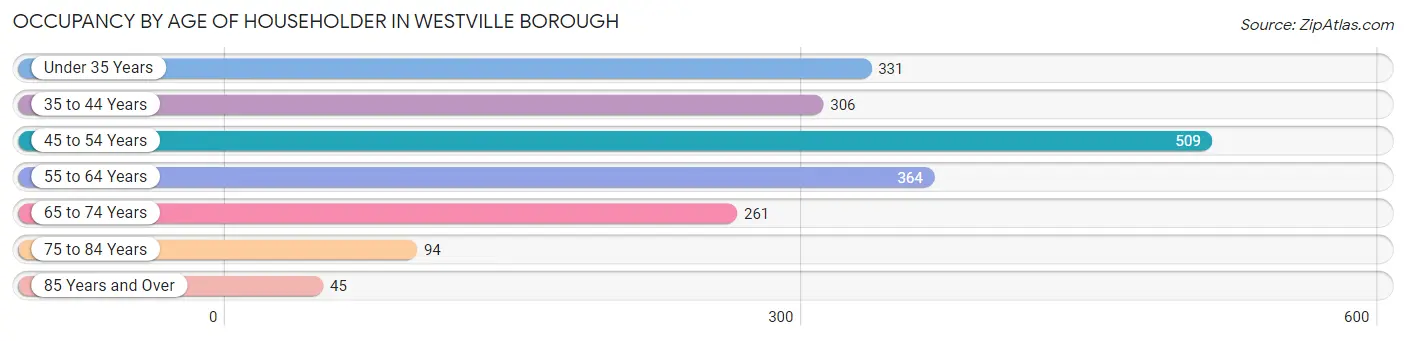
| Age Bracket | # Households | % Households |
| Under 35 Years | 331 | 17.3% |
| 35 to 44 Years | 306 | 16.0% |
| 45 to 54 Years | 509 | 26.7% |
| 55 to 64 Years | 364 | 19.1% |
| 65 to 74 Years | 261 | 13.7% |
| 75 to 84 Years | 94 | 4.9% |
| 85 Years and Over | 45 | 2.4% |
| Total | 1,910 | 100.0% |
Housing Finances in Westville borough
Median Income by Occupancy in Westville borough
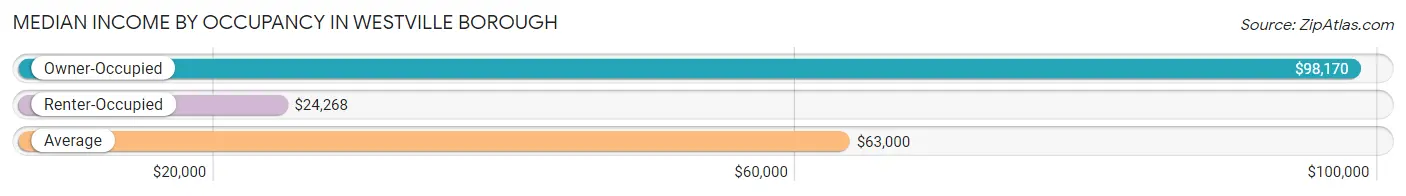
| Occupancy Type | # Households | Median Income |
| Owner-Occupied | 1,131 (59.2%) | $98,170 |
| Renter-Occupied | 779 (40.8%) | $24,268 |
| Average | 1,910 (100.0%) | $63,000 |
Occupancy by Householder Income Bracket in Westville borough
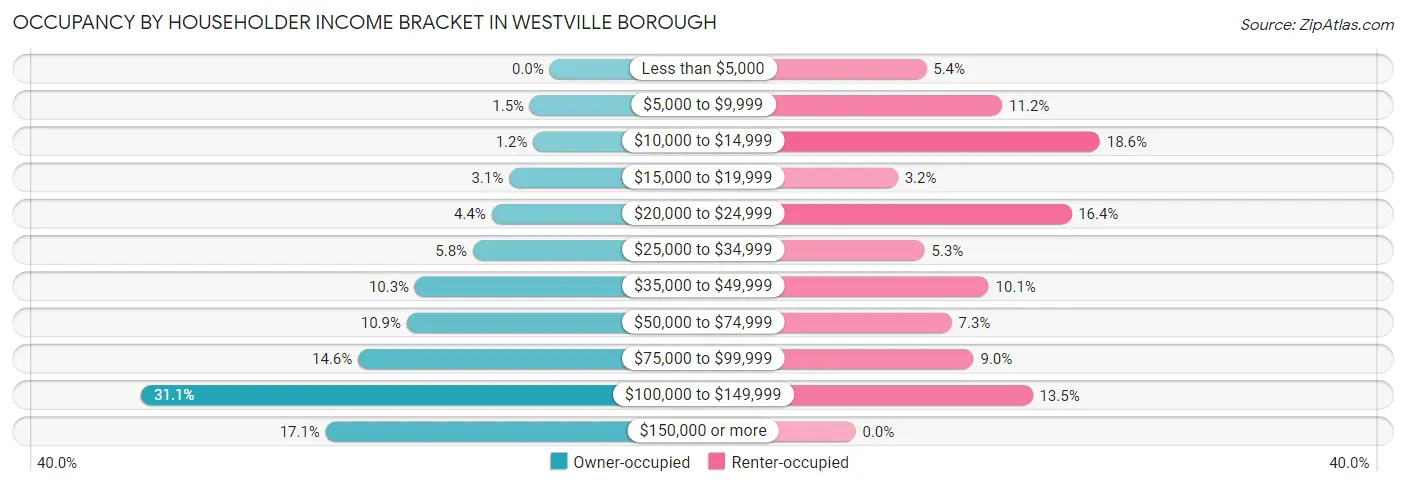
| Income Bracket | Owner-occupied | Renter-occupied |
| Less than $5,000 | 0 (0.0%) | 42 (5.4%) |
| $5,000 to $9,999 | 17 (1.5%) | 87 (11.2%) |
| $10,000 to $14,999 | 14 (1.2%) | 145 (18.6%) |
| $15,000 to $19,999 | 35 (3.1%) | 25 (3.2%) |
| $20,000 to $24,999 | 50 (4.4%) | 128 (16.4%) |
| $25,000 to $34,999 | 66 (5.8%) | 41 (5.3%) |
| $35,000 to $49,999 | 116 (10.3%) | 79 (10.1%) |
| $50,000 to $74,999 | 123 (10.9%) | 57 (7.3%) |
| $75,000 to $99,999 | 165 (14.6%) | 70 (9.0%) |
| $100,000 to $149,999 | 352 (31.1%) | 105 (13.5%) |
| $150,000 or more | 193 (17.1%) | 0 (0.0%) |
| Total | 1,131 (100.0%) | 779 (100.0%) |
Monthly Housing Cost Tiers in Westville borough
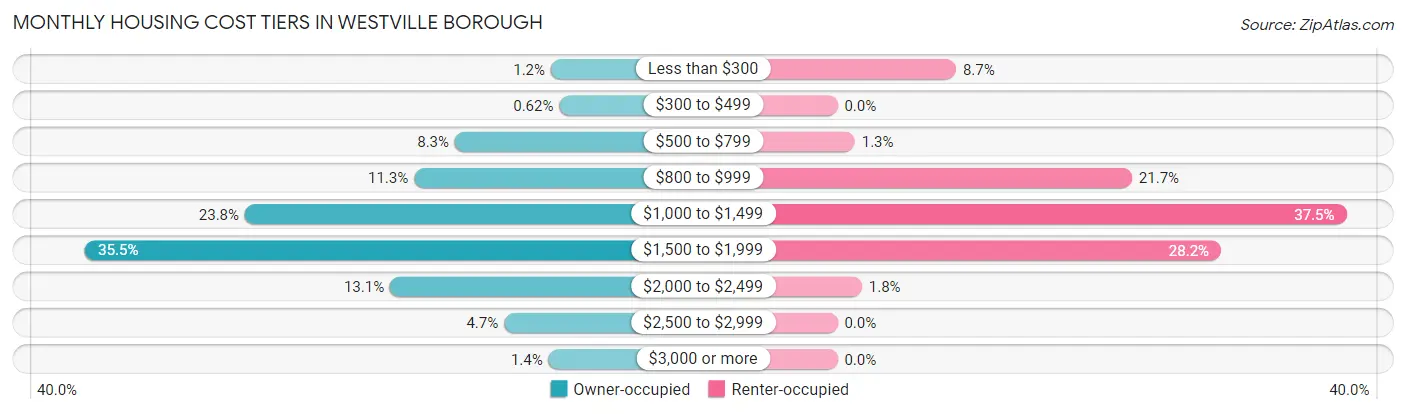
| Monthly Cost | Owner-occupied | Renter-occupied |
| Less than $300 | 14 (1.2%) | 68 (8.7%) |
| $300 to $499 | 7 (0.6%) | 0 (0.0%) |
| $500 to $799 | 94 (8.3%) | 10 (1.3%) |
| $800 to $999 | 128 (11.3%) | 169 (21.7%) |
| $1,000 to $1,499 | 269 (23.8%) | 292 (37.5%) |
| $1,500 to $1,999 | 402 (35.5%) | 220 (28.2%) |
| $2,000 to $2,499 | 148 (13.1%) | 14 (1.8%) |
| $2,500 to $2,999 | 53 (4.7%) | 0 (0.0%) |
| $3,000 or more | 16 (1.4%) | 0 (0.0%) |
| Total | 1,131 (100.0%) | 779 (100.0%) |
Physical Housing Characteristics in Westville borough
Housing Structures in Westville borough
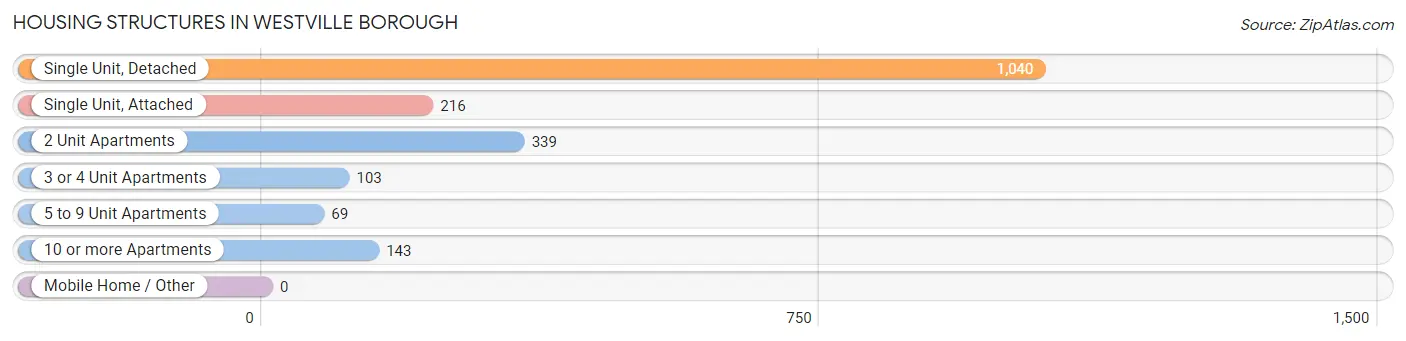
| Structure Type | # Housing Units | % Housing Units |
| Single Unit, Detached | 1,040 | 54.4% |
| Single Unit, Attached | 216 | 11.3% |
| 2 Unit Apartments | 339 | 17.7% |
| 3 or 4 Unit Apartments | 103 | 5.4% |
| 5 to 9 Unit Apartments | 69 | 3.6% |
| 10 or more Apartments | 143 | 7.5% |
| Mobile Home / Other | 0 | 0.0% |
| Total | 1,910 | 100.0% |
Housing Structures by Occupancy in Westville borough
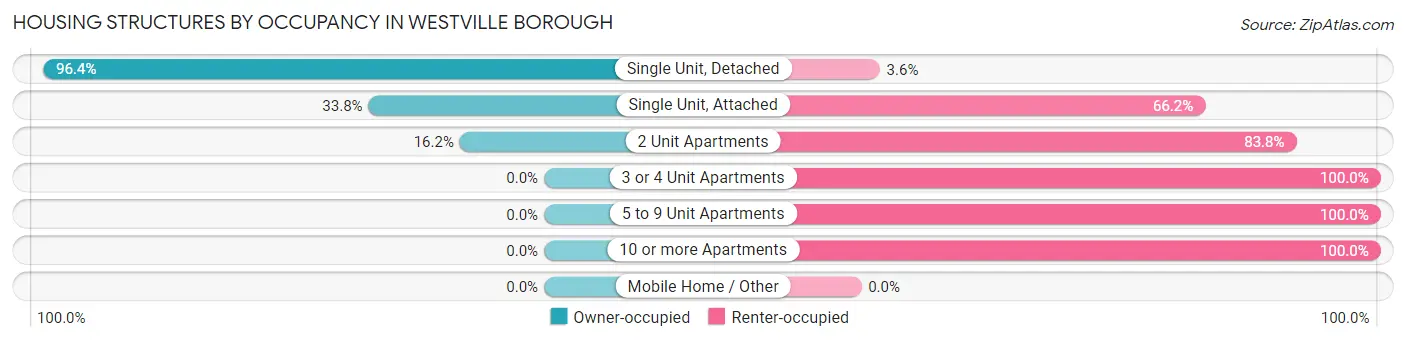
| Structure Type | Owner-occupied | Renter-occupied |
| Single Unit, Detached | 1,003 (96.4%) | 37 (3.6%) |
| Single Unit, Attached | 73 (33.8%) | 143 (66.2%) |
| 2 Unit Apartments | 55 (16.2%) | 284 (83.8%) |
| 3 or 4 Unit Apartments | 0 (0.0%) | 103 (100.0%) |
| 5 to 9 Unit Apartments | 0 (0.0%) | 69 (100.0%) |
| 10 or more Apartments | 0 (0.0%) | 143 (100.0%) |
| Mobile Home / Other | 0 (0.0%) | 0 (0.0%) |
| Total | 1,131 (59.2%) | 779 (40.8%) |
Housing Structures by Number of Rooms in Westville borough
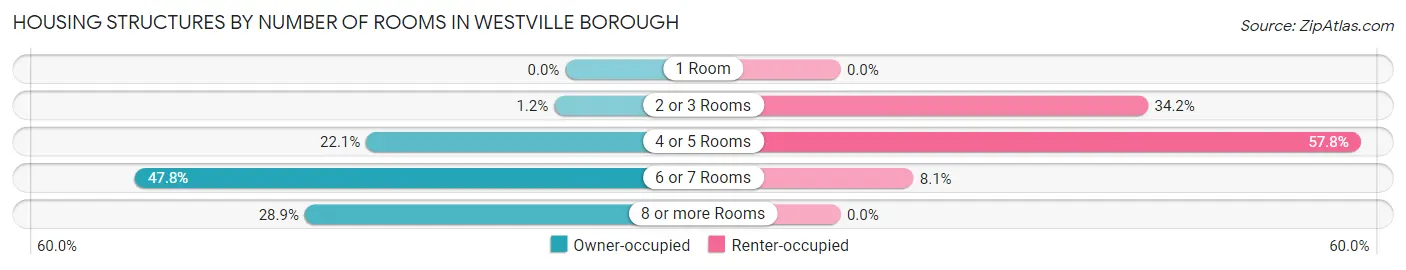
| Number of Rooms | Owner-occupied | Renter-occupied |
| 1 Room | 0 (0.0%) | 0 (0.0%) |
| 2 or 3 Rooms | 14 (1.2%) | 266 (34.2%) |
| 4 or 5 Rooms | 250 (22.1%) | 450 (57.8%) |
| 6 or 7 Rooms | 540 (47.7%) | 63 (8.1%) |
| 8 or more Rooms | 327 (28.9%) | 0 (0.0%) |
| Total | 1,131 (100.0%) | 779 (100.0%) |
Housing Structure by Heating Type in Westville borough
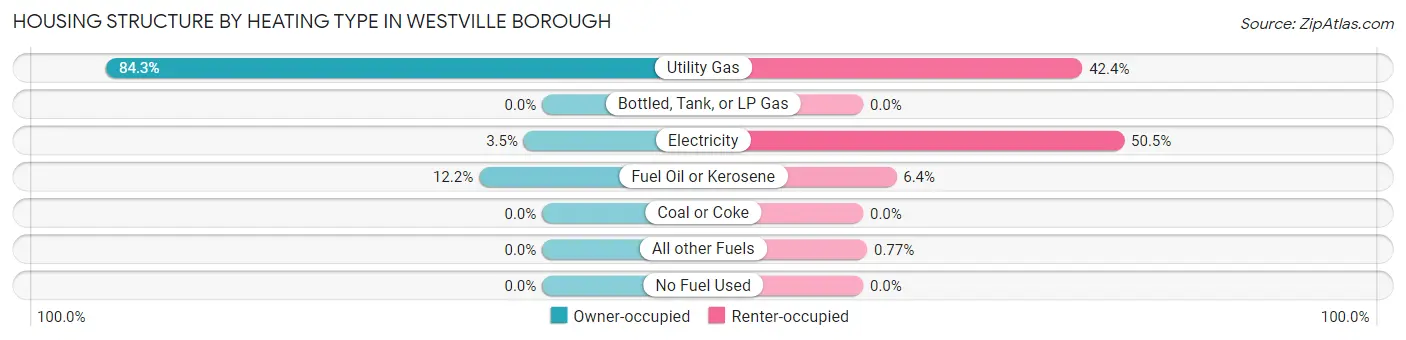
| Heating Type | Owner-occupied | Renter-occupied |
| Utility Gas | 953 (84.3%) | 330 (42.4%) |
| Bottled, Tank, or LP Gas | 0 (0.0%) | 0 (0.0%) |
| Electricity | 40 (3.5%) | 393 (50.4%) |
| Fuel Oil or Kerosene | 138 (12.2%) | 50 (6.4%) |
| Coal or Coke | 0 (0.0%) | 0 (0.0%) |
| All other Fuels | 0 (0.0%) | 6 (0.8%) |
| No Fuel Used | 0 (0.0%) | 0 (0.0%) |
| Total | 1,131 (100.0%) | 779 (100.0%) |
Household Vehicle Usage in Westville borough
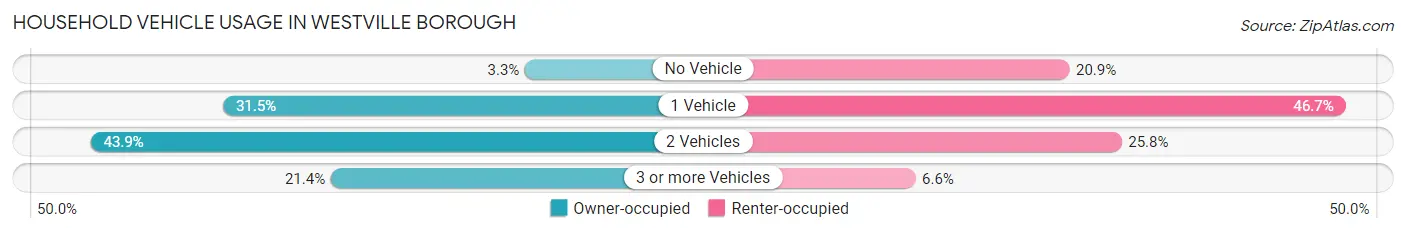
| Vehicles per Household | Owner-occupied | Renter-occupied |
| No Vehicle | 37 (3.3%) | 163 (20.9%) |
| 1 Vehicle | 356 (31.5%) | 364 (46.7%) |
| 2 Vehicles | 496 (43.9%) | 201 (25.8%) |
| 3 or more Vehicles | 242 (21.4%) | 51 (6.6%) |
| Total | 1,131 (100.0%) | 779 (100.0%) |
Real Estate & Mortgages in Westville borough
Real Estate and Mortgage Overview in Westville borough
| Characteristic | Without Mortgage | With Mortgage |
| Housing Units | 359 | 772 |
| Median Property Value | $166,600 | $175,100 |
| Median Household Income | $50,804 | $167 |
| Monthly Housing Costs | $878 | $16 |
| Real Estate Taxes | $6,218 | $6 |
Property Value by Mortgage Status in Westville borough
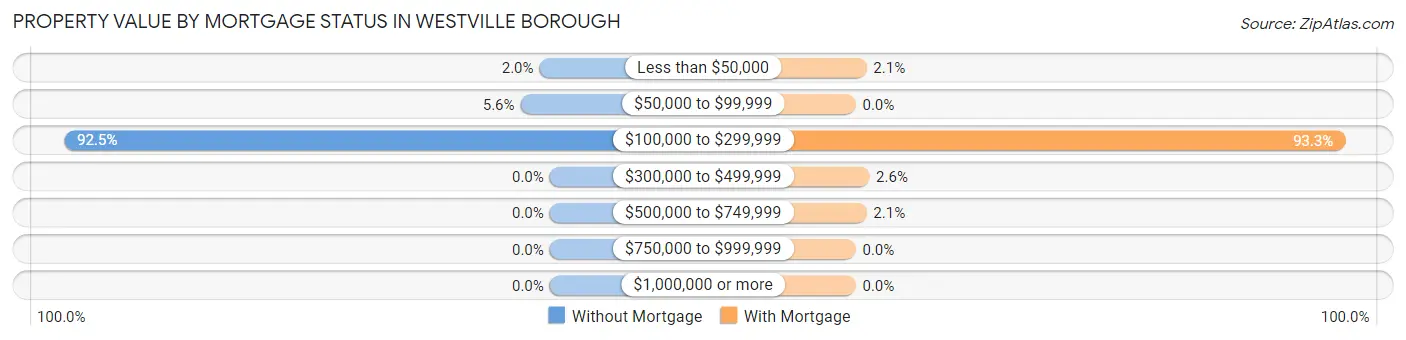
| Property Value | Without Mortgage | With Mortgage |
| Less than $50,000 | 7 (1.9%) | 16 (2.1%) |
| $50,000 to $99,999 | 20 (5.6%) | 0 (0.0%) |
| $100,000 to $299,999 | 332 (92.5%) | 720 (93.3%) |
| $300,000 to $499,999 | 0 (0.0%) | 20 (2.6%) |
| $500,000 to $749,999 | 0 (0.0%) | 16 (2.1%) |
| $750,000 to $999,999 | 0 (0.0%) | 0 (0.0%) |
| $1,000,000 or more | 0 (0.0%) | 0 (0.0%) |
| Total | 359 (100.0%) | 772 (100.0%) |
Household Income by Mortgage Status in Westville borough
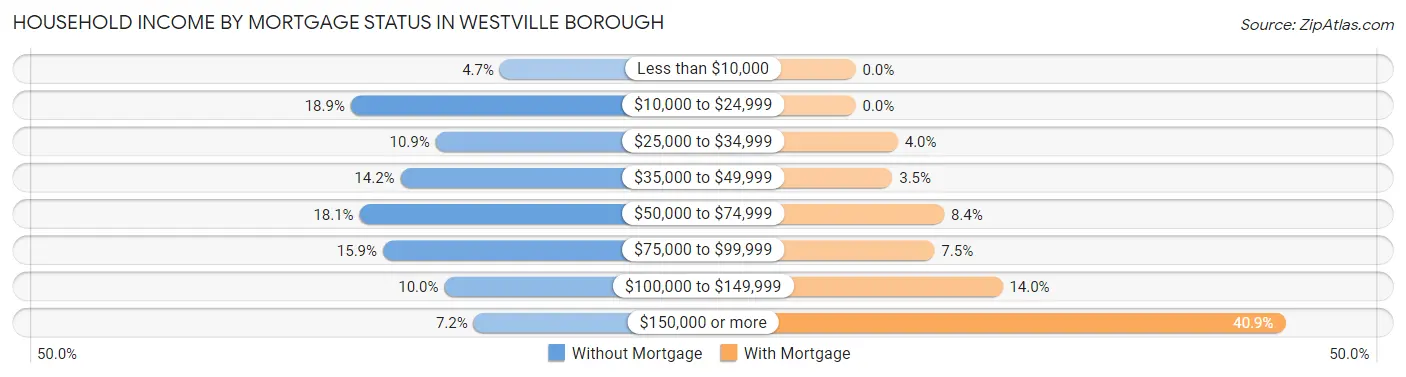
| Household Income | Without Mortgage | With Mortgage |
| Less than $10,000 | 17 (4.7%) | 0 (0.0%) |
| $10,000 to $24,999 | 68 (18.9%) | 0 (0.0%) |
| $25,000 to $34,999 | 39 (10.9%) | 31 (4.0%) |
| $35,000 to $49,999 | 51 (14.2%) | 27 (3.5%) |
| $50,000 to $74,999 | 65 (18.1%) | 65 (8.4%) |
| $75,000 to $99,999 | 57 (15.9%) | 58 (7.5%) |
| $100,000 to $149,999 | 36 (10.0%) | 108 (14.0%) |
| $150,000 or more | 26 (7.2%) | 316 (40.9%) |
| Total | 359 (100.0%) | 772 (100.0%) |
Property Value to Household Income Ratio in Westville borough
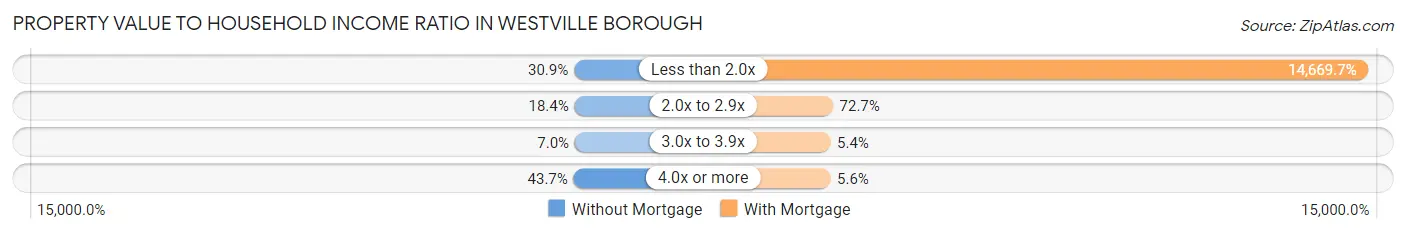
| Value-to-Income Ratio | Without Mortgage | With Mortgage |
| Less than 2.0x | 111 (30.9%) | 113,250 (14,669.7%) |
| 2.0x to 2.9x | 66 (18.4%) | 561 (72.7%) |
| 3.0x to 3.9x | 25 (7.0%) | 42 (5.4%) |
| 4.0x or more | 157 (43.7%) | 43 (5.6%) |
| Total | 359 (100.0%) | 772 (100.0%) |
Real Estate Taxes by Mortgage Status in Westville borough
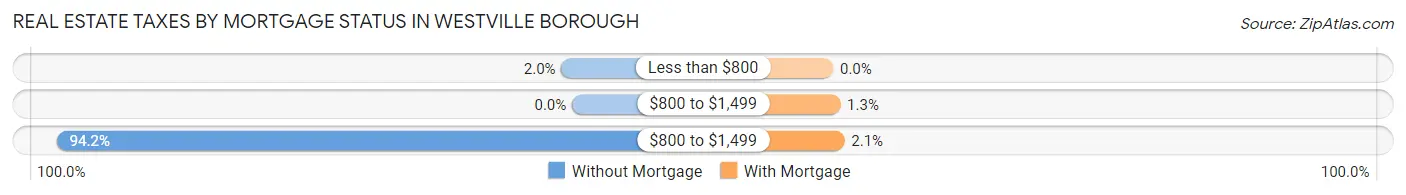
| Property Taxes | Without Mortgage | With Mortgage |
| Less than $800 | 7 (1.9%) | 0 (0.0%) |
| $800 to $1,499 | 0 (0.0%) | 10 (1.3%) |
| $800 to $1,499 | 338 (94.2%) | 16 (2.1%) |
| Total | 359 (100.0%) | 772 (100.0%) |
Health & Disability in Westville borough
Health Insurance Coverage by Age in Westville borough
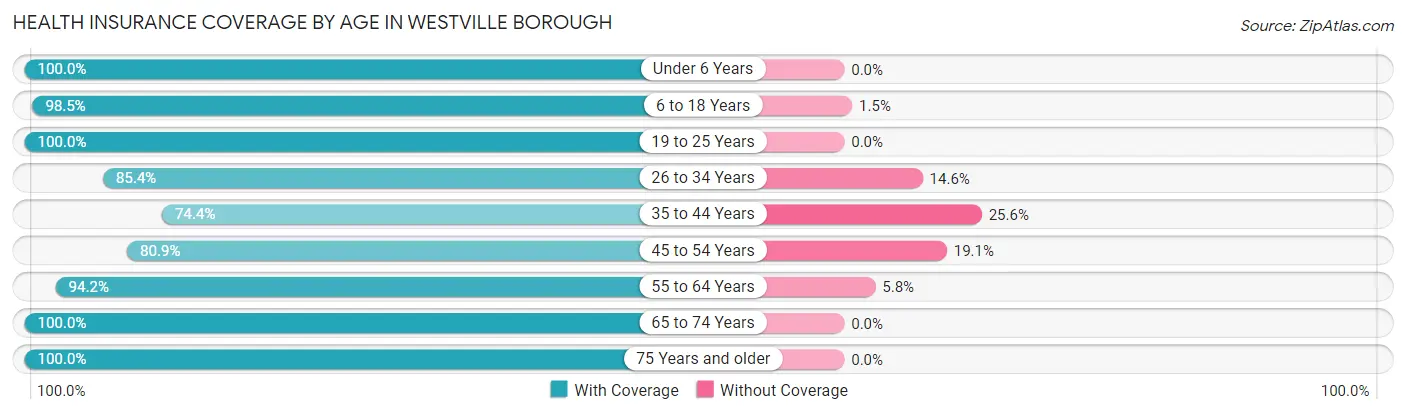
| Age Bracket | With Coverage | Without Coverage |
| Under 6 Years | 427 (100.0%) | 0 (0.0%) |
| 6 to 18 Years | 468 (98.5%) | 7 (1.5%) |
| 19 to 25 Years | 267 (100.0%) | 0 (0.0%) |
| 26 to 34 Years | 520 (85.4%) | 89 (14.6%) |
| 35 to 44 Years | 386 (74.4%) | 133 (25.6%) |
| 45 to 54 Years | 554 (80.9%) | 131 (19.1%) |
| 55 to 64 Years | 569 (94.2%) | 35 (5.8%) |
| 65 to 74 Years | 512 (100.0%) | 0 (0.0%) |
| 75 Years and older | 178 (100.0%) | 0 (0.0%) |
| Total | 3,881 (90.8%) | 395 (9.2%) |
Health Insurance Coverage by Citizenship Status in Westville borough
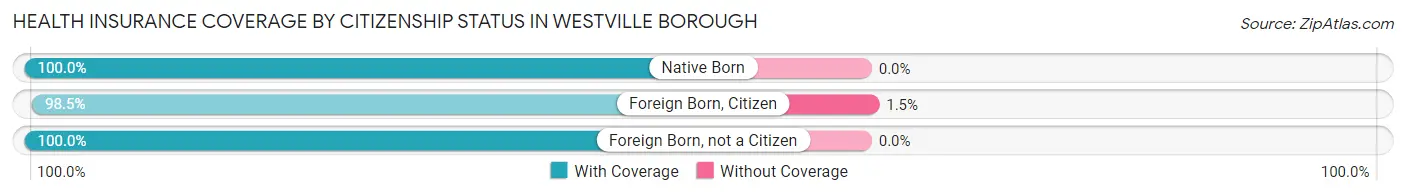
| Citizenship Status | With Coverage | Without Coverage |
| Native Born | 427 (100.0%) | 0 (0.0%) |
| Foreign Born, Citizen | 468 (98.5%) | 7 (1.5%) |
| Foreign Born, not a Citizen | 267 (100.0%) | 0 (0.0%) |
Health Insurance Coverage by Household Income in Westville borough
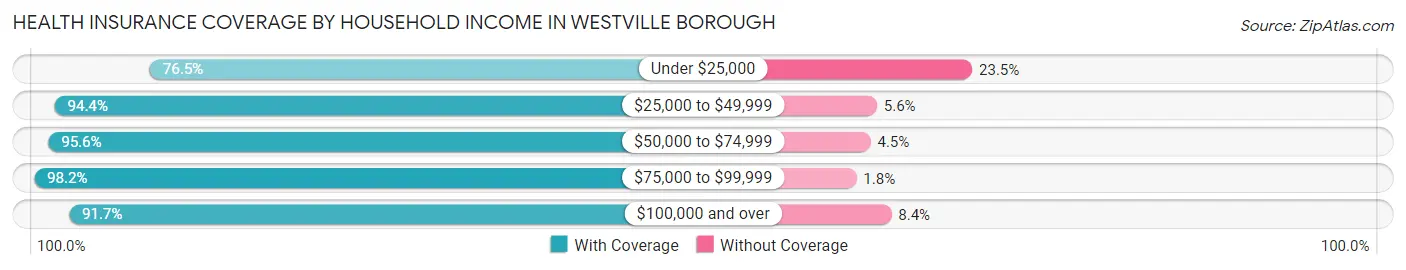
| Household Income | With Coverage | Without Coverage |
| Under $25,000 | 593 (76.5%) | 182 (23.5%) |
| $25,000 to $49,999 | 670 (94.4%) | 40 (5.6%) |
| $50,000 to $74,999 | 365 (95.6%) | 17 (4.4%) |
| $75,000 to $99,999 | 653 (98.2%) | 12 (1.8%) |
| $100,000 and over | 1,581 (91.6%) | 144 (8.4%) |
Public vs Private Health Insurance Coverage by Age in Westville borough
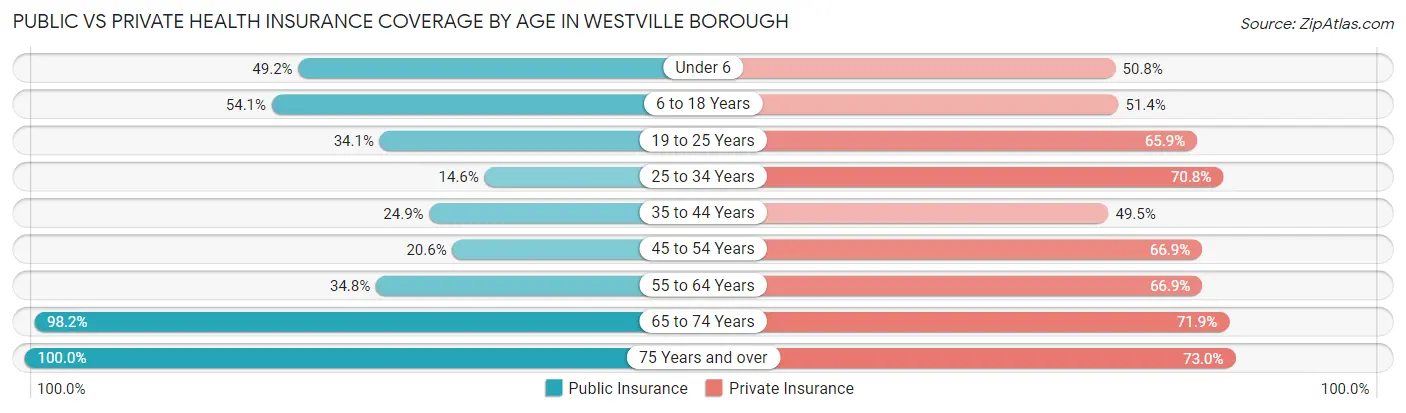
| Age Bracket | Public Insurance | Private Insurance |
| Under 6 | 210 (49.2%) | 217 (50.8%) |
| 6 to 18 Years | 257 (54.1%) | 244 (51.4%) |
| 19 to 25 Years | 91 (34.1%) | 176 (65.9%) |
| 25 to 34 Years | 89 (14.6%) | 431 (70.8%) |
| 35 to 44 Years | 129 (24.9%) | 257 (49.5%) |
| 45 to 54 Years | 141 (20.6%) | 458 (66.9%) |
| 55 to 64 Years | 210 (34.8%) | 404 (66.9%) |
| 65 to 74 Years | 503 (98.2%) | 368 (71.9%) |
| 75 Years and over | 178 (100.0%) | 130 (73.0%) |
| Total | 1,808 (42.3%) | 2,685 (62.8%) |
Disability Status by Sex by Age in Westville borough
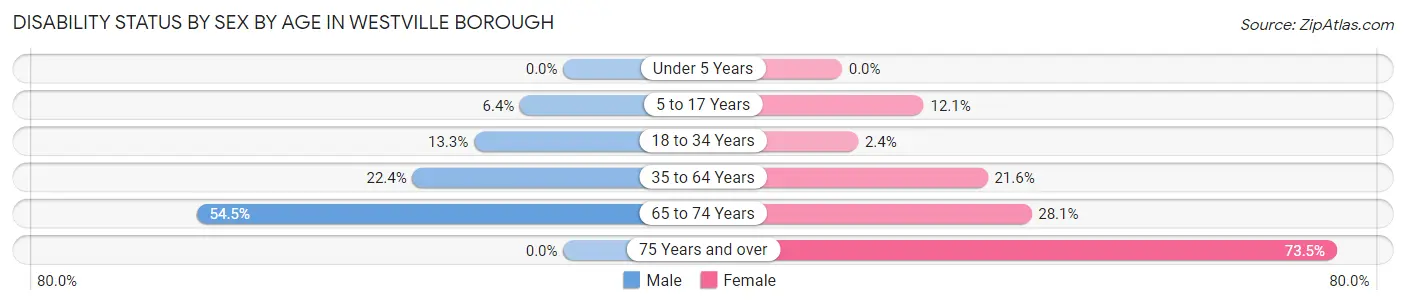
| Age Bracket | Male | Female |
| Under 5 Years | 0 (0.0%) | 0 (0.0%) |
| 5 to 17 Years | 15 (6.4%) | 34 (12.1%) |
| 18 to 34 Years | 50 (13.3%) | 12 (2.4%) |
| 35 to 64 Years | 204 (22.4%) | 194 (21.6%) |
| 65 to 74 Years | 153 (54.4%) | 65 (28.1%) |
| 75 Years and over | 0 (0.0%) | 111 (73.5%) |
Disability Class by Sex by Age in Westville borough
Disability Class: Hearing Difficulty
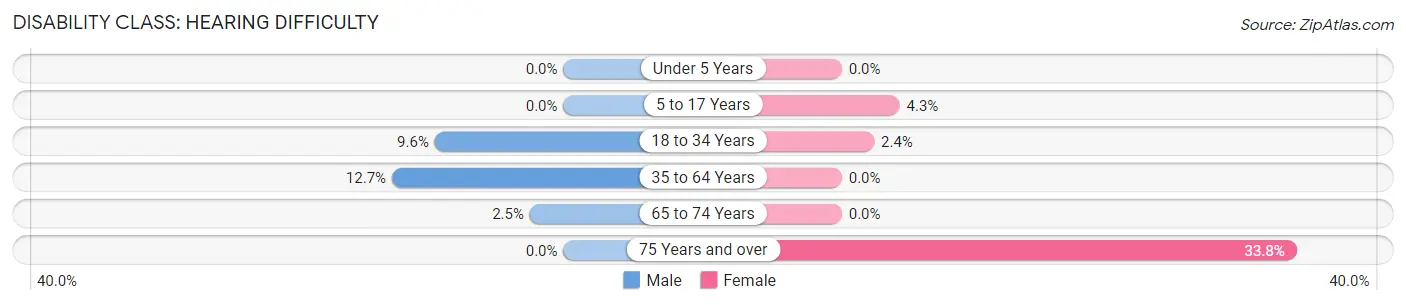
| Age Bracket | Male | Female |
| Under 5 Years | 0 (0.0%) | 0 (0.0%) |
| 5 to 17 Years | 0 (0.0%) | 12 (4.3%) |
| 18 to 34 Years | 36 (9.6%) | 12 (2.4%) |
| 35 to 64 Years | 116 (12.7%) | 0 (0.0%) |
| 65 to 74 Years | 7 (2.5%) | 0 (0.0%) |
| 75 Years and over | 0 (0.0%) | 51 (33.8%) |
Disability Class: Vision Difficulty
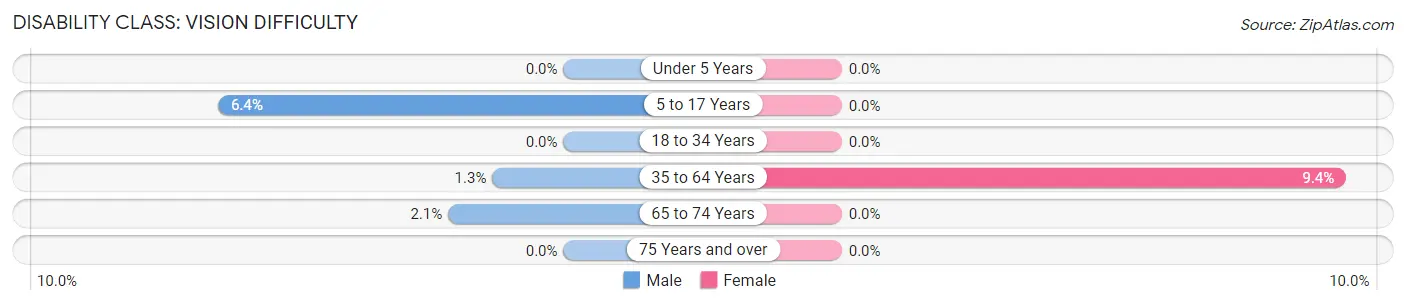
| Age Bracket | Male | Female |
| Under 5 Years | 0 (0.0%) | 0 (0.0%) |
| 5 to 17 Years | 15 (6.4%) | 0 (0.0%) |
| 18 to 34 Years | 0 (0.0%) | 0 (0.0%) |
| 35 to 64 Years | 12 (1.3%) | 84 (9.4%) |
| 65 to 74 Years | 6 (2.1%) | 0 (0.0%) |
| 75 Years and over | 0 (0.0%) | 0 (0.0%) |
Disability Class: Cognitive Difficulty
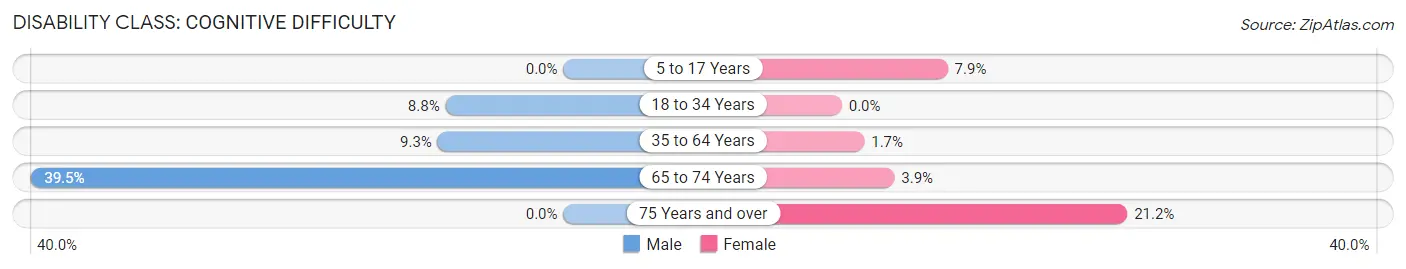
| Age Bracket | Male | Female |
| 5 to 17 Years | 0 (0.0%) | 22 (7.9%) |
| 18 to 34 Years | 33 (8.7%) | 0 (0.0%) |
| 35 to 64 Years | 85 (9.3%) | 15 (1.7%) |
| 65 to 74 Years | 111 (39.5%) | 9 (3.9%) |
| 75 Years and over | 0 (0.0%) | 32 (21.2%) |
Disability Class: Ambulatory Difficulty
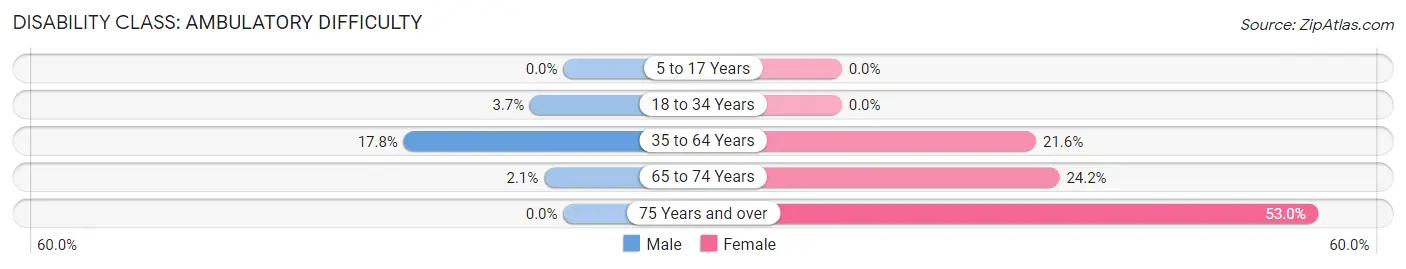
| Age Bracket | Male | Female |
| 5 to 17 Years | 0 (0.0%) | 0 (0.0%) |
| 18 to 34 Years | 14 (3.7%) | 0 (0.0%) |
| 35 to 64 Years | 162 (17.8%) | 194 (21.6%) |
| 65 to 74 Years | 6 (2.1%) | 56 (24.2%) |
| 75 Years and over | 0 (0.0%) | 80 (53.0%) |
Disability Class: Self-Care Difficulty
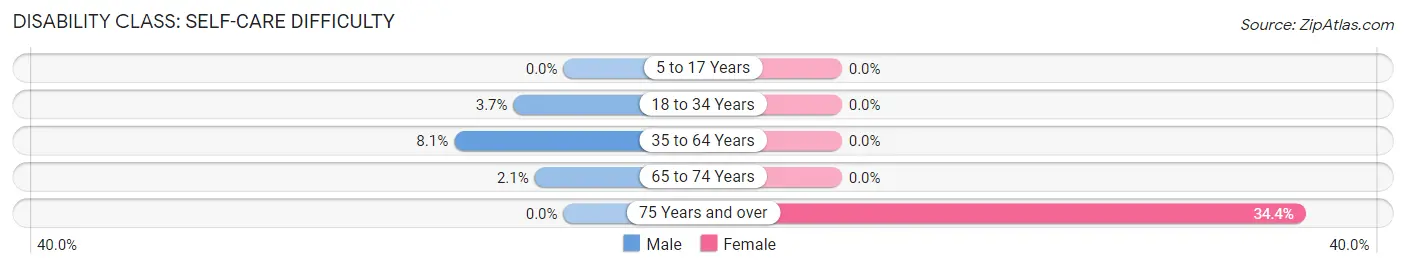
| Age Bracket | Male | Female |
| 5 to 17 Years | 0 (0.0%) | 0 (0.0%) |
| 18 to 34 Years | 14 (3.7%) | 0 (0.0%) |
| 35 to 64 Years | 74 (8.1%) | 0 (0.0%) |
| 65 to 74 Years | 6 (2.1%) | 0 (0.0%) |
| 75 Years and over | 0 (0.0%) | 52 (34.4%) |
Technology Access in Westville borough
Computing Device Access in Westville borough
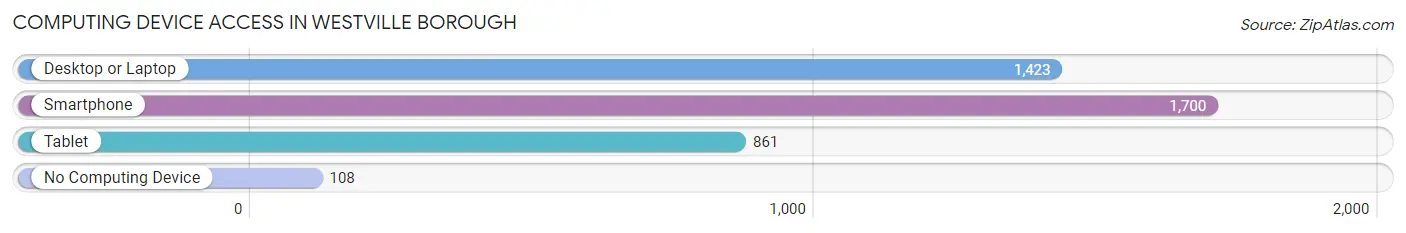
| Device Type | # Households | % Households |
| Desktop or Laptop | 1,423 | 74.5% |
| Smartphone | 1,700 | 89.0% |
| Tablet | 861 | 45.1% |
| No Computing Device | 108 | 5.7% |
| Total | 1,910 | 100.0% |
Internet Access in Westville borough
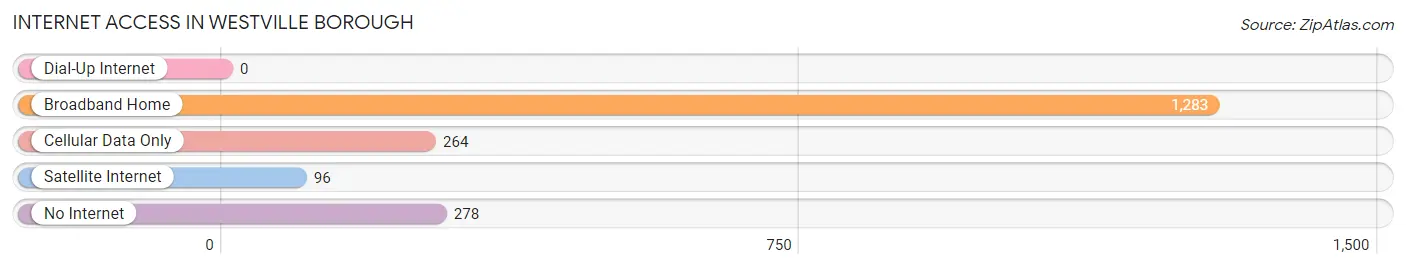
| Internet Type | # Households | % Households |
| Dial-Up Internet | 0 | 0.0% |
| Broadband Home | 1,283 | 67.2% |
| Cellular Data Only | 264 | 13.8% |
| Satellite Internet | 96 | 5.0% |
| No Internet | 278 | 14.5% |
| Total | 1,910 | 100.0% |
Westville borough Summary
History
Westville Borough is a small borough located in Gloucester County, New Jersey. It is situated on the banks of the Delaware River, just south of Philadelphia. The borough was originally part of Deptford Township, which was established in 1695. In 1871, the area was incorporated as Westville Borough.
The area was first settled by Dutch and Swedish immigrants in the late 1600s. The first settlers were attracted to the area due to its fertile soil and abundant natural resources. The area was also known for its iron ore deposits, which were mined and used to make tools and weapons.
The area was also home to a thriving shipbuilding industry. The first shipyard was established in 1790 and the area quickly became a major center for shipbuilding. The shipyards produced a variety of vessels, including schooners, sloops, and steamboats.
The borough was also home to a number of other industries, including a glassworks, a brickyard, and a paper mill. The paper mill was the largest employer in the area and provided jobs for many of the residents.
The borough was also home to a number of educational institutions, including Westville Academy, which was established in 1802. The academy was a private school that offered a variety of courses, including mathematics, science, and literature.
Geography
Westville Borough is located in Gloucester County, New Jersey. It is situated on the banks of the Delaware River, just south of Philadelphia. The borough covers an area of 1.2 square miles and is bordered by Deptford Township to the north, West Deptford Township to the east, and Mantua Township to the south.
The borough is located in a flat, low-lying area. The terrain is mostly flat, with some rolling hills in the northern part of the borough. The area is mostly wooded, with some open fields and wetlands.
The climate in Westville Borough is humid subtropical, with hot, humid summers and mild winters. The average annual temperature is around 55 degrees Fahrenheit. The average annual precipitation is around 45 inches.
Economy
Westville Borough has a diverse economy. The largest employers in the borough are the Westville School District, the Westville Public Library, and the Westville Fire Department. Other major employers include the Westville Glassworks, the Westville Brickyard, and the Westville Paper Mill.
The borough also has a number of small businesses, including restaurants, retail stores, and professional services. The borough is also home to a number of manufacturing companies, including a plastics factory and a metal fabrication plant.
Demographics
As of the 2010 census, Westville Borough had a population of 8,845. The racial makeup of the borough was 79.3% White, 11.2% African American, 0.4% Native American, 2.2% Asian, and 6.9% from other races. Hispanic or Latino of any race were 8.3% of the population.
The median household income in Westville Borough was $50,945, and the median family income was $60,945. The per capita income was $25,945. About 8.3% of families and 10.2% of the population were below the poverty line.
Common Questions
What is the Total Population of Westville borough?
Total Population of Westville borough is 4,276.
What is the Total Male Population of Westville borough?
Total Male Population of Westville borough is 2,019.
What is the Total Female Population of Westville borough?
Total Female Population of Westville borough is 2,257.
What is the Ratio of Males per 100 Females in Westville borough?
There are 89.46 Males per 100 Females in Westville borough.
What is the Ratio of Females per 100 Males in Westville borough?
There are 111.79 Females per 100 Males in Westville borough.
What is the Median Population Age in Westville borough?
Median Population Age in Westville borough is 41.8 Years.
What is the Average Family Size in Westville borough
Average Family Size in Westville borough is 3.0 People.
What is the Average Household Size in Westville borough
Average Household Size in Westville borough is 2.2 People.
What is Per Capita Income in Westville borough?
Per Capita income in Westville borough is $37,296.
What is the Median Family Income in Westville borough?
Median Family Income in Westville borough is $88,354.
What is the Median Household income in Westville borough?
Median Household Income in Westville borough is $63,000.
What is Income or Wage Gap in Westville borough?
Income or Wage Gap in Westville borough is 6.4%.
Women in Westville borough earn 93.6 cents for every dollar earned by a man.
What is Inequality or Gini Index in Westville borough?
Inequality or Gini Index in Westville borough is 0.47.
How Large is the Labor Force in Westville borough?
There are 2,385 People in the Labor Forcein in Westville borough.
What is the Percentage of People in the Labor Force in Westville borough?
69.3% of People are in the Labor Force in Westville borough.
What is the Unemployment Rate in Westville borough?
Unemployment Rate in Westville borough is 6.3%.