Crandon Lakes, NJ
Crandon Lakes Map
Crandon Lakes Overview
1,141
TOTAL POPULATION
561
MALE POPULATION
580
FEMALE POPULATION
96.72
MALES / 100 FEMALES
103.39
FEMALES / 100 MALES
47.9
MEDIAN AGE
2.8
AVG FAMILY SIZE
2.4
AVG HOUSEHOLD SIZE
$44,950
PER CAPITA INCOME
$114,615
AVG FAMILY INCOME
$102,083
AVG HOUSEHOLD INCOME
37.8%
WAGE / INCOME GAP [ % ]
62.2¢/ $1
WAGE / INCOME GAP [ $ ]
0.32
INEQUALITY / GINI INDEX
558
LABOR FORCE [ PEOPLE ]
57.5%
PERCENT IN LABOR FORCE
5.7%
UNEMPLOYMENT RATE
Race in Crandon Lakes
The most populous races in Crandon Lakes are White / Caucasian (1,123 | 98.4%), Two or more Races (18 | 1.6%), and Hispanic or Latino (12 | 1.1%).
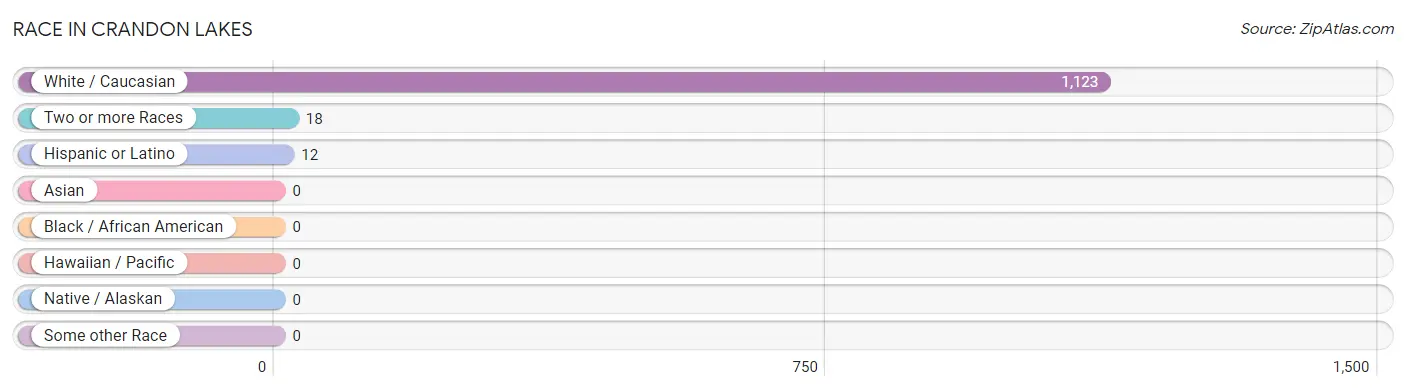
| Race | # Population | % Population |
| Asian | 0 | 0.0% |
| Black / African American | 0 | 0.0% |
| Hawaiian / Pacific | 0 | 0.0% |
| Hispanic or Latino | 12 | 1.1% |
| Native / Alaskan | 0 | 0.0% |
| White / Caucasian | 1,123 | 98.4% |
| Two or more Races | 18 | 1.6% |
| Some other Race | 0 | 0.0% |
| Total | 1,141 | 100.0% |
Ancestry in Crandon Lakes
The most populous ancestries reported in Crandon Lakes are German (514 | 45.1%), Irish (386 | 33.8%), Italian (225 | 19.7%), English (135 | 11.8%), and American (67 | 5.9%), together accounting for 116.3% of all Crandon Lakes residents.
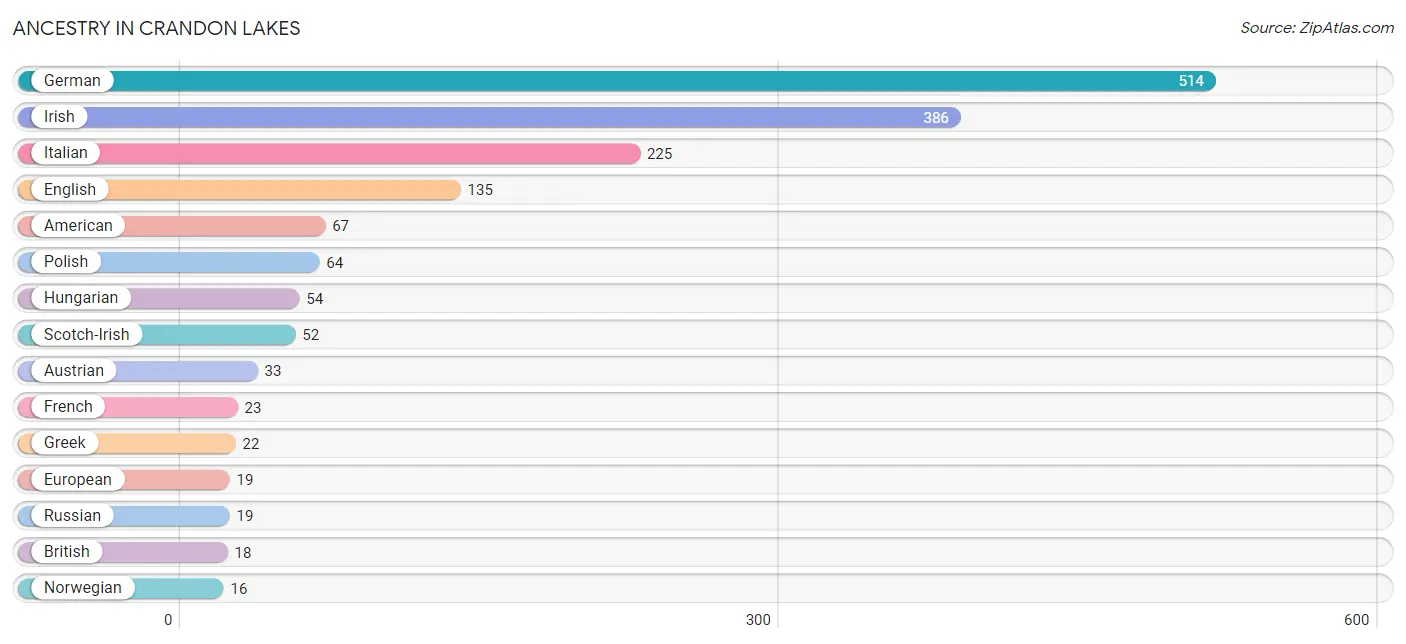
| Ancestry | # Population | % Population |
| American | 67 | 5.9% |
| Austrian | 33 | 2.9% |
| British | 18 | 1.6% |
| Colombian | 5 | 0.4% |
| Dutch | 8 | 0.7% |
| English | 135 | 11.8% |
| European | 19 | 1.7% |
| Finnish | 8 | 0.7% |
| French | 23 | 2.0% |
| German | 514 | 45.1% |
| Greek | 22 | 1.9% |
| Hungarian | 54 | 4.7% |
| Irish | 386 | 33.8% |
| Italian | 225 | 19.7% |
| Norwegian | 16 | 1.4% |
| Polish | 64 | 5.6% |
| Puerto Rican | 7 | 0.6% |
| Russian | 19 | 1.7% |
| Scotch-Irish | 52 | 4.6% |
| Slovak | 8 | 0.7% |
| Slovene | 8 | 0.7% |
| South American | 5 | 0.4% |
| Welsh | 10 | 0.9% | View All 23 Rows |
Immigrants in Crandon Lakes
The most numerous immigrant groups reported in Crandon Lakes came from Europe (44 | 3.9%), Italy (33 | 2.9%), Southern Europe (33 | 2.9%), Northern Europe (11 | 1.0%), and Caribbean (5 | 0.4%), together accounting for 11.0% of all Crandon Lakes residents.
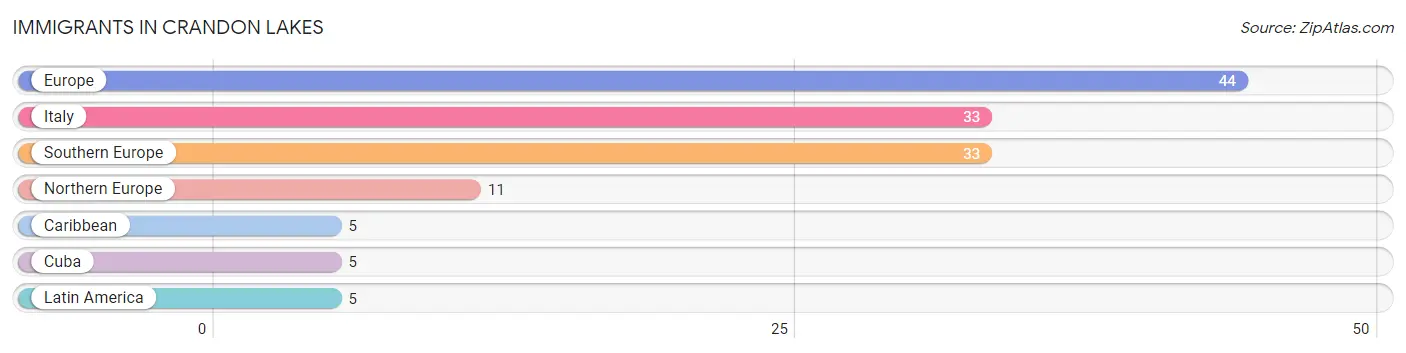
| Immigration Origin | # Population | % Population |
| Caribbean | 5 | 0.4% |
| Cuba | 5 | 0.4% |
| Europe | 44 | 3.9% |
| Italy | 33 | 2.9% |
| Latin America | 5 | 0.4% |
| Northern Europe | 11 | 1.0% |
| Southern Europe | 33 | 2.9% | View All 7 Rows |
Sex and Age in Crandon Lakes
Sex and Age in Crandon Lakes
The most populous age groups in Crandon Lakes are 75 to 79 Years (87 | 15.5%) for men and 50 to 54 Years (110 | 19.0%) for women.
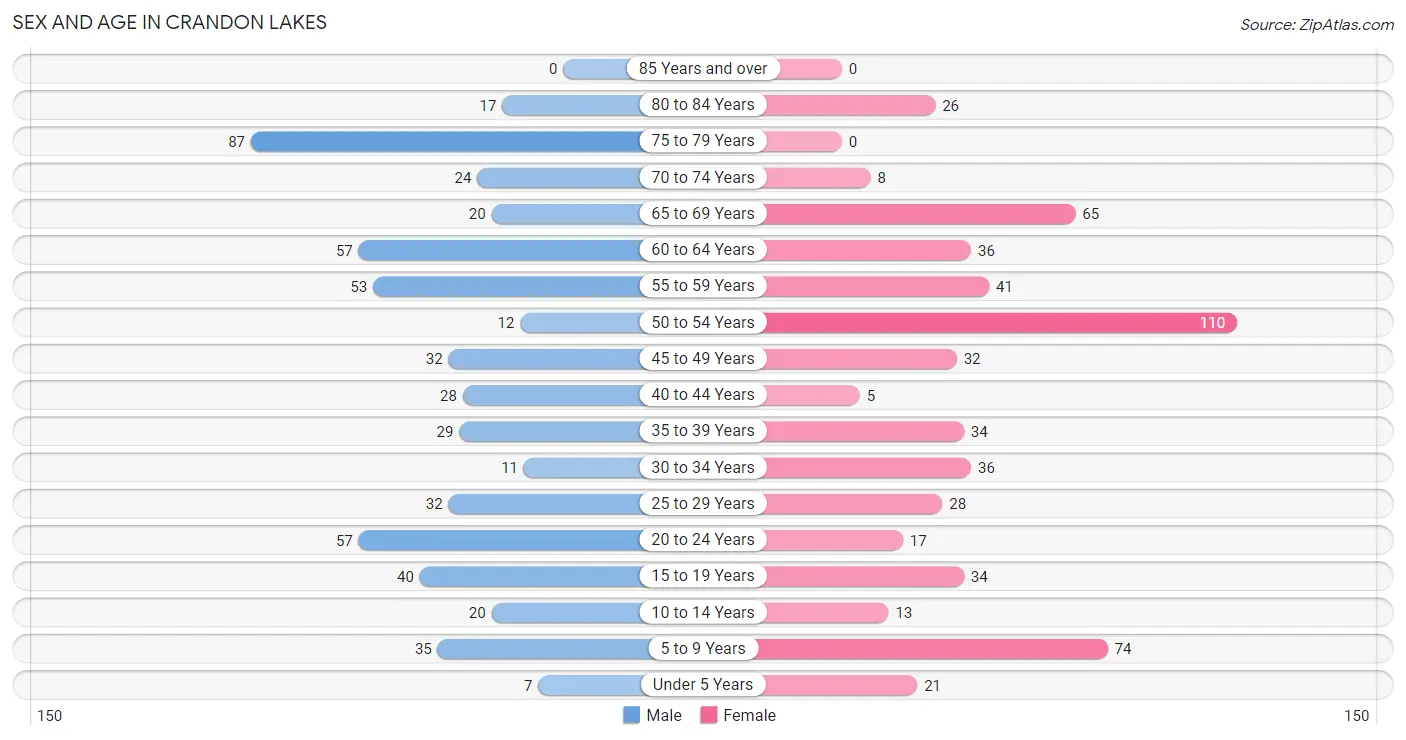
| Age Bracket | Male | Female |
| Under 5 Years | 7 (1.3%) | 21 (3.6%) |
| 5 to 9 Years | 35 (6.2%) | 74 (12.8%) |
| 10 to 14 Years | 20 (3.6%) | 13 (2.2%) |
| 15 to 19 Years | 40 (7.1%) | 34 (5.9%) |
| 20 to 24 Years | 57 (10.2%) | 17 (2.9%) |
| 25 to 29 Years | 32 (5.7%) | 28 (4.8%) |
| 30 to 34 Years | 11 (2.0%) | 36 (6.2%) |
| 35 to 39 Years | 29 (5.2%) | 34 (5.9%) |
| 40 to 44 Years | 28 (5.0%) | 5 (0.9%) |
| 45 to 49 Years | 32 (5.7%) | 32 (5.5%) |
| 50 to 54 Years | 12 (2.1%) | 110 (19.0%) |
| 55 to 59 Years | 53 (9.5%) | 41 (7.1%) |
| 60 to 64 Years | 57 (10.2%) | 36 (6.2%) |
| 65 to 69 Years | 20 (3.6%) | 65 (11.2%) |
| 70 to 74 Years | 24 (4.3%) | 8 (1.4%) |
| 75 to 79 Years | 87 (15.5%) | 0 (0.0%) |
| 80 to 84 Years | 17 (3.0%) | 26 (4.5%) |
| 85 Years and over | 0 (0.0%) | 0 (0.0%) |
| Total | 561 (100.0%) | 580 (100.0%) |
Families and Households in Crandon Lakes
Median Family Size in Crandon Lakes
The median family size in Crandon Lakes is 2.75 persons per family, with married-couple families (253 | 72.3%) accounting for the largest median family size of 2.87 persons per family. On the other hand, single male/father families (24 | 6.9%) represent the smallest median family size with 2.25 persons per family.
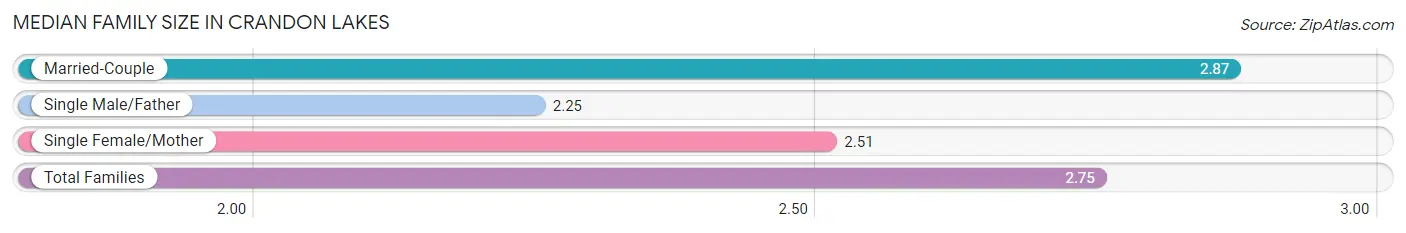
| Family Type | # Families | Family Size |
| Married-Couple | 253 (72.3%) | 2.87 |
| Single Male/Father | 24 (6.9%) | 2.25 |
| Single Female/Mother | 73 (20.9%) | 2.51 |
| Total Families | 350 (100.0%) | 2.75 |
Median Household Size in Crandon Lakes
The median household size in Crandon Lakes is 2.42 persons per household, with single male/father households (24 | 5.1%) accounting for the largest median household size of 3 persons per household. non-family households (121 | 25.7%) represent the smallest median household size with 1.33 persons per household.
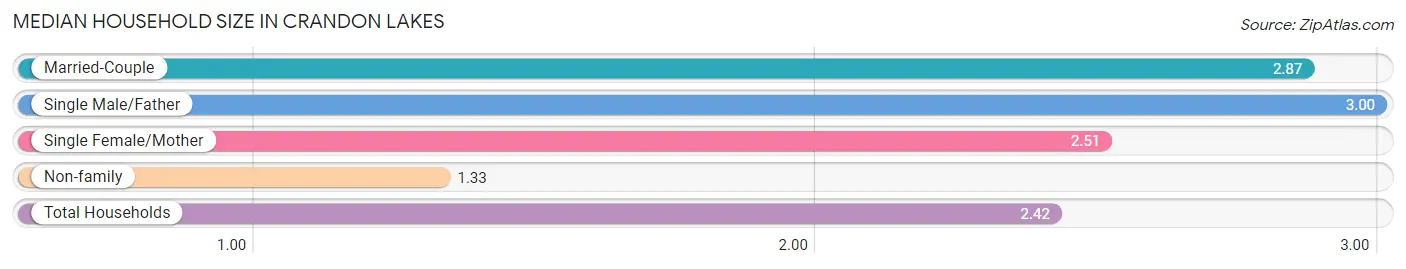
| Household Type | # Households | Household Size |
| Married-Couple | 253 (53.7%) | 2.87 |
| Single Male/Father | 24 (5.1%) | 3.00 |
| Single Female/Mother | 73 (15.5%) | 2.51 |
| Non-family | 121 (25.7%) | 1.33 |
| Total Households | 471 (100.0%) | 2.42 |
Household Size by Marriage Status in Crandon Lakes
Out of a total of 471 households in Crandon Lakes, 350 (74.3%) are family households, while 121 (25.7%) are nonfamily households. The most numerous type of family households are 2-person households, comprising 176, and the most common type of nonfamily households are 1-person households, comprising 78.
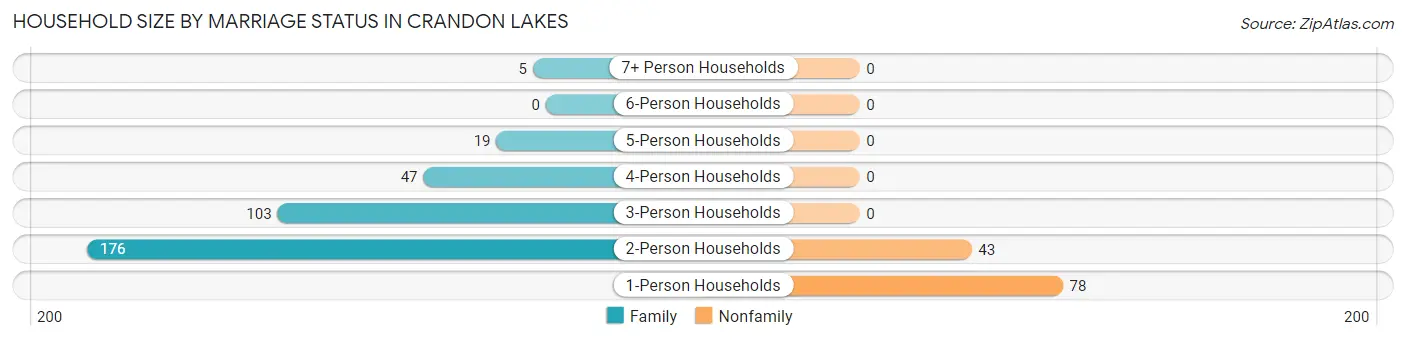
| Household Size | Family Households | Nonfamily Households |
| 1-Person Households | - | 78 (16.6%) |
| 2-Person Households | 176 (37.4%) | 43 (9.1%) |
| 3-Person Households | 103 (21.9%) | 0 (0.0%) |
| 4-Person Households | 47 (10.0%) | 0 (0.0%) |
| 5-Person Households | 19 (4.0%) | 0 (0.0%) |
| 6-Person Households | 0 (0.0%) | 0 (0.0%) |
| 7+ Person Households | 5 (1.1%) | 0 (0.0%) |
| Total | 350 (74.3%) | 121 (25.7%) |
Female Fertility in Crandon Lakes
Fertility by Age in Crandon Lakes
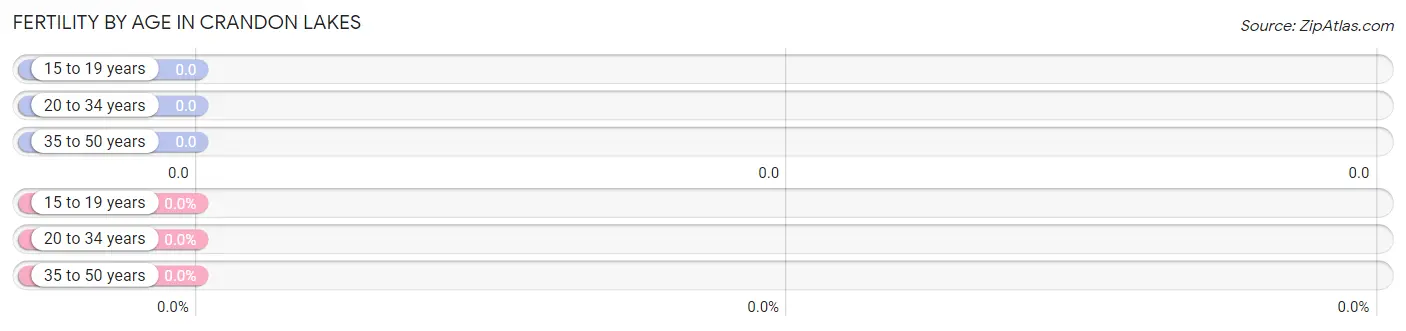
| Age Bracket | Women with Births | Births / 1,000 Women |
| 15 to 19 years | 0 (0.0%) | 0.0 |
| 20 to 34 years | 0 (0.0%) | 0.0 |
| 35 to 50 years | 0 (0.0%) | 0.0 |
| Total | 0 (0.0%) | 0.0 |
Fertility by Age by Marriage Status in Crandon Lakes
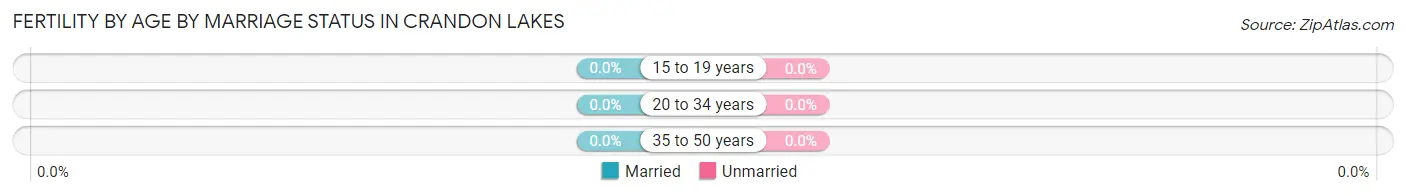
| Age Bracket | Married | Unmarried |
| 15 to 19 years | 0 (0.0%) | 0 (0.0%) |
| 20 to 34 years | 0 (0.0%) | 0 (0.0%) |
| 35 to 50 years | 0 (0.0%) | 0 (0.0%) |
| Total | 0 (0.0%) | 0 (0.0%) |
Fertility by Education in Crandon Lakes
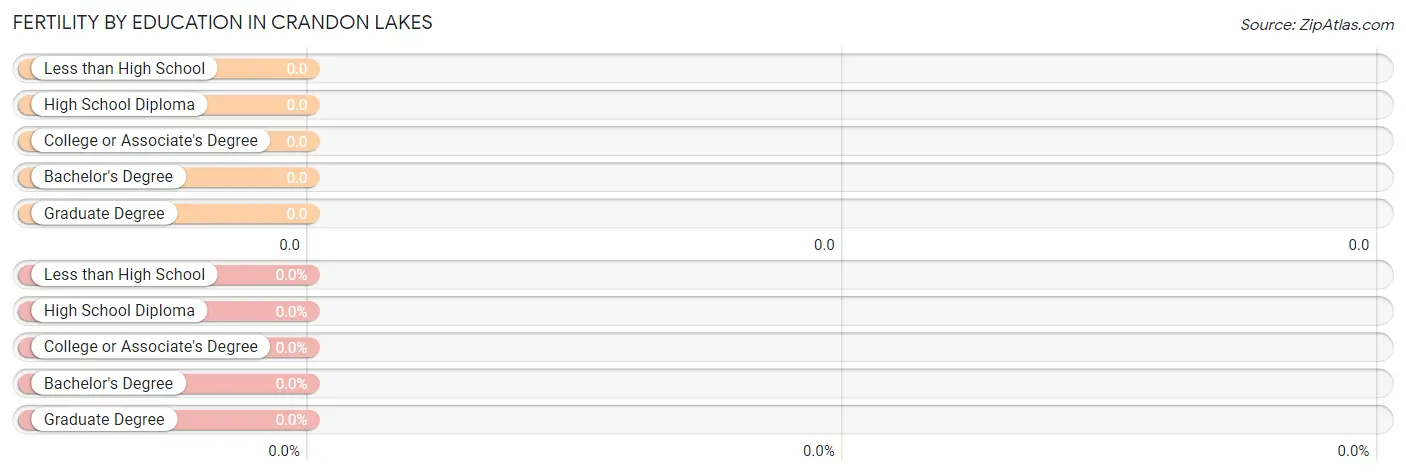
| Educational Attainment | Women with Births | Births / 1,000 Women |
| Less than High School | 0 (0.0%) | 0.0 |
| High School Diploma | 0 (0.0%) | 0.0 |
| College or Associate's Degree | 0 (0.0%) | 0.0 |
| Bachelor's Degree | 0 (0.0%) | 0.0 |
| Graduate Degree | 0 (0.0%) | 0.0 |
| Total | 0 (0.0%) | 0.0 |
Fertility by Education by Marriage Status in Crandon Lakes
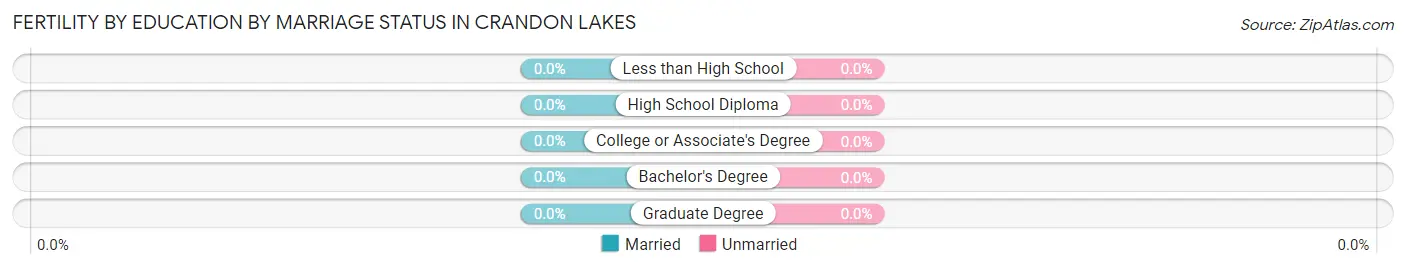
| Educational Attainment | Married | Unmarried |
| Less than High School | 0 (0.0%) | 0 (0.0%) |
| High School Diploma | 0 (0.0%) | 0 (0.0%) |
| College or Associate's Degree | 0 (0.0%) | 0 (0.0%) |
| Bachelor's Degree | 0 (0.0%) | 0 (0.0%) |
| Graduate Degree | 0 (0.0%) | 0 (0.0%) |
| Total | 0 (0.0%) | 0 (0.0%) |
Income in Crandon Lakes
Income Overview in Crandon Lakes
Per Capita Income in Crandon Lakes is $44,950, while median incomes of families and households are $114,615 and $102,083 respectively.
| Characteristic | Number | Measure |
| Per Capita Income | 1,141 | $44,950 |
| Median Family Income | 350 | $114,615 |
| Mean Family Income | 350 | $117,914 |
| Median Household Income | 471 | $102,083 |
| Mean Household Income | 471 | $108,075 |
| Income Deficit | 350 | $0 |
| Wage / Income Gap (%) | 1,141 | 37.77% |
| Wage / Income Gap ($) | 1,141 | 62.23¢ per $1 |
| Gini / Inequality Index | 1,141 | 0.32 |
Earnings by Sex in Crandon Lakes
Average Earnings in Crandon Lakes are $46,250, $41,463 for men and $66,625 for women, a difference of 37.8%.
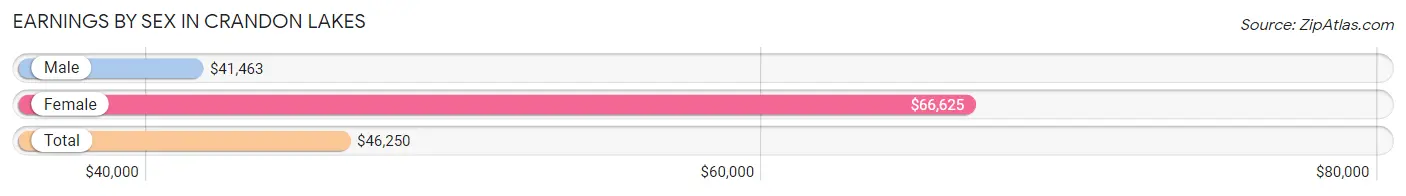
| Sex | Number | Average Earnings |
| Male | 321 (54.6%) | $41,463 |
| Female | 267 (45.4%) | $66,625 |
| Total | 588 (100.0%) | $46,250 |
Earnings by Sex by Income Bracket in Crandon Lakes
The most common earnings brackets in Crandon Lakes are $100,000+ for men (63 | 19.6%) and $100,000+ for women (98 | 36.7%).
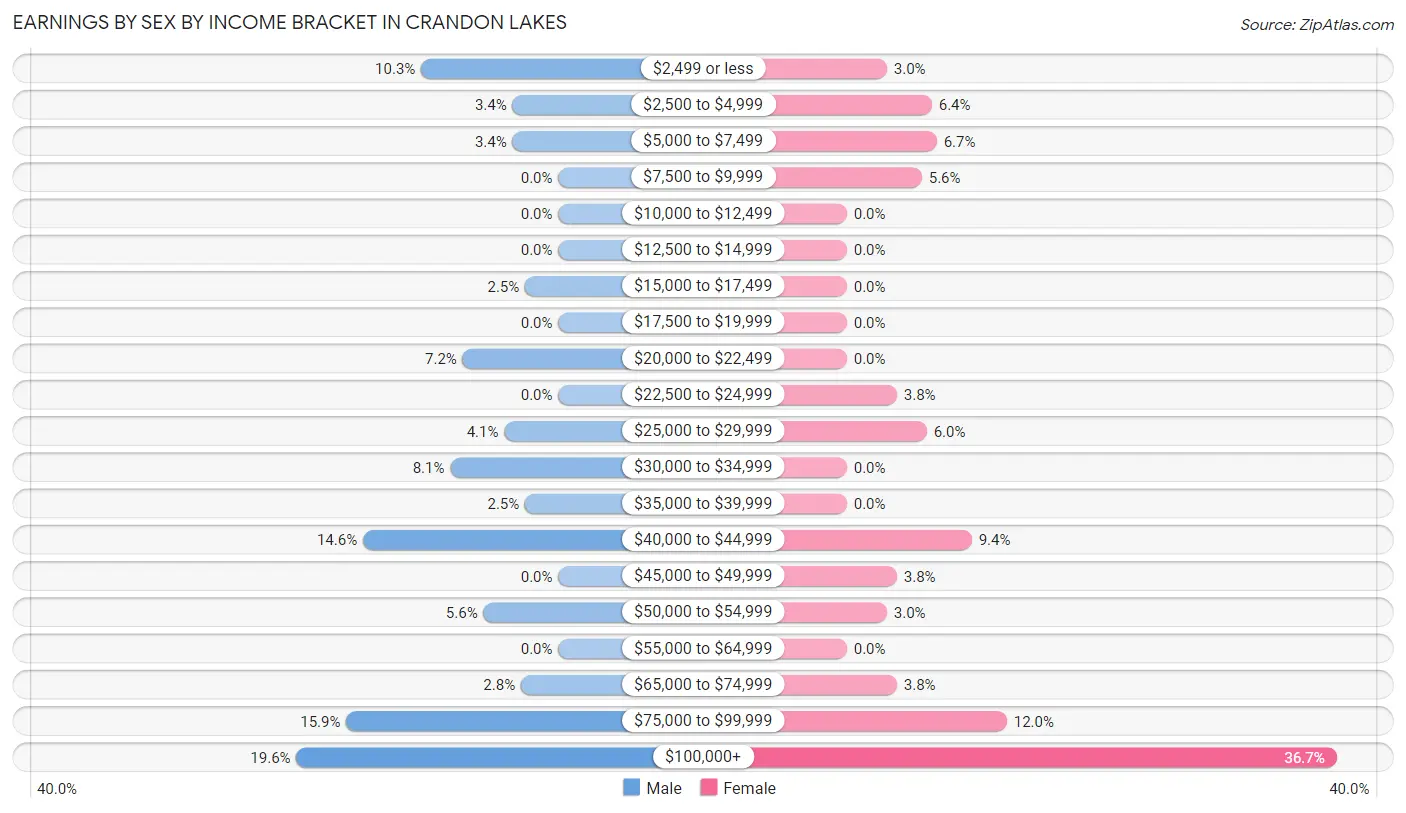
| Income | Male | Female |
| $2,499 or less | 33 (10.3%) | 8 (3.0%) |
| $2,500 to $4,999 | 11 (3.4%) | 17 (6.4%) |
| $5,000 to $7,499 | 11 (3.4%) | 18 (6.7%) |
| $7,500 to $9,999 | 0 (0.0%) | 15 (5.6%) |
| $10,000 to $12,499 | 0 (0.0%) | 0 (0.0%) |
| $12,500 to $14,999 | 0 (0.0%) | 0 (0.0%) |
| $15,000 to $17,499 | 8 (2.5%) | 0 (0.0%) |
| $17,500 to $19,999 | 0 (0.0%) | 0 (0.0%) |
| $20,000 to $22,499 | 23 (7.2%) | 0 (0.0%) |
| $22,500 to $24,999 | 0 (0.0%) | 10 (3.7%) |
| $25,000 to $29,999 | 13 (4.1%) | 16 (6.0%) |
| $30,000 to $34,999 | 26 (8.1%) | 0 (0.0%) |
| $35,000 to $39,999 | 8 (2.5%) | 0 (0.0%) |
| $40,000 to $44,999 | 47 (14.6%) | 25 (9.4%) |
| $45,000 to $49,999 | 0 (0.0%) | 10 (3.7%) |
| $50,000 to $54,999 | 18 (5.6%) | 8 (3.0%) |
| $55,000 to $64,999 | 0 (0.0%) | 0 (0.0%) |
| $65,000 to $74,999 | 9 (2.8%) | 10 (3.7%) |
| $75,000 to $99,999 | 51 (15.9%) | 32 (12.0%) |
| $100,000+ | 63 (19.6%) | 98 (36.7%) |
| Total | 321 (100.0%) | 267 (100.0%) |
Earnings by Sex by Educational Attainment in Crandon Lakes
Average earnings in Crandon Lakes are $75,294 for men and $83,365 for women, a difference of 9.7%. Men with an educational attainment of college or associate's degree enjoy the highest average annual earnings of $93,000, while those with bachelor's degree education earn the least with $50,114. Women with an educational attainment of bachelor's degree earn the most with the average annual earnings of $126,750, while those with college or associate's degree education have the smallest earnings of $76,023.
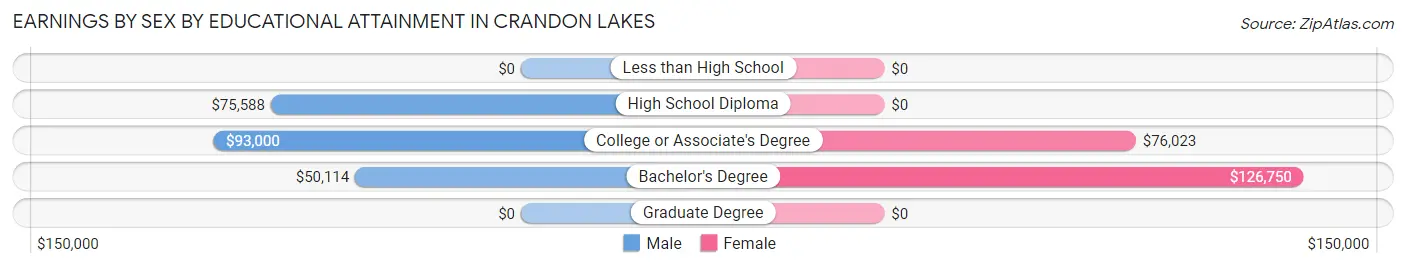
| Educational Attainment | Male Income | Female Income |
| Less than High School | - | - |
| High School Diploma | $75,588 | $0 |
| College or Associate's Degree | $93,000 | $76,023 |
| Bachelor's Degree | $50,114 | $126,750 |
| Graduate Degree | - | - |
| Total | $75,294 | $83,365 |
Family Income in Crandon Lakes
Family Income Brackets in Crandon Lakes
According to the Crandon Lakes family income data, there are 96 families falling into the $100,000 to $149,999 income range, which is the most common income bracket and makes up 27.4% of all families.
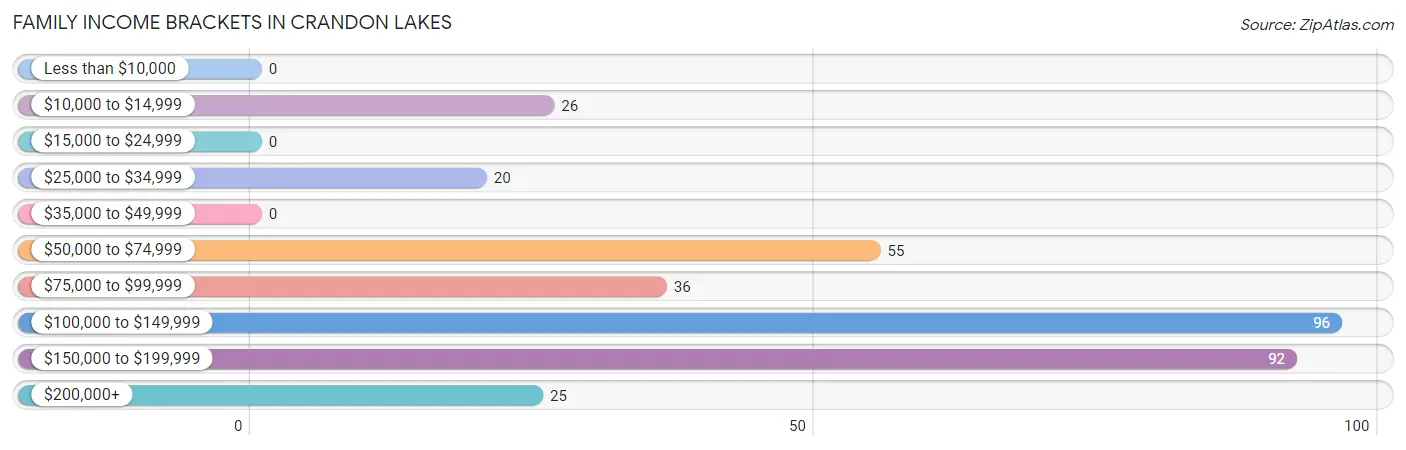
| Income Bracket | # Families | % Families |
| Less than $10,000 | 0 | 0.0% |
| $10,000 to $14,999 | 26 | 7.4% |
| $15,000 to $24,999 | 0 | 0.0% |
| $25,000 to $34,999 | 20 | 5.7% |
| $35,000 to $49,999 | 0 | 0.0% |
| $50,000 to $74,999 | 55 | 15.7% |
| $75,000 to $99,999 | 36 | 10.3% |
| $100,000 to $149,999 | 96 | 27.4% |
| $150,000 to $199,999 | 92 | 26.3% |
| $200,000+ | 25 | 7.1% |
Family Income by Famaliy Size in Crandon Lakes
4-person families (47 | 13.4%) account for the highest median family income in Crandon Lakes with $192,708 per family, while 3-person families (86 | 24.6%) have the highest median income of $55,500 per family member.
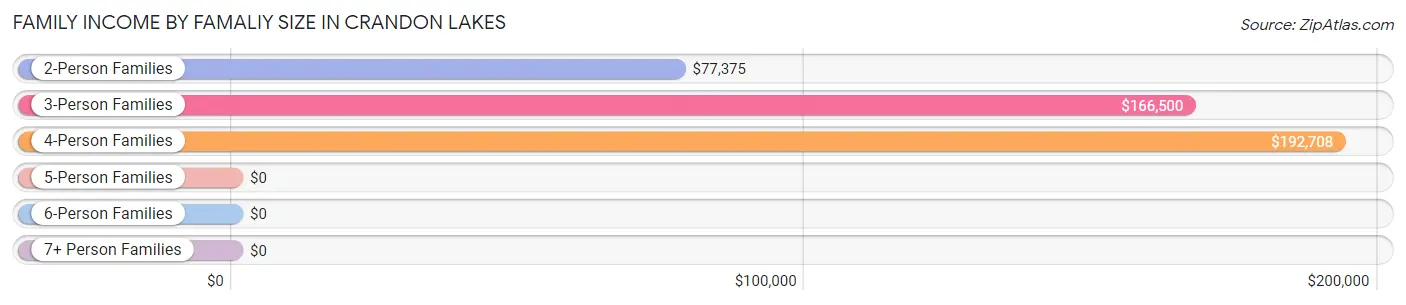
| Income Bracket | # Families | Median Income |
| 2-Person Families | 193 (55.1%) | $77,375 |
| 3-Person Families | 86 (24.6%) | $166,500 |
| 4-Person Families | 47 (13.4%) | $192,708 |
| 5-Person Families | 19 (5.4%) | $0 |
| 6-Person Families | 0 (0.0%) | $0 |
| 7+ Person Families | 5 (1.4%) | $0 |
| Total | 350 (100.0%) | $114,615 |
Family Income by Number of Earners in Crandon Lakes
The median family income in Crandon Lakes is $114,615, with families comprising 3+ earners (57) having the highest median family income of $172,981, while families with no earners (93) have the lowest median family income of $56,553, accounting for 16.3% and 26.6% of families, respectively.
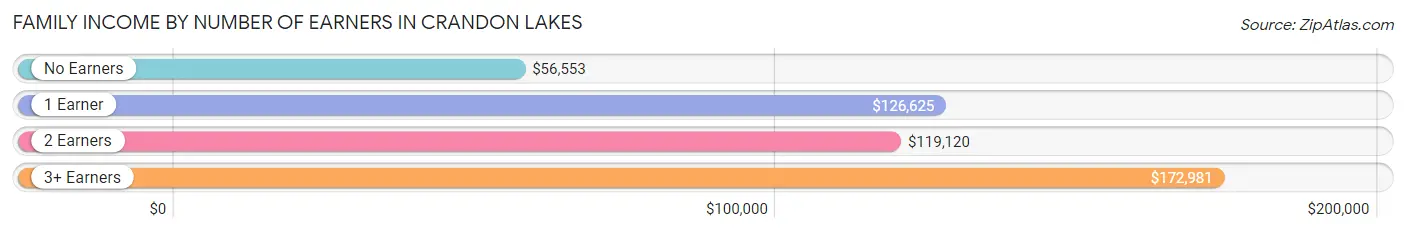
| Number of Earners | # Families | Median Income |
| No Earners | 93 (26.6%) | $56,553 |
| 1 Earner | 85 (24.3%) | $126,625 |
| 2 Earners | 115 (32.9%) | $119,120 |
| 3+ Earners | 57 (16.3%) | $172,981 |
| Total | 350 (100.0%) | $114,615 |
Household Income in Crandon Lakes
Household Income Brackets in Crandon Lakes
With 115 households falling in the category, the $100,000 to $149,999 income range is the most frequent in Crandon Lakes, accounting for 24.4% of all households.
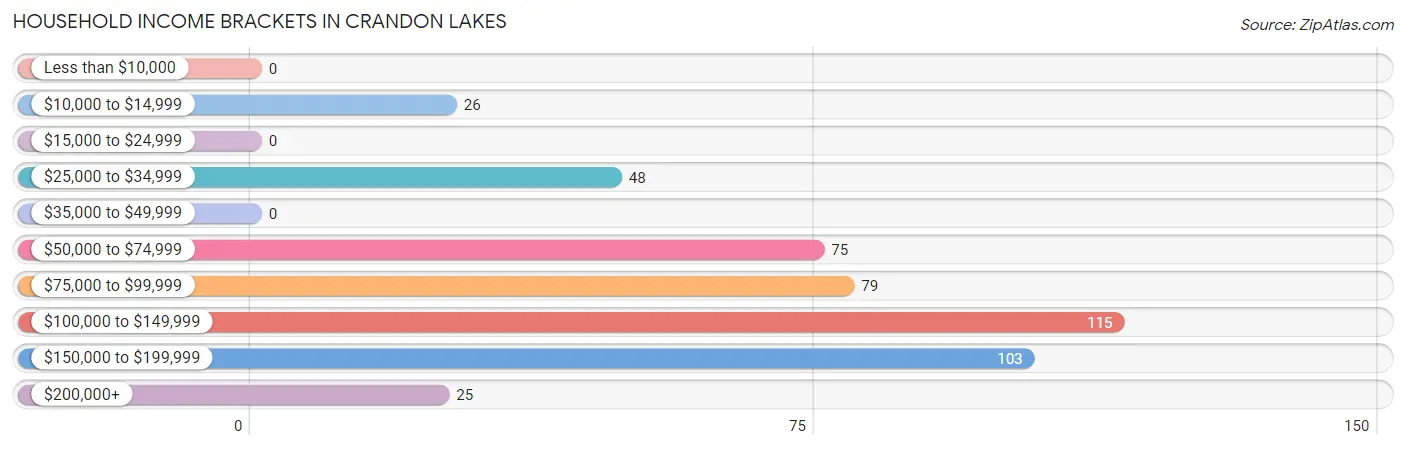
| Income Bracket | # Households | % Households |
| Less than $10,000 | 0 | 0.0% |
| $10,000 to $14,999 | 26 | 5.5% |
| $15,000 to $24,999 | 0 | 0.0% |
| $25,000 to $34,999 | 48 | 10.2% |
| $35,000 to $49,999 | 0 | 0.0% |
| $50,000 to $74,999 | 75 | 15.9% |
| $75,000 to $99,999 | 79 | 16.8% |
| $100,000 to $149,999 | 115 | 24.4% |
| $150,000 to $199,999 | 103 | 21.9% |
| $200,000+ | 25 | 5.3% |
Household Income by Householder Age in Crandon Lakes
The median household income in Crandon Lakes is $102,083, with the highest median household income of $129,779 found in the 45 to 64 years age bracket for the primary householder. A total of 231 households (49.0%) fall into this category.
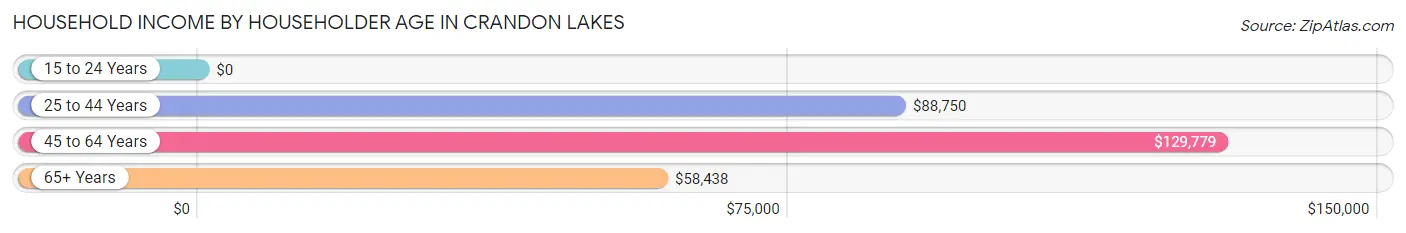
| Income Bracket | # Households | Median Income |
| 15 to 24 Years | 0 (0.0%) | $0 |
| 25 to 44 Years | 86 (18.3%) | $88,750 |
| 45 to 64 Years | 231 (49.0%) | $129,779 |
| 65+ Years | 154 (32.7%) | $58,438 |
| Total | 471 (100.0%) | $102,083 |
Poverty in Crandon Lakes
Income Below Poverty by Sex and Age in Crandon Lakes
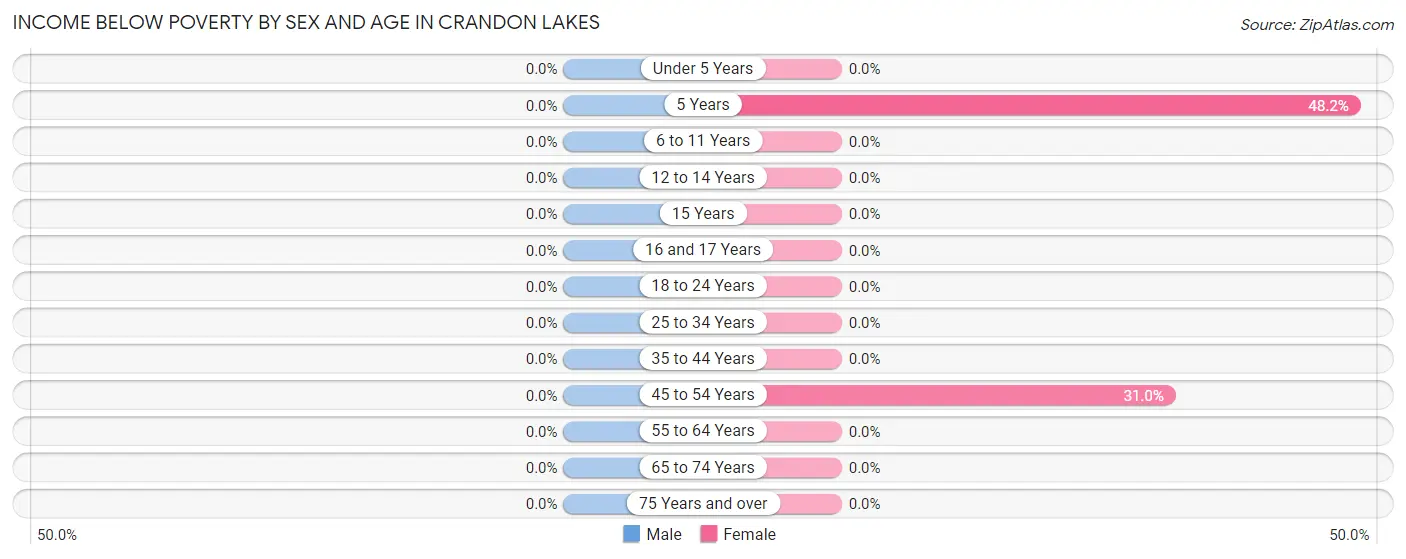
| Age Bracket | Male | Female |
| Under 5 Years | 0 (0.0%) | 0 (0.0%) |
| 5 Years | 0 (0.0%) | 26 (48.1%) |
| 6 to 11 Years | 0 (0.0%) | 0 (0.0%) |
| 12 to 14 Years | 0 (0.0%) | 0 (0.0%) |
| 15 Years | 0 (0.0%) | 0 (0.0%) |
| 16 and 17 Years | 0 (0.0%) | 0 (0.0%) |
| 18 to 24 Years | 0 (0.0%) | 0 (0.0%) |
| 25 to 34 Years | 0 (0.0%) | 0 (0.0%) |
| 35 to 44 Years | 0 (0.0%) | 0 (0.0%) |
| 45 to 54 Years | 0 (0.0%) | 44 (31.0%) |
| 55 to 64 Years | 0 (0.0%) | 0 (0.0%) |
| 65 to 74 Years | 0 (0.0%) | 0 (0.0%) |
| 75 Years and over | 0 (0.0%) | 0 (0.0%) |
| Total | 0 (0.0%) | 70 (12.1%) |
Income Above Poverty by Sex and Age in Crandon Lakes
According to the poverty statistics in Crandon Lakes, males aged under 5 years and females aged under 5 years are the age groups that are most secure financially, with 100.0% of males and 100.0% of females in these age groups living above the poverty line.
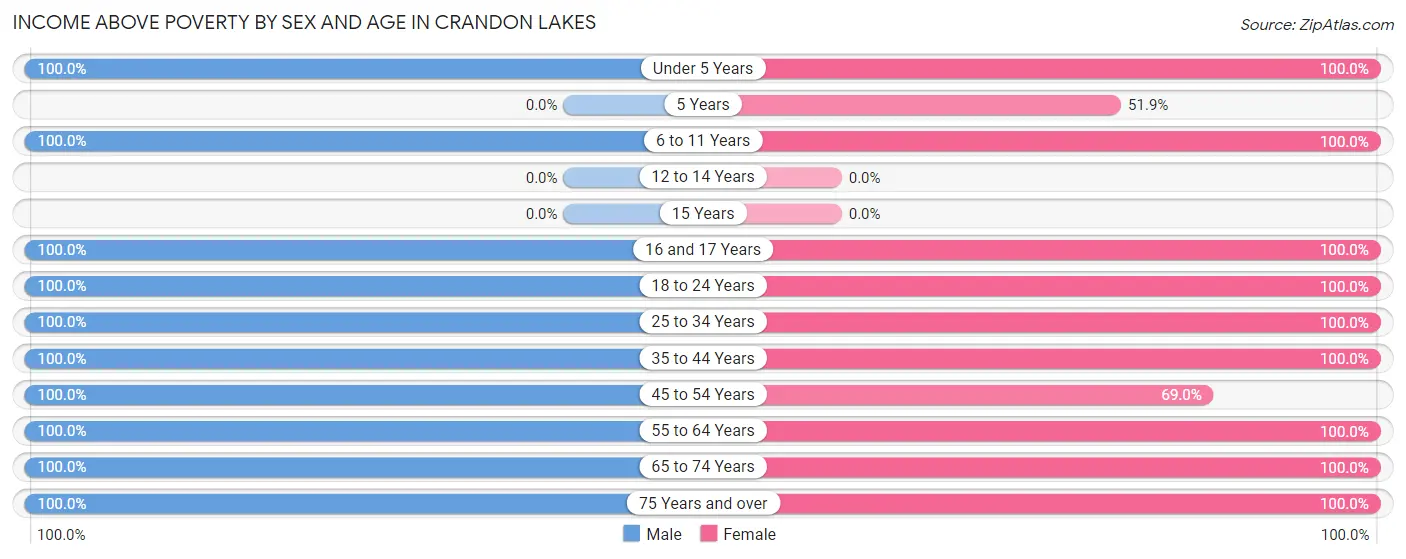
| Age Bracket | Male | Female |
| Under 5 Years | 7 (100.0%) | 21 (100.0%) |
| 5 Years | 0 (0.0%) | 28 (51.8%) |
| 6 to 11 Years | 55 (100.0%) | 33 (100.0%) |
| 12 to 14 Years | 0 (0.0%) | 0 (0.0%) |
| 15 Years | 0 (0.0%) | 0 (0.0%) |
| 16 and 17 Years | 16 (100.0%) | 16 (100.0%) |
| 18 to 24 Years | 81 (100.0%) | 35 (100.0%) |
| 25 to 34 Years | 43 (100.0%) | 64 (100.0%) |
| 35 to 44 Years | 57 (100.0%) | 39 (100.0%) |
| 45 to 54 Years | 44 (100.0%) | 98 (69.0%) |
| 55 to 64 Years | 110 (100.0%) | 77 (100.0%) |
| 65 to 74 Years | 44 (100.0%) | 73 (100.0%) |
| 75 Years and over | 104 (100.0%) | 26 (100.0%) |
| Total | 561 (100.0%) | 510 (87.9%) |
Income Below Poverty Among Married-Couple Families in Crandon Lakes
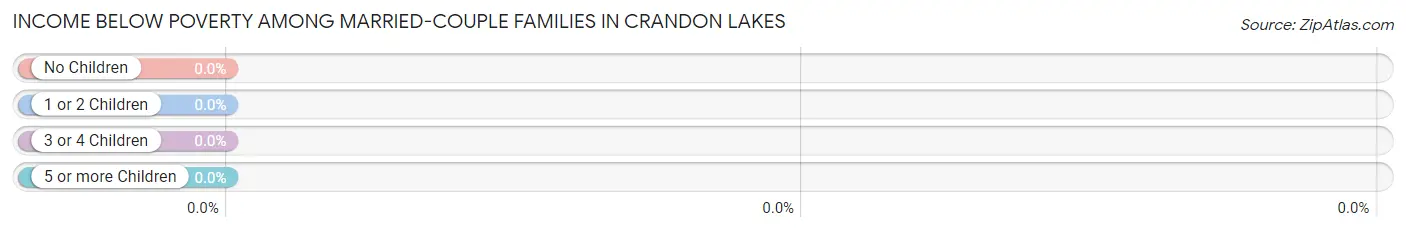
| Children | Above Poverty | Below Poverty |
| No Children | 170 (100.0%) | 0 (0.0%) |
| 1 or 2 Children | 76 (100.0%) | 0 (0.0%) |
| 3 or 4 Children | 7 (100.0%) | 0 (0.0%) |
| 5 or more Children | 0 (0.0%) | 0 (0.0%) |
| Total | 253 (100.0%) | 0 (0.0%) |
Income Below Poverty Among Single-Parent Households in Crandon Lakes
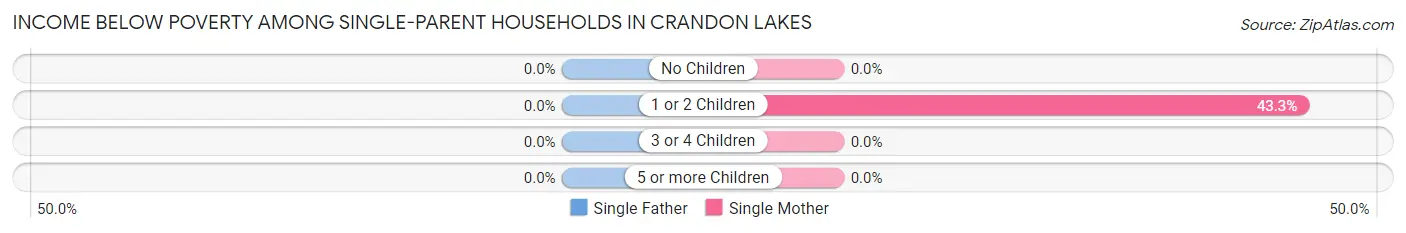
| Children | Single Father | Single Mother |
| No Children | 0 (0.0%) | 0 (0.0%) |
| 1 or 2 Children | 0 (0.0%) | 26 (43.3%) |
| 3 or 4 Children | 0 (0.0%) | 0 (0.0%) |
| 5 or more Children | 0 (0.0%) | 0 (0.0%) |
| Total | 0 (0.0%) | 26 (35.6%) |
Income Below Poverty Among Married-Couple vs Single-Parent Households in Crandon Lakes
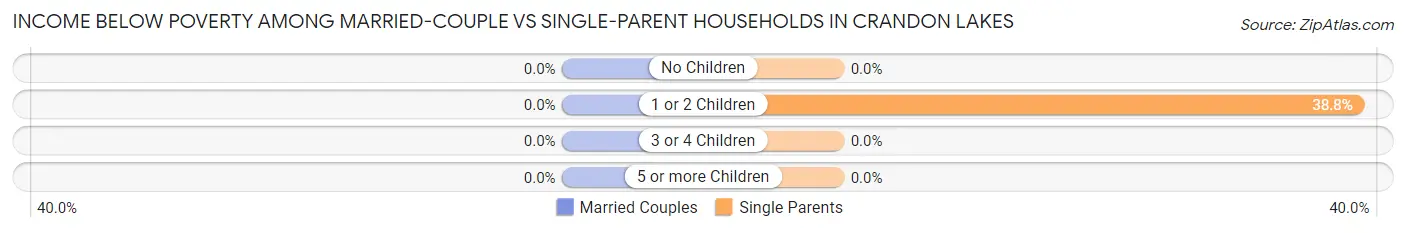
| Children | Married-Couple Families | Single-Parent Households |
| No Children | 0 (0.0%) | 0 (0.0%) |
| 1 or 2 Children | 0 (0.0%) | 26 (38.8%) |
| 3 or 4 Children | 0 (0.0%) | 0 (0.0%) |
| 5 or more Children | 0 (0.0%) | 0 (0.0%) |
| Total | 0 (0.0%) | 26 (26.8%) |
Employment Characteristics in Crandon Lakes
Employment by Class of Employer in Crandon Lakes
Among the 520 employed individuals in Crandon Lakes, private company employees (419 | 80.6%), local government employees (61 | 11.7%), and state government employees (32 | 6.1%) make up the most common classes of employment.
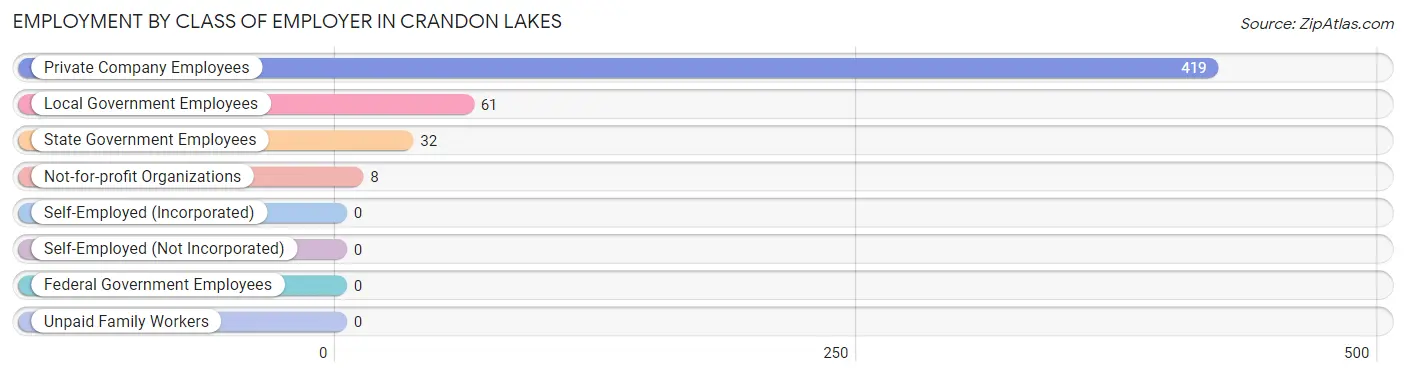
| Employer Class | # Employees | % Employees |
| Private Company Employees | 419 | 80.6% |
| Self-Employed (Incorporated) | 0 | 0.0% |
| Self-Employed (Not Incorporated) | 0 | 0.0% |
| Not-for-profit Organizations | 8 | 1.5% |
| Local Government Employees | 61 | 11.7% |
| State Government Employees | 32 | 6.1% |
| Federal Government Employees | 0 | 0.0% |
| Unpaid Family Workers | 0 | 0.0% |
| Total | 520 | 100.0% |
Employment Status by Age in Crandon Lakes
According to the labor force statistics for Crandon Lakes, out of the total population over 16 years of age (971), 57.5% or 558 individuals are in the labor force, with 5.7% or 32 of them unemployed. The age group with the highest labor force participation rate is 30 to 34 years, with 100.0% or 47 individuals in the labor force. Within the labor force, the 16 to 19 years age range has the highest percentage of unemployed individuals, with 29.7% or 11 of them being unemployed.
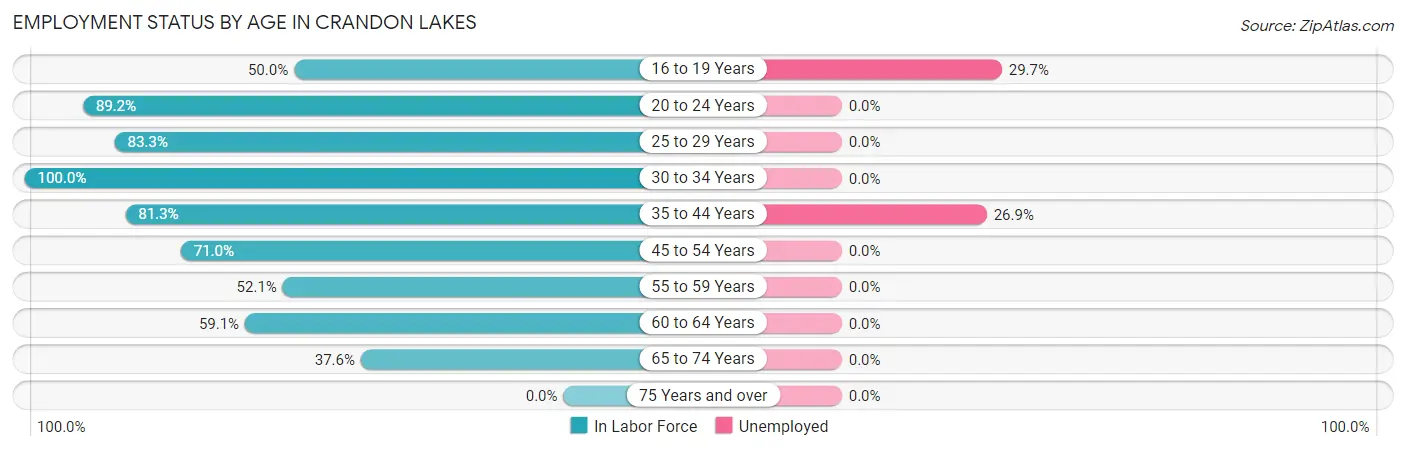
| Age Bracket | In Labor Force | Unemployed |
| 16 to 19 Years | 37 (50.0%) | 11 (29.7%) |
| 20 to 24 Years | 66 (89.2%) | 0 (0.0%) |
| 25 to 29 Years | 50 (83.3%) | 0 (0.0%) |
| 30 to 34 Years | 47 (100.0%) | 0 (0.0%) |
| 35 to 44 Years | 78 (81.3%) | 21 (26.9%) |
| 45 to 54 Years | 132 (71.0%) | 0 (0.0%) |
| 55 to 59 Years | 49 (52.1%) | 0 (0.0%) |
| 60 to 64 Years | 55 (59.1%) | 0 (0.0%) |
| 65 to 74 Years | 44 (37.6%) | 0 (0.0%) |
| 75 Years and over | 0 (0.0%) | 0 (0.0%) |
| Total | 558 (57.5%) | 32 (5.7%) |
Employment Status by Educational Attainment in Crandon Lakes
According to labor force statistics for Crandon Lakes, 71.4% of individuals (411) out of the total population between 25 and 64 years of age (576) are in the labor force, with 5.1% or 21 of them being unemployed. The group with the highest labor force participation rate are those with the educational attainment of bachelor's degree or higher, with 80.8% or 181 individuals in the labor force. Within the labor force, individuals with bachelor's degree or higher education have the highest percentage of unemployment, with 11.6% or 21 of them being unemployed.
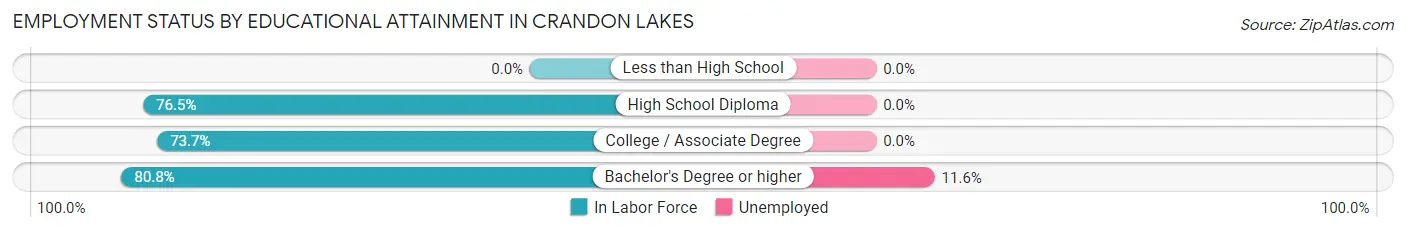
| Educational Attainment | In Labor Force | Unemployed |
| Less than High School | 0 (0.0%) | 0 (0.0%) |
| High School Diploma | 62 (76.5%) | 0 (0.0%) |
| College / Associate Degree | 168 (73.7%) | 0 (0.0%) |
| Bachelor's Degree or higher | 181 (80.8%) | 26 (11.6%) |
| Total | 411 (71.4%) | 29 (5.1%) |
Employment Occupations by Sex in Crandon Lakes
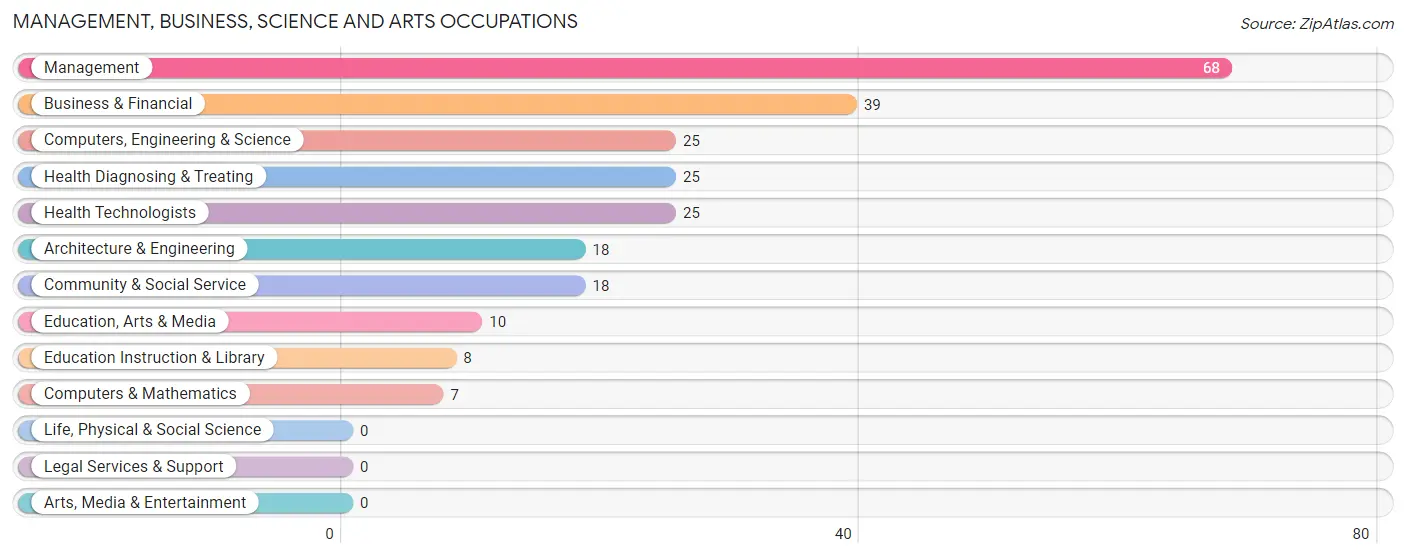
Management, Business, Science and Arts Occupations
The most common Management, Business, Science and Arts occupations in Crandon Lakes are Management (68 | 12.9%), Business & Financial (39 | 7.4%), Computers, Engineering & Science (25 | 4.8%), Health Diagnosing & Treating (25 | 4.8%), and Health Technologists (25 | 4.8%).
Management, Business, Science and Arts Occupations by Sex
Within the Management, Business, Science and Arts occupations in Crandon Lakes, the most male-oriented occupations are Computers, Engineering & Science (100.0%), Computers & Mathematics (100.0%), and Architecture & Engineering (100.0%), while the most female-oriented occupations are Business & Financial (100.0%), Community & Social Service (100.0%), and Education, Arts & Media (100.0%).
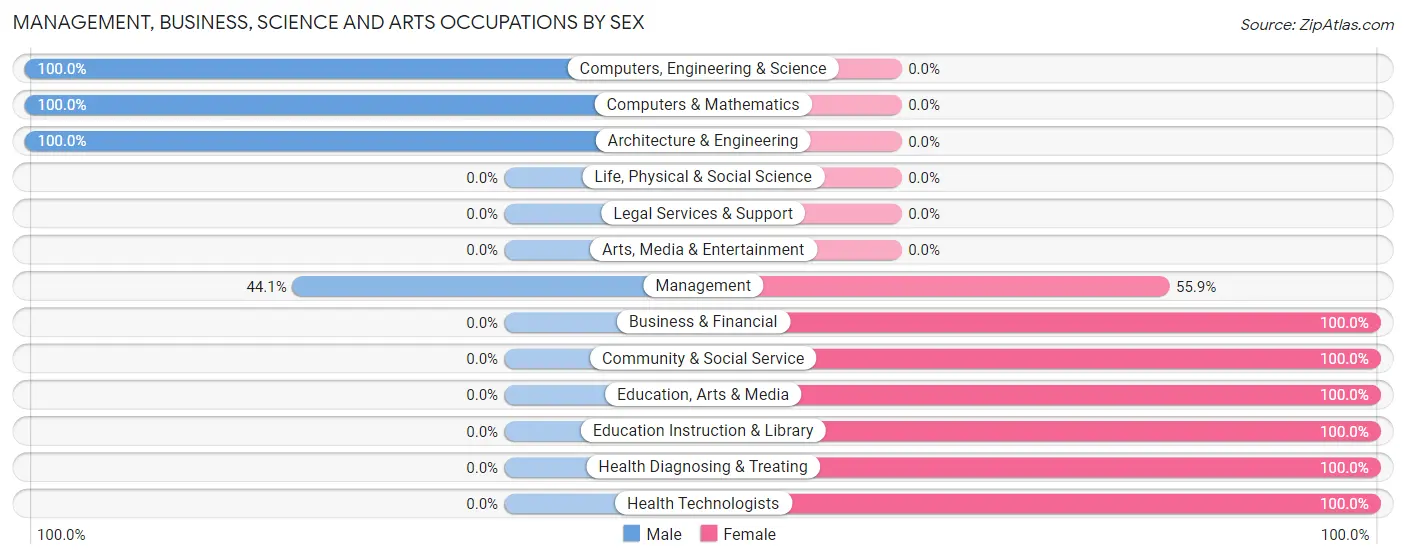
| Occupation | Male | Female |
| Management | 30 (44.1%) | 38 (55.9%) |
| Business & Financial | 0 (0.0%) | 39 (100.0%) |
| Computers, Engineering & Science | 25 (100.0%) | 0 (0.0%) |
| Computers & Mathematics | 7 (100.0%) | 0 (0.0%) |
| Architecture & Engineering | 18 (100.0%) | 0 (0.0%) |
| Life, Physical & Social Science | 0 (0.0%) | 0 (0.0%) |
| Community & Social Service | 0 (0.0%) | 18 (100.0%) |
| Education, Arts & Media | 0 (0.0%) | 10 (100.0%) |
| Legal Services & Support | 0 (0.0%) | 0 (0.0%) |
| Education Instruction & Library | 0 (0.0%) | 8 (100.0%) |
| Arts, Media & Entertainment | 0 (0.0%) | 0 (0.0%) |
| Health Diagnosing & Treating | 0 (0.0%) | 25 (100.0%) |
| Health Technologists | 0 (0.0%) | 25 (100.0%) |
| Total (Category) | 55 (31.4%) | 120 (68.6%) |
| Total (Overall) | 275 (52.3%) | 251 (47.7%) |
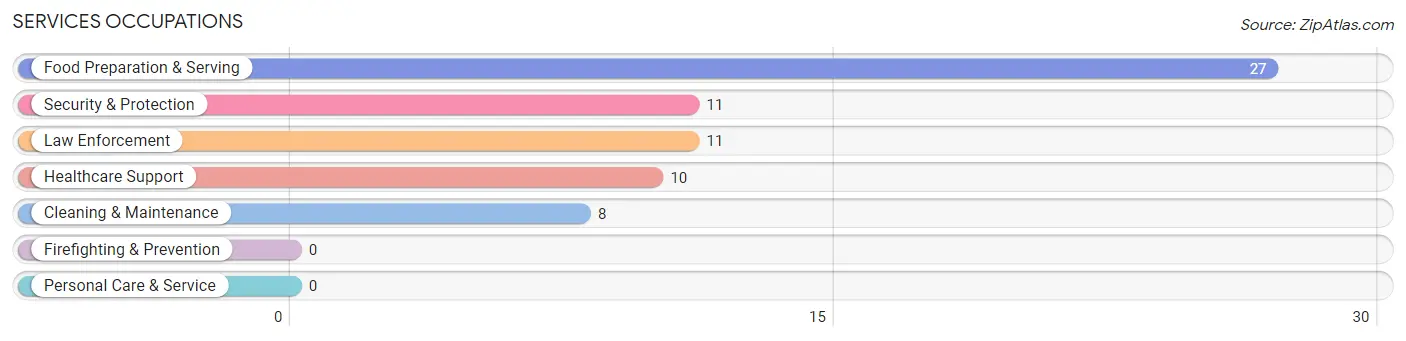
Services Occupations
The most common Services occupations in Crandon Lakes are Food Preparation & Serving (27 | 5.1%), Security & Protection (11 | 2.1%), Law Enforcement (11 | 2.1%), Healthcare Support (10 | 1.9%), and Cleaning & Maintenance (8 | 1.5%).
Services Occupations by Sex
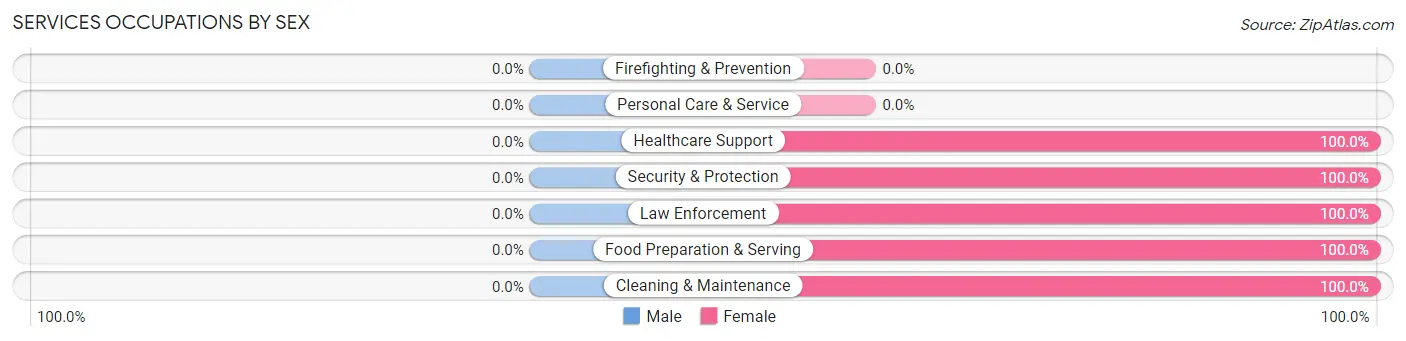
| Occupation | Male | Female |
| Healthcare Support | 0 (0.0%) | 10 (100.0%) |
| Security & Protection | 0 (0.0%) | 11 (100.0%) |
| Firefighting & Prevention | 0 (0.0%) | 0 (0.0%) |
| Law Enforcement | 0 (0.0%) | 11 (100.0%) |
| Food Preparation & Serving | 0 (0.0%) | 27 (100.0%) |
| Cleaning & Maintenance | 0 (0.0%) | 8 (100.0%) |
| Personal Care & Service | 0 (0.0%) | 0 (0.0%) |
| Total (Category) | 0 (0.0%) | 56 (100.0%) |
| Total (Overall) | 275 (52.3%) | 251 (47.7%) |
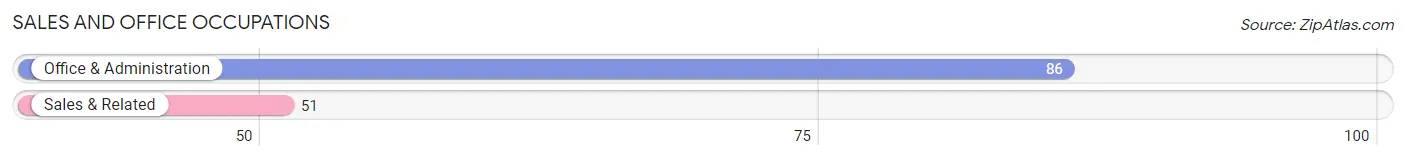
Sales and Office Occupations
The most common Sales and Office occupations in Crandon Lakes are Office & Administration (86 | 16.4%), and Sales & Related (51 | 9.7%).
Sales and Office Occupations by Sex
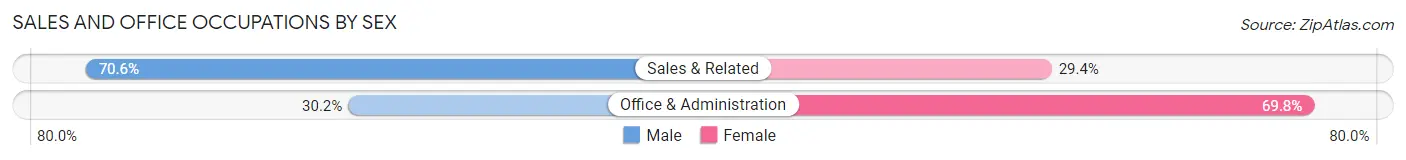
| Occupation | Male | Female |
| Sales & Related | 36 (70.6%) | 15 (29.4%) |
| Office & Administration | 26 (30.2%) | 60 (69.8%) |
| Total (Category) | 62 (45.3%) | 75 (54.7%) |
| Total (Overall) | 275 (52.3%) | 251 (47.7%) |
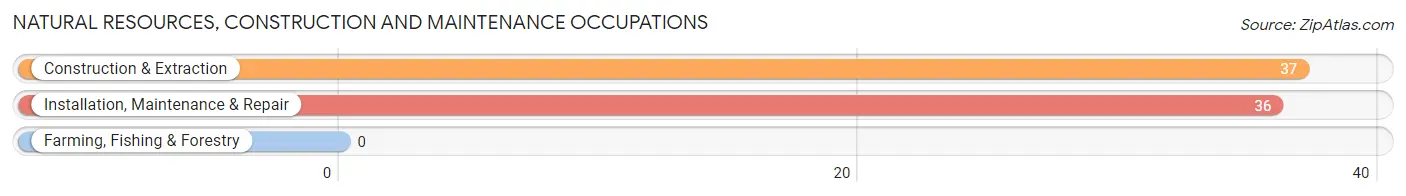
Natural Resources, Construction and Maintenance Occupations
The most common Natural Resources, Construction and Maintenance occupations in Crandon Lakes are Construction & Extraction (37 | 7.0%), and Installation, Maintenance & Repair (36 | 6.8%).
Natural Resources, Construction and Maintenance Occupations by Sex
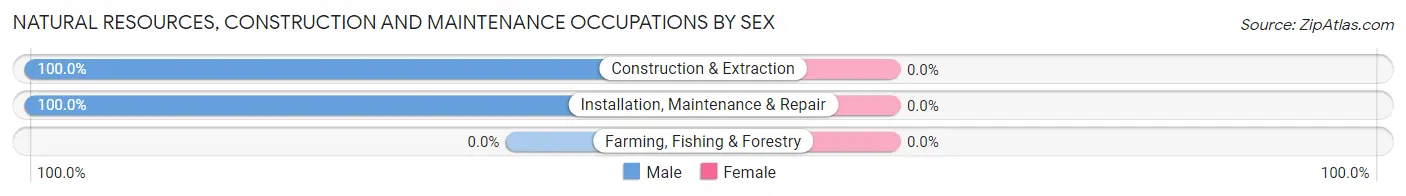
| Occupation | Male | Female |
| Farming, Fishing & Forestry | 0 (0.0%) | 0 (0.0%) |
| Construction & Extraction | 37 (100.0%) | 0 (0.0%) |
| Installation, Maintenance & Repair | 36 (100.0%) | 0 (0.0%) |
| Total (Category) | 73 (100.0%) | 0 (0.0%) |
| Total (Overall) | 275 (52.3%) | 251 (47.7%) |
Production, Transportation and Moving Occupations
The most common Production, Transportation and Moving occupations in Crandon Lakes are Production (55 | 10.5%), and Transportation (30 | 5.7%).
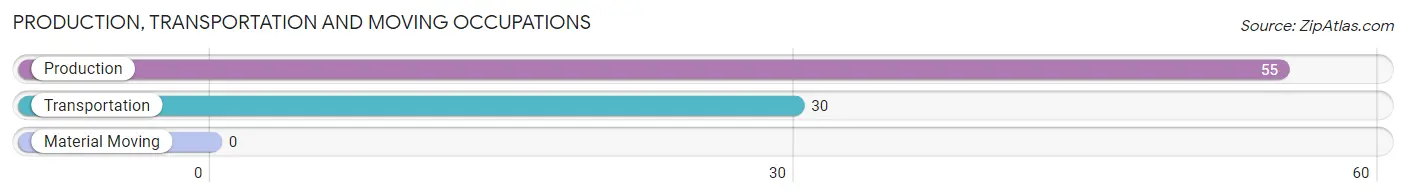
Production, Transportation and Moving Occupations by Sex
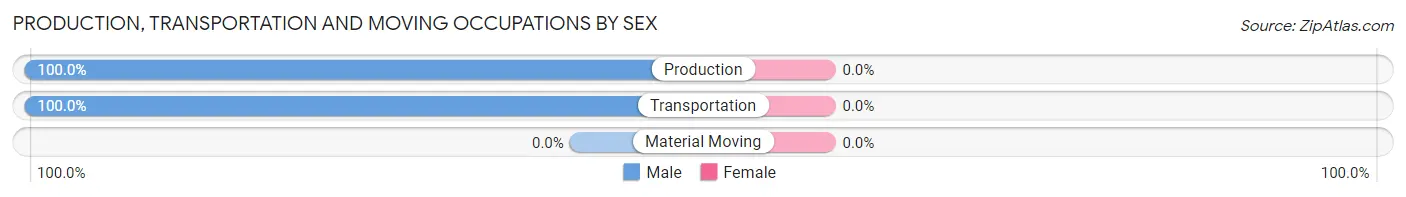
| Occupation | Male | Female |
| Production | 55 (100.0%) | 0 (0.0%) |
| Transportation | 30 (100.0%) | 0 (0.0%) |
| Material Moving | 0 (0.0%) | 0 (0.0%) |
| Total (Category) | 85 (100.0%) | 0 (0.0%) |
| Total (Overall) | 275 (52.3%) | 251 (47.7%) |
Employment Industries by Sex in Crandon Lakes
Employment Industries in Crandon Lakes
The major employment industries in Crandon Lakes include Manufacturing (94 | 17.9%), Construction (63 | 12.0%), Health Care & Social Assistance (57 | 10.8%), Retail Trade (55 | 10.5%), and Public Administration (55 | 10.5%).
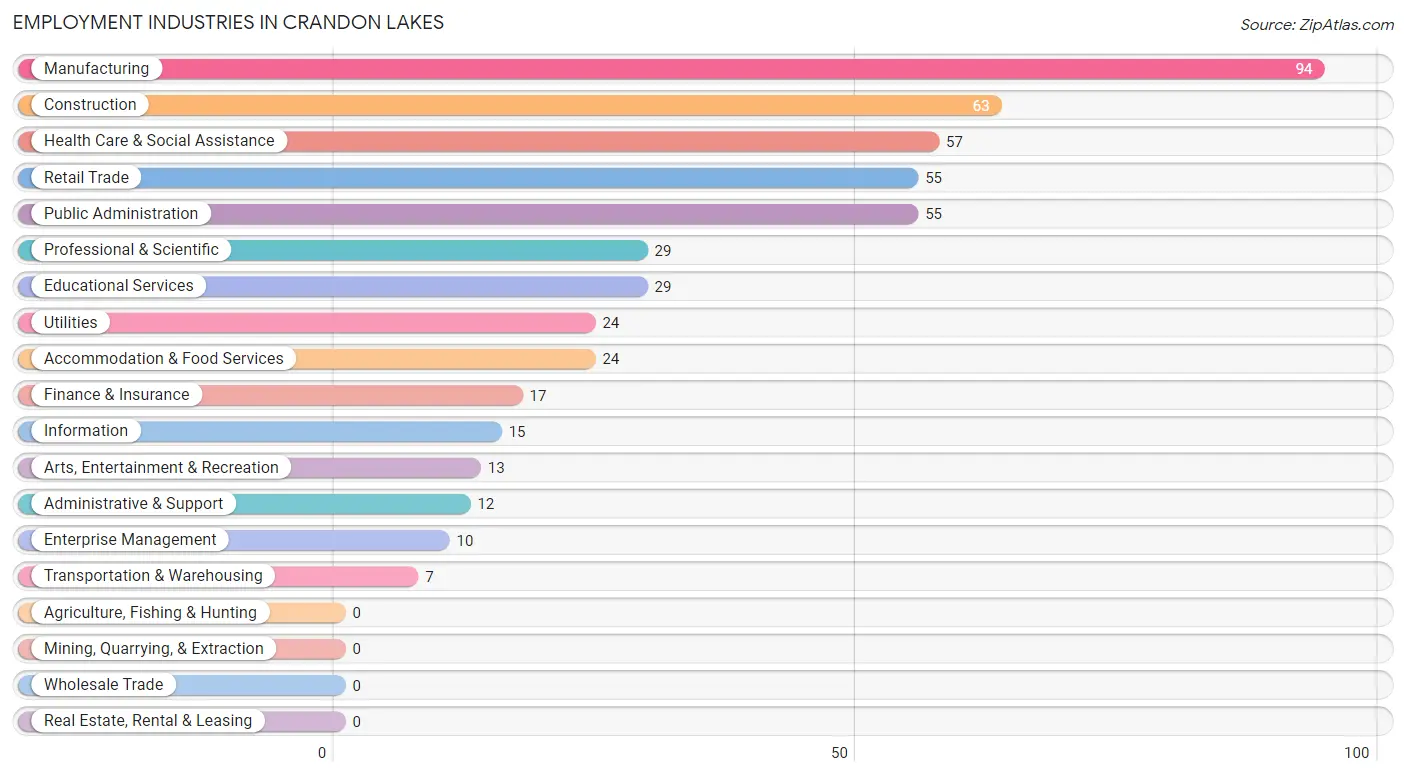
Employment Industries by Sex in Crandon Lakes
The Crandon Lakes industries that see more men than women are Construction (100.0%), Transportation & Warehousing (100.0%), and Utilities (100.0%), whereas the industries that tend to have a higher number of women are Information (100.0%), Enterprise Management (100.0%), and Educational Services (100.0%).
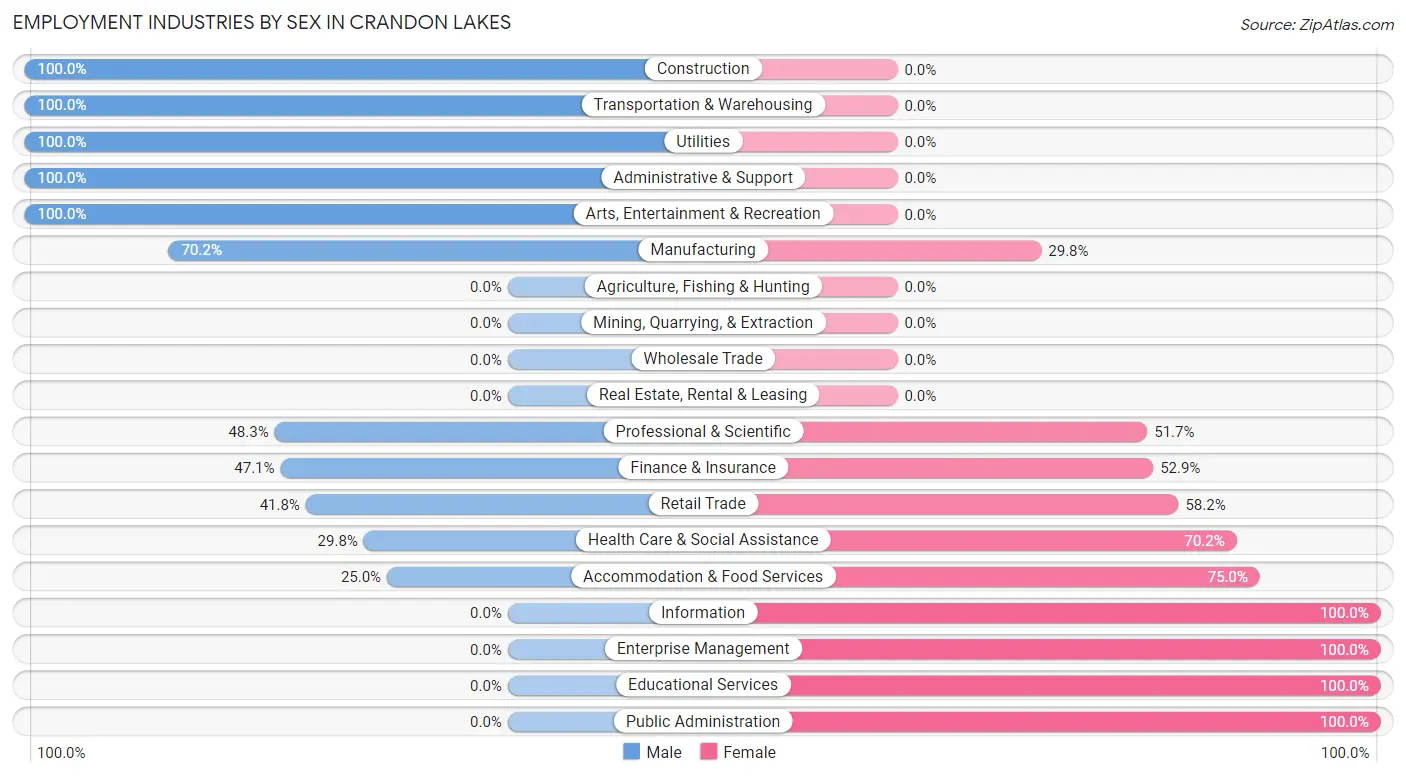
| Industry | Male | Female |
| Agriculture, Fishing & Hunting | 0 (0.0%) | 0 (0.0%) |
| Mining, Quarrying, & Extraction | 0 (0.0%) | 0 (0.0%) |
| Construction | 63 (100.0%) | 0 (0.0%) |
| Manufacturing | 66 (70.2%) | 28 (29.8%) |
| Wholesale Trade | 0 (0.0%) | 0 (0.0%) |
| Retail Trade | 23 (41.8%) | 32 (58.2%) |
| Transportation & Warehousing | 7 (100.0%) | 0 (0.0%) |
| Utilities | 24 (100.0%) | 0 (0.0%) |
| Information | 0 (0.0%) | 15 (100.0%) |
| Finance & Insurance | 8 (47.1%) | 9 (52.9%) |
| Real Estate, Rental & Leasing | 0 (0.0%) | 0 (0.0%) |
| Professional & Scientific | 14 (48.3%) | 15 (51.7%) |
| Enterprise Management | 0 (0.0%) | 10 (100.0%) |
| Administrative & Support | 12 (100.0%) | 0 (0.0%) |
| Educational Services | 0 (0.0%) | 29 (100.0%) |
| Health Care & Social Assistance | 17 (29.8%) | 40 (70.2%) |
| Arts, Entertainment & Recreation | 13 (100.0%) | 0 (0.0%) |
| Accommodation & Food Services | 6 (25.0%) | 18 (75.0%) |
| Public Administration | 0 (0.0%) | 55 (100.0%) |
| Total | 275 (52.3%) | 251 (47.7%) |
Education in Crandon Lakes
School Enrollment in Crandon Lakes
The most common levels of schooling among the 258 students in Crandon Lakes are elementary school (57 | 22.1%), college / undergraduate (56 | 21.7%), and high school (48 | 18.6%).
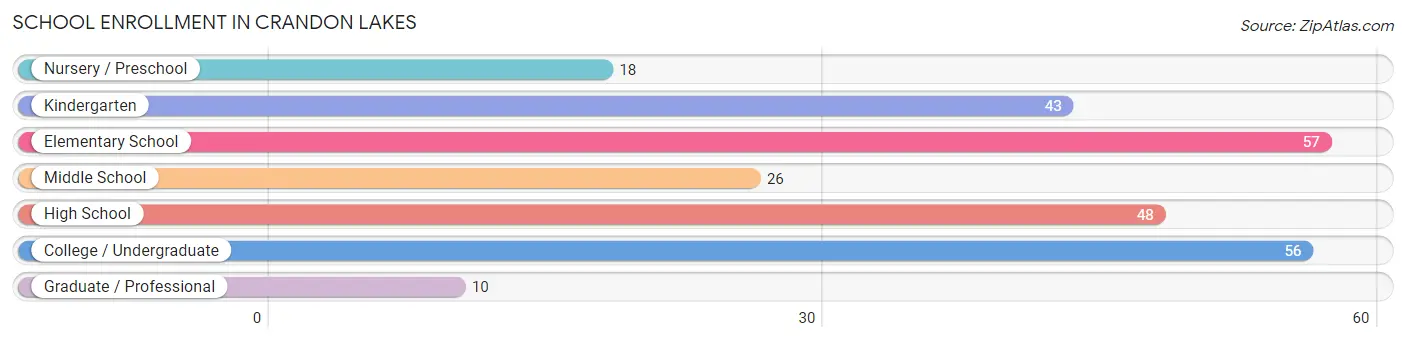
| School Level | # Students | % Students |
| Nursery / Preschool | 18 | 7.0% |
| Kindergarten | 43 | 16.7% |
| Elementary School | 57 | 22.1% |
| Middle School | 26 | 10.1% |
| High School | 48 | 18.6% |
| College / Undergraduate | 56 | 21.7% |
| Graduate / Professional | 10 | 3.9% |
| Total | 258 | 100.0% |
School Enrollment by Age by Funding Source in Crandon Lakes
Out of a total of 258 students who are enrolled in schools in Crandon Lakes, 32 (12.4%) attend a private institution, while the remaining 226 (87.6%) are enrolled in public schools. The age group of 3 to 4 year olds has the highest likelihood of being enrolled in private schools, with 2 (100.0% in the age bracket) enrolled. Conversely, the age group of 10 to 14 year olds has the lowest likelihood of being enrolled in a private school, with 33 (100.0% in the age bracket) attending a public institution.
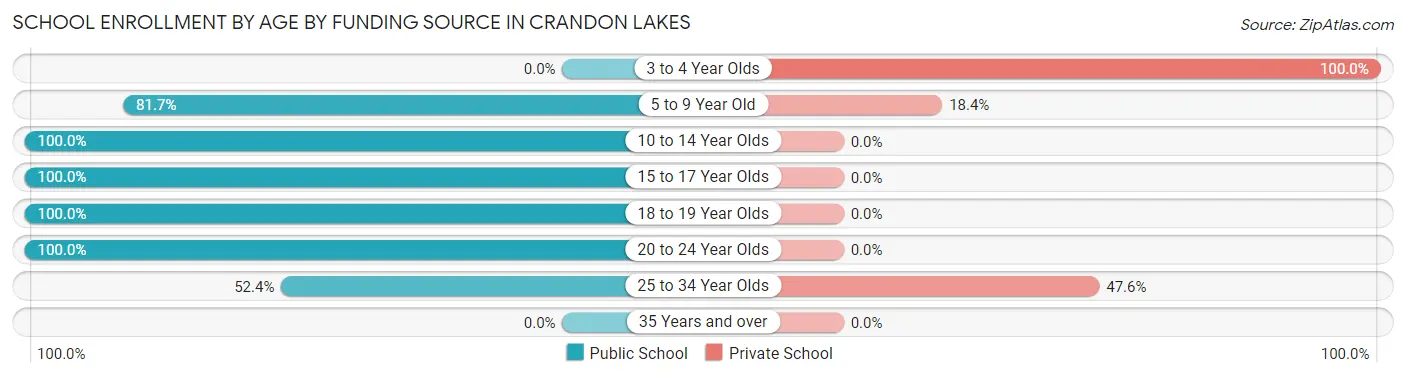
| Age Bracket | Public School | Private School |
| 3 to 4 Year Olds | 0 (0.0%) | 2 (100.0%) |
| 5 to 9 Year Old | 89 (81.7%) | 20 (18.3%) |
| 10 to 14 Year Olds | 33 (100.0%) | 0 (0.0%) |
| 15 to 17 Year Olds | 32 (100.0%) | 0 (0.0%) |
| 18 to 19 Year Olds | 29 (100.0%) | 0 (0.0%) |
| 20 to 24 Year Olds | 32 (100.0%) | 0 (0.0%) |
| 25 to 34 Year Olds | 11 (52.4%) | 10 (47.6%) |
| 35 Years and over | 0 (0.0%) | 0 (0.0%) |
| Total | 226 (87.6%) | 32 (12.4%) |
Educational Attainment by Field of Study in Crandon Lakes
Business (91 | 31.3%), science & technology (42 | 14.4%), liberal arts & history (32 | 11.0%), education (27 | 9.3%), and bio, nature & agricultural (25 | 8.6%) are the most common fields of study among 291 individuals in Crandon Lakes who have obtained a bachelor's degree or higher.
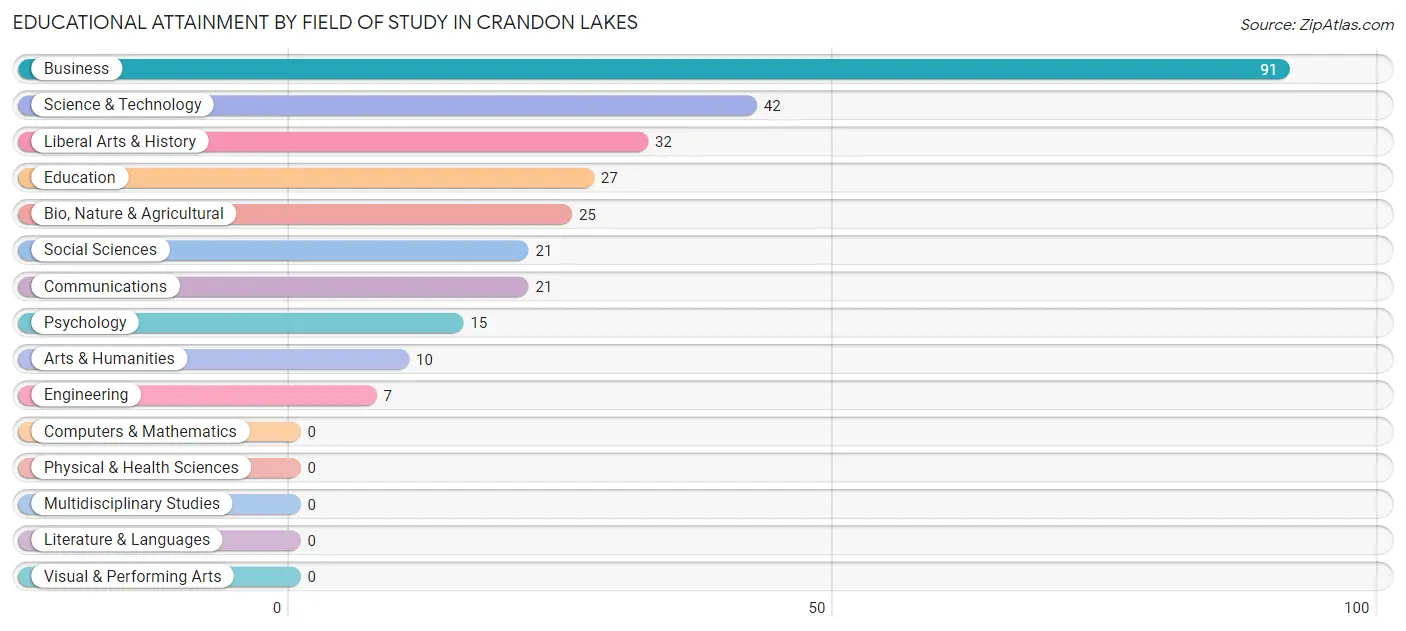
| Field of Study | # Graduates | % Graduates |
| Computers & Mathematics | 0 | 0.0% |
| Bio, Nature & Agricultural | 25 | 8.6% |
| Physical & Health Sciences | 0 | 0.0% |
| Psychology | 15 | 5.1% |
| Social Sciences | 21 | 7.2% |
| Engineering | 7 | 2.4% |
| Multidisciplinary Studies | 0 | 0.0% |
| Science & Technology | 42 | 14.4% |
| Business | 91 | 31.3% |
| Education | 27 | 9.3% |
| Literature & Languages | 0 | 0.0% |
| Liberal Arts & History | 32 | 11.0% |
| Visual & Performing Arts | 0 | 0.0% |
| Communications | 21 | 7.2% |
| Arts & Humanities | 10 | 3.4% |
| Total | 291 | 100.0% |
Transportation & Commute in Crandon Lakes
Vehicle Availability by Sex in Crandon Lakes
The most prevalent vehicle ownership categories in Crandon Lakes are males with 2 vehicles (124, accounting for 46.1%) and females with 2 vehicles (89, making up 49.4%).
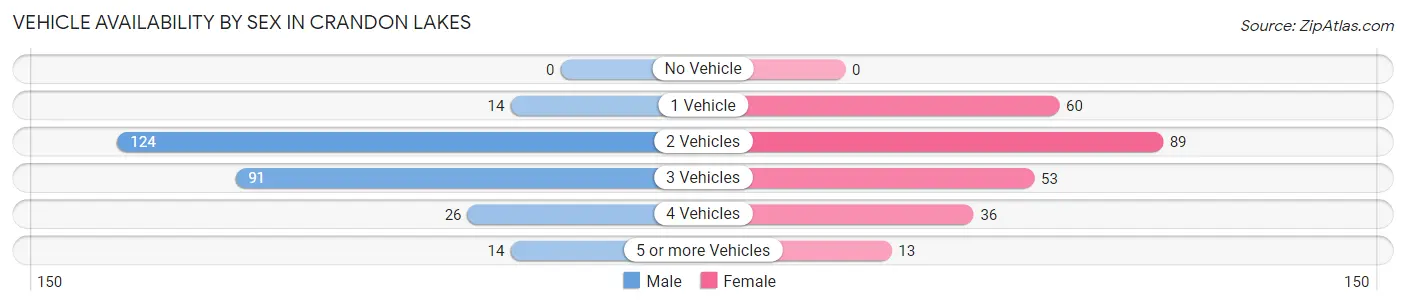
| Vehicles Available | Male | Female |
| No Vehicle | 0 (0.0%) | 0 (0.0%) |
| 1 Vehicle | 14 (5.2%) | 60 (23.9%) |
| 2 Vehicles | 124 (46.1%) | 89 (35.5%) |
| 3 Vehicles | 91 (33.8%) | 53 (21.1%) |
| 4 Vehicles | 26 (9.7%) | 36 (14.3%) |
| 5 or more Vehicles | 14 (5.2%) | 13 (5.2%) |
| Total | 269 (100.0%) | 251 (100.0%) |
Commute Time in Crandon Lakes
The most frequently occuring commute durations in Crandon Lakes are 15 to 19 minutes (114 commuters, 23.7%), 60 to 89 minutes (65 commuters, 13.5%), and 25 to 29 minutes (60 commuters, 12.5%).
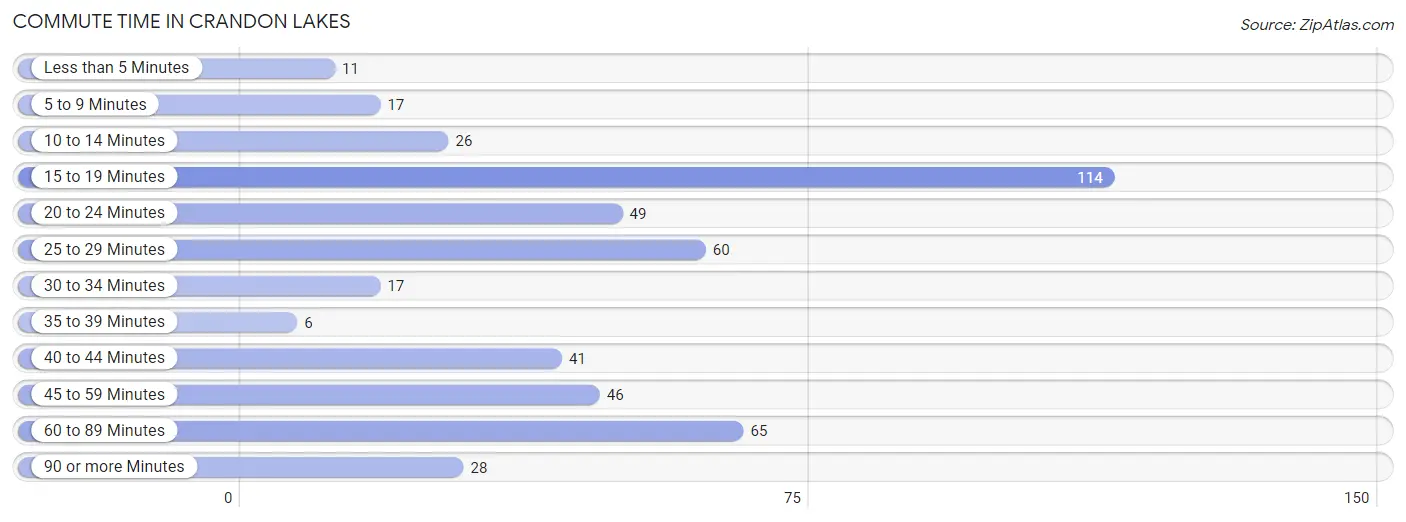
| Commute Time | # Commuters | % Commuters |
| Less than 5 Minutes | 11 | 2.3% |
| 5 to 9 Minutes | 17 | 3.5% |
| 10 to 14 Minutes | 26 | 5.4% |
| 15 to 19 Minutes | 114 | 23.7% |
| 20 to 24 Minutes | 49 | 10.2% |
| 25 to 29 Minutes | 60 | 12.5% |
| 30 to 34 Minutes | 17 | 3.5% |
| 35 to 39 Minutes | 6 | 1.3% |
| 40 to 44 Minutes | 41 | 8.5% |
| 45 to 59 Minutes | 46 | 9.6% |
| 60 to 89 Minutes | 65 | 13.5% |
| 90 or more Minutes | 28 | 5.8% |
Commute Time by Sex in Crandon Lakes
The most common commute times in Crandon Lakes are 15 to 19 minutes (68 commuters, 26.0%) for males and 15 to 19 minutes (46 commuters, 21.1%) for females.
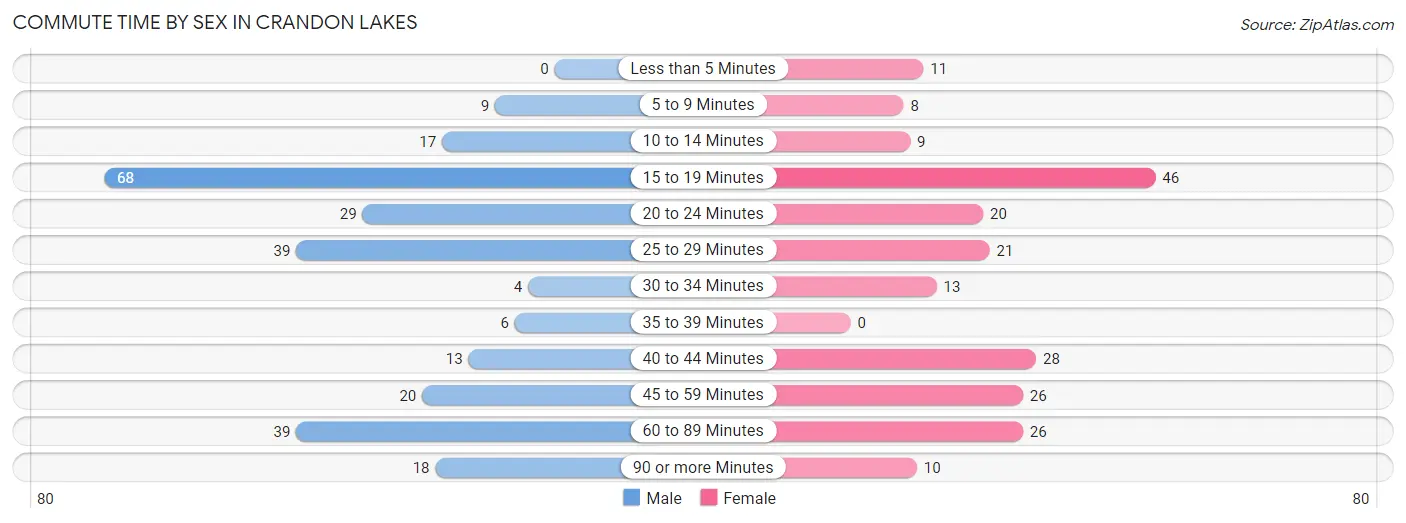
| Commute Time | Male | Female |
| Less than 5 Minutes | 0 (0.0%) | 11 (5.1%) |
| 5 to 9 Minutes | 9 (3.4%) | 8 (3.7%) |
| 10 to 14 Minutes | 17 (6.5%) | 9 (4.1%) |
| 15 to 19 Minutes | 68 (26.0%) | 46 (21.1%) |
| 20 to 24 Minutes | 29 (11.1%) | 20 (9.2%) |
| 25 to 29 Minutes | 39 (14.9%) | 21 (9.6%) |
| 30 to 34 Minutes | 4 (1.5%) | 13 (6.0%) |
| 35 to 39 Minutes | 6 (2.3%) | 0 (0.0%) |
| 40 to 44 Minutes | 13 (5.0%) | 28 (12.8%) |
| 45 to 59 Minutes | 20 (7.6%) | 26 (11.9%) |
| 60 to 89 Minutes | 39 (14.9%) | 26 (11.9%) |
| 90 or more Minutes | 18 (6.9%) | 10 (4.6%) |
Time of Departure to Work by Sex in Crandon Lakes
The most frequent times of departure to work in Crandon Lakes are 6:30 AM to 6:59 AM (59, 22.5%) for males and 7:30 AM to 7:59 AM (47, 21.6%) for females.
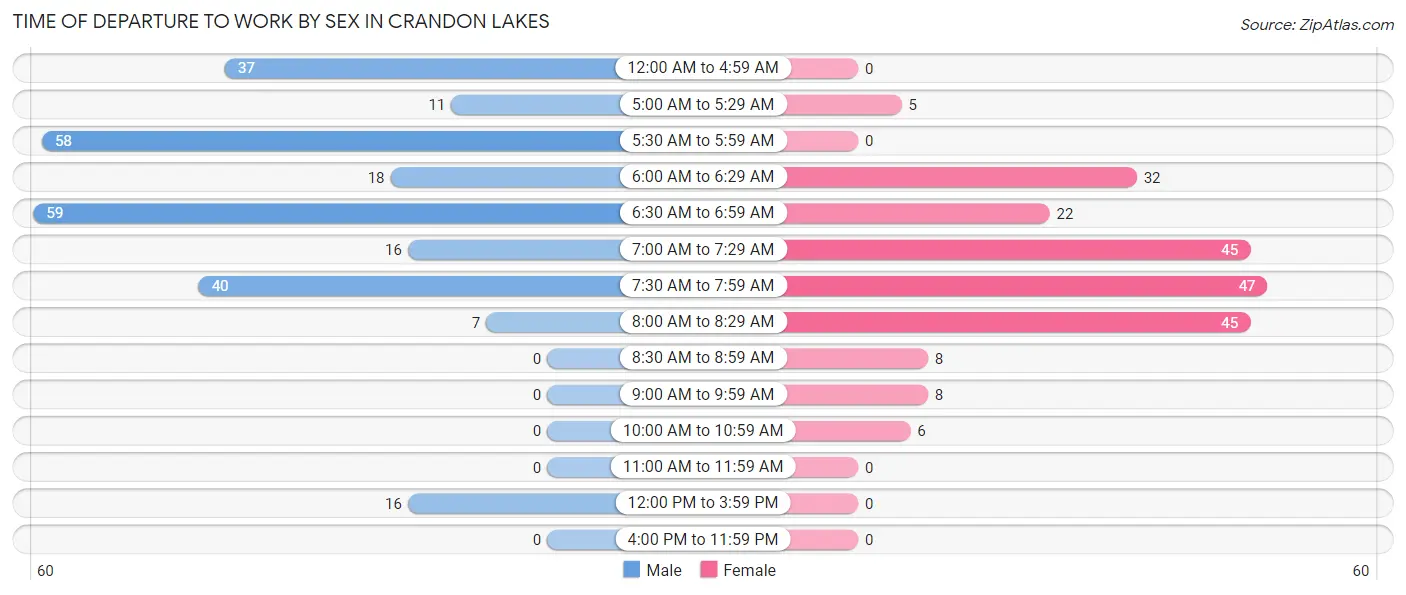
| Time of Departure | Male | Female |
| 12:00 AM to 4:59 AM | 37 (14.1%) | 0 (0.0%) |
| 5:00 AM to 5:29 AM | 11 (4.2%) | 5 (2.3%) |
| 5:30 AM to 5:59 AM | 58 (22.1%) | 0 (0.0%) |
| 6:00 AM to 6:29 AM | 18 (6.9%) | 32 (14.7%) |
| 6:30 AM to 6:59 AM | 59 (22.5%) | 22 (10.1%) |
| 7:00 AM to 7:29 AM | 16 (6.1%) | 45 (20.6%) |
| 7:30 AM to 7:59 AM | 40 (15.3%) | 47 (21.6%) |
| 8:00 AM to 8:29 AM | 7 (2.7%) | 45 (20.6%) |
| 8:30 AM to 8:59 AM | 0 (0.0%) | 8 (3.7%) |
| 9:00 AM to 9:59 AM | 0 (0.0%) | 8 (3.7%) |
| 10:00 AM to 10:59 AM | 0 (0.0%) | 6 (2.8%) |
| 11:00 AM to 11:59 AM | 0 (0.0%) | 0 (0.0%) |
| 12:00 PM to 3:59 PM | 16 (6.1%) | 0 (0.0%) |
| 4:00 PM to 11:59 PM | 0 (0.0%) | 0 (0.0%) |
| Total | 262 (100.0%) | 218 (100.0%) |
Housing Occupancy in Crandon Lakes
Occupancy by Ownership in Crandon Lakes
Of the total 471 dwellings in Crandon Lakes, owner-occupied units account for 426 (90.4%), while renter-occupied units make up 45 (9.6%).
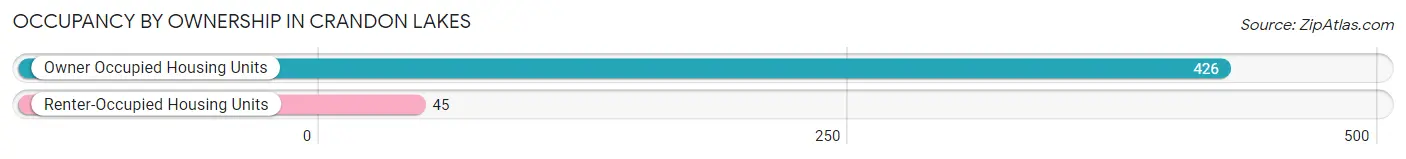
| Occupancy | # Housing Units | % Housing Units |
| Owner Occupied Housing Units | 426 | 90.4% |
| Renter-Occupied Housing Units | 45 | 9.6% |
| Total Occupied Housing Units | 471 | 100.0% |
Occupancy by Household Size in Crandon Lakes
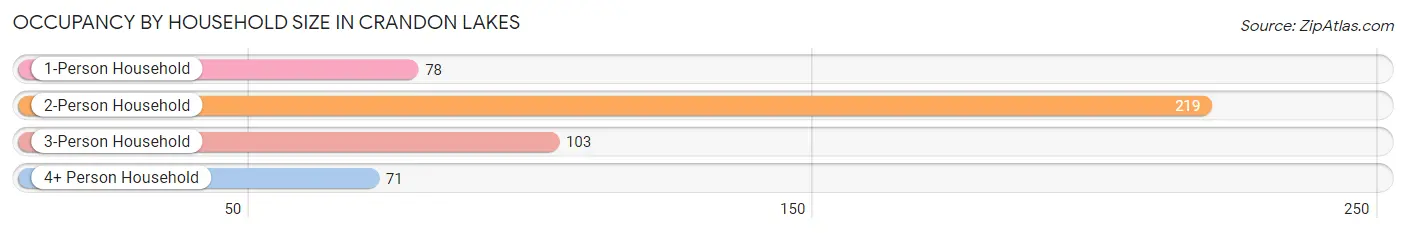
| Household Size | # Housing Units | % Housing Units |
| 1-Person Household | 78 | 16.6% |
| 2-Person Household | 219 | 46.5% |
| 3-Person Household | 103 | 21.9% |
| 4+ Person Household | 71 | 15.1% |
| Total Housing Units | 471 | 100.0% |
Occupancy by Ownership by Household Size in Crandon Lakes
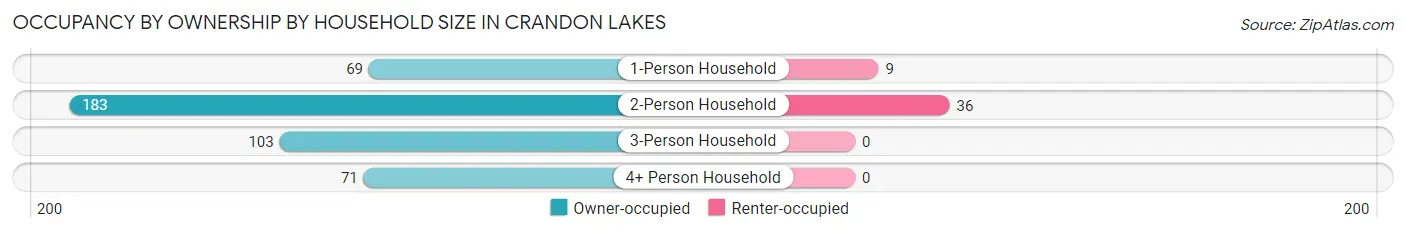
| Household Size | Owner-occupied | Renter-occupied |
| 1-Person Household | 69 (88.5%) | 9 (11.5%) |
| 2-Person Household | 183 (83.6%) | 36 (16.4%) |
| 3-Person Household | 103 (100.0%) | 0 (0.0%) |
| 4+ Person Household | 71 (100.0%) | 0 (0.0%) |
| Total Housing Units | 426 (90.4%) | 45 (9.6%) |
Occupancy by Educational Attainment in Crandon Lakes
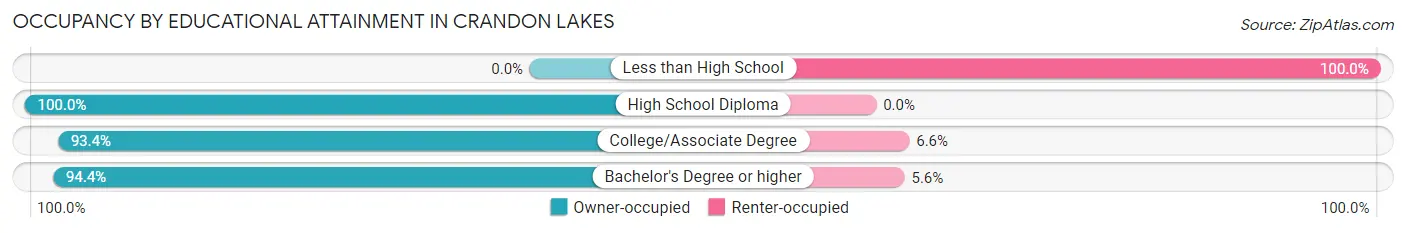
| Household Size | Owner-occupied | Renter-occupied |
| Less than High School | 0 (0.0%) | 26 (100.0%) |
| High School Diploma | 130 (100.0%) | 0 (0.0%) |
| College/Associate Degree | 128 (93.4%) | 9 (6.6%) |
| Bachelor's Degree or higher | 168 (94.4%) | 10 (5.6%) |
Occupancy by Age of Householder in Crandon Lakes
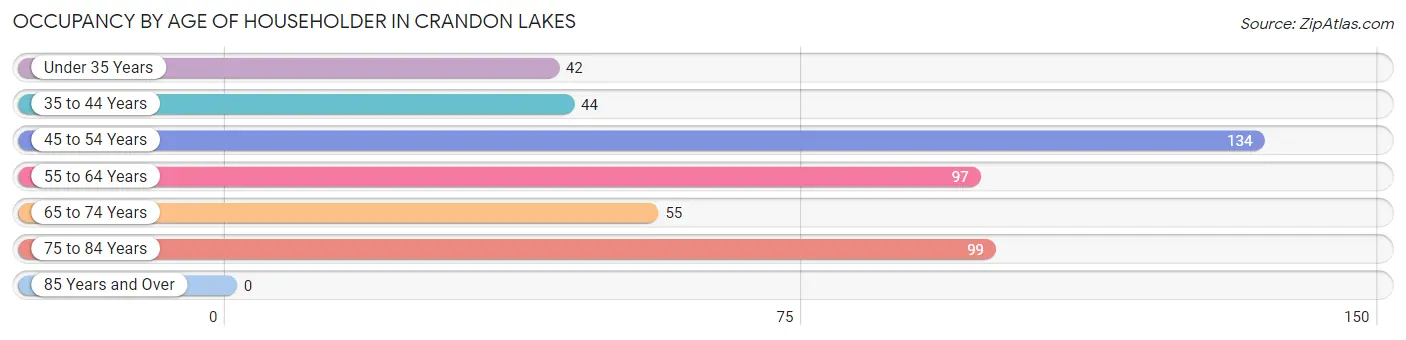
| Age Bracket | # Households | % Households |
| Under 35 Years | 42 | 8.9% |
| 35 to 44 Years | 44 | 9.3% |
| 45 to 54 Years | 134 | 28.4% |
| 55 to 64 Years | 97 | 20.6% |
| 65 to 74 Years | 55 | 11.7% |
| 75 to 84 Years | 99 | 21.0% |
| 85 Years and Over | 0 | 0.0% |
| Total | 471 | 100.0% |
Housing Finances in Crandon Lakes
Median Income by Occupancy in Crandon Lakes
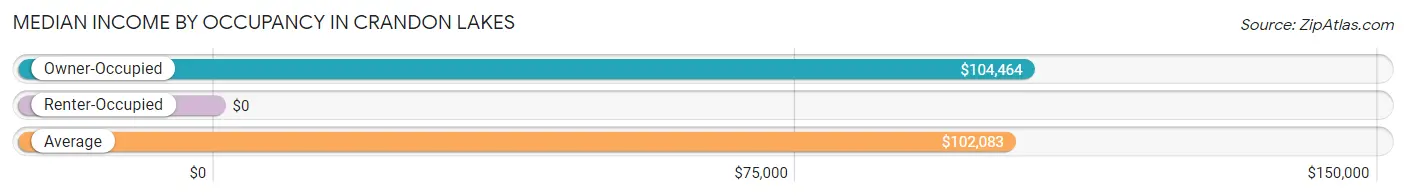
| Occupancy Type | # Households | Median Income |
| Owner-Occupied | 426 (90.4%) | $104,464 |
| Renter-Occupied | 45 (9.6%) | $0 |
| Average | 471 (100.0%) | $102,083 |
Occupancy by Householder Income Bracket in Crandon Lakes
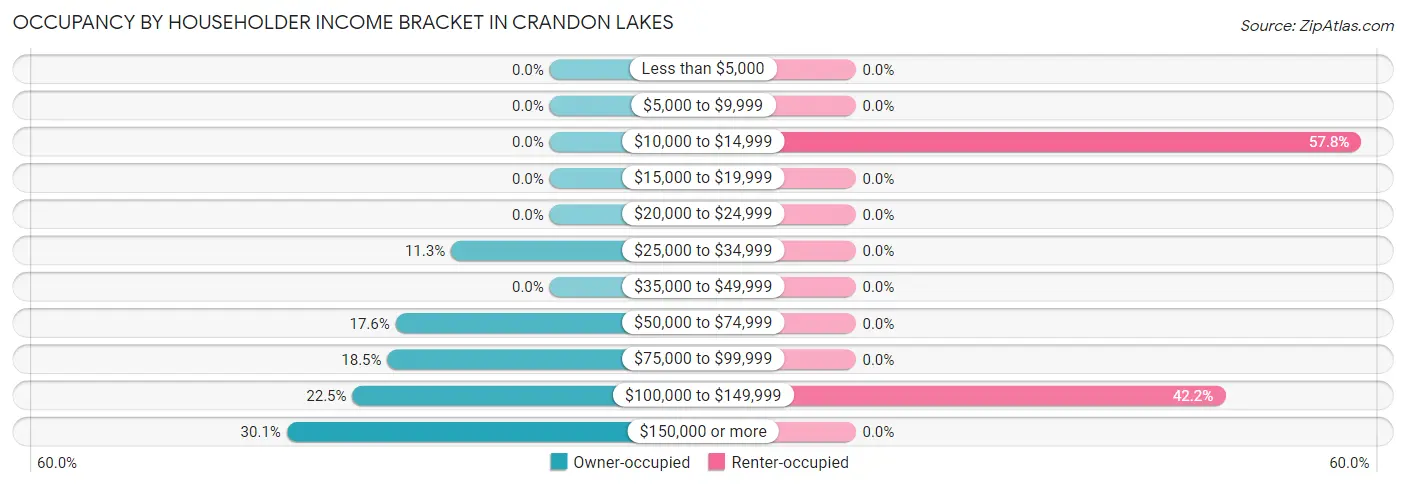
| Income Bracket | Owner-occupied | Renter-occupied |
| Less than $5,000 | 0 (0.0%) | 0 (0.0%) |
| $5,000 to $9,999 | 0 (0.0%) | 0 (0.0%) |
| $10,000 to $14,999 | 0 (0.0%) | 26 (57.8%) |
| $15,000 to $19,999 | 0 (0.0%) | 0 (0.0%) |
| $20,000 to $24,999 | 0 (0.0%) | 0 (0.0%) |
| $25,000 to $34,999 | 48 (11.3%) | 0 (0.0%) |
| $35,000 to $49,999 | 0 (0.0%) | 0 (0.0%) |
| $50,000 to $74,999 | 75 (17.6%) | 0 (0.0%) |
| $75,000 to $99,999 | 79 (18.5%) | 0 (0.0%) |
| $100,000 to $149,999 | 96 (22.5%) | 19 (42.2%) |
| $150,000 or more | 128 (30.0%) | 0 (0.0%) |
| Total | 426 (100.0%) | 45 (100.0%) |
Monthly Housing Cost Tiers in Crandon Lakes
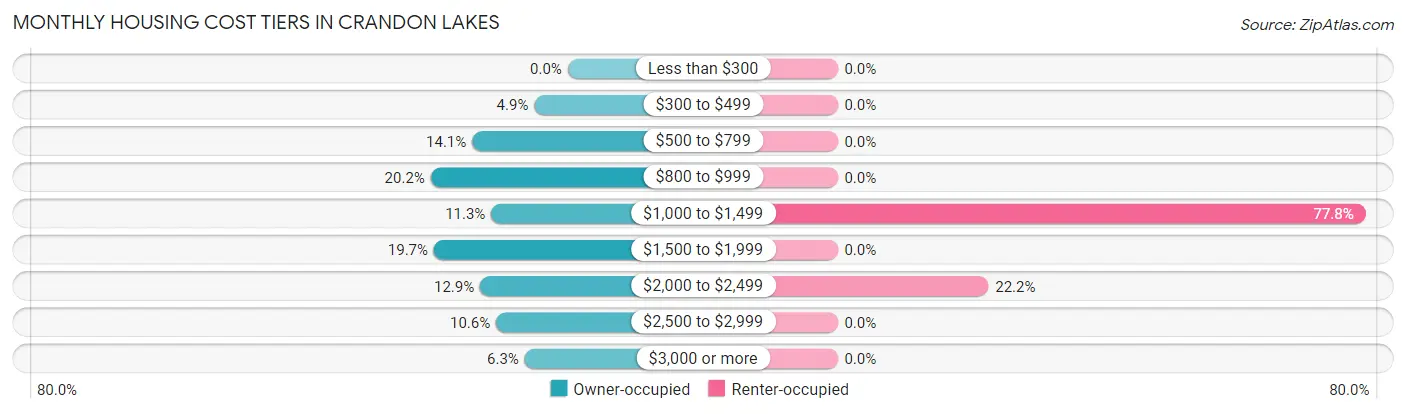
| Monthly Cost | Owner-occupied | Renter-occupied |
| Less than $300 | 0 (0.0%) | 0 (0.0%) |
| $300 to $499 | 21 (4.9%) | 0 (0.0%) |
| $500 to $799 | 60 (14.1%) | 0 (0.0%) |
| $800 to $999 | 86 (20.2%) | 0 (0.0%) |
| $1,000 to $1,499 | 48 (11.3%) | 35 (77.8%) |
| $1,500 to $1,999 | 84 (19.7%) | 0 (0.0%) |
| $2,000 to $2,499 | 55 (12.9%) | 10 (22.2%) |
| $2,500 to $2,999 | 45 (10.6%) | 0 (0.0%) |
| $3,000 or more | 27 (6.3%) | 0 (0.0%) |
| Total | 426 (100.0%) | 45 (100.0%) |
Physical Housing Characteristics in Crandon Lakes
Housing Structures in Crandon Lakes
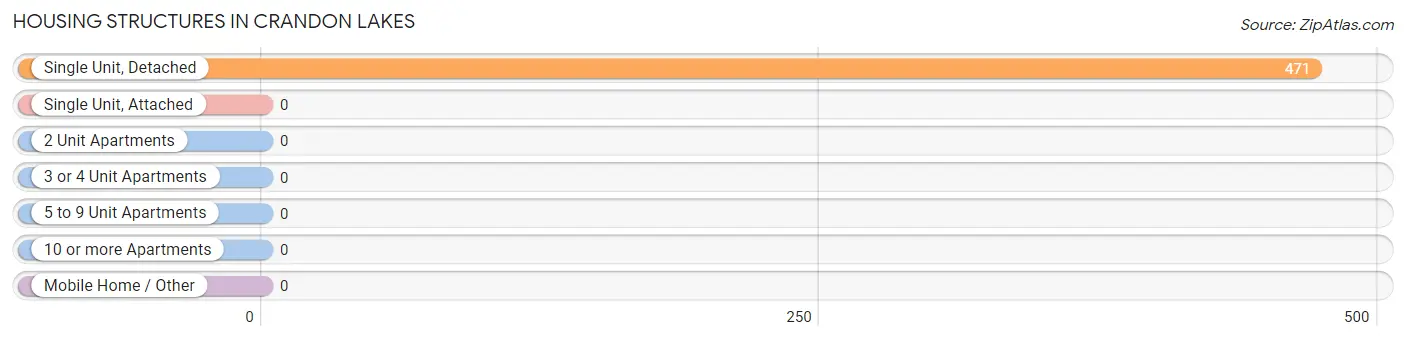
| Structure Type | # Housing Units | % Housing Units |
| Single Unit, Detached | 471 | 100.0% |
| Single Unit, Attached | 0 | 0.0% |
| 2 Unit Apartments | 0 | 0.0% |
| 3 or 4 Unit Apartments | 0 | 0.0% |
| 5 to 9 Unit Apartments | 0 | 0.0% |
| 10 or more Apartments | 0 | 0.0% |
| Mobile Home / Other | 0 | 0.0% |
| Total | 471 | 100.0% |
Housing Structures by Occupancy in Crandon Lakes
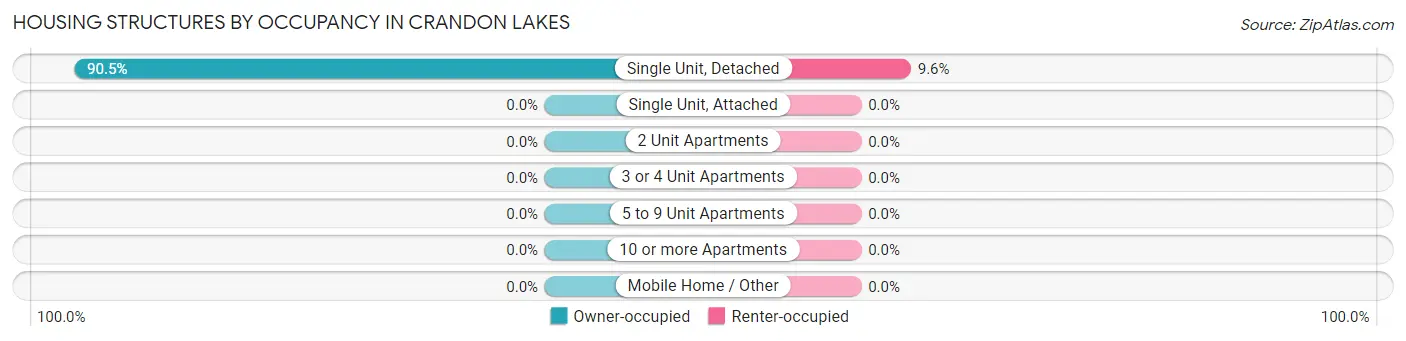
| Structure Type | Owner-occupied | Renter-occupied |
| Single Unit, Detached | 426 (90.4%) | 45 (9.6%) |
| Single Unit, Attached | 0 (0.0%) | 0 (0.0%) |
| 2 Unit Apartments | 0 (0.0%) | 0 (0.0%) |
| 3 or 4 Unit Apartments | 0 (0.0%) | 0 (0.0%) |
| 5 to 9 Unit Apartments | 0 (0.0%) | 0 (0.0%) |
| 10 or more Apartments | 0 (0.0%) | 0 (0.0%) |
| Mobile Home / Other | 0 (0.0%) | 0 (0.0%) |
| Total | 426 (90.4%) | 45 (9.6%) |
Housing Structures by Number of Rooms in Crandon Lakes
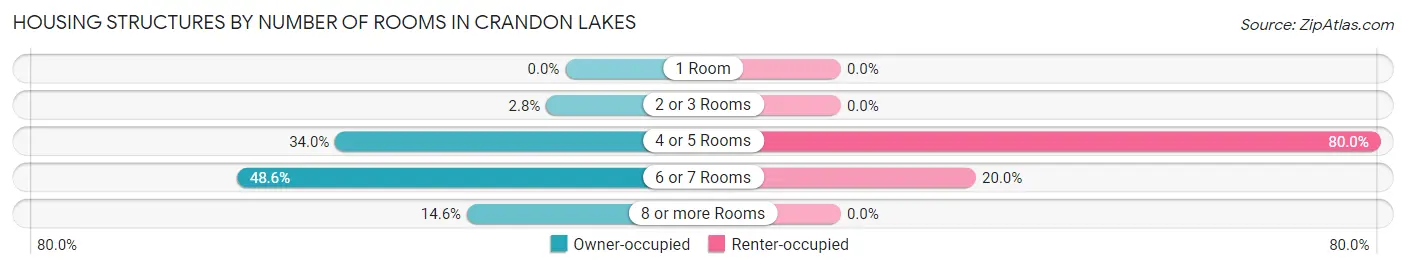
| Number of Rooms | Owner-occupied | Renter-occupied |
| 1 Room | 0 (0.0%) | 0 (0.0%) |
| 2 or 3 Rooms | 12 (2.8%) | 0 (0.0%) |
| 4 or 5 Rooms | 145 (34.0%) | 36 (80.0%) |
| 6 or 7 Rooms | 207 (48.6%) | 9 (20.0%) |
| 8 or more Rooms | 62 (14.5%) | 0 (0.0%) |
| Total | 426 (100.0%) | 45 (100.0%) |
Housing Structure by Heating Type in Crandon Lakes
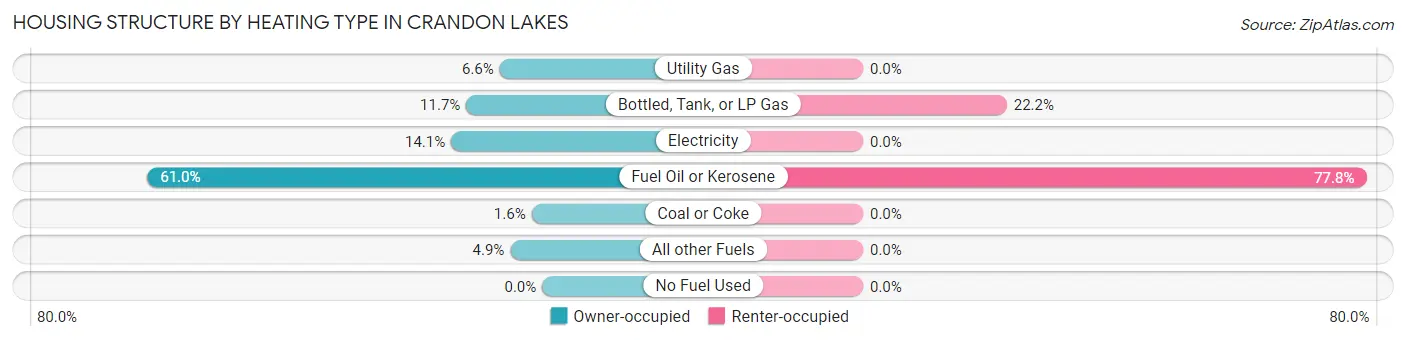
| Heating Type | Owner-occupied | Renter-occupied |
| Utility Gas | 28 (6.6%) | 0 (0.0%) |
| Bottled, Tank, or LP Gas | 50 (11.7%) | 10 (22.2%) |
| Electricity | 60 (14.1%) | 0 (0.0%) |
| Fuel Oil or Kerosene | 260 (61.0%) | 35 (77.8%) |
| Coal or Coke | 7 (1.6%) | 0 (0.0%) |
| All other Fuels | 21 (4.9%) | 0 (0.0%) |
| No Fuel Used | 0 (0.0%) | 0 (0.0%) |
| Total | 426 (100.0%) | 45 (100.0%) |
Household Vehicle Usage in Crandon Lakes
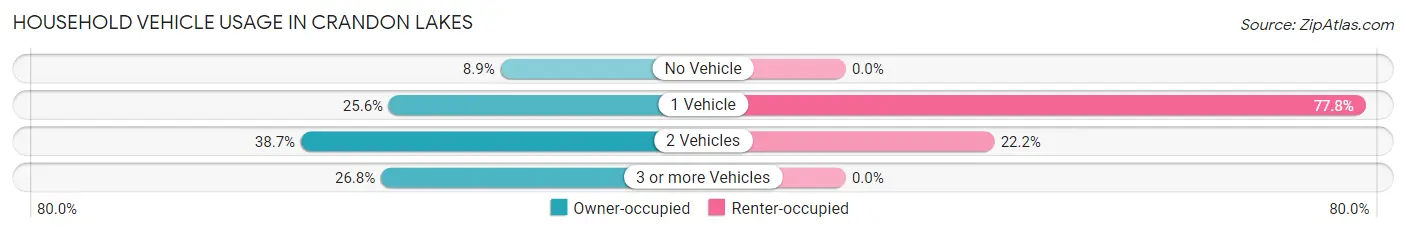
| Vehicles per Household | Owner-occupied | Renter-occupied |
| No Vehicle | 38 (8.9%) | 0 (0.0%) |
| 1 Vehicle | 109 (25.6%) | 35 (77.8%) |
| 2 Vehicles | 165 (38.7%) | 10 (22.2%) |
| 3 or more Vehicles | 114 (26.8%) | 0 (0.0%) |
| Total | 426 (100.0%) | 45 (100.0%) |
Real Estate & Mortgages in Crandon Lakes
Real Estate and Mortgage Overview in Crandon Lakes
| Characteristic | Without Mortgage | With Mortgage |
| Housing Units | 196 | 230 |
| Median Property Value | $245,300 | $234,800 |
| Median Household Income | $76,726 | $88 |
| Monthly Housing Costs | $841 | $27 |
| Real Estate Taxes | $6,721 | $0 |
Property Value by Mortgage Status in Crandon Lakes
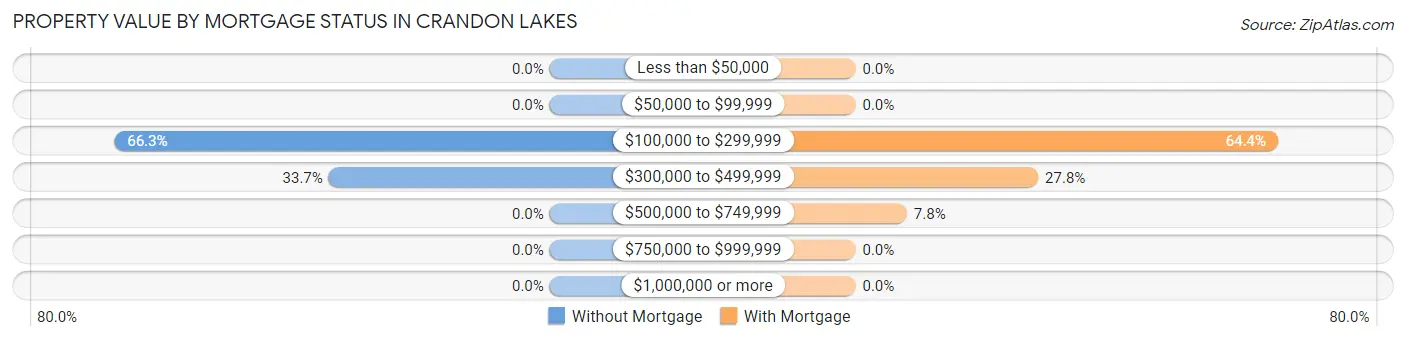
| Property Value | Without Mortgage | With Mortgage |
| Less than $50,000 | 0 (0.0%) | 0 (0.0%) |
| $50,000 to $99,999 | 0 (0.0%) | 0 (0.0%) |
| $100,000 to $299,999 | 130 (66.3%) | 148 (64.3%) |
| $300,000 to $499,999 | 66 (33.7%) | 64 (27.8%) |
| $500,000 to $749,999 | 0 (0.0%) | 18 (7.8%) |
| $750,000 to $999,999 | 0 (0.0%) | 0 (0.0%) |
| $1,000,000 or more | 0 (0.0%) | 0 (0.0%) |
| Total | 196 (100.0%) | 230 (100.0%) |
Household Income by Mortgage Status in Crandon Lakes
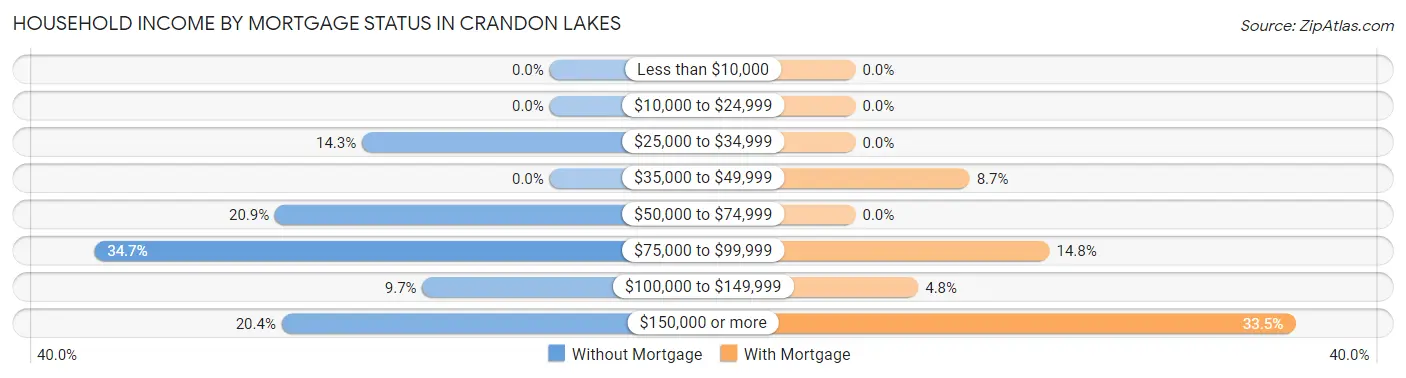
| Household Income | Without Mortgage | With Mortgage |
| Less than $10,000 | 0 (0.0%) | 0 (0.0%) |
| $10,000 to $24,999 | 0 (0.0%) | 0 (0.0%) |
| $25,000 to $34,999 | 28 (14.3%) | 0 (0.0%) |
| $35,000 to $49,999 | 0 (0.0%) | 20 (8.7%) |
| $50,000 to $74,999 | 41 (20.9%) | 0 (0.0%) |
| $75,000 to $99,999 | 68 (34.7%) | 34 (14.8%) |
| $100,000 to $149,999 | 19 (9.7%) | 11 (4.8%) |
| $150,000 or more | 40 (20.4%) | 77 (33.5%) |
| Total | 196 (100.0%) | 230 (100.0%) |
Property Value to Household Income Ratio in Crandon Lakes
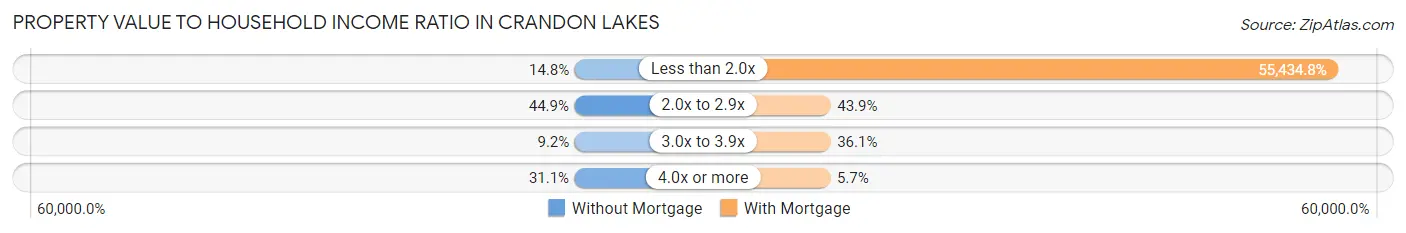
| Value-to-Income Ratio | Without Mortgage | With Mortgage |
| Less than 2.0x | 29 (14.8%) | 127,500 (55,434.8%) |
| 2.0x to 2.9x | 88 (44.9%) | 101 (43.9%) |
| 3.0x to 3.9x | 18 (9.2%) | 83 (36.1%) |
| 4.0x or more | 61 (31.1%) | 13 (5.7%) |
| Total | 196 (100.0%) | 230 (100.0%) |
Real Estate Taxes by Mortgage Status in Crandon Lakes
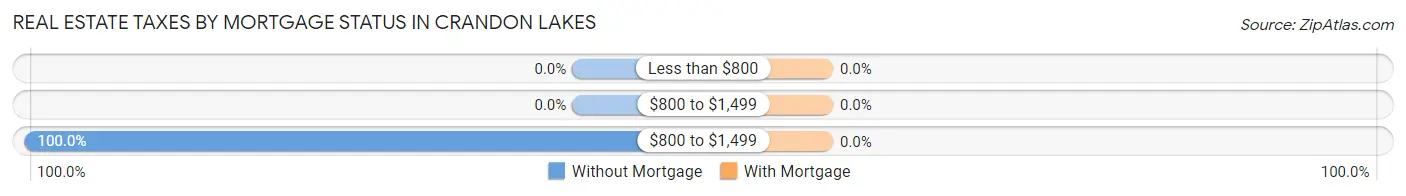
| Property Taxes | Without Mortgage | With Mortgage |
| Less than $800 | 0 (0.0%) | 0 (0.0%) |
| $800 to $1,499 | 0 (0.0%) | 0 (0.0%) |
| $800 to $1,499 | 196 (100.0%) | 0 (0.0%) |
| Total | 196 (100.0%) | 230 (100.0%) |
Health & Disability in Crandon Lakes
Health Insurance Coverage by Age in Crandon Lakes
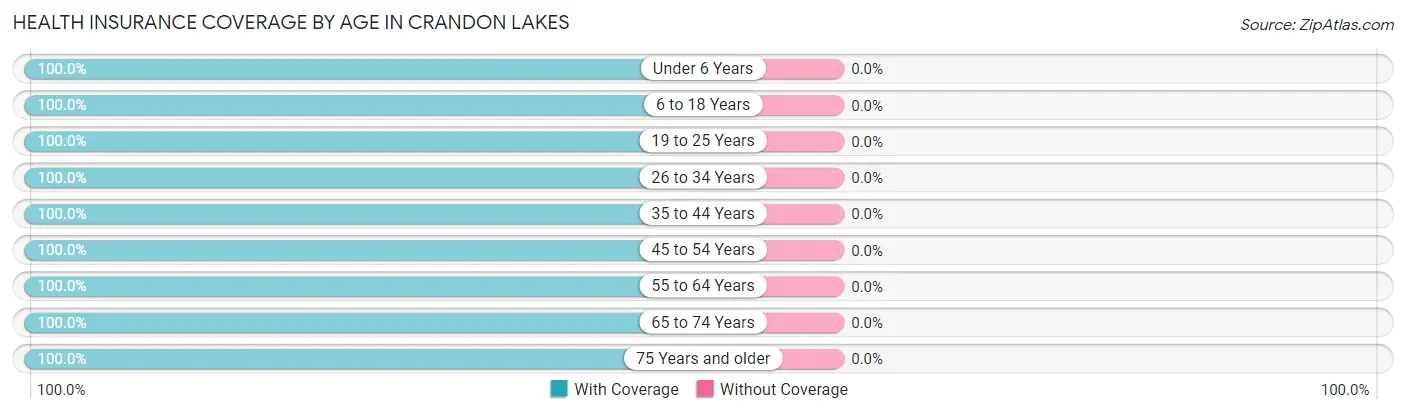
| Age Bracket | With Coverage | Without Coverage |
| Under 6 Years | 82 (100.0%) | 0 (0.0%) |
| 6 to 18 Years | 149 (100.0%) | 0 (0.0%) |
| 19 to 25 Years | 98 (100.0%) | 0 (0.0%) |
| 26 to 34 Years | 96 (100.0%) | 0 (0.0%) |
| 35 to 44 Years | 96 (100.0%) | 0 (0.0%) |
| 45 to 54 Years | 186 (100.0%) | 0 (0.0%) |
| 55 to 64 Years | 187 (100.0%) | 0 (0.0%) |
| 65 to 74 Years | 117 (100.0%) | 0 (0.0%) |
| 75 Years and older | 130 (100.0%) | 0 (0.0%) |
| Total | 1,141 (100.0%) | 0 (0.0%) |
Health Insurance Coverage by Citizenship Status in Crandon Lakes
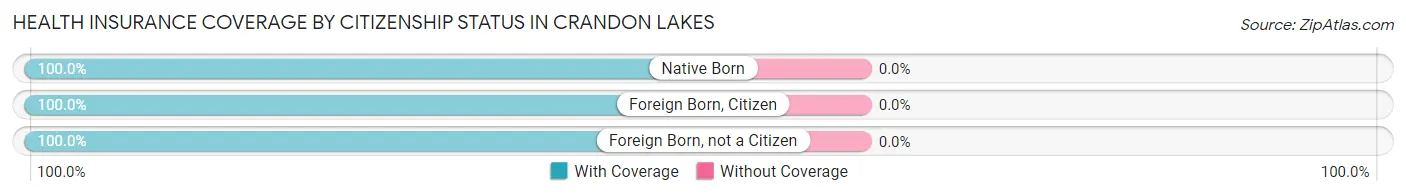
| Citizenship Status | With Coverage | Without Coverage |
| Native Born | 82 (100.0%) | 0 (0.0%) |
| Foreign Born, Citizen | 149 (100.0%) | 0 (0.0%) |
| Foreign Born, not a Citizen | 98 (100.0%) | 0 (0.0%) |
Health Insurance Coverage by Household Income in Crandon Lakes
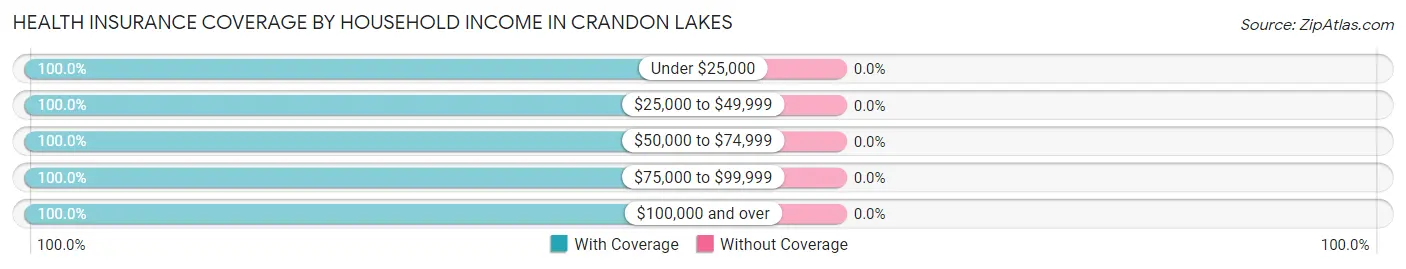
| Household Income | With Coverage | Without Coverage |
| Under $25,000 | 52 (100.0%) | 0 (0.0%) |
| $25,000 to $49,999 | 73 (100.0%) | 0 (0.0%) |
| $50,000 to $74,999 | 174 (100.0%) | 0 (0.0%) |
| $75,000 to $99,999 | 169 (100.0%) | 0 (0.0%) |
| $100,000 and over | 673 (100.0%) | 0 (0.0%) |
Public vs Private Health Insurance Coverage by Age in Crandon Lakes
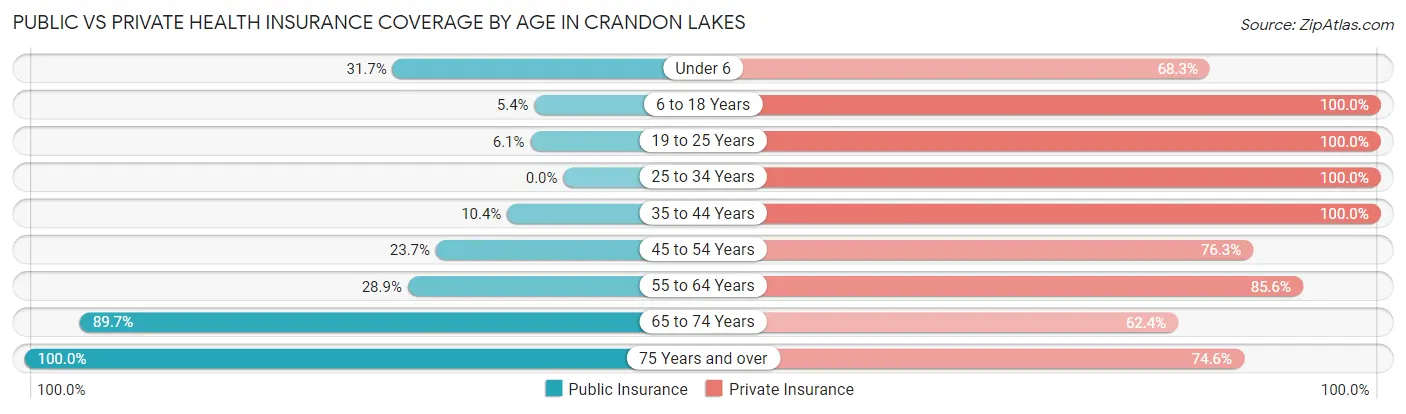
| Age Bracket | Public Insurance | Private Insurance |
| Under 6 | 26 (31.7%) | 56 (68.3%) |
| 6 to 18 Years | 8 (5.4%) | 149 (100.0%) |
| 19 to 25 Years | 6 (6.1%) | 98 (100.0%) |
| 25 to 34 Years | 0 (0.0%) | 96 (100.0%) |
| 35 to 44 Years | 10 (10.4%) | 96 (100.0%) |
| 45 to 54 Years | 44 (23.7%) | 142 (76.3%) |
| 55 to 64 Years | 54 (28.9%) | 160 (85.6%) |
| 65 to 74 Years | 105 (89.7%) | 73 (62.4%) |
| 75 Years and over | 130 (100.0%) | 97 (74.6%) |
| Total | 383 (33.6%) | 967 (84.8%) |
Disability Status by Sex by Age in Crandon Lakes
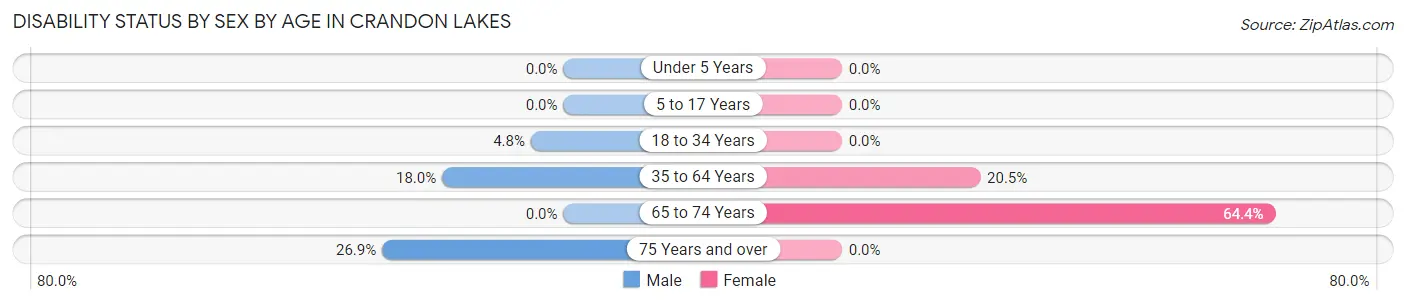
| Age Bracket | Male | Female |
| Under 5 Years | 0 (0.0%) | 0 (0.0%) |
| 5 to 17 Years | 0 (0.0%) | 0 (0.0%) |
| 18 to 34 Years | 6 (4.8%) | 0 (0.0%) |
| 35 to 64 Years | 38 (18.0%) | 53 (20.5%) |
| 65 to 74 Years | 0 (0.0%) | 47 (64.4%) |
| 75 Years and over | 28 (26.9%) | 0 (0.0%) |
Disability Class by Sex by Age in Crandon Lakes
Disability Class: Hearing Difficulty
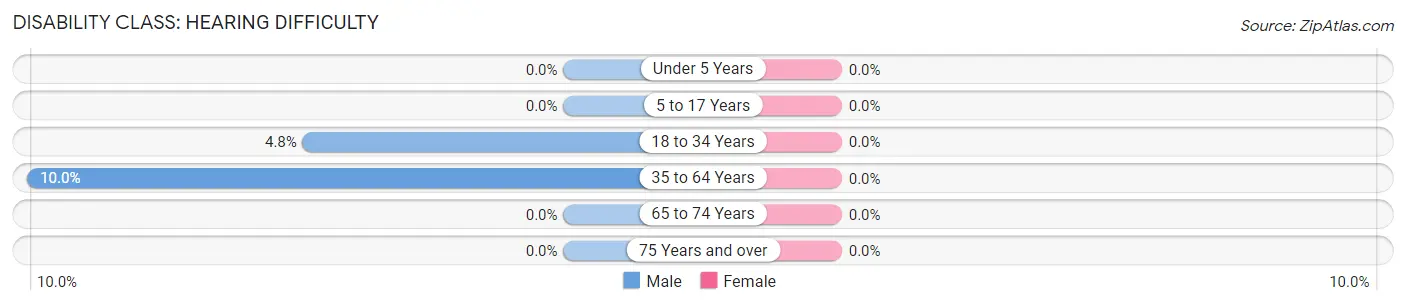
| Age Bracket | Male | Female |
| Under 5 Years | 0 (0.0%) | 0 (0.0%) |
| 5 to 17 Years | 0 (0.0%) | 0 (0.0%) |
| 18 to 34 Years | 6 (4.8%) | 0 (0.0%) |
| 35 to 64 Years | 21 (10.0%) | 0 (0.0%) |
| 65 to 74 Years | 0 (0.0%) | 0 (0.0%) |
| 75 Years and over | 0 (0.0%) | 0 (0.0%) |
Disability Class: Vision Difficulty
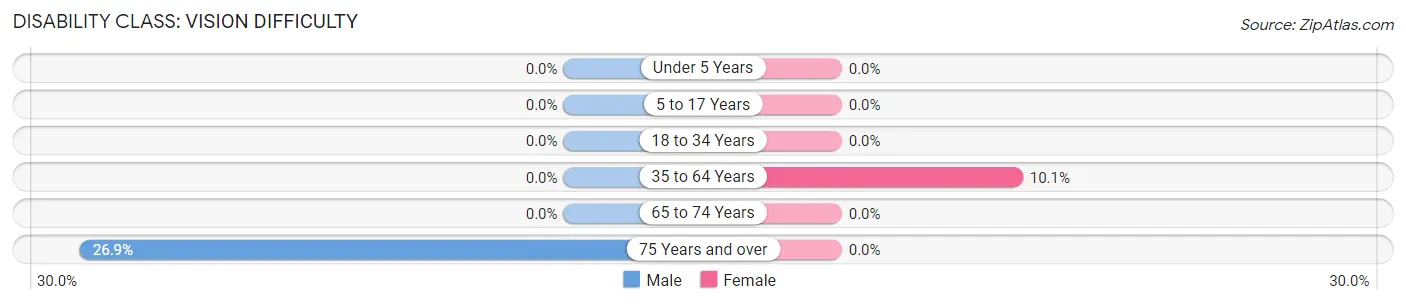
| Age Bracket | Male | Female |
| Under 5 Years | 0 (0.0%) | 0 (0.0%) |
| 5 to 17 Years | 0 (0.0%) | 0 (0.0%) |
| 18 to 34 Years | 0 (0.0%) | 0 (0.0%) |
| 35 to 64 Years | 0 (0.0%) | 26 (10.1%) |
| 65 to 74 Years | 0 (0.0%) | 0 (0.0%) |
| 75 Years and over | 28 (26.9%) | 0 (0.0%) |
Disability Class: Cognitive Difficulty
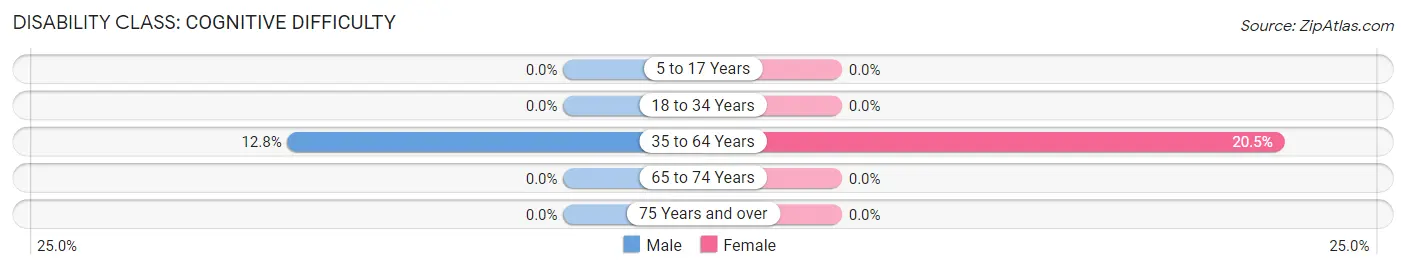
| Age Bracket | Male | Female |
| 5 to 17 Years | 0 (0.0%) | 0 (0.0%) |
| 18 to 34 Years | 0 (0.0%) | 0 (0.0%) |
| 35 to 64 Years | 27 (12.8%) | 53 (20.5%) |
| 65 to 74 Years | 0 (0.0%) | 0 (0.0%) |
| 75 Years and over | 0 (0.0%) | 0 (0.0%) |
Disability Class: Ambulatory Difficulty
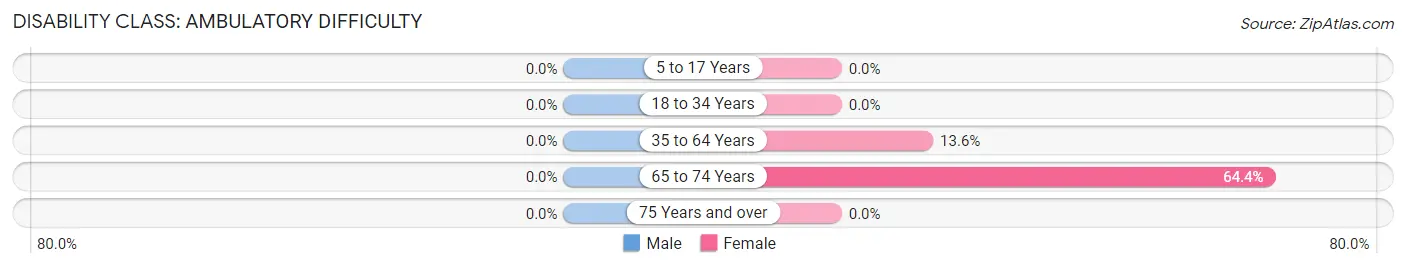
| Age Bracket | Male | Female |
| 5 to 17 Years | 0 (0.0%) | 0 (0.0%) |
| 18 to 34 Years | 0 (0.0%) | 0 (0.0%) |
| 35 to 64 Years | 0 (0.0%) | 35 (13.6%) |
| 65 to 74 Years | 0 (0.0%) | 47 (64.4%) |
| 75 Years and over | 0 (0.0%) | 0 (0.0%) |
Disability Class: Self-Care Difficulty
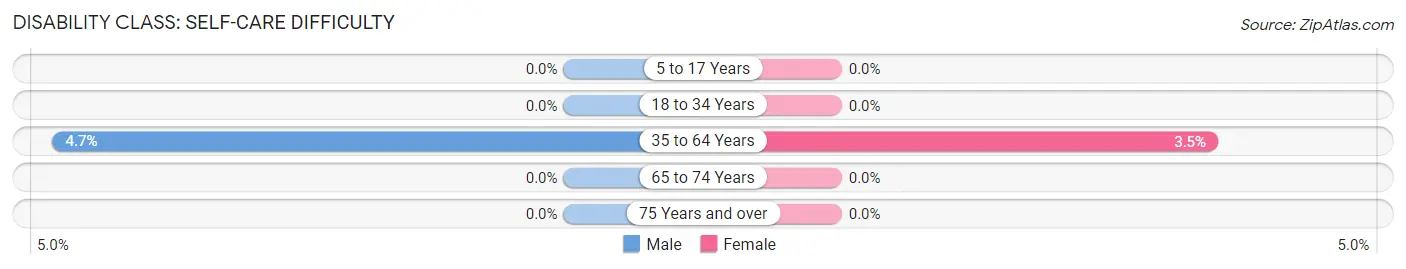
| Age Bracket | Male | Female |
| 5 to 17 Years | 0 (0.0%) | 0 (0.0%) |
| 18 to 34 Years | 0 (0.0%) | 0 (0.0%) |
| 35 to 64 Years | 10 (4.7%) | 9 (3.5%) |
| 65 to 74 Years | 0 (0.0%) | 0 (0.0%) |
| 75 Years and over | 0 (0.0%) | 0 (0.0%) |
Technology Access in Crandon Lakes
Computing Device Access in Crandon Lakes
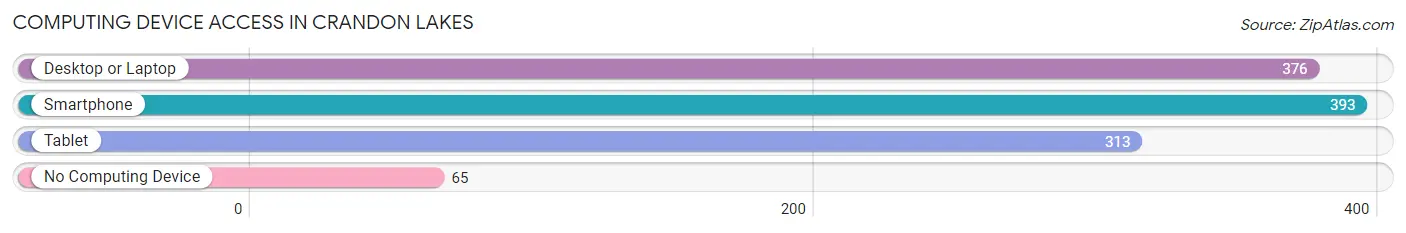
| Device Type | # Households | % Households |
| Desktop or Laptop | 376 | 79.8% |
| Smartphone | 393 | 83.4% |
| Tablet | 313 | 66.4% |
| No Computing Device | 65 | 13.8% |
| Total | 471 | 100.0% |
Internet Access in Crandon Lakes
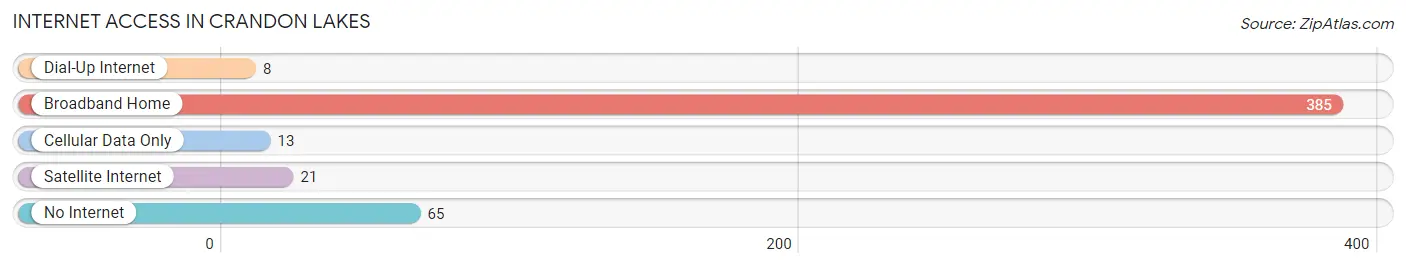
| Internet Type | # Households | % Households |
| Dial-Up Internet | 8 | 1.7% |
| Broadband Home | 385 | 81.7% |
| Cellular Data Only | 13 | 2.8% |
| Satellite Internet | 21 | 4.5% |
| No Internet | 65 | 13.8% |
| Total | 471 | 100.0% |
Crandon Lakes Summary
Crandon Lakes is a small unincorporated community located in Morris County, New Jersey. It is situated in the foothills of the Kittatinny Mountains, and is part of the larger township of Jefferson. The community is located approximately 25 miles northwest of New York City, and is home to a population of approximately 1,500 people.
History
Crandon Lakes was first settled in the late 1700s by Dutch and German immigrants. The area was originally known as “Cranden”, and was part of the larger township of Jefferson. In the early 1800s, the area was renamed “Crandon Lakes”, after the nearby lakes. The lakes were named after the Cranden family, who were the original settlers of the area.
In the late 1800s, the area began to develop as a resort destination. The lakes were a popular spot for fishing, swimming, and boating. The area also became known for its mineral springs, which were believed to have healing properties.
In the early 1900s, the area began to develop as a residential community. The lakes were a popular spot for summer homes, and the area began to attract more and more people. By the mid-1900s, the area had become a popular destination for vacationers and retirees.
Geography
Crandon Lakes is located in the foothills of the Kittatinny Mountains. The area is characterized by rolling hills, forests, and several small lakes. The lakes are the main feature of the area, and are a popular spot for fishing, swimming, and boating.
The area is located approximately 25 miles northwest of New York City. It is bordered by the townships of Jefferson, Rockaway, and Denville. The closest major city is Morristown, which is located approximately 10 miles to the south.
Economy
The economy of Crandon Lakes is largely based on tourism and recreation. The area is a popular destination for vacationers and retirees, and is known for its lakes and mineral springs. The area also attracts visitors for its hiking trails, camping sites, and other outdoor activities.
The area is also home to several small businesses, including restaurants, shops, and other services. The area is also home to several small farms, which produce a variety of fruits and vegetables.
Demographics
As of the 2010 census, the population of Crandon Lakes was 1,500. The population is largely white (94.7%), with small percentages of African American (2.3%), Asian (1.3%), and Hispanic (1.7%) residents. The median household income is $76,250, and the median home value is $323,000.
Conclusion
Crandon Lakes is a small unincorporated community located in Morris County, New Jersey. It is situated in the foothills of the Kittatinny Mountains, and is part of the larger township of Jefferson. The area is known for its lakes and mineral springs, and is a popular destination for vacationers and retirees. The economy of the area is largely based on tourism and recreation, and the area is home to several small businesses. The population of Crandon Lakes is largely white, with small percentages of African American, Asian, and Hispanic residents.
Common Questions
What is the Total Population of Crandon Lakes?
Total Population of Crandon Lakes is 1,141.
What is the Total Male Population of Crandon Lakes?
Total Male Population of Crandon Lakes is 561.
What is the Total Female Population of Crandon Lakes?
Total Female Population of Crandon Lakes is 580.
What is the Ratio of Males per 100 Females in Crandon Lakes?
There are 96.72 Males per 100 Females in Crandon Lakes.
What is the Ratio of Females per 100 Males in Crandon Lakes?
There are 103.39 Females per 100 Males in Crandon Lakes.
What is the Median Population Age in Crandon Lakes?
Median Population Age in Crandon Lakes is 47.9 Years.
What is the Average Family Size in Crandon Lakes
Average Family Size in Crandon Lakes is 2.8 People.
What is the Average Household Size in Crandon Lakes
Average Household Size in Crandon Lakes is 2.4 People.
What is Per Capita Income in Crandon Lakes?
Per Capita income in Crandon Lakes is $44,950.
What is the Median Family Income in Crandon Lakes?
Median Family Income in Crandon Lakes is $114,615.
What is the Median Household income in Crandon Lakes?
Median Household Income in Crandon Lakes is $102,083.
What is Income or Wage Gap in Crandon Lakes?
Income or Wage Gap in Crandon Lakes is 37.8%.
Women in Crandon Lakes earn 62.2 cents for every dollar earned by a man.
What is Inequality or Gini Index in Crandon Lakes?
Inequality or Gini Index in Crandon Lakes is 0.32.
How Large is the Labor Force in Crandon Lakes?
There are 558 People in the Labor Forcein in Crandon Lakes.
What is the Percentage of People in the Labor Force in Crandon Lakes?
57.5% of People are in the Labor Force in Crandon Lakes.
What is the Unemployment Rate in Crandon Lakes?
Unemployment Rate in Crandon Lakes is 5.7%.