Oak Valley, NJ
Oak Valley Map
Oak Valley Overview
4,346
TOTAL POPULATION
2,269
MALE POPULATION
2,077
FEMALE POPULATION
109.24
MALES / 100 FEMALES
91.54
FEMALES / 100 MALES
32.8
MEDIAN AGE
3.7
AVG FAMILY SIZE
3.3
AVG HOUSEHOLD SIZE
$30,598
PER CAPITA INCOME
$101,275
AVG FAMILY INCOME
$86,875
AVG HOUSEHOLD INCOME
30.4%
WAGE / INCOME GAP [ % ]
69.6¢/ $1
WAGE / INCOME GAP [ $ ]
0.34
INEQUALITY / GINI INDEX
2,105
LABOR FORCE [ PEOPLE ]
65.3%
PERCENT IN LABOR FORCE
3.8%
UNEMPLOYMENT RATE
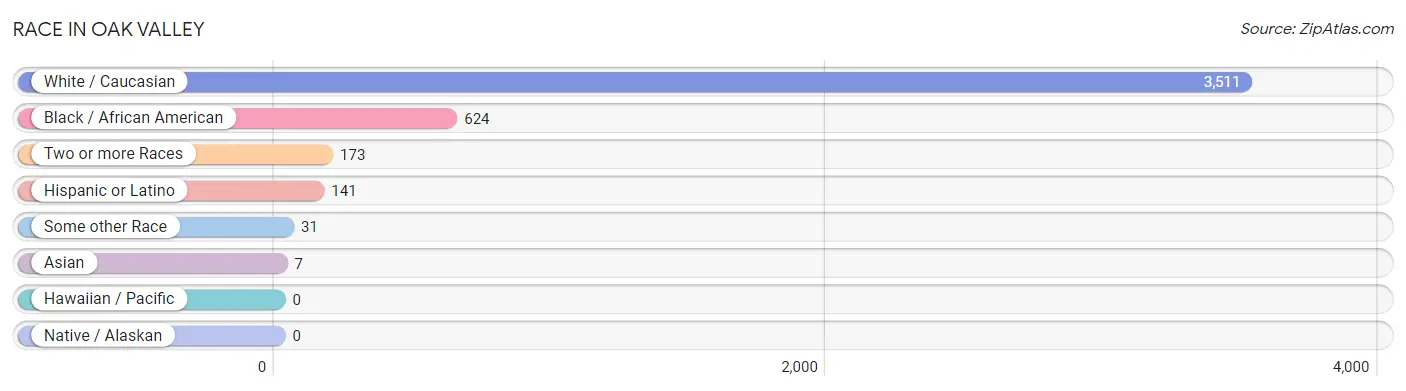
Race in Oak Valley
The most populous races in Oak Valley are White / Caucasian (3,511 | 80.8%), Black / African American (624 | 14.4%), and Two or more Races (173 | 4.0%).
| Race | # Population | % Population |
| Asian | 7 | 0.2% |
| Black / African American | 624 | 14.4% |
| Hawaiian / Pacific | 0 | 0.0% |
| Hispanic or Latino | 141 | 3.2% |
| Native / Alaskan | 0 | 0.0% |
| White / Caucasian | 3,511 | 80.8% |
| Two or more Races | 173 | 4.0% |
| Some other Race | 31 | 0.7% |
| Total | 4,346 | 100.0% |
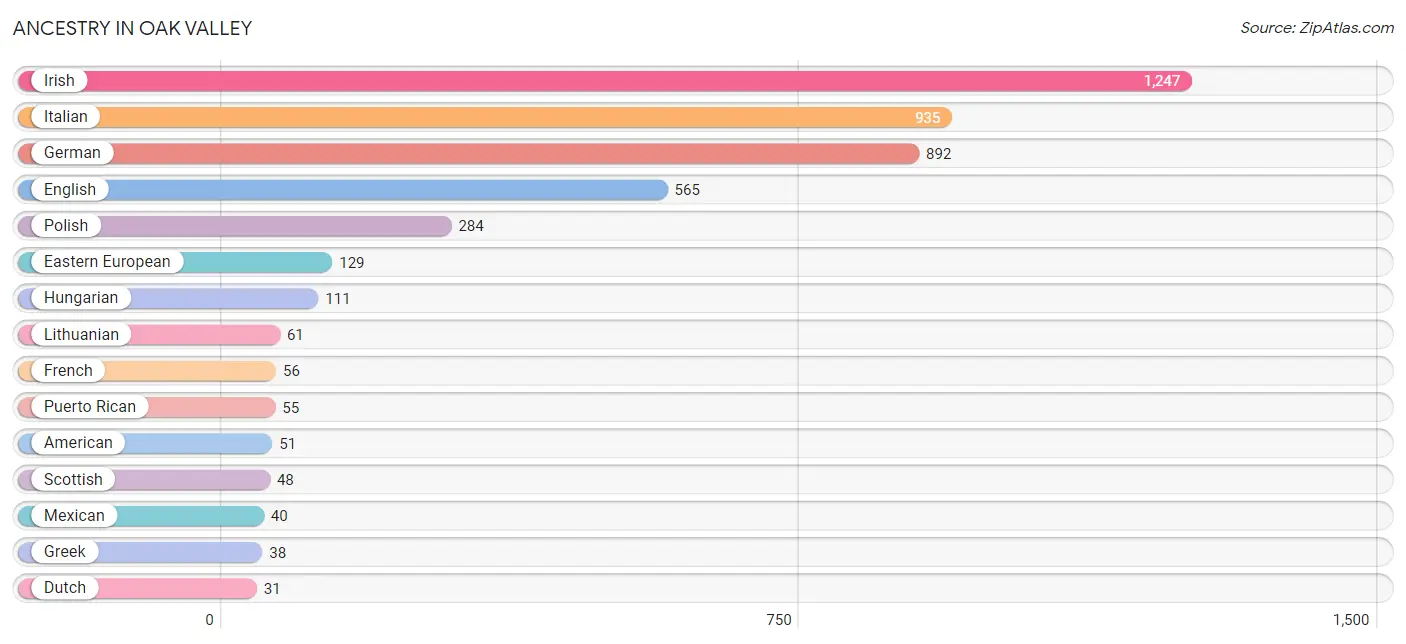
Ancestry in Oak Valley
The most populous ancestries reported in Oak Valley are Irish (1,247 | 28.7%), Italian (935 | 21.5%), German (892 | 20.5%), English (565 | 13.0%), and Polish (284 | 6.5%), together accounting for 90.3% of all Oak Valley residents.
| Ancestry | # Population | % Population |
| American | 51 | 1.2% |
| Armenian | 20 | 0.5% |
| Central American | 23 | 0.5% |
| Cherokee | 5 | 0.1% |
| Cuban | 23 | 0.5% |
| Czech | 11 | 0.3% |
| Dutch | 31 | 0.7% |
| Eastern European | 129 | 3.0% |
| English | 565 | 13.0% |
| European | 15 | 0.4% |
| French | 56 | 1.3% |
| French Canadian | 13 | 0.3% |
| German | 892 | 20.5% |
| Greek | 38 | 0.9% |
| Guatemalan | 23 | 0.5% |
| Hungarian | 111 | 2.5% |
| Irish | 1,247 | 28.7% |
| Italian | 935 | 21.5% |
| Korean | 8 | 0.2% |
| Lithuanian | 61 | 1.4% |
| Mexican | 40 | 0.9% |
| Norwegian | 19 | 0.4% |
| Pennsylvania German | 19 | 0.4% |
| Polish | 284 | 6.5% |
| Portuguese | 11 | 0.3% |
| Puerto Rican | 55 | 1.3% |
| Romanian | 13 | 0.3% |
| Russian | 11 | 0.3% |
| Scotch-Irish | 22 | 0.5% |
| Scottish | 48 | 1.1% |
| Sri Lankan | 30 | 0.7% |
| Thai | 7 | 0.2% |
| Welsh | 25 | 0.6% |
| Yugoslavian | 7 | 0.2% | View All 34 Rows |
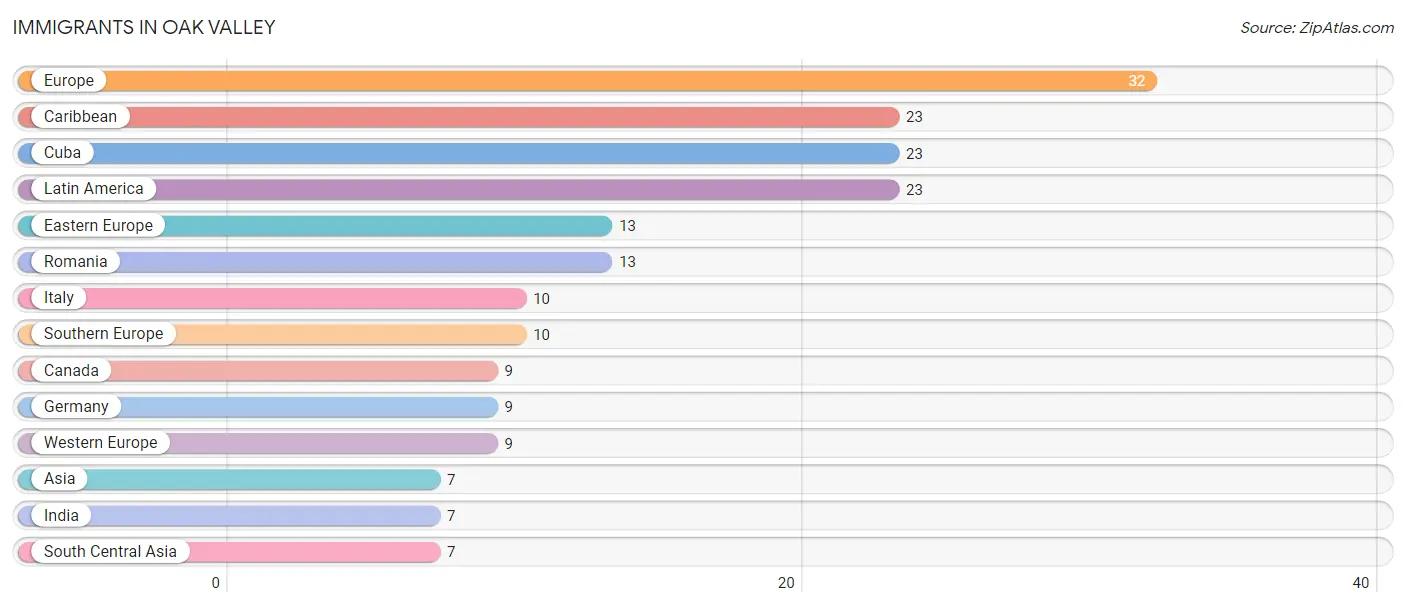
Immigrants in Oak Valley
The most numerous immigrant groups reported in Oak Valley came from Europe (32 | 0.7%), Caribbean (23 | 0.5%), Cuba (23 | 0.5%), Latin America (23 | 0.5%), and Eastern Europe (13 | 0.3%), together accounting for 2.6% of all Oak Valley residents.
| Immigration Origin | # Population | % Population |
| Asia | 7 | 0.2% |
| Canada | 9 | 0.2% |
| Caribbean | 23 | 0.5% |
| Cuba | 23 | 0.5% |
| Eastern Europe | 13 | 0.3% |
| Europe | 32 | 0.7% |
| Germany | 9 | 0.2% |
| India | 7 | 0.2% |
| Italy | 10 | 0.2% |
| Latin America | 23 | 0.5% |
| Romania | 13 | 0.3% |
| South Central Asia | 7 | 0.2% |
| Southern Europe | 10 | 0.2% |
| Western Europe | 9 | 0.2% | View All 14 Rows |
Sex and Age in Oak Valley
Sex and Age in Oak Valley
The most populous age groups in Oak Valley are Under 5 Years (314 | 13.8%) for men and 55 to 59 Years (230 | 11.1%) for women.
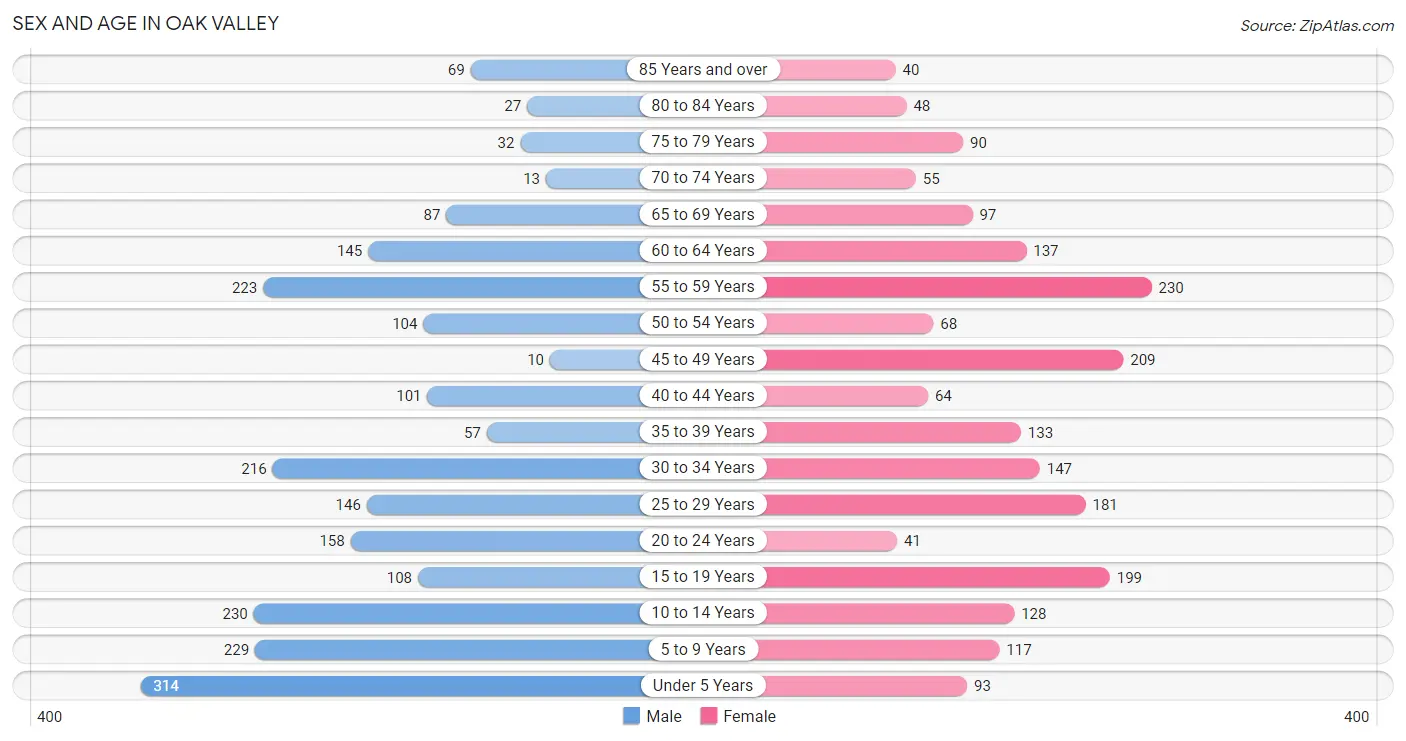
| Age Bracket | Male | Female |
| Under 5 Years | 314 (13.8%) | 93 (4.5%) |
| 5 to 9 Years | 229 (10.1%) | 117 (5.6%) |
| 10 to 14 Years | 230 (10.1%) | 128 (6.2%) |
| 15 to 19 Years | 108 (4.8%) | 199 (9.6%) |
| 20 to 24 Years | 158 (7.0%) | 41 (2.0%) |
| 25 to 29 Years | 146 (6.4%) | 181 (8.7%) |
| 30 to 34 Years | 216 (9.5%) | 147 (7.1%) |
| 35 to 39 Years | 57 (2.5%) | 133 (6.4%) |
| 40 to 44 Years | 101 (4.4%) | 64 (3.1%) |
| 45 to 49 Years | 10 (0.4%) | 209 (10.1%) |
| 50 to 54 Years | 104 (4.6%) | 68 (3.3%) |
| 55 to 59 Years | 223 (9.8%) | 230 (11.1%) |
| 60 to 64 Years | 145 (6.4%) | 137 (6.6%) |
| 65 to 69 Years | 87 (3.8%) | 97 (4.7%) |
| 70 to 74 Years | 13 (0.6%) | 55 (2.6%) |
| 75 to 79 Years | 32 (1.4%) | 90 (4.3%) |
| 80 to 84 Years | 27 (1.2%) | 48 (2.3%) |
| 85 Years and over | 69 (3.0%) | 40 (1.9%) |
| Total | 2,269 (100.0%) | 2,077 (100.0%) |
Families and Households in Oak Valley
Median Family Size in Oak Valley
The median family size in Oak Valley is 3.68 persons per family, with single female/mother families (302 | 28.1%) accounting for the largest median family size of 4.02 persons per family. On the other hand, single male/father families (55 | 5.1%) represent the smallest median family size with 1.95 persons per family.
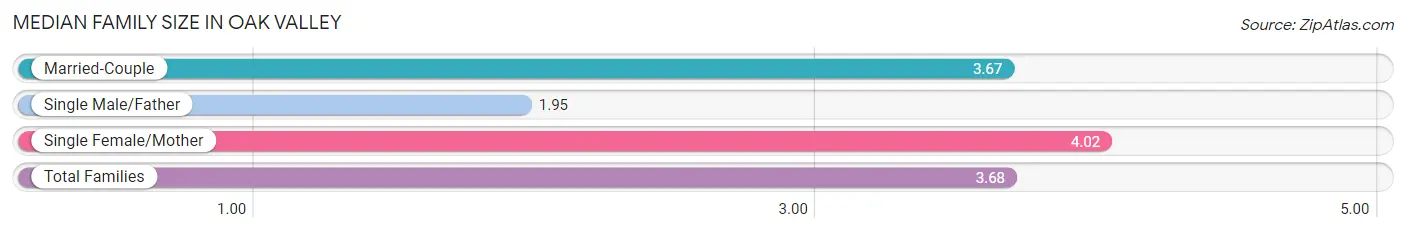
| Family Type | # Families | Family Size |
| Married-Couple | 718 (66.8%) | 3.67 |
| Single Male/Father | 55 (5.1%) | 1.95 |
| Single Female/Mother | 302 (28.1%) | 4.02 |
| Total Families | 1,075 (100.0%) | 3.68 |
Median Household Size in Oak Valley
The median household size in Oak Valley is 3.32 persons per household, with single female/mother households (302 | 23.1%) accounting for the largest median household size of 4.13 persons per household. non-family households (235 | 17.9%) represent the smallest median household size with 1.34 persons per household.
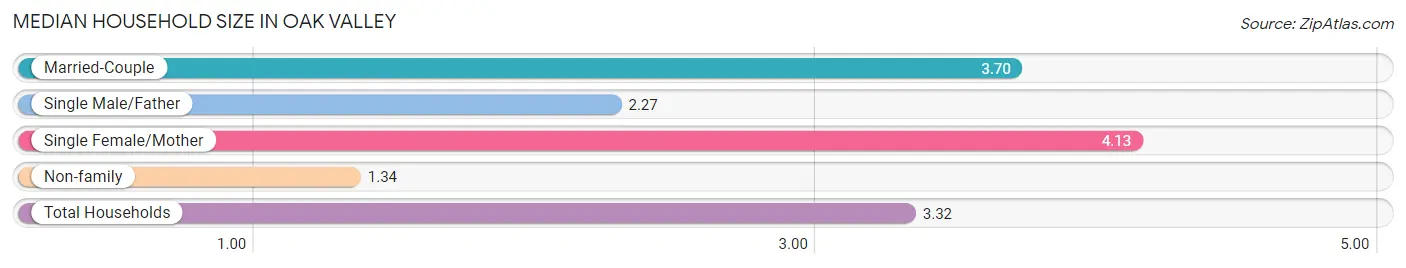
| Household Type | # Households | Household Size |
| Married-Couple | 718 (54.8%) | 3.70 |
| Single Male/Father | 55 (4.2%) | 2.27 |
| Single Female/Mother | 302 (23.1%) | 4.13 |
| Non-family | 235 (17.9%) | 1.34 |
| Total Households | 1,310 (100.0%) | 3.32 |
Household Size by Marriage Status in Oak Valley
Out of a total of 1,310 households in Oak Valley, 1,075 (82.1%) are family households, while 235 (17.9%) are nonfamily households. The most numerous type of family households are 2-person households, comprising 401, and the most common type of nonfamily households are 1-person households, comprising 155.
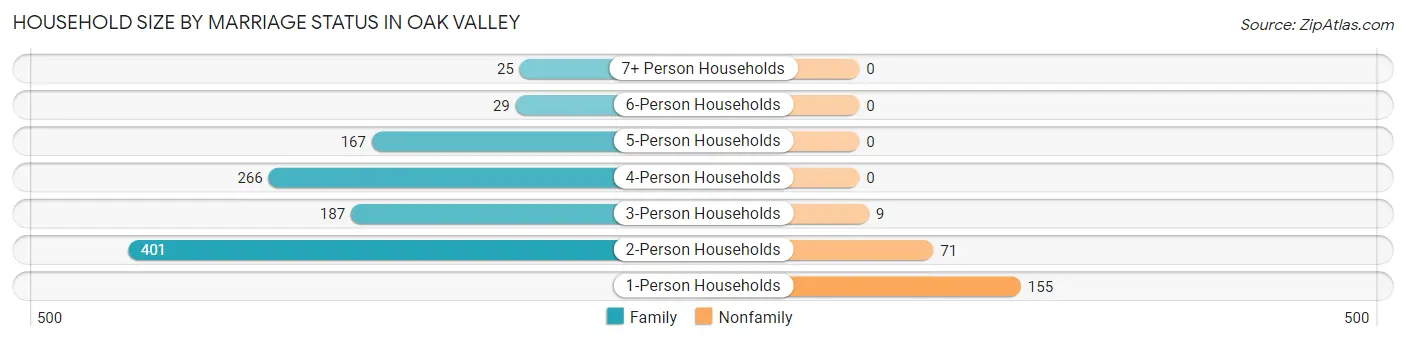
| Household Size | Family Households | Nonfamily Households |
| 1-Person Households | - | 155 (11.8%) |
| 2-Person Households | 401 (30.6%) | 71 (5.4%) |
| 3-Person Households | 187 (14.3%) | 9 (0.7%) |
| 4-Person Households | 266 (20.3%) | 0 (0.0%) |
| 5-Person Households | 167 (12.8%) | 0 (0.0%) |
| 6-Person Households | 29 (2.2%) | 0 (0.0%) |
| 7+ Person Households | 25 (1.9%) | 0 (0.0%) |
| Total | 1,075 (82.1%) | 235 (17.9%) |
Female Fertility in Oak Valley
Fertility by Age in Oak Valley
Average fertility rate in Oak Valley is 50.0 births per 1,000 women. Women in the age bracket of 20 to 34 years have the highest fertility rate with 92.0 births per 1,000 women. Women in the age bracket of 20 to 34 years acount for 69.4% of all women with births.
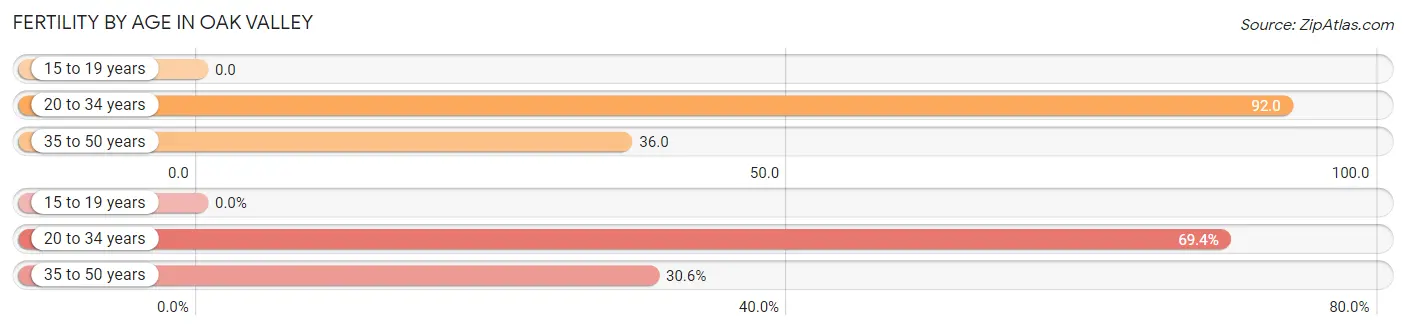
| Age Bracket | Women with Births | Births / 1,000 Women |
| 15 to 19 years | 0 (0.0%) | 0.0 |
| 20 to 34 years | 34 (69.4%) | 92.0 |
| 35 to 50 years | 15 (30.6%) | 36.0 |
| Total | 49 (100.0%) | 50.0 |
Fertility by Age by Marriage Status in Oak Valley
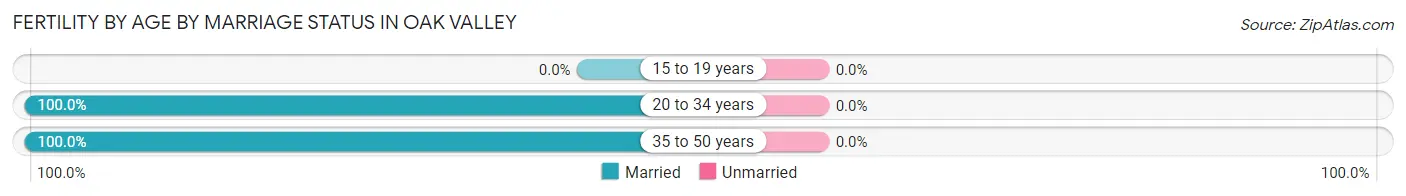
| Age Bracket | Married | Unmarried |
| 15 to 19 years | 0 (0.0%) | 0 (0.0%) |
| 20 to 34 years | 34 (100.0%) | 0 (0.0%) |
| 35 to 50 years | 15 (100.0%) | 0 (0.0%) |
| Total | 49 (100.0%) | 0 (0.0%) |
Fertility by Education in Oak Valley
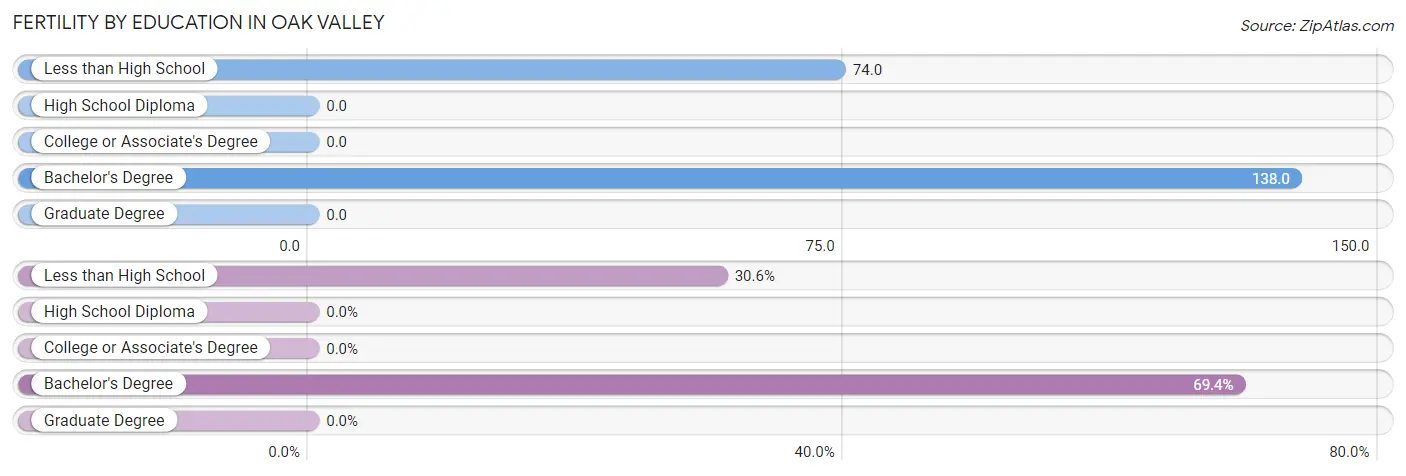
| Educational Attainment | Women with Births | Births / 1,000 Women |
| Less than High School | 15 (30.6%) | 74.0 |
| High School Diploma | 0 (0.0%) | 0.0 |
| College or Associate's Degree | 0 (0.0%) | 0.0 |
| Bachelor's Degree | 34 (69.4%) | 138.0 |
| Graduate Degree | 0 (0.0%) | 0.0 |
| Total | 49 (100.0%) | 50.0 |
Fertility by Education by Marriage Status in Oak Valley
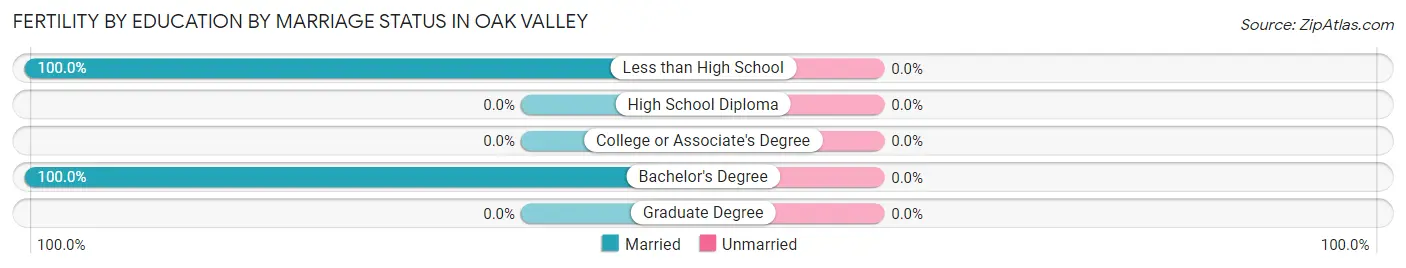
| Educational Attainment | Married | Unmarried |
| Less than High School | 15 (100.0%) | 0 (0.0%) |
| High School Diploma | 0 (0.0%) | 0 (0.0%) |
| College or Associate's Degree | 0 (0.0%) | 0 (0.0%) |
| Bachelor's Degree | 34 (100.0%) | 0 (0.0%) |
| Graduate Degree | 0 (0.0%) | 0 (0.0%) |
| Total | 49 (100.0%) | 0 (0.0%) |
Income in Oak Valley
Income Overview in Oak Valley
Per Capita Income in Oak Valley is $30,598, while median incomes of families and households are $101,275 and $86,875 respectively.
| Characteristic | Number | Measure |
| Per Capita Income | 4,346 | $30,598 |
| Median Family Income | 1,075 | $101,275 |
| Mean Family Income | 1,075 | $103,663 |
| Median Household Income | 1,310 | $86,875 |
| Mean Household Income | 1,310 | $97,141 |
| Income Deficit | 1,075 | $0 |
| Wage / Income Gap (%) | 4,346 | 30.40% |
| Wage / Income Gap ($) | 4,346 | 69.60¢ per $1 |
| Gini / Inequality Index | 4,346 | 0.34 |
Earnings by Sex in Oak Valley
Average Earnings in Oak Valley are $46,034, $58,301 for men and $40,580 for women, a difference of 30.4%.
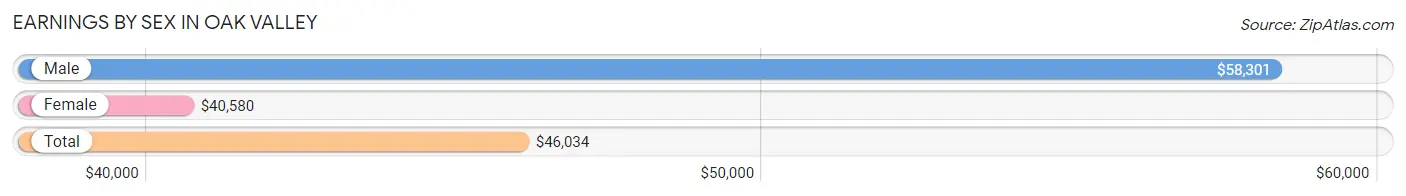
| Sex | Number | Average Earnings |
| Male | 1,149 (50.8%) | $58,301 |
| Female | 1,113 (49.2%) | $40,580 |
| Total | 2,262 (100.0%) | $46,034 |
Earnings by Sex by Income Bracket in Oak Valley
The most common earnings brackets in Oak Valley are $75,000 to $99,999 for men (311 | 27.1%) and $2,499 or less for women (211 | 19.0%).
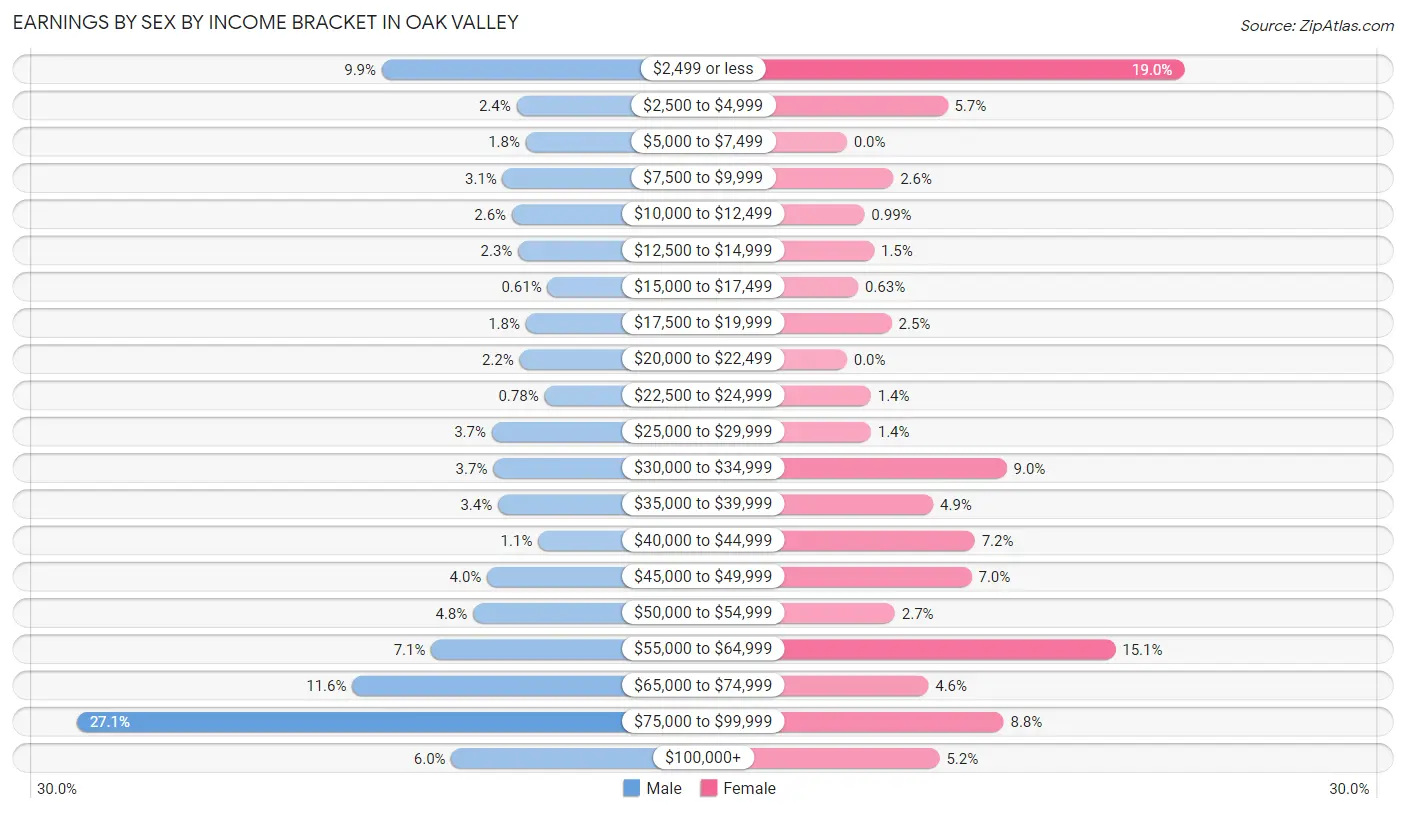
| Income | Male | Female |
| $2,499 or less | 114 (9.9%) | 211 (19.0%) |
| $2,500 to $4,999 | 27 (2.4%) | 63 (5.7%) |
| $5,000 to $7,499 | 21 (1.8%) | 0 (0.0%) |
| $7,500 to $9,999 | 36 (3.1%) | 29 (2.6%) |
| $10,000 to $12,499 | 30 (2.6%) | 11 (1.0%) |
| $12,500 to $14,999 | 26 (2.3%) | 17 (1.5%) |
| $15,000 to $17,499 | 7 (0.6%) | 7 (0.6%) |
| $17,500 to $19,999 | 21 (1.8%) | 28 (2.5%) |
| $20,000 to $22,499 | 25 (2.2%) | 0 (0.0%) |
| $22,500 to $24,999 | 9 (0.8%) | 15 (1.3%) |
| $25,000 to $29,999 | 43 (3.7%) | 15 (1.3%) |
| $30,000 to $34,999 | 42 (3.7%) | 100 (9.0%) |
| $35,000 to $39,999 | 39 (3.4%) | 54 (4.9%) |
| $40,000 to $44,999 | 13 (1.1%) | 80 (7.2%) |
| $45,000 to $49,999 | 46 (4.0%) | 78 (7.0%) |
| $50,000 to $54,999 | 55 (4.8%) | 30 (2.7%) |
| $55,000 to $64,999 | 82 (7.1%) | 168 (15.1%) |
| $65,000 to $74,999 | 133 (11.6%) | 51 (4.6%) |
| $75,000 to $99,999 | 311 (27.1%) | 98 (8.8%) |
| $100,000+ | 69 (6.0%) | 58 (5.2%) |
| Total | 1,149 (100.0%) | 1,113 (100.0%) |
Earnings by Sex by Educational Attainment in Oak Valley
Average earnings in Oak Valley are $66,610 for men and $45,080 for women, a difference of 32.3%. Men with an educational attainment of college or associate's degree enjoy the highest average annual earnings of $83,778, while those with less than high school education earn the least with $51,389. Women with an educational attainment of bachelor's degree earn the most with the average annual earnings of $72,500, while those with high school diploma education have the smallest earnings of $33,835.
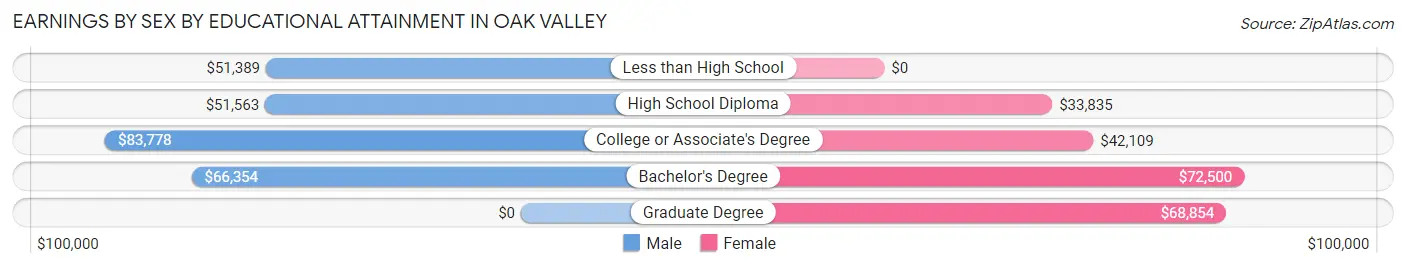
| Educational Attainment | Male Income | Female Income |
| Less than High School | $51,389 | $0 |
| High School Diploma | $51,563 | $33,835 |
| College or Associate's Degree | $83,778 | $42,109 |
| Bachelor's Degree | $66,354 | $72,500 |
| Graduate Degree | - | - |
| Total | $66,610 | $45,080 |
Family Income in Oak Valley
Family Income Brackets in Oak Valley
According to the Oak Valley family income data, there are 392 families falling into the $100,000 to $149,999 income range, which is the most common income bracket and makes up 36.5% of all families. Conversely, the $10,000 to $14,999 income bracket is the least frequent group with only 10 families (0.9%) belonging to this category.
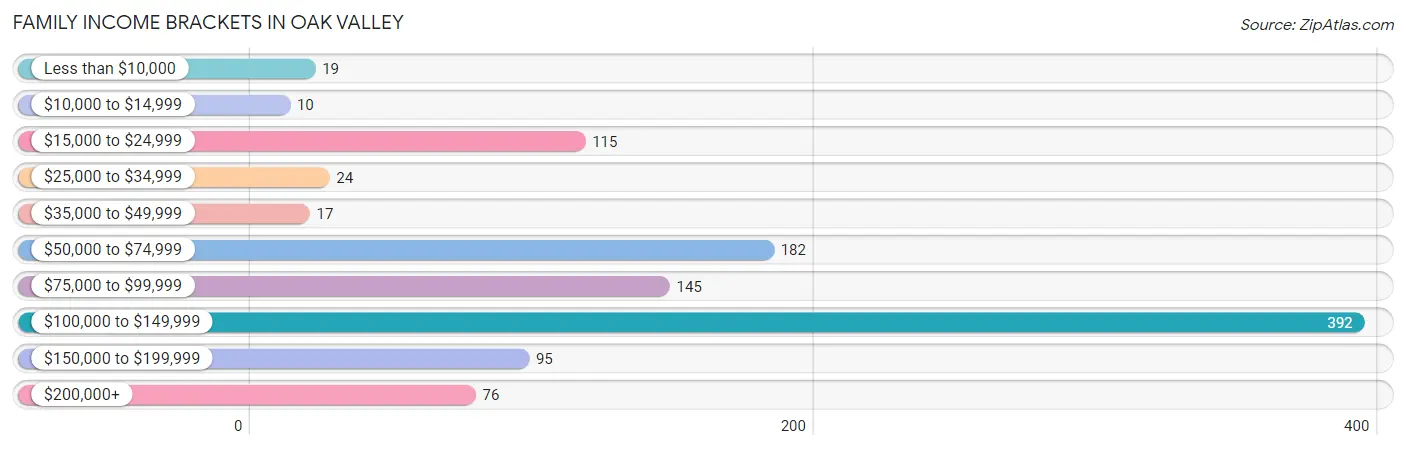
| Income Bracket | # Families | % Families |
| Less than $10,000 | 19 | 1.8% |
| $10,000 to $14,999 | 10 | 0.9% |
| $15,000 to $24,999 | 115 | 10.7% |
| $25,000 to $34,999 | 24 | 2.2% |
| $35,000 to $49,999 | 17 | 1.6% |
| $50,000 to $74,999 | 182 | 16.9% |
| $75,000 to $99,999 | 145 | 13.5% |
| $100,000 to $149,999 | 392 | 36.5% |
| $150,000 to $199,999 | 95 | 8.8% |
| $200,000+ | 76 | 7.1% |
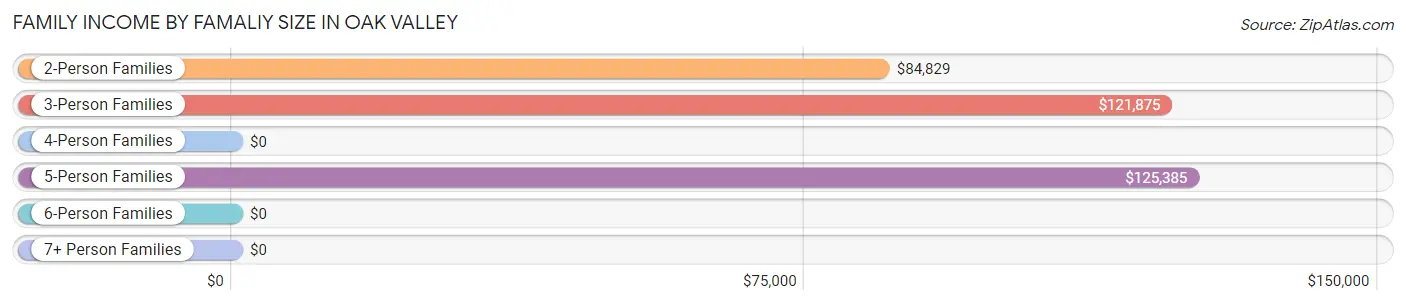
Family Income by Famaliy Size in Oak Valley
5-person families (146 | 13.6%) account for the highest median family income in Oak Valley with $125,385 per family, while 2-person families (454 | 42.2%) have the highest median income of $42,414 per family member.
| Income Bracket | # Families | Median Income |
| 2-Person Families | 454 (42.2%) | $84,829 |
| 3-Person Families | 155 (14.4%) | $121,875 |
| 4-Person Families | 266 (24.7%) | $0 |
| 5-Person Families | 146 (13.6%) | $125,385 |
| 6-Person Families | 29 (2.7%) | $0 |
| 7+ Person Families | 25 (2.3%) | $0 |
| Total | 1,075 (100.0%) | $101,275 |
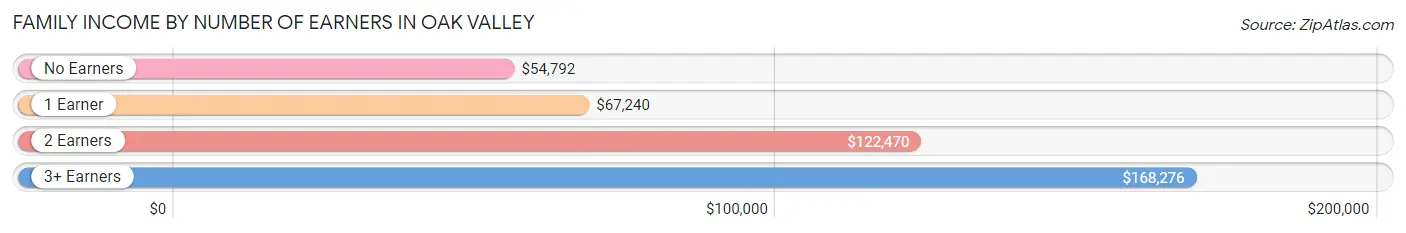
Family Income by Number of Earners in Oak Valley
The median family income in Oak Valley is $101,275, with families comprising 3+ earners (200) having the highest median family income of $168,276, while families with no earners (97) have the lowest median family income of $54,792, accounting for 18.6% and 9.0% of families, respectively.
| Number of Earners | # Families | Median Income |
| No Earners | 97 (9.0%) | $54,792 |
| 1 Earner | 401 (37.3%) | $67,240 |
| 2 Earners | 377 (35.1%) | $122,470 |
| 3+ Earners | 200 (18.6%) | $168,276 |
| Total | 1,075 (100.0%) | $101,275 |
Household Income in Oak Valley
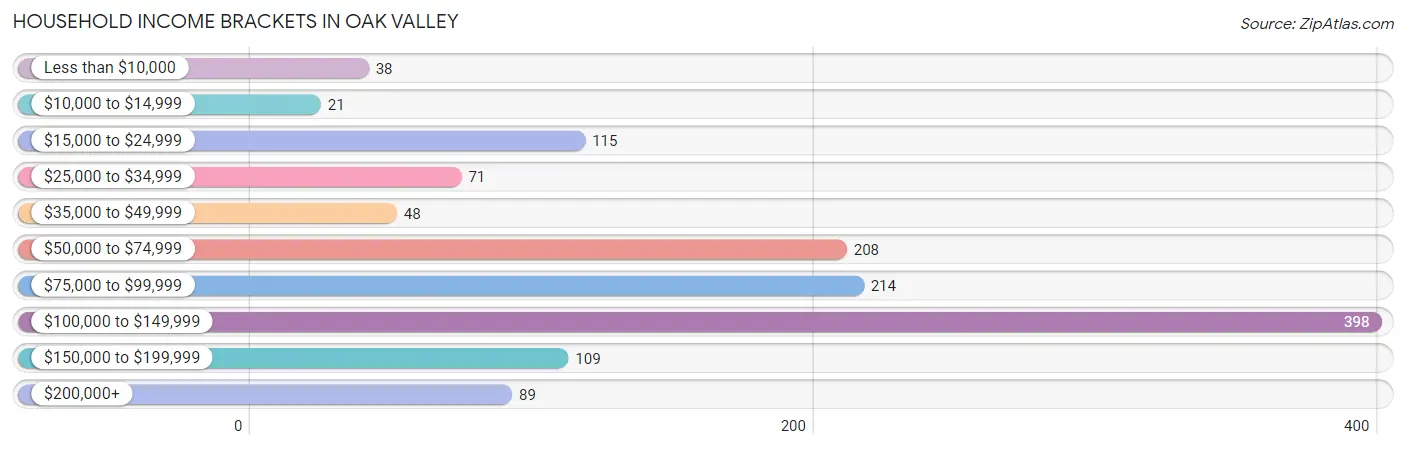
Household Income Brackets in Oak Valley
With 398 households falling in the category, the $100,000 to $149,999 income range is the most frequent in Oak Valley, accounting for 30.4% of all households. In contrast, only 21 households (1.6%) fall into the $10,000 to $14,999 income bracket, making it the least populous group.
| Income Bracket | # Households | % Households |
| Less than $10,000 | 38 | 2.9% |
| $10,000 to $14,999 | 21 | 1.6% |
| $15,000 to $24,999 | 115 | 8.8% |
| $25,000 to $34,999 | 71 | 5.4% |
| $35,000 to $49,999 | 48 | 3.7% |
| $50,000 to $74,999 | 208 | 15.9% |
| $75,000 to $99,999 | 214 | 16.3% |
| $100,000 to $149,999 | 398 | 30.4% |
| $150,000 to $199,999 | 109 | 8.3% |
| $200,000+ | 89 | 6.8% |
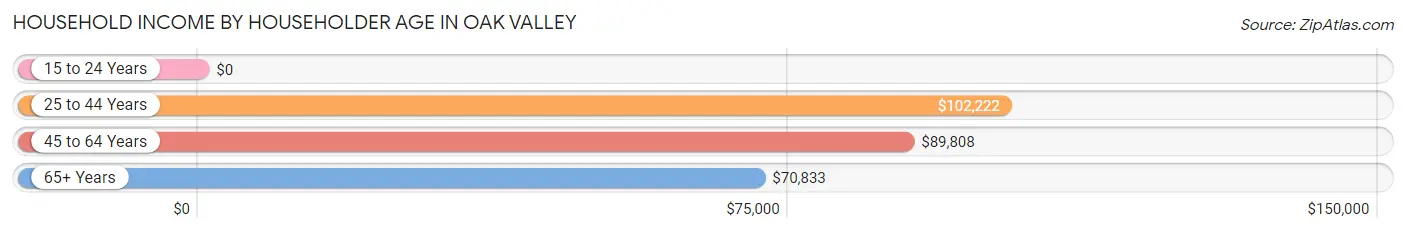
Household Income by Householder Age in Oak Valley
The median household income in Oak Valley is $86,875, with the highest median household income of $102,222 found in the 25 to 44 years age bracket for the primary householder. A total of 414 households (31.6%) fall into this category. Meanwhile, the 15 to 24 years age bracket for the primary householder has the lowest median household income of $0, with 6 households (0.5%) in this group.
| Income Bracket | # Households | Median Income |
| 15 to 24 Years | 6 (0.5%) | $0 |
| 25 to 44 Years | 414 (31.6%) | $102,222 |
| 45 to 64 Years | 588 (44.9%) | $89,808 |
| 65+ Years | 302 (23.1%) | $70,833 |
| Total | 1,310 (100.0%) | $86,875 |
Poverty in Oak Valley
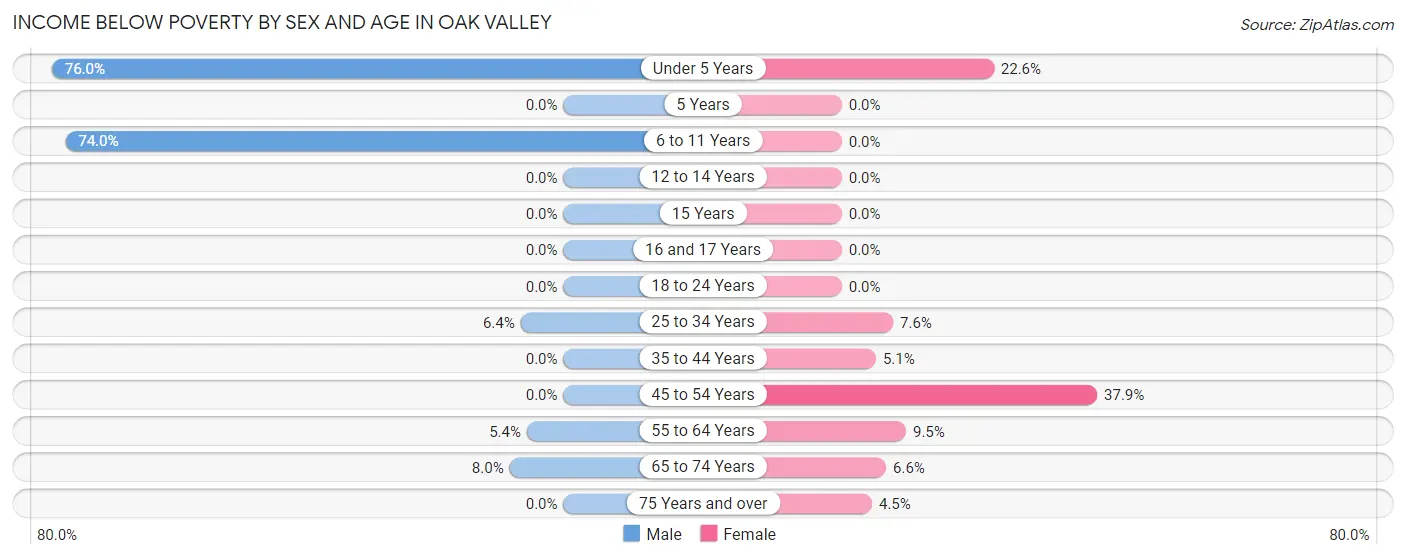
Income Below Poverty by Sex and Age in Oak Valley
With 24.5% poverty level for males and 10.3% for females among the residents of Oak Valley, under 5 year old males and 45 to 54 year old females are the most vulnerable to poverty, with 218 males (76.0%) and 105 females (37.9%) in their respective age groups living below the poverty level.
| Age Bracket | Male | Female |
| Under 5 Years | 218 (76.0%) | 21 (22.6%) |
| 5 Years | 0 (0.0%) | 0 (0.0%) |
| 6 to 11 Years | 281 (74.0%) | 0 (0.0%) |
| 12 to 14 Years | 0 (0.0%) | 0 (0.0%) |
| 15 Years | 0 (0.0%) | 0 (0.0%) |
| 16 and 17 Years | 0 (0.0%) | 0 (0.0%) |
| 18 to 24 Years | 0 (0.0%) | 0 (0.0%) |
| 25 to 34 Years | 23 (6.4%) | 25 (7.6%) |
| 35 to 44 Years | 0 (0.0%) | 10 (5.1%) |
| 45 to 54 Years | 0 (0.0%) | 105 (37.9%) |
| 55 to 64 Years | 20 (5.4%) | 35 (9.5%) |
| 65 to 74 Years | 8 (8.0%) | 10 (6.6%) |
| 75 Years and over | 0 (0.0%) | 8 (4.5%) |
| Total | 550 (24.5%) | 214 (10.3%) |
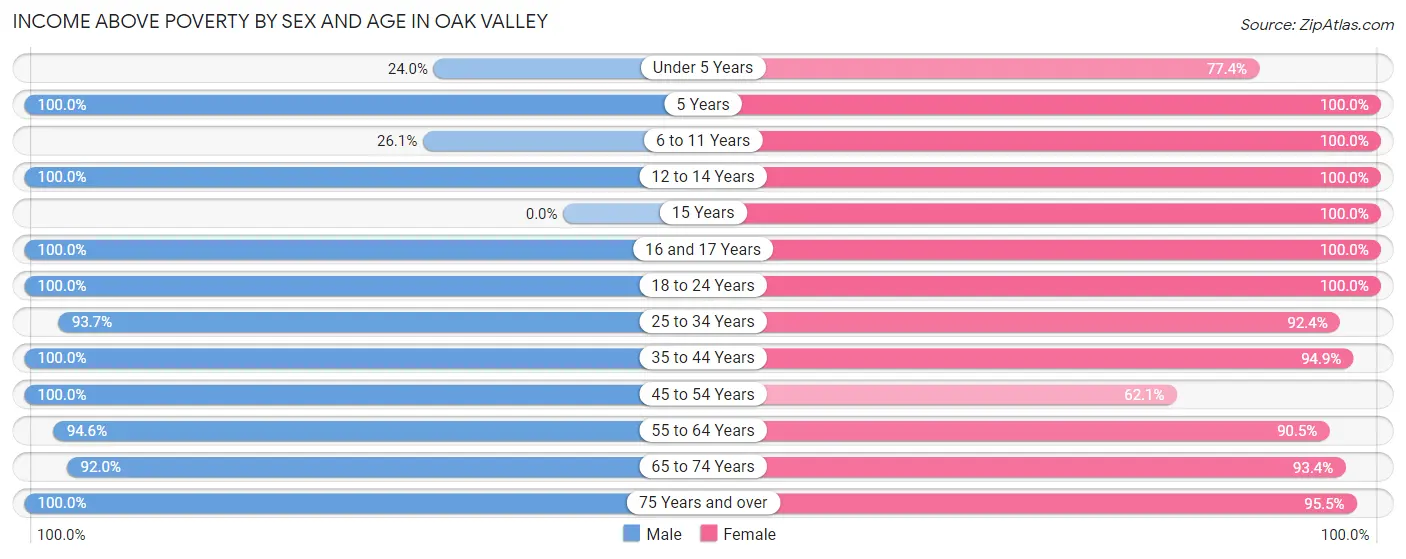
Income Above Poverty by Sex and Age in Oak Valley
According to the poverty statistics in Oak Valley, males aged 5 years and females aged 5 years are the age groups that are most secure financially, with 100.0% of males and 100.0% of females in these age groups living above the poverty line.
| Age Bracket | Male | Female |
| Under 5 Years | 69 (24.0%) | 72 (77.4%) |
| 5 Years | 27 (100.0%) | 20 (100.0%) |
| 6 to 11 Years | 99 (26.1%) | 118 (100.0%) |
| 12 to 14 Years | 52 (100.0%) | 107 (100.0%) |
| 15 Years | 0 (0.0%) | 12 (100.0%) |
| 16 and 17 Years | 11 (100.0%) | 151 (100.0%) |
| 18 to 24 Years | 255 (100.0%) | 77 (100.0%) |
| 25 to 34 Years | 339 (93.6%) | 303 (92.4%) |
| 35 to 44 Years | 158 (100.0%) | 187 (94.9%) |
| 45 to 54 Years | 114 (100.0%) | 172 (62.1%) |
| 55 to 64 Years | 348 (94.6%) | 332 (90.5%) |
| 65 to 74 Years | 92 (92.0%) | 142 (93.4%) |
| 75 Years and over | 128 (100.0%) | 170 (95.5%) |
| Total | 1,692 (75.5%) | 1,863 (89.7%) |
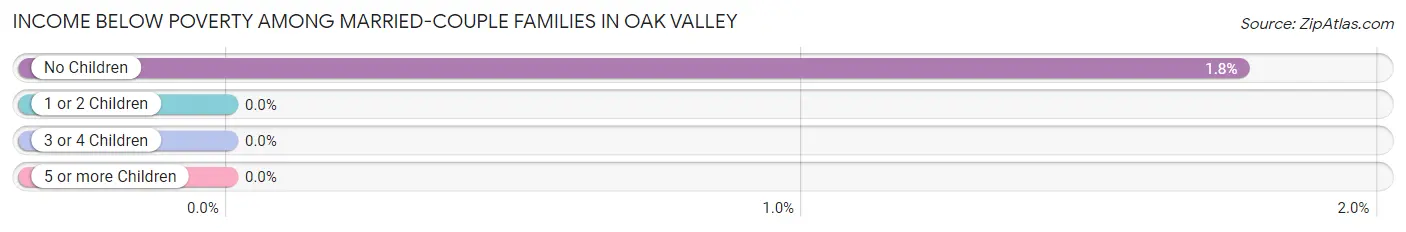
Income Below Poverty Among Married-Couple Families in Oak Valley
The poverty statistics for married-couple families in Oak Valley show that 1.1% or 8 of the total 718 families live below the poverty line. Families with no children have the highest poverty rate of 1.8%, comprising of 8 families. On the other hand, families with 1 or 2 children have the lowest poverty rate of 0.0%, which includes 0 families.
| Children | Above Poverty | Below Poverty |
| No Children | 447 (98.2%) | 8 (1.8%) |
| 1 or 2 Children | 231 (100.0%) | 0 (0.0%) |
| 3 or 4 Children | 32 (100.0%) | 0 (0.0%) |
| 5 or more Children | 0 (0.0%) | 0 (0.0%) |
| Total | 710 (98.9%) | 8 (1.1%) |
Income Below Poverty Among Single-Parent Households in Oak Valley
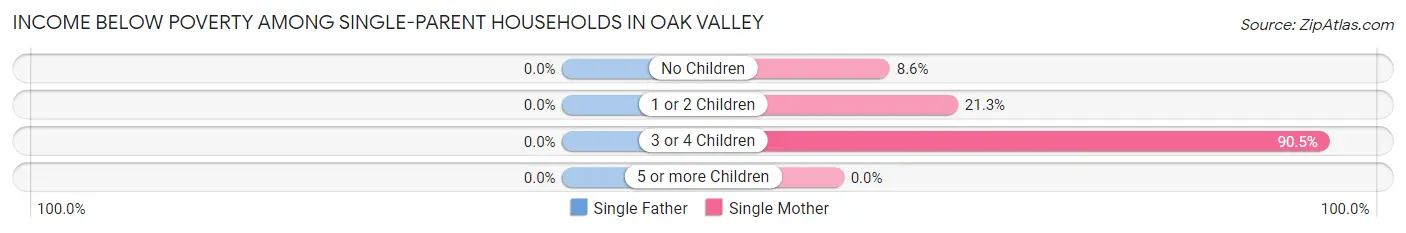
| Children | Single Father | Single Mother |
| No Children | 0 (0.0%) | 11 (8.6%) |
| 1 or 2 Children | 0 (0.0%) | 10 (21.3%) |
| 3 or 4 Children | 0 (0.0%) | 105 (90.5%) |
| 5 or more Children | 0 (0.0%) | 0 (0.0%) |
| Total | 0 (0.0%) | 126 (41.7%) |
Income Below Poverty Among Married-Couple vs Single-Parent Households in Oak Valley
The poverty data for Oak Valley shows that 8 of the married-couple family households (1.1%) and 126 of the single-parent households (35.3%) are living below the poverty level. Within the married-couple family households, those with no children have the highest poverty rate, with 8 households (1.8%) falling below the poverty line. Among the single-parent households, those with 3 or 4 children have the highest poverty rate, with 105 household (83.3%) living below poverty.
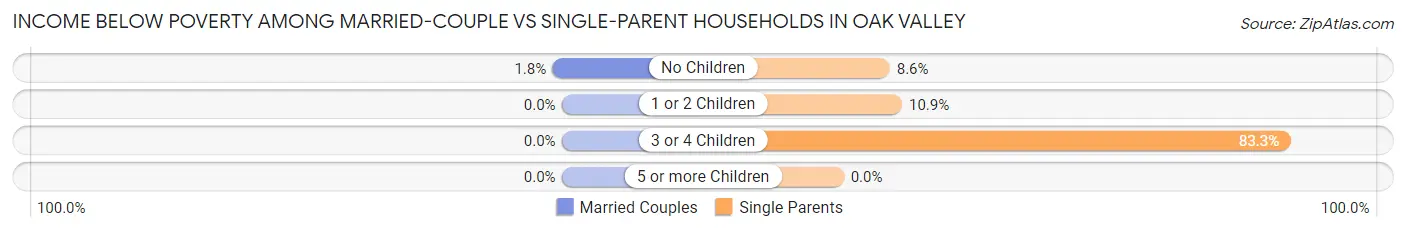
| Children | Married-Couple Families | Single-Parent Households |
| No Children | 8 (1.8%) | 11 (8.6%) |
| 1 or 2 Children | 0 (0.0%) | 10 (10.9%) |
| 3 or 4 Children | 0 (0.0%) | 105 (83.3%) |
| 5 or more Children | 0 (0.0%) | 0 (0.0%) |
| Total | 8 (1.1%) | 126 (35.3%) |
Employment Characteristics in Oak Valley
Employment by Class of Employer in Oak Valley
Among the 1,983 employed individuals in Oak Valley, private company employees (1,507 | 76.0%), local government employees (250 | 12.6%), and not-for-profit organizations (128 | 6.5%) make up the most common classes of employment.
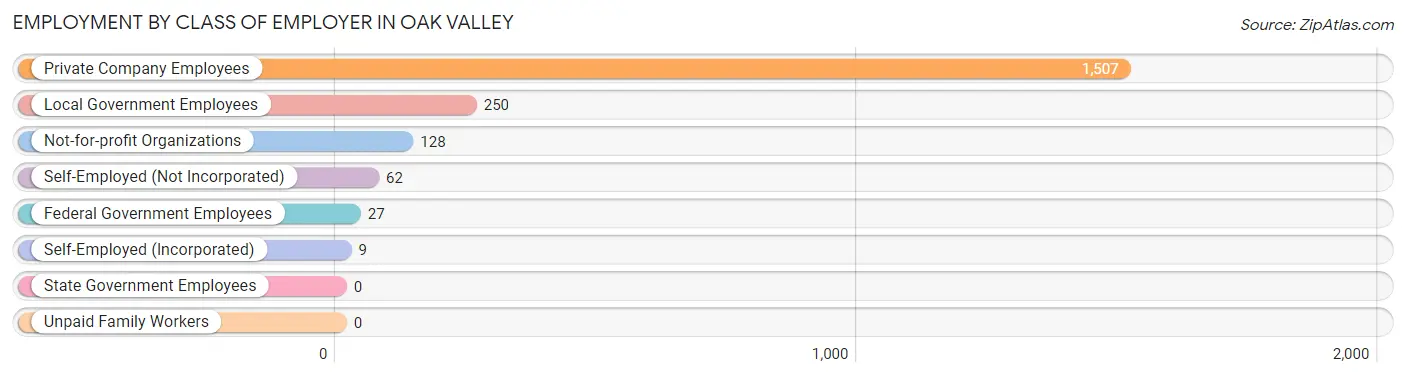
| Employer Class | # Employees | % Employees |
| Private Company Employees | 1,507 | 76.0% |
| Self-Employed (Incorporated) | 9 | 0.4% |
| Self-Employed (Not Incorporated) | 62 | 3.1% |
| Not-for-profit Organizations | 128 | 6.5% |
| Local Government Employees | 250 | 12.6% |
| State Government Employees | 0 | 0.0% |
| Federal Government Employees | 27 | 1.4% |
| Unpaid Family Workers | 0 | 0.0% |
| Total | 1,983 | 100.0% |
Employment Status by Age in Oak Valley
According to the labor force statistics for Oak Valley, out of the total population over 16 years of age (3,223), 65.3% or 2,105 individuals are in the labor force, with 3.8% or 80 of them unemployed. The age group with the highest labor force participation rate is 35 to 44 years, with 95.8% or 340 individuals in the labor force. Within the labor force, the 65 to 74 years age range has the highest percentage of unemployed individuals, with 12.8% or 10 of them being unemployed.
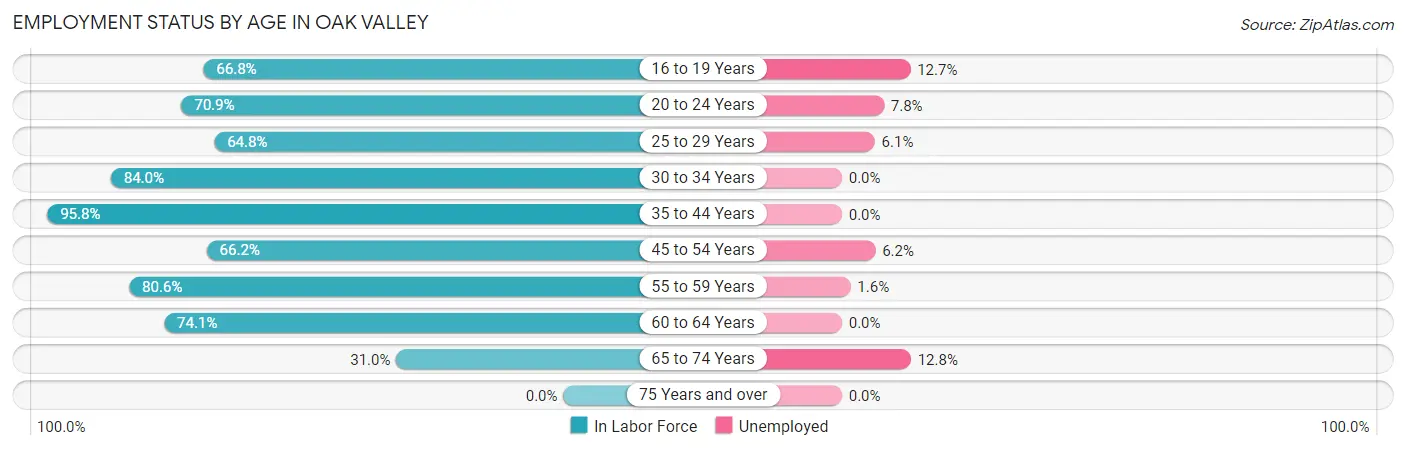
| Age Bracket | In Labor Force | Unemployed |
| 16 to 19 Years | 197 (66.8%) | 25 (12.7%) |
| 20 to 24 Years | 141 (70.9%) | 11 (7.8%) |
| 25 to 29 Years | 212 (64.8%) | 13 (6.1%) |
| 30 to 34 Years | 305 (84.0%) | 0 (0.0%) |
| 35 to 44 Years | 340 (95.8%) | 0 (0.0%) |
| 45 to 54 Years | 259 (66.2%) | 16 (6.2%) |
| 55 to 59 Years | 365 (80.6%) | 6 (1.6%) |
| 60 to 64 Years | 209 (74.1%) | 0 (0.0%) |
| 65 to 74 Years | 78 (31.0%) | 10 (12.8%) |
| 75 Years and over | 0 (0.0%) | 0 (0.0%) |
| Total | 2,105 (65.3%) | 80 (3.8%) |
Employment Status by Educational Attainment in Oak Valley
According to labor force statistics for Oak Valley, 77.8% of individuals (1,689) out of the total population between 25 and 64 years of age (2,171) are in the labor force, with 2.1% or 35 of them being unemployed. The group with the highest labor force participation rate are those with the educational attainment of high school diploma, with 79.7% or 674 individuals in the labor force. Within the labor force, individuals with high school diploma education have the highest percentage of unemployment, with 5.2% or 35 of them being unemployed.
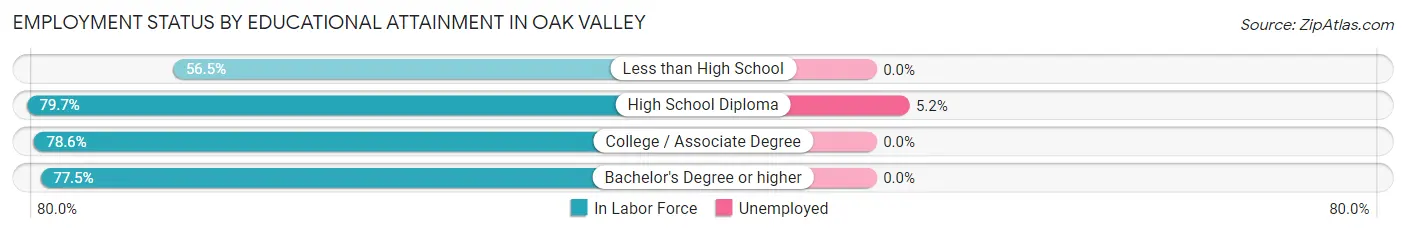
| Educational Attainment | In Labor Force | Unemployed |
| Less than High School | 52 (56.5%) | 0 (0.0%) |
| High School Diploma | 674 (79.7%) | 44 (5.2%) |
| College / Associate Degree | 619 (78.6%) | 0 (0.0%) |
| Bachelor's Degree or higher | 345 (77.5%) | 0 (0.0%) |
| Total | 1,689 (77.8%) | 46 (2.1%) |
Employment Occupations by Sex in Oak Valley
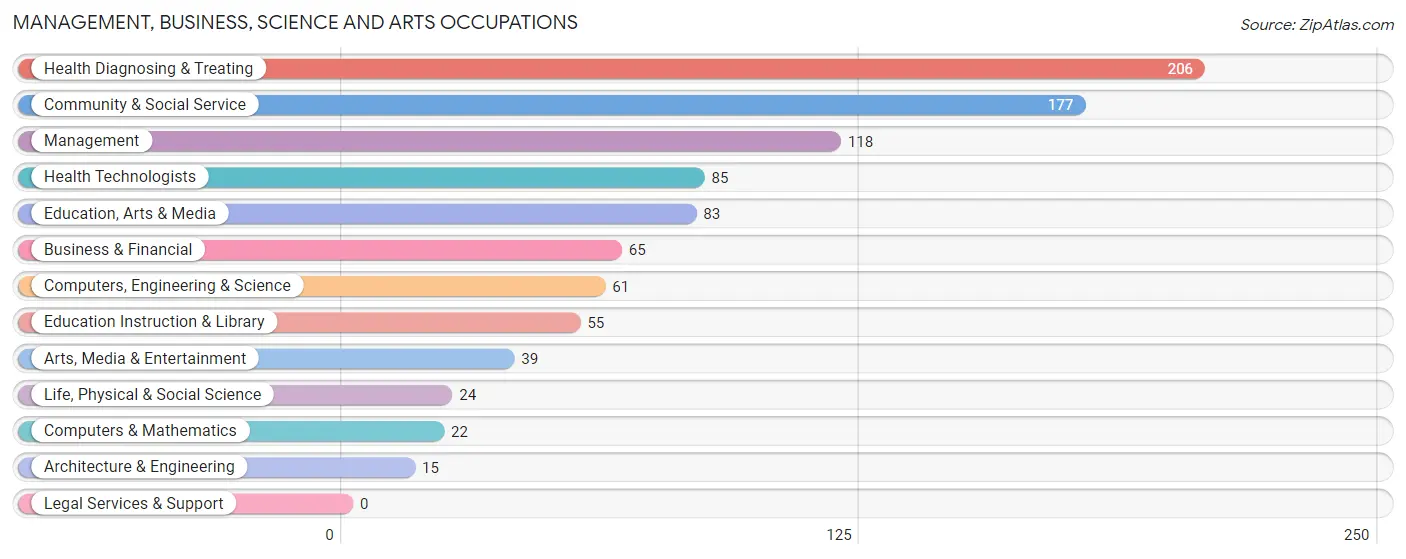
Management, Business, Science and Arts Occupations
The most common Management, Business, Science and Arts occupations in Oak Valley are Health Diagnosing & Treating (206 | 10.2%), Community & Social Service (177 | 8.7%), Management (118 | 5.8%), Health Technologists (85 | 4.2%), and Education, Arts & Media (83 | 4.1%).
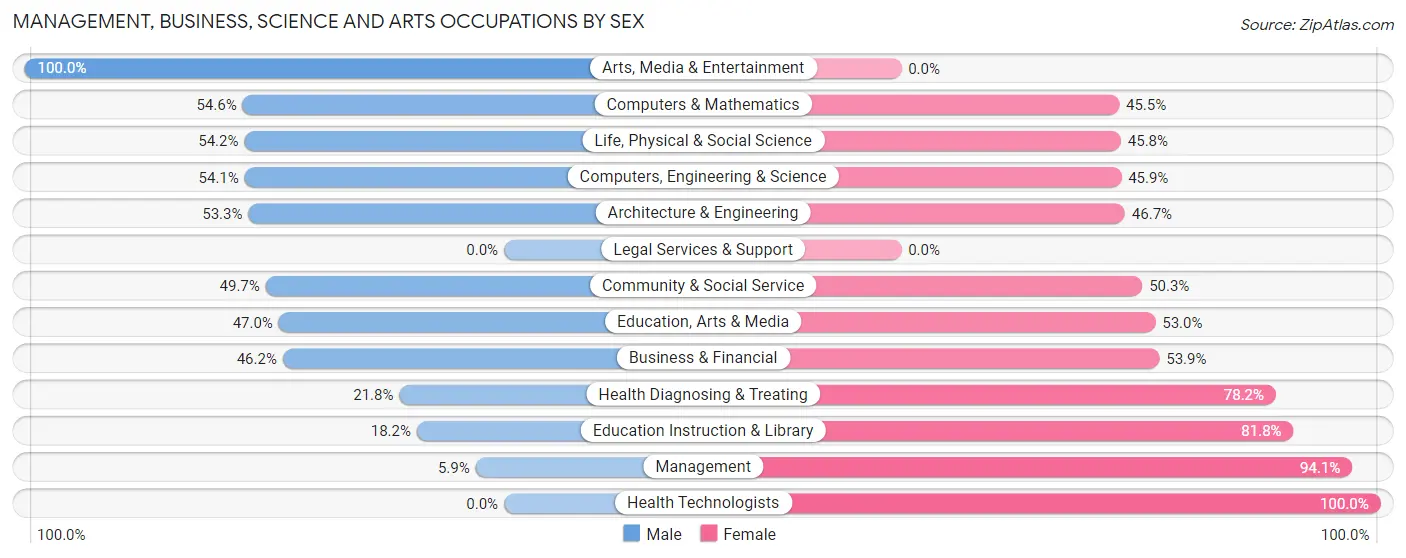
Management, Business, Science and Arts Occupations by Sex
Within the Management, Business, Science and Arts occupations in Oak Valley, the most male-oriented occupations are Arts, Media & Entertainment (100.0%), Computers & Mathematics (54.5%), and Life, Physical & Social Science (54.2%), while the most female-oriented occupations are Health Technologists (100.0%), Management (94.1%), and Education Instruction & Library (81.8%).
| Occupation | Male | Female |
| Management | 7 (5.9%) | 111 (94.1%) |
| Business & Financial | 30 (46.2%) | 35 (53.8%) |
| Computers, Engineering & Science | 33 (54.1%) | 28 (45.9%) |
| Computers & Mathematics | 12 (54.5%) | 10 (45.5%) |
| Architecture & Engineering | 8 (53.3%) | 7 (46.7%) |
| Life, Physical & Social Science | 13 (54.2%) | 11 (45.8%) |
| Community & Social Service | 88 (49.7%) | 89 (50.3%) |
| Education, Arts & Media | 39 (47.0%) | 44 (53.0%) |
| Legal Services & Support | 0 (0.0%) | 0 (0.0%) |
| Education Instruction & Library | 10 (18.2%) | 45 (81.8%) |
| Arts, Media & Entertainment | 39 (100.0%) | 0 (0.0%) |
| Health Diagnosing & Treating | 45 (21.8%) | 161 (78.2%) |
| Health Technologists | 0 (0.0%) | 85 (100.0%) |
| Total (Category) | 203 (32.4%) | 424 (67.6%) |
| Total (Overall) | 1,082 (53.4%) | 943 (46.6%) |
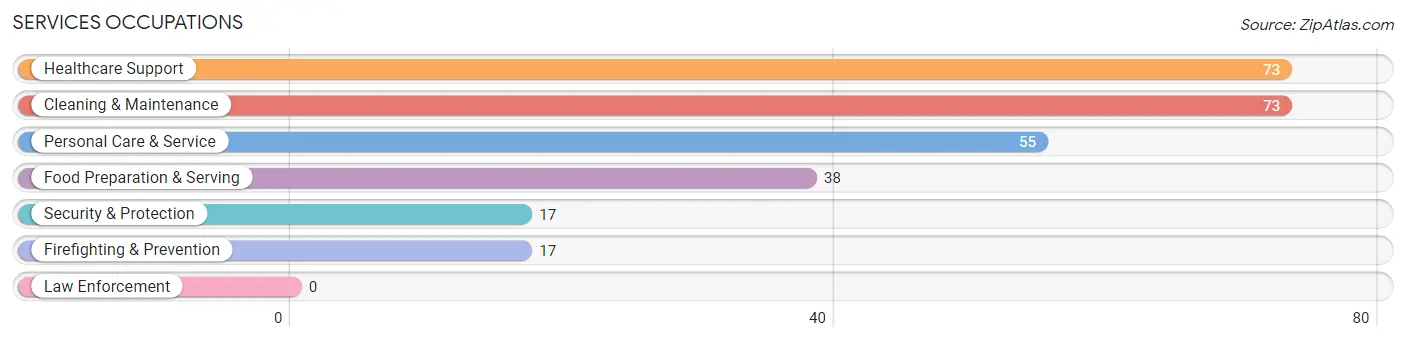
Services Occupations
The most common Services occupations in Oak Valley are Healthcare Support (73 | 3.6%), Cleaning & Maintenance (73 | 3.6%), Personal Care & Service (55 | 2.7%), Food Preparation & Serving (38 | 1.9%), and Security & Protection (17 | 0.8%).
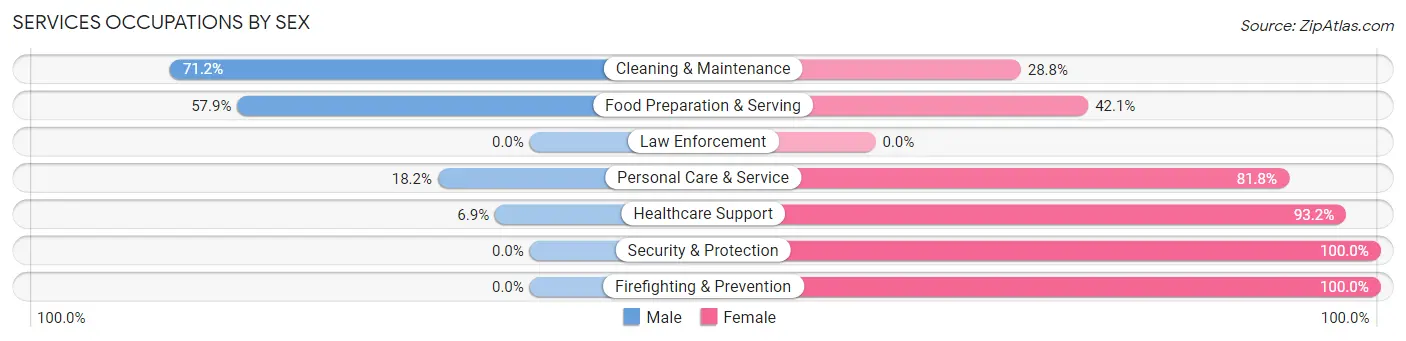
Services Occupations by Sex
Within the Services occupations in Oak Valley, the most male-oriented occupations are Cleaning & Maintenance (71.2%), Food Preparation & Serving (57.9%), and Personal Care & Service (18.2%), while the most female-oriented occupations are Security & Protection (100.0%), Firefighting & Prevention (100.0%), and Healthcare Support (93.1%).
| Occupation | Male | Female |
| Healthcare Support | 5 (6.9%) | 68 (93.1%) |
| Security & Protection | 0 (0.0%) | 17 (100.0%) |
| Firefighting & Prevention | 0 (0.0%) | 17 (100.0%) |
| Law Enforcement | 0 (0.0%) | 0 (0.0%) |
| Food Preparation & Serving | 22 (57.9%) | 16 (42.1%) |
| Cleaning & Maintenance | 52 (71.2%) | 21 (28.8%) |
| Personal Care & Service | 10 (18.2%) | 45 (81.8%) |
| Total (Category) | 89 (34.8%) | 167 (65.2%) |
| Total (Overall) | 1,082 (53.4%) | 943 (46.6%) |
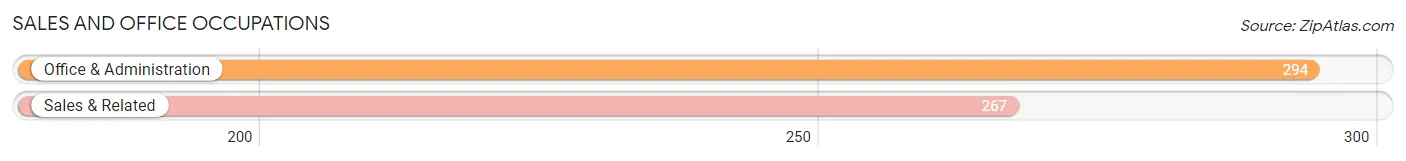
Sales and Office Occupations
The most common Sales and Office occupations in Oak Valley are Office & Administration (294 | 14.5%), and Sales & Related (267 | 13.2%).
Sales and Office Occupations by Sex
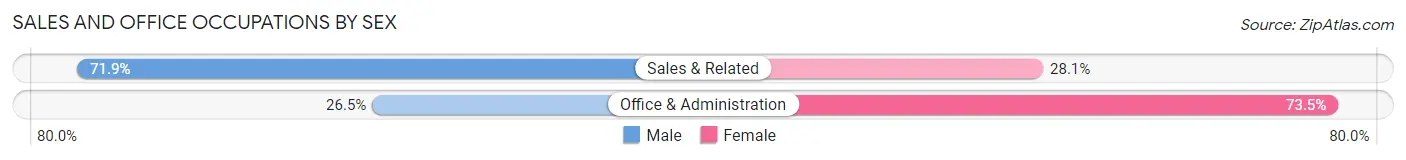
| Occupation | Male | Female |
| Sales & Related | 192 (71.9%) | 75 (28.1%) |
| Office & Administration | 78 (26.5%) | 216 (73.5%) |
| Total (Category) | 270 (48.1%) | 291 (51.9%) |
| Total (Overall) | 1,082 (53.4%) | 943 (46.6%) |
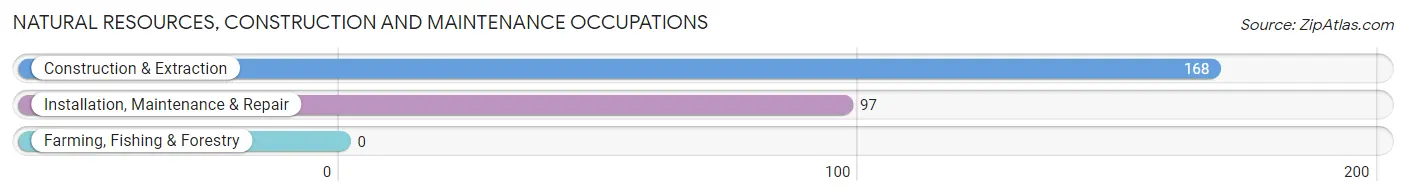
Natural Resources, Construction and Maintenance Occupations
The most common Natural Resources, Construction and Maintenance occupations in Oak Valley are Construction & Extraction (168 | 8.3%), and Installation, Maintenance & Repair (97 | 4.8%).
Natural Resources, Construction and Maintenance Occupations by Sex
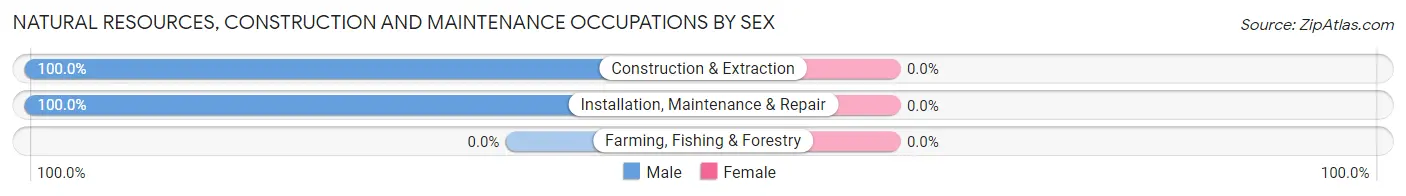
| Occupation | Male | Female |
| Farming, Fishing & Forestry | 0 (0.0%) | 0 (0.0%) |
| Construction & Extraction | 168 (100.0%) | 0 (0.0%) |
| Installation, Maintenance & Repair | 97 (100.0%) | 0 (0.0%) |
| Total (Category) | 265 (100.0%) | 0 (0.0%) |
| Total (Overall) | 1,082 (53.4%) | 943 (46.6%) |
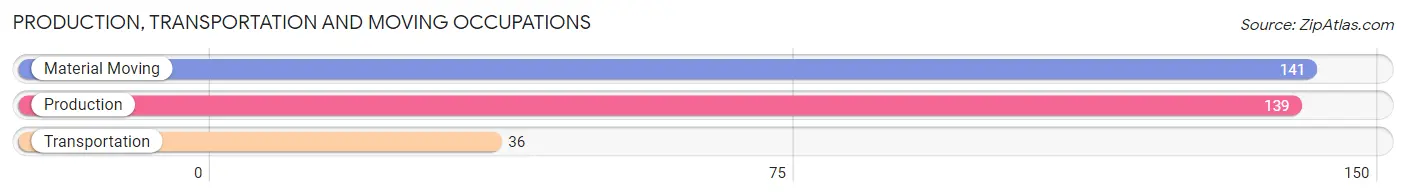
Production, Transportation and Moving Occupations
The most common Production, Transportation and Moving occupations in Oak Valley are Material Moving (141 | 7.0%), Production (139 | 6.9%), and Transportation (36 | 1.8%).
Production, Transportation and Moving Occupations by Sex
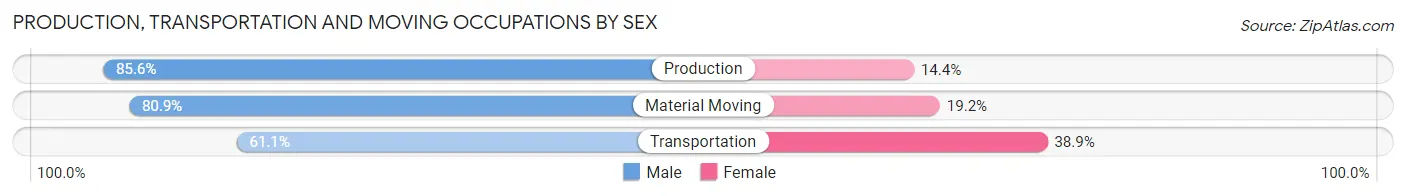
| Occupation | Male | Female |
| Production | 119 (85.6%) | 20 (14.4%) |
| Transportation | 22 (61.1%) | 14 (38.9%) |
| Material Moving | 114 (80.8%) | 27 (19.2%) |
| Total (Category) | 255 (80.7%) | 61 (19.3%) |
| Total (Overall) | 1,082 (53.4%) | 943 (46.6%) |
Employment Industries by Sex in Oak Valley
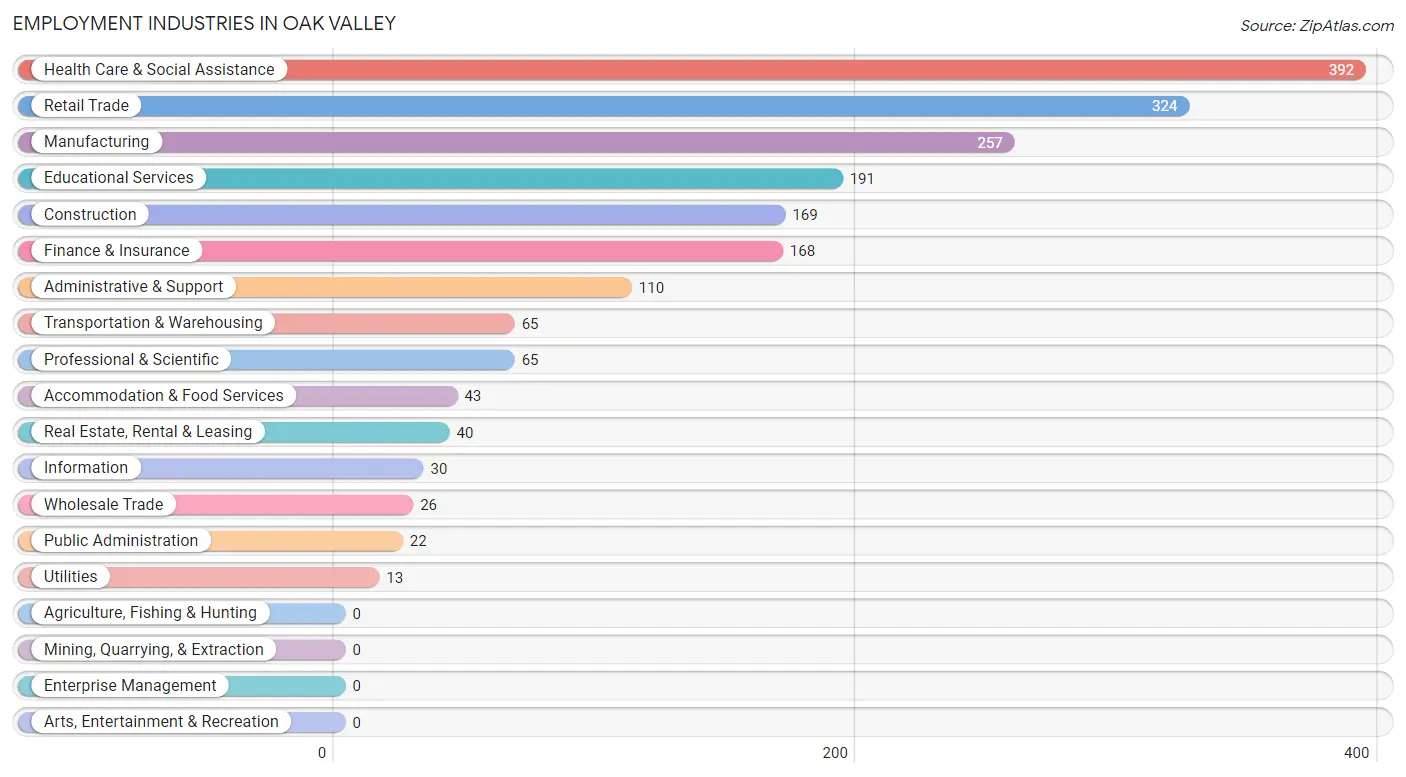
Employment Industries in Oak Valley
The major employment industries in Oak Valley include Health Care & Social Assistance (392 | 19.4%), Retail Trade (324 | 16.0%), Manufacturing (257 | 12.7%), Educational Services (191 | 9.4%), and Construction (169 | 8.4%).
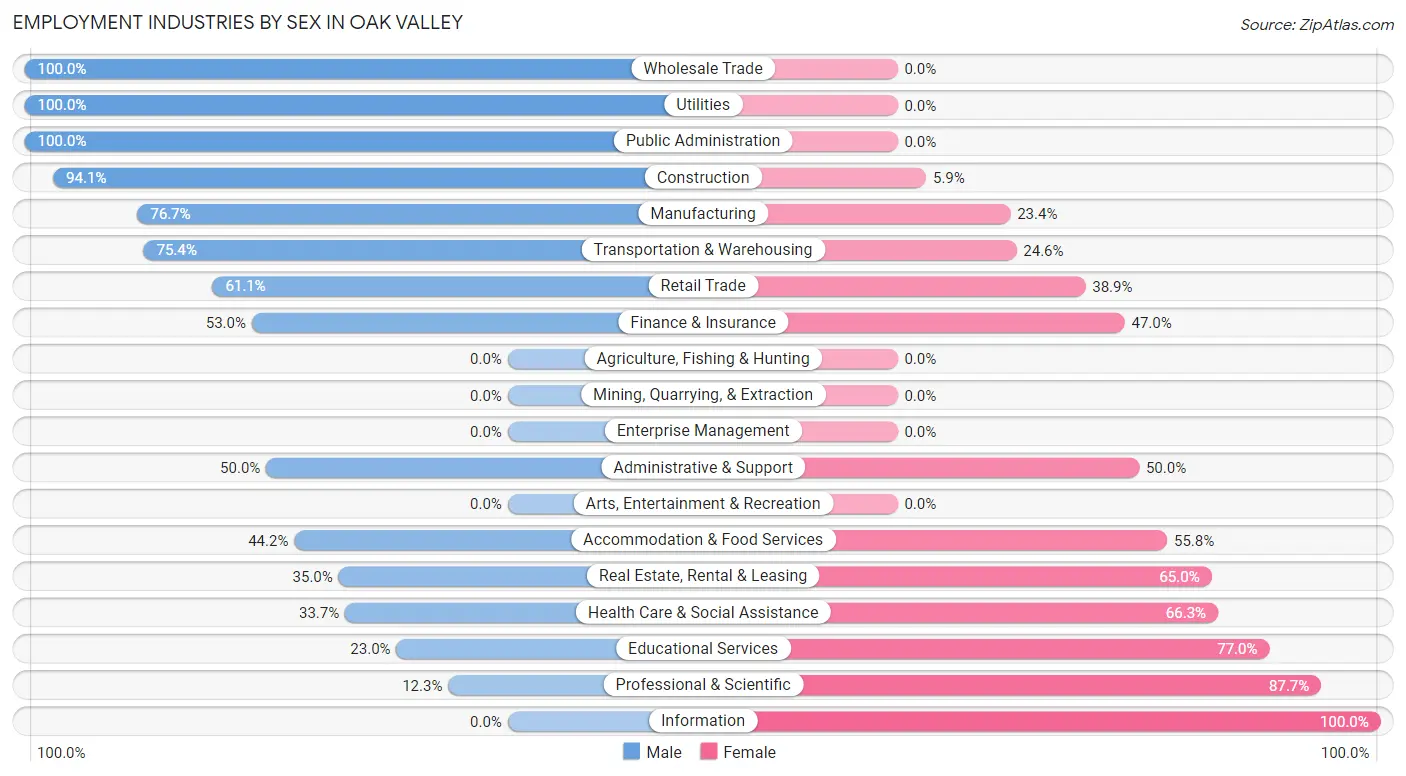
Employment Industries by Sex in Oak Valley
The Oak Valley industries that see more men than women are Wholesale Trade (100.0%), Utilities (100.0%), and Public Administration (100.0%), whereas the industries that tend to have a higher number of women are Information (100.0%), Professional & Scientific (87.7%), and Educational Services (77.0%).
| Industry | Male | Female |
| Agriculture, Fishing & Hunting | 0 (0.0%) | 0 (0.0%) |
| Mining, Quarrying, & Extraction | 0 (0.0%) | 0 (0.0%) |
| Construction | 159 (94.1%) | 10 (5.9%) |
| Manufacturing | 197 (76.6%) | 60 (23.4%) |
| Wholesale Trade | 26 (100.0%) | 0 (0.0%) |
| Retail Trade | 198 (61.1%) | 126 (38.9%) |
| Transportation & Warehousing | 49 (75.4%) | 16 (24.6%) |
| Utilities | 13 (100.0%) | 0 (0.0%) |
| Information | 0 (0.0%) | 30 (100.0%) |
| Finance & Insurance | 89 (53.0%) | 79 (47.0%) |
| Real Estate, Rental & Leasing | 14 (35.0%) | 26 (65.0%) |
| Professional & Scientific | 8 (12.3%) | 57 (87.7%) |
| Enterprise Management | 0 (0.0%) | 0 (0.0%) |
| Administrative & Support | 55 (50.0%) | 55 (50.0%) |
| Educational Services | 44 (23.0%) | 147 (77.0%) |
| Health Care & Social Assistance | 132 (33.7%) | 260 (66.3%) |
| Arts, Entertainment & Recreation | 0 (0.0%) | 0 (0.0%) |
| Accommodation & Food Services | 19 (44.2%) | 24 (55.8%) |
| Public Administration | 22 (100.0%) | 0 (0.0%) |
| Total | 1,082 (53.4%) | 943 (46.6%) |
Education in Oak Valley
School Enrollment in Oak Valley
The most common levels of schooling among the 755 students in Oak Valley are middle school (210 | 27.8%), high school (183 | 24.2%), and college / undergraduate (155 | 20.5%).
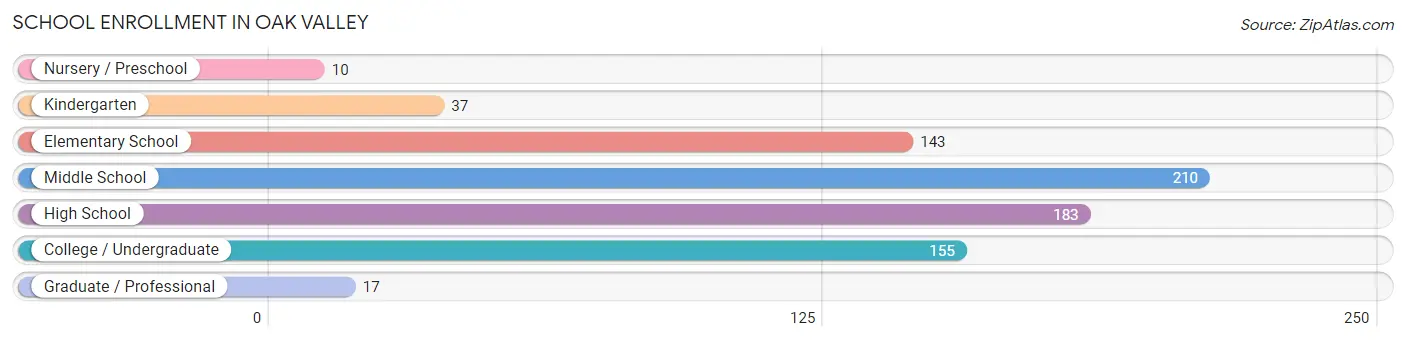
| School Level | # Students | % Students |
| Nursery / Preschool | 10 | 1.3% |
| Kindergarten | 37 | 4.9% |
| Elementary School | 143 | 18.9% |
| Middle School | 210 | 27.8% |
| High School | 183 | 24.2% |
| College / Undergraduate | 155 | 20.5% |
| Graduate / Professional | 17 | 2.2% |
| Total | 755 | 100.0% |
School Enrollment by Age by Funding Source in Oak Valley
Out of a total of 755 students who are enrolled in schools in Oak Valley, 41 (5.4%) attend a private institution, while the remaining 714 (94.6%) are enrolled in public schools. The age group of 5 to 9 year old has the highest likelihood of being enrolled in private schools, with 27 (15.1% in the age bracket) enrolled. Conversely, the age group of 10 to 14 year olds has the lowest likelihood of being enrolled in a private school, with 221 (100.0% in the age bracket) attending a public institution.
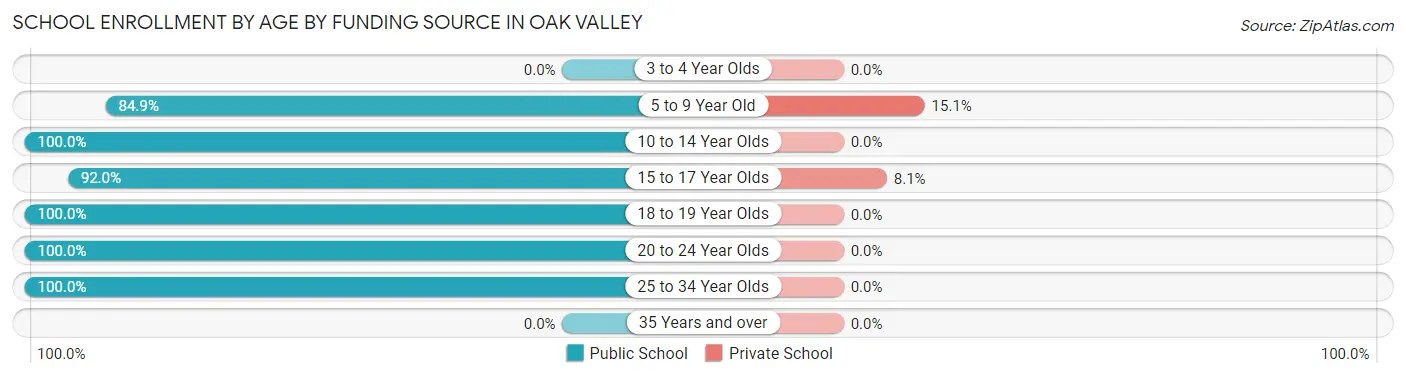
| Age Bracket | Public School | Private School |
| 3 to 4 Year Olds | 0 (0.0%) | 0 (0.0%) |
| 5 to 9 Year Old | 152 (84.9%) | 27 (15.1%) |
| 10 to 14 Year Olds | 221 (100.0%) | 0 (0.0%) |
| 15 to 17 Year Olds | 160 (91.9%) | 14 (8.1%) |
| 18 to 19 Year Olds | 21 (100.0%) | 0 (0.0%) |
| 20 to 24 Year Olds | 117 (100.0%) | 0 (0.0%) |
| 25 to 34 Year Olds | 43 (100.0%) | 0 (0.0%) |
| 35 Years and over | 0 (0.0%) | 0 (0.0%) |
| Total | 714 (94.6%) | 41 (5.4%) |
Educational Attainment by Field of Study in Oak Valley
Arts & humanities (114 | 20.0%), science & technology (106 | 18.6%), education (72 | 12.6%), business (55 | 9.7%), and literature & languages (48 | 8.4%) are the most common fields of study among 570 individuals in Oak Valley who have obtained a bachelor's degree or higher.
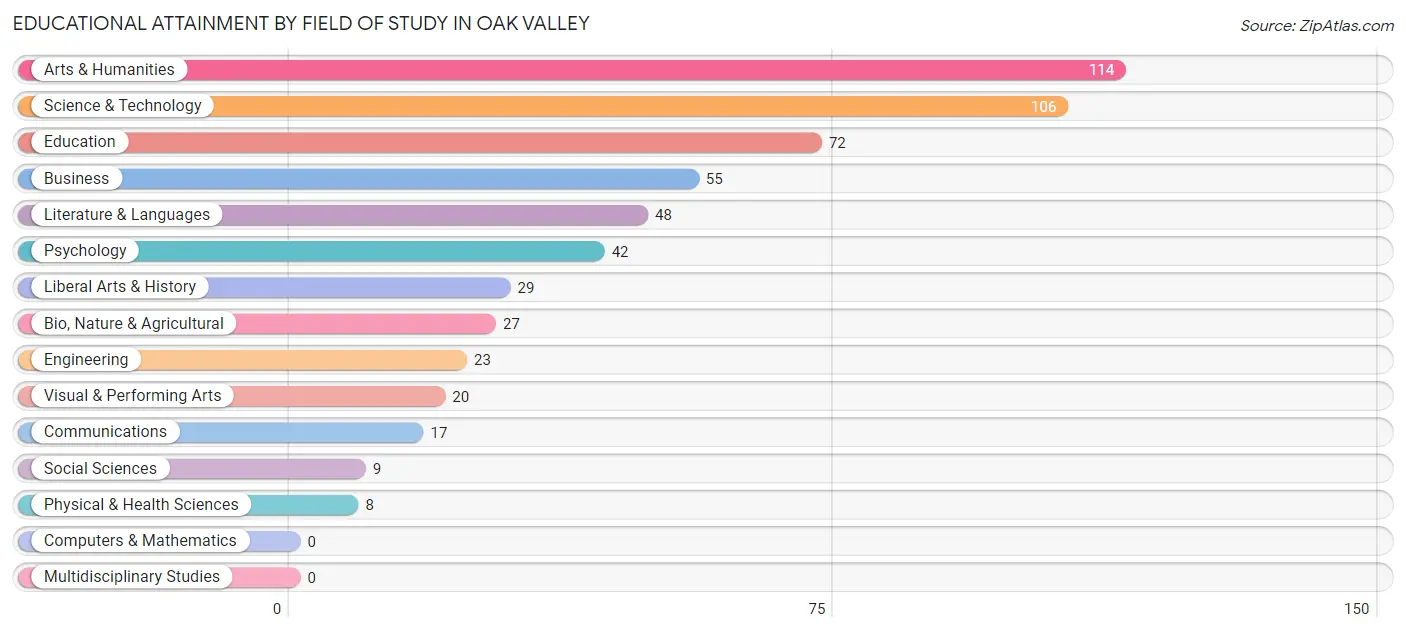
| Field of Study | # Graduates | % Graduates |
| Computers & Mathematics | 0 | 0.0% |
| Bio, Nature & Agricultural | 27 | 4.7% |
| Physical & Health Sciences | 8 | 1.4% |
| Psychology | 42 | 7.4% |
| Social Sciences | 9 | 1.6% |
| Engineering | 23 | 4.0% |
| Multidisciplinary Studies | 0 | 0.0% |
| Science & Technology | 106 | 18.6% |
| Business | 55 | 9.7% |
| Education | 72 | 12.6% |
| Literature & Languages | 48 | 8.4% |
| Liberal Arts & History | 29 | 5.1% |
| Visual & Performing Arts | 20 | 3.5% |
| Communications | 17 | 3.0% |
| Arts & Humanities | 114 | 20.0% |
| Total | 570 | 100.0% |
Transportation & Commute in Oak Valley
Vehicle Availability by Sex in Oak Valley
The most prevalent vehicle ownership categories in Oak Valley are males with 2 vehicles (352, accounting for 33.3%) and females with 2 vehicles (343, making up 38.1%).
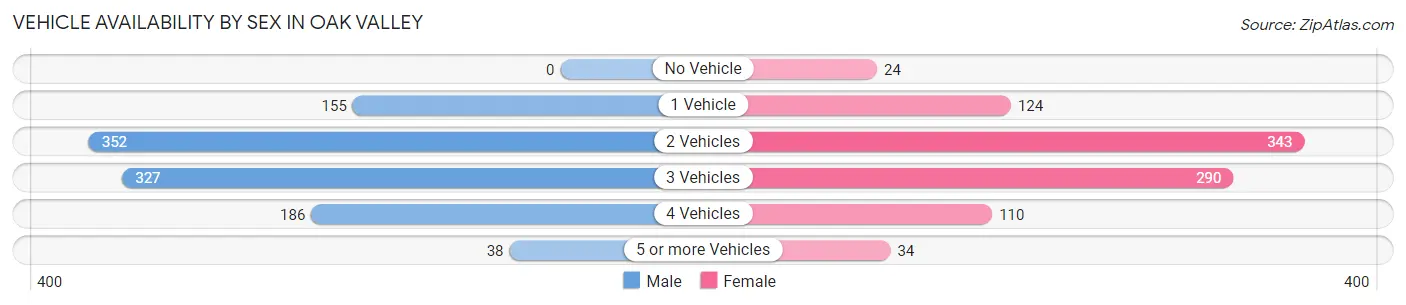
| Vehicles Available | Male | Female |
| No Vehicle | 0 (0.0%) | 24 (2.6%) |
| 1 Vehicle | 155 (14.6%) | 124 (13.4%) |
| 2 Vehicles | 352 (33.3%) | 343 (37.1%) |
| 3 Vehicles | 327 (30.9%) | 290 (31.4%) |
| 4 Vehicles | 186 (17.6%) | 110 (11.9%) |
| 5 or more Vehicles | 38 (3.6%) | 34 (3.7%) |
| Total | 1,058 (100.0%) | 925 (100.0%) |
Commute Time in Oak Valley
The most frequently occuring commute durations in Oak Valley are 10 to 14 minutes (308 commuters, 17.8%), 15 to 19 minutes (250 commuters, 14.4%), and 30 to 34 minutes (221 commuters, 12.8%).
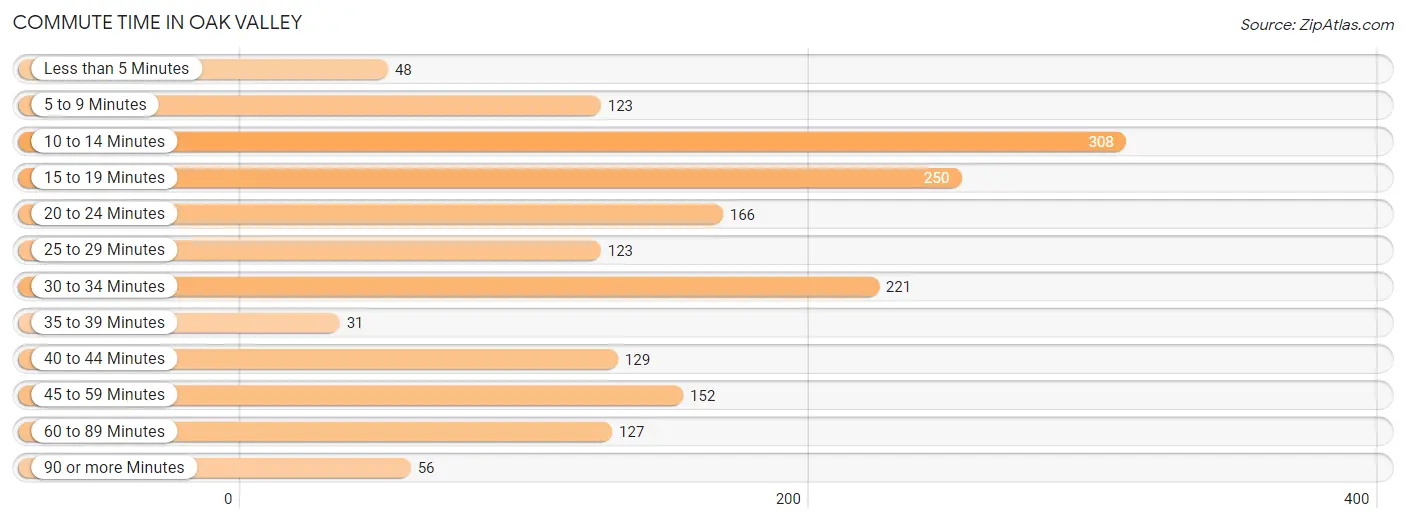
| Commute Time | # Commuters | % Commuters |
| Less than 5 Minutes | 48 | 2.8% |
| 5 to 9 Minutes | 123 | 7.1% |
| 10 to 14 Minutes | 308 | 17.8% |
| 15 to 19 Minutes | 250 | 14.4% |
| 20 to 24 Minutes | 166 | 9.6% |
| 25 to 29 Minutes | 123 | 7.1% |
| 30 to 34 Minutes | 221 | 12.8% |
| 35 to 39 Minutes | 31 | 1.8% |
| 40 to 44 Minutes | 129 | 7.4% |
| 45 to 59 Minutes | 152 | 8.8% |
| 60 to 89 Minutes | 127 | 7.3% |
| 90 or more Minutes | 56 | 3.2% |
Commute Time by Sex in Oak Valley
The most common commute times in Oak Valley are 10 to 14 minutes (176 commuters, 18.6%) for males and 10 to 14 minutes (132 commuters, 16.8%) for females.
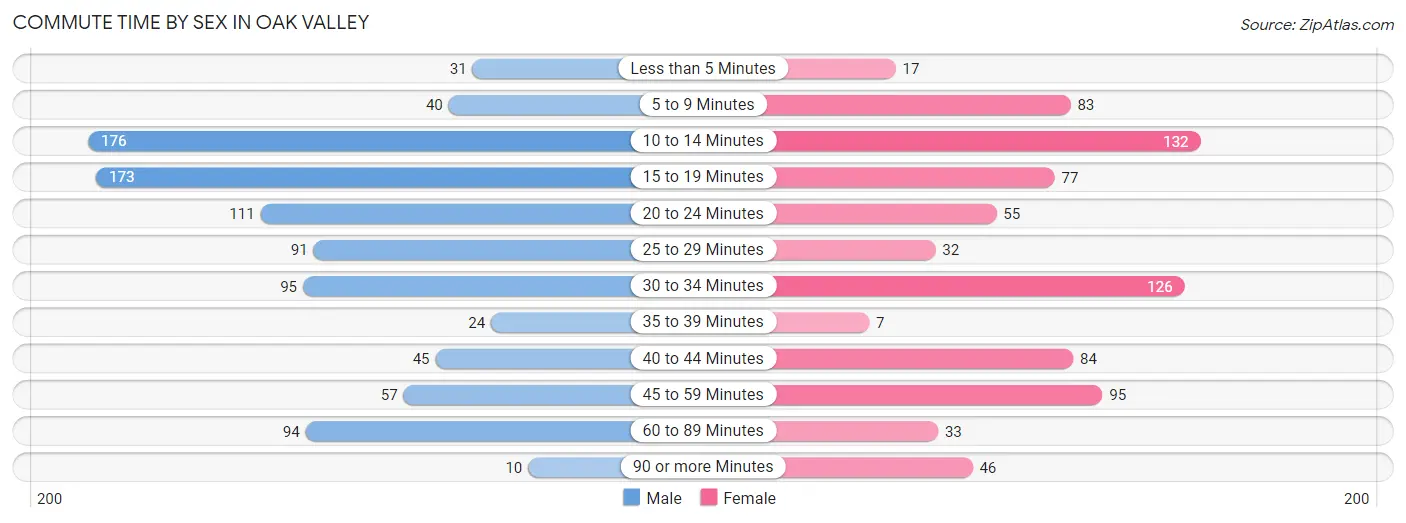
| Commute Time | Male | Female |
| Less than 5 Minutes | 31 (3.3%) | 17 (2.2%) |
| 5 to 9 Minutes | 40 (4.2%) | 83 (10.5%) |
| 10 to 14 Minutes | 176 (18.6%) | 132 (16.8%) |
| 15 to 19 Minutes | 173 (18.3%) | 77 (9.8%) |
| 20 to 24 Minutes | 111 (11.7%) | 55 (7.0%) |
| 25 to 29 Minutes | 91 (9.6%) | 32 (4.1%) |
| 30 to 34 Minutes | 95 (10.0%) | 126 (16.0%) |
| 35 to 39 Minutes | 24 (2.5%) | 7 (0.9%) |
| 40 to 44 Minutes | 45 (4.8%) | 84 (10.7%) |
| 45 to 59 Minutes | 57 (6.0%) | 95 (12.1%) |
| 60 to 89 Minutes | 94 (9.9%) | 33 (4.2%) |
| 90 or more Minutes | 10 (1.1%) | 46 (5.8%) |
Time of Departure to Work by Sex in Oak Valley
The most frequent times of departure to work in Oak Valley are 7:00 AM to 7:29 AM (193, 20.4%) for males and 8:00 AM to 8:29 AM (159, 20.2%) for females.
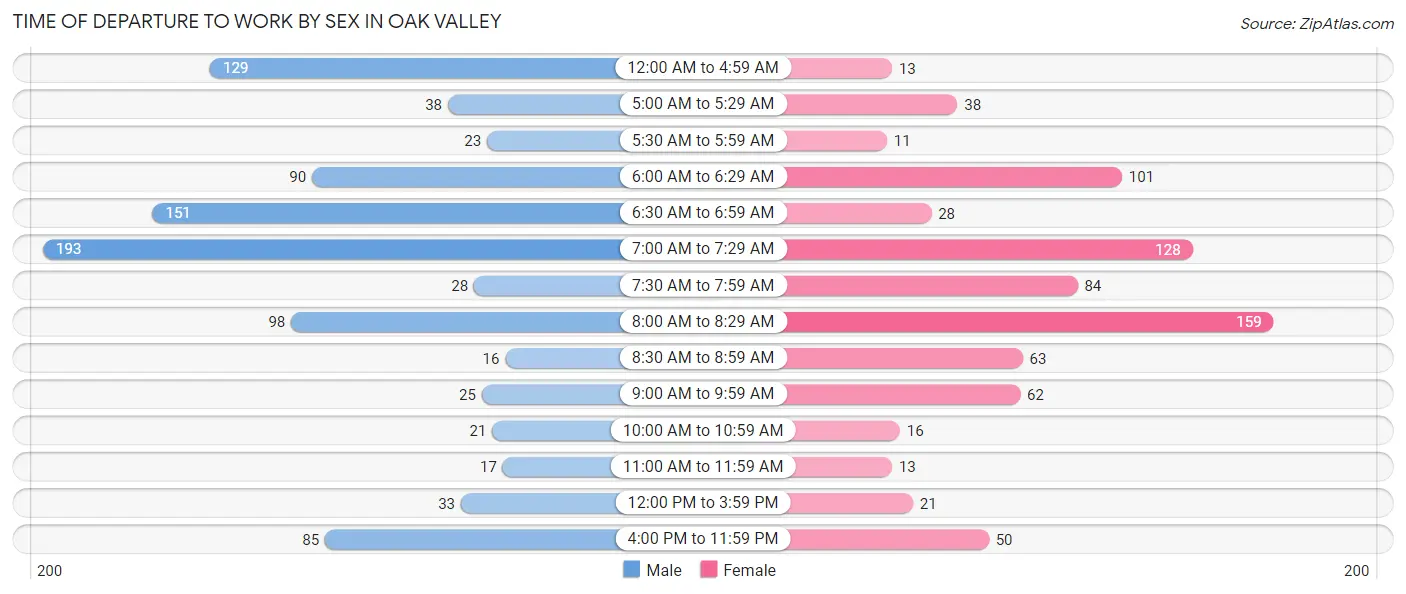
| Time of Departure | Male | Female |
| 12:00 AM to 4:59 AM | 129 (13.6%) | 13 (1.7%) |
| 5:00 AM to 5:29 AM | 38 (4.0%) | 38 (4.8%) |
| 5:30 AM to 5:59 AM | 23 (2.4%) | 11 (1.4%) |
| 6:00 AM to 6:29 AM | 90 (9.5%) | 101 (12.8%) |
| 6:30 AM to 6:59 AM | 151 (16.0%) | 28 (3.6%) |
| 7:00 AM to 7:29 AM | 193 (20.4%) | 128 (16.3%) |
| 7:30 AM to 7:59 AM | 28 (3.0%) | 84 (10.7%) |
| 8:00 AM to 8:29 AM | 98 (10.3%) | 159 (20.2%) |
| 8:30 AM to 8:59 AM | 16 (1.7%) | 63 (8.0%) |
| 9:00 AM to 9:59 AM | 25 (2.6%) | 62 (7.9%) |
| 10:00 AM to 10:59 AM | 21 (2.2%) | 16 (2.0%) |
| 11:00 AM to 11:59 AM | 17 (1.8%) | 13 (1.7%) |
| 12:00 PM to 3:59 PM | 33 (3.5%) | 21 (2.7%) |
| 4:00 PM to 11:59 PM | 85 (9.0%) | 50 (6.4%) |
| Total | 947 (100.0%) | 787 (100.0%) |
Housing Occupancy in Oak Valley
Occupancy by Ownership in Oak Valley
Of the total 1,310 dwellings in Oak Valley, owner-occupied units account for 1,126 (86.0%), while renter-occupied units make up 184 (14.1%).
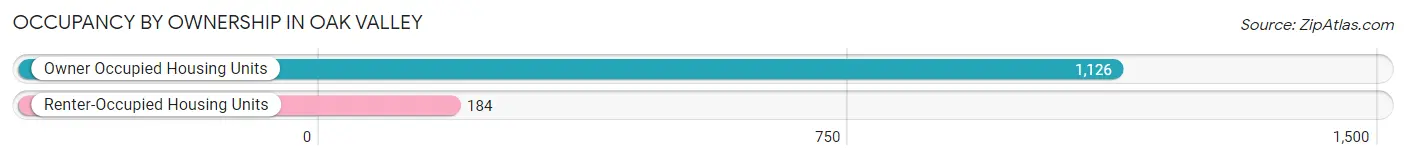
| Occupancy | # Housing Units | % Housing Units |
| Owner Occupied Housing Units | 1,126 | 86.0% |
| Renter-Occupied Housing Units | 184 | 14.1% |
| Total Occupied Housing Units | 1,310 | 100.0% |
Occupancy by Household Size in Oak Valley
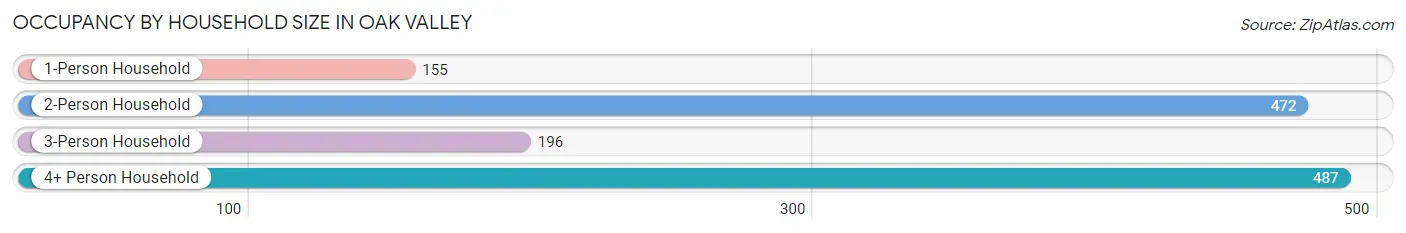
| Household Size | # Housing Units | % Housing Units |
| 1-Person Household | 155 | 11.8% |
| 2-Person Household | 472 | 36.0% |
| 3-Person Household | 196 | 15.0% |
| 4+ Person Household | 487 | 37.2% |
| Total Housing Units | 1,310 | 100.0% |
Occupancy by Ownership by Household Size in Oak Valley
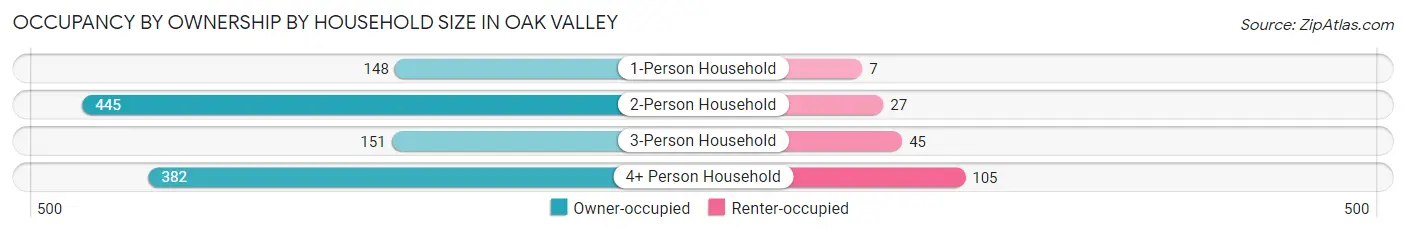
| Household Size | Owner-occupied | Renter-occupied |
| 1-Person Household | 148 (95.5%) | 7 (4.5%) |
| 2-Person Household | 445 (94.3%) | 27 (5.7%) |
| 3-Person Household | 151 (77.0%) | 45 (23.0%) |
| 4+ Person Household | 382 (78.4%) | 105 (21.6%) |
| Total Housing Units | 1,126 (86.0%) | 184 (14.1%) |
Occupancy by Educational Attainment in Oak Valley
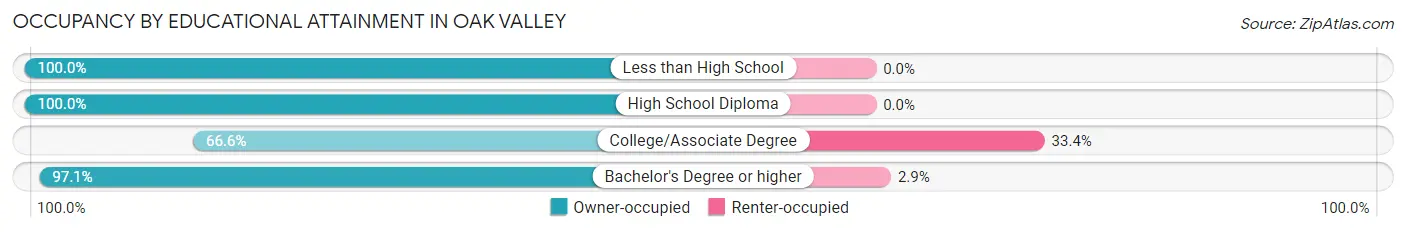
| Household Size | Owner-occupied | Renter-occupied |
| Less than High School | 90 (100.0%) | 0 (0.0%) |
| High School Diploma | 451 (100.0%) | 0 (0.0%) |
| College/Associate Degree | 353 (66.6%) | 177 (33.4%) |
| Bachelor's Degree or higher | 232 (97.1%) | 7 (2.9%) |
Occupancy by Age of Householder in Oak Valley
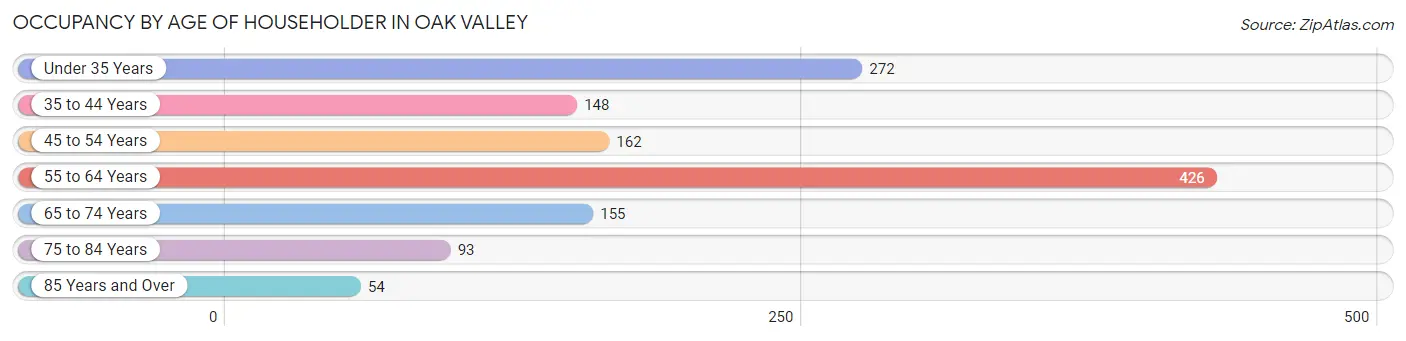
| Age Bracket | # Households | % Households |
| Under 35 Years | 272 | 20.8% |
| 35 to 44 Years | 148 | 11.3% |
| 45 to 54 Years | 162 | 12.4% |
| 55 to 64 Years | 426 | 32.5% |
| 65 to 74 Years | 155 | 11.8% |
| 75 to 84 Years | 93 | 7.1% |
| 85 Years and Over | 54 | 4.1% |
| Total | 1,310 | 100.0% |
Housing Finances in Oak Valley
Median Income by Occupancy in Oak Valley
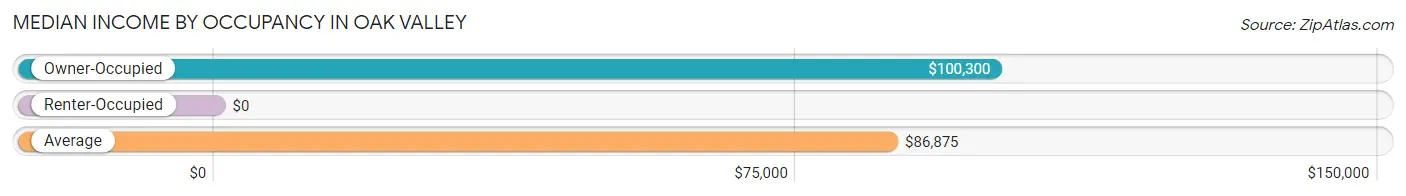
| Occupancy Type | # Households | Median Income |
| Owner-Occupied | 1,126 (86.0%) | $100,300 |
| Renter-Occupied | 184 (14.1%) | $0 |
| Average | 1,310 (100.0%) | $86,875 |
Occupancy by Householder Income Bracket in Oak Valley
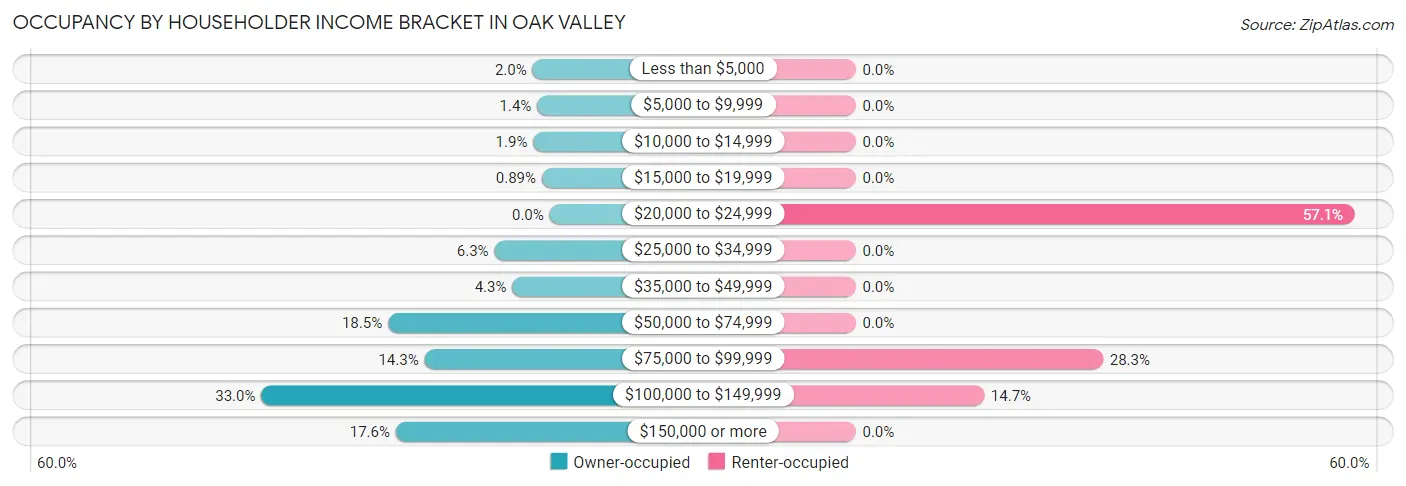
| Income Bracket | Owner-occupied | Renter-occupied |
| Less than $5,000 | 22 (1.9%) | 0 (0.0%) |
| $5,000 to $9,999 | 16 (1.4%) | 0 (0.0%) |
| $10,000 to $14,999 | 21 (1.9%) | 0 (0.0%) |
| $15,000 to $19,999 | 10 (0.9%) | 0 (0.0%) |
| $20,000 to $24,999 | 0 (0.0%) | 105 (57.1%) |
| $25,000 to $34,999 | 71 (6.3%) | 0 (0.0%) |
| $35,000 to $49,999 | 48 (4.3%) | 0 (0.0%) |
| $50,000 to $74,999 | 208 (18.5%) | 0 (0.0%) |
| $75,000 to $99,999 | 161 (14.3%) | 52 (28.3%) |
| $100,000 to $149,999 | 371 (33.0%) | 27 (14.7%) |
| $150,000 or more | 198 (17.6%) | 0 (0.0%) |
| Total | 1,126 (100.0%) | 184 (100.0%) |
Monthly Housing Cost Tiers in Oak Valley
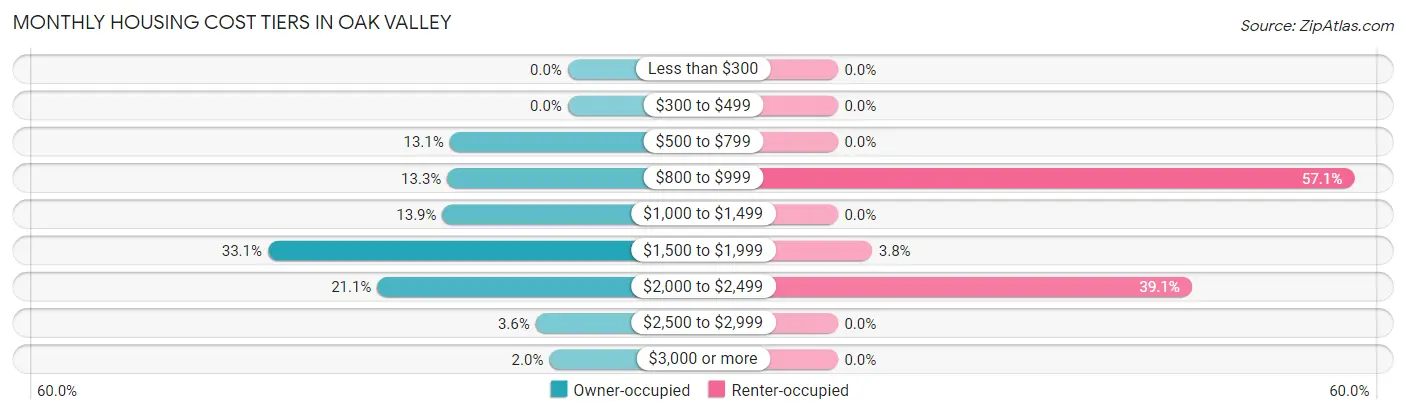
| Monthly Cost | Owner-occupied | Renter-occupied |
| Less than $300 | 0 (0.0%) | 0 (0.0%) |
| $300 to $499 | 0 (0.0%) | 0 (0.0%) |
| $500 to $799 | 147 (13.1%) | 0 (0.0%) |
| $800 to $999 | 150 (13.3%) | 105 (57.1%) |
| $1,000 to $1,499 | 156 (13.9%) | 0 (0.0%) |
| $1,500 to $1,999 | 373 (33.1%) | 7 (3.8%) |
| $2,000 to $2,499 | 237 (21.0%) | 72 (39.1%) |
| $2,500 to $2,999 | 40 (3.5%) | 0 (0.0%) |
| $3,000 or more | 23 (2.0%) | 0 (0.0%) |
| Total | 1,126 (100.0%) | 184 (100.0%) |
Physical Housing Characteristics in Oak Valley
Housing Structures in Oak Valley
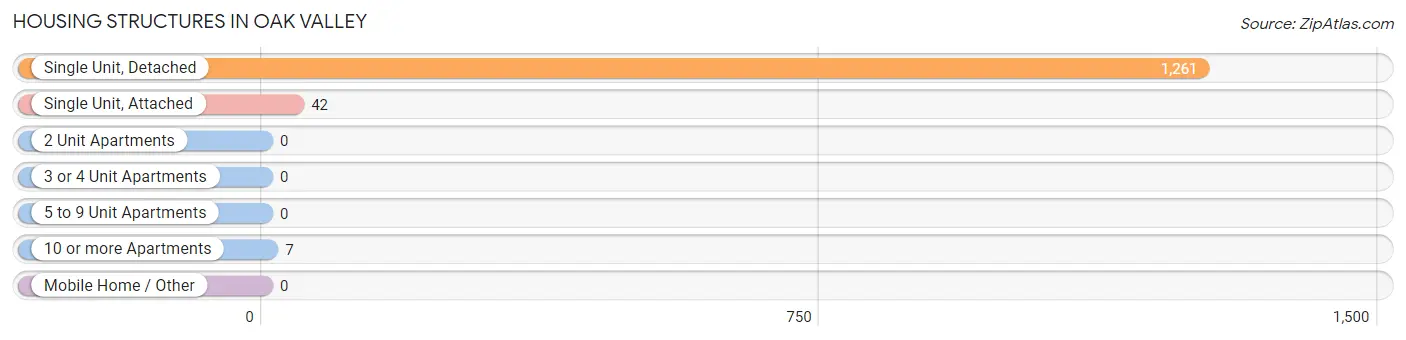
| Structure Type | # Housing Units | % Housing Units |
| Single Unit, Detached | 1,261 | 96.3% |
| Single Unit, Attached | 42 | 3.2% |
| 2 Unit Apartments | 0 | 0.0% |
| 3 or 4 Unit Apartments | 0 | 0.0% |
| 5 to 9 Unit Apartments | 0 | 0.0% |
| 10 or more Apartments | 7 | 0.5% |
| Mobile Home / Other | 0 | 0.0% |
| Total | 1,310 | 100.0% |
Housing Structures by Occupancy in Oak Valley
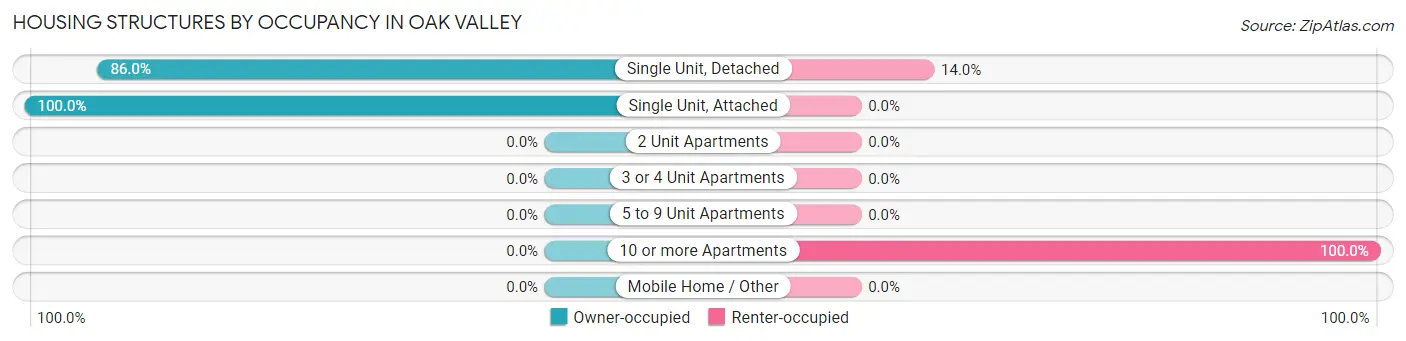
| Structure Type | Owner-occupied | Renter-occupied |
| Single Unit, Detached | 1,084 (86.0%) | 177 (14.0%) |
| Single Unit, Attached | 42 (100.0%) | 0 (0.0%) |
| 2 Unit Apartments | 0 (0.0%) | 0 (0.0%) |
| 3 or 4 Unit Apartments | 0 (0.0%) | 0 (0.0%) |
| 5 to 9 Unit Apartments | 0 (0.0%) | 0 (0.0%) |
| 10 or more Apartments | 0 (0.0%) | 7 (100.0%) |
| Mobile Home / Other | 0 (0.0%) | 0 (0.0%) |
| Total | 1,126 (86.0%) | 184 (14.1%) |
Housing Structures by Number of Rooms in Oak Valley
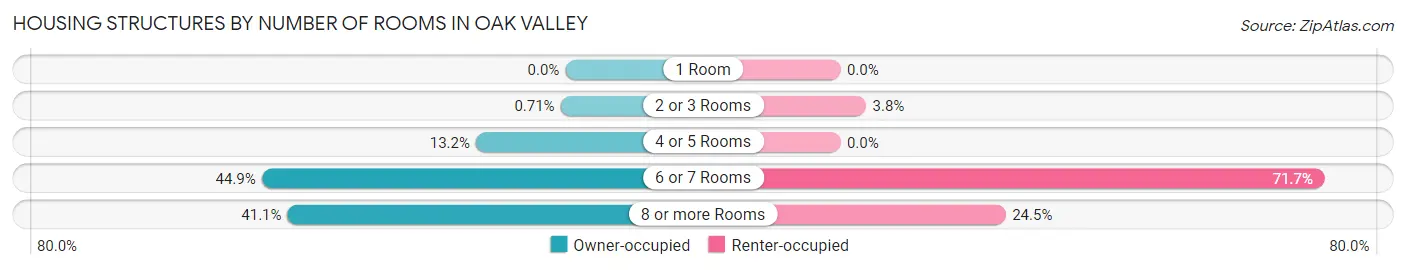
| Number of Rooms | Owner-occupied | Renter-occupied |
| 1 Room | 0 (0.0%) | 0 (0.0%) |
| 2 or 3 Rooms | 8 (0.7%) | 7 (3.8%) |
| 4 or 5 Rooms | 149 (13.2%) | 0 (0.0%) |
| 6 or 7 Rooms | 506 (44.9%) | 132 (71.7%) |
| 8 or more Rooms | 463 (41.1%) | 45 (24.5%) |
| Total | 1,126 (100.0%) | 184 (100.0%) |
Housing Structure by Heating Type in Oak Valley
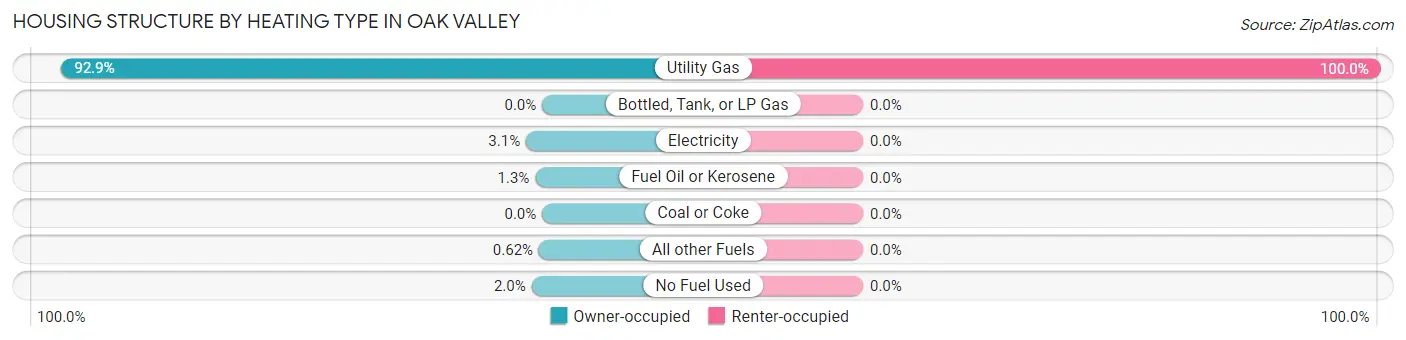
| Heating Type | Owner-occupied | Renter-occupied |
| Utility Gas | 1,046 (92.9%) | 184 (100.0%) |
| Bottled, Tank, or LP Gas | 0 (0.0%) | 0 (0.0%) |
| Electricity | 35 (3.1%) | 0 (0.0%) |
| Fuel Oil or Kerosene | 15 (1.3%) | 0 (0.0%) |
| Coal or Coke | 0 (0.0%) | 0 (0.0%) |
| All other Fuels | 7 (0.6%) | 0 (0.0%) |
| No Fuel Used | 23 (2.0%) | 0 (0.0%) |
| Total | 1,126 (100.0%) | 184 (100.0%) |
Household Vehicle Usage in Oak Valley
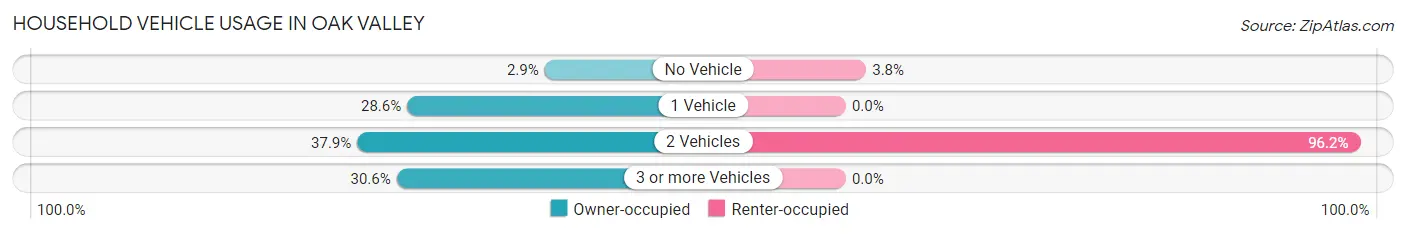
| Vehicles per Household | Owner-occupied | Renter-occupied |
| No Vehicle | 33 (2.9%) | 7 (3.8%) |
| 1 Vehicle | 322 (28.6%) | 0 (0.0%) |
| 2 Vehicles | 427 (37.9%) | 177 (96.2%) |
| 3 or more Vehicles | 344 (30.5%) | 0 (0.0%) |
| Total | 1,126 (100.0%) | 184 (100.0%) |
Real Estate & Mortgages in Oak Valley
Real Estate and Mortgage Overview in Oak Valley
| Characteristic | Without Mortgage | With Mortgage |
| Housing Units | 282 | 844 |
| Median Property Value | $179,900 | $217,900 |
| Median Household Income | $82,813 | $153 |
| Monthly Housing Costs | $832 | $23 |
| Real Estate Taxes | $5,876 | $13 |
Property Value by Mortgage Status in Oak Valley
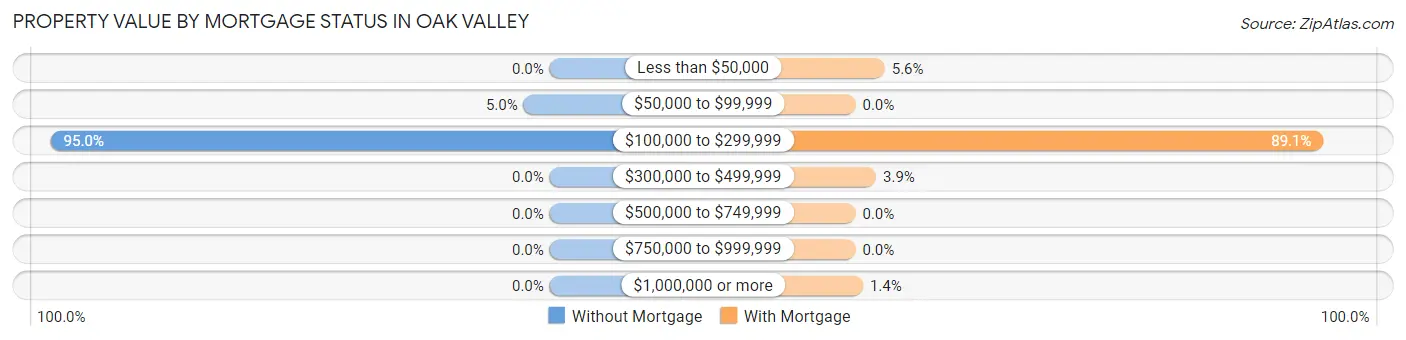
| Property Value | Without Mortgage | With Mortgage |
| Less than $50,000 | 0 (0.0%) | 47 (5.6%) |
| $50,000 to $99,999 | 14 (5.0%) | 0 (0.0%) |
| $100,000 to $299,999 | 268 (95.0%) | 752 (89.1%) |
| $300,000 to $499,999 | 0 (0.0%) | 33 (3.9%) |
| $500,000 to $749,999 | 0 (0.0%) | 0 (0.0%) |
| $750,000 to $999,999 | 0 (0.0%) | 0 (0.0%) |
| $1,000,000 or more | 0 (0.0%) | 12 (1.4%) |
| Total | 282 (100.0%) | 844 (100.0%) |
Household Income by Mortgage Status in Oak Valley
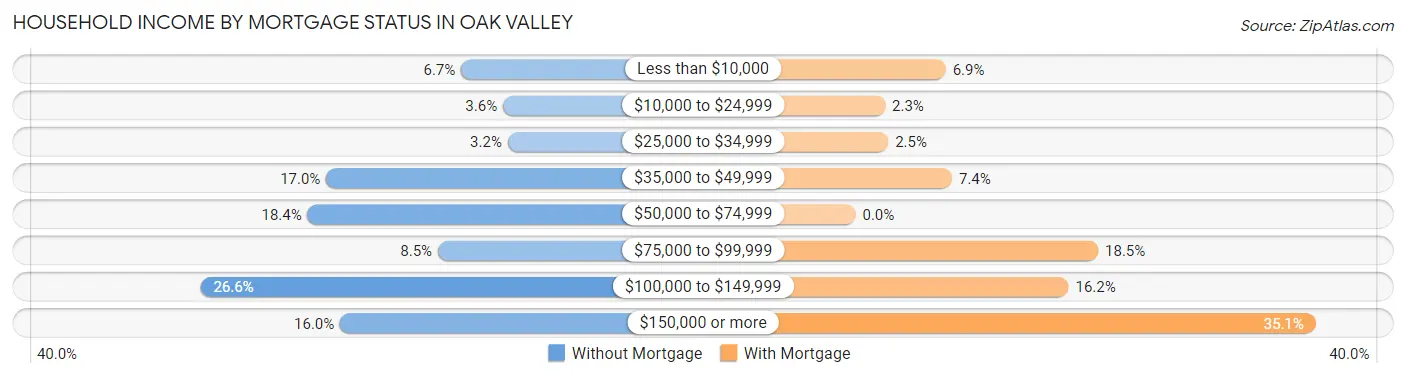
| Household Income | Without Mortgage | With Mortgage |
| Less than $10,000 | 19 (6.7%) | 58 (6.9%) |
| $10,000 to $24,999 | 10 (3.5%) | 19 (2.2%) |
| $25,000 to $34,999 | 9 (3.2%) | 21 (2.5%) |
| $35,000 to $49,999 | 48 (17.0%) | 62 (7.3%) |
| $50,000 to $74,999 | 52 (18.4%) | 0 (0.0%) |
| $75,000 to $99,999 | 24 (8.5%) | 156 (18.5%) |
| $100,000 to $149,999 | 75 (26.6%) | 137 (16.2%) |
| $150,000 or more | 45 (16.0%) | 296 (35.1%) |
| Total | 282 (100.0%) | 844 (100.0%) |
Property Value to Household Income Ratio in Oak Valley
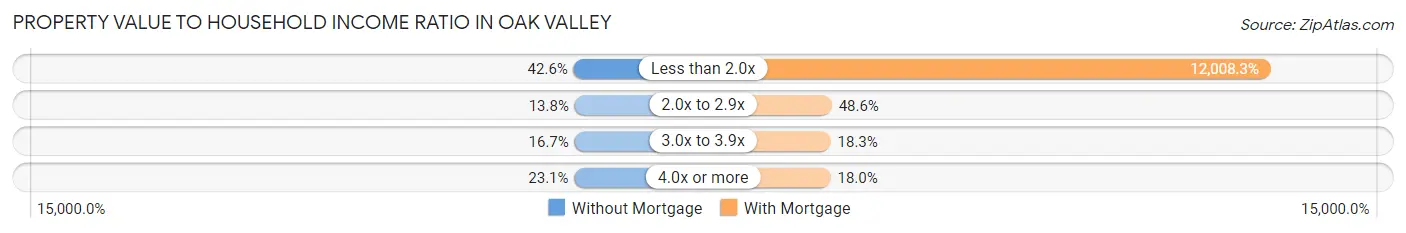
| Value-to-Income Ratio | Without Mortgage | With Mortgage |
| Less than 2.0x | 120 (42.5%) | 101,350 (12,008.3%) |
| 2.0x to 2.9x | 39 (13.8%) | 410 (48.6%) |
| 3.0x to 3.9x | 47 (16.7%) | 154 (18.2%) |
| 4.0x or more | 65 (23.1%) | 152 (18.0%) |
| Total | 282 (100.0%) | 844 (100.0%) |
Real Estate Taxes by Mortgage Status in Oak Valley
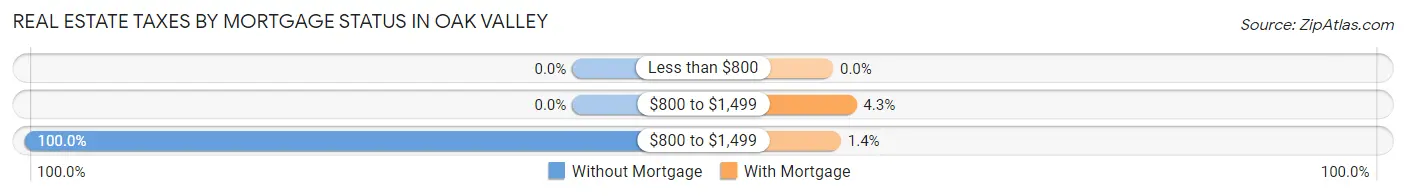
| Property Taxes | Without Mortgage | With Mortgage |
| Less than $800 | 0 (0.0%) | 0 (0.0%) |
| $800 to $1,499 | 0 (0.0%) | 36 (4.3%) |
| $800 to $1,499 | 282 (100.0%) | 12 (1.4%) |
| Total | 282 (100.0%) | 844 (100.0%) |
Health & Disability in Oak Valley
Health Insurance Coverage by Age in Oak Valley
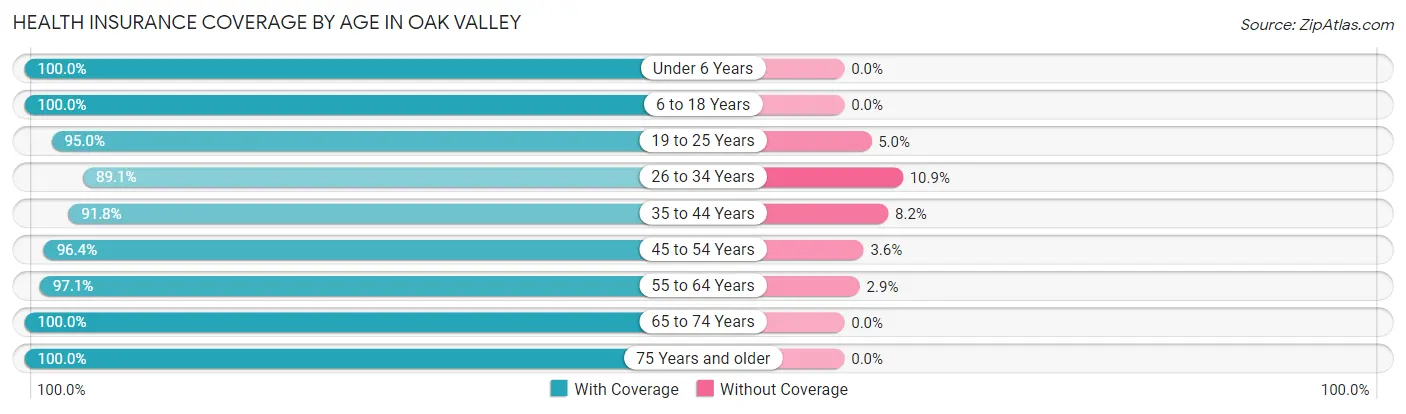
| Age Bracket | With Coverage | Without Coverage |
| Under 6 Years | 454 (100.0%) | 0 (0.0%) |
| 6 to 18 Years | 964 (100.0%) | 0 (0.0%) |
| 19 to 25 Years | 208 (95.0%) | 11 (5.0%) |
| 26 to 34 Years | 597 (89.1%) | 73 (10.9%) |
| 35 to 44 Years | 326 (91.8%) | 29 (8.2%) |
| 45 to 54 Years | 377 (96.4%) | 14 (3.6%) |
| 55 to 64 Years | 714 (97.1%) | 21 (2.9%) |
| 65 to 74 Years | 252 (100.0%) | 0 (0.0%) |
| 75 Years and older | 306 (100.0%) | 0 (0.0%) |
| Total | 4,198 (96.6%) | 148 (3.4%) |
Health Insurance Coverage by Citizenship Status in Oak Valley
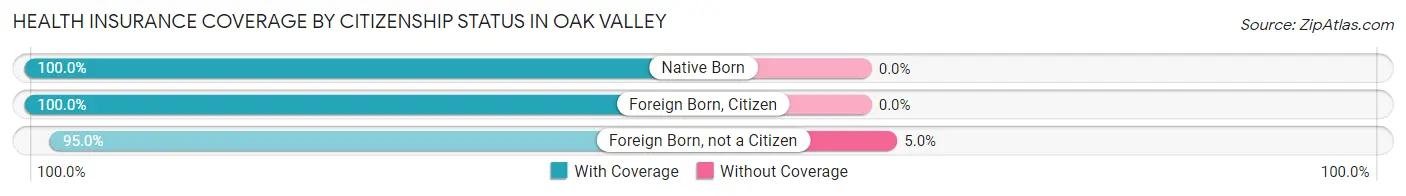
| Citizenship Status | With Coverage | Without Coverage |
| Native Born | 454 (100.0%) | 0 (0.0%) |
| Foreign Born, Citizen | 964 (100.0%) | 0 (0.0%) |
| Foreign Born, not a Citizen | 208 (95.0%) | 11 (5.0%) |
Health Insurance Coverage by Household Income in Oak Valley
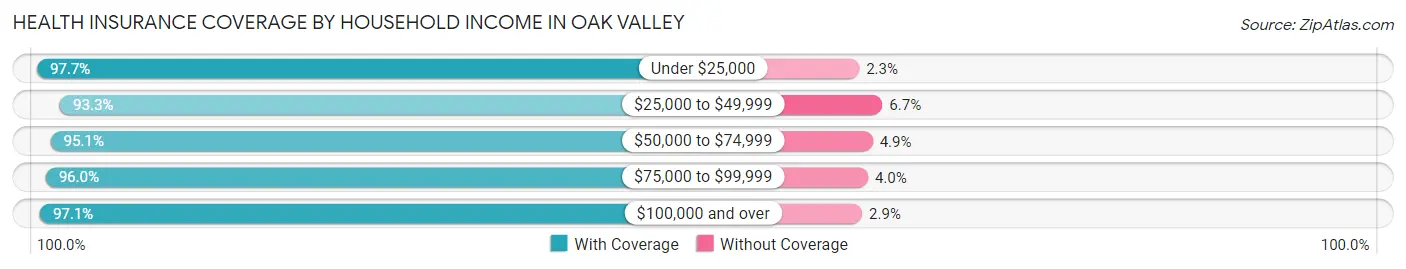
| Household Income | With Coverage | Without Coverage |
| Under $25,000 | 715 (97.7%) | 17 (2.3%) |
| $25,000 to $49,999 | 182 (93.3%) | 13 (6.7%) |
| $50,000 to $74,999 | 685 (95.1%) | 35 (4.9%) |
| $75,000 to $99,999 | 459 (96.0%) | 19 (4.0%) |
| $100,000 and over | 2,157 (97.1%) | 64 (2.9%) |
Public vs Private Health Insurance Coverage by Age in Oak Valley
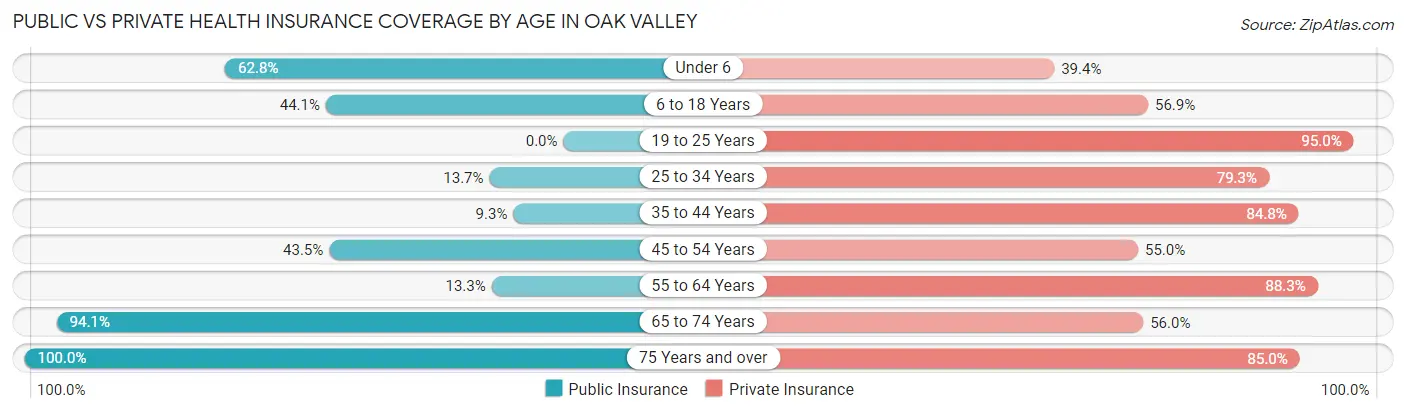
| Age Bracket | Public Insurance | Private Insurance |
| Under 6 | 285 (62.8%) | 179 (39.4%) |
| 6 to 18 Years | 425 (44.1%) | 548 (56.9%) |
| 19 to 25 Years | 0 (0.0%) | 208 (95.0%) |
| 25 to 34 Years | 92 (13.7%) | 531 (79.2%) |
| 35 to 44 Years | 33 (9.3%) | 301 (84.8%) |
| 45 to 54 Years | 170 (43.5%) | 215 (55.0%) |
| 55 to 64 Years | 98 (13.3%) | 649 (88.3%) |
| 65 to 74 Years | 237 (94.1%) | 141 (55.9%) |
| 75 Years and over | 306 (100.0%) | 260 (85.0%) |
| Total | 1,646 (37.9%) | 3,032 (69.8%) |
Disability Status by Sex by Age in Oak Valley
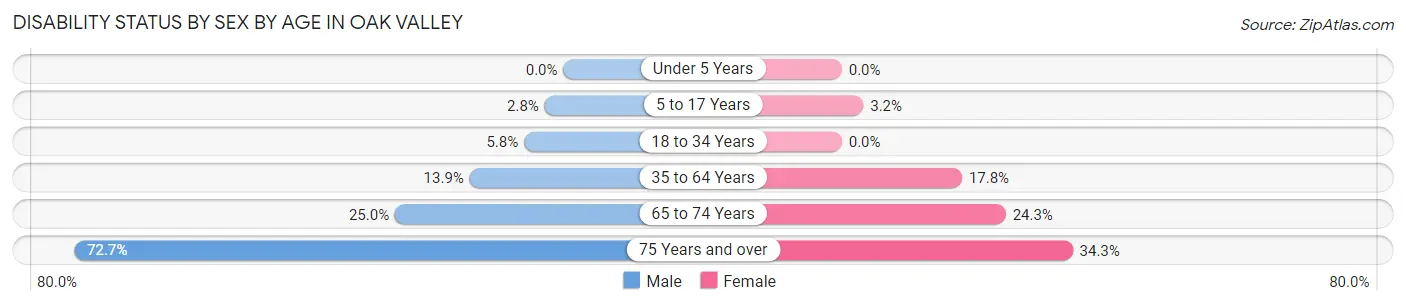
| Age Bracket | Male | Female |
| Under 5 Years | 0 (0.0%) | 0 (0.0%) |
| 5 to 17 Years | 13 (2.8%) | 13 (3.2%) |
| 18 to 34 Years | 36 (5.8%) | 0 (0.0%) |
| 35 to 64 Years | 89 (13.9%) | 150 (17.8%) |
| 65 to 74 Years | 25 (25.0%) | 37 (24.3%) |
| 75 Years and over | 93 (72.7%) | 61 (34.3%) |
Disability Class by Sex by Age in Oak Valley
Disability Class: Hearing Difficulty
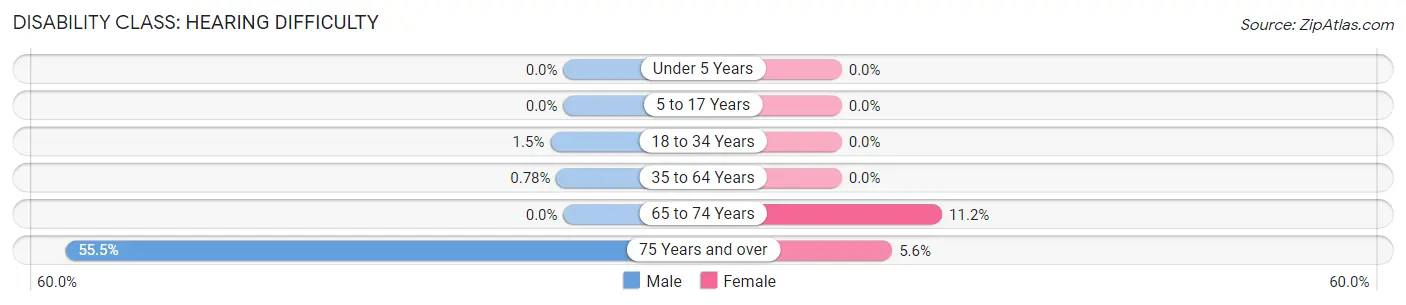
| Age Bracket | Male | Female |
| Under 5 Years | 0 (0.0%) | 0 (0.0%) |
| 5 to 17 Years | 0 (0.0%) | 0 (0.0%) |
| 18 to 34 Years | 9 (1.5%) | 0 (0.0%) |
| 35 to 64 Years | 5 (0.8%) | 0 (0.0%) |
| 65 to 74 Years | 0 (0.0%) | 17 (11.2%) |
| 75 Years and over | 71 (55.5%) | 10 (5.6%) |
Disability Class: Vision Difficulty
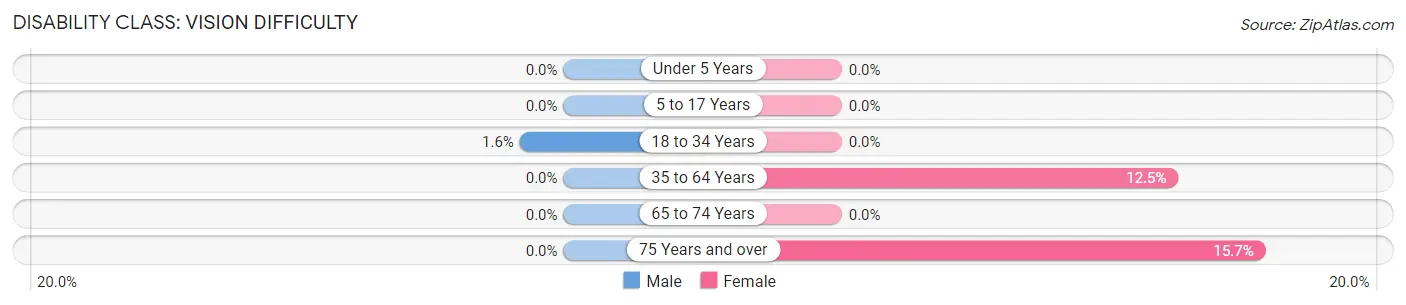
| Age Bracket | Male | Female |
| Under 5 Years | 0 (0.0%) | 0 (0.0%) |
| 5 to 17 Years | 0 (0.0%) | 0 (0.0%) |
| 18 to 34 Years | 10 (1.6%) | 0 (0.0%) |
| 35 to 64 Years | 0 (0.0%) | 105 (12.5%) |
| 65 to 74 Years | 0 (0.0%) | 0 (0.0%) |
| 75 Years and over | 0 (0.0%) | 28 (15.7%) |
Disability Class: Cognitive Difficulty
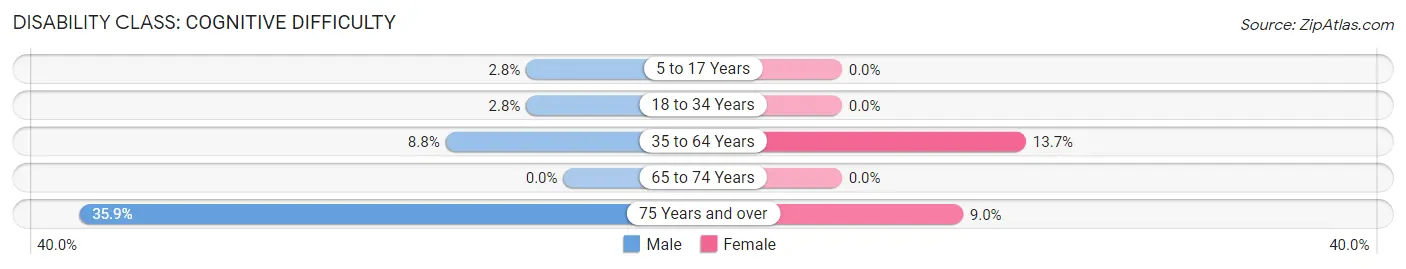
| Age Bracket | Male | Female |
| 5 to 17 Years | 13 (2.8%) | 0 (0.0%) |
| 18 to 34 Years | 17 (2.8%) | 0 (0.0%) |
| 35 to 64 Years | 56 (8.7%) | 115 (13.7%) |
| 65 to 74 Years | 0 (0.0%) | 0 (0.0%) |
| 75 Years and over | 46 (35.9%) | 16 (9.0%) |
Disability Class: Ambulatory Difficulty
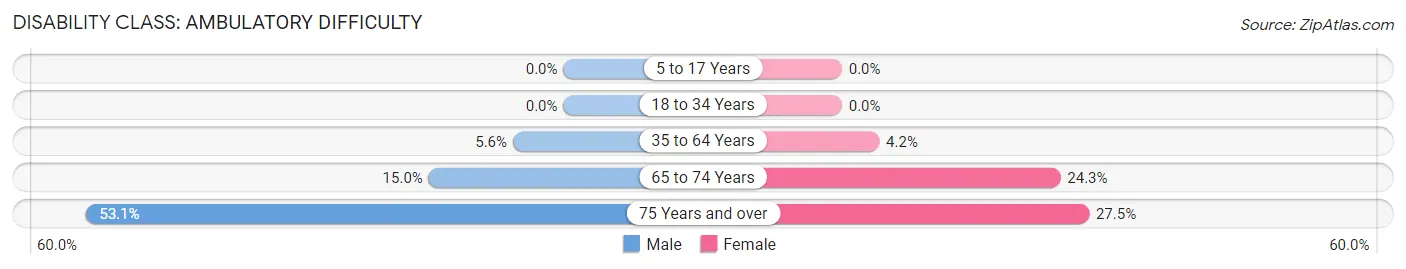
| Age Bracket | Male | Female |
| 5 to 17 Years | 0 (0.0%) | 0 (0.0%) |
| 18 to 34 Years | 0 (0.0%) | 0 (0.0%) |
| 35 to 64 Years | 36 (5.6%) | 35 (4.2%) |
| 65 to 74 Years | 15 (15.0%) | 37 (24.3%) |
| 75 Years and over | 68 (53.1%) | 49 (27.5%) |
Disability Class: Self-Care Difficulty
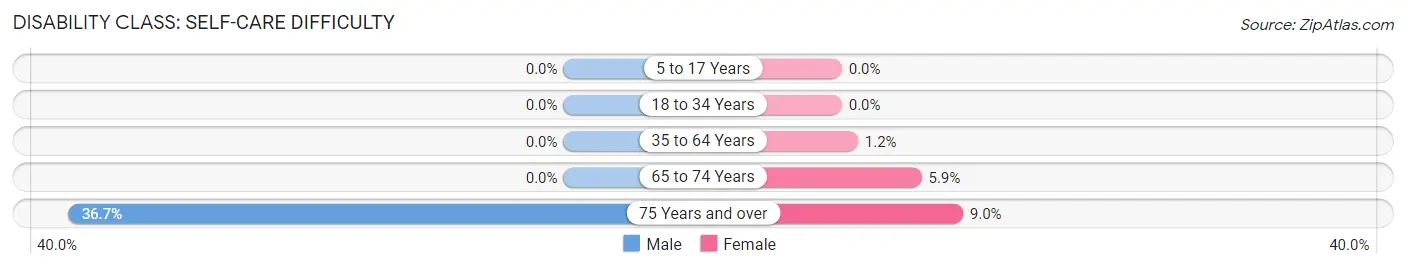
| Age Bracket | Male | Female |
| 5 to 17 Years | 0 (0.0%) | 0 (0.0%) |
| 18 to 34 Years | 0 (0.0%) | 0 (0.0%) |
| 35 to 64 Years | 0 (0.0%) | 10 (1.2%) |
| 65 to 74 Years | 0 (0.0%) | 9 (5.9%) |
| 75 Years and over | 47 (36.7%) | 16 (9.0%) |
Technology Access in Oak Valley
Computing Device Access in Oak Valley
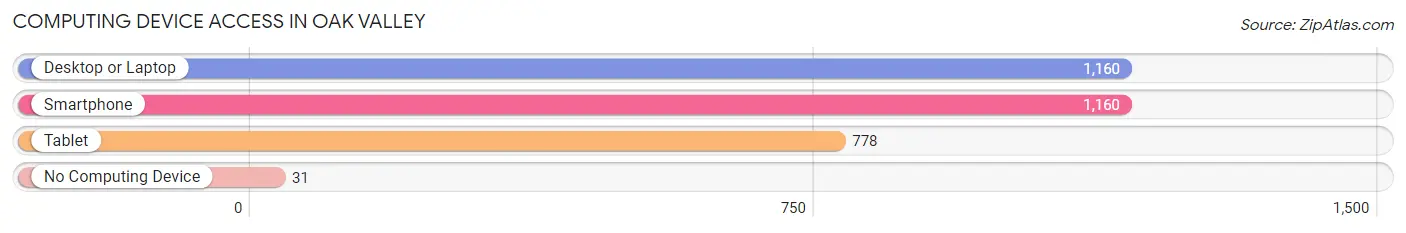
| Device Type | # Households | % Households |
| Desktop or Laptop | 1,160 | 88.5% |
| Smartphone | 1,160 | 88.5% |
| Tablet | 778 | 59.4% |
| No Computing Device | 31 | 2.4% |
| Total | 1,310 | 100.0% |
Internet Access in Oak Valley
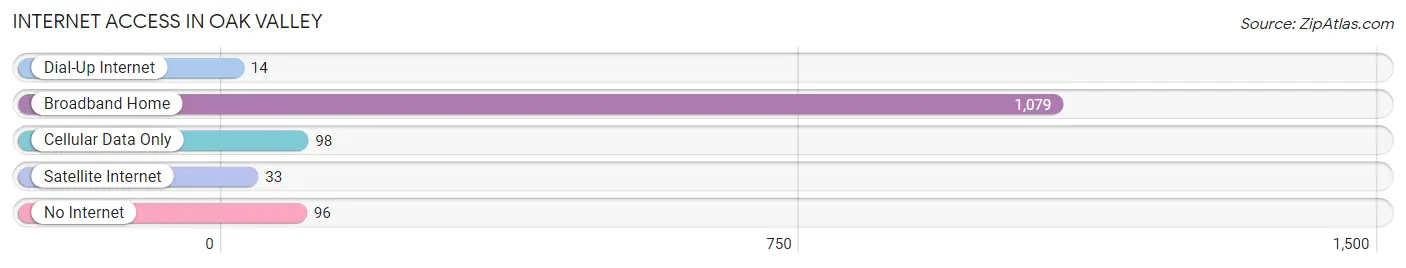
| Internet Type | # Households | % Households |
| Dial-Up Internet | 14 | 1.1% |
| Broadband Home | 1,079 | 82.4% |
| Cellular Data Only | 98 | 7.5% |
| Satellite Internet | 33 | 2.5% |
| No Internet | 96 | 7.3% |
| Total | 1,310 | 100.0% |
Oak Valley Summary
Oak Valley is a small borough located in Burlington County, New Jersey. It is situated in the Delaware Valley region of the state, and is part of the Philadelphia metropolitan area. The borough was incorporated in 1891, and is home to a population of approximately 2,000 people.
Geography
Oak Valley is located in the Delaware Valley region of New Jersey, and is situated in the southern part of Burlington County. It is bordered by the townships of Evesham, Mount Laurel, and Medford. The borough is located approximately 25 miles east of Philadelphia, and is accessible via the New Jersey Turnpike and Interstate 295. The borough is situated on a flat terrain, and is surrounded by a mix of residential and commercial development.
Climate
Oak Valley has a humid subtropical climate, with hot and humid summers and cold winters. The average annual temperature is around 54 degrees Fahrenheit, with average highs in the summer reaching around 85 degrees Fahrenheit and average lows in the winter reaching around 25 degrees Fahrenheit. The borough receives an average of 45 inches of precipitation per year, with the majority of it falling in the form of rain.
Demographics
As of the 2010 census, Oak Valley had a population of 2,000 people. The racial makeup of the borough was 94.2% White, 2.2% African American, 0.7% Asian, 0.5% from other races, and 2.4% from two or more races. Hispanic or Latino of any race were 2.2% of the population.
The median household income in Oak Valley was $68,750, and the median family income was $76,250. The per capita income for the borough was $30,945. About 4.2% of families and 5.2% of the population were below the poverty line, including 6.2% of those under age 18 and 4.2% of those age 65 or over.
Economy
Oak Valley is primarily a residential community, with most of its residents commuting to nearby cities for work. The borough does not have any major employers, but there are several small businesses located in the area. These include restaurants, retail stores, and professional services.
The borough is also home to a number of parks and recreational facilities, including a public golf course, a public pool, and several parks and playgrounds.
History
Oak Valley was first settled in the late 1700s by a group of Quakers from Pennsylvania. The borough was officially incorporated in 1891, and was named after the oak trees that grew in the area.
In the early 1900s, the borough was home to a number of small farms and businesses. The borough also had a number of small factories, including a paper mill and a brickyard.
In the 1950s, the borough began to experience a period of growth and development. This included the construction of new homes and businesses, as well as the expansion of existing ones.
Today, Oak Valley is a small residential community with a strong sense of community. The borough is home to a number of parks and recreational facilities, as well as a variety of small businesses.
Common Questions
What is the Total Population of Oak Valley?
Total Population of Oak Valley is 4,346.
What is the Total Male Population of Oak Valley?
Total Male Population of Oak Valley is 2,269.
What is the Total Female Population of Oak Valley?
Total Female Population of Oak Valley is 2,077.
What is the Ratio of Males per 100 Females in Oak Valley?
There are 109.24 Males per 100 Females in Oak Valley.
What is the Ratio of Females per 100 Males in Oak Valley?
There are 91.54 Females per 100 Males in Oak Valley.
What is the Median Population Age in Oak Valley?
Median Population Age in Oak Valley is 32.8 Years.
What is the Average Family Size in Oak Valley
Average Family Size in Oak Valley is 3.7 People.
What is the Average Household Size in Oak Valley
Average Household Size in Oak Valley is 3.3 People.
What is Per Capita Income in Oak Valley?
Per Capita income in Oak Valley is $30,598.
What is the Median Family Income in Oak Valley?
Median Family Income in Oak Valley is $101,275.
What is the Median Household income in Oak Valley?
Median Household Income in Oak Valley is $86,875.
What is Income or Wage Gap in Oak Valley?
Income or Wage Gap in Oak Valley is 30.4%.
Women in Oak Valley earn 69.6 cents for every dollar earned by a man.
What is Inequality or Gini Index in Oak Valley?
Inequality or Gini Index in Oak Valley is 0.34.
How Large is the Labor Force in Oak Valley?
There are 2,105 People in the Labor Forcein in Oak Valley.
What is the Percentage of People in the Labor Force in Oak Valley?
65.3% of People are in the Labor Force in Oak Valley.
What is the Unemployment Rate in Oak Valley?
Unemployment Rate in Oak Valley is 3.8%.