Duck, NC
Duck Map
Duck Overview
686
TOTAL POPULATION
323
MALE POPULATION
363
FEMALE POPULATION
88.98
MALES / 100 FEMALES
112.38
FEMALES / 100 MALES
57.1
MEDIAN AGE
2.6
AVG FAMILY SIZE
2.2
AVG HOUSEHOLD SIZE
$71,337
PER CAPITA INCOME
$139,318
AVG FAMILY INCOME
$122,500
AVG HOUSEHOLD INCOME
76.1%
WAGE / INCOME GAP [ % ]
23.9¢/ $1
WAGE / INCOME GAP [ $ ]
$5,383
FAMILY INCOME DEFICIT
0.47
INEQUALITY / GINI INDEX
288
LABOR FORCE [ PEOPLE ]
47.1%
PERCENT IN LABOR FORCE
1.4%
UNEMPLOYMENT RATE
Duck Area Codes
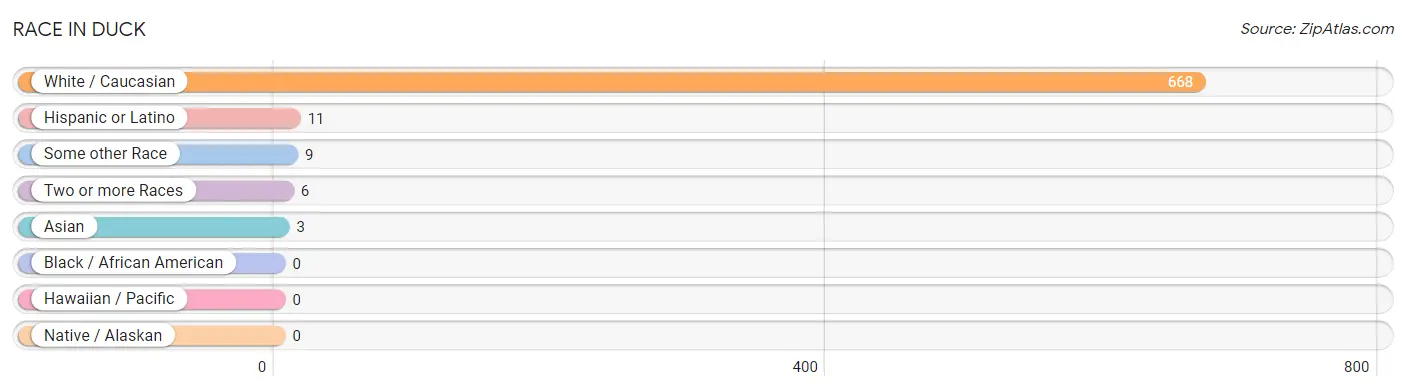
Race in Duck
The most populous races in Duck are White / Caucasian (668 | 97.4%), Hispanic or Latino (11 | 1.6%), and Some other Race (9 | 1.3%).
| Race | # Population | % Population |
| Asian | 3 | 0.4% |
| Black / African American | 0 | 0.0% |
| Hawaiian / Pacific | 0 | 0.0% |
| Hispanic or Latino | 11 | 1.6% |
| Native / Alaskan | 0 | 0.0% |
| White / Caucasian | 668 | 97.4% |
| Two or more Races | 6 | 0.9% |
| Some other Race | 9 | 1.3% |
| Total | 686 | 100.0% |
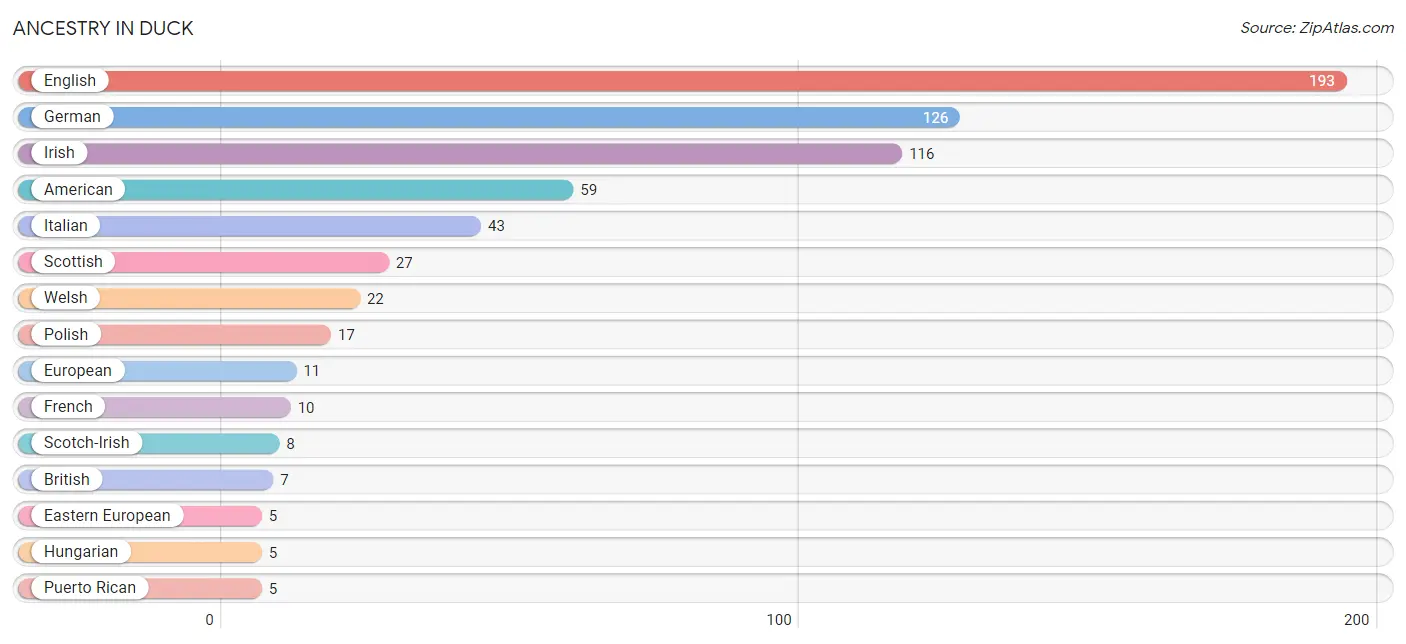
Ancestry in Duck
The most populous ancestries reported in Duck are English (193 | 28.1%), German (126 | 18.4%), Irish (116 | 16.9%), American (59 | 8.6%), and Italian (43 | 6.3%), together accounting for 78.3% of all Duck residents.
| Ancestry | # Population | % Population |
| American | 59 | 8.6% |
| Arab | 1 | 0.2% |
| Australian | 2 | 0.3% |
| British | 7 | 1.0% |
| Burmese | 3 | 0.4% |
| Cherokee | 3 | 0.4% |
| Colombian | 2 | 0.3% |
| Cuban | 4 | 0.6% |
| Dutch | 3 | 0.4% |
| Eastern European | 5 | 0.7% |
| Egyptian | 1 | 0.2% |
| English | 193 | 28.1% |
| European | 11 | 1.6% |
| French | 10 | 1.5% |
| French Canadian | 4 | 0.6% |
| German | 126 | 18.4% |
| Hungarian | 5 | 0.7% |
| Irish | 116 | 16.9% |
| Italian | 43 | 6.3% |
| Pennsylvania German | 1 | 0.2% |
| Polish | 17 | 2.5% |
| Puerto Rican | 5 | 0.7% |
| Russian | 4 | 0.6% |
| Scotch-Irish | 8 | 1.2% |
| Scottish | 27 | 3.9% |
| Slovak | 2 | 0.3% |
| South American | 2 | 0.3% |
| Sri Lankan | 1 | 0.2% |
| Swedish | 1 | 0.2% |
| Welsh | 22 | 3.2% | View All 30 Rows |
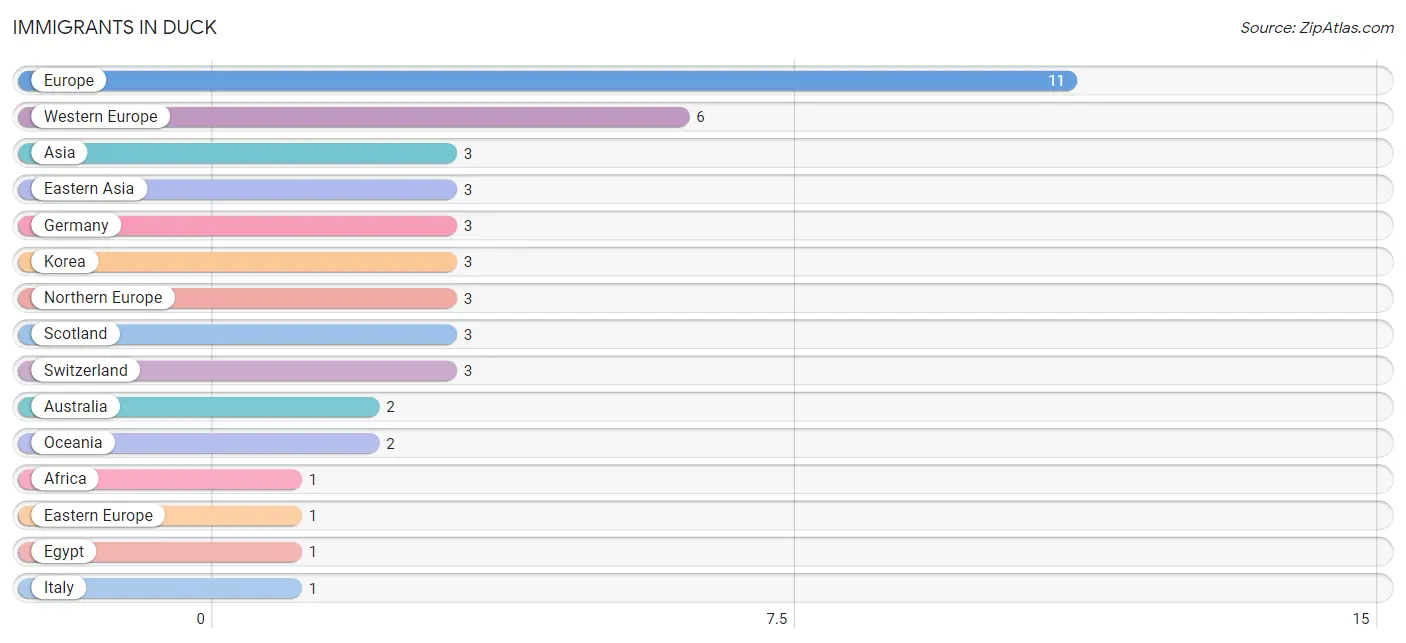
Immigrants in Duck
The most numerous immigrant groups reported in Duck came from Europe (11 | 1.6%), Western Europe (6 | 0.9%), Asia (3 | 0.4%), Eastern Asia (3 | 0.4%), and Germany (3 | 0.4%), together accounting for 3.8% of all Duck residents.
| Immigration Origin | # Population | % Population |
| Africa | 1 | 0.2% |
| Asia | 3 | 0.4% |
| Australia | 2 | 0.3% |
| Eastern Asia | 3 | 0.4% |
| Eastern Europe | 1 | 0.2% |
| Egypt | 1 | 0.2% |
| Europe | 11 | 1.6% |
| Germany | 3 | 0.4% |
| Italy | 1 | 0.2% |
| Korea | 3 | 0.4% |
| Northern Africa | 1 | 0.2% |
| Northern Europe | 3 | 0.4% |
| Oceania | 2 | 0.3% |
| Russia | 1 | 0.2% |
| Scotland | 3 | 0.4% |
| Southern Europe | 1 | 0.2% |
| Switzerland | 3 | 0.4% |
| Western Europe | 6 | 0.9% | View All 18 Rows |
Sex and Age in Duck
Sex and Age in Duck
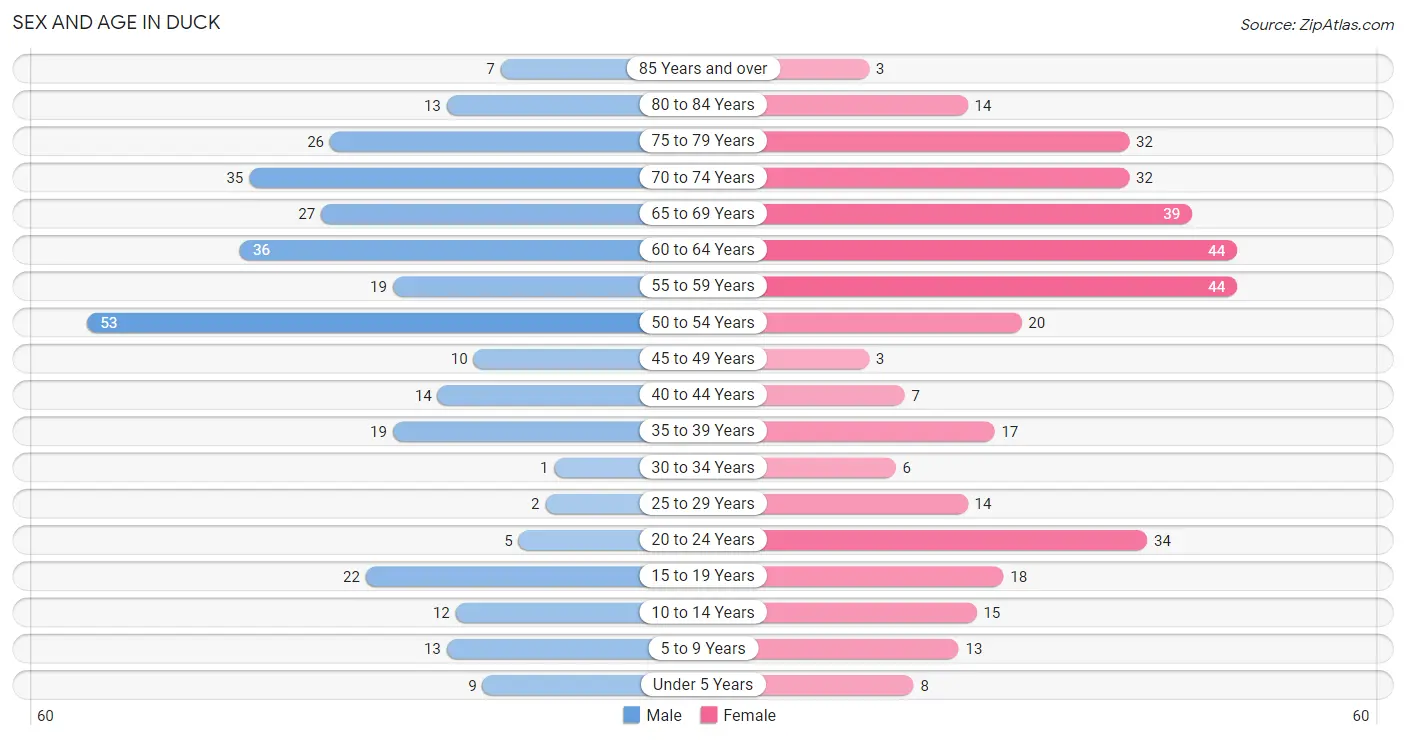
The most populous age groups in Duck are 50 to 54 Years (53 | 16.4%) for men and 55 to 59 Years (44 | 12.1%) for women.
| Age Bracket | Male | Female |
| Under 5 Years | 9 (2.8%) | 8 (2.2%) |
| 5 to 9 Years | 13 (4.0%) | 13 (3.6%) |
| 10 to 14 Years | 12 (3.7%) | 15 (4.1%) |
| 15 to 19 Years | 22 (6.8%) | 18 (5.0%) |
| 20 to 24 Years | 5 (1.5%) | 34 (9.4%) |
| 25 to 29 Years | 2 (0.6%) | 14 (3.9%) |
| 30 to 34 Years | 1 (0.3%) | 6 (1.7%) |
| 35 to 39 Years | 19 (5.9%) | 17 (4.7%) |
| 40 to 44 Years | 14 (4.3%) | 7 (1.9%) |
| 45 to 49 Years | 10 (3.1%) | 3 (0.8%) |
| 50 to 54 Years | 53 (16.4%) | 20 (5.5%) |
| 55 to 59 Years | 19 (5.9%) | 44 (12.1%) |
| 60 to 64 Years | 36 (11.2%) | 44 (12.1%) |
| 65 to 69 Years | 27 (8.4%) | 39 (10.7%) |
| 70 to 74 Years | 35 (10.8%) | 32 (8.8%) |
| 75 to 79 Years | 26 (8.1%) | 32 (8.8%) |
| 80 to 84 Years | 13 (4.0%) | 14 (3.9%) |
| 85 Years and over | 7 (2.2%) | 3 (0.8%) |
| Total | 323 (100.0%) | 363 (100.0%) |
Families and Households in Duck
Median Family Size in Duck
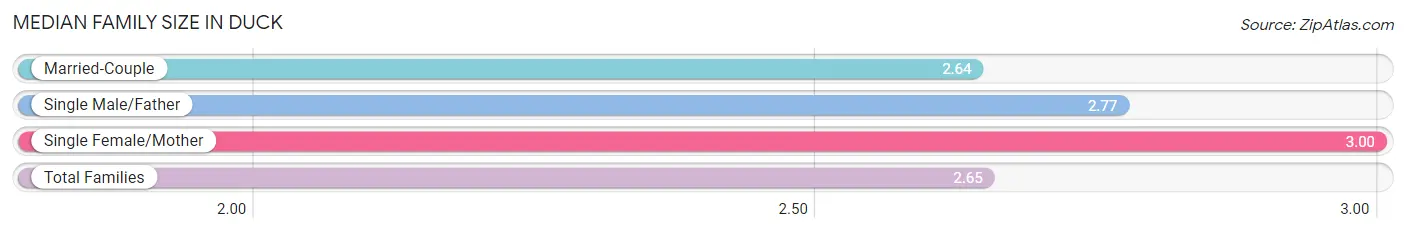
The median family size in Duck is 2.65 persons per family, with single female/mother families (2 | 1.0%) accounting for the largest median family size of 3 persons per family. On the other hand, married-couple families (183 | 92.4%) represent the smallest median family size with 2.64 persons per family.
| Family Type | # Families | Family Size |
| Married-Couple | 183 (92.4%) | 2.64 |
| Single Male/Father | 13 (6.6%) | 2.77 |
| Single Female/Mother | 2 (1.0%) | 3.00 |
| Total Families | 198 (100.0%) | 2.65 |
Median Household Size in Duck
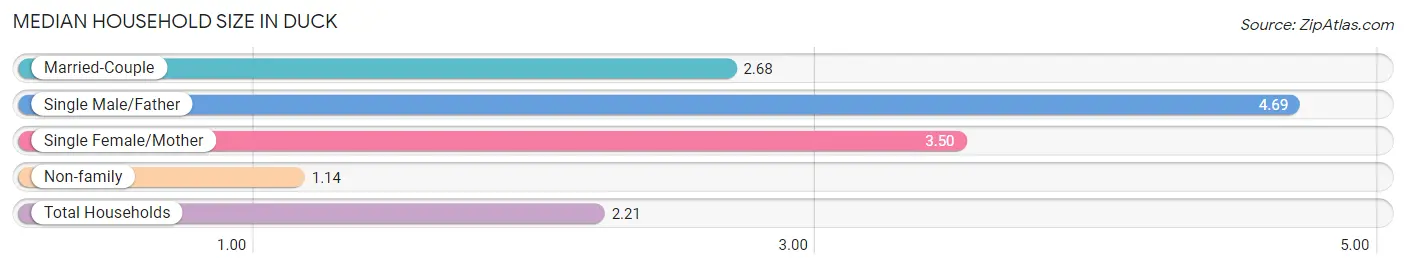
The median household size in Duck is 2.21 persons per household, with single male/father households (13 | 4.2%) accounting for the largest median household size of 4.69 persons per household. non-family households (112 | 36.1%) represent the smallest median household size with 1.14 persons per household.
| Household Type | # Households | Household Size |
| Married-Couple | 183 (59.0%) | 2.68 |
| Single Male/Father | 13 (4.2%) | 4.69 |
| Single Female/Mother | 2 (0.6%) | 3.50 |
| Non-family | 112 (36.1%) | 1.14 |
| Total Households | 310 (100.0%) | 2.21 |
Household Size by Marriage Status in Duck
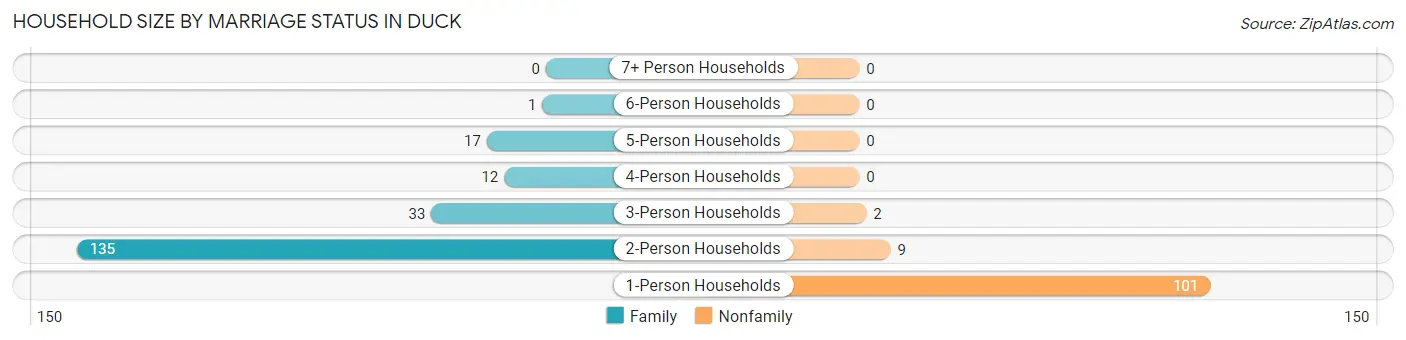
Out of a total of 310 households in Duck, 198 (63.9%) are family households, while 112 (36.1%) are nonfamily households. The most numerous type of family households are 2-person households, comprising 135, and the most common type of nonfamily households are 1-person households, comprising 101.
| Household Size | Family Households | Nonfamily Households |
| 1-Person Households | - | 101 (32.6%) |
| 2-Person Households | 135 (43.5%) | 9 (2.9%) |
| 3-Person Households | 33 (10.6%) | 2 (0.6%) |
| 4-Person Households | 12 (3.9%) | 0 (0.0%) |
| 5-Person Households | 17 (5.5%) | 0 (0.0%) |
| 6-Person Households | 1 (0.3%) | 0 (0.0%) |
| 7+ Person Households | 0 (0.0%) | 0 (0.0%) |
| Total | 198 (63.9%) | 112 (36.1%) |
Female Fertility in Duck
Fertility by Age in Duck
| Age Bracket | Women with Births | Births / 1,000 Women |
| 15 to 19 years | 0 (0.0%) | 0.0 |
| 20 to 34 years | 0 (0.0%) | 0.0 |
| 35 to 50 years | 0 (0.0%) | 0.0 |
| Total | 0 (0.0%) | 0.0 |
Fertility by Age by Marriage Status in Duck
| Age Bracket | Married | Unmarried |
| 15 to 19 years | 0 (0.0%) | 0 (0.0%) |
| 20 to 34 years | 0 (0.0%) | 0 (0.0%) |
| 35 to 50 years | 0 (0.0%) | 0 (0.0%) |
| Total | 0 (0.0%) | 0 (0.0%) |
Fertility by Education in Duck
| Educational Attainment | Women with Births | Births / 1,000 Women |
| Less than High School | 0 (0.0%) | 0.0 |
| High School Diploma | 0 (0.0%) | 0.0 |
| College or Associate's Degree | 0 (0.0%) | 0.0 |
| Bachelor's Degree | 0 (0.0%) | 0.0 |
| Graduate Degree | 0 (0.0%) | 0.0 |
| Total | 0 (0.0%) | 0.0 |
Fertility by Education by Marriage Status in Duck
| Educational Attainment | Married | Unmarried |
| Less than High School | 0 (0.0%) | 0 (0.0%) |
| High School Diploma | 0 (0.0%) | 0 (0.0%) |
| College or Associate's Degree | 0 (0.0%) | 0 (0.0%) |
| Bachelor's Degree | 0 (0.0%) | 0 (0.0%) |
| Graduate Degree | 0 (0.0%) | 0 (0.0%) |
| Total | 0 (0.0%) | 0 (0.0%) |
Income in Duck
Income Overview in Duck
Per Capita Income in Duck is $71,337, while median incomes of families and households are $139,318 and $122,500 respectively.
| Characteristic | Number | Measure |
| Per Capita Income | 686 | $71,337 |
| Median Family Income | 198 | $139,318 |
| Mean Family Income | 198 | $184,995 |
| Median Household Income | 310 | $122,500 |
| Mean Household Income | 310 | $153,990 |
| Income Deficit | 198 | $5,383 |
| Wage / Income Gap (%) | 686 | 76.10% |
| Wage / Income Gap ($) | 686 | 23.90¢ per $1 |
| Gini / Inequality Index | 686 | 0.47 |
Earnings by Sex in Duck
Average Earnings in Duck are $43,333, $66,250 for men and $15,833 for women, a difference of 76.1%.
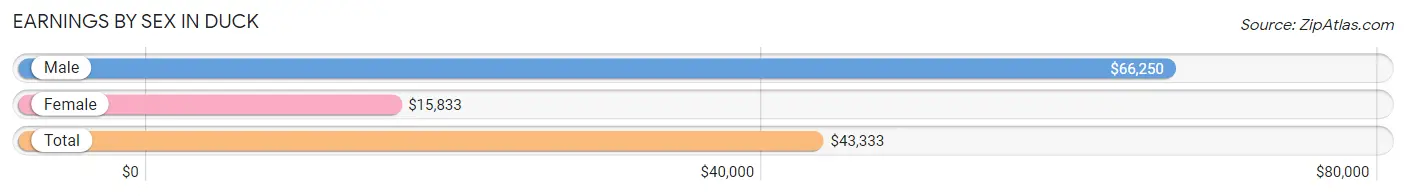
| Sex | Number | Average Earnings |
| Male | 190 (55.9%) | $66,250 |
| Female | 150 (44.1%) | $15,833 |
| Total | 340 (100.0%) | $43,333 |
Earnings by Sex by Income Bracket in Duck
The most common earnings brackets in Duck are $100,000+ for men (79 | 41.6%) and $5,000 to $7,499 for women (22 | 14.7%).
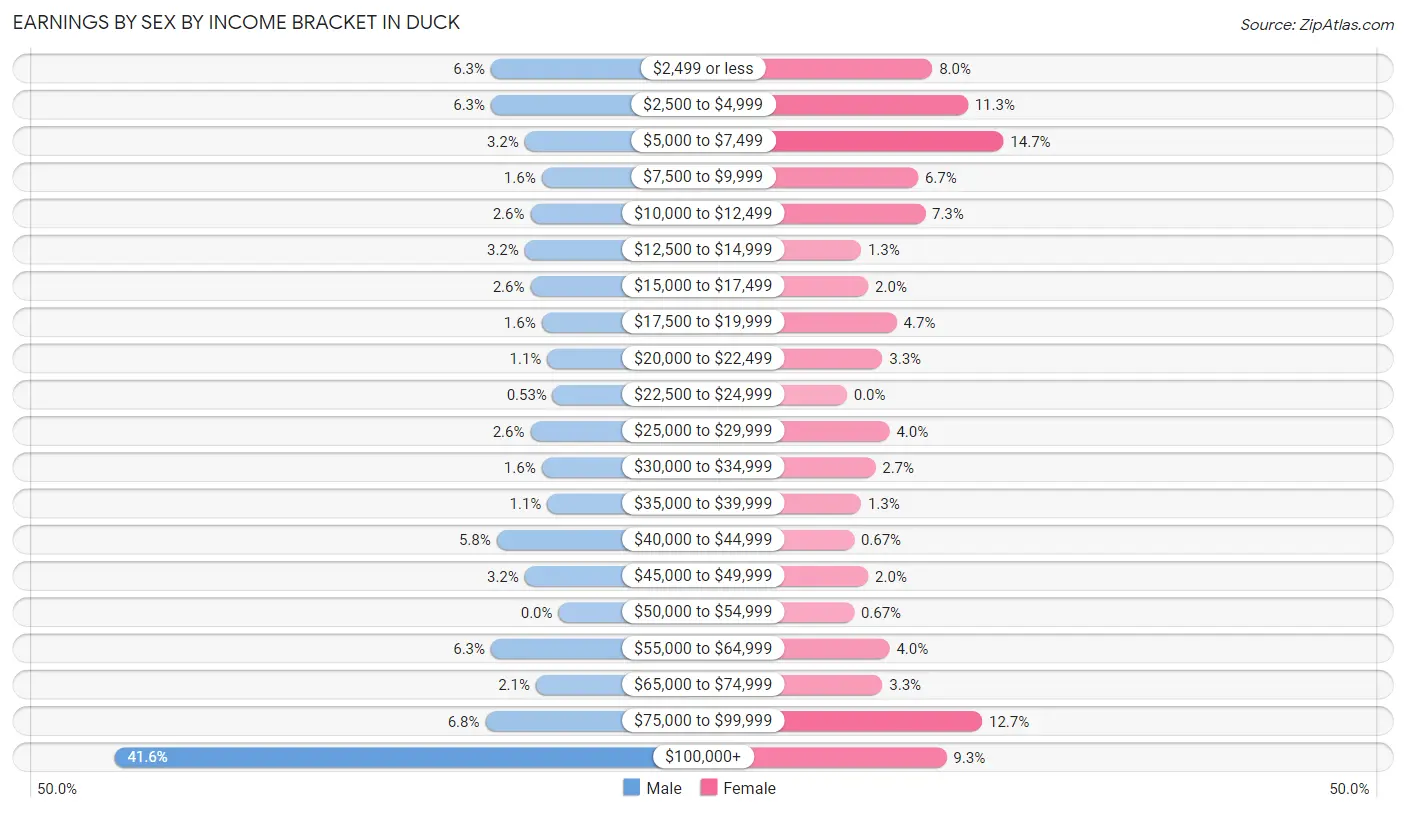
| Income | Male | Female |
| $2,499 or less | 12 (6.3%) | 12 (8.0%) |
| $2,500 to $4,999 | 12 (6.3%) | 17 (11.3%) |
| $5,000 to $7,499 | 6 (3.2%) | 22 (14.7%) |
| $7,500 to $9,999 | 3 (1.6%) | 10 (6.7%) |
| $10,000 to $12,499 | 5 (2.6%) | 11 (7.3%) |
| $12,500 to $14,999 | 6 (3.2%) | 2 (1.3%) |
| $15,000 to $17,499 | 5 (2.6%) | 3 (2.0%) |
| $17,500 to $19,999 | 3 (1.6%) | 7 (4.7%) |
| $20,000 to $22,499 | 2 (1.1%) | 5 (3.3%) |
| $22,500 to $24,999 | 1 (0.5%) | 0 (0.0%) |
| $25,000 to $29,999 | 5 (2.6%) | 6 (4.0%) |
| $30,000 to $34,999 | 3 (1.6%) | 4 (2.7%) |
| $35,000 to $39,999 | 2 (1.1%) | 2 (1.3%) |
| $40,000 to $44,999 | 11 (5.8%) | 1 (0.7%) |
| $45,000 to $49,999 | 6 (3.2%) | 3 (2.0%) |
| $50,000 to $54,999 | 0 (0.0%) | 1 (0.7%) |
| $55,000 to $64,999 | 12 (6.3%) | 6 (4.0%) |
| $65,000 to $74,999 | 4 (2.1%) | 5 (3.3%) |
| $75,000 to $99,999 | 13 (6.8%) | 19 (12.7%) |
| $100,000+ | 79 (41.6%) | 14 (9.3%) |
| Total | 190 (100.0%) | 150 (100.0%) |
Earnings by Sex by Educational Attainment in Duck
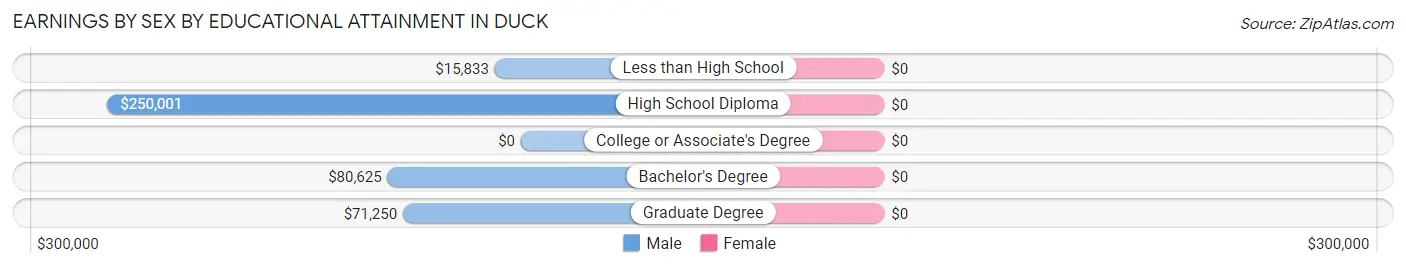
| Educational Attainment | Male Income | Female Income |
| Less than High School | $15,833 | $0 |
| High School Diploma | $250,001 | $0 |
| College or Associate's Degree | - | - |
| Bachelor's Degree | $80,625 | $0 |
| Graduate Degree | $71,250 | $0 |
| Total | $90,750 | $21,750 |
Family Income in Duck
Family Income Brackets in Duck
According to the Duck family income data, there are 56 families falling into the $200,000+ income range, which is the most common income bracket and makes up 28.3% of all families. Conversely, the less than $10,000 income bracket is the least frequent group with only 1 families (0.5%) belonging to this category.
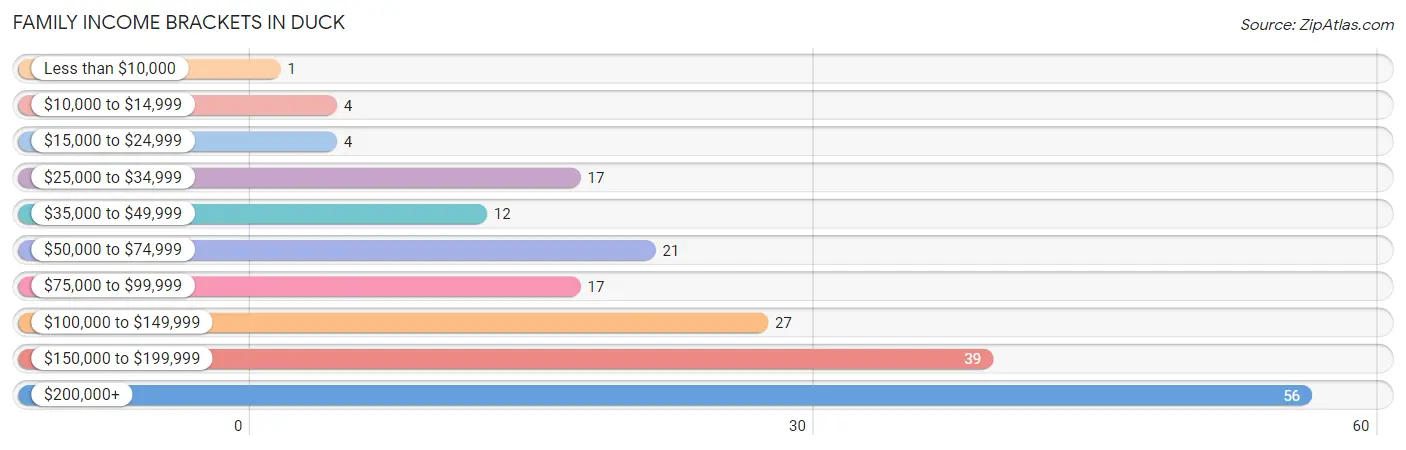
| Income Bracket | # Families | % Families |
| Less than $10,000 | 1 | 0.5% |
| $10,000 to $14,999 | 4 | 2.0% |
| $15,000 to $24,999 | 4 | 2.0% |
| $25,000 to $34,999 | 17 | 8.6% |
| $35,000 to $49,999 | 12 | 6.1% |
| $50,000 to $74,999 | 21 | 10.6% |
| $75,000 to $99,999 | 17 | 8.6% |
| $100,000 to $149,999 | 27 | 13.6% |
| $150,000 to $199,999 | 39 | 19.7% |
| $200,000+ | 56 | 28.3% |
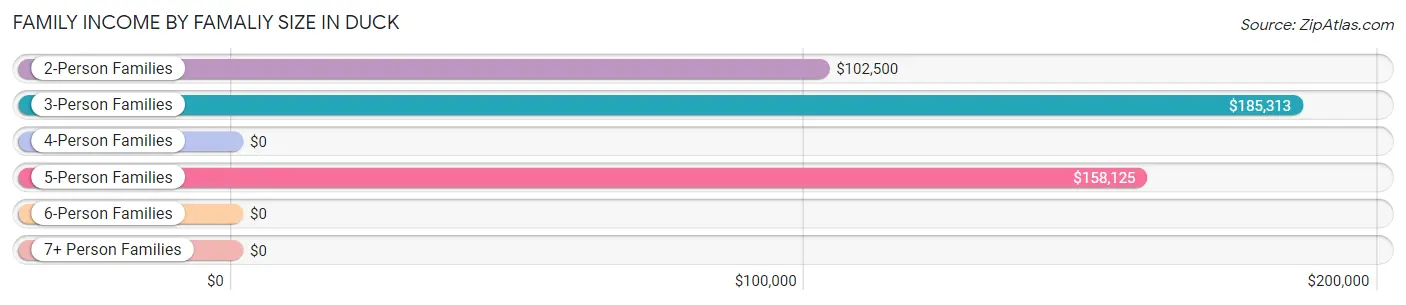
Family Income by Famaliy Size in Duck
3-person families (27 | 13.6%) account for the highest median family income in Duck with $185,313 per family, while 3-person families (27 | 13.6%) have the highest median income of $61,771 per family member.
| Income Bracket | # Families | Median Income |
| 2-Person Families | 146 (73.7%) | $102,500 |
| 3-Person Families | 27 (13.6%) | $185,313 |
| 4-Person Families | 8 (4.0%) | $0 |
| 5-Person Families | 17 (8.6%) | $158,125 |
| 6-Person Families | 0 (0.0%) | $0 |
| 7+ Person Families | 0 (0.0%) | $0 |
| Total | 198 (100.0%) | $139,318 |
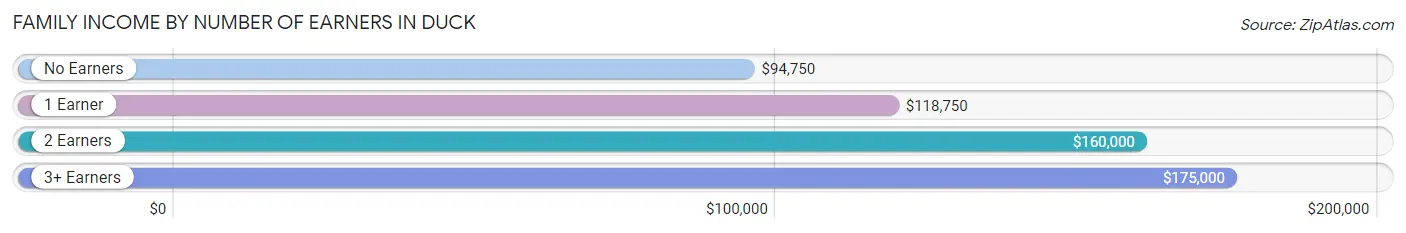
Family Income by Number of Earners in Duck
The median family income in Duck is $139,318, with families comprising 3+ earners (10) having the highest median family income of $175,000, while families with no earners (69) have the lowest median family income of $94,750, accounting for 5.1% and 34.8% of families, respectively.
| Number of Earners | # Families | Median Income |
| No Earners | 69 (34.8%) | $94,750 |
| 1 Earner | 53 (26.8%) | $118,750 |
| 2 Earners | 66 (33.3%) | $160,000 |
| 3+ Earners | 10 (5.1%) | $175,000 |
| Total | 198 (100.0%) | $139,318 |
Household Income in Duck
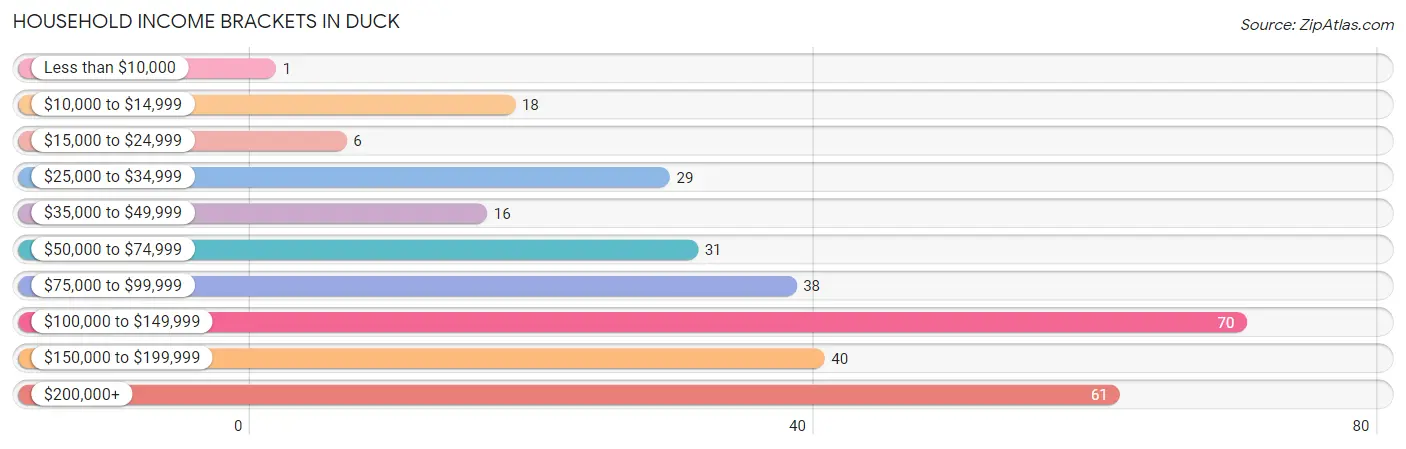
Household Income Brackets in Duck
With 70 households falling in the category, the $100,000 to $149,999 income range is the most frequent in Duck, accounting for 22.6% of all households. In contrast, only 1 households (0.3%) fall into the less than $10,000 income bracket, making it the least populous group.
| Income Bracket | # Households | % Households |
| Less than $10,000 | 1 | 0.3% |
| $10,000 to $14,999 | 18 | 5.8% |
| $15,000 to $24,999 | 6 | 1.9% |
| $25,000 to $34,999 | 29 | 9.4% |
| $35,000 to $49,999 | 16 | 5.2% |
| $50,000 to $74,999 | 31 | 10.0% |
| $75,000 to $99,999 | 38 | 12.3% |
| $100,000 to $149,999 | 70 | 22.6% |
| $150,000 to $199,999 | 40 | 12.9% |
| $200,000+ | 61 | 19.7% |
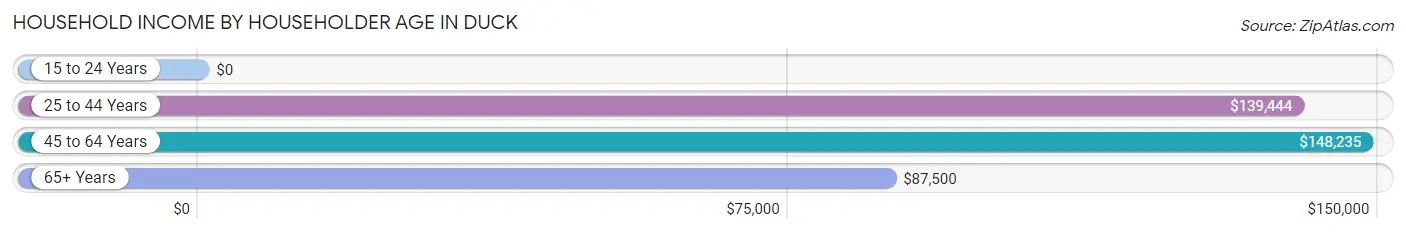
Household Income by Householder Age in Duck
The median household income in Duck is $122,500, with the highest median household income of $148,235 found in the 45 to 64 years age bracket for the primary householder. A total of 132 households (42.6%) fall into this category.
| Income Bracket | # Households | Median Income |
| 15 to 24 Years | 0 (0.0%) | $0 |
| 25 to 44 Years | 36 (11.6%) | $139,444 |
| 45 to 64 Years | 132 (42.6%) | $148,235 |
| 65+ Years | 142 (45.8%) | $87,500 |
| Total | 310 (100.0%) | $122,500 |
Poverty in Duck
Income Below Poverty by Sex and Age in Duck
With 6.8% poverty level for males and 12.4% for females among the residents of Duck, 65 to 74 year old males and 18 to 24 year old females are the most vulnerable to poverty, with 7 males (11.3%) and 28 females (71.8%) in their respective age groups living below the poverty level.
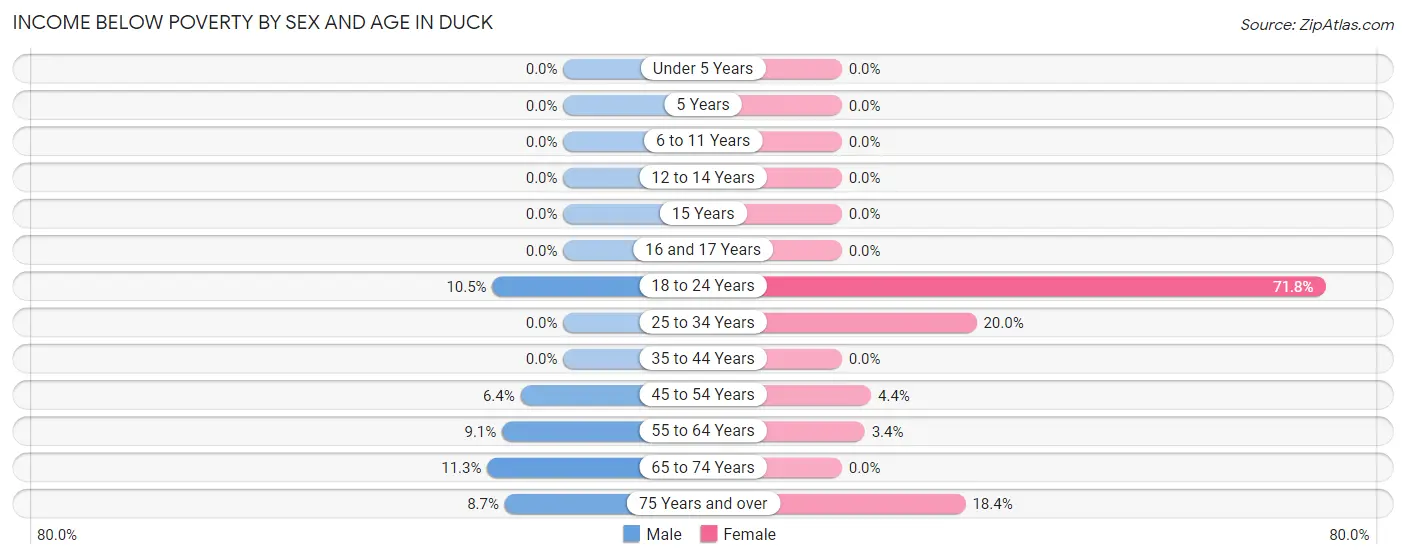
| Age Bracket | Male | Female |
| Under 5 Years | 0 (0.0%) | 0 (0.0%) |
| 5 Years | 0 (0.0%) | 0 (0.0%) |
| 6 to 11 Years | 0 (0.0%) | 0 (0.0%) |
| 12 to 14 Years | 0 (0.0%) | 0 (0.0%) |
| 15 Years | 0 (0.0%) | 0 (0.0%) |
| 16 and 17 Years | 0 (0.0%) | 0 (0.0%) |
| 18 to 24 Years | 2 (10.5%) | 28 (71.8%) |
| 25 to 34 Years | 0 (0.0%) | 4 (20.0%) |
| 35 to 44 Years | 0 (0.0%) | 0 (0.0%) |
| 45 to 54 Years | 4 (6.4%) | 1 (4.3%) |
| 55 to 64 Years | 5 (9.1%) | 3 (3.4%) |
| 65 to 74 Years | 7 (11.3%) | 0 (0.0%) |
| 75 Years and over | 4 (8.7%) | 9 (18.4%) |
| Total | 22 (6.8%) | 45 (12.4%) |
Income Above Poverty by Sex and Age in Duck
According to the poverty statistics in Duck, males aged under 5 years and females aged under 5 years are the age groups that are most secure financially, with 100.0% of males and 100.0% of females in these age groups living above the poverty line.
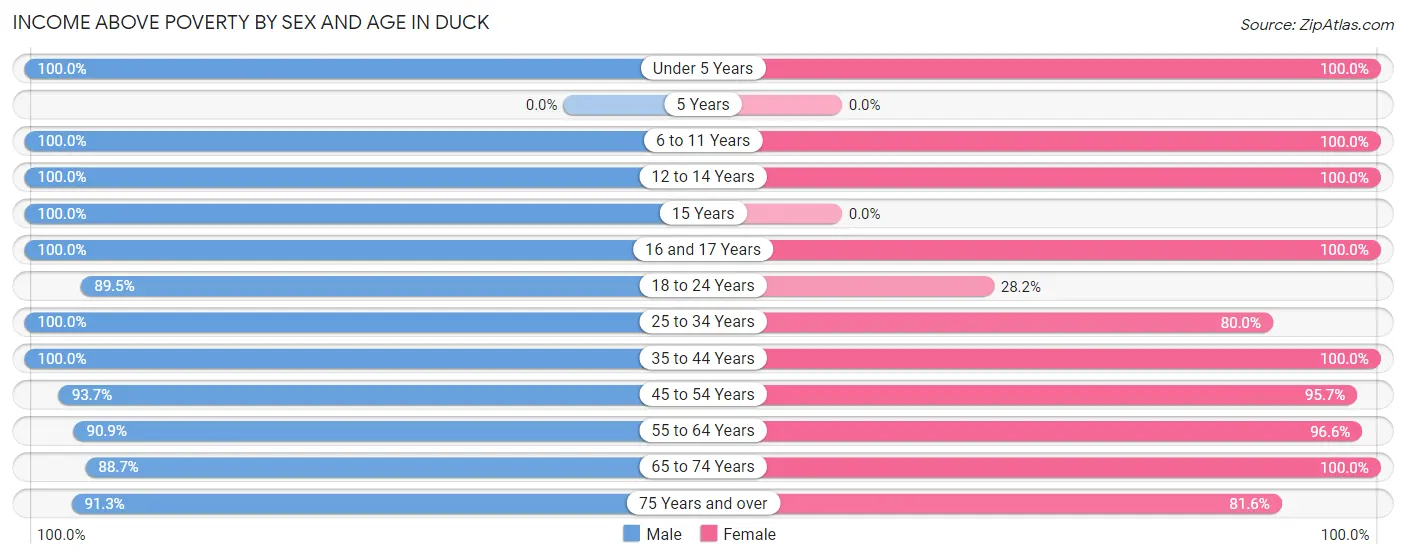
| Age Bracket | Male | Female |
| Under 5 Years | 9 (100.0%) | 8 (100.0%) |
| 5 Years | 0 (0.0%) | 0 (0.0%) |
| 6 to 11 Years | 23 (100.0%) | 18 (100.0%) |
| 12 to 14 Years | 2 (100.0%) | 10 (100.0%) |
| 15 Years | 5 (100.0%) | 0 (0.0%) |
| 16 and 17 Years | 3 (100.0%) | 13 (100.0%) |
| 18 to 24 Years | 17 (89.5%) | 11 (28.2%) |
| 25 to 34 Years | 3 (100.0%) | 16 (80.0%) |
| 35 to 44 Years | 33 (100.0%) | 24 (100.0%) |
| 45 to 54 Years | 59 (93.6%) | 22 (95.7%) |
| 55 to 64 Years | 50 (90.9%) | 85 (96.6%) |
| 65 to 74 Years | 55 (88.7%) | 71 (100.0%) |
| 75 Years and over | 42 (91.3%) | 40 (81.6%) |
| Total | 301 (93.2%) | 318 (87.6%) |
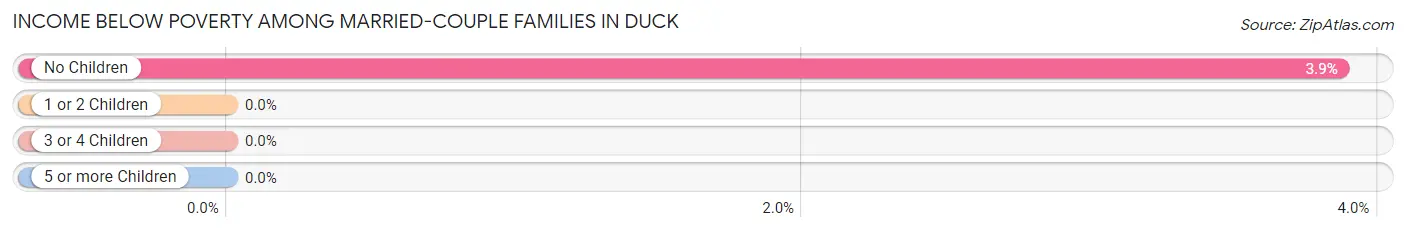
Income Below Poverty Among Married-Couple Families in Duck
The poverty statistics for married-couple families in Duck show that 3.3% or 6 of the total 183 families live below the poverty line. Families with no children have the highest poverty rate of 3.9%, comprising of 6 families. On the other hand, families with 1 or 2 children have the lowest poverty rate of 0.0%, which includes 0 families.
| Children | Above Poverty | Below Poverty |
| No Children | 149 (96.1%) | 6 (3.9%) |
| 1 or 2 Children | 15 (100.0%) | 0 (0.0%) |
| 3 or 4 Children | 13 (100.0%) | 0 (0.0%) |
| 5 or more Children | 0 (0.0%) | 0 (0.0%) |
| Total | 177 (96.7%) | 6 (3.3%) |
Income Below Poverty Among Single-Parent Households in Duck
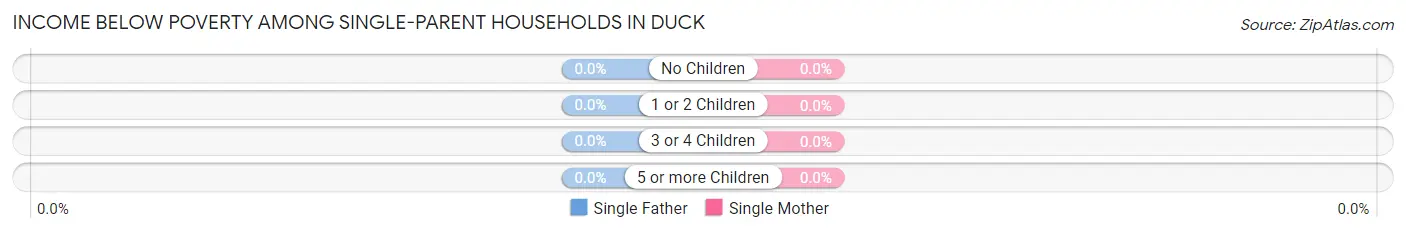
| Children | Single Father | Single Mother |
| No Children | 0 (0.0%) | 0 (0.0%) |
| 1 or 2 Children | 0 (0.0%) | 0 (0.0%) |
| 3 or 4 Children | 0 (0.0%) | 0 (0.0%) |
| 5 or more Children | 0 (0.0%) | 0 (0.0%) |
| Total | 0 (0.0%) | 0 (0.0%) |
Income Below Poverty Among Married-Couple vs Single-Parent Households in Duck
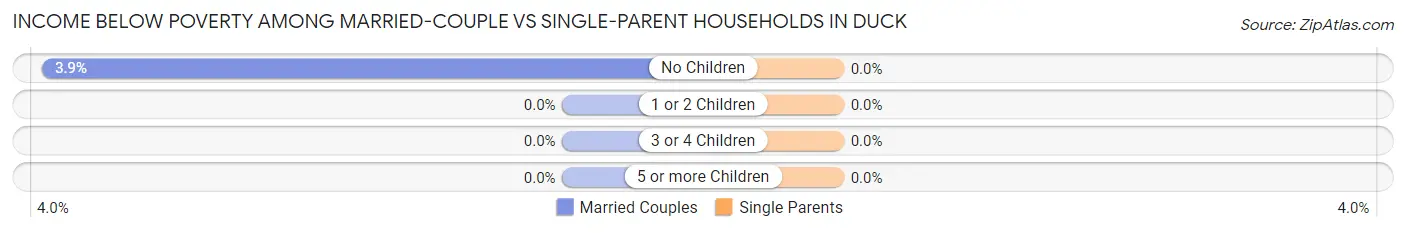
| Children | Married-Couple Families | Single-Parent Households |
| No Children | 6 (3.9%) | 0 (0.0%) |
| 1 or 2 Children | 0 (0.0%) | 0 (0.0%) |
| 3 or 4 Children | 0 (0.0%) | 0 (0.0%) |
| 5 or more Children | 0 (0.0%) | 0 (0.0%) |
| Total | 6 (3.3%) | 0 (0.0%) |
Employment Characteristics in Duck
Employment by Class of Employer in Duck
Among the 276 employed individuals in Duck, private company employees (183 | 66.3%), self-employed (incorporated) (37 | 13.4%), and self-employed (not incorporated) (22 | 8.0%) make up the most common classes of employment.
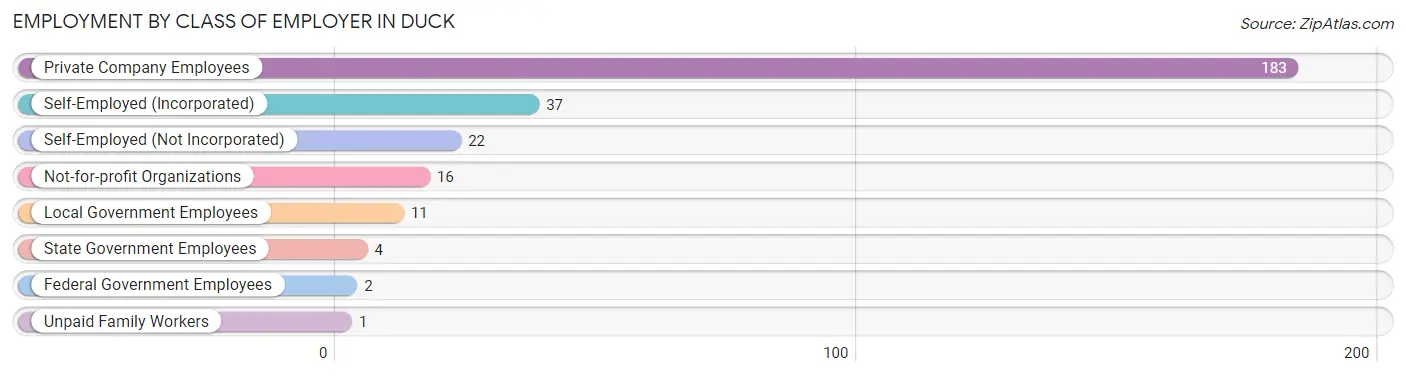
| Employer Class | # Employees | % Employees |
| Private Company Employees | 183 | 66.3% |
| Self-Employed (Incorporated) | 37 | 13.4% |
| Self-Employed (Not Incorporated) | 22 | 8.0% |
| Not-for-profit Organizations | 16 | 5.8% |
| Local Government Employees | 11 | 4.0% |
| State Government Employees | 4 | 1.5% |
| Federal Government Employees | 2 | 0.7% |
| Unpaid Family Workers | 1 | 0.4% |
| Total | 276 | 100.0% |
Employment Status by Age in Duck
According to the labor force statistics for Duck, out of the total population over 16 years of age (611), 47.1% or 288 individuals are in the labor force, with 1.4% or 4 of them unemployed. The age group with the highest labor force participation rate is 30 to 34 years, with 100.0% or 7 individuals in the labor force. Within the labor force, the 25 to 29 years age range has the highest percentage of unemployed individuals, with 25.0% or 3 of them being unemployed.
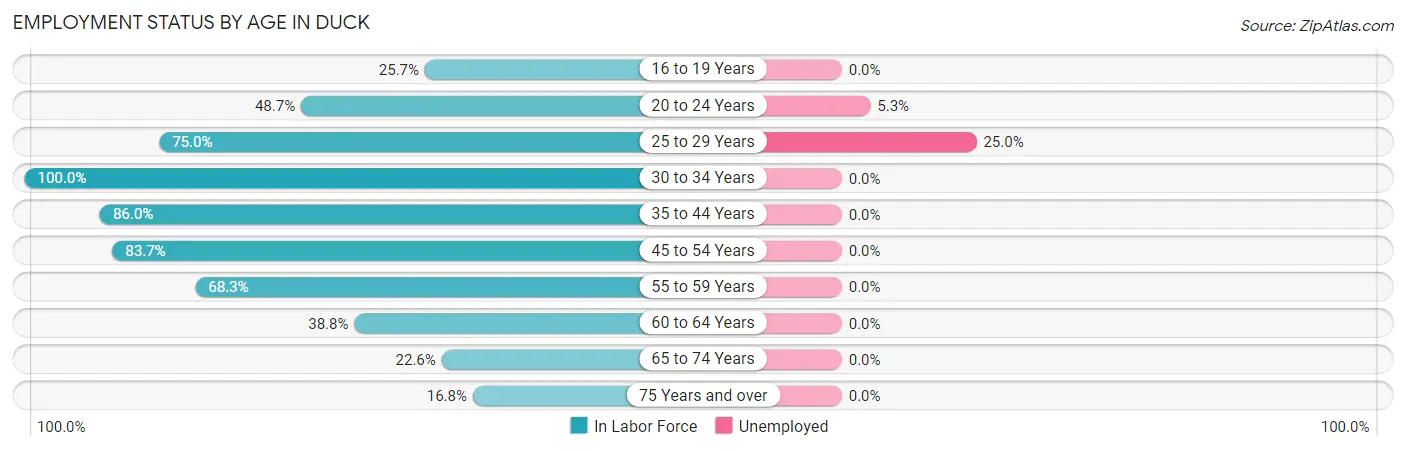
| Age Bracket | In Labor Force | Unemployed |
| 16 to 19 Years | 9 (25.7%) | 0 (0.0%) |
| 20 to 24 Years | 19 (48.7%) | 1 (5.3%) |
| 25 to 29 Years | 12 (75.0%) | 3 (25.0%) |
| 30 to 34 Years | 7 (100.0%) | 0 (0.0%) |
| 35 to 44 Years | 49 (86.0%) | 0 (0.0%) |
| 45 to 54 Years | 72 (83.7%) | 0 (0.0%) |
| 55 to 59 Years | 43 (68.3%) | 0 (0.0%) |
| 60 to 64 Years | 31 (38.8%) | 0 (0.0%) |
| 65 to 74 Years | 30 (22.6%) | 0 (0.0%) |
| 75 Years and over | 16 (16.8%) | 0 (0.0%) |
| Total | 288 (47.1%) | 4 (1.4%) |
Employment Status by Educational Attainment in Duck
According to labor force statistics for Duck, 69.3% of individuals (214) out of the total population between 25 and 64 years of age (309) are in the labor force, with 1.4% or 3 of them being unemployed. The group with the highest labor force participation rate are those with the educational attainment of college / associate degree, with 83.0% or 73 individuals in the labor force. Within the labor force, individuals with bachelor's degree or higher education have the highest percentage of unemployment, with 2.5% or 3 of them being unemployed.
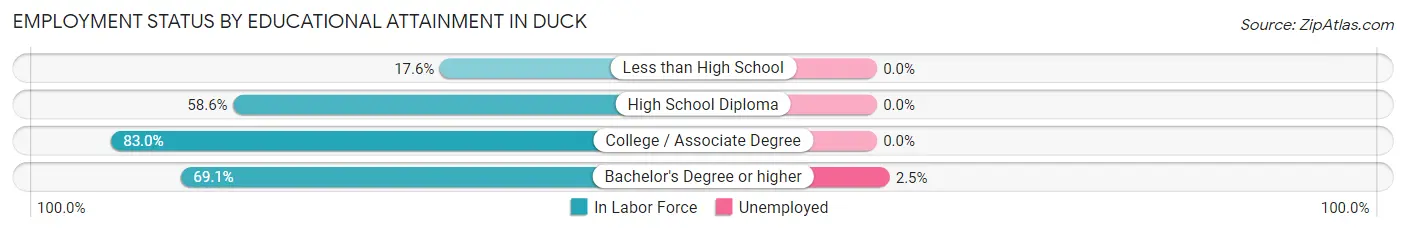
| Educational Attainment | In Labor Force | Unemployed |
| Less than High School | 3 (17.6%) | 0 (0.0%) |
| High School Diploma | 17 (58.6%) | 0 (0.0%) |
| College / Associate Degree | 73 (83.0%) | 0 (0.0%) |
| Bachelor's Degree or higher | 121 (69.1%) | 4 (2.5%) |
| Total | 214 (69.3%) | 4 (1.4%) |
Employment Occupations by Sex in Duck
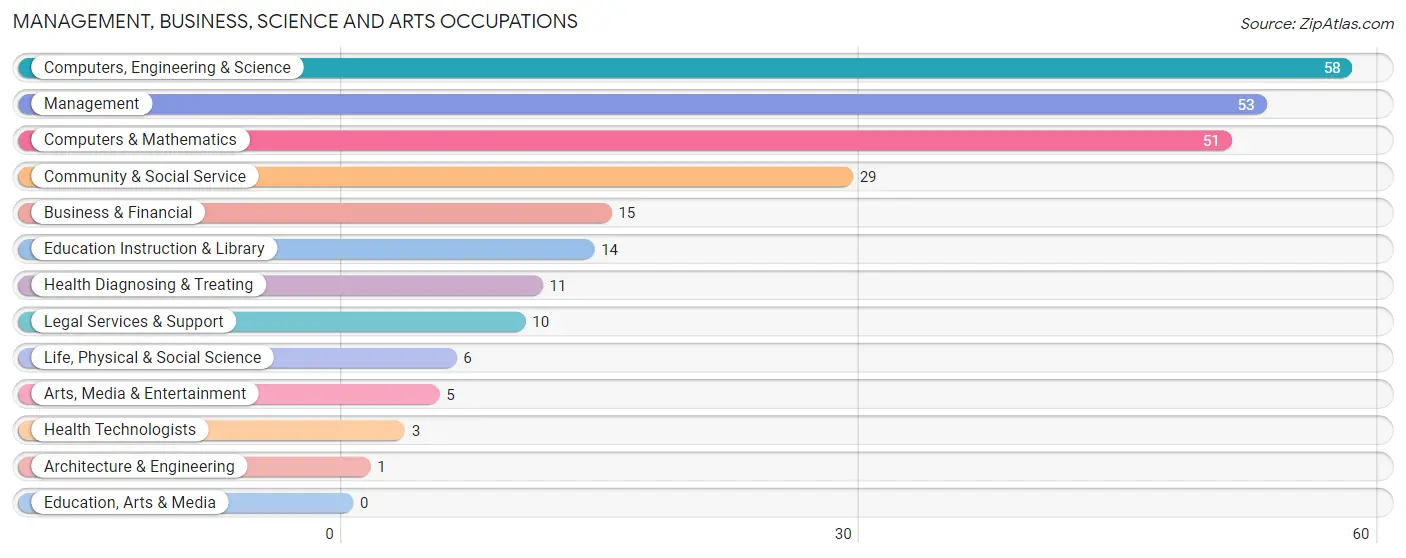
Management, Business, Science and Arts Occupations
The most common Management, Business, Science and Arts occupations in Duck are Computers, Engineering & Science (58 | 20.4%), Management (53 | 18.7%), Computers & Mathematics (51 | 18.0%), Community & Social Service (29 | 10.2%), and Business & Financial (15 | 5.3%).
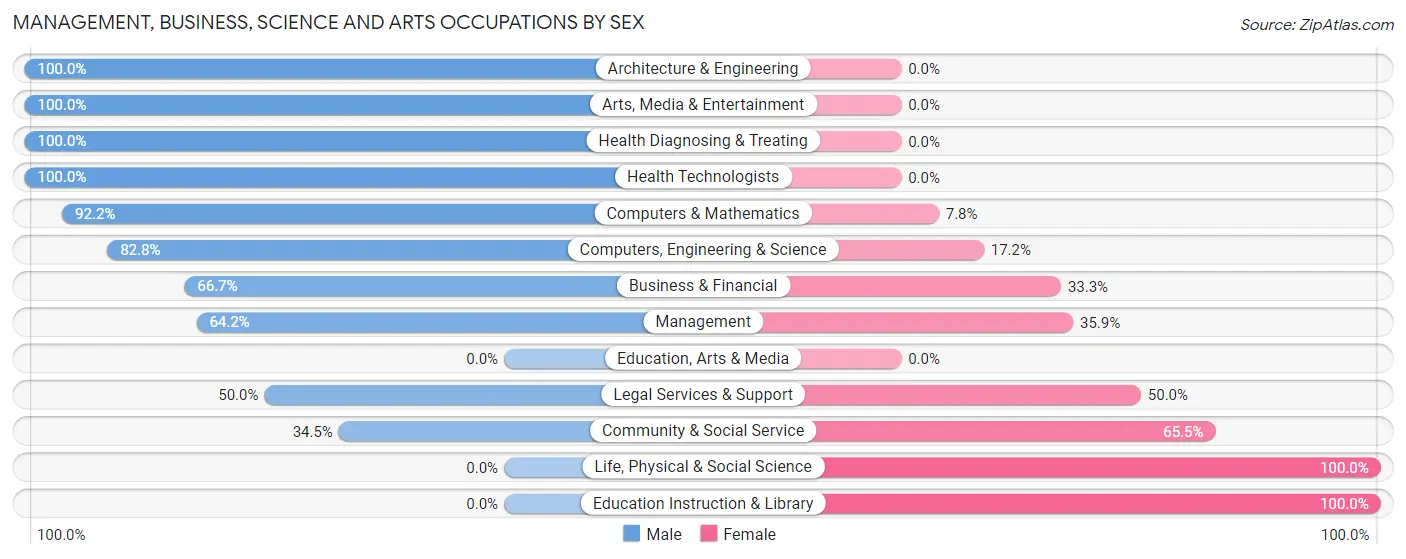
Management, Business, Science and Arts Occupations by Sex
Within the Management, Business, Science and Arts occupations in Duck, the most male-oriented occupations are Architecture & Engineering (100.0%), Arts, Media & Entertainment (100.0%), and Health Diagnosing & Treating (100.0%), while the most female-oriented occupations are Life, Physical & Social Science (100.0%), Education Instruction & Library (100.0%), and Community & Social Service (65.5%).
| Occupation | Male | Female |
| Management | 34 (64.1%) | 19 (35.8%) |
| Business & Financial | 10 (66.7%) | 5 (33.3%) |
| Computers, Engineering & Science | 48 (82.8%) | 10 (17.2%) |
| Computers & Mathematics | 47 (92.2%) | 4 (7.8%) |
| Architecture & Engineering | 1 (100.0%) | 0 (0.0%) |
| Life, Physical & Social Science | 0 (0.0%) | 6 (100.0%) |
| Community & Social Service | 10 (34.5%) | 19 (65.5%) |
| Education, Arts & Media | 0 (0.0%) | 0 (0.0%) |
| Legal Services & Support | 5 (50.0%) | 5 (50.0%) |
| Education Instruction & Library | 0 (0.0%) | 14 (100.0%) |
| Arts, Media & Entertainment | 5 (100.0%) | 0 (0.0%) |
| Health Diagnosing & Treating | 11 (100.0%) | 0 (0.0%) |
| Health Technologists | 3 (100.0%) | 0 (0.0%) |
| Total (Category) | 113 (68.1%) | 53 (31.9%) |
| Total (Overall) | 161 (56.7%) | 123 (43.3%) |
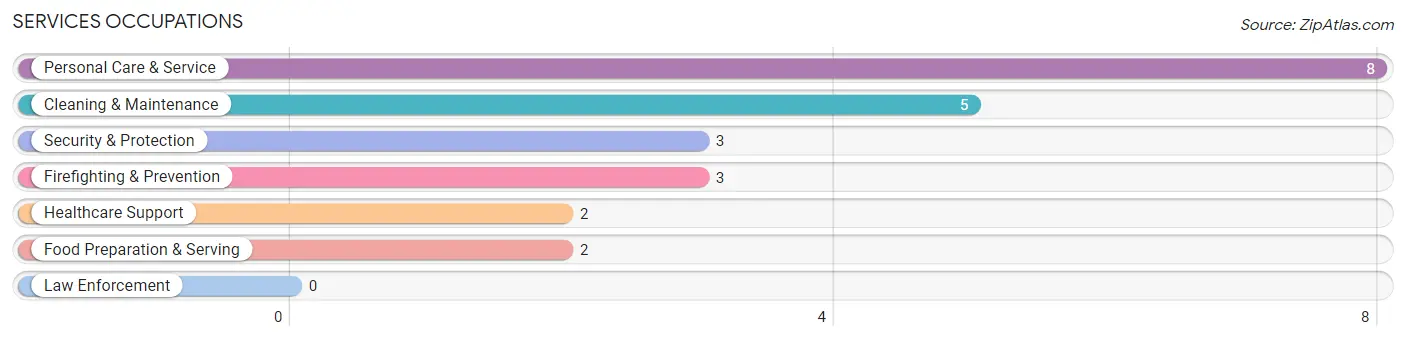
Services Occupations
The most common Services occupations in Duck are Personal Care & Service (8 | 2.8%), Cleaning & Maintenance (5 | 1.8%), Security & Protection (3 | 1.1%), Firefighting & Prevention (3 | 1.1%), and Healthcare Support (2 | 0.7%).
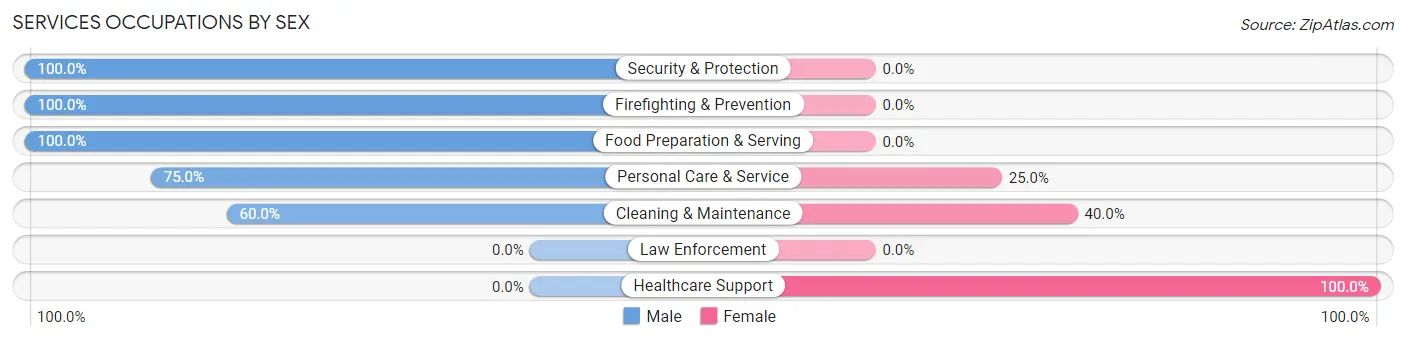
Services Occupations by Sex
Within the Services occupations in Duck, the most male-oriented occupations are Security & Protection (100.0%), Firefighting & Prevention (100.0%), and Food Preparation & Serving (100.0%), while the most female-oriented occupations are Healthcare Support (100.0%), Cleaning & Maintenance (40.0%), and Personal Care & Service (25.0%).
| Occupation | Male | Female |
| Healthcare Support | 0 (0.0%) | 2 (100.0%) |
| Security & Protection | 3 (100.0%) | 0 (0.0%) |
| Firefighting & Prevention | 3 (100.0%) | 0 (0.0%) |
| Law Enforcement | 0 (0.0%) | 0 (0.0%) |
| Food Preparation & Serving | 2 (100.0%) | 0 (0.0%) |
| Cleaning & Maintenance | 3 (60.0%) | 2 (40.0%) |
| Personal Care & Service | 6 (75.0%) | 2 (25.0%) |
| Total (Category) | 14 (70.0%) | 6 (30.0%) |
| Total (Overall) | 161 (56.7%) | 123 (43.3%) |
Sales and Office Occupations
The most common Sales and Office occupations in Duck are Sales & Related (61 | 21.5%), and Office & Administration (16 | 5.6%).

Sales and Office Occupations by Sex
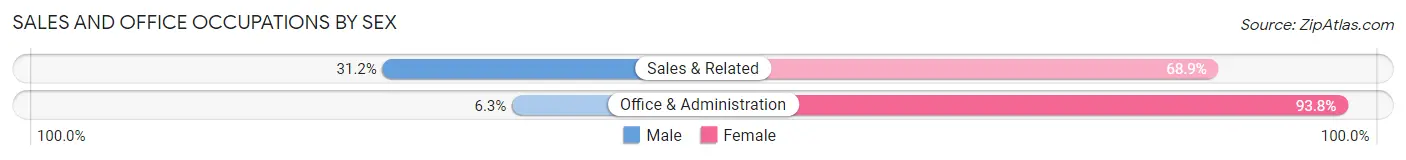
| Occupation | Male | Female |
| Sales & Related | 19 (31.1%) | 42 (68.9%) |
| Office & Administration | 1 (6.2%) | 15 (93.8%) |
| Total (Category) | 20 (26.0%) | 57 (74.0%) |
| Total (Overall) | 161 (56.7%) | 123 (43.3%) |
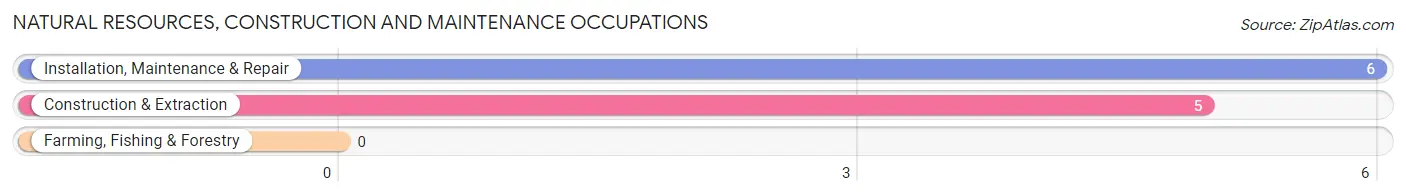
Natural Resources, Construction and Maintenance Occupations
The most common Natural Resources, Construction and Maintenance occupations in Duck are Installation, Maintenance & Repair (6 | 2.1%), and Construction & Extraction (5 | 1.8%).
Natural Resources, Construction and Maintenance Occupations by Sex
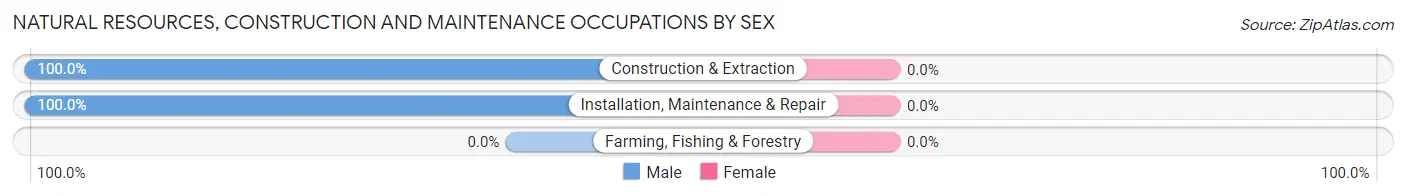
| Occupation | Male | Female |
| Farming, Fishing & Forestry | 0 (0.0%) | 0 (0.0%) |
| Construction & Extraction | 5 (100.0%) | 0 (0.0%) |
| Installation, Maintenance & Repair | 6 (100.0%) | 0 (0.0%) |
| Total (Category) | 11 (100.0%) | 0 (0.0%) |
| Total (Overall) | 161 (56.7%) | 123 (43.3%) |
Production, Transportation and Moving Occupations
The most common Production, Transportation and Moving occupations in Duck are Transportation (7 | 2.5%), and Production (3 | 1.1%).
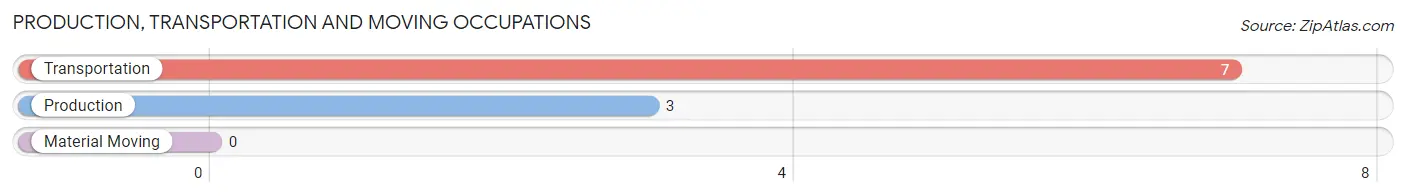
Production, Transportation and Moving Occupations by Sex
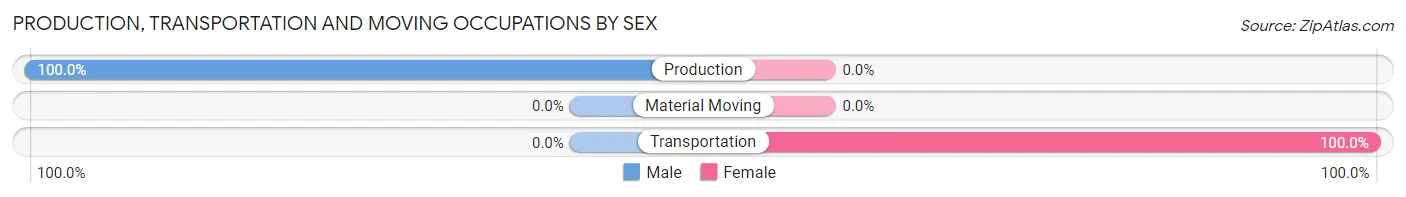
| Occupation | Male | Female |
| Production | 3 (100.0%) | 0 (0.0%) |
| Transportation | 0 (0.0%) | 7 (100.0%) |
| Material Moving | 0 (0.0%) | 0 (0.0%) |
| Total (Category) | 3 (30.0%) | 7 (70.0%) |
| Total (Overall) | 161 (56.7%) | 123 (43.3%) |
Employment Industries by Sex in Duck
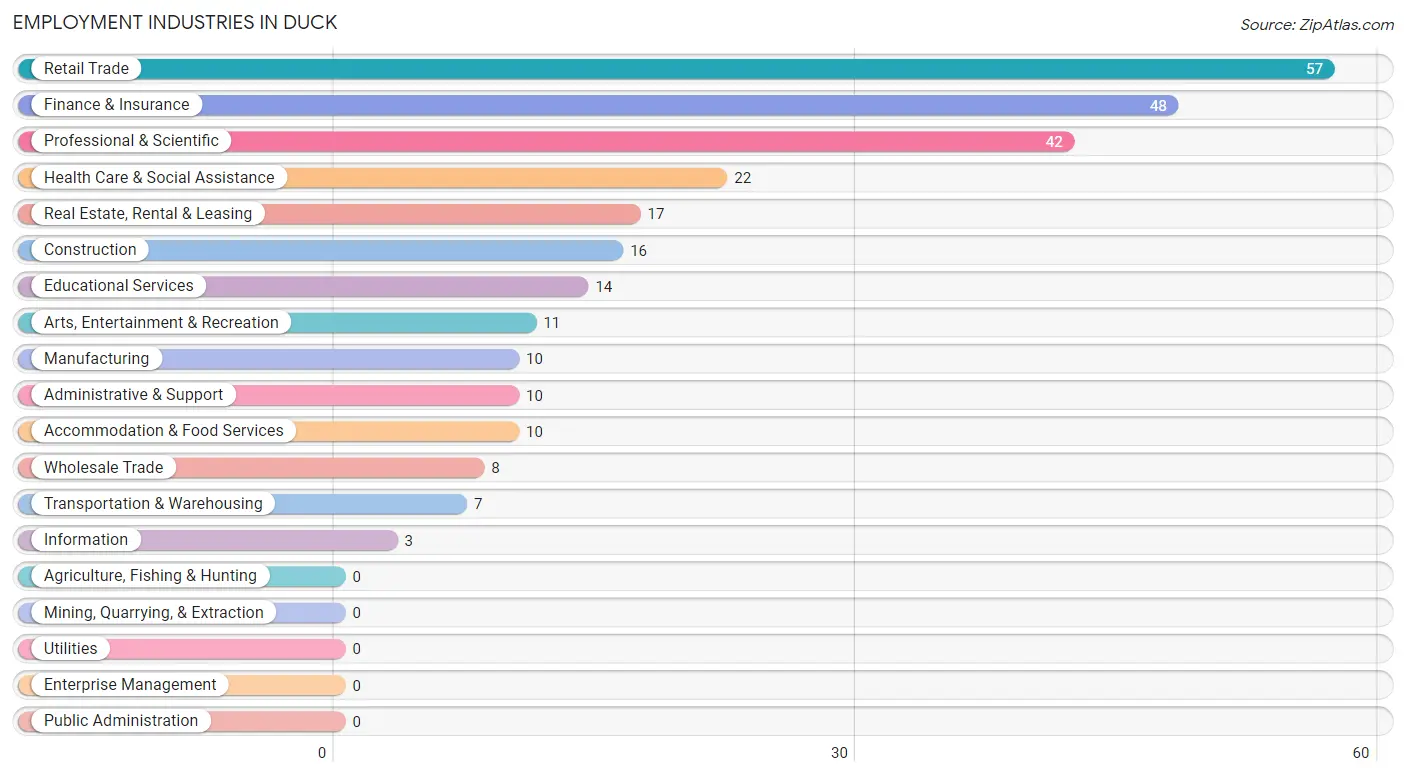
Employment Industries in Duck
The major employment industries in Duck include Retail Trade (57 | 20.1%), Finance & Insurance (48 | 16.9%), Professional & Scientific (42 | 14.8%), Health Care & Social Assistance (22 | 7.7%), and Real Estate, Rental & Leasing (17 | 6.0%).
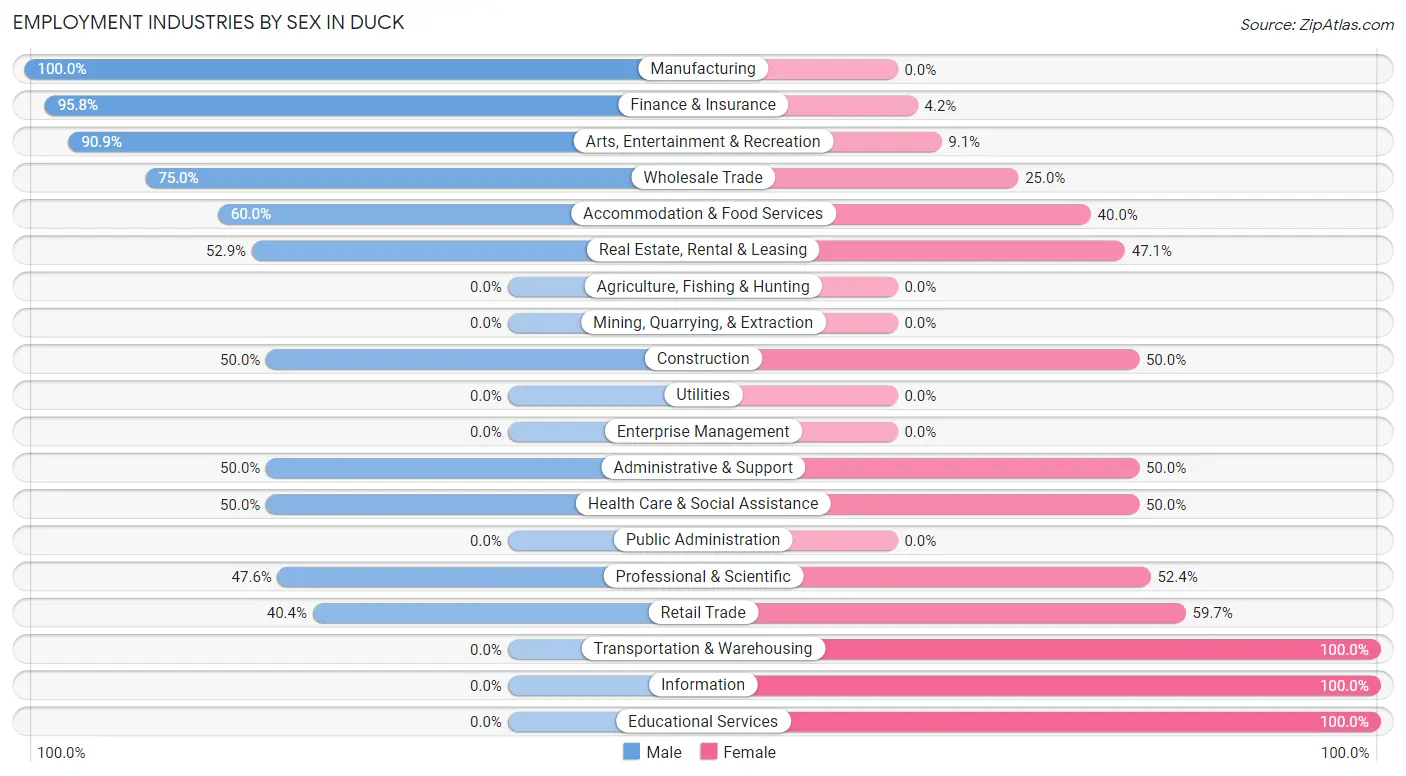
Employment Industries by Sex in Duck
The Duck industries that see more men than women are Manufacturing (100.0%), Finance & Insurance (95.8%), and Arts, Entertainment & Recreation (90.9%), whereas the industries that tend to have a higher number of women are Transportation & Warehousing (100.0%), Information (100.0%), and Educational Services (100.0%).
| Industry | Male | Female |
| Agriculture, Fishing & Hunting | 0 (0.0%) | 0 (0.0%) |
| Mining, Quarrying, & Extraction | 0 (0.0%) | 0 (0.0%) |
| Construction | 8 (50.0%) | 8 (50.0%) |
| Manufacturing | 10 (100.0%) | 0 (0.0%) |
| Wholesale Trade | 6 (75.0%) | 2 (25.0%) |
| Retail Trade | 23 (40.4%) | 34 (59.7%) |
| Transportation & Warehousing | 0 (0.0%) | 7 (100.0%) |
| Utilities | 0 (0.0%) | 0 (0.0%) |
| Information | 0 (0.0%) | 3 (100.0%) |
| Finance & Insurance | 46 (95.8%) | 2 (4.2%) |
| Real Estate, Rental & Leasing | 9 (52.9%) | 8 (47.1%) |
| Professional & Scientific | 20 (47.6%) | 22 (52.4%) |
| Enterprise Management | 0 (0.0%) | 0 (0.0%) |
| Administrative & Support | 5 (50.0%) | 5 (50.0%) |
| Educational Services | 0 (0.0%) | 14 (100.0%) |
| Health Care & Social Assistance | 11 (50.0%) | 11 (50.0%) |
| Arts, Entertainment & Recreation | 10 (90.9%) | 1 (9.1%) |
| Accommodation & Food Services | 6 (60.0%) | 4 (40.0%) |
| Public Administration | 0 (0.0%) | 0 (0.0%) |
| Total | 161 (56.7%) | 123 (43.3%) |
Education in Duck
School Enrollment in Duck
The most common levels of schooling among the 117 students in Duck are high school (28 | 23.9%), middle school (27 | 23.1%), and college / undergraduate (25 | 21.4%).
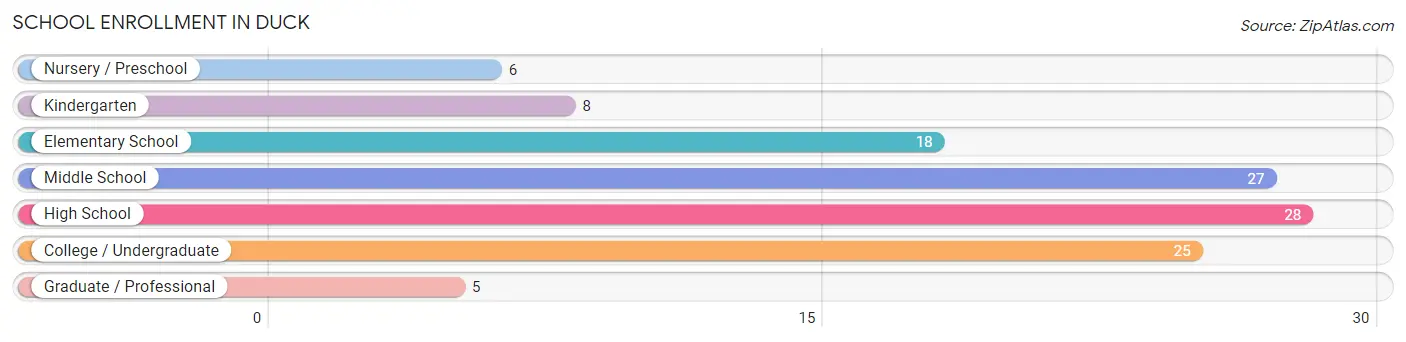
| School Level | # Students | % Students |
| Nursery / Preschool | 6 | 5.1% |
| Kindergarten | 8 | 6.8% |
| Elementary School | 18 | 15.4% |
| Middle School | 27 | 23.1% |
| High School | 28 | 23.9% |
| College / Undergraduate | 25 | 21.4% |
| Graduate / Professional | 5 | 4.3% |
| Total | 117 | 100.0% |
School Enrollment by Age by Funding Source in Duck
Out of a total of 117 students who are enrolled in schools in Duck, 17 (14.5%) attend a private institution, while the remaining 100 (85.5%) are enrolled in public schools. The age group of 3 to 4 year olds has the highest likelihood of being enrolled in private schools, with 6 (100.0% in the age bracket) enrolled. Conversely, the age group of 10 to 14 year olds has the lowest likelihood of being enrolled in a private school, with 27 (100.0% in the age bracket) attending a public institution.
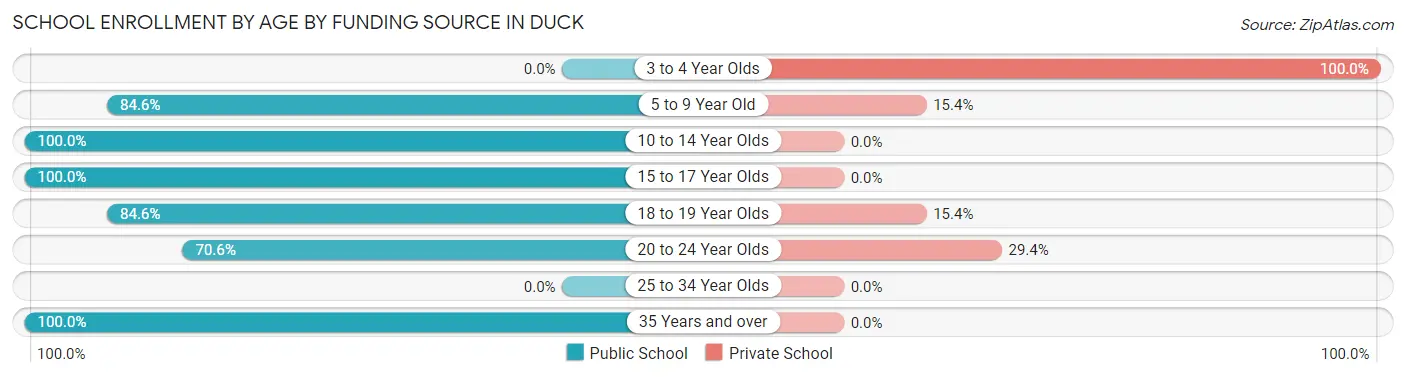
| Age Bracket | Public School | Private School |
| 3 to 4 Year Olds | 0 (0.0%) | 6 (100.0%) |
| 5 to 9 Year Old | 22 (84.6%) | 4 (15.4%) |
| 10 to 14 Year Olds | 27 (100.0%) | 0 (0.0%) |
| 15 to 17 Year Olds | 21 (100.0%) | 0 (0.0%) |
| 18 to 19 Year Olds | 11 (84.6%) | 2 (15.4%) |
| 20 to 24 Year Olds | 12 (70.6%) | 5 (29.4%) |
| 25 to 34 Year Olds | 0 (0.0%) | 0 (0.0%) |
| 35 Years and over | 7 (100.0%) | 0 (0.0%) |
| Total | 100 (85.5%) | 17 (14.5%) |
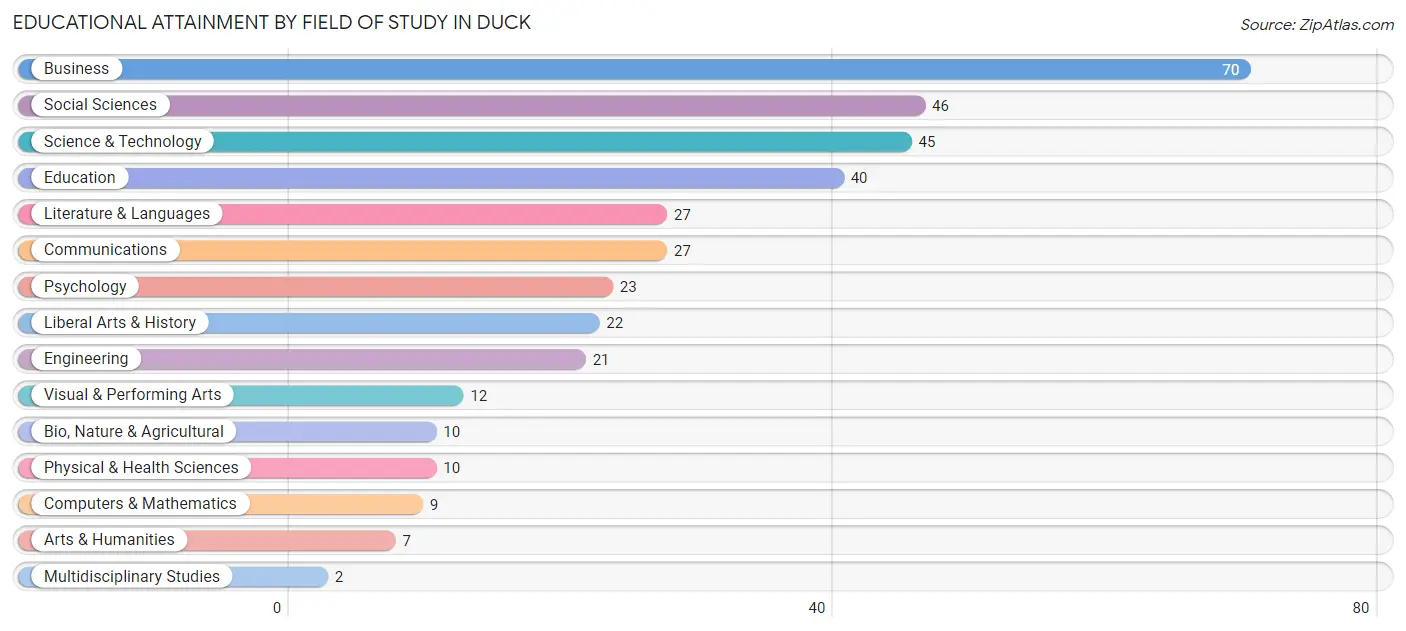
Educational Attainment by Field of Study in Duck
Business (70 | 18.9%), social sciences (46 | 12.4%), science & technology (45 | 12.1%), education (40 | 10.8%), and literature & languages (27 | 7.3%) are the most common fields of study among 371 individuals in Duck who have obtained a bachelor's degree or higher.
| Field of Study | # Graduates | % Graduates |
| Computers & Mathematics | 9 | 2.4% |
| Bio, Nature & Agricultural | 10 | 2.7% |
| Physical & Health Sciences | 10 | 2.7% |
| Psychology | 23 | 6.2% |
| Social Sciences | 46 | 12.4% |
| Engineering | 21 | 5.7% |
| Multidisciplinary Studies | 2 | 0.5% |
| Science & Technology | 45 | 12.1% |
| Business | 70 | 18.9% |
| Education | 40 | 10.8% |
| Literature & Languages | 27 | 7.3% |
| Liberal Arts & History | 22 | 5.9% |
| Visual & Performing Arts | 12 | 3.2% |
| Communications | 27 | 7.3% |
| Arts & Humanities | 7 | 1.9% |
| Total | 371 | 100.0% |
Transportation & Commute in Duck
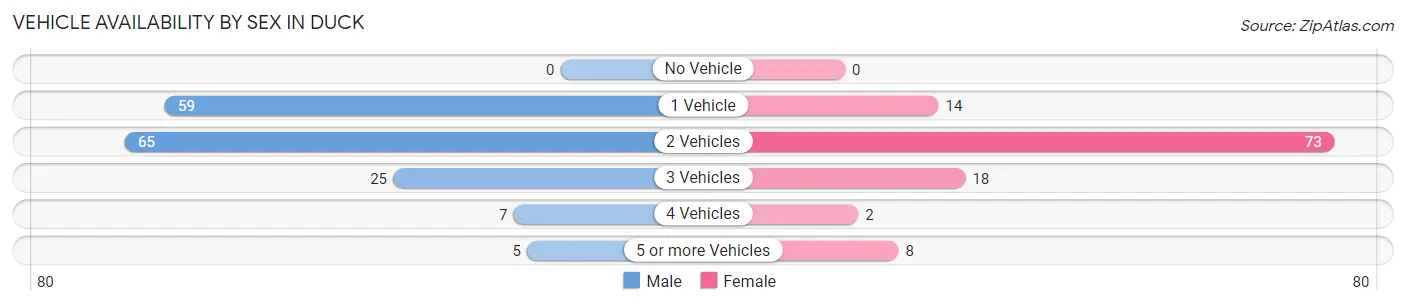
Vehicle Availability by Sex in Duck
The most prevalent vehicle ownership categories in Duck are males with 2 vehicles (65, accounting for 40.4%) and females with 2 vehicles (73, making up 56.5%).
| Vehicles Available | Male | Female |
| No Vehicle | 0 (0.0%) | 0 (0.0%) |
| 1 Vehicle | 59 (36.6%) | 14 (12.2%) |
| 2 Vehicles | 65 (40.4%) | 73 (63.5%) |
| 3 Vehicles | 25 (15.5%) | 18 (15.7%) |
| 4 Vehicles | 7 (4.3%) | 2 (1.7%) |
| 5 or more Vehicles | 5 (3.1%) | 8 (7.0%) |
| Total | 161 (100.0%) | 115 (100.0%) |
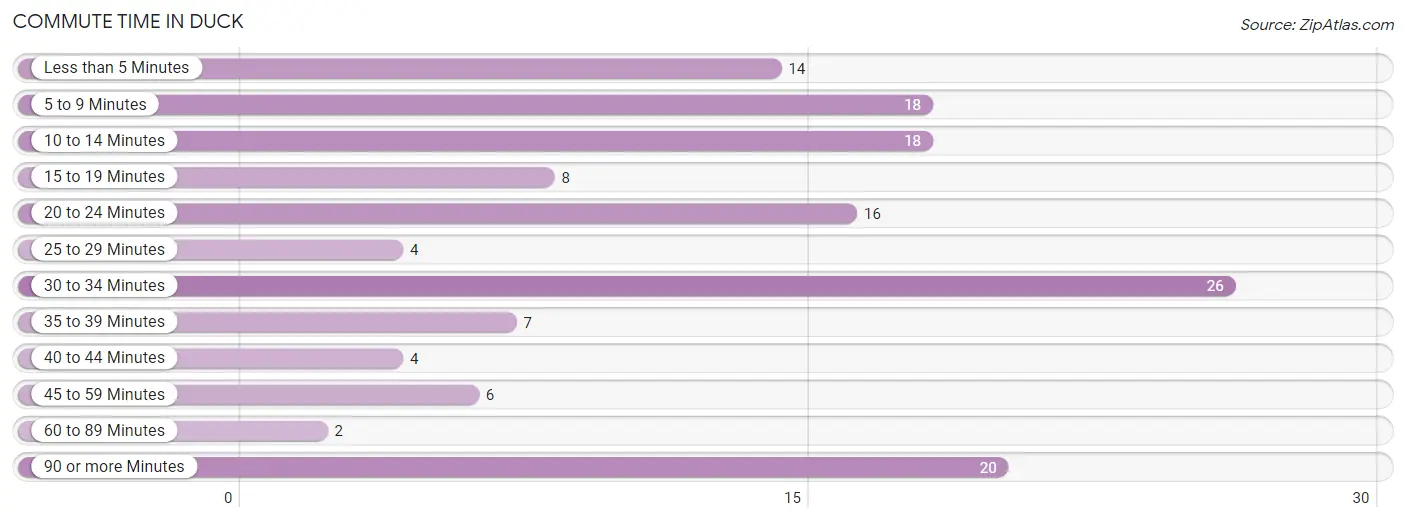
Commute Time in Duck
The most frequently occuring commute durations in Duck are 30 to 34 minutes (26 commuters, 18.2%), 90 or more minutes (20 commuters, 14.0%), and 5 to 9 minutes (18 commuters, 12.6%).
| Commute Time | # Commuters | % Commuters |
| Less than 5 Minutes | 14 | 9.8% |
| 5 to 9 Minutes | 18 | 12.6% |
| 10 to 14 Minutes | 18 | 12.6% |
| 15 to 19 Minutes | 8 | 5.6% |
| 20 to 24 Minutes | 16 | 11.2% |
| 25 to 29 Minutes | 4 | 2.8% |
| 30 to 34 Minutes | 26 | 18.2% |
| 35 to 39 Minutes | 7 | 4.9% |
| 40 to 44 Minutes | 4 | 2.8% |
| 45 to 59 Minutes | 6 | 4.2% |
| 60 to 89 Minutes | 2 | 1.4% |
| 90 or more Minutes | 20 | 14.0% |
Commute Time by Sex in Duck
The most common commute times in Duck are 30 to 34 minutes (21 commuters, 30.0%) for males and 5 to 9 minutes (16 commuters, 21.9%) for females.
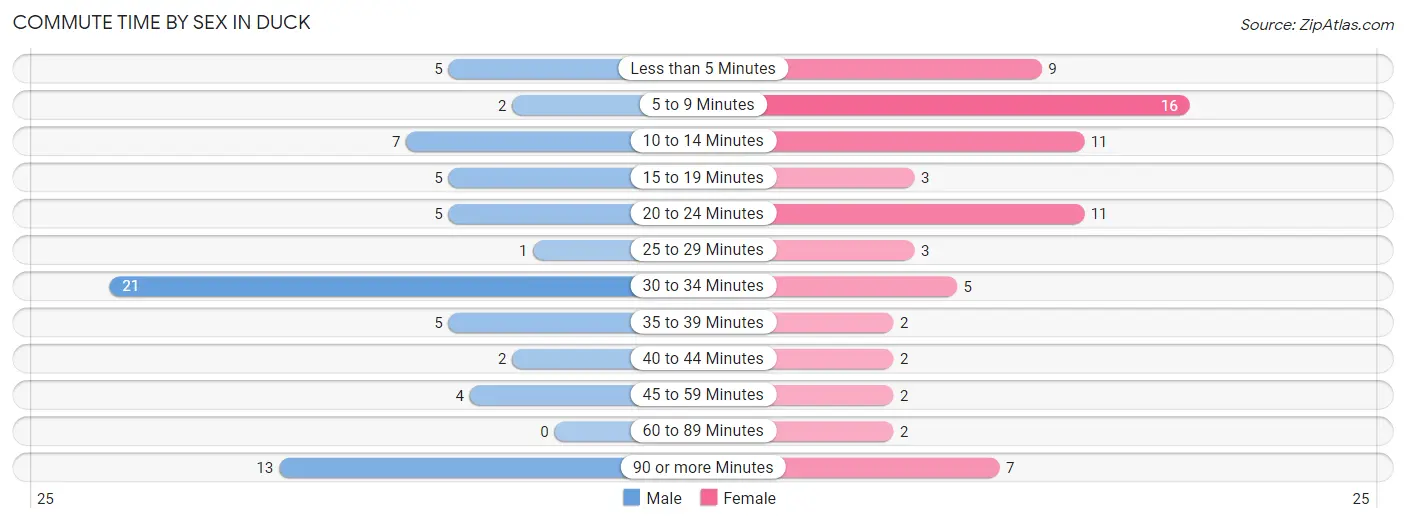
| Commute Time | Male | Female |
| Less than 5 Minutes | 5 (7.1%) | 9 (12.3%) |
| 5 to 9 Minutes | 2 (2.9%) | 16 (21.9%) |
| 10 to 14 Minutes | 7 (10.0%) | 11 (15.1%) |
| 15 to 19 Minutes | 5 (7.1%) | 3 (4.1%) |
| 20 to 24 Minutes | 5 (7.1%) | 11 (15.1%) |
| 25 to 29 Minutes | 1 (1.4%) | 3 (4.1%) |
| 30 to 34 Minutes | 21 (30.0%) | 5 (6.9%) |
| 35 to 39 Minutes | 5 (7.1%) | 2 (2.7%) |
| 40 to 44 Minutes | 2 (2.9%) | 2 (2.7%) |
| 45 to 59 Minutes | 4 (5.7%) | 2 (2.7%) |
| 60 to 89 Minutes | 0 (0.0%) | 2 (2.7%) |
| 90 or more Minutes | 13 (18.6%) | 7 (9.6%) |
Time of Departure to Work by Sex in Duck
The most frequent times of departure to work in Duck are 8:00 AM to 8:29 AM (18, 25.7%) for males and 10:00 AM to 10:59 AM (28, 38.4%) for females.
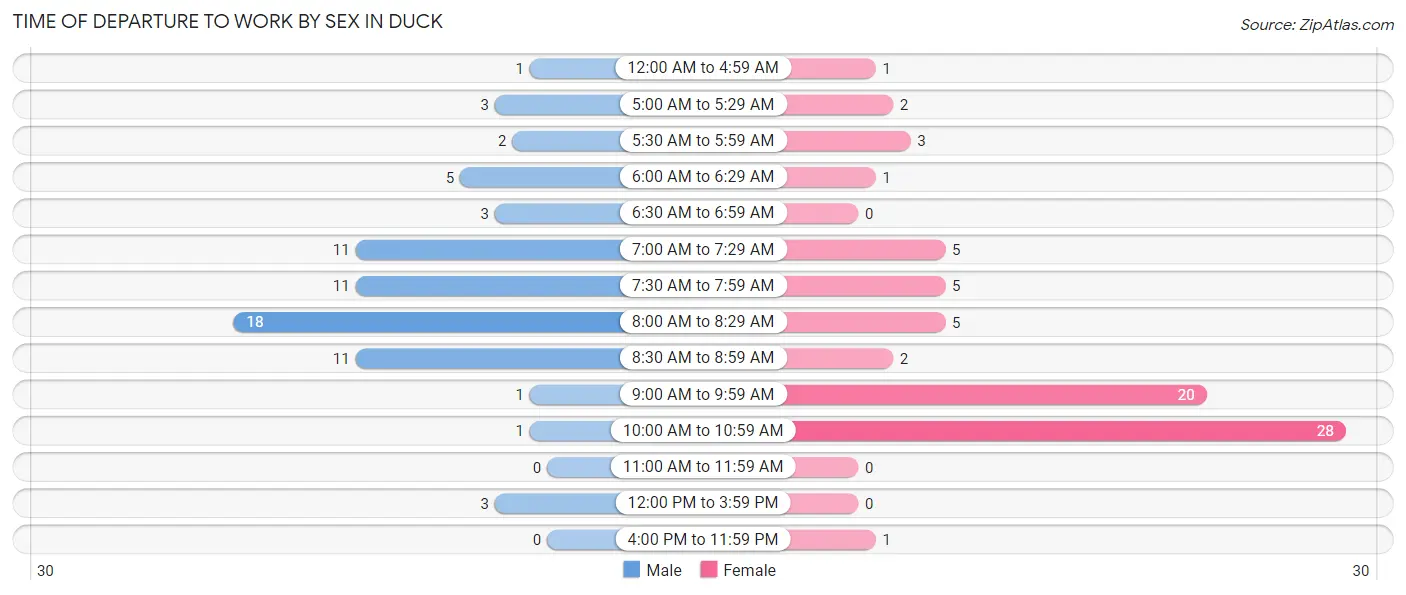
| Time of Departure | Male | Female |
| 12:00 AM to 4:59 AM | 1 (1.4%) | 1 (1.4%) |
| 5:00 AM to 5:29 AM | 3 (4.3%) | 2 (2.7%) |
| 5:30 AM to 5:59 AM | 2 (2.9%) | 3 (4.1%) |
| 6:00 AM to 6:29 AM | 5 (7.1%) | 1 (1.4%) |
| 6:30 AM to 6:59 AM | 3 (4.3%) | 0 (0.0%) |
| 7:00 AM to 7:29 AM | 11 (15.7%) | 5 (6.9%) |
| 7:30 AM to 7:59 AM | 11 (15.7%) | 5 (6.9%) |
| 8:00 AM to 8:29 AM | 18 (25.7%) | 5 (6.9%) |
| 8:30 AM to 8:59 AM | 11 (15.7%) | 2 (2.7%) |
| 9:00 AM to 9:59 AM | 1 (1.4%) | 20 (27.4%) |
| 10:00 AM to 10:59 AM | 1 (1.4%) | 28 (38.4%) |
| 11:00 AM to 11:59 AM | 0 (0.0%) | 0 (0.0%) |
| 12:00 PM to 3:59 PM | 3 (4.3%) | 0 (0.0%) |
| 4:00 PM to 11:59 PM | 0 (0.0%) | 1 (1.4%) |
| Total | 70 (100.0%) | 73 (100.0%) |
Housing Occupancy in Duck
Occupancy by Ownership in Duck
Of the total 310 dwellings in Duck, owner-occupied units account for 271 (87.4%), while renter-occupied units make up 39 (12.6%).
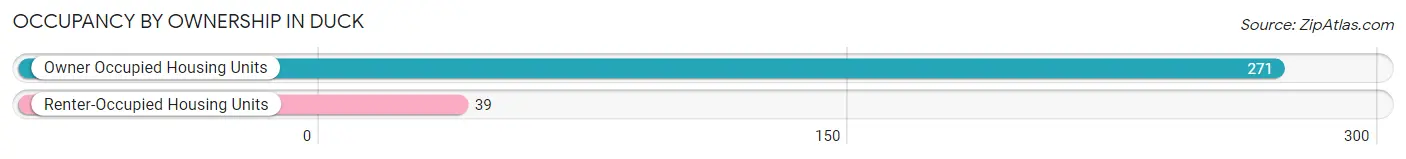
| Occupancy | # Housing Units | % Housing Units |
| Owner Occupied Housing Units | 271 | 87.4% |
| Renter-Occupied Housing Units | 39 | 12.6% |
| Total Occupied Housing Units | 310 | 100.0% |
Occupancy by Household Size in Duck
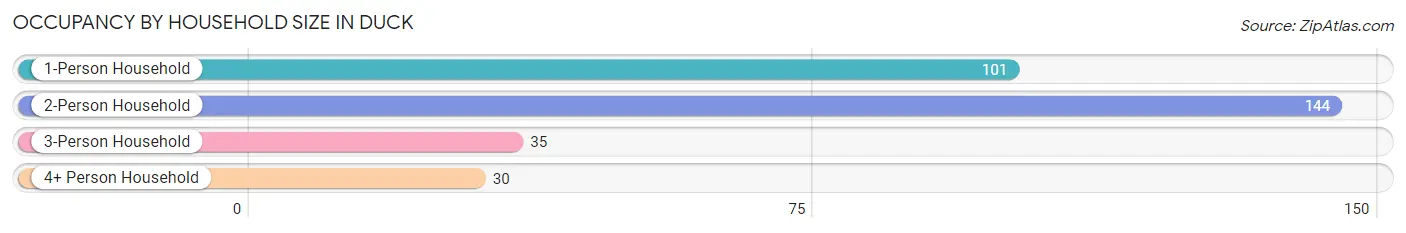
| Household Size | # Housing Units | % Housing Units |
| 1-Person Household | 101 | 32.6% |
| 2-Person Household | 144 | 46.5% |
| 3-Person Household | 35 | 11.3% |
| 4+ Person Household | 30 | 9.7% |
| Total Housing Units | 310 | 100.0% |
Occupancy by Ownership by Household Size in Duck
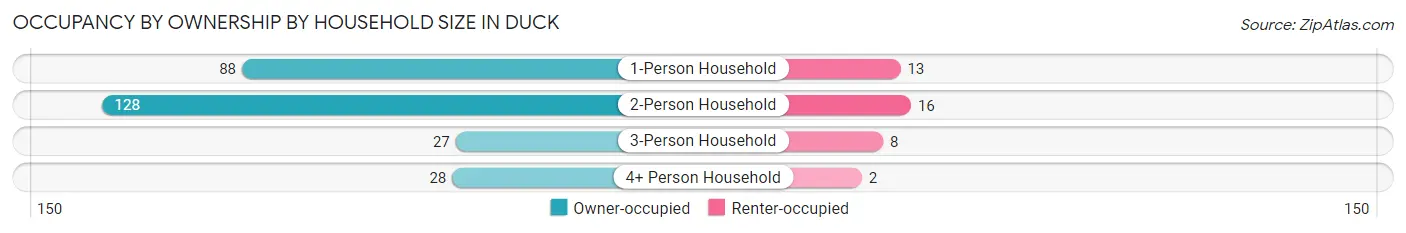
| Household Size | Owner-occupied | Renter-occupied |
| 1-Person Household | 88 (87.1%) | 13 (12.9%) |
| 2-Person Household | 128 (88.9%) | 16 (11.1%) |
| 3-Person Household | 27 (77.1%) | 8 (22.9%) |
| 4+ Person Household | 28 (93.3%) | 2 (6.7%) |
| Total Housing Units | 271 (87.4%) | 39 (12.6%) |
Occupancy by Educational Attainment in Duck
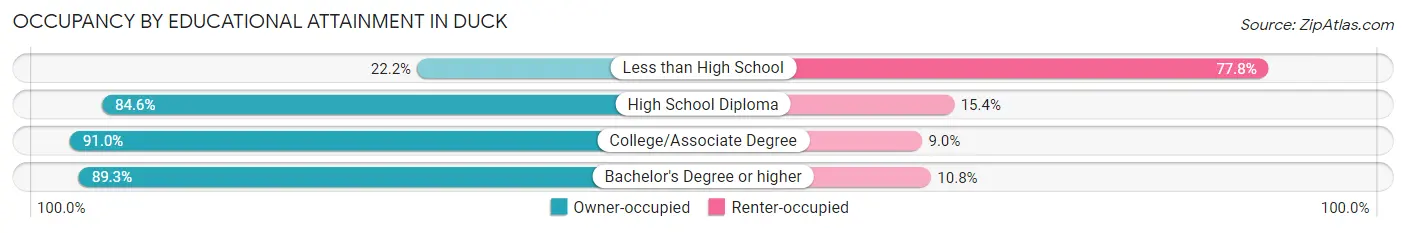
| Household Size | Owner-occupied | Renter-occupied |
| Less than High School | 2 (22.2%) | 7 (77.8%) |
| High School Diploma | 22 (84.6%) | 4 (15.4%) |
| College/Associate Degree | 81 (91.0%) | 8 (9.0%) |
| Bachelor's Degree or higher | 166 (89.2%) | 20 (10.7%) |
Occupancy by Age of Householder in Duck
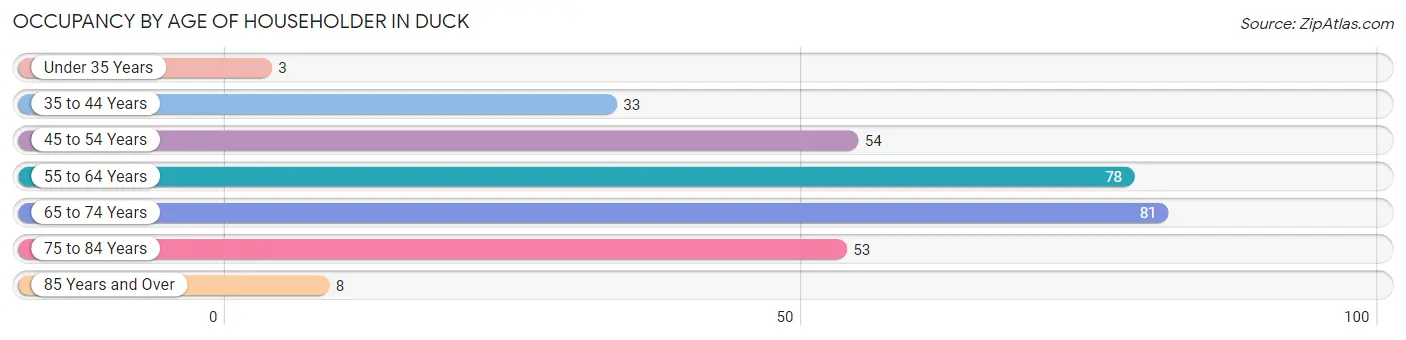
| Age Bracket | # Households | % Households |
| Under 35 Years | 3 | 1.0% |
| 35 to 44 Years | 33 | 10.6% |
| 45 to 54 Years | 54 | 17.4% |
| 55 to 64 Years | 78 | 25.2% |
| 65 to 74 Years | 81 | 26.1% |
| 75 to 84 Years | 53 | 17.1% |
| 85 Years and Over | 8 | 2.6% |
| Total | 310 | 100.0% |
Housing Finances in Duck
Median Income by Occupancy in Duck
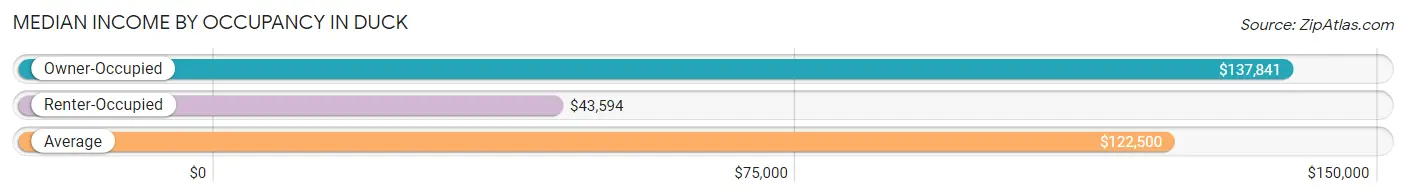
| Occupancy Type | # Households | Median Income |
| Owner-Occupied | 271 (87.4%) | $137,841 |
| Renter-Occupied | 39 (12.6%) | $43,594 |
| Average | 310 (100.0%) | $122,500 |
Occupancy by Householder Income Bracket in Duck
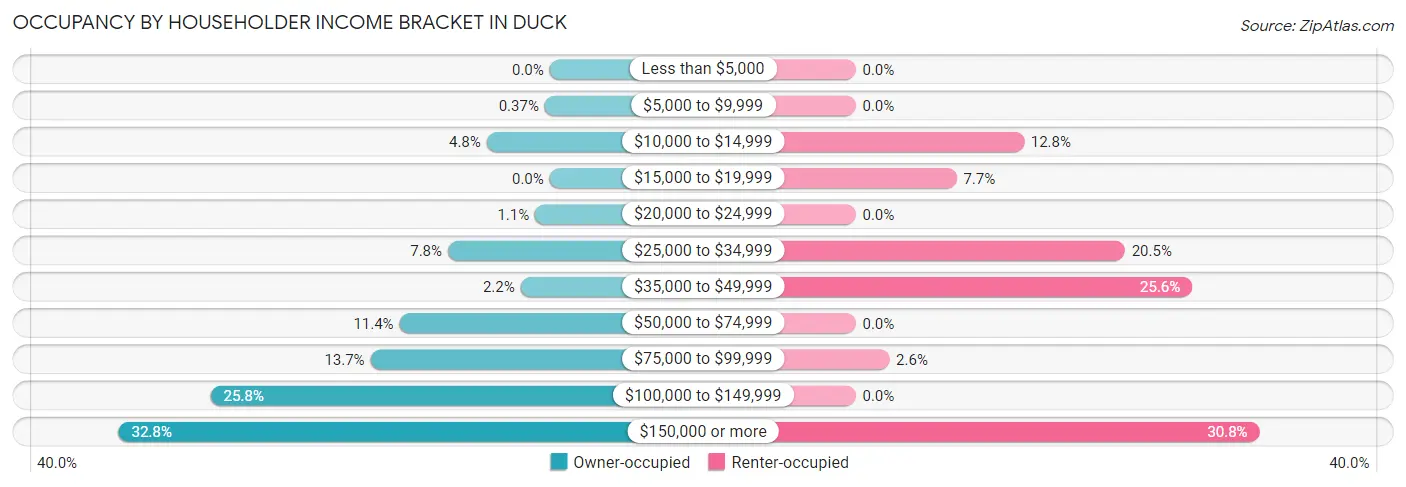
| Income Bracket | Owner-occupied | Renter-occupied |
| Less than $5,000 | 0 (0.0%) | 0 (0.0%) |
| $5,000 to $9,999 | 1 (0.4%) | 0 (0.0%) |
| $10,000 to $14,999 | 13 (4.8%) | 5 (12.8%) |
| $15,000 to $19,999 | 0 (0.0%) | 3 (7.7%) |
| $20,000 to $24,999 | 3 (1.1%) | 0 (0.0%) |
| $25,000 to $34,999 | 21 (7.7%) | 8 (20.5%) |
| $35,000 to $49,999 | 6 (2.2%) | 10 (25.6%) |
| $50,000 to $74,999 | 31 (11.4%) | 0 (0.0%) |
| $75,000 to $99,999 | 37 (13.7%) | 1 (2.6%) |
| $100,000 to $149,999 | 70 (25.8%) | 0 (0.0%) |
| $150,000 or more | 89 (32.8%) | 12 (30.8%) |
| Total | 271 (100.0%) | 39 (100.0%) |
Monthly Housing Cost Tiers in Duck
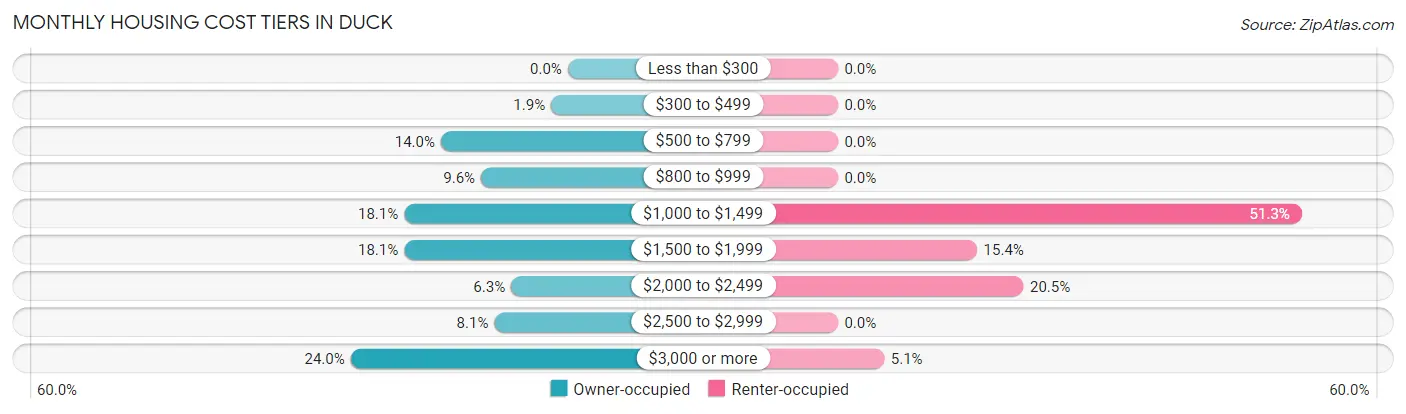
| Monthly Cost | Owner-occupied | Renter-occupied |
| Less than $300 | 0 (0.0%) | 0 (0.0%) |
| $300 to $499 | 5 (1.8%) | 0 (0.0%) |
| $500 to $799 | 38 (14.0%) | 0 (0.0%) |
| $800 to $999 | 26 (9.6%) | 0 (0.0%) |
| $1,000 to $1,499 | 49 (18.1%) | 20 (51.3%) |
| $1,500 to $1,999 | 49 (18.1%) | 6 (15.4%) |
| $2,000 to $2,499 | 17 (6.3%) | 8 (20.5%) |
| $2,500 to $2,999 | 22 (8.1%) | 0 (0.0%) |
| $3,000 or more | 65 (24.0%) | 2 (5.1%) |
| Total | 271 (100.0%) | 39 (100.0%) |
Physical Housing Characteristics in Duck
Housing Structures in Duck
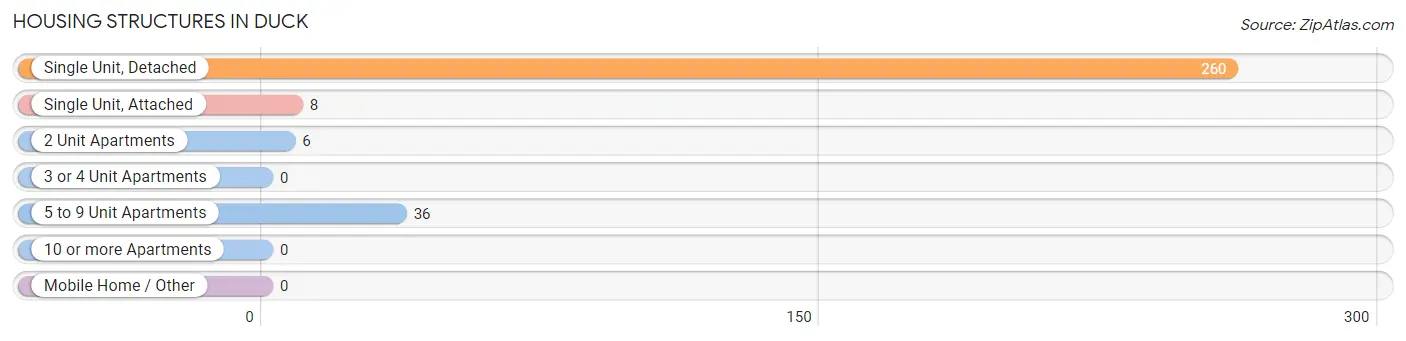
| Structure Type | # Housing Units | % Housing Units |
| Single Unit, Detached | 260 | 83.9% |
| Single Unit, Attached | 8 | 2.6% |
| 2 Unit Apartments | 6 | 1.9% |
| 3 or 4 Unit Apartments | 0 | 0.0% |
| 5 to 9 Unit Apartments | 36 | 11.6% |
| 10 or more Apartments | 0 | 0.0% |
| Mobile Home / Other | 0 | 0.0% |
| Total | 310 | 100.0% |
Housing Structures by Occupancy in Duck
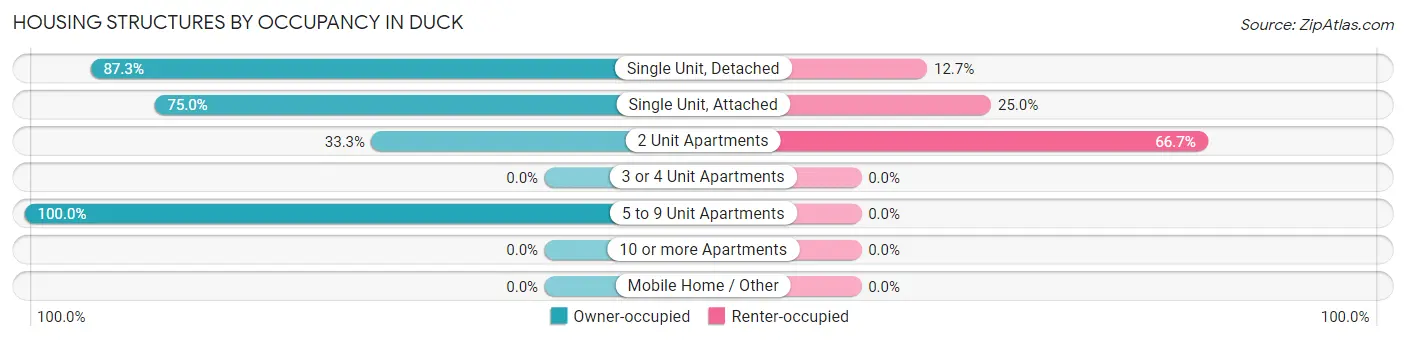
| Structure Type | Owner-occupied | Renter-occupied |
| Single Unit, Detached | 227 (87.3%) | 33 (12.7%) |
| Single Unit, Attached | 6 (75.0%) | 2 (25.0%) |
| 2 Unit Apartments | 2 (33.3%) | 4 (66.7%) |
| 3 or 4 Unit Apartments | 0 (0.0%) | 0 (0.0%) |
| 5 to 9 Unit Apartments | 36 (100.0%) | 0 (0.0%) |
| 10 or more Apartments | 0 (0.0%) | 0 (0.0%) |
| Mobile Home / Other | 0 (0.0%) | 0 (0.0%) |
| Total | 271 (87.4%) | 39 (12.6%) |
Housing Structures by Number of Rooms in Duck
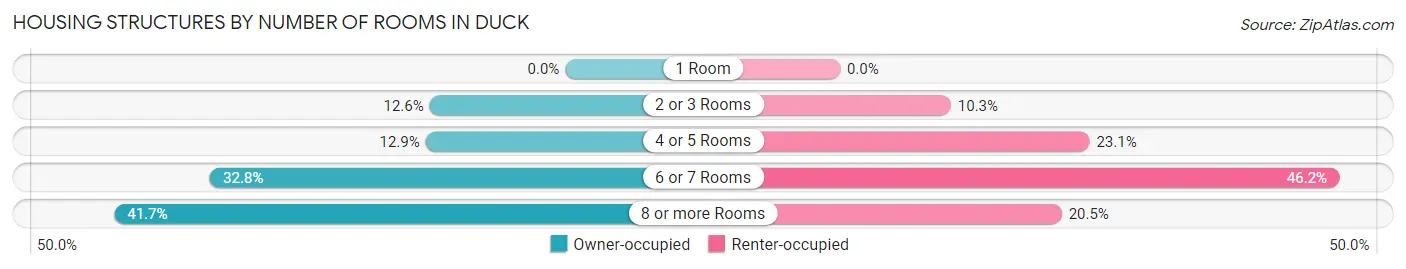
| Number of Rooms | Owner-occupied | Renter-occupied |
| 1 Room | 0 (0.0%) | 0 (0.0%) |
| 2 or 3 Rooms | 34 (12.6%) | 4 (10.3%) |
| 4 or 5 Rooms | 35 (12.9%) | 9 (23.1%) |
| 6 or 7 Rooms | 89 (32.8%) | 18 (46.2%) |
| 8 or more Rooms | 113 (41.7%) | 8 (20.5%) |
| Total | 271 (100.0%) | 39 (100.0%) |
Housing Structure by Heating Type in Duck
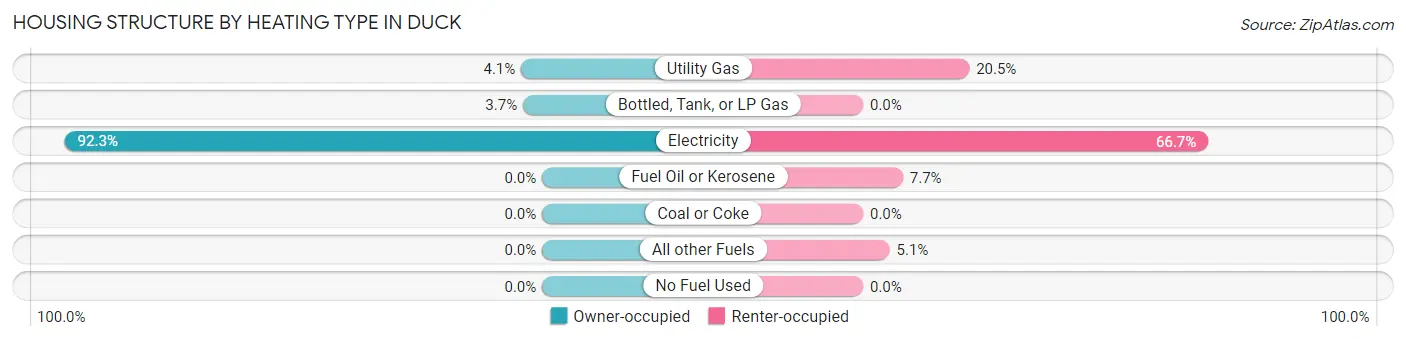
| Heating Type | Owner-occupied | Renter-occupied |
| Utility Gas | 11 (4.1%) | 8 (20.5%) |
| Bottled, Tank, or LP Gas | 10 (3.7%) | 0 (0.0%) |
| Electricity | 250 (92.2%) | 26 (66.7%) |
| Fuel Oil or Kerosene | 0 (0.0%) | 3 (7.7%) |
| Coal or Coke | 0 (0.0%) | 0 (0.0%) |
| All other Fuels | 0 (0.0%) | 2 (5.1%) |
| No Fuel Used | 0 (0.0%) | 0 (0.0%) |
| Total | 271 (100.0%) | 39 (100.0%) |
Household Vehicle Usage in Duck
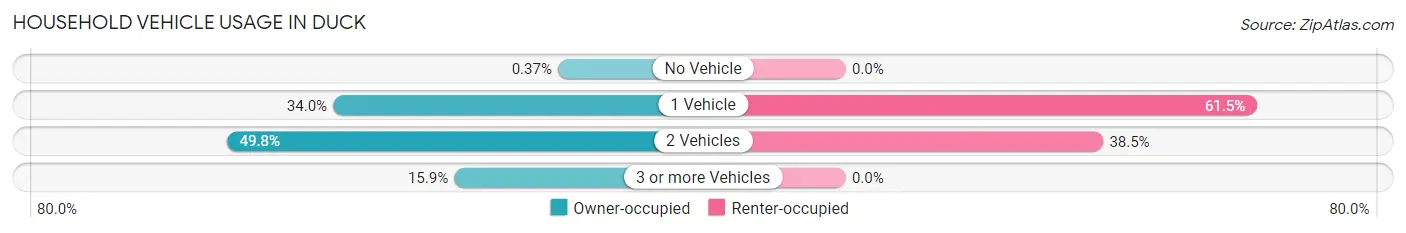
| Vehicles per Household | Owner-occupied | Renter-occupied |
| No Vehicle | 1 (0.4%) | 0 (0.0%) |
| 1 Vehicle | 92 (34.0%) | 24 (61.5%) |
| 2 Vehicles | 135 (49.8%) | 15 (38.5%) |
| 3 or more Vehicles | 43 (15.9%) | 0 (0.0%) |
| Total | 271 (100.0%) | 39 (100.0%) |
Real Estate & Mortgages in Duck
Real Estate and Mortgage Overview in Duck
| Characteristic | Without Mortgage | With Mortgage |
| Housing Units | 99 | 172 |
| Median Property Value | $657,300 | $615,700 |
| Median Household Income | $80,781 | $65 |
| Monthly Housing Costs | $920 | $65 |
| Real Estate Taxes | $4,176 | $3 |
Property Value by Mortgage Status in Duck
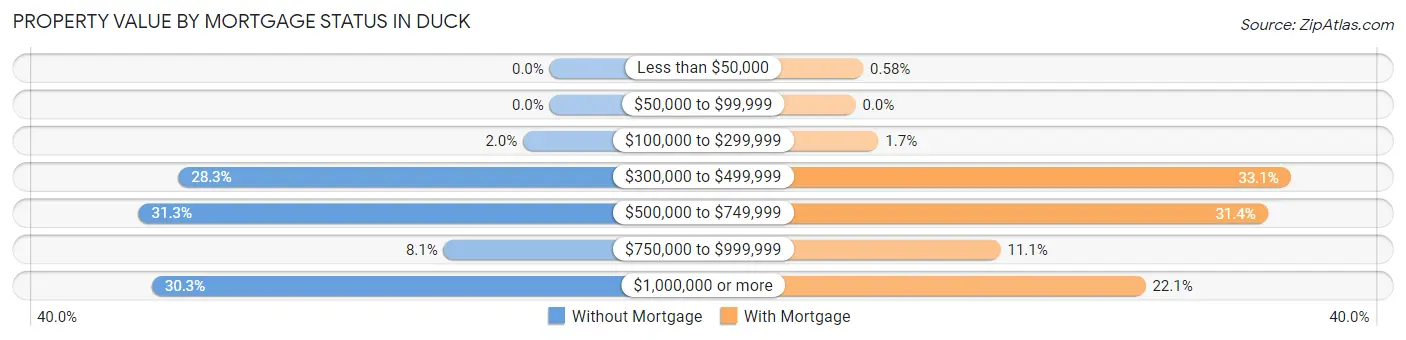
| Property Value | Without Mortgage | With Mortgage |
| Less than $50,000 | 0 (0.0%) | 1 (0.6%) |
| $50,000 to $99,999 | 0 (0.0%) | 0 (0.0%) |
| $100,000 to $299,999 | 2 (2.0%) | 3 (1.7%) |
| $300,000 to $499,999 | 28 (28.3%) | 57 (33.1%) |
| $500,000 to $749,999 | 31 (31.3%) | 54 (31.4%) |
| $750,000 to $999,999 | 8 (8.1%) | 19 (11.1%) |
| $1,000,000 or more | 30 (30.3%) | 38 (22.1%) |
| Total | 99 (100.0%) | 172 (100.0%) |
Household Income by Mortgage Status in Duck
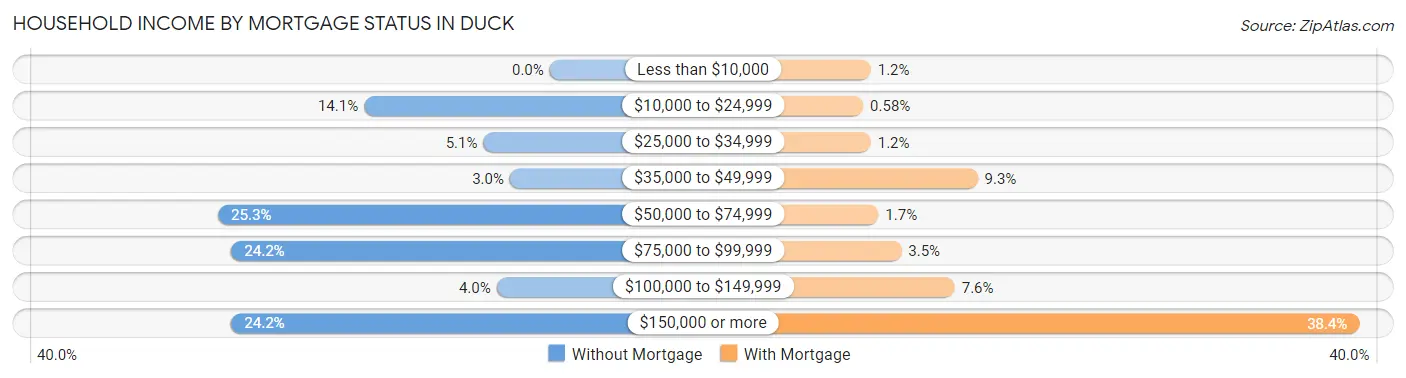
| Household Income | Without Mortgage | With Mortgage |
| Less than $10,000 | 0 (0.0%) | 2 (1.2%) |
| $10,000 to $24,999 | 14 (14.1%) | 1 (0.6%) |
| $25,000 to $34,999 | 5 (5.1%) | 2 (1.2%) |
| $35,000 to $49,999 | 3 (3.0%) | 16 (9.3%) |
| $50,000 to $74,999 | 25 (25.3%) | 3 (1.7%) |
| $75,000 to $99,999 | 24 (24.2%) | 6 (3.5%) |
| $100,000 to $149,999 | 4 (4.0%) | 13 (7.6%) |
| $150,000 or more | 24 (24.2%) | 66 (38.4%) |
| Total | 99 (100.0%) | 172 (100.0%) |
Property Value to Household Income Ratio in Duck
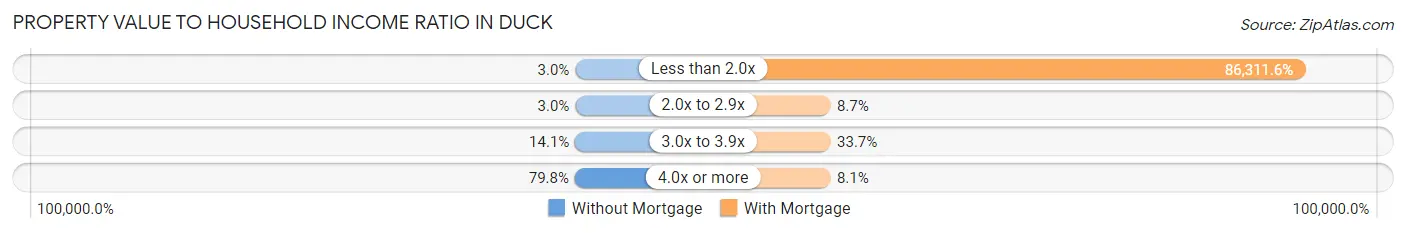
| Value-to-Income Ratio | Without Mortgage | With Mortgage |
| Less than 2.0x | 3 (3.0%) | 148,456 (86,311.6%) |
| 2.0x to 2.9x | 3 (3.0%) | 15 (8.7%) |
| 3.0x to 3.9x | 14 (14.1%) | 58 (33.7%) |
| 4.0x or more | 79 (79.8%) | 14 (8.1%) |
| Total | 99 (100.0%) | 172 (100.0%) |
Real Estate Taxes by Mortgage Status in Duck
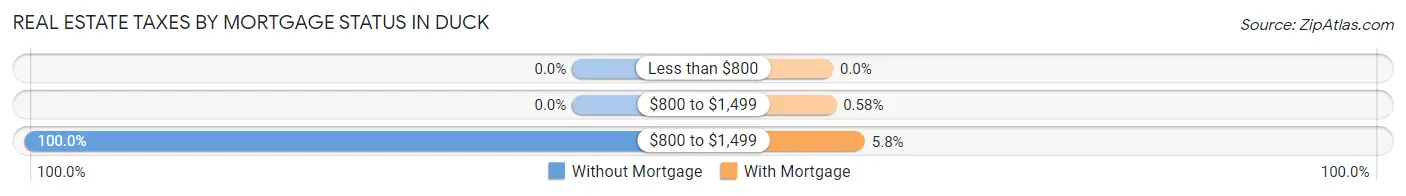
| Property Taxes | Without Mortgage | With Mortgage |
| Less than $800 | 0 (0.0%) | 0 (0.0%) |
| $800 to $1,499 | 0 (0.0%) | 1 (0.6%) |
| $800 to $1,499 | 99 (100.0%) | 10 (5.8%) |
| Total | 99 (100.0%) | 172 (100.0%) |
Health & Disability in Duck
Health Insurance Coverage by Age in Duck
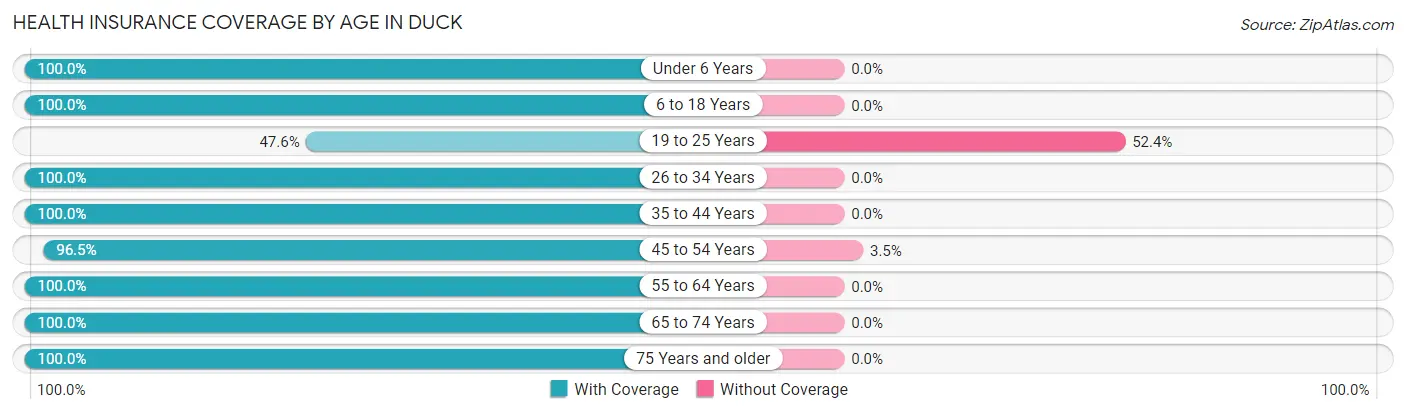
| Age Bracket | With Coverage | Without Coverage |
| Under 6 Years | 17 (100.0%) | 0 (0.0%) |
| 6 to 18 Years | 90 (100.0%) | 0 (0.0%) |
| 19 to 25 Years | 20 (47.6%) | 22 (52.4%) |
| 26 to 34 Years | 23 (100.0%) | 0 (0.0%) |
| 35 to 44 Years | 57 (100.0%) | 0 (0.0%) |
| 45 to 54 Years | 83 (96.5%) | 3 (3.5%) |
| 55 to 64 Years | 143 (100.0%) | 0 (0.0%) |
| 65 to 74 Years | 133 (100.0%) | 0 (0.0%) |
| 75 Years and older | 95 (100.0%) | 0 (0.0%) |
| Total | 661 (96.4%) | 25 (3.6%) |
Health Insurance Coverage by Citizenship Status in Duck
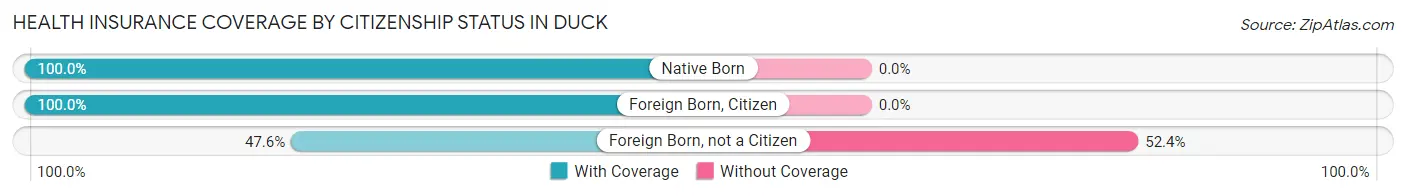
| Citizenship Status | With Coverage | Without Coverage |
| Native Born | 17 (100.0%) | 0 (0.0%) |
| Foreign Born, Citizen | 90 (100.0%) | 0 (0.0%) |
| Foreign Born, not a Citizen | 20 (47.6%) | 22 (52.4%) |
Health Insurance Coverage by Household Income in Duck
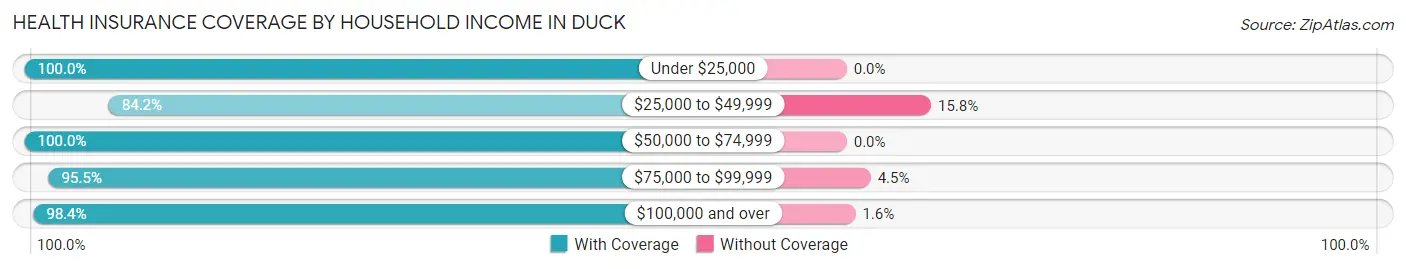
| Household Income | With Coverage | Without Coverage |
| Under $25,000 | 41 (100.0%) | 0 (0.0%) |
| $25,000 to $49,999 | 80 (84.2%) | 15 (15.8%) |
| $50,000 to $74,999 | 54 (100.0%) | 0 (0.0%) |
| $75,000 to $99,999 | 64 (95.5%) | 3 (4.5%) |
| $100,000 and over | 422 (98.4%) | 7 (1.6%) |
Public vs Private Health Insurance Coverage by Age in Duck
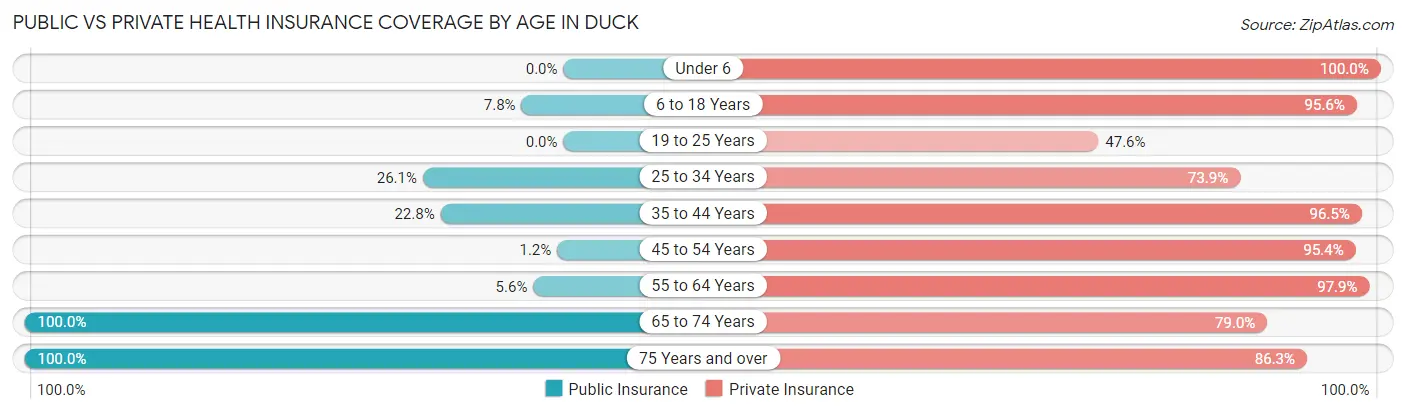
| Age Bracket | Public Insurance | Private Insurance |
| Under 6 | 0 (0.0%) | 17 (100.0%) |
| 6 to 18 Years | 7 (7.8%) | 86 (95.6%) |
| 19 to 25 Years | 0 (0.0%) | 20 (47.6%) |
| 25 to 34 Years | 6 (26.1%) | 17 (73.9%) |
| 35 to 44 Years | 13 (22.8%) | 55 (96.5%) |
| 45 to 54 Years | 1 (1.2%) | 82 (95.4%) |
| 55 to 64 Years | 8 (5.6%) | 140 (97.9%) |
| 65 to 74 Years | 133 (100.0%) | 105 (78.9%) |
| 75 Years and over | 95 (100.0%) | 82 (86.3%) |
| Total | 263 (38.3%) | 604 (88.0%) |
Disability Status by Sex by Age in Duck
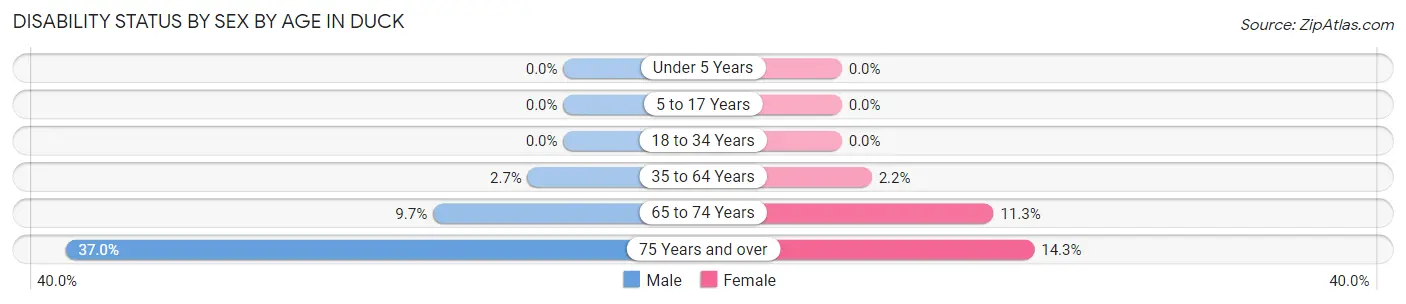
| Age Bracket | Male | Female |
| Under 5 Years | 0 (0.0%) | 0 (0.0%) |
| 5 to 17 Years | 0 (0.0%) | 0 (0.0%) |
| 18 to 34 Years | 0 (0.0%) | 0 (0.0%) |
| 35 to 64 Years | 4 (2.6%) | 3 (2.2%) |
| 65 to 74 Years | 6 (9.7%) | 8 (11.3%) |
| 75 Years and over | 17 (37.0%) | 7 (14.3%) |
Disability Class by Sex by Age in Duck
Disability Class: Hearing Difficulty
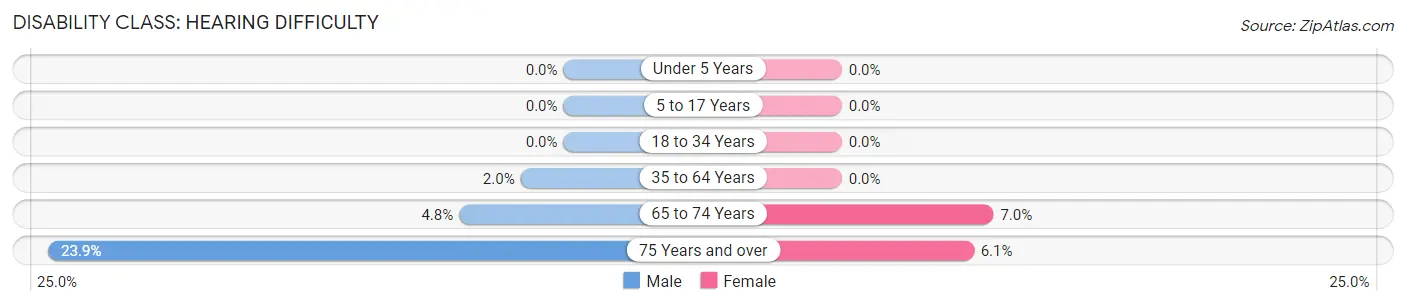
| Age Bracket | Male | Female |
| Under 5 Years | 0 (0.0%) | 0 (0.0%) |
| 5 to 17 Years | 0 (0.0%) | 0 (0.0%) |
| 18 to 34 Years | 0 (0.0%) | 0 (0.0%) |
| 35 to 64 Years | 3 (2.0%) | 0 (0.0%) |
| 65 to 74 Years | 3 (4.8%) | 5 (7.0%) |
| 75 Years and over | 11 (23.9%) | 3 (6.1%) |
Disability Class: Vision Difficulty
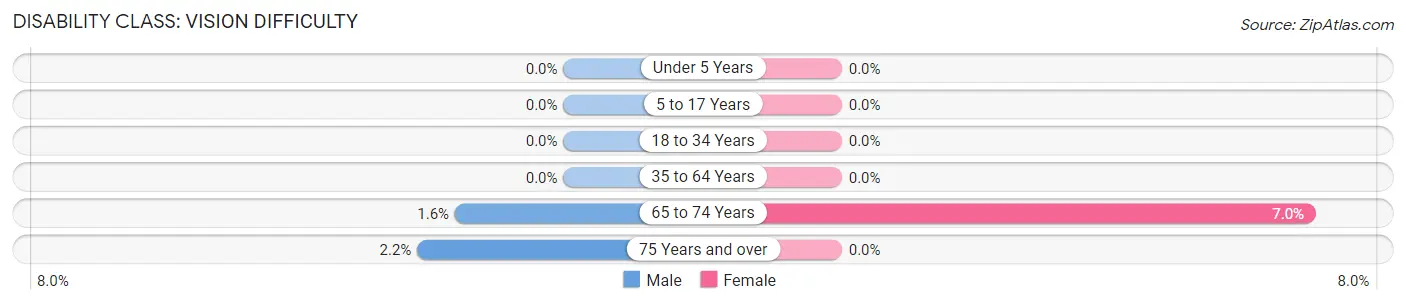
| Age Bracket | Male | Female |
| Under 5 Years | 0 (0.0%) | 0 (0.0%) |
| 5 to 17 Years | 0 (0.0%) | 0 (0.0%) |
| 18 to 34 Years | 0 (0.0%) | 0 (0.0%) |
| 35 to 64 Years | 0 (0.0%) | 0 (0.0%) |
| 65 to 74 Years | 1 (1.6%) | 5 (7.0%) |
| 75 Years and over | 1 (2.2%) | 0 (0.0%) |
Disability Class: Cognitive Difficulty
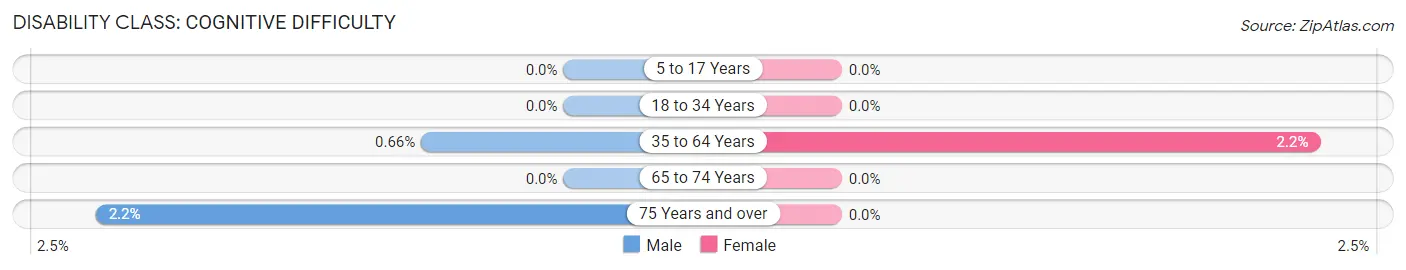
| Age Bracket | Male | Female |
| 5 to 17 Years | 0 (0.0%) | 0 (0.0%) |
| 18 to 34 Years | 0 (0.0%) | 0 (0.0%) |
| 35 to 64 Years | 1 (0.7%) | 3 (2.2%) |
| 65 to 74 Years | 0 (0.0%) | 0 (0.0%) |
| 75 Years and over | 1 (2.2%) | 0 (0.0%) |
Disability Class: Ambulatory Difficulty
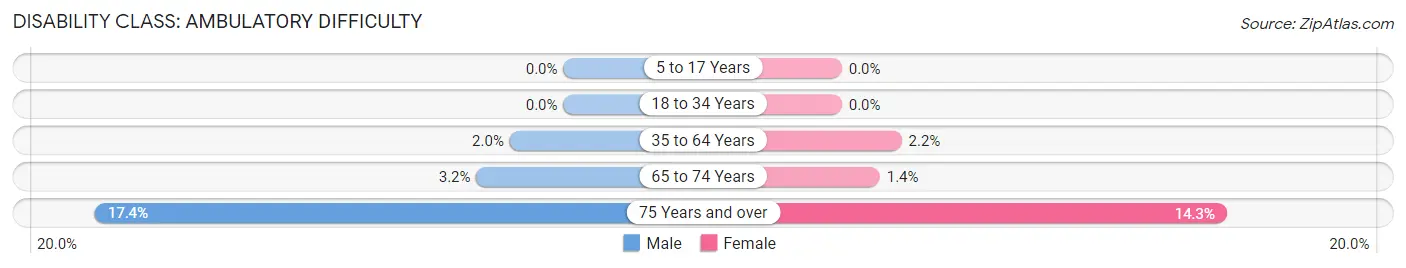
| Age Bracket | Male | Female |
| 5 to 17 Years | 0 (0.0%) | 0 (0.0%) |
| 18 to 34 Years | 0 (0.0%) | 0 (0.0%) |
| 35 to 64 Years | 3 (2.0%) | 3 (2.2%) |
| 65 to 74 Years | 2 (3.2%) | 1 (1.4%) |
| 75 Years and over | 8 (17.4%) | 7 (14.3%) |
Disability Class: Self-Care Difficulty
| Age Bracket | Male | Female |
| 5 to 17 Years | 0 (0.0%) | 0 (0.0%) |
| 18 to 34 Years | 0 (0.0%) | 0 (0.0%) |
| 35 to 64 Years | 0 (0.0%) | 0 (0.0%) |
| 65 to 74 Years | 0 (0.0%) | 0 (0.0%) |
| 75 Years and over | 0 (0.0%) | 0 (0.0%) |
Technology Access in Duck
Computing Device Access in Duck
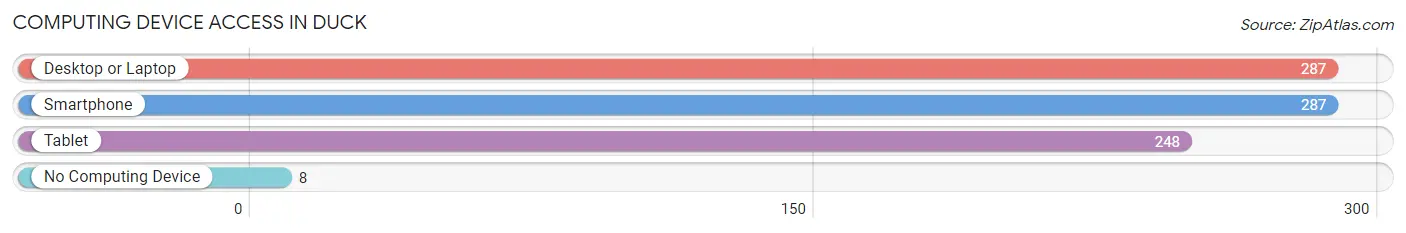
| Device Type | # Households | % Households |
| Desktop or Laptop | 287 | 92.6% |
| Smartphone | 287 | 92.6% |
| Tablet | 248 | 80.0% |
| No Computing Device | 8 | 2.6% |
| Total | 310 | 100.0% |
Internet Access in Duck
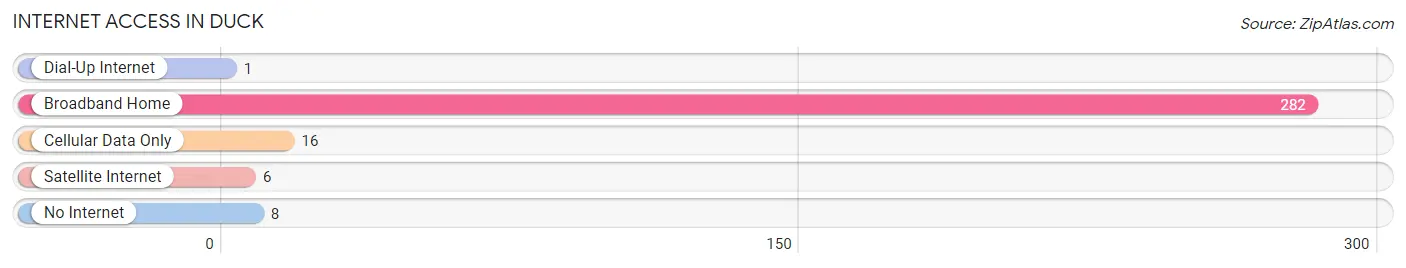
| Internet Type | # Households | % Households |
| Dial-Up Internet | 1 | 0.3% |
| Broadband Home | 282 | 91.0% |
| Cellular Data Only | 16 | 5.2% |
| Satellite Internet | 6 | 1.9% |
| No Internet | 8 | 2.6% |
| Total | 310 | 100.0% |
Duck Summary
Duck, North Carolina is a small town located in the Outer Banks region of the state. It is situated on the northern end of the Currituck Banks, a barrier island chain that stretches along the Atlantic coast of North Carolina. The town is bordered by the Currituck Sound to the west and the Atlantic Ocean to the east. Duck is a popular tourist destination, known for its beaches, wildlife, and outdoor activities.
History
The area that is now Duck was first inhabited by Native Americans, who used the area for hunting and fishing. The first European settlers arrived in the area in the late 1700s, and the town was officially incorporated in 1883. The town was named after the wild ducks that were abundant in the area.
In the early 1900s, Duck became a popular destination for tourists, who came to enjoy the beaches and the wildlife. The town was also a popular spot for fishing and hunting. In the 1950s, the town began to develop as a resort community, with the construction of several hotels and resorts.
Geography
Duck is located in the Outer Banks region of North Carolina, on the northern end of the Currituck Banks. The town is bordered by the Currituck Sound to the west and the Atlantic Ocean to the east. The town is situated on a narrow strip of land between the sound and the ocean, and is surrounded by wetlands and marshlands.
The town is located in Dare County, and is part of the Outer Banks region. The town is located approximately 40 miles south of Nags Head, and is about a two-hour drive from the state capital of Raleigh.
Economy
Duck’s economy is largely based on tourism. The town is a popular destination for beachgoers, and is known for its wildlife and outdoor activities. The town is also home to several resorts and hotels, which provide employment for many of the town’s residents.
The town is also home to several restaurants, shops, and other businesses. The town is also home to a number of art galleries, which feature the work of local artists.
Demographics
As of the 2010 census, the population of Duck was 365. The town has a median age of 48.7 years, and a median household income of $62,500. The town is predominantly white, with 92.3% of the population identifying as white. The town also has a small Hispanic population, with 4.3% of the population identifying as Hispanic or Latino.
Conclusion
Duck, North Carolina is a small town located in the Outer Banks region of the state. It is a popular tourist destination, known for its beaches, wildlife, and outdoor activities. The town’s economy is largely based on tourism, and the town is home to several resorts and hotels. The town has a predominantly white population, with a median age of 48.7 years and a median household income of $62,500. Duck is a popular destination for beachgoers, and is known for its wildlife and outdoor activities.
Common Questions
What is the Total Population of Duck?
Total Population of Duck is 686.
What is the Total Male Population of Duck?
Total Male Population of Duck is 323.
What is the Total Female Population of Duck?
Total Female Population of Duck is 363.
What is the Ratio of Males per 100 Females in Duck?
There are 88.98 Males per 100 Females in Duck.
What is the Ratio of Females per 100 Males in Duck?
There are 112.38 Females per 100 Males in Duck.
What is the Median Population Age in Duck?
Median Population Age in Duck is 57.1 Years.
What is the Average Family Size in Duck
Average Family Size in Duck is 2.6 People.
What is the Average Household Size in Duck
Average Household Size in Duck is 2.2 People.
What is Per Capita Income in Duck?
Per Capita income in Duck is $71,337.
What is the Median Family Income in Duck?
Median Family Income in Duck is $139,318.
What is the Median Household income in Duck?
Median Household Income in Duck is $122,500.
What is Income or Wage Gap in Duck?
Income or Wage Gap in Duck is 76.1%.
Women in Duck earn 23.9 cents for every dollar earned by a man.
What is Family Income Deficit in Duck?
Family Income Deficit in Duck is $5,383.
Families that are below poverty line in Duck earn $5,383 less on average than the poverty threshold level.
What is Inequality or Gini Index in Duck?
Inequality or Gini Index in Duck is 0.47.
How Large is the Labor Force in Duck?
There are 288 People in the Labor Forcein in Duck.
What is the Percentage of People in the Labor Force in Duck?
47.1% of People are in the Labor Force in Duck.
What is the Unemployment Rate in Duck?
Unemployment Rate in Duck is 1.4%.