Ingold, NC
Ingold Map
Ingold Overview
757
TOTAL POPULATION
502
MALE POPULATION
255
FEMALE POPULATION
196.86
MALES / 100 FEMALES
50.80
FEMALES / 100 MALES
25.4
MEDIAN AGE
6.7
AVG FAMILY SIZE
4.6
AVG HOUSEHOLD SIZE
$18,080
PER CAPITA INCOME
$67,674
AVG FAMILY INCOME
$38,281
AVG HOUSEHOLD INCOME
48.2%
WAGE / INCOME GAP [ % ]
51.8¢/ $1
WAGE / INCOME GAP [ $ ]
0.32
INEQUALITY / GINI INDEX
368
LABOR FORCE [ PEOPLE ]
81.8%
PERCENT IN LABOR FORCE
29.3%
UNEMPLOYMENT RATE
Ingold Area Codes
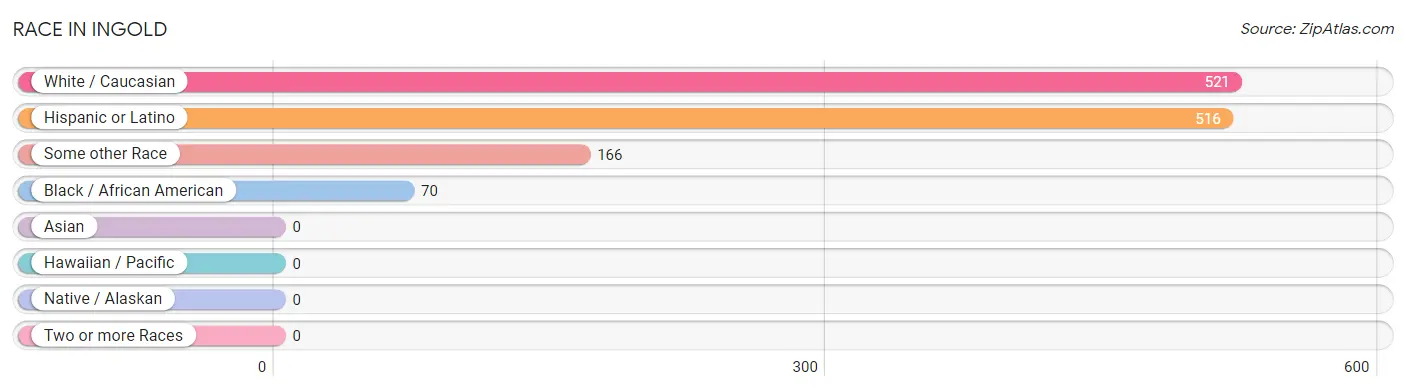
Race in Ingold
The most populous races in Ingold are White / Caucasian (521 | 68.8%), Hispanic or Latino (516 | 68.2%), and Some other Race (166 | 21.9%).
| Race | # Population | % Population |
| Asian | 0 | 0.0% |
| Black / African American | 70 | 9.2% |
| Hawaiian / Pacific | 0 | 0.0% |
| Hispanic or Latino | 516 | 68.2% |
| Native / Alaskan | 0 | 0.0% |
| White / Caucasian | 521 | 68.8% |
| Two or more Races | 0 | 0.0% |
| Some other Race | 166 | 21.9% |
| Total | 757 | 100.0% |
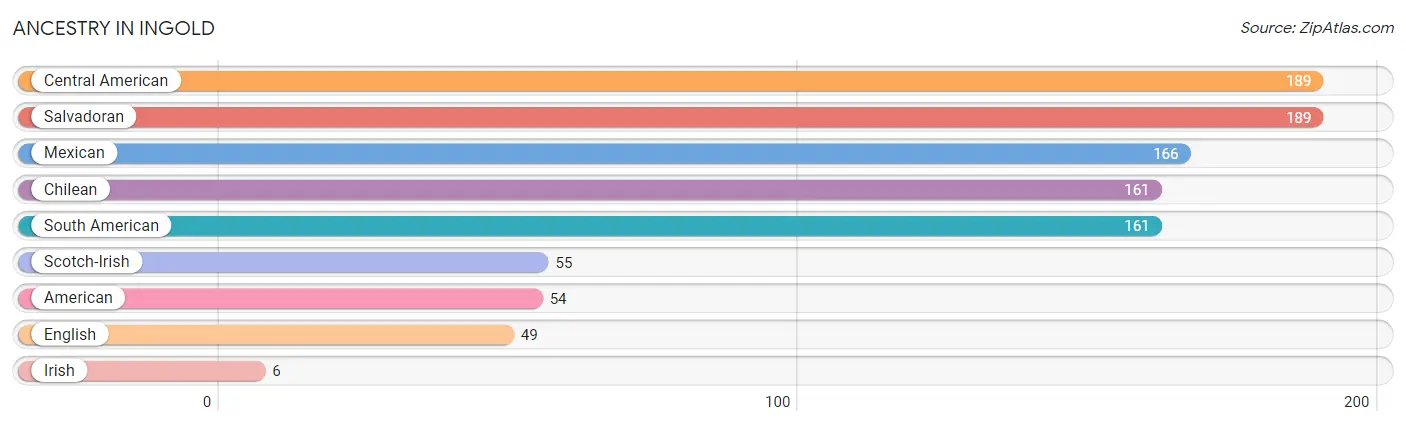
Ancestry in Ingold
The most populous ancestries reported in Ingold are Central American (189 | 25.0%), Salvadoran (189 | 25.0%), Mexican (166 | 21.9%), Chilean (161 | 21.3%), and South American (161 | 21.3%), together accounting for 114.4% of all Ingold residents.
| Ancestry | # Population | % Population |
| American | 54 | 7.1% |
| Central American | 189 | 25.0% |
| Chilean | 161 | 21.3% |
| English | 49 | 6.5% |
| Irish | 6 | 0.8% |
| Mexican | 166 | 21.9% |
| Salvadoran | 189 | 25.0% |
| Scotch-Irish | 55 | 7.3% |
| South American | 161 | 21.3% | View All 9 Rows |
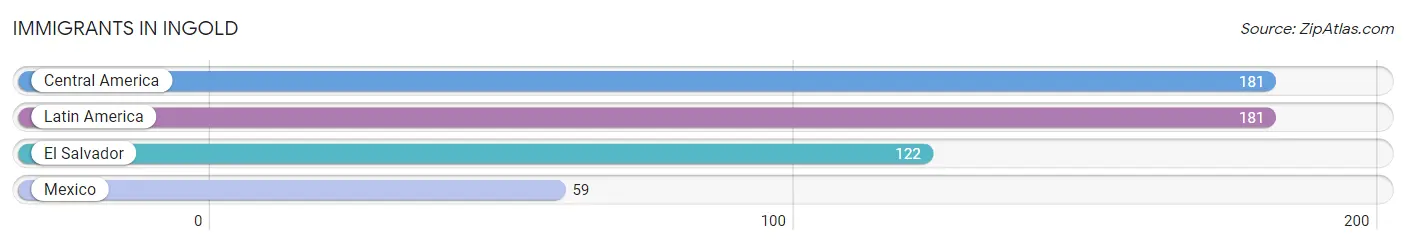
Immigrants in Ingold
The most numerous immigrant groups reported in Ingold came from Central America (181 | 23.9%), Latin America (181 | 23.9%), El Salvador (122 | 16.1%), and Mexico (59 | 7.8%), together accounting for 71.7% of all Ingold residents.
| Immigration Origin | # Population | % Population |
| Central America | 181 | 23.9% |
| El Salvador | 122 | 16.1% |
| Latin America | 181 | 23.9% |
| Mexico | 59 | 7.8% | View All 4 Rows |
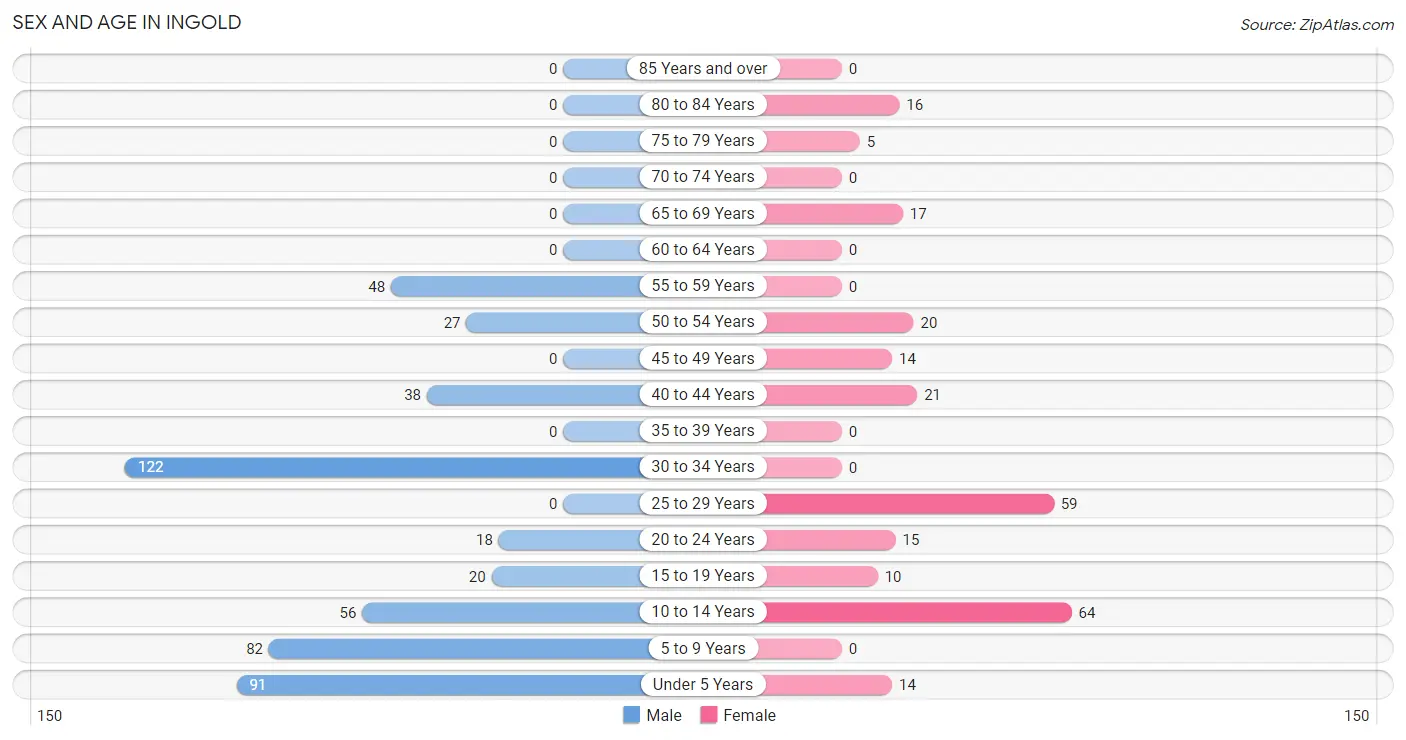
Sex and Age in Ingold
Sex and Age in Ingold
The most populous age groups in Ingold are 30 to 34 Years (122 | 24.3%) for men and 10 to 14 Years (64 | 25.1%) for women.
| Age Bracket | Male | Female |
| Under 5 Years | 91 (18.1%) | 14 (5.5%) |
| 5 to 9 Years | 82 (16.3%) | 0 (0.0%) |
| 10 to 14 Years | 56 (11.2%) | 64 (25.1%) |
| 15 to 19 Years | 20 (4.0%) | 10 (3.9%) |
| 20 to 24 Years | 18 (3.6%) | 15 (5.9%) |
| 25 to 29 Years | 0 (0.0%) | 59 (23.1%) |
| 30 to 34 Years | 122 (24.3%) | 0 (0.0%) |
| 35 to 39 Years | 0 (0.0%) | 0 (0.0%) |
| 40 to 44 Years | 38 (7.6%) | 21 (8.2%) |
| 45 to 49 Years | 0 (0.0%) | 14 (5.5%) |
| 50 to 54 Years | 27 (5.4%) | 20 (7.8%) |
| 55 to 59 Years | 48 (9.6%) | 0 (0.0%) |
| 60 to 64 Years | 0 (0.0%) | 0 (0.0%) |
| 65 to 69 Years | 0 (0.0%) | 17 (6.7%) |
| 70 to 74 Years | 0 (0.0%) | 0 (0.0%) |
| 75 to 79 Years | 0 (0.0%) | 5 (2.0%) |
| 80 to 84 Years | 0 (0.0%) | 16 (6.3%) |
| 85 Years and over | 0 (0.0%) | 0 (0.0%) |
| Total | 502 (100.0%) | 255 (100.0%) |
Families and Households in Ingold
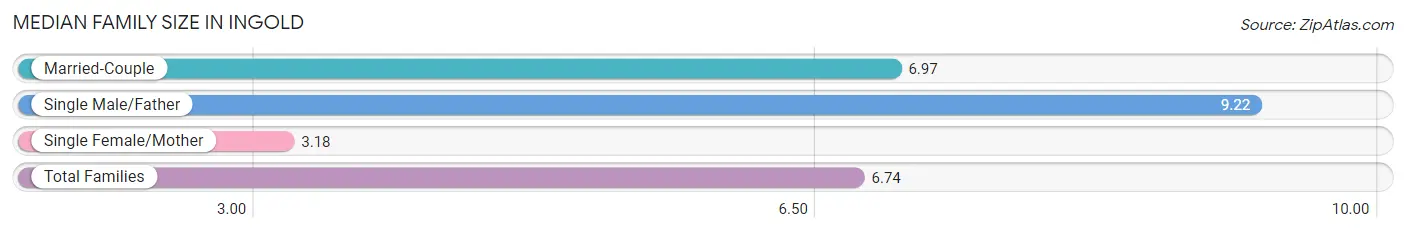
Median Family Size in Ingold
The median family size in Ingold is 6.74 persons per family, with single male/father families (18 | 17.5%) accounting for the largest median family size of 9.22 persons per family. On the other hand, single female/mother families (17 | 16.5%) represent the smallest median family size with 3.18 persons per family.
| Family Type | # Families | Family Size |
| Married-Couple | 68 (66.0%) | 6.97 |
| Single Male/Father | 18 (17.5%) | 9.22 |
| Single Female/Mother | 17 (16.5%) | 3.18 |
| Total Families | 103 (100.0%) | 6.74 |
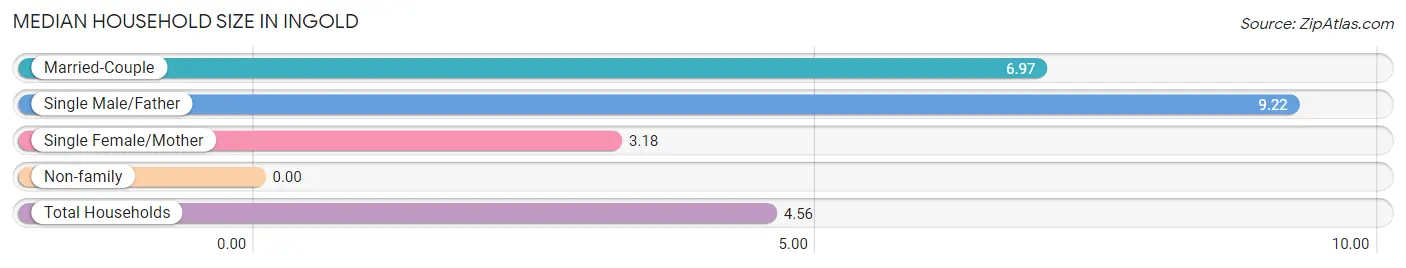
Median Household Size in Ingold
| Household Type | # Households | Household Size |
| Married-Couple | 68 (41.0%) | 6.97 |
| Single Male/Father | 18 (10.8%) | 9.22 |
| Single Female/Mother | 17 (10.2%) | 3.18 |
| Non-family | 63 (38.0%) | - |
| Total Households | 166 (100.0%) | 4.56 |
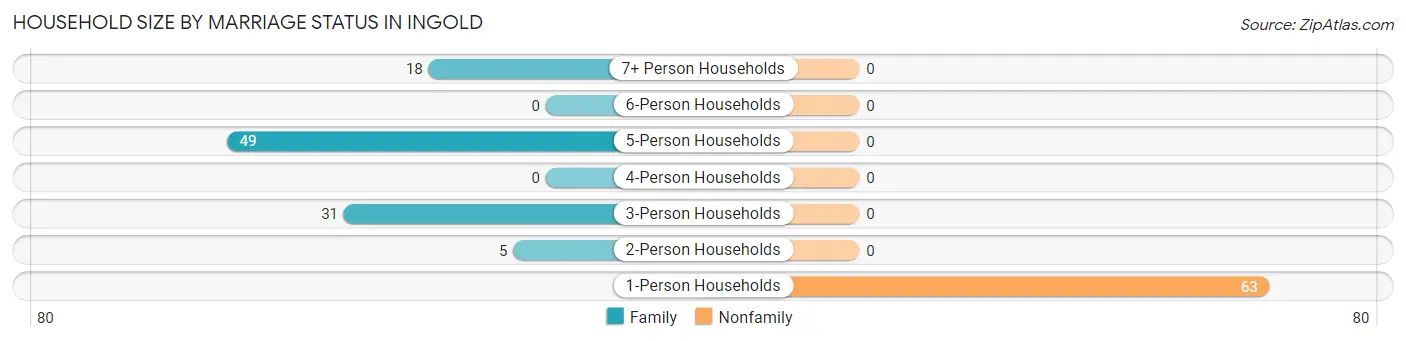
Household Size by Marriage Status in Ingold
Out of a total of 166 households in Ingold, 103 (62.1%) are family households, while 63 (38.0%) are nonfamily households. The most numerous type of family households are 5-person households, comprising 49, and the most common type of nonfamily households are 1-person households, comprising 63.
| Household Size | Family Households | Nonfamily Households |
| 1-Person Households | - | 63 (38.0%) |
| 2-Person Households | 5 (3.0%) | 0 (0.0%) |
| 3-Person Households | 31 (18.7%) | 0 (0.0%) |
| 4-Person Households | 0 (0.0%) | 0 (0.0%) |
| 5-Person Households | 49 (29.5%) | 0 (0.0%) |
| 6-Person Households | 0 (0.0%) | 0 (0.0%) |
| 7+ Person Households | 18 (10.8%) | 0 (0.0%) |
| Total | 103 (62.1%) | 63 (38.0%) |
Female Fertility in Ingold
Fertility by Age in Ingold
Average fertility rate in Ingold is 157.0 births per 1,000 women. Women in the age bracket of 35 to 50 years have the highest fertility rate with 420.0 births per 1,000 women. Women in the age bracket of 35 to 50 years acount for 100.0% of all women with births.
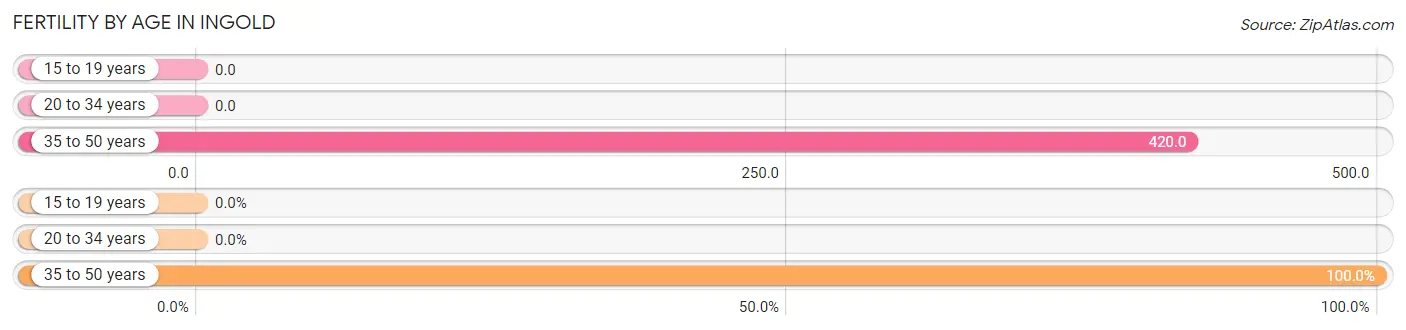
| Age Bracket | Women with Births | Births / 1,000 Women |
| 15 to 19 years | 0 (0.0%) | 0.0 |
| 20 to 34 years | 0 (0.0%) | 0.0 |
| 35 to 50 years | 21 (100.0%) | 420.0 |
| Total | 21 (100.0%) | 157.0 |
Fertility by Age by Marriage Status in Ingold
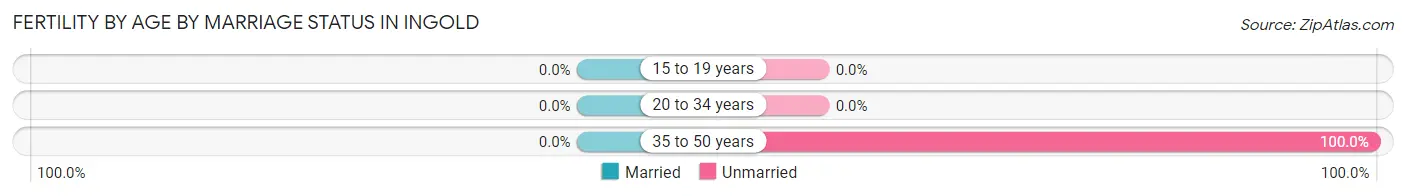
| Age Bracket | Married | Unmarried |
| 15 to 19 years | 0 (0.0%) | 0 (0.0%) |
| 20 to 34 years | 0 (0.0%) | 0 (0.0%) |
| 35 to 50 years | 0 (0.0%) | 21 (100.0%) |
| Total | 0 (0.0%) | 21 (100.0%) |
Fertility by Education in Ingold
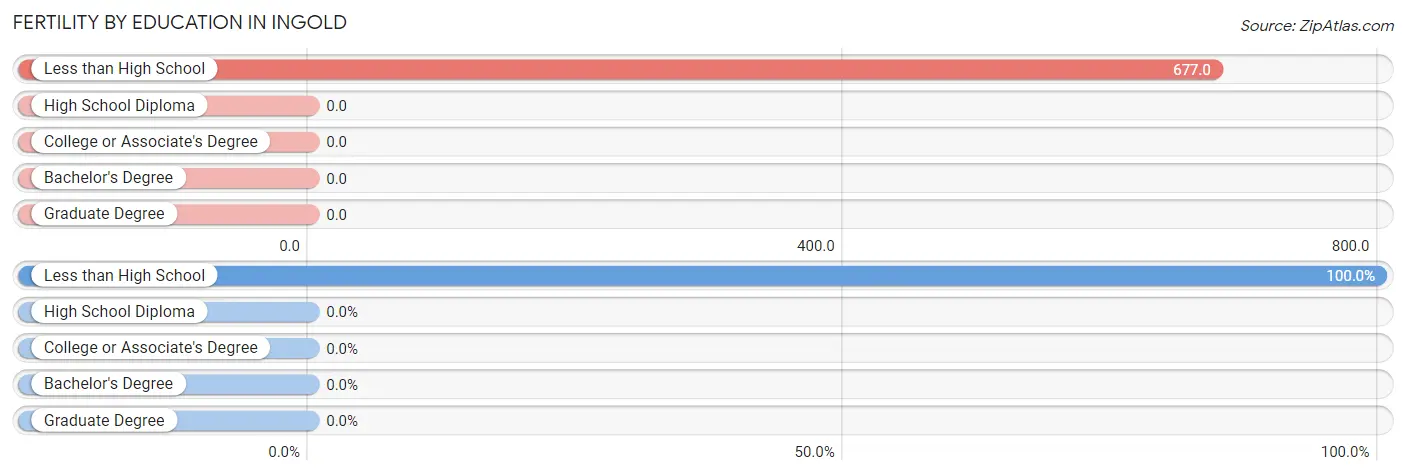
| Educational Attainment | Women with Births | Births / 1,000 Women |
| Less than High School | 21 (100.0%) | 677.0 |
| High School Diploma | 0 (0.0%) | 0.0 |
| College or Associate's Degree | 0 (0.0%) | 0.0 |
| Bachelor's Degree | 0 (0.0%) | 0.0 |
| Graduate Degree | 0 (0.0%) | 0.0 |
| Total | 21 (100.0%) | 157.0 |
Fertility by Education by Marriage Status in Ingold
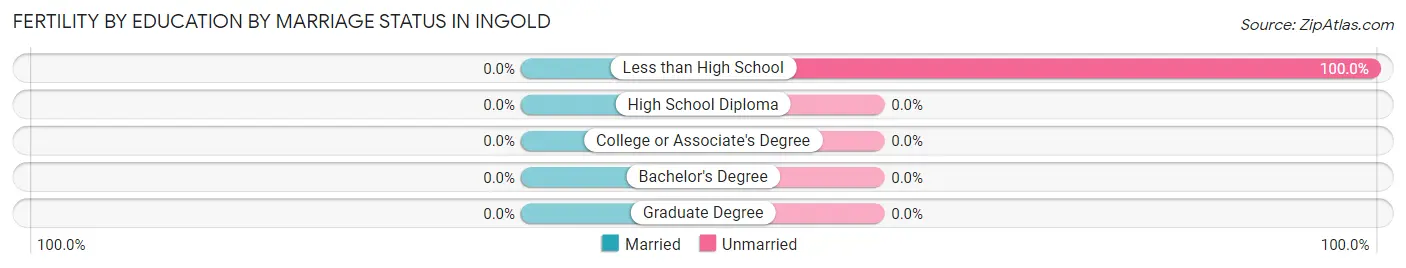
| Educational Attainment | Married | Unmarried |
| Less than High School | 0 (0.0%) | 21 (100.0%) |
| High School Diploma | 0 (0.0%) | 0 (0.0%) |
| College or Associate's Degree | 0 (0.0%) | 0 (0.0%) |
| Bachelor's Degree | 0 (0.0%) | 0 (0.0%) |
| Graduate Degree | 0 (0.0%) | 0 (0.0%) |
| Total | 0 (0.0%) | 21 (100.0%) |
Income in Ingold
Income Overview in Ingold
Per Capita Income in Ingold is $18,080, while median incomes of families and households are $67,674 and $38,281 respectively.
| Characteristic | Number | Measure |
| Per Capita Income | 757 | $18,080 |
| Median Family Income | 103 | $67,674 |
| Mean Family Income | 103 | $63,530 |
| Median Household Income | 166 | $38,281 |
| Mean Household Income | 166 | $52,501 |
| Income Deficit | 103 | $0 |
| Wage / Income Gap (%) | 757 | 48.24% |
| Wage / Income Gap ($) | 757 | 51.76¢ per $1 |
| Gini / Inequality Index | 757 | 0.32 |
Earnings by Sex in Ingold
Average Earnings in Ingold are $33,006, $41,058 for men and $21,250 for women, a difference of 48.2%.
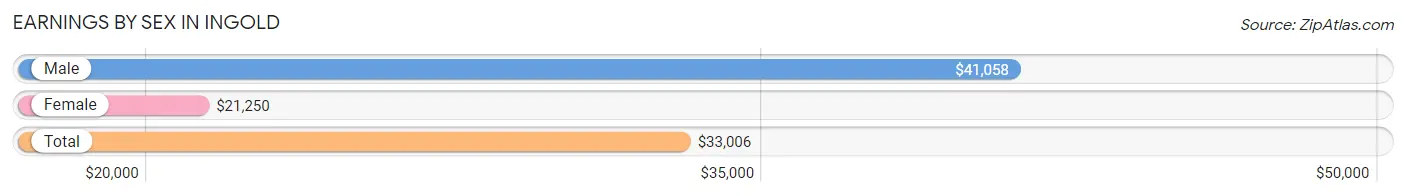
| Sex | Number | Average Earnings |
| Male | 259 (69.1%) | $41,058 |
| Female | 116 (30.9%) | $21,250 |
| Total | 375 (100.0%) | $33,006 |
Earnings by Sex by Income Bracket in Ingold
The most common earnings brackets in Ingold are $45,000 to $49,999 for men (122 | 47.1%) and $20,000 to $22,499 for women (36 | 31.0%).
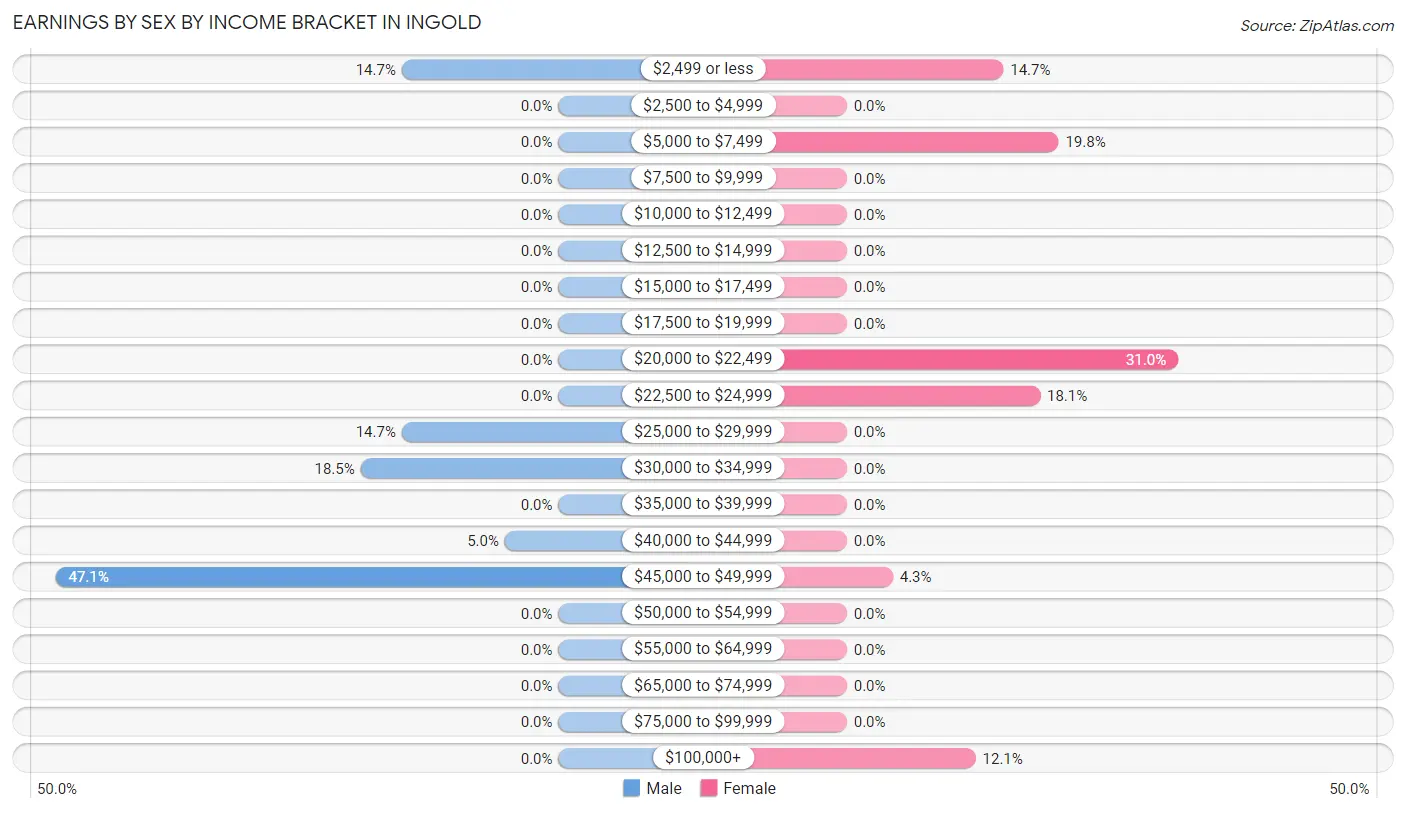
| Income | Male | Female |
| $2,499 or less | 38 (14.7%) | 17 (14.7%) |
| $2,500 to $4,999 | 0 (0.0%) | 0 (0.0%) |
| $5,000 to $7,499 | 0 (0.0%) | 23 (19.8%) |
| $7,500 to $9,999 | 0 (0.0%) | 0 (0.0%) |
| $10,000 to $12,499 | 0 (0.0%) | 0 (0.0%) |
| $12,500 to $14,999 | 0 (0.0%) | 0 (0.0%) |
| $15,000 to $17,499 | 0 (0.0%) | 0 (0.0%) |
| $17,500 to $19,999 | 0 (0.0%) | 0 (0.0%) |
| $20,000 to $22,499 | 0 (0.0%) | 36 (31.0%) |
| $22,500 to $24,999 | 0 (0.0%) | 21 (18.1%) |
| $25,000 to $29,999 | 38 (14.7%) | 0 (0.0%) |
| $30,000 to $34,999 | 48 (18.5%) | 0 (0.0%) |
| $35,000 to $39,999 | 0 (0.0%) | 0 (0.0%) |
| $40,000 to $44,999 | 13 (5.0%) | 0 (0.0%) |
| $45,000 to $49,999 | 122 (47.1%) | 5 (4.3%) |
| $50,000 to $54,999 | 0 (0.0%) | 0 (0.0%) |
| $55,000 to $64,999 | 0 (0.0%) | 0 (0.0%) |
| $65,000 to $74,999 | 0 (0.0%) | 0 (0.0%) |
| $75,000 to $99,999 | 0 (0.0%) | 0 (0.0%) |
| $100,000+ | 0 (0.0%) | 14 (12.1%) |
| Total | 259 (100.0%) | 116 (100.0%) |
Earnings by Sex by Educational Attainment in Ingold
| Educational Attainment | Male Income | Female Income |
| Less than High School | - | - |
| High School Diploma | - | - |
| College or Associate's Degree | - | - |
| Bachelor's Degree | - | - |
| Graduate Degree | - | - |
| Total | $47,736 | $21,250 |
Family Income in Ingold
Family Income Brackets in Ingold
According to the Ingold family income data, there are 54 families falling into the $50,000 to $74,999 income range, which is the most common income bracket and makes up 52.4% of all families.
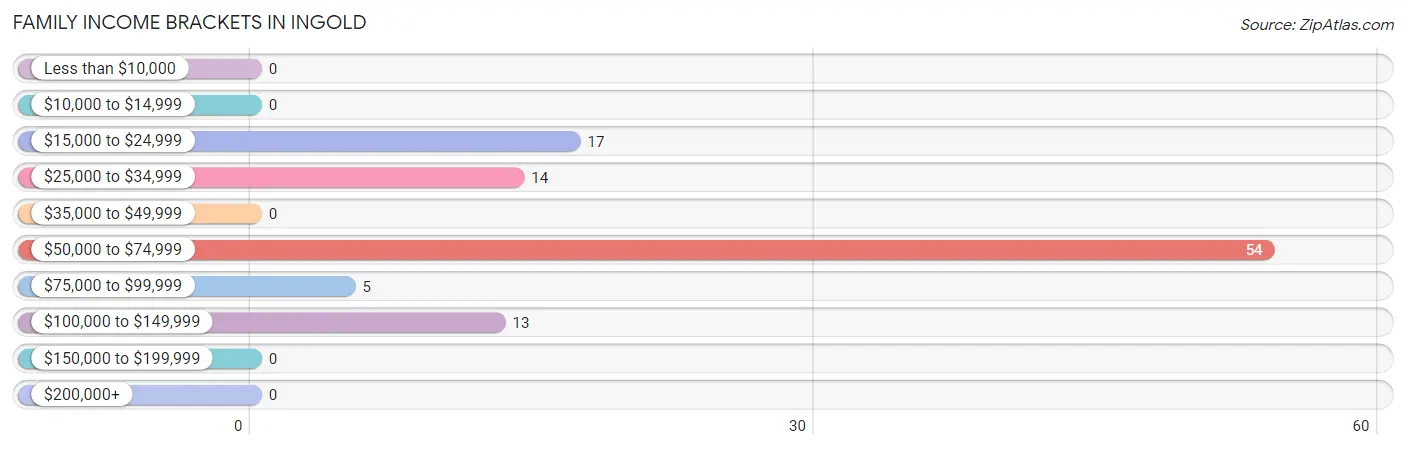
| Income Bracket | # Families | % Families |
| Less than $10,000 | 0 | 0.0% |
| $10,000 to $14,999 | 0 | 0.0% |
| $15,000 to $24,999 | 17 | 16.5% |
| $25,000 to $34,999 | 14 | 13.6% |
| $35,000 to $49,999 | 0 | 0.0% |
| $50,000 to $74,999 | 54 | 52.4% |
| $75,000 to $99,999 | 5 | 4.9% |
| $100,000 to $149,999 | 13 | 12.6% |
| $150,000 to $199,999 | 0 | 0.0% |
| $200,000+ | 0 | 0.0% |
Family Income by Famaliy Size in Ingold
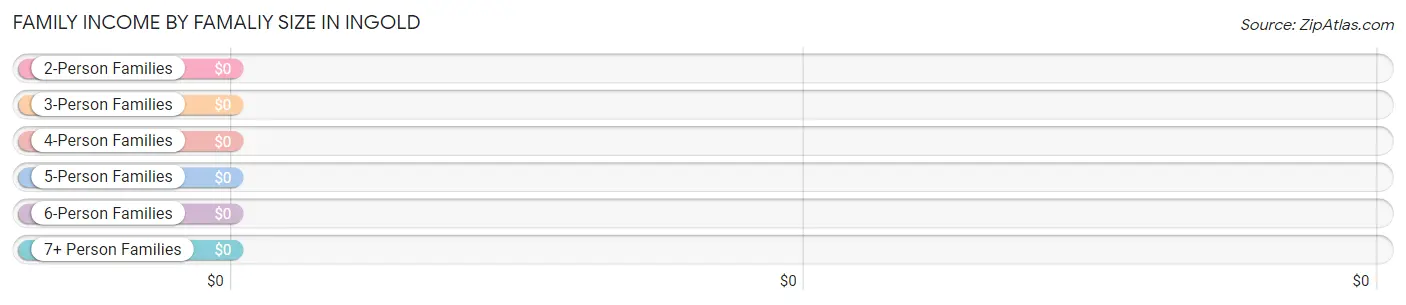
| Income Bracket | # Families | Median Income |
| 2-Person Families | 5 (4.9%) | $0 |
| 3-Person Families | 31 (30.1%) | $0 |
| 4-Person Families | 0 (0.0%) | $0 |
| 5-Person Families | 49 (47.6%) | $0 |
| 6-Person Families | 0 (0.0%) | $0 |
| 7+ Person Families | 18 (17.5%) | $0 |
| Total | 103 (100.0%) | $67,674 |
Family Income by Number of Earners in Ingold
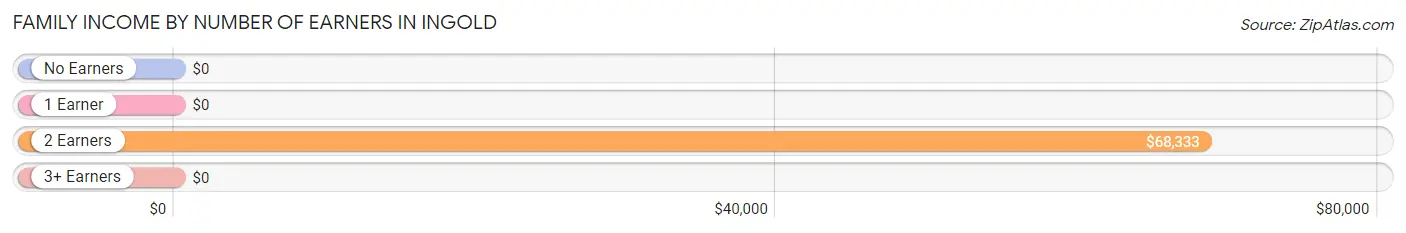
| Number of Earners | # Families | Median Income |
| No Earners | 14 (13.6%) | $0 |
| 1 Earner | 0 (0.0%) | $0 |
| 2 Earners | 58 (56.3%) | $68,333 |
| 3+ Earners | 31 (30.1%) | $0 |
| Total | 103 (100.0%) | $67,674 |
Household Income in Ingold
Household Income Brackets in Ingold
With 56 households falling in the category, the $25,000 to $34,999 income range is the most frequent in Ingold, accounting for 33.7% of all households.
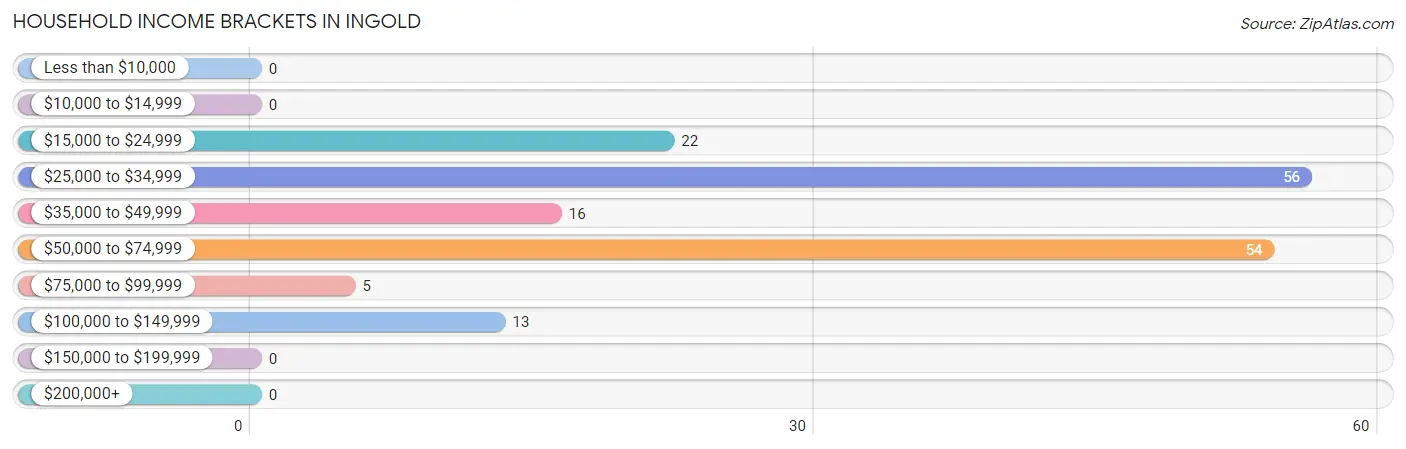
| Income Bracket | # Households | % Households |
| Less than $10,000 | 0 | 0.0% |
| $10,000 to $14,999 | 0 | 0.0% |
| $15,000 to $24,999 | 22 | 13.3% |
| $25,000 to $34,999 | 56 | 33.7% |
| $35,000 to $49,999 | 16 | 9.6% |
| $50,000 to $74,999 | 54 | 32.5% |
| $75,000 to $99,999 | 5 | 3.0% |
| $100,000 to $149,999 | 13 | 7.8% |
| $150,000 to $199,999 | 0 | 0.0% |
| $200,000+ | 0 | 0.0% |
Household Income by Householder Age in Ingold
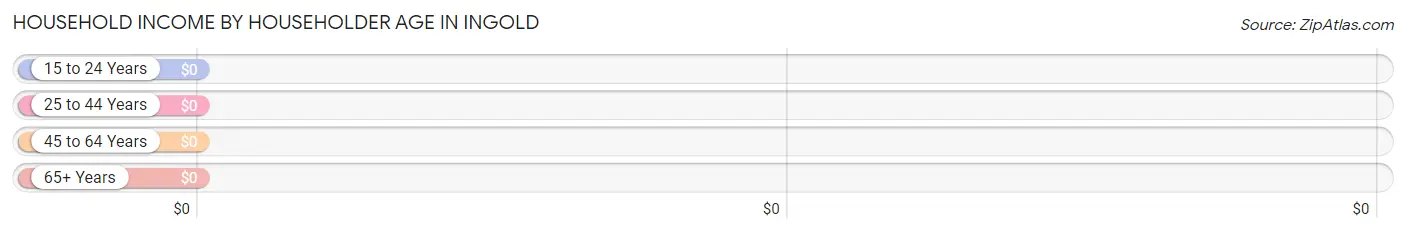
| Income Bracket | # Households | Median Income |
| 15 to 24 Years | 18 (10.8%) | $0 |
| 25 to 44 Years | 36 (21.7%) | $0 |
| 45 to 64 Years | 74 (44.6%) | $0 |
| 65+ Years | 38 (22.9%) | $0 |
| Total | 166 (100.0%) | $38,281 |
Poverty in Ingold
Income Below Poverty by Sex and Age in Ingold
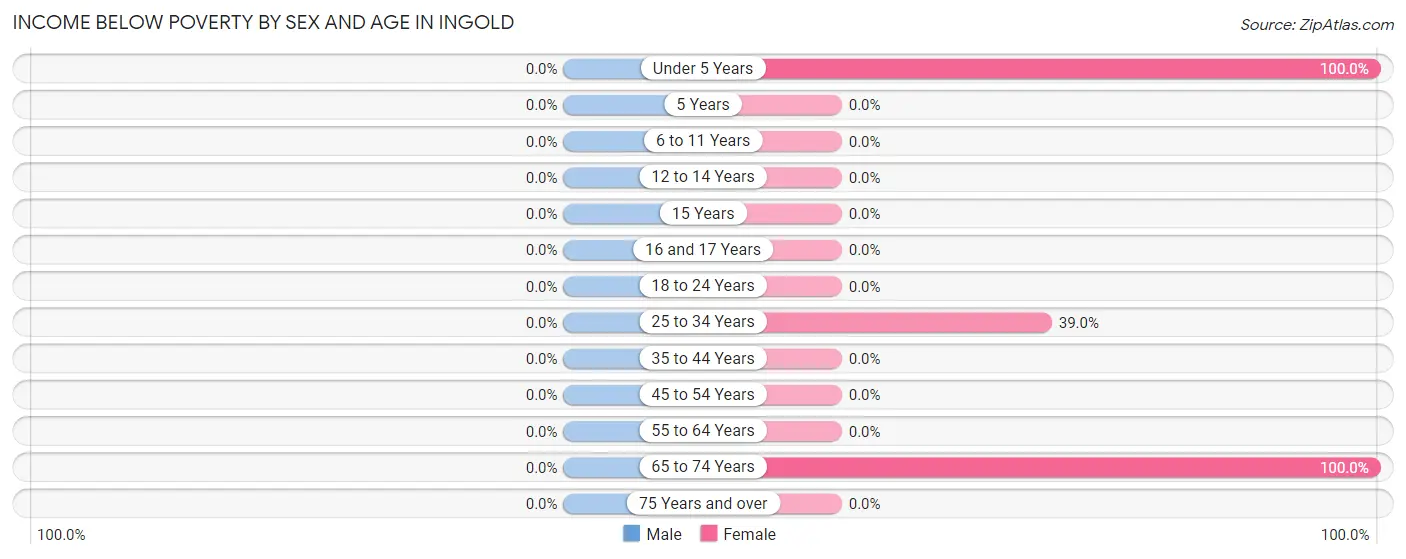
| Age Bracket | Male | Female |
| Under 5 Years | 0 (0.0%) | 14 (100.0%) |
| 5 Years | 0 (0.0%) | 0 (0.0%) |
| 6 to 11 Years | 0 (0.0%) | 0 (0.0%) |
| 12 to 14 Years | 0 (0.0%) | 0 (0.0%) |
| 15 Years | 0 (0.0%) | 0 (0.0%) |
| 16 and 17 Years | 0 (0.0%) | 0 (0.0%) |
| 18 to 24 Years | 0 (0.0%) | 0 (0.0%) |
| 25 to 34 Years | 0 (0.0%) | 23 (39.0%) |
| 35 to 44 Years | 0 (0.0%) | 0 (0.0%) |
| 45 to 54 Years | 0 (0.0%) | 0 (0.0%) |
| 55 to 64 Years | 0 (0.0%) | 0 (0.0%) |
| 65 to 74 Years | 0 (0.0%) | 17 (100.0%) |
| 75 Years and over | 0 (0.0%) | 0 (0.0%) |
| Total | 0 (0.0%) | 54 (21.2%) |
Income Above Poverty by Sex and Age in Ingold
According to the poverty statistics in Ingold, males aged under 5 years and females aged 6 to 11 years are the age groups that are most secure financially, with 100.0% of males and 100.0% of females in these age groups living above the poverty line.
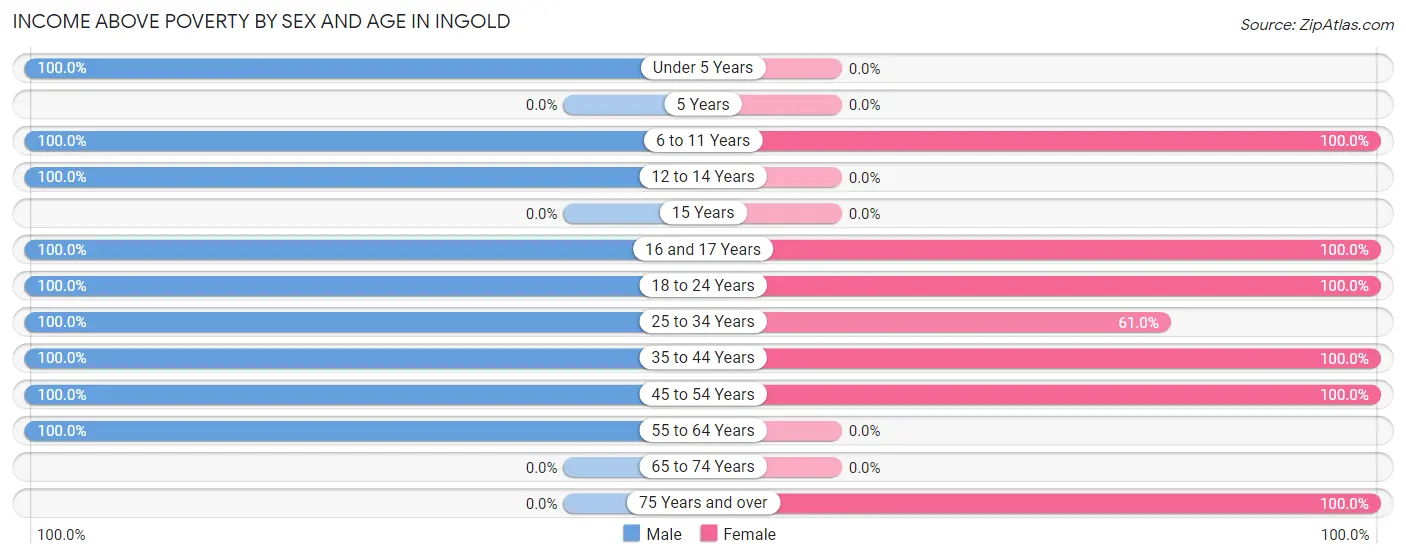
| Age Bracket | Male | Female |
| Under 5 Years | 91 (100.0%) | 0 (0.0%) |
| 5 Years | 0 (0.0%) | 0 (0.0%) |
| 6 to 11 Years | 104 (100.0%) | 64 (100.0%) |
| 12 to 14 Years | 34 (100.0%) | 0 (0.0%) |
| 15 Years | 0 (0.0%) | 0 (0.0%) |
| 16 and 17 Years | 20 (100.0%) | 10 (100.0%) |
| 18 to 24 Years | 18 (100.0%) | 15 (100.0%) |
| 25 to 34 Years | 122 (100.0%) | 36 (61.0%) |
| 35 to 44 Years | 38 (100.0%) | 21 (100.0%) |
| 45 to 54 Years | 27 (100.0%) | 34 (100.0%) |
| 55 to 64 Years | 48 (100.0%) | 0 (0.0%) |
| 65 to 74 Years | 0 (0.0%) | 0 (0.0%) |
| 75 Years and over | 0 (0.0%) | 21 (100.0%) |
| Total | 502 (100.0%) | 201 (78.8%) |
Income Below Poverty Among Married-Couple Families in Ingold
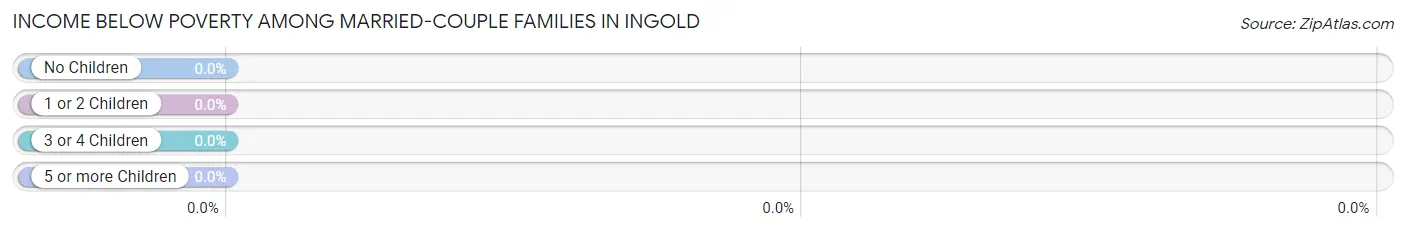
| Children | Above Poverty | Below Poverty |
| No Children | 19 (100.0%) | 0 (0.0%) |
| 1 or 2 Children | 0 (0.0%) | 0 (0.0%) |
| 3 or 4 Children | 49 (100.0%) | 0 (0.0%) |
| 5 or more Children | 0 (0.0%) | 0 (0.0%) |
| Total | 68 (100.0%) | 0 (0.0%) |
Income Below Poverty Among Single-Parent Households in Ingold
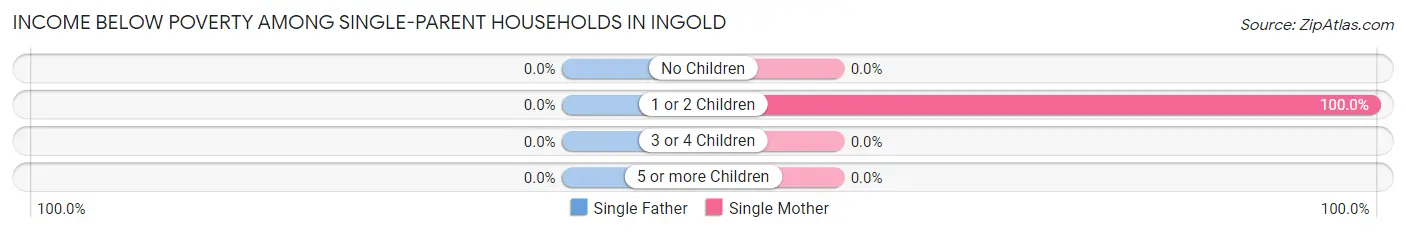
| Children | Single Father | Single Mother |
| No Children | 0 (0.0%) | 0 (0.0%) |
| 1 or 2 Children | 0 (0.0%) | 17 (100.0%) |
| 3 or 4 Children | 0 (0.0%) | 0 (0.0%) |
| 5 or more Children | 0 (0.0%) | 0 (0.0%) |
| Total | 0 (0.0%) | 17 (100.0%) |
Income Below Poverty Among Married-Couple vs Single-Parent Households in Ingold
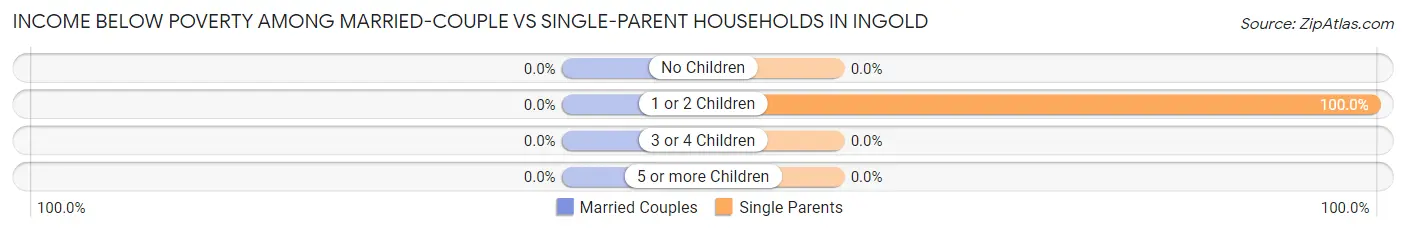
| Children | Married-Couple Families | Single-Parent Households |
| No Children | 0 (0.0%) | 0 (0.0%) |
| 1 or 2 Children | 0 (0.0%) | 17 (100.0%) |
| 3 or 4 Children | 0 (0.0%) | 0 (0.0%) |
| 5 or more Children | 0 (0.0%) | 0 (0.0%) |
| Total | 0 (0.0%) | 17 (48.6%) |
Employment Characteristics in Ingold
Employment by Class of Employer in Ingold
Among the 260 employed individuals in Ingold, private company employees (181 | 69.6%), local government employees (28 | 10.8%), and self-employed (not incorporated) (24 | 9.2%) make up the most common classes of employment.
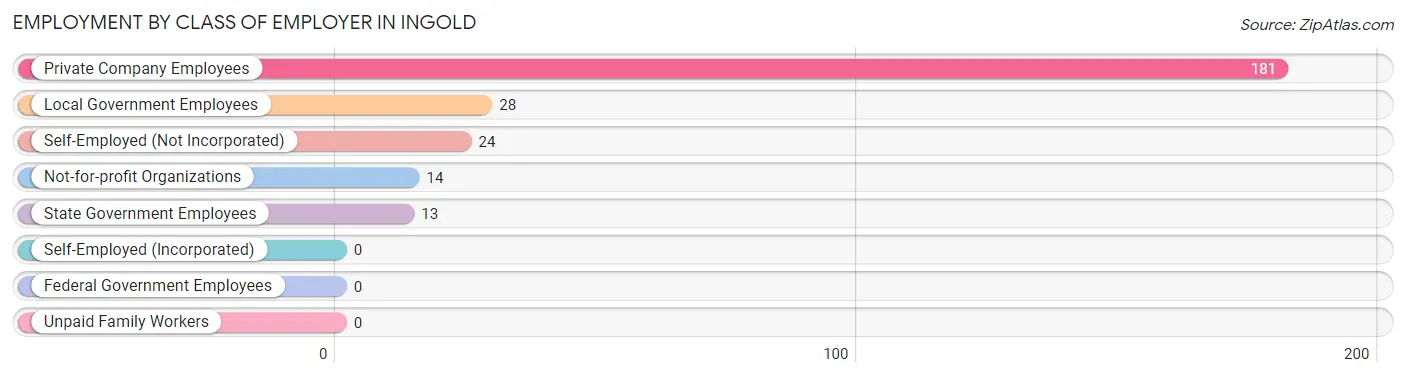
| Employer Class | # Employees | % Employees |
| Private Company Employees | 181 | 69.6% |
| Self-Employed (Incorporated) | 0 | 0.0% |
| Self-Employed (Not Incorporated) | 24 | 9.2% |
| Not-for-profit Organizations | 14 | 5.4% |
| Local Government Employees | 28 | 10.8% |
| State Government Employees | 13 | 5.0% |
| Federal Government Employees | 0 | 0.0% |
| Unpaid Family Workers | 0 | 0.0% |
| Total | 260 | 100.0% |
Employment Status by Age in Ingold
According to the labor force statistics for Ingold, out of the total population over 16 years of age (450), 81.8% or 368 individuals are in the labor force, with 29.3% or 108 of them unemployed. The age group with the highest labor force participation rate is 20 to 24 years, with 100.0% or 33 individuals in the labor force. Within the labor force, the 55 to 59 years age range has the highest percentage of unemployed individuals, with 87.5% or 42 of them being unemployed.
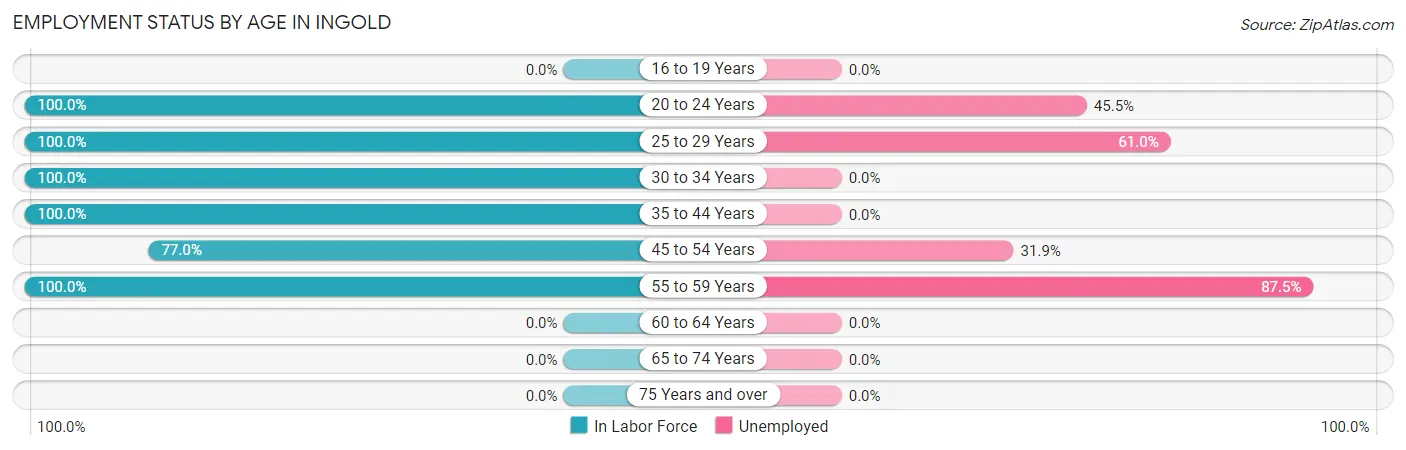
| Age Bracket | In Labor Force | Unemployed |
| 16 to 19 Years | 0 (0.0%) | 0 (0.0%) |
| 20 to 24 Years | 33 (100.0%) | 15 (45.5%) |
| 25 to 29 Years | 59 (100.0%) | 36 (61.0%) |
| 30 to 34 Years | 122 (100.0%) | 0 (0.0%) |
| 35 to 44 Years | 59 (100.0%) | 0 (0.0%) |
| 45 to 54 Years | 47 (77.0%) | 15 (31.9%) |
| 55 to 59 Years | 48 (100.0%) | 42 (87.5%) |
| 60 to 64 Years | 0 (0.0%) | 0 (0.0%) |
| 65 to 74 Years | 0 (0.0%) | 0 (0.0%) |
| 75 Years and over | 0 (0.0%) | 0 (0.0%) |
| Total | 368 (81.8%) | 108 (29.3%) |
Employment Status by Educational Attainment in Ingold
According to labor force statistics for Ingold, 96.0% of individuals (335) out of the total population between 25 and 64 years of age (349) are in the labor force, with 27.8% or 93 of them being unemployed. The group with the highest labor force participation rate are those with the educational attainment of less than high school, with 100.0% or 181 individuals in the labor force. Within the labor force, individuals with college / associate degree education have the highest percentage of unemployment, with 72.1% or 93 of them being unemployed.
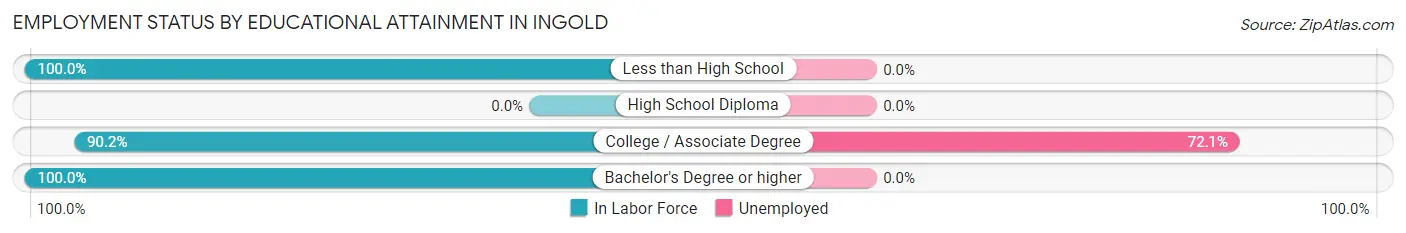
| Educational Attainment | In Labor Force | Unemployed |
| Less than High School | 181 (100.0%) | 0 (0.0%) |
| High School Diploma | 0 (0.0%) | 0 (0.0%) |
| College / Associate Degree | 129 (90.2%) | 103 (72.1%) |
| Bachelor's Degree or higher | 25 (100.0%) | 0 (0.0%) |
| Total | 335 (96.0%) | 97 (27.8%) |
Employment Occupations by Sex in Ingold
Management, Business, Science and Arts Occupations
The most common Management, Business, Science and Arts occupations in Ingold are Management (20 | 7.7%), Community & Social Service (5 | 1.9%), and Education Instruction & Library (5 | 1.9%).
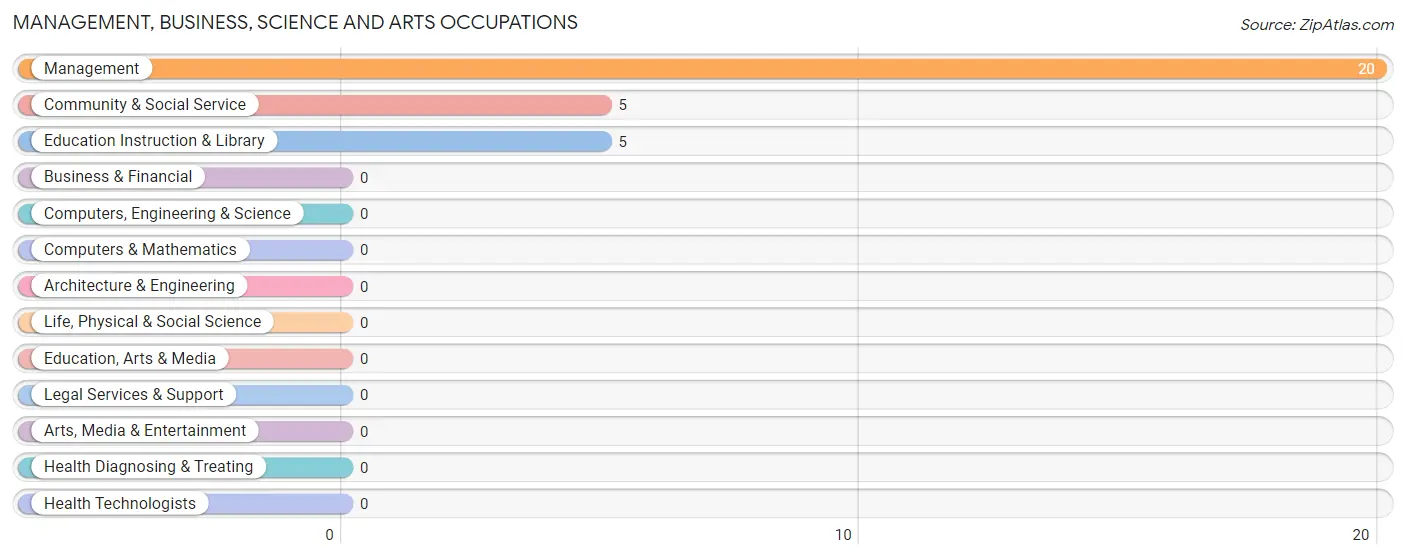
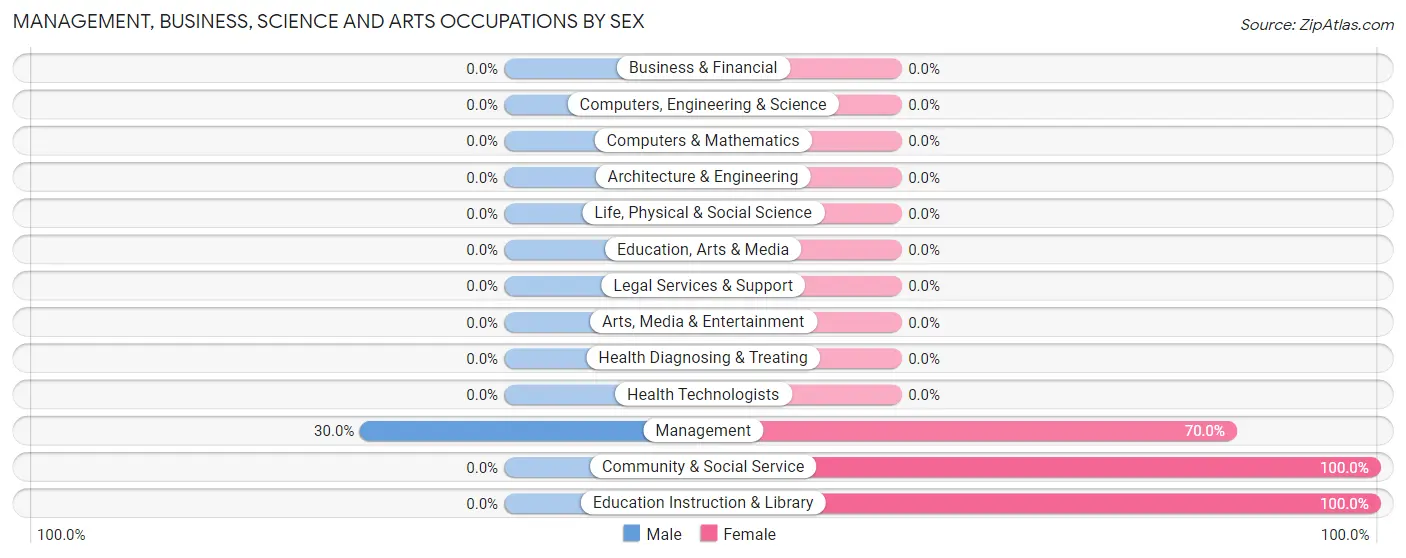
Management, Business, Science and Arts Occupations by Sex
| Occupation | Male | Female |
| Management | 6 (30.0%) | 14 (70.0%) |
| Business & Financial | 0 (0.0%) | 0 (0.0%) |
| Computers, Engineering & Science | 0 (0.0%) | 0 (0.0%) |
| Computers & Mathematics | 0 (0.0%) | 0 (0.0%) |
| Architecture & Engineering | 0 (0.0%) | 0 (0.0%) |
| Life, Physical & Social Science | 0 (0.0%) | 0 (0.0%) |
| Community & Social Service | 0 (0.0%) | 5 (100.0%) |
| Education, Arts & Media | 0 (0.0%) | 0 (0.0%) |
| Legal Services & Support | 0 (0.0%) | 0 (0.0%) |
| Education Instruction & Library | 0 (0.0%) | 5 (100.0%) |
| Arts, Media & Entertainment | 0 (0.0%) | 0 (0.0%) |
| Health Diagnosing & Treating | 0 (0.0%) | 0 (0.0%) |
| Health Technologists | 0 (0.0%) | 0 (0.0%) |
| Total (Category) | 6 (24.0%) | 19 (76.0%) |
| Total (Overall) | 197 (75.8%) | 63 (24.2%) |
Services Occupations
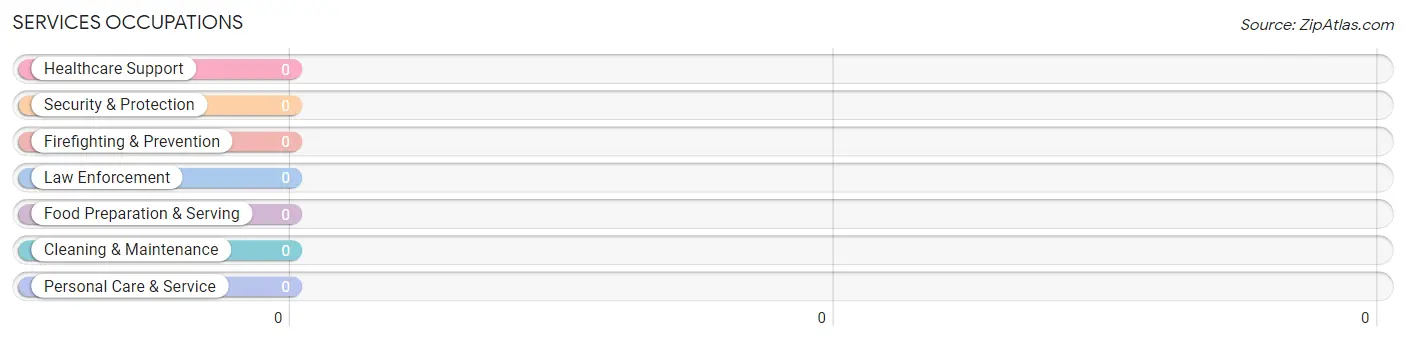
Services Occupations by Sex
| Occupation | Male | Female |
| Healthcare Support | 0 (0.0%) | 0 (0.0%) |
| Security & Protection | 0 (0.0%) | 0 (0.0%) |
| Firefighting & Prevention | 0 (0.0%) | 0 (0.0%) |
| Law Enforcement | 0 (0.0%) | 0 (0.0%) |
| Food Preparation & Serving | 0 (0.0%) | 0 (0.0%) |
| Cleaning & Maintenance | 0 (0.0%) | 0 (0.0%) |
| Personal Care & Service | 0 (0.0%) | 0 (0.0%) |
| Total (Category) | 0 (0.0%) | 0 (0.0%) |
| Total (Overall) | 197 (75.8%) | 63 (24.2%) |
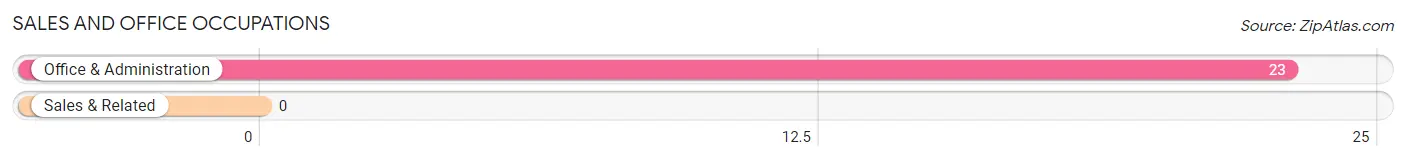
Sales and Office Occupations
The most common Sales and Office occupations in Ingold are , and Office & Administration (23 | 8.8%).
Sales and Office Occupations by Sex
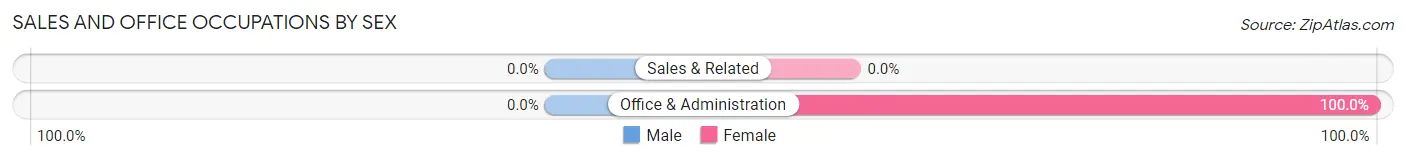
| Occupation | Male | Female |
| Sales & Related | 0 (0.0%) | 0 (0.0%) |
| Office & Administration | 0 (0.0%) | 23 (100.0%) |
| Total (Category) | 0 (0.0%) | 23 (100.0%) |
| Total (Overall) | 197 (75.8%) | 63 (24.2%) |
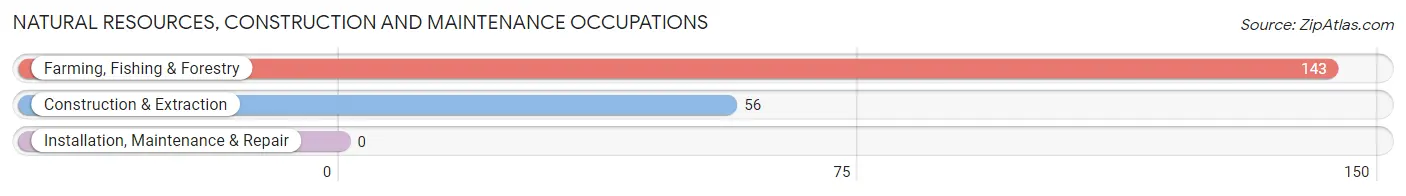
Natural Resources, Construction and Maintenance Occupations
The most common Natural Resources, Construction and Maintenance occupations in Ingold are Farming, Fishing & Forestry (143 | 55.0%), and Construction & Extraction (56 | 21.5%).
Natural Resources, Construction and Maintenance Occupations by Sex
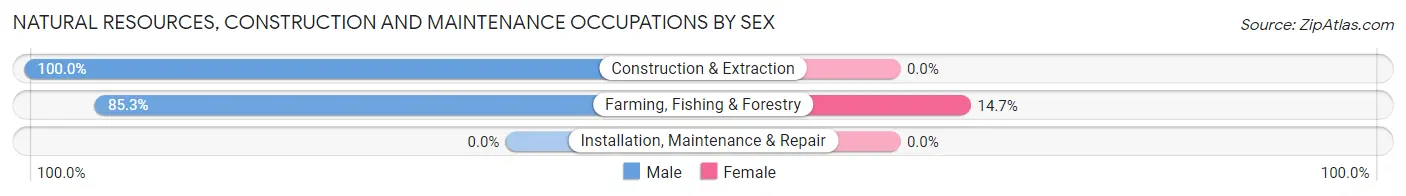
| Occupation | Male | Female |
| Farming, Fishing & Forestry | 122 (85.3%) | 21 (14.7%) |
| Construction & Extraction | 56 (100.0%) | 0 (0.0%) |
| Installation, Maintenance & Repair | 0 (0.0%) | 0 (0.0%) |
| Total (Category) | 178 (89.4%) | 21 (10.5%) |
| Total (Overall) | 197 (75.8%) | 63 (24.2%) |
Production, Transportation and Moving Occupations
The most common Production, Transportation and Moving occupations in Ingold are , and Transportation (13 | 5.0%).
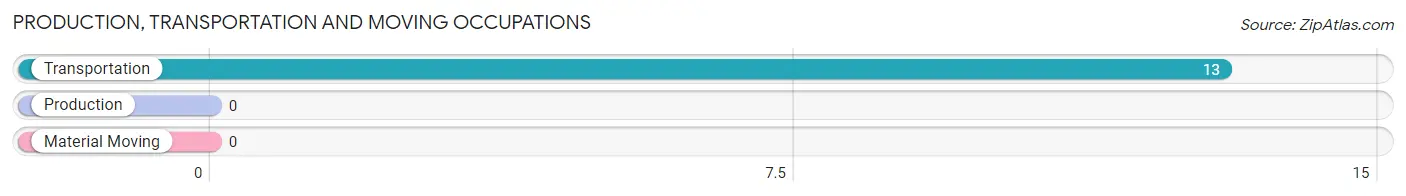
Production, Transportation and Moving Occupations by Sex
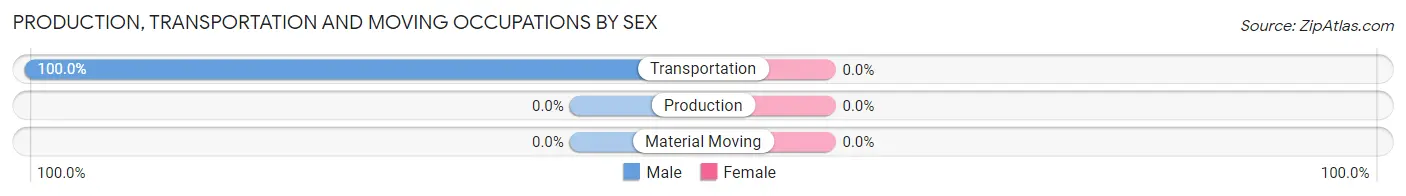
| Occupation | Male | Female |
| Production | 0 (0.0%) | 0 (0.0%) |
| Transportation | 13 (100.0%) | 0 (0.0%) |
| Material Moving | 0 (0.0%) | 0 (0.0%) |
| Total (Category) | 13 (100.0%) | 0 (0.0%) |
| Total (Overall) | 197 (75.8%) | 63 (24.2%) |
Employment Industries by Sex in Ingold
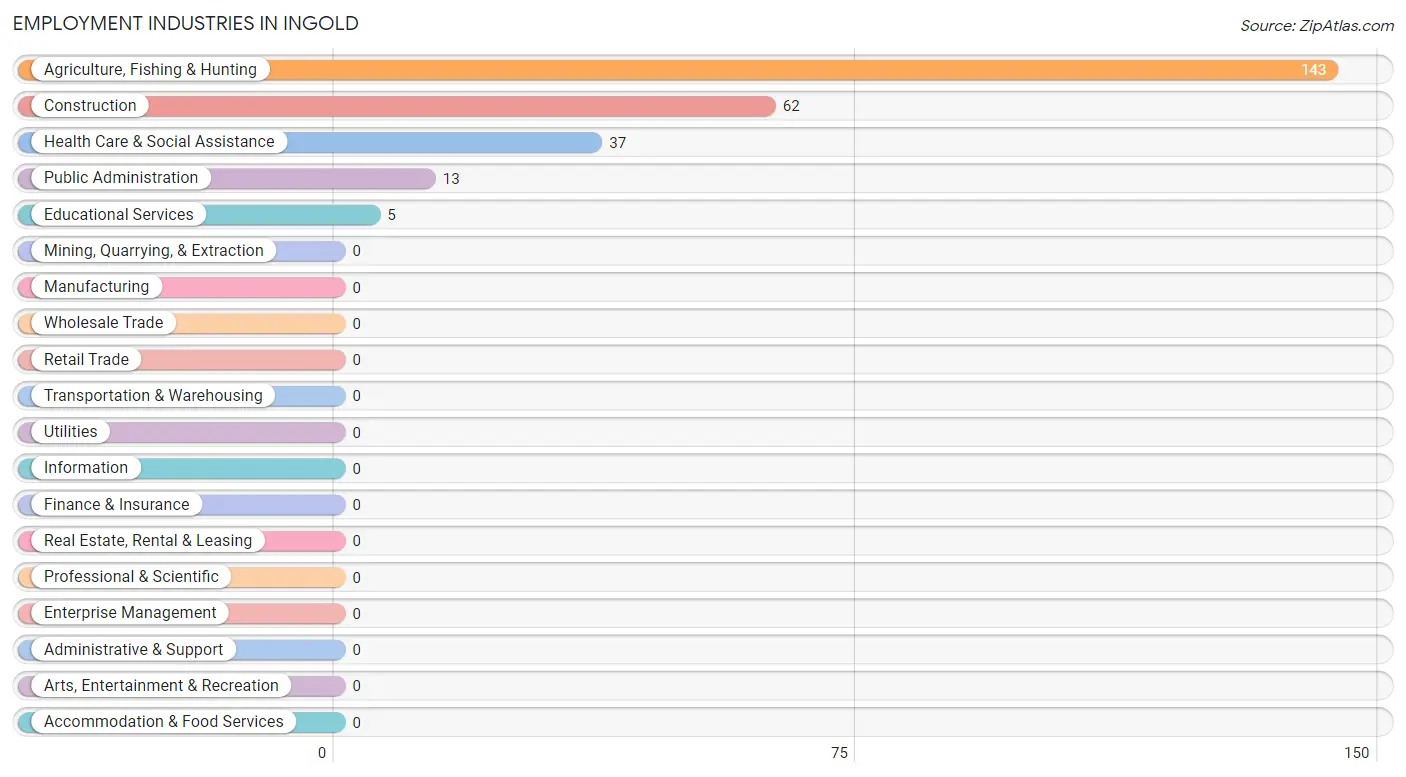
Employment Industries in Ingold
The major employment industries in Ingold include Agriculture, Fishing & Hunting (143 | 55.0%), Construction (62 | 23.8%), Health Care & Social Assistance (37 | 14.2%), Public Administration (13 | 5.0%), and Educational Services (5 | 1.9%).
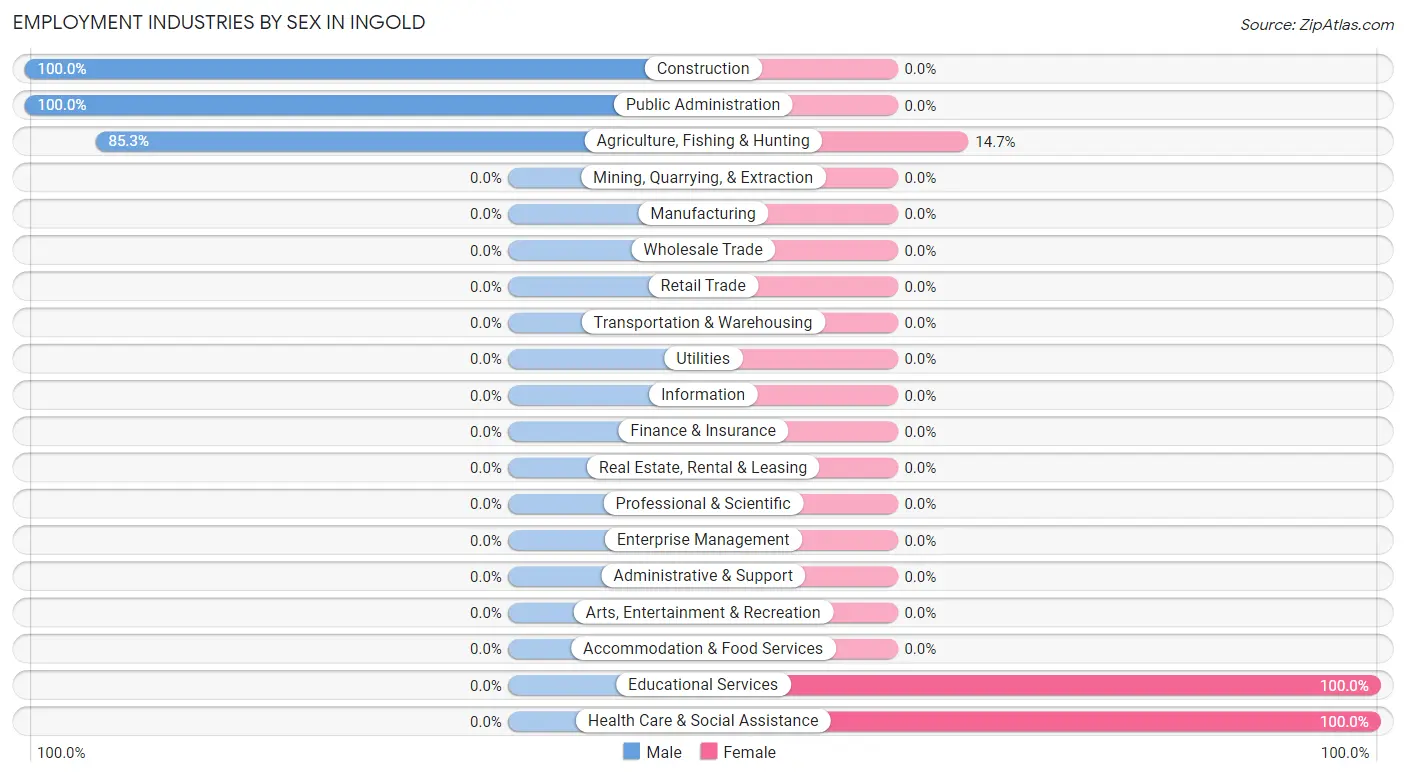
Employment Industries by Sex in Ingold
The Ingold industries that see more men than women are Construction (100.0%), Public Administration (100.0%), and Agriculture, Fishing & Hunting (85.3%), whereas the industries that tend to have a higher number of women are Educational Services (100.0%), Health Care & Social Assistance (100.0%), and Agriculture, Fishing & Hunting (14.7%).
| Industry | Male | Female |
| Agriculture, Fishing & Hunting | 122 (85.3%) | 21 (14.7%) |
| Mining, Quarrying, & Extraction | 0 (0.0%) | 0 (0.0%) |
| Construction | 62 (100.0%) | 0 (0.0%) |
| Manufacturing | 0 (0.0%) | 0 (0.0%) |
| Wholesale Trade | 0 (0.0%) | 0 (0.0%) |
| Retail Trade | 0 (0.0%) | 0 (0.0%) |
| Transportation & Warehousing | 0 (0.0%) | 0 (0.0%) |
| Utilities | 0 (0.0%) | 0 (0.0%) |
| Information | 0 (0.0%) | 0 (0.0%) |
| Finance & Insurance | 0 (0.0%) | 0 (0.0%) |
| Real Estate, Rental & Leasing | 0 (0.0%) | 0 (0.0%) |
| Professional & Scientific | 0 (0.0%) | 0 (0.0%) |
| Enterprise Management | 0 (0.0%) | 0 (0.0%) |
| Administrative & Support | 0 (0.0%) | 0 (0.0%) |
| Educational Services | 0 (0.0%) | 5 (100.0%) |
| Health Care & Social Assistance | 0 (0.0%) | 37 (100.0%) |
| Arts, Entertainment & Recreation | 0 (0.0%) | 0 (0.0%) |
| Accommodation & Food Services | 0 (0.0%) | 0 (0.0%) |
| Public Administration | 13 (100.0%) | 0 (0.0%) |
| Total | 197 (75.8%) | 63 (24.2%) |
Education in Ingold
School Enrollment in Ingold
The most common levels of schooling among the 299 students in Ingold are elementary school (168 | 56.2%), nursery / preschool (67 | 22.4%), and middle school (34 | 11.4%).
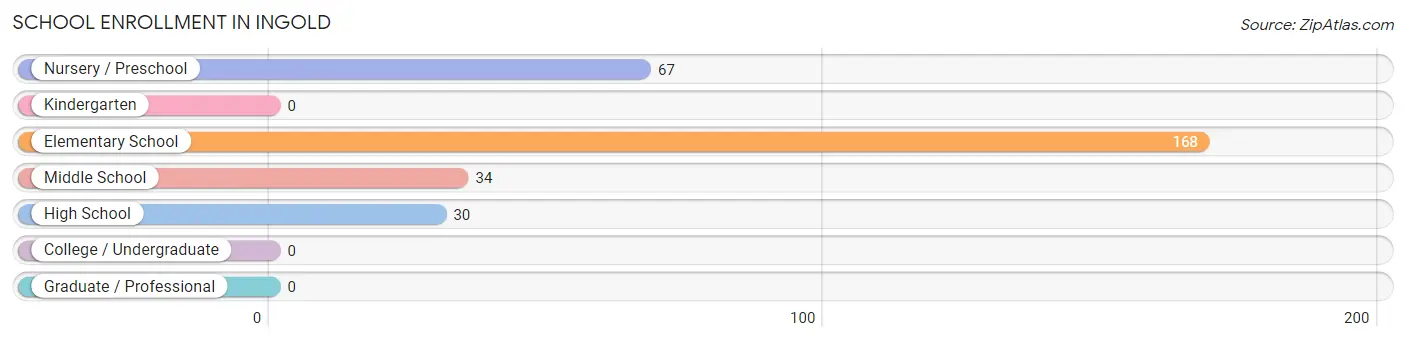
| School Level | # Students | % Students |
| Nursery / Preschool | 67 | 22.4% |
| Kindergarten | 0 | 0.0% |
| Elementary School | 168 | 56.2% |
| Middle School | 34 | 11.4% |
| High School | 30 | 10.0% |
| College / Undergraduate | 0 | 0.0% |
| Graduate / Professional | 0 | 0.0% |
| Total | 299 | 100.0% |
School Enrollment by Age by Funding Source in Ingold
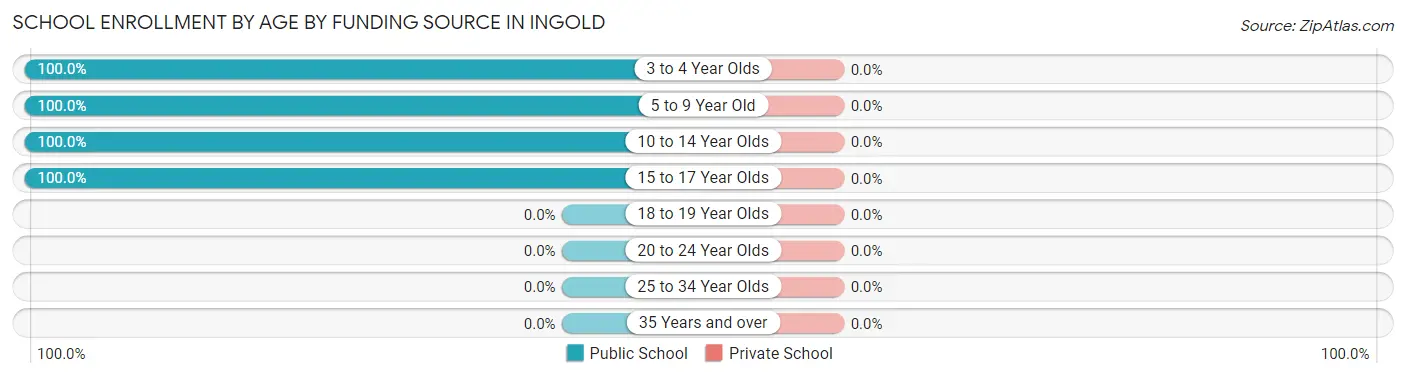
| Age Bracket | Public School | Private School |
| 3 to 4 Year Olds | 67 (100.0%) | 0 (0.0%) |
| 5 to 9 Year Old | 82 (100.0%) | 0 (0.0%) |
| 10 to 14 Year Olds | 120 (100.0%) | 0 (0.0%) |
| 15 to 17 Year Olds | 30 (100.0%) | 0 (0.0%) |
| 18 to 19 Year Olds | 0 (0.0%) | 0 (0.0%) |
| 20 to 24 Year Olds | 0 (0.0%) | 0 (0.0%) |
| 25 to 34 Year Olds | 0 (0.0%) | 0 (0.0%) |
| 35 Years and over | 0 (0.0%) | 0 (0.0%) |
| Total | 299 (100.0%) | 0 (0.0%) |
Educational Attainment by Field of Study in Ingold
Science & technology (14 | 56.0%), and physical & health sciences (11 | 44.0%) are the most common fields of study among 25 individuals in Ingold who have obtained a bachelor's degree or higher.
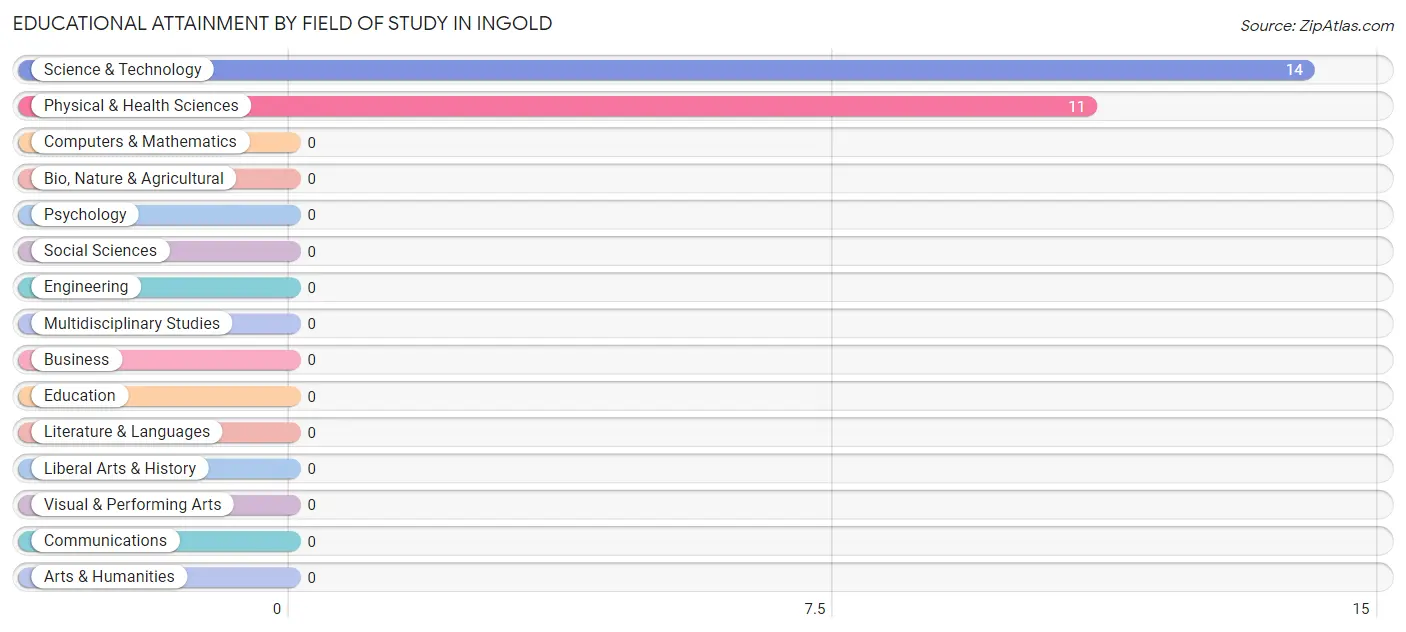
| Field of Study | # Graduates | % Graduates |
| Computers & Mathematics | 0 | 0.0% |
| Bio, Nature & Agricultural | 0 | 0.0% |
| Physical & Health Sciences | 11 | 44.0% |
| Psychology | 0 | 0.0% |
| Social Sciences | 0 | 0.0% |
| Engineering | 0 | 0.0% |
| Multidisciplinary Studies | 0 | 0.0% |
| Science & Technology | 14 | 56.0% |
| Business | 0 | 0.0% |
| Education | 0 | 0.0% |
| Literature & Languages | 0 | 0.0% |
| Liberal Arts & History | 0 | 0.0% |
| Visual & Performing Arts | 0 | 0.0% |
| Communications | 0 | 0.0% |
| Arts & Humanities | 0 | 0.0% |
| Total | 25 | 100.0% |
Transportation & Commute in Ingold
Vehicle Availability by Sex in Ingold
The most prevalent vehicle ownership categories in Ingold are males with 3 vehicles (122, accounting for 61.9%) and females with 3 vehicles (0, making up 193.7%).
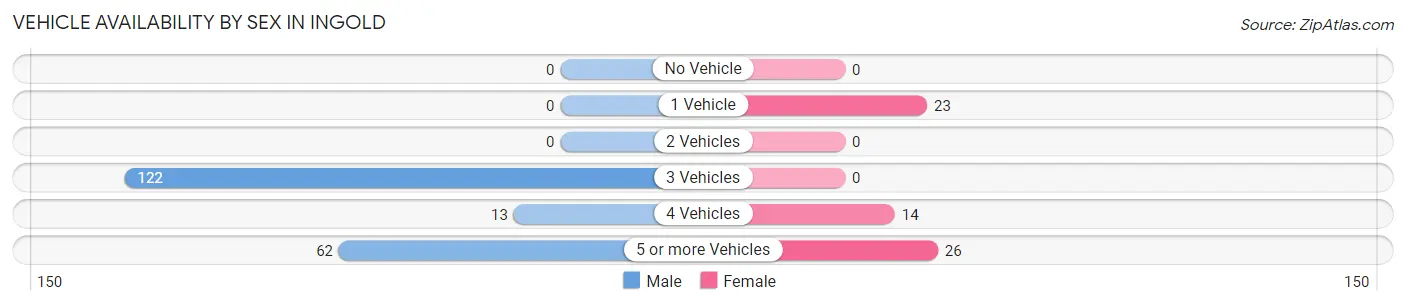
| Vehicles Available | Male | Female |
| No Vehicle | 0 (0.0%) | 0 (0.0%) |
| 1 Vehicle | 0 (0.0%) | 23 (36.5%) |
| 2 Vehicles | 0 (0.0%) | 0 (0.0%) |
| 3 Vehicles | 122 (61.9%) | 0 (0.0%) |
| 4 Vehicles | 13 (6.6%) | 14 (22.2%) |
| 5 or more Vehicles | 62 (31.5%) | 26 (41.3%) |
| Total | 197 (100.0%) | 63 (100.0%) |
Commute Time in Ingold
The most frequently occuring commute durations in Ingold are 5 to 9 minutes (122 commuters, 46.9%), 30 to 34 minutes (86 commuters, 33.1%), and 25 to 29 minutes (23 commuters, 8.8%).
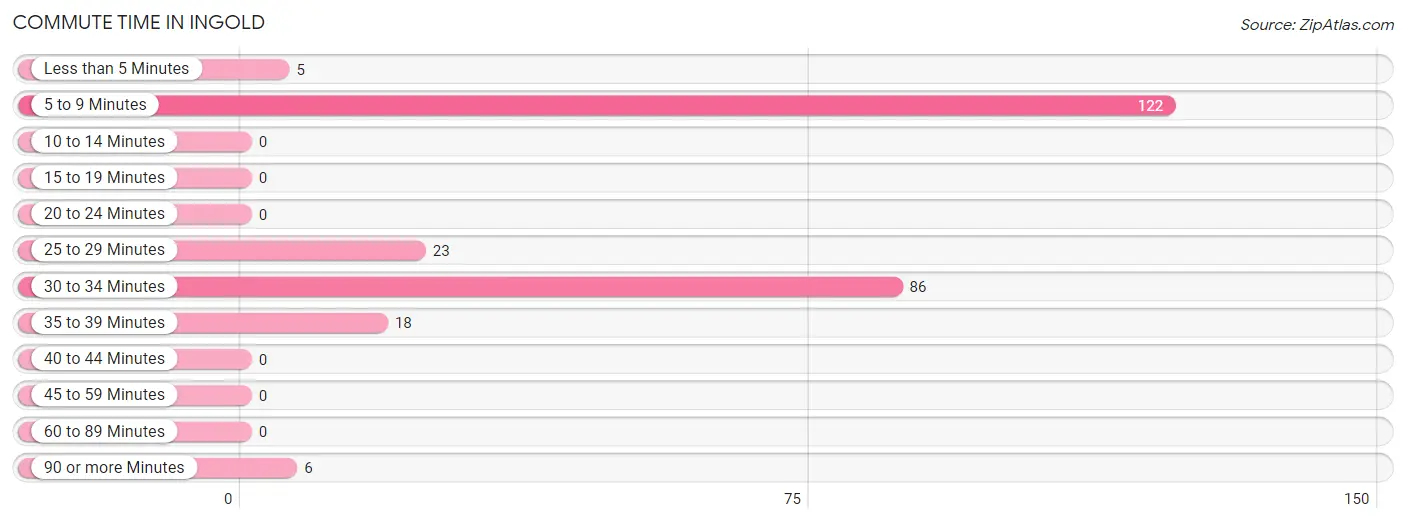
| Commute Time | # Commuters | % Commuters |
| Less than 5 Minutes | 5 | 1.9% |
| 5 to 9 Minutes | 122 | 46.9% |
| 10 to 14 Minutes | 0 | 0.0% |
| 15 to 19 Minutes | 0 | 0.0% |
| 20 to 24 Minutes | 0 | 0.0% |
| 25 to 29 Minutes | 23 | 8.8% |
| 30 to 34 Minutes | 86 | 33.1% |
| 35 to 39 Minutes | 18 | 6.9% |
| 40 to 44 Minutes | 0 | 0.0% |
| 45 to 59 Minutes | 0 | 0.0% |
| 60 to 89 Minutes | 0 | 0.0% |
| 90 or more Minutes | 6 | 2.3% |
Commute Time by Sex in Ingold
The most common commute times in Ingold are 5 to 9 minutes (122 commuters, 61.9%) for males and 30 to 34 minutes (35 commuters, 55.6%) for females.
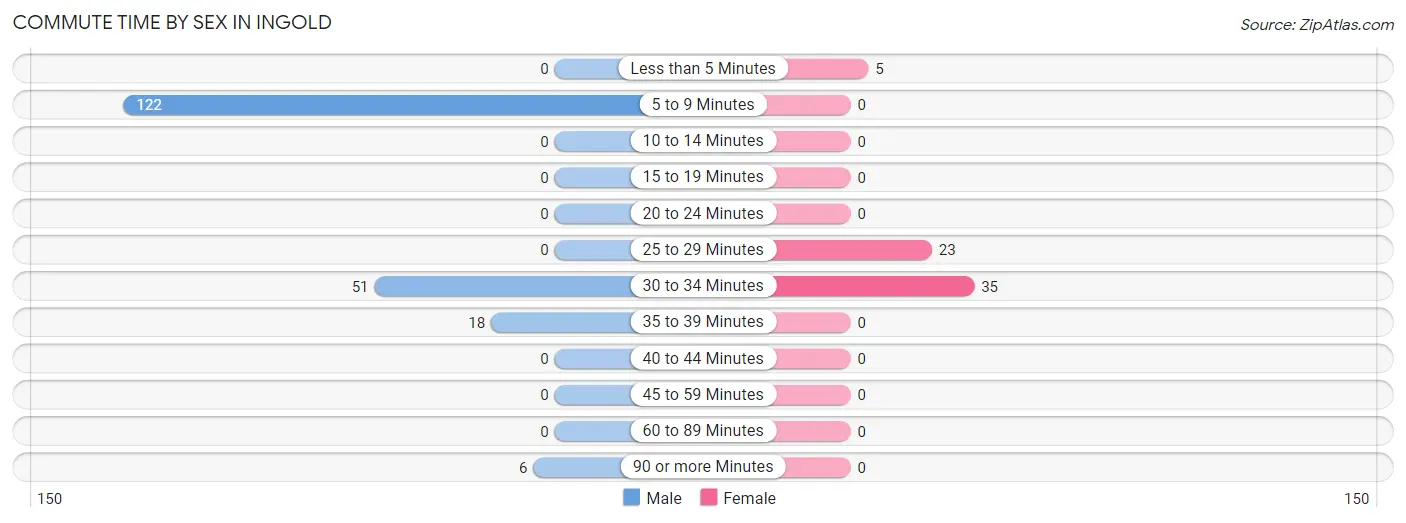
| Commute Time | Male | Female |
| Less than 5 Minutes | 0 (0.0%) | 5 (7.9%) |
| 5 to 9 Minutes | 122 (61.9%) | 0 (0.0%) |
| 10 to 14 Minutes | 0 (0.0%) | 0 (0.0%) |
| 15 to 19 Minutes | 0 (0.0%) | 0 (0.0%) |
| 20 to 24 Minutes | 0 (0.0%) | 0 (0.0%) |
| 25 to 29 Minutes | 0 (0.0%) | 23 (36.5%) |
| 30 to 34 Minutes | 51 (25.9%) | 35 (55.6%) |
| 35 to 39 Minutes | 18 (9.1%) | 0 (0.0%) |
| 40 to 44 Minutes | 0 (0.0%) | 0 (0.0%) |
| 45 to 59 Minutes | 0 (0.0%) | 0 (0.0%) |
| 60 to 89 Minutes | 0 (0.0%) | 0 (0.0%) |
| 90 or more Minutes | 6 (3.0%) | 0 (0.0%) |
Time of Departure to Work by Sex in Ingold
The most frequent times of departure to work in Ingold are 5:30 AM to 5:59 AM (122, 61.9%) for males and 7:30 AM to 7:59 AM (37, 58.7%) for females.
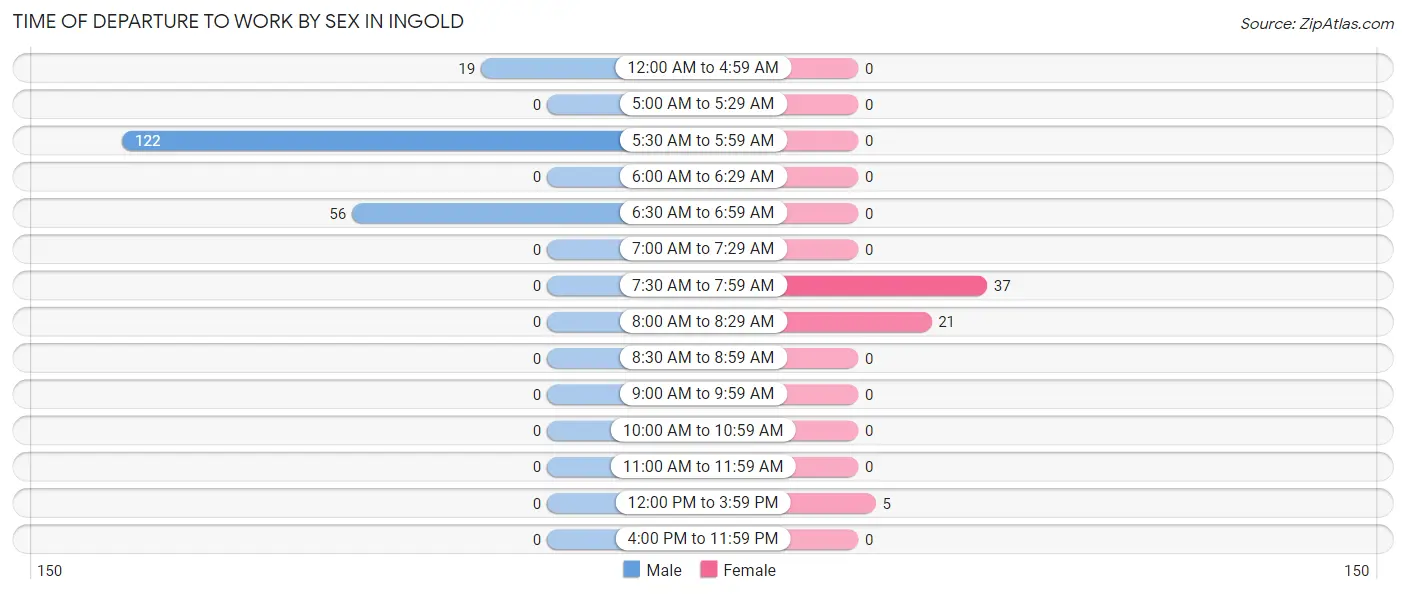
| Time of Departure | Male | Female |
| 12:00 AM to 4:59 AM | 19 (9.6%) | 0 (0.0%) |
| 5:00 AM to 5:29 AM | 0 (0.0%) | 0 (0.0%) |
| 5:30 AM to 5:59 AM | 122 (61.9%) | 0 (0.0%) |
| 6:00 AM to 6:29 AM | 0 (0.0%) | 0 (0.0%) |
| 6:30 AM to 6:59 AM | 56 (28.4%) | 0 (0.0%) |
| 7:00 AM to 7:29 AM | 0 (0.0%) | 0 (0.0%) |
| 7:30 AM to 7:59 AM | 0 (0.0%) | 37 (58.7%) |
| 8:00 AM to 8:29 AM | 0 (0.0%) | 21 (33.3%) |
| 8:30 AM to 8:59 AM | 0 (0.0%) | 0 (0.0%) |
| 9:00 AM to 9:59 AM | 0 (0.0%) | 0 (0.0%) |
| 10:00 AM to 10:59 AM | 0 (0.0%) | 0 (0.0%) |
| 11:00 AM to 11:59 AM | 0 (0.0%) | 0 (0.0%) |
| 12:00 PM to 3:59 PM | 0 (0.0%) | 5 (7.9%) |
| 4:00 PM to 11:59 PM | 0 (0.0%) | 0 (0.0%) |
| Total | 197 (100.0%) | 63 (100.0%) |
Housing Occupancy in Ingold
Occupancy by Ownership in Ingold
Of the total 166 dwellings in Ingold, owner-occupied units account for 124 (74.7%), while renter-occupied units make up 42 (25.3%).
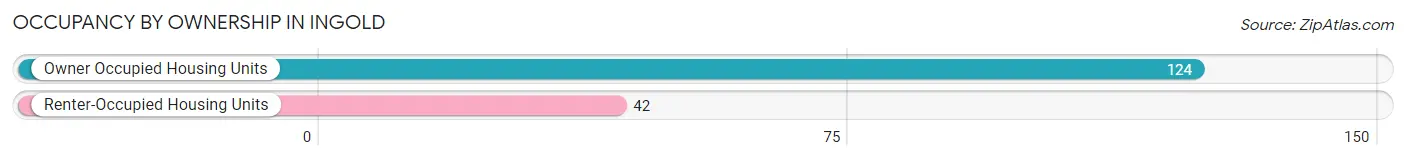
| Occupancy | # Housing Units | % Housing Units |
| Owner Occupied Housing Units | 124 | 74.7% |
| Renter-Occupied Housing Units | 42 | 25.3% |
| Total Occupied Housing Units | 166 | 100.0% |
Occupancy by Household Size in Ingold
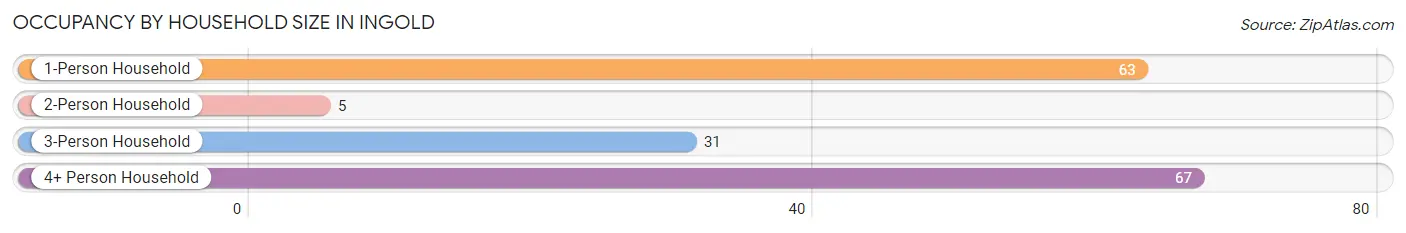
| Household Size | # Housing Units | % Housing Units |
| 1-Person Household | 63 | 38.0% |
| 2-Person Household | 5 | 3.0% |
| 3-Person Household | 31 | 18.7% |
| 4+ Person Household | 67 | 40.4% |
| Total Housing Units | 166 | 100.0% |
Occupancy by Ownership by Household Size in Ingold
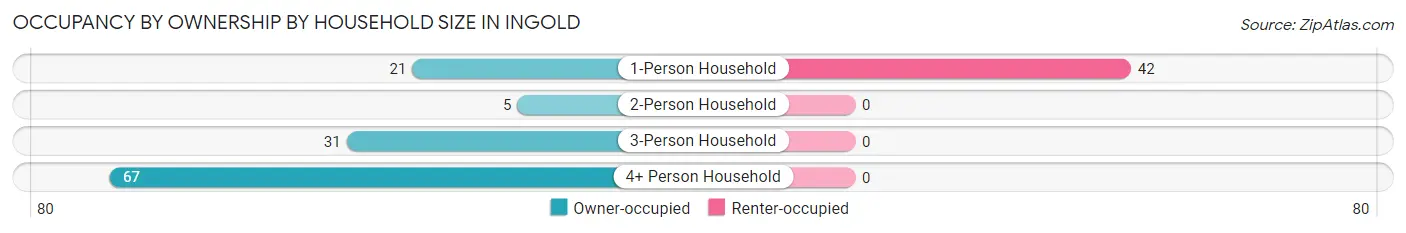
| Household Size | Owner-occupied | Renter-occupied |
| 1-Person Household | 21 (33.3%) | 42 (66.7%) |
| 2-Person Household | 5 (100.0%) | 0 (0.0%) |
| 3-Person Household | 31 (100.0%) | 0 (0.0%) |
| 4+ Person Household | 67 (100.0%) | 0 (0.0%) |
| Total Housing Units | 124 (74.7%) | 42 (25.3%) |
Occupancy by Educational Attainment in Ingold
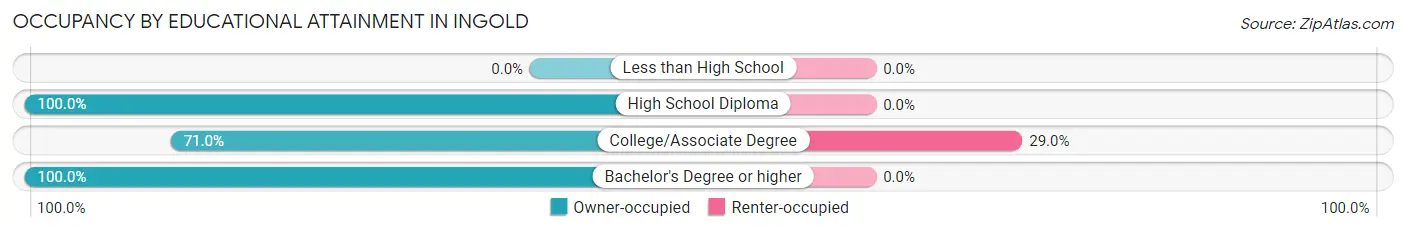
| Household Size | Owner-occupied | Renter-occupied |
| Less than High School | 0 (0.0%) | 0 (0.0%) |
| High School Diploma | 16 (100.0%) | 0 (0.0%) |
| College/Associate Degree | 103 (71.0%) | 42 (29.0%) |
| Bachelor's Degree or higher | 5 (100.0%) | 0 (0.0%) |
Occupancy by Age of Householder in Ingold
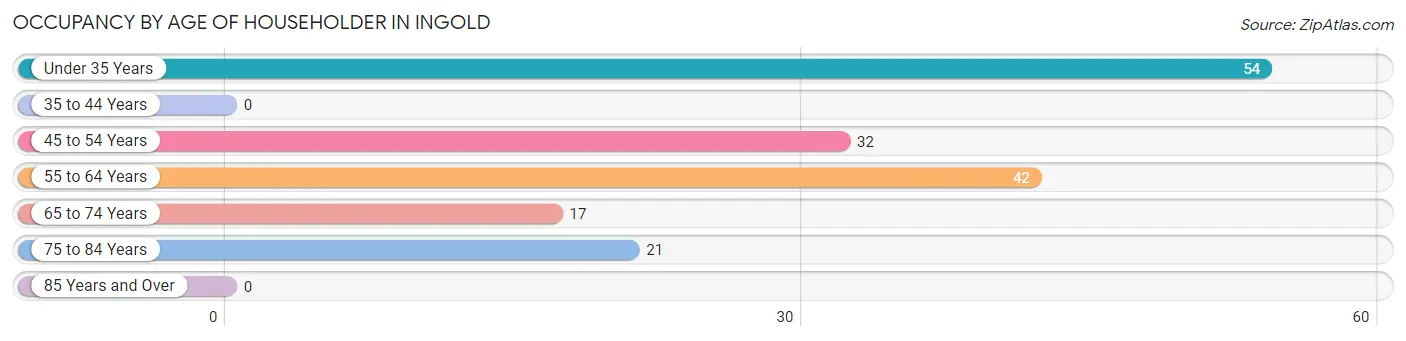
| Age Bracket | # Households | % Households |
| Under 35 Years | 54 | 32.5% |
| 35 to 44 Years | 0 | 0.0% |
| 45 to 54 Years | 32 | 19.3% |
| 55 to 64 Years | 42 | 25.3% |
| 65 to 74 Years | 17 | 10.2% |
| 75 to 84 Years | 21 | 12.7% |
| 85 Years and Over | 0 | 0.0% |
| Total | 166 | 100.0% |
Housing Finances in Ingold
Median Income by Occupancy in Ingold
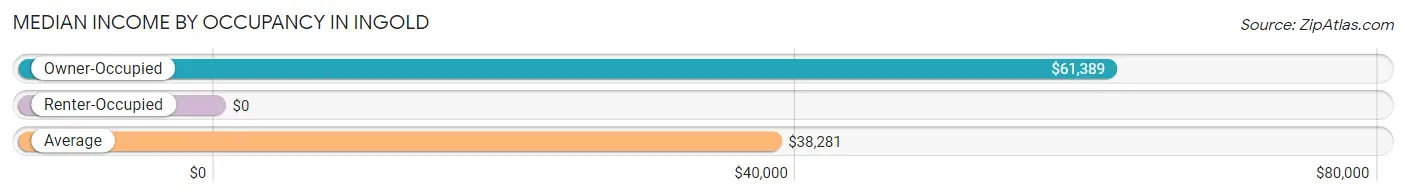
| Occupancy Type | # Households | Median Income |
| Owner-Occupied | 124 (74.7%) | $61,389 |
| Renter-Occupied | 42 (25.3%) | $0 |
| Average | 166 (100.0%) | $38,281 |
Occupancy by Householder Income Bracket in Ingold
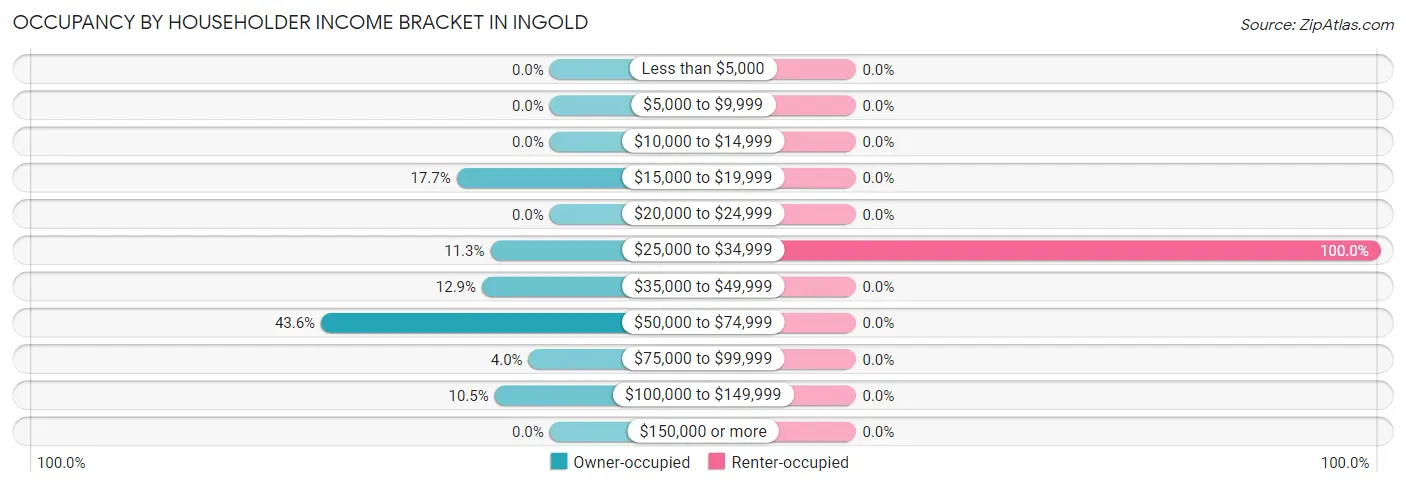
| Income Bracket | Owner-occupied | Renter-occupied |
| Less than $5,000 | 0 (0.0%) | 0 (0.0%) |
| $5,000 to $9,999 | 0 (0.0%) | 0 (0.0%) |
| $10,000 to $14,999 | 0 (0.0%) | 0 (0.0%) |
| $15,000 to $19,999 | 22 (17.7%) | 0 (0.0%) |
| $20,000 to $24,999 | 0 (0.0%) | 0 (0.0%) |
| $25,000 to $34,999 | 14 (11.3%) | 42 (100.0%) |
| $35,000 to $49,999 | 16 (12.9%) | 0 (0.0%) |
| $50,000 to $74,999 | 54 (43.5%) | 0 (0.0%) |
| $75,000 to $99,999 | 5 (4.0%) | 0 (0.0%) |
| $100,000 to $149,999 | 13 (10.5%) | 0 (0.0%) |
| $150,000 or more | 0 (0.0%) | 0 (0.0%) |
| Total | 124 (100.0%) | 42 (100.0%) |
Monthly Housing Cost Tiers in Ingold
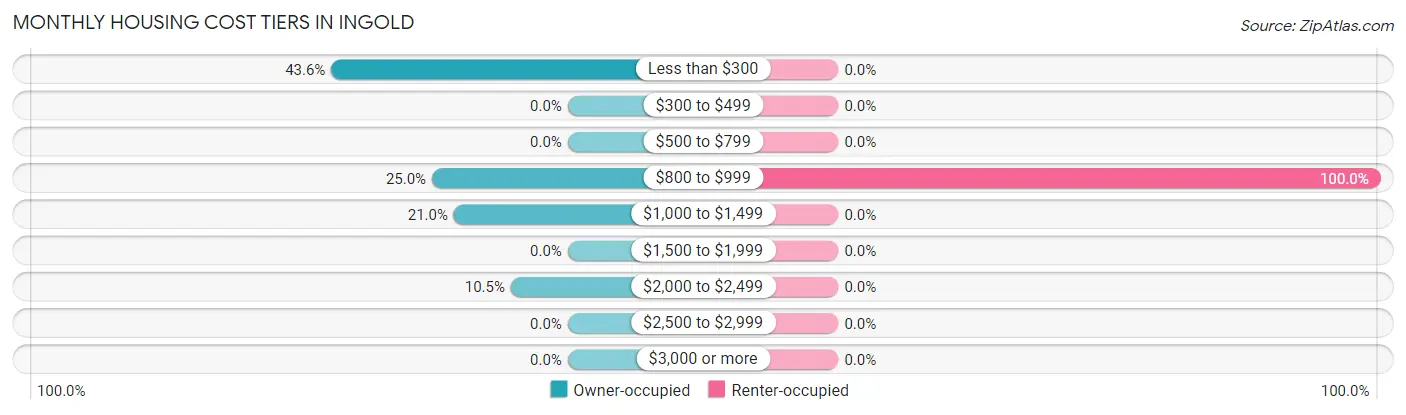
| Monthly Cost | Owner-occupied | Renter-occupied |
| Less than $300 | 54 (43.5%) | 0 (0.0%) |
| $300 to $499 | 0 (0.0%) | 0 (0.0%) |
| $500 to $799 | 0 (0.0%) | 0 (0.0%) |
| $800 to $999 | 31 (25.0%) | 42 (100.0%) |
| $1,000 to $1,499 | 26 (21.0%) | 0 (0.0%) |
| $1,500 to $1,999 | 0 (0.0%) | 0 (0.0%) |
| $2,000 to $2,499 | 13 (10.5%) | 0 (0.0%) |
| $2,500 to $2,999 | 0 (0.0%) | 0 (0.0%) |
| $3,000 or more | 0 (0.0%) | 0 (0.0%) |
| Total | 124 (100.0%) | 42 (100.0%) |
Physical Housing Characteristics in Ingold
Housing Structures in Ingold
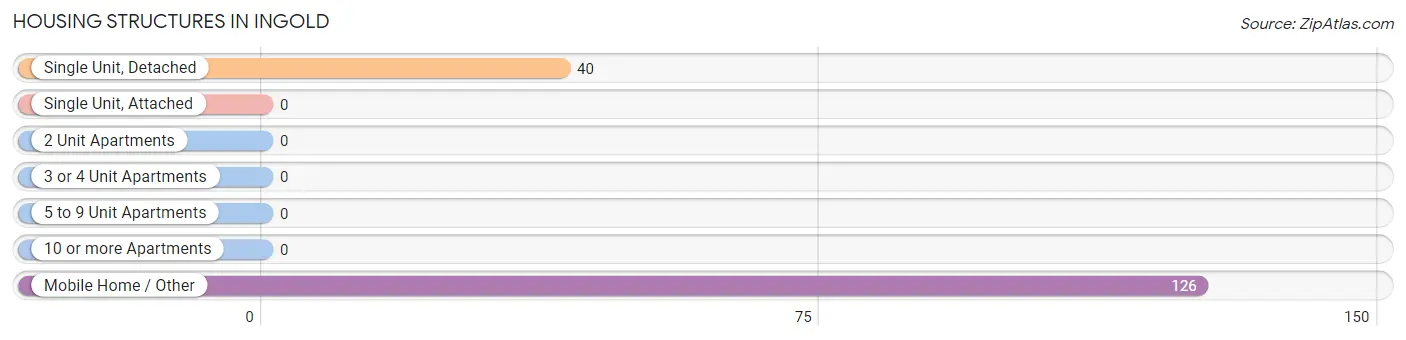
| Structure Type | # Housing Units | % Housing Units |
| Single Unit, Detached | 40 | 24.1% |
| Single Unit, Attached | 0 | 0.0% |
| 2 Unit Apartments | 0 | 0.0% |
| 3 or 4 Unit Apartments | 0 | 0.0% |
| 5 to 9 Unit Apartments | 0 | 0.0% |
| 10 or more Apartments | 0 | 0.0% |
| Mobile Home / Other | 126 | 75.9% |
| Total | 166 | 100.0% |
Housing Structures by Occupancy in Ingold
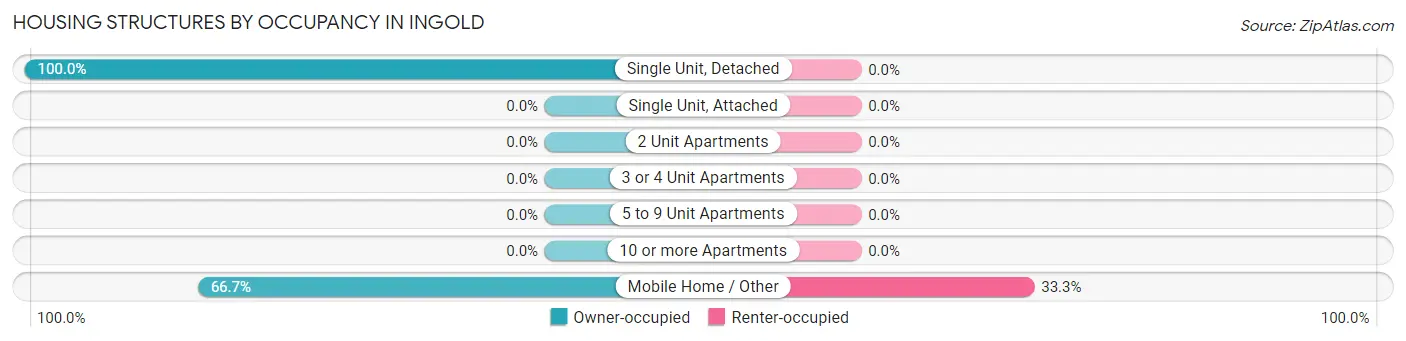
| Structure Type | Owner-occupied | Renter-occupied |
| Single Unit, Detached | 40 (100.0%) | 0 (0.0%) |
| Single Unit, Attached | 0 (0.0%) | 0 (0.0%) |
| 2 Unit Apartments | 0 (0.0%) | 0 (0.0%) |
| 3 or 4 Unit Apartments | 0 (0.0%) | 0 (0.0%) |
| 5 to 9 Unit Apartments | 0 (0.0%) | 0 (0.0%) |
| 10 or more Apartments | 0 (0.0%) | 0 (0.0%) |
| Mobile Home / Other | 84 (66.7%) | 42 (33.3%) |
| Total | 124 (74.7%) | 42 (25.3%) |
Housing Structures by Number of Rooms in Ingold
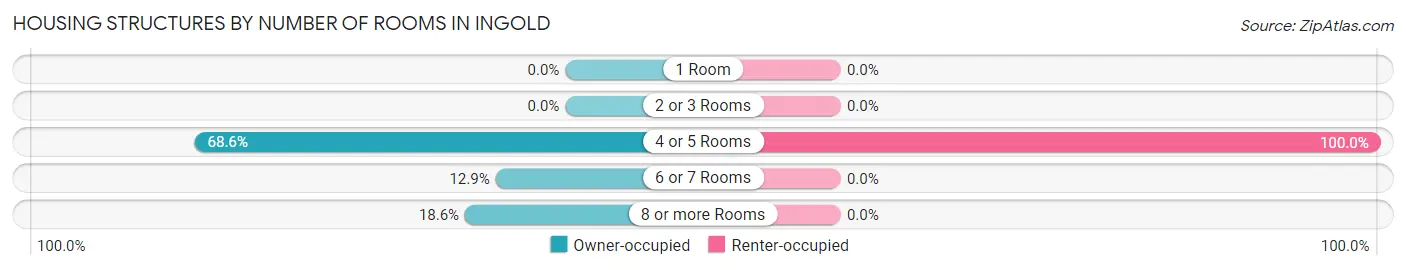
| Number of Rooms | Owner-occupied | Renter-occupied |
| 1 Room | 0 (0.0%) | 0 (0.0%) |
| 2 or 3 Rooms | 0 (0.0%) | 0 (0.0%) |
| 4 or 5 Rooms | 85 (68.5%) | 42 (100.0%) |
| 6 or 7 Rooms | 16 (12.9%) | 0 (0.0%) |
| 8 or more Rooms | 23 (18.5%) | 0 (0.0%) |
| Total | 124 (100.0%) | 42 (100.0%) |
Housing Structure by Heating Type in Ingold
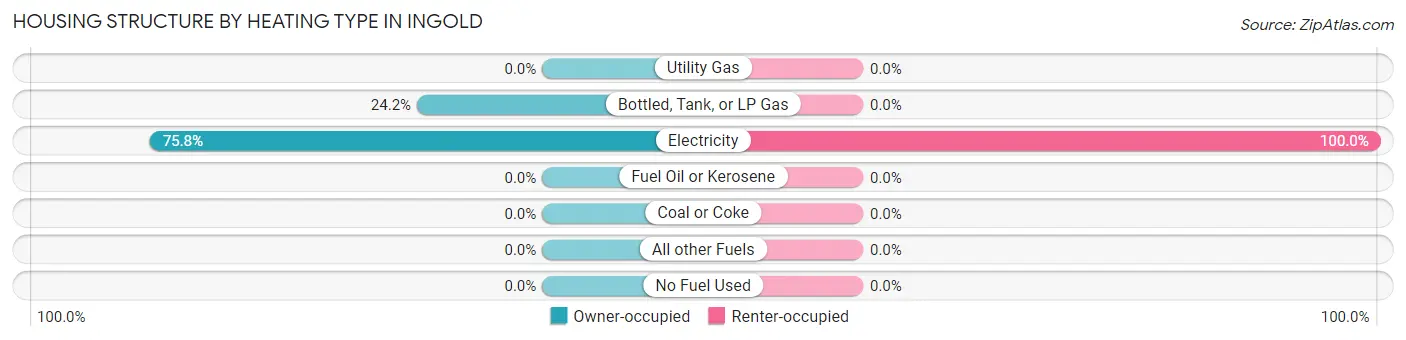
| Heating Type | Owner-occupied | Renter-occupied |
| Utility Gas | 0 (0.0%) | 0 (0.0%) |
| Bottled, Tank, or LP Gas | 30 (24.2%) | 0 (0.0%) |
| Electricity | 94 (75.8%) | 42 (100.0%) |
| Fuel Oil or Kerosene | 0 (0.0%) | 0 (0.0%) |
| Coal or Coke | 0 (0.0%) | 0 (0.0%) |
| All other Fuels | 0 (0.0%) | 0 (0.0%) |
| No Fuel Used | 0 (0.0%) | 0 (0.0%) |
| Total | 124 (100.0%) | 42 (100.0%) |
Household Vehicle Usage in Ingold
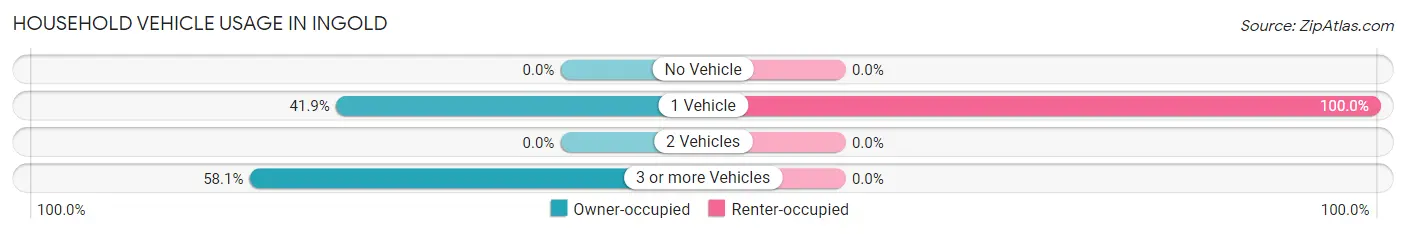
| Vehicles per Household | Owner-occupied | Renter-occupied |
| No Vehicle | 0 (0.0%) | 0 (0.0%) |
| 1 Vehicle | 52 (41.9%) | 42 (100.0%) |
| 2 Vehicles | 0 (0.0%) | 0 (0.0%) |
| 3 or more Vehicles | 72 (58.1%) | 0 (0.0%) |
| Total | 124 (100.0%) | 42 (100.0%) |
Real Estate & Mortgages in Ingold
Real Estate and Mortgage Overview in Ingold
| Characteristic | Without Mortgage | With Mortgage |
| Housing Units | 54 | 70 |
| Median Property Value | - | - |
| Median Household Income | - | - |
| Monthly Housing Costs | - | - |
| Real Estate Taxes | - | - |
Property Value by Mortgage Status in Ingold
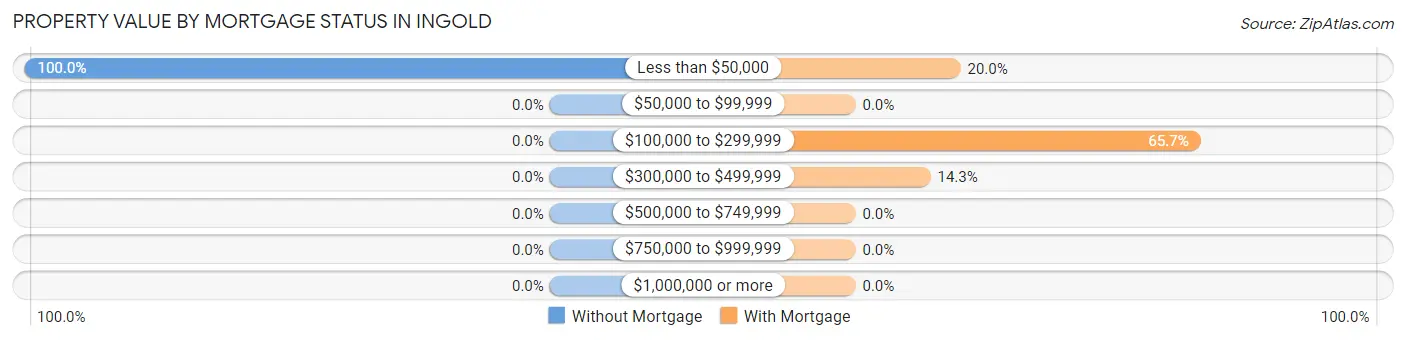
| Property Value | Without Mortgage | With Mortgage |
| Less than $50,000 | 54 (100.0%) | 14 (20.0%) |
| $50,000 to $99,999 | 0 (0.0%) | 0 (0.0%) |
| $100,000 to $299,999 | 0 (0.0%) | 46 (65.7%) |
| $300,000 to $499,999 | 0 (0.0%) | 10 (14.3%) |
| $500,000 to $749,999 | 0 (0.0%) | 0 (0.0%) |
| $750,000 to $999,999 | 0 (0.0%) | 0 (0.0%) |
| $1,000,000 or more | 0 (0.0%) | 0 (0.0%) |
| Total | 54 (100.0%) | 70 (100.0%) |
Household Income by Mortgage Status in Ingold
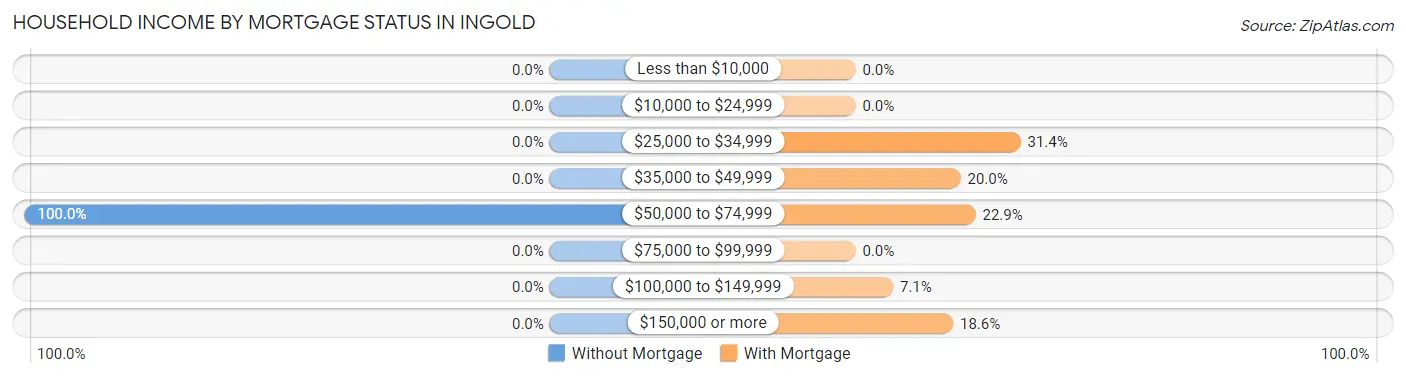
| Household Income | Without Mortgage | With Mortgage |
| Less than $10,000 | 0 (0.0%) | 0 (0.0%) |
| $10,000 to $24,999 | 0 (0.0%) | 0 (0.0%) |
| $25,000 to $34,999 | 0 (0.0%) | 22 (31.4%) |
| $35,000 to $49,999 | 0 (0.0%) | 14 (20.0%) |
| $50,000 to $74,999 | 54 (100.0%) | 16 (22.9%) |
| $75,000 to $99,999 | 0 (0.0%) | 0 (0.0%) |
| $100,000 to $149,999 | 0 (0.0%) | 5 (7.1%) |
| $150,000 or more | 0 (0.0%) | 13 (18.6%) |
| Total | 54 (100.0%) | 70 (100.0%) |
Property Value to Household Income Ratio in Ingold
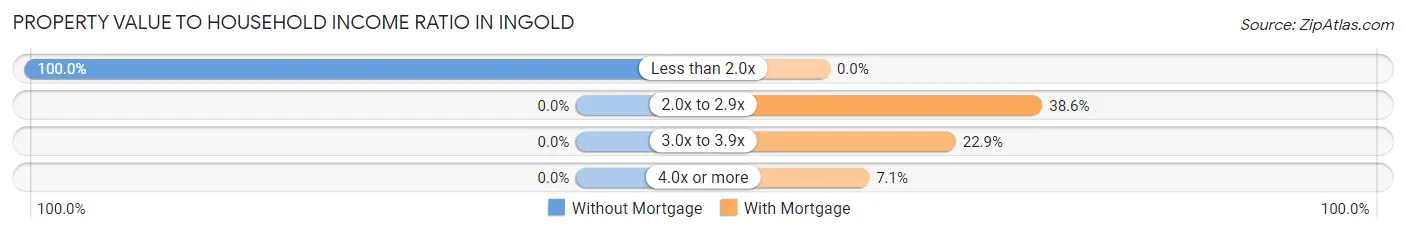
| Value-to-Income Ratio | Without Mortgage | With Mortgage |
| Less than 2.0x | 54 (100.0%) | 0 (0.0%) |
| 2.0x to 2.9x | 0 (0.0%) | 27 (38.6%) |
| 3.0x to 3.9x | 0 (0.0%) | 16 (22.9%) |
| 4.0x or more | 0 (0.0%) | 5 (7.1%) |
| Total | 54 (100.0%) | 70 (100.0%) |
Real Estate Taxes by Mortgage Status in Ingold
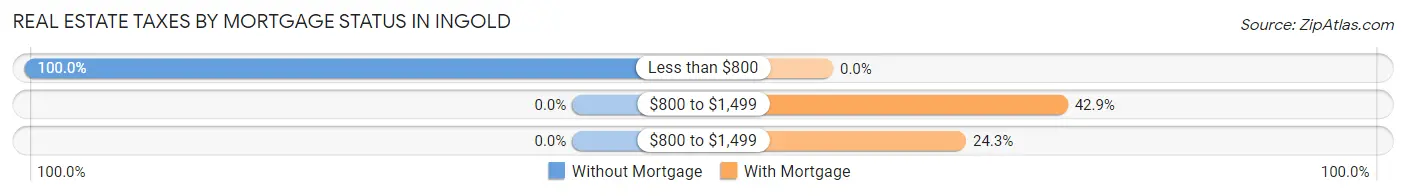
| Property Taxes | Without Mortgage | With Mortgage |
| Less than $800 | 54 (100.0%) | 0 (0.0%) |
| $800 to $1,499 | 0 (0.0%) | 30 (42.9%) |
| $800 to $1,499 | 0 (0.0%) | 17 (24.3%) |
| Total | 54 (100.0%) | 70 (100.0%) |
Health & Disability in Ingold
Health Insurance Coverage by Age in Ingold
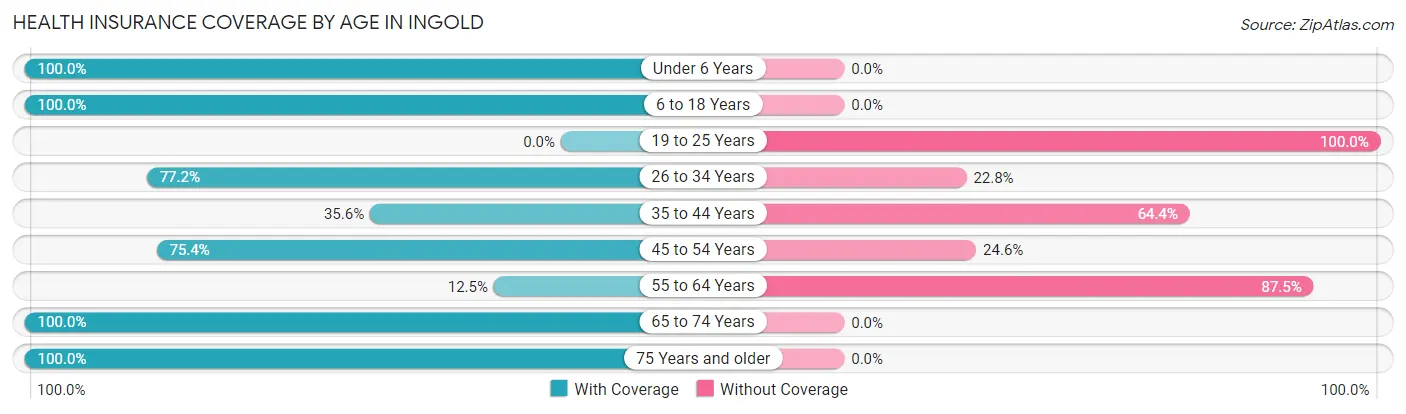
| Age Bracket | With Coverage | Without Coverage |
| Under 6 Years | 105 (100.0%) | 0 (0.0%) |
| 6 to 18 Years | 232 (100.0%) | 0 (0.0%) |
| 19 to 25 Years | 0 (0.0%) | 56 (100.0%) |
| 26 to 34 Years | 122 (77.2%) | 36 (22.8%) |
| 35 to 44 Years | 21 (35.6%) | 38 (64.4%) |
| 45 to 54 Years | 46 (75.4%) | 15 (24.6%) |
| 55 to 64 Years | 6 (12.5%) | 42 (87.5%) |
| 65 to 74 Years | 17 (100.0%) | 0 (0.0%) |
| 75 Years and older | 21 (100.0%) | 0 (0.0%) |
| Total | 570 (75.3%) | 187 (24.7%) |
Health Insurance Coverage by Citizenship Status in Ingold
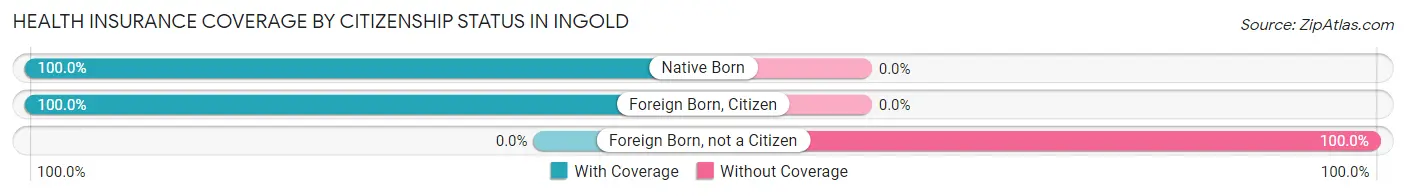
| Citizenship Status | With Coverage | Without Coverage |
| Native Born | 105 (100.0%) | 0 (0.0%) |
| Foreign Born, Citizen | 232 (100.0%) | 0 (0.0%) |
| Foreign Born, not a Citizen | 0 (0.0%) | 56 (100.0%) |
Health Insurance Coverage by Household Income in Ingold
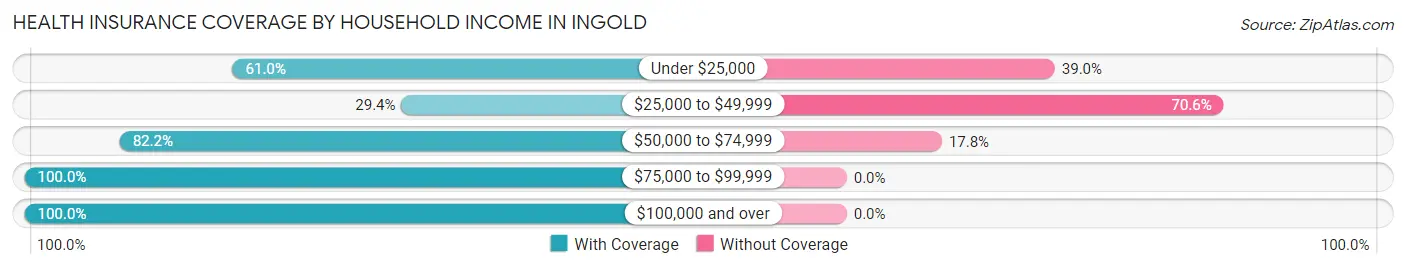
| Household Income | With Coverage | Without Coverage |
| Under $25,000 | 36 (61.0%) | 23 (39.0%) |
| $25,000 to $49,999 | 30 (29.4%) | 72 (70.6%) |
| $50,000 to $74,999 | 424 (82.2%) | 92 (17.8%) |
| $75,000 to $99,999 | 11 (100.0%) | 0 (0.0%) |
| $100,000 and over | 69 (100.0%) | 0 (0.0%) |
Public vs Private Health Insurance Coverage by Age in Ingold
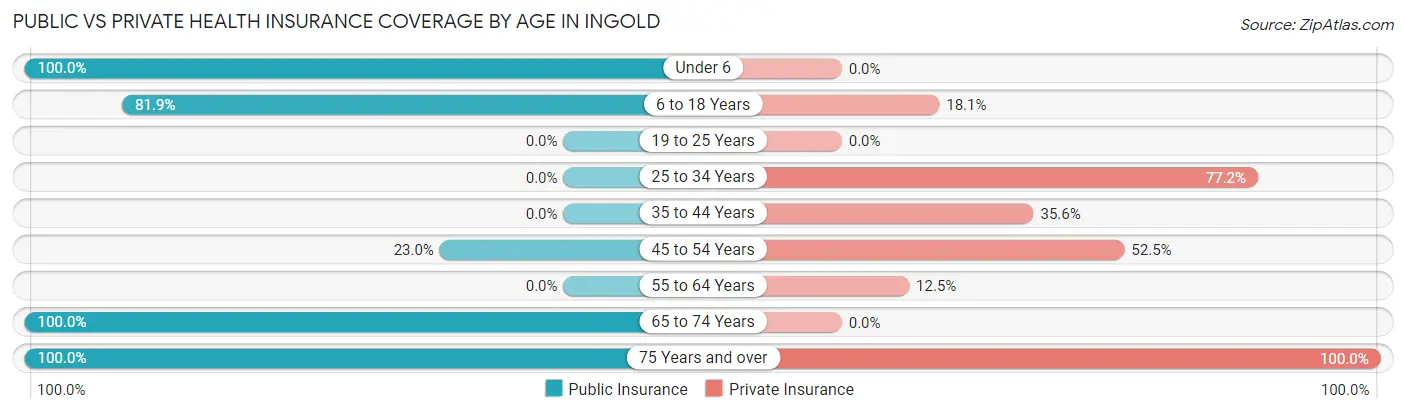
| Age Bracket | Public Insurance | Private Insurance |
| Under 6 | 105 (100.0%) | 0 (0.0%) |
| 6 to 18 Years | 190 (81.9%) | 42 (18.1%) |
| 19 to 25 Years | 0 (0.0%) | 0 (0.0%) |
| 25 to 34 Years | 0 (0.0%) | 122 (77.2%) |
| 35 to 44 Years | 0 (0.0%) | 21 (35.6%) |
| 45 to 54 Years | 14 (23.0%) | 32 (52.5%) |
| 55 to 64 Years | 0 (0.0%) | 6 (12.5%) |
| 65 to 74 Years | 17 (100.0%) | 0 (0.0%) |
| 75 Years and over | 21 (100.0%) | 21 (100.0%) |
| Total | 347 (45.8%) | 244 (32.2%) |
Disability Status by Sex by Age in Ingold
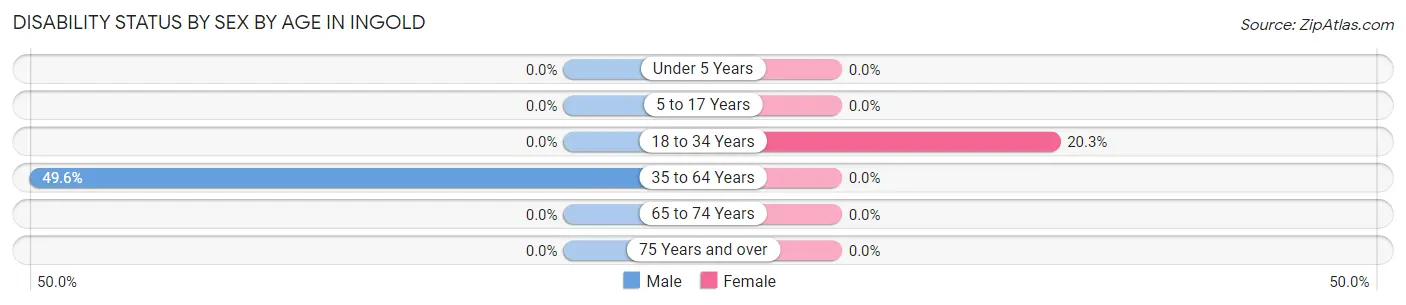
| Age Bracket | Male | Female |
| Under 5 Years | 0 (0.0%) | 0 (0.0%) |
| 5 to 17 Years | 0 (0.0%) | 0 (0.0%) |
| 18 to 34 Years | 0 (0.0%) | 15 (20.3%) |
| 35 to 64 Years | 56 (49.6%) | 0 (0.0%) |
| 65 to 74 Years | 0 (0.0%) | 0 (0.0%) |
| 75 Years and over | 0 (0.0%) | 0 (0.0%) |
Disability Class by Sex by Age in Ingold
Disability Class: Hearing Difficulty
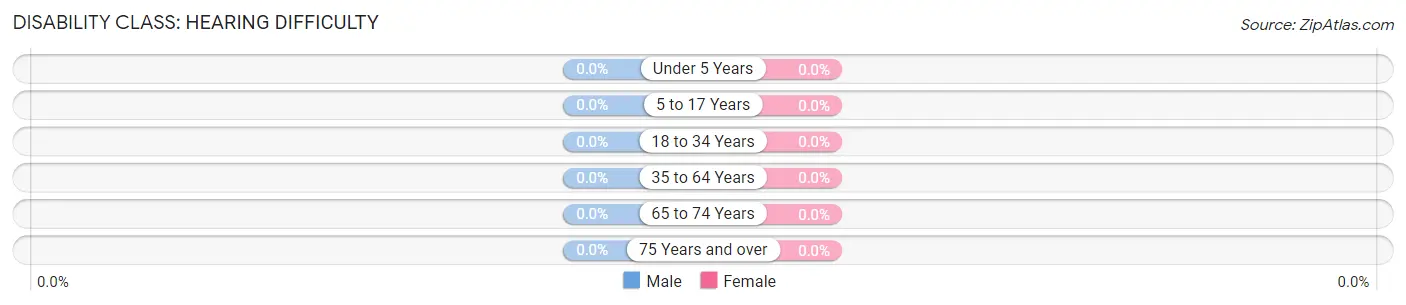
| Age Bracket | Male | Female |
| Under 5 Years | 0 (0.0%) | 0 (0.0%) |
| 5 to 17 Years | 0 (0.0%) | 0 (0.0%) |
| 18 to 34 Years | 0 (0.0%) | 0 (0.0%) |
| 35 to 64 Years | 0 (0.0%) | 0 (0.0%) |
| 65 to 74 Years | 0 (0.0%) | 0 (0.0%) |
| 75 Years and over | 0 (0.0%) | 0 (0.0%) |
Disability Class: Vision Difficulty
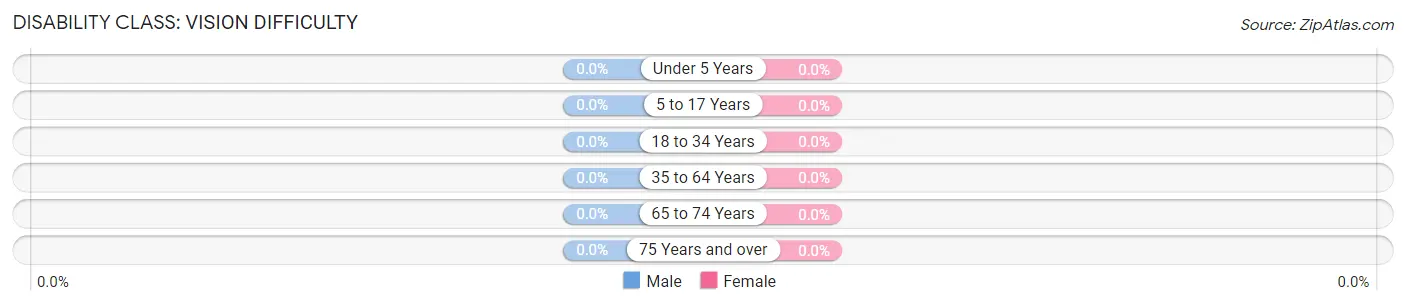
| Age Bracket | Male | Female |
| Under 5 Years | 0 (0.0%) | 0 (0.0%) |
| 5 to 17 Years | 0 (0.0%) | 0 (0.0%) |
| 18 to 34 Years | 0 (0.0%) | 0 (0.0%) |
| 35 to 64 Years | 0 (0.0%) | 0 (0.0%) |
| 65 to 74 Years | 0 (0.0%) | 0 (0.0%) |
| 75 Years and over | 0 (0.0%) | 0 (0.0%) |
Disability Class: Cognitive Difficulty
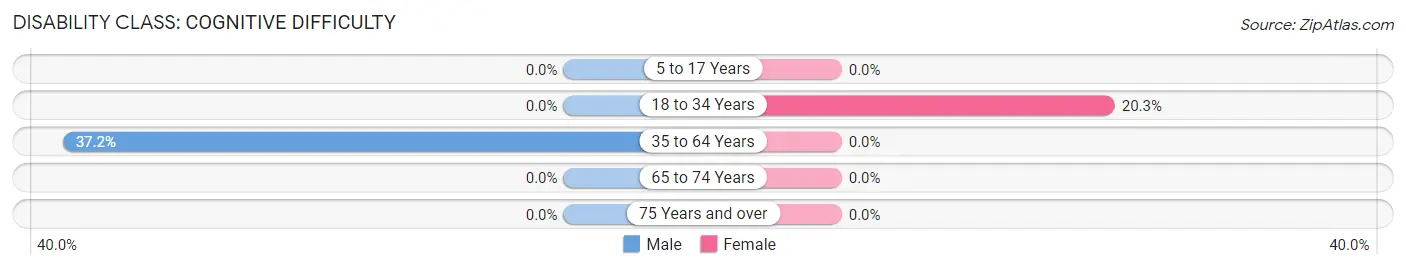
| Age Bracket | Male | Female |
| 5 to 17 Years | 0 (0.0%) | 0 (0.0%) |
| 18 to 34 Years | 0 (0.0%) | 15 (20.3%) |
| 35 to 64 Years | 42 (37.2%) | 0 (0.0%) |
| 65 to 74 Years | 0 (0.0%) | 0 (0.0%) |
| 75 Years and over | 0 (0.0%) | 0 (0.0%) |
Disability Class: Ambulatory Difficulty
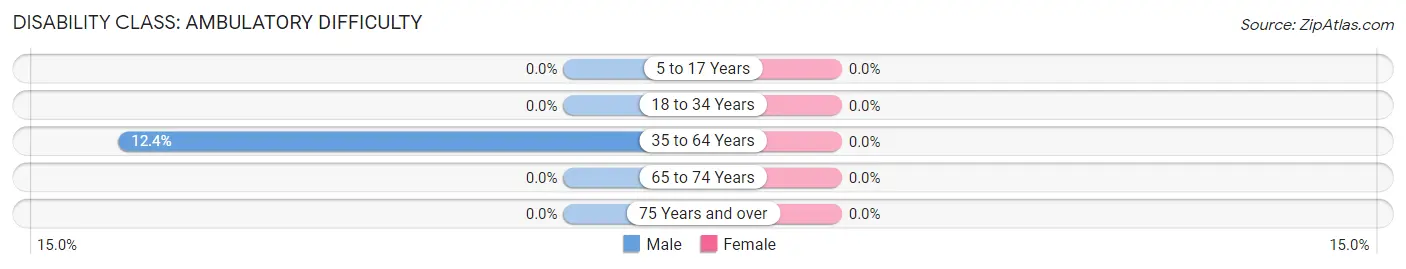
| Age Bracket | Male | Female |
| 5 to 17 Years | 0 (0.0%) | 0 (0.0%) |
| 18 to 34 Years | 0 (0.0%) | 0 (0.0%) |
| 35 to 64 Years | 14 (12.4%) | 0 (0.0%) |
| 65 to 74 Years | 0 (0.0%) | 0 (0.0%) |
| 75 Years and over | 0 (0.0%) | 0 (0.0%) |
Disability Class: Self-Care Difficulty
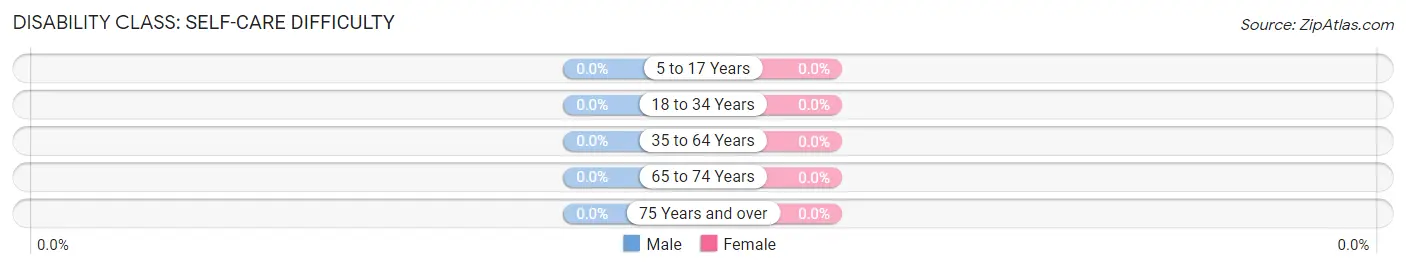
| Age Bracket | Male | Female |
| 5 to 17 Years | 0 (0.0%) | 0 (0.0%) |
| 18 to 34 Years | 0 (0.0%) | 0 (0.0%) |
| 35 to 64 Years | 0 (0.0%) | 0 (0.0%) |
| 65 to 74 Years | 0 (0.0%) | 0 (0.0%) |
| 75 Years and over | 0 (0.0%) | 0 (0.0%) |
Technology Access in Ingold
Computing Device Access in Ingold
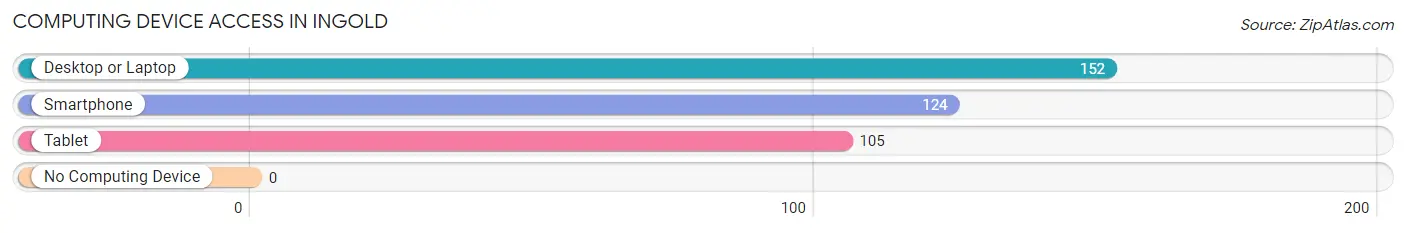
| Device Type | # Households | % Households |
| Desktop or Laptop | 152 | 91.6% |
| Smartphone | 124 | 74.7% |
| Tablet | 105 | 63.2% |
| No Computing Device | 0 | 0.0% |
| Total | 166 | 100.0% |
Internet Access in Ingold
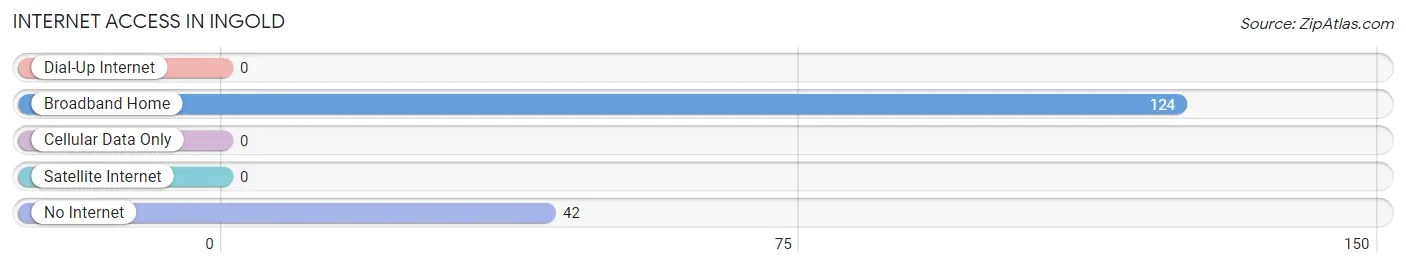
| Internet Type | # Households | % Households |
| Dial-Up Internet | 0 | 0.0% |
| Broadband Home | 124 | 74.7% |
| Cellular Data Only | 0 | 0.0% |
| Satellite Internet | 0 | 0.0% |
| No Internet | 42 | 25.3% |
| Total | 166 | 100.0% |
Ingold Summary
NC History
North Carolina is a state located in the southeastern United States. It is bordered by South Carolina to the south, Georgia to the southwest, Tennessee to the west, Virginia to the north, and the Atlantic Ocean to the east. The state was originally inhabited by Native American tribes, including the Cherokee, Catawba, and Tuscarora. The first European settlers arrived in the late 16th century, and the state was officially established in 1712.
North Carolina was one of the original 13 colonies that declared independence from Great Britain in 1776. During the Revolutionary War, the state was a major supplier of food, clothing, and other supplies to the Continental Army. After the war, North Carolina became the 12th state to ratify the United States Constitution in 1789.
In the 19th century, North Carolina was a major producer of cotton, tobacco, and other agricultural products. The state also became a major center of the textile industry, and many of the state’s cities and towns grew rapidly during this period.
During the Civil War, North Carolina was a Confederate state. The state was the site of several major battles, including the Battle of Bentonville, which was the last major battle of the war. After the war, the state was readmitted to the Union in 1868.
In the 20th century, North Carolina experienced rapid economic growth, particularly in the areas of manufacturing, technology, and finance. The state also became a major center of higher education, with several major universities and colleges located in the state.
Geography
North Carolina is located in the southeastern United States, and is bordered by South Carolina to the south, Georgia to the southwest, Tennessee to the west, Virginia to the north, and the Atlantic Ocean to the east. The state has a total area of 53,819 square miles, making it the 28th largest state in the country.
The state is divided into three distinct geographic regions: the Coastal Plain, the Piedmont, and the Appalachian Mountains. The Coastal Plain is located along the Atlantic coast and is characterized by flat terrain and sandy beaches. The Piedmont is located in the central part of the state and is characterized by rolling hills and valleys. The Appalachian Mountains are located in the western part of the state and are characterized by steep, rugged terrain.
Economy
North Carolina’s economy is largely based on agriculture, manufacturing, and services. The state is a major producer of tobacco, cotton, and other agricultural products. It is also a major producer of furniture, textiles, and other manufactured goods.
The state’s service sector is also a major contributor to the economy, with tourism, finance, and technology being major industries. The state is also home to several major universities and colleges, which contribute to the economy through research and development.
Demographics
As of 2019, North Carolina had an estimated population of 10,488,084, making it the 9th most populous state in the country. The state’s population is largely concentrated in the cities and towns of the Piedmont region, with Charlotte being the largest city in the state.
The state’s population is racially and ethnically diverse, with the largest racial groups being White (68.5%), Black or African American (21.5%), and Hispanic or Latino (8.9%). The state’s largest religious group is Christianity, with Protestantism being the largest denomination.
Conclusion
North Carolina is a state located in the southeastern United States. It has a long and rich history, and has experienced rapid economic growth in recent decades. The state is divided into three distinct geographic regions, and its economy is largely based on agriculture, manufacturing, and services. The state’s population is racially and ethnically diverse, and is largely concentrated in the cities and towns of the Piedmont region.
Common Questions
What is the Total Population of Ingold?
Total Population of Ingold is 757.
What is the Total Male Population of Ingold?
Total Male Population of Ingold is 502.
What is the Total Female Population of Ingold?
Total Female Population of Ingold is 255.
What is the Ratio of Males per 100 Females in Ingold?
There are 196.86 Males per 100 Females in Ingold.
What is the Ratio of Females per 100 Males in Ingold?
There are 50.80 Females per 100 Males in Ingold.
What is the Median Population Age in Ingold?
Median Population Age in Ingold is 25.4 Years.
What is the Average Family Size in Ingold
Average Family Size in Ingold is 6.7 People.
What is the Average Household Size in Ingold
Average Household Size in Ingold is 4.6 People.
What is Per Capita Income in Ingold?
Per Capita income in Ingold is $18,080.
What is the Median Family Income in Ingold?
Median Family Income in Ingold is $67,674.
What is the Median Household income in Ingold?
Median Household Income in Ingold is $38,281.
What is Income or Wage Gap in Ingold?
Income or Wage Gap in Ingold is 48.2%.
Women in Ingold earn 51.8 cents for every dollar earned by a man.
What is Inequality or Gini Index in Ingold?
Inequality or Gini Index in Ingold is 0.32.
How Large is the Labor Force in Ingold?
There are 368 People in the Labor Forcein in Ingold.
What is the Percentage of People in the Labor Force in Ingold?
81.8% of People are in the Labor Force in Ingold.
What is the Unemployment Rate in Ingold?
Unemployment Rate in Ingold is 29.3%.