Stony Point, NC
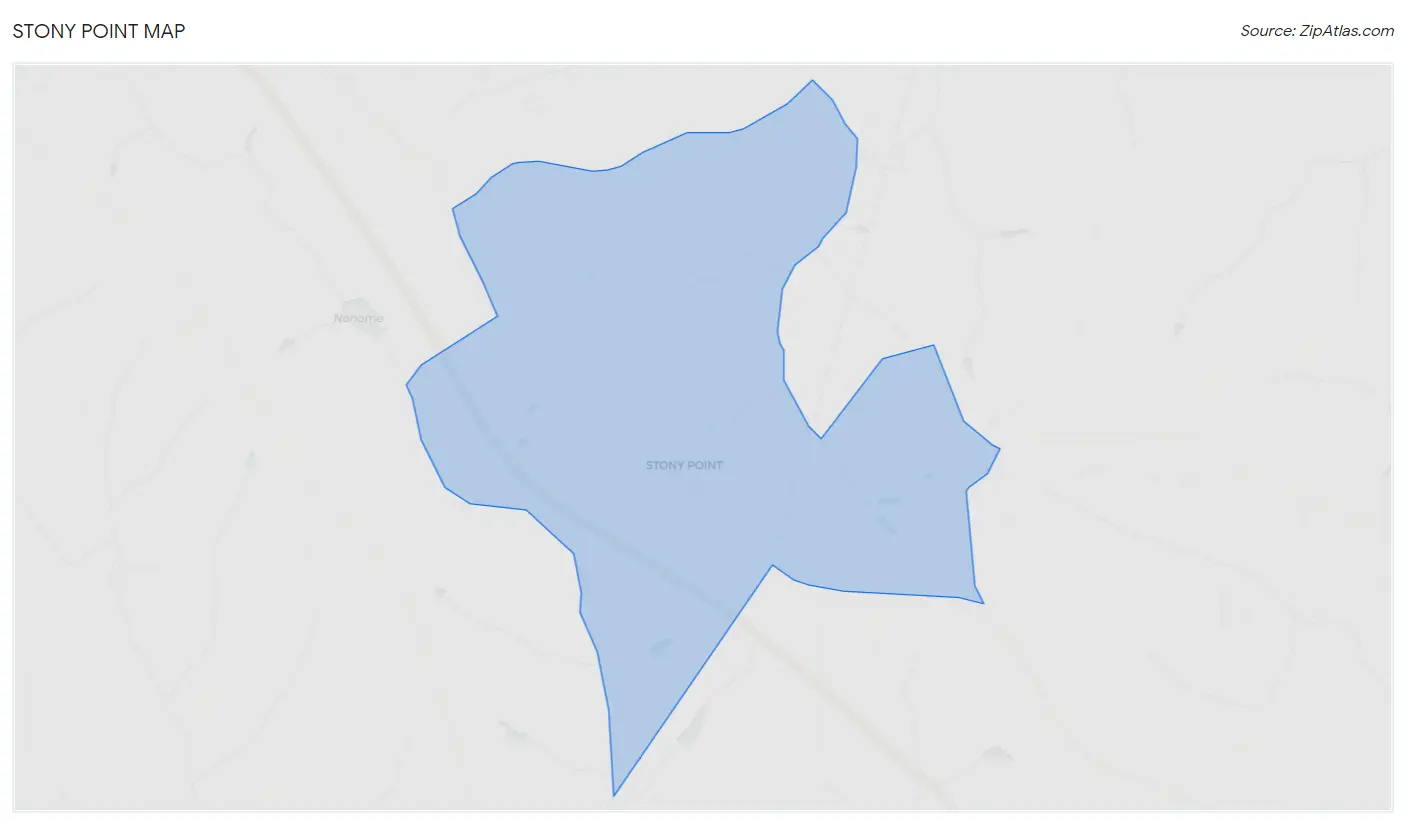
Stony Point Map
Stony Point Overview
1,494
TOTAL POPULATION
831
MALE POPULATION
663
FEMALE POPULATION
125.34
MALES / 100 FEMALES
79.78
FEMALES / 100 MALES
44.2
MEDIAN AGE
2.8
AVG FAMILY SIZE
2.5
AVG HOUSEHOLD SIZE
$29,251
PER CAPITA INCOME
$70,136
AVG FAMILY INCOME
$68,371
AVG HOUSEHOLD INCOME
0.40
INEQUALITY / GINI INDEX
835
LABOR FORCE [ PEOPLE ]
67.9%
PERCENT IN LABOR FORCE
Stony Point Zip Codes
Stony Point Area Codes
Race in Stony Point
The most populous races in Stony Point are White / Caucasian (1,156 | 77.4%), Hispanic or Latino (288 | 19.3%), and Some other Race (244 | 16.3%).
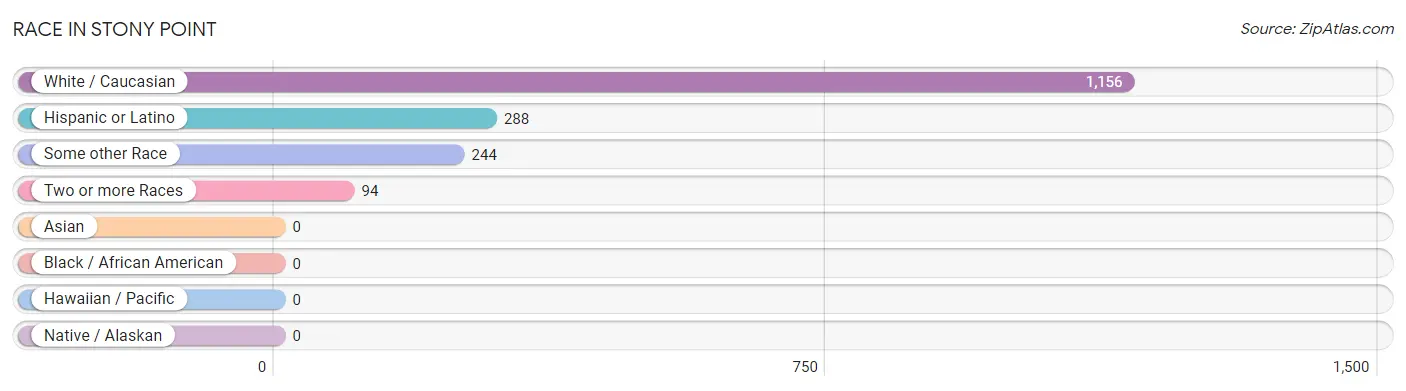
| Race | # Population | % Population |
| Asian | 0 | 0.0% |
| Black / African American | 0 | 0.0% |
| Hawaiian / Pacific | 0 | 0.0% |
| Hispanic or Latino | 288 | 19.3% |
| Native / Alaskan | 0 | 0.0% |
| White / Caucasian | 1,156 | 77.4% |
| Two or more Races | 94 | 6.3% |
| Some other Race | 244 | 16.3% |
| Total | 1,494 | 100.0% |
Ancestry in Stony Point
The most populous ancestries reported in Stony Point are German (423 | 28.3%), Mexican (258 | 17.3%), American (235 | 15.7%), Irish (222 | 14.9%), and English (221 | 14.8%), together accounting for 91.0% of all Stony Point residents.
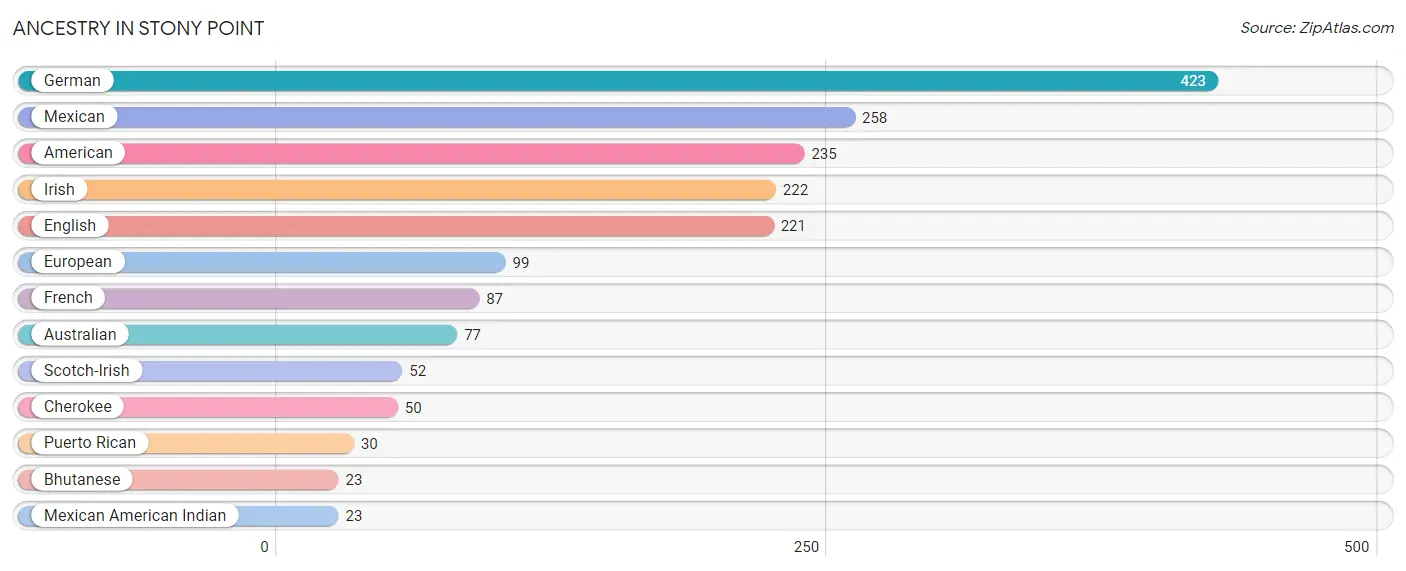
| Ancestry | # Population | % Population |
| American | 235 | 15.7% |
| Australian | 77 | 5.1% |
| Bhutanese | 23 | 1.5% |
| Cherokee | 50 | 3.4% |
| English | 221 | 14.8% |
| European | 99 | 6.6% |
| French | 87 | 5.8% |
| German | 423 | 28.3% |
| Irish | 222 | 14.9% |
| Mexican | 258 | 17.3% |
| Mexican American Indian | 23 | 1.5% |
| Puerto Rican | 30 | 2.0% |
| Scotch-Irish | 52 | 3.5% | View All 13 Rows |
Immigrants in Stony Point
The most numerous immigrant groups reported in Stony Point came from Central America (148 | 9.9%), Latin America (148 | 9.9%), and Mexico (148 | 9.9%), together accounting for 29.7% of all Stony Point residents.
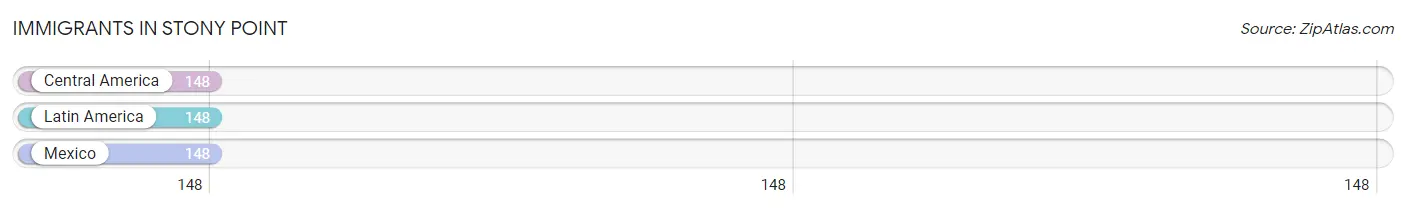
| Immigration Origin | # Population | % Population |
| Central America | 148 | 9.9% |
| Latin America | 148 | 9.9% |
| Mexico | 148 | 9.9% | View All 3 Rows |
Sex and Age in Stony Point
Sex and Age in Stony Point
The most populous age groups in Stony Point are 35 to 39 Years (190 | 22.9%) for men and 75 to 79 Years (188 | 28.4%) for women.
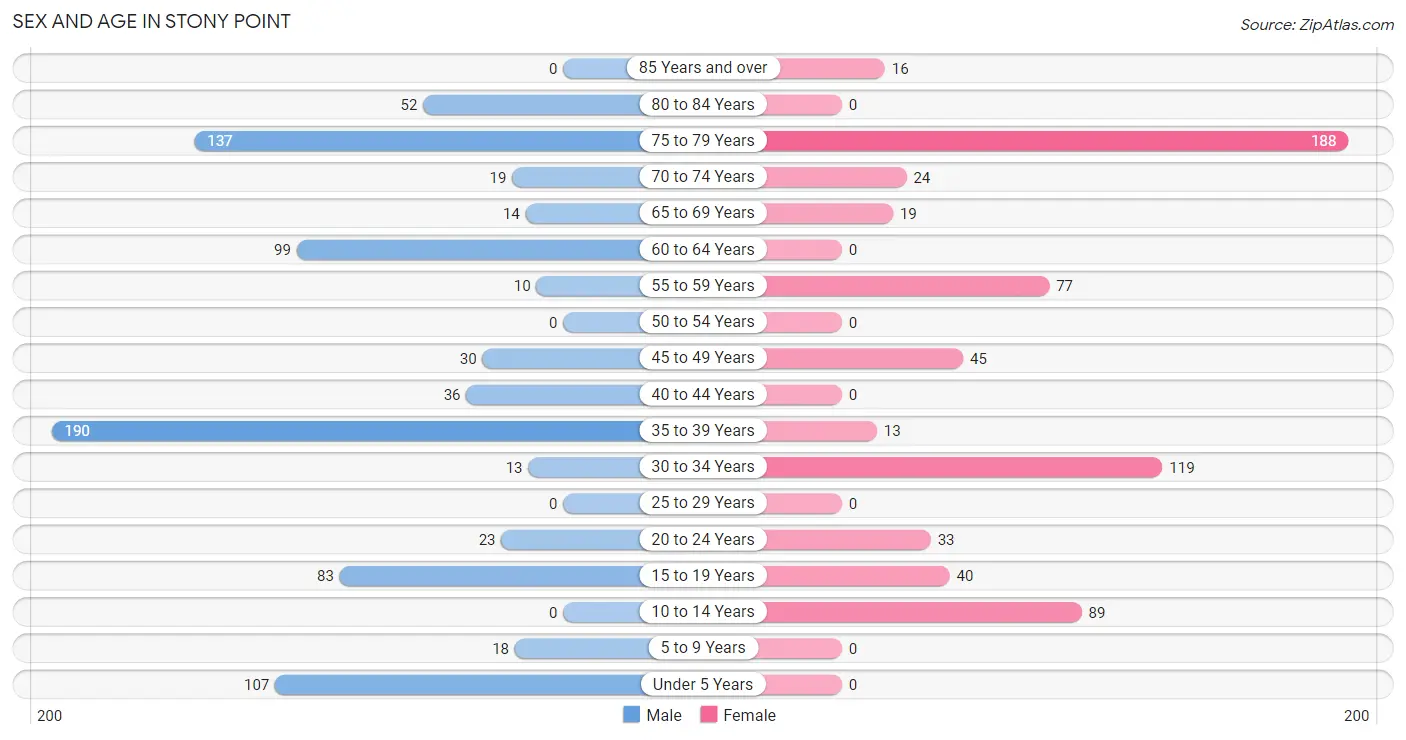
| Age Bracket | Male | Female |
| Under 5 Years | 107 (12.9%) | 0 (0.0%) |
| 5 to 9 Years | 18 (2.2%) | 0 (0.0%) |
| 10 to 14 Years | 0 (0.0%) | 89 (13.4%) |
| 15 to 19 Years | 83 (10.0%) | 40 (6.0%) |
| 20 to 24 Years | 23 (2.8%) | 33 (5.0%) |
| 25 to 29 Years | 0 (0.0%) | 0 (0.0%) |
| 30 to 34 Years | 13 (1.6%) | 119 (17.9%) |
| 35 to 39 Years | 190 (22.9%) | 13 (2.0%) |
| 40 to 44 Years | 36 (4.3%) | 0 (0.0%) |
| 45 to 49 Years | 30 (3.6%) | 45 (6.8%) |
| 50 to 54 Years | 0 (0.0%) | 0 (0.0%) |
| 55 to 59 Years | 10 (1.2%) | 77 (11.6%) |
| 60 to 64 Years | 99 (11.9%) | 0 (0.0%) |
| 65 to 69 Years | 14 (1.7%) | 19 (2.9%) |
| 70 to 74 Years | 19 (2.3%) | 24 (3.6%) |
| 75 to 79 Years | 137 (16.5%) | 188 (28.4%) |
| 80 to 84 Years | 52 (6.3%) | 0 (0.0%) |
| 85 Years and over | 0 (0.0%) | 16 (2.4%) |
| Total | 831 (100.0%) | 663 (100.0%) |
Families and Households in Stony Point
Median Family Size in Stony Point
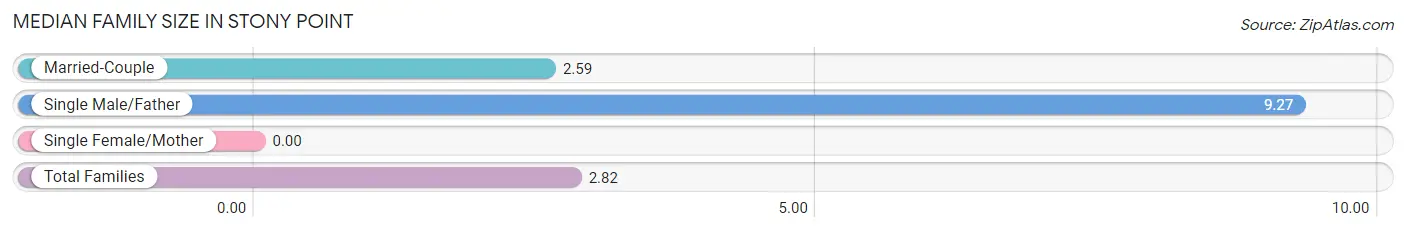
| Family Type | # Families | Family Size |
| Married-Couple | 412 (96.5%) | 2.59 |
| Single Male/Father | 15 (3.5%) | 9.27 |
| Single Female/Mother | 0 (0.0%) | - |
| Total Families | 427 (100.0%) | 2.82 |
Median Household Size in Stony Point
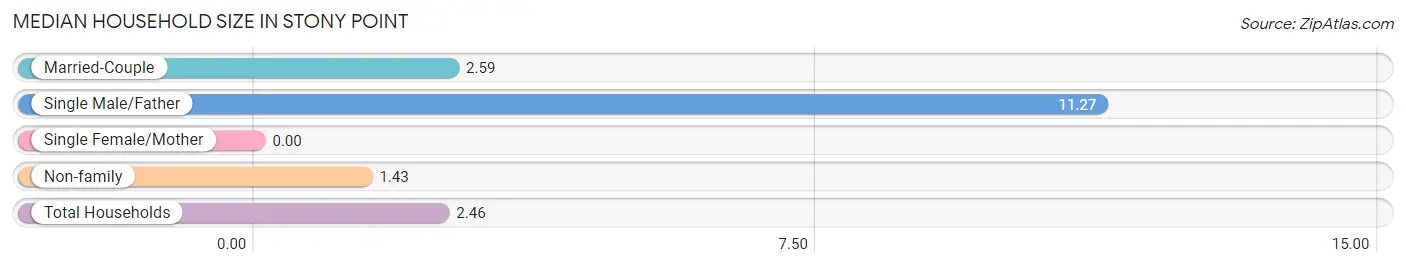
| Household Type | # Households | Household Size |
| Married-Couple | 412 (67.8%) | 2.59 |
| Single Male/Father | 15 (2.5%) | 11.27 |
| Single Female/Mother | 0 (0.0%) | - |
| Non-family | 181 (29.8%) | 1.43 |
| Total Households | 608 (100.0%) | 2.46 |
Household Size by Marriage Status in Stony Point
Out of a total of 608 households in Stony Point, 427 (70.2%) are family households, while 181 (29.8%) are nonfamily households. The most numerous type of family households are 2-person households, comprising 208, and the most common type of nonfamily households are 2-person households, comprising 99.
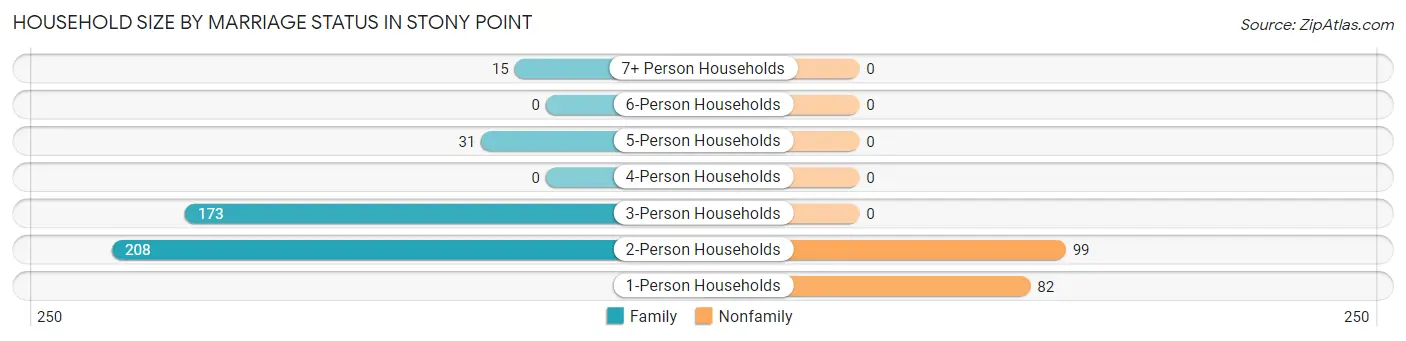
| Household Size | Family Households | Nonfamily Households |
| 1-Person Households | - | 82 (13.5%) |
| 2-Person Households | 208 (34.2%) | 99 (16.3%) |
| 3-Person Households | 173 (28.4%) | 0 (0.0%) |
| 4-Person Households | 0 (0.0%) | 0 (0.0%) |
| 5-Person Households | 31 (5.1%) | 0 (0.0%) |
| 6-Person Households | 0 (0.0%) | 0 (0.0%) |
| 7+ Person Households | 15 (2.5%) | 0 (0.0%) |
| Total | 427 (70.2%) | 181 (29.8%) |
Female Fertility in Stony Point
Fertility by Age in Stony Point

| Age Bracket | Women with Births | Births / 1,000 Women |
| 15 to 19 years | 0 (0.0%) | 0.0 |
| 20 to 34 years | 0 (0.0%) | 0.0 |
| 35 to 50 years | 0 (0.0%) | 0.0 |
| Total | 0 (0.0%) | 0.0 |
Fertility by Age by Marriage Status in Stony Point
| Age Bracket | Married | Unmarried |
| 15 to 19 years | 0 (0.0%) | 0 (0.0%) |
| 20 to 34 years | 0 (0.0%) | 0 (0.0%) |
| 35 to 50 years | 0 (0.0%) | 0 (0.0%) |
| Total | 0 (0.0%) | 0 (0.0%) |
Fertility by Education in Stony Point
| Educational Attainment | Women with Births | Births / 1,000 Women |
| Less than High School | 0 (0.0%) | 0.0 |
| High School Diploma | 0 (0.0%) | 0.0 |
| College or Associate's Degree | 0 (0.0%) | 0.0 |
| Bachelor's Degree | 0 (0.0%) | 0.0 |
| Graduate Degree | 0 (0.0%) | 0.0 |
| Total | 0 (0.0%) | 0.0 |
Fertility by Education by Marriage Status in Stony Point
| Educational Attainment | Married | Unmarried |
| Less than High School | 0 (0.0%) | 0 (0.0%) |
| High School Diploma | 0 (0.0%) | 0 (0.0%) |
| College or Associate's Degree | 0 (0.0%) | 0 (0.0%) |
| Bachelor's Degree | 0 (0.0%) | 0 (0.0%) |
| Graduate Degree | 0 (0.0%) | 0 (0.0%) |
| Total | 0 (0.0%) | 0 (0.0%) |
Income in Stony Point
Income Overview in Stony Point
Per Capita Income in Stony Point is $29,251, while median incomes of families and households are $70,136 and $68,371 respectively.
| Characteristic | Number | Measure |
| Per Capita Income | 1,494 | $29,251 |
| Median Family Income | 427 | $70,136 |
| Mean Family Income | 427 | $65,998 |
| Median Household Income | 608 | $68,371 |
| Mean Household Income | 608 | $75,883 |
| Income Deficit | 427 | $0 |
| Wage / Income Gap (%) | 1,494 | 0.00% |
| Wage / Income Gap ($) | 1,494 | 100.00¢ per $1 |
| Gini / Inequality Index | 1,494 | 0.40 |
Earnings by Sex in Stony Point
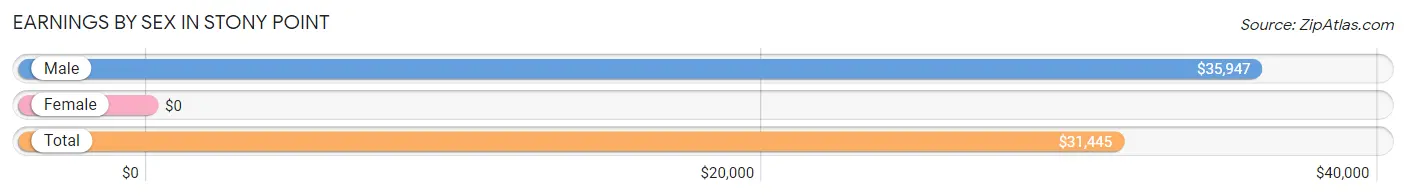
| Sex | Number | Average Earnings |
| Male | 419 (49.7%) | $35,947 |
| Female | 424 (50.3%) | $0 |
| Total | 843 (100.0%) | $31,445 |
Earnings by Sex by Income Bracket in Stony Point
The most common earnings brackets in Stony Point are $25,000 to $29,999 for men (101 | 24.1%) and $10,000 to $12,499 for women (97 | 22.9%).
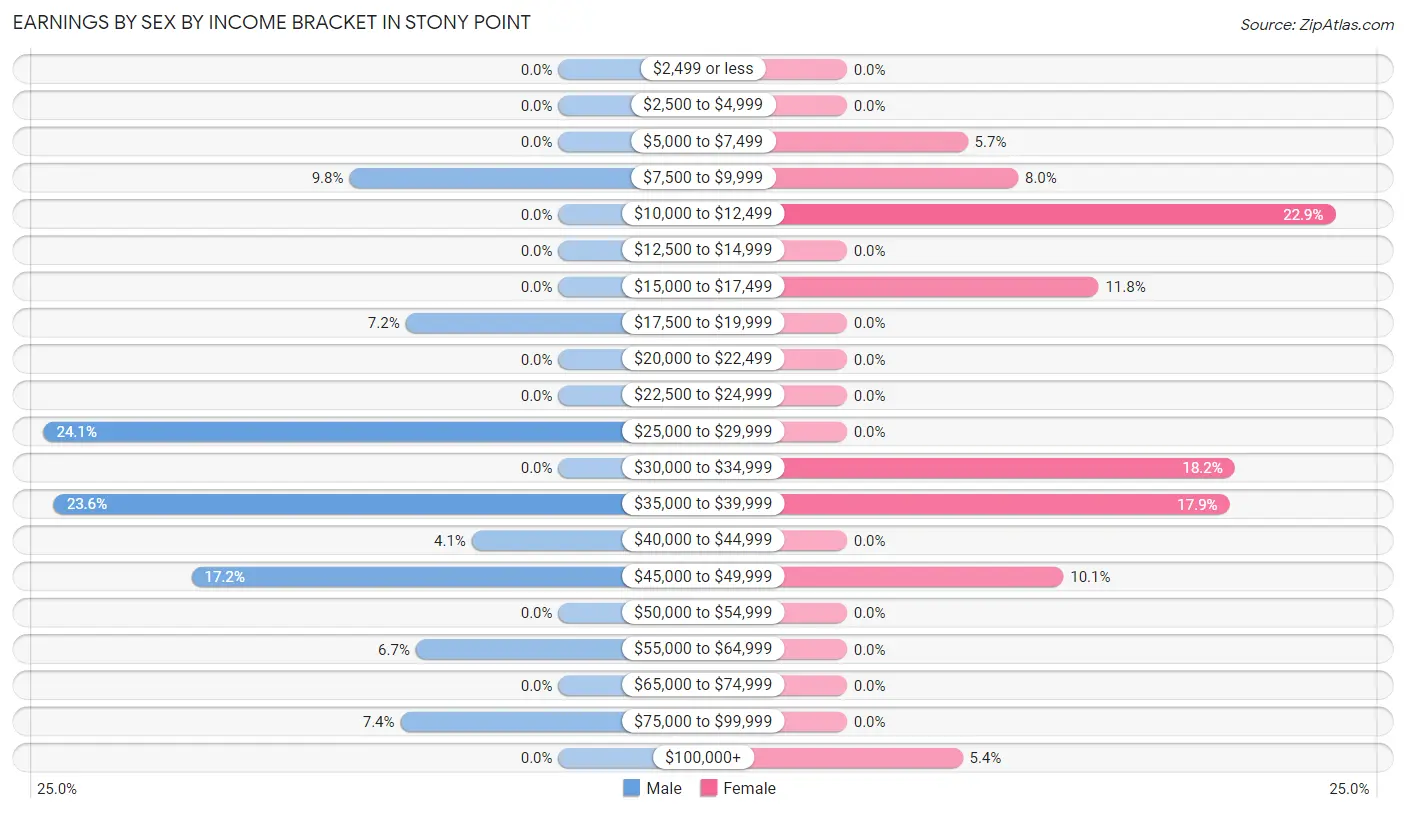
| Income | Male | Female |
| $2,499 or less | 0 (0.0%) | 0 (0.0%) |
| $2,500 to $4,999 | 0 (0.0%) | 0 (0.0%) |
| $5,000 to $7,499 | 0 (0.0%) | 24 (5.7%) |
| $7,500 to $9,999 | 41 (9.8%) | 34 (8.0%) |
| $10,000 to $12,499 | 0 (0.0%) | 97 (22.9%) |
| $12,500 to $14,999 | 0 (0.0%) | 0 (0.0%) |
| $15,000 to $17,499 | 0 (0.0%) | 50 (11.8%) |
| $17,500 to $19,999 | 30 (7.2%) | 0 (0.0%) |
| $20,000 to $22,499 | 0 (0.0%) | 0 (0.0%) |
| $22,500 to $24,999 | 0 (0.0%) | 0 (0.0%) |
| $25,000 to $29,999 | 101 (24.1%) | 0 (0.0%) |
| $30,000 to $34,999 | 0 (0.0%) | 77 (18.2%) |
| $35,000 to $39,999 | 99 (23.6%) | 76 (17.9%) |
| $40,000 to $44,999 | 17 (4.1%) | 0 (0.0%) |
| $45,000 to $49,999 | 72 (17.2%) | 43 (10.1%) |
| $50,000 to $54,999 | 0 (0.0%) | 0 (0.0%) |
| $55,000 to $64,999 | 28 (6.7%) | 0 (0.0%) |
| $65,000 to $74,999 | 0 (0.0%) | 0 (0.0%) |
| $75,000 to $99,999 | 31 (7.4%) | 0 (0.0%) |
| $100,000+ | 0 (0.0%) | 23 (5.4%) |
| Total | 419 (100.0%) | 424 (100.0%) |
Earnings by Sex by Educational Attainment in Stony Point
Average earnings in Stony Point are $36,364 for men and $30,763 for women, a difference of 15.4%. Men with an educational attainment of college or associate's degree enjoy the highest average annual earnings of $58,077, while those with high school diploma education earn the least with $35,593. Women with an educational attainment of bachelor's degree earn the most with the average annual earnings of $31,266, while those with bachelor's degree education have the smallest earnings of $31,266.
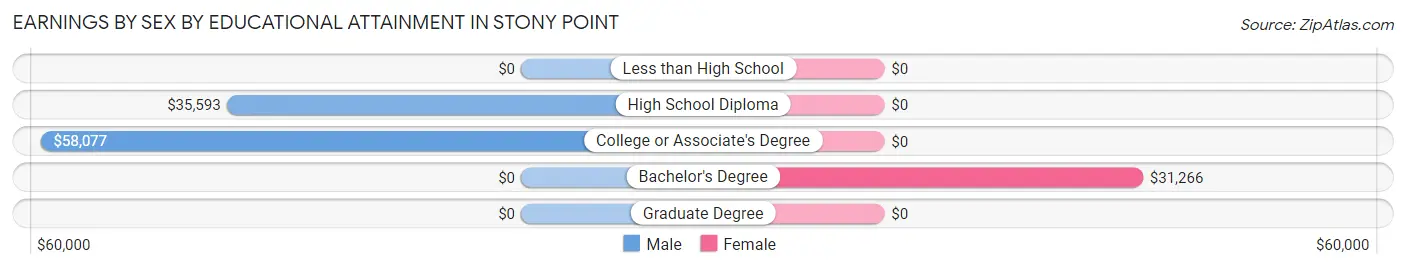
| Educational Attainment | Male Income | Female Income |
| Less than High School | - | - |
| High School Diploma | $35,593 | $0 |
| College or Associate's Degree | $58,077 | $0 |
| Bachelor's Degree | - | - |
| Graduate Degree | - | - |
| Total | $36,364 | $30,763 |
Family Income in Stony Point
Family Income Brackets in Stony Point
According to the Stony Point family income data, there are 171 families falling into the $50,000 to $74,999 income range, which is the most common income bracket and makes up 40.1% of all families.
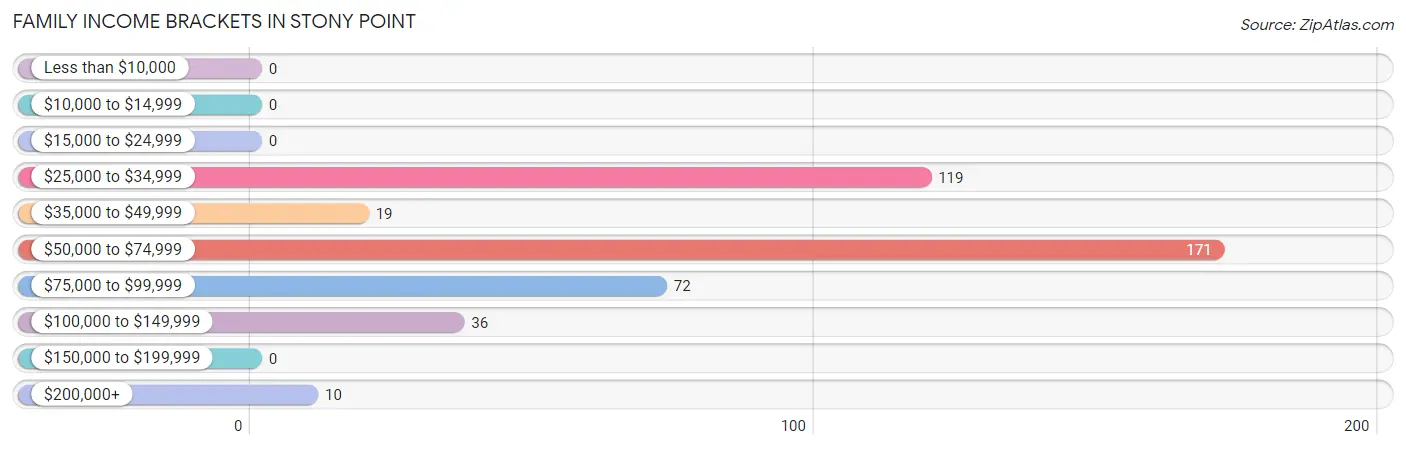
| Income Bracket | # Families | % Families |
| Less than $10,000 | 0 | 0.0% |
| $10,000 to $14,999 | 0 | 0.0% |
| $15,000 to $24,999 | 0 | 0.0% |
| $25,000 to $34,999 | 119 | 27.9% |
| $35,000 to $49,999 | 19 | 4.4% |
| $50,000 to $74,999 | 171 | 40.0% |
| $75,000 to $99,999 | 72 | 16.9% |
| $100,000 to $149,999 | 36 | 8.4% |
| $150,000 to $199,999 | 0 | 0.0% |
| $200,000+ | 10 | 2.3% |
Family Income by Famaliy Size in Stony Point
2-person families (208 | 48.7%) account for the highest median family income in Stony Point with $31,940 per family, while 2-person families (208 | 48.7%) have the highest median income of $15,970 per family member.
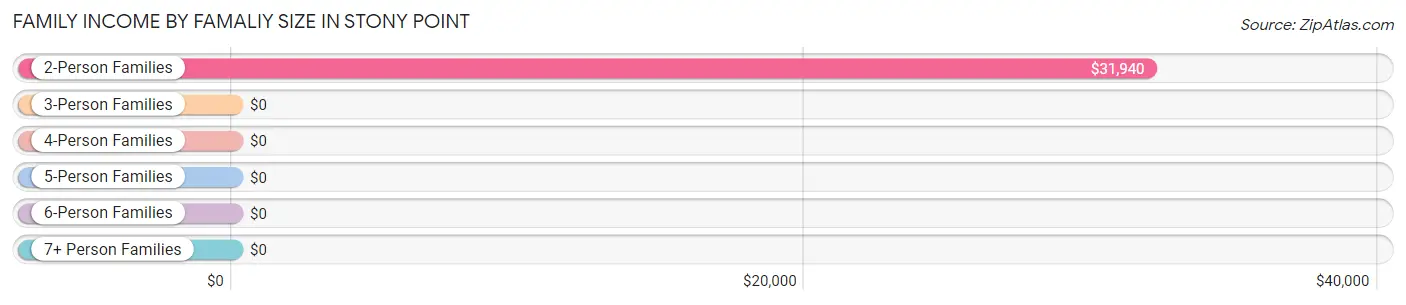
| Income Bracket | # Families | Median Income |
| 2-Person Families | 208 (48.7%) | $31,940 |
| 3-Person Families | 173 (40.5%) | $0 |
| 4-Person Families | 0 (0.0%) | $0 |
| 5-Person Families | 31 (7.3%) | $0 |
| 6-Person Families | 0 (0.0%) | $0 |
| 7+ Person Families | 15 (3.5%) | $0 |
| Total | 427 (100.0%) | $70,136 |
Family Income by Number of Earners in Stony Point
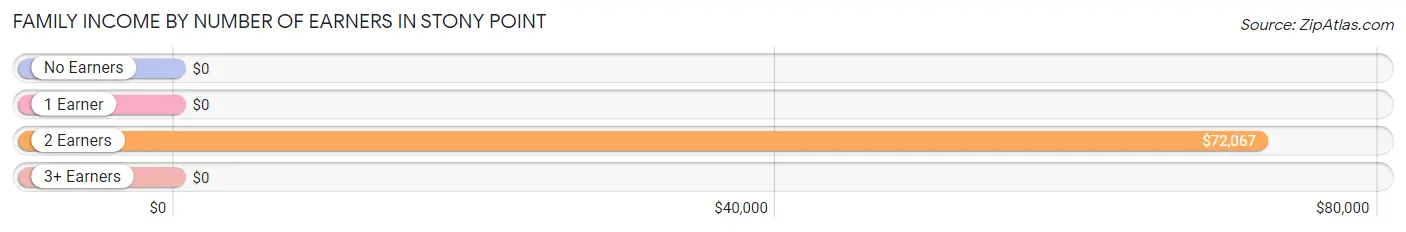
| Number of Earners | # Families | Median Income |
| No Earners | 71 (16.6%) | $0 |
| 1 Earner | 116 (27.2%) | $0 |
| 2 Earners | 209 (48.9%) | $72,067 |
| 3+ Earners | 31 (7.3%) | $0 |
| Total | 427 (100.0%) | $70,136 |
Household Income in Stony Point
Household Income Brackets in Stony Point
With 270 households falling in the category, the $50,000 to $74,999 income range is the most frequent in Stony Point, accounting for 44.4% of all households.
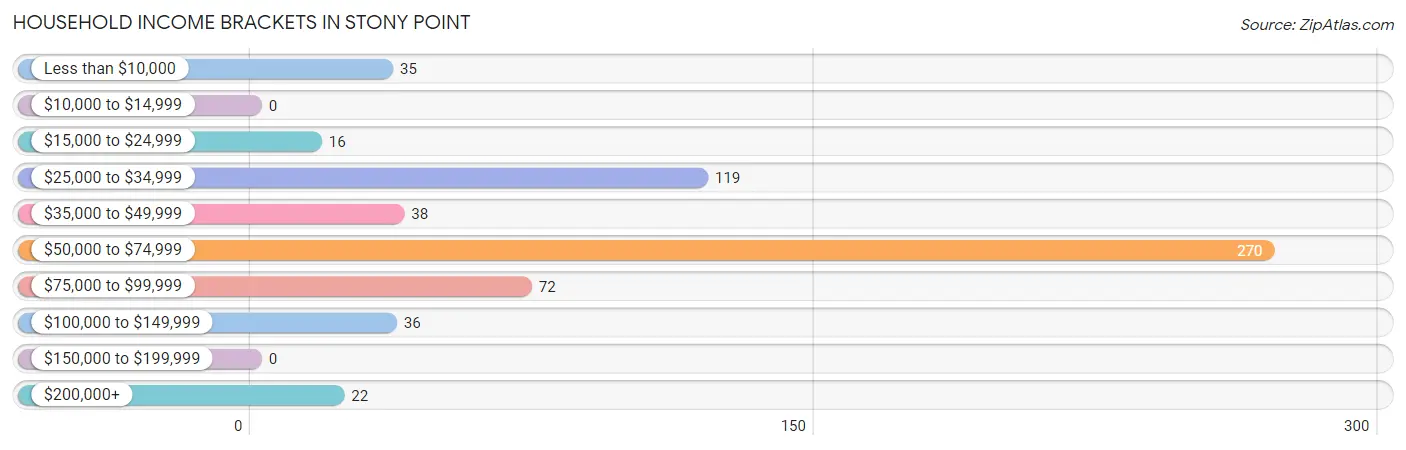
| Income Bracket | # Households | % Households |
| Less than $10,000 | 35 | 5.8% |
| $10,000 to $14,999 | 0 | 0.0% |
| $15,000 to $24,999 | 16 | 2.6% |
| $25,000 to $34,999 | 119 | 19.6% |
| $35,000 to $49,999 | 38 | 6.3% |
| $50,000 to $74,999 | 270 | 44.4% |
| $75,000 to $99,999 | 72 | 11.8% |
| $100,000 to $149,999 | 36 | 5.9% |
| $150,000 to $199,999 | 0 | 0.0% |
| $200,000+ | 22 | 3.6% |
Household Income by Householder Age in Stony Point
The median household income in Stony Point is $68,371, with the highest median household income of $72,426 found in the 25 to 44 years age bracket for the primary householder. A total of 222 households (36.5%) fall into this category. Meanwhile, the 15 to 24 years age bracket for the primary householder has the lowest median household income of $0, with 23 households (3.8%) in this group.
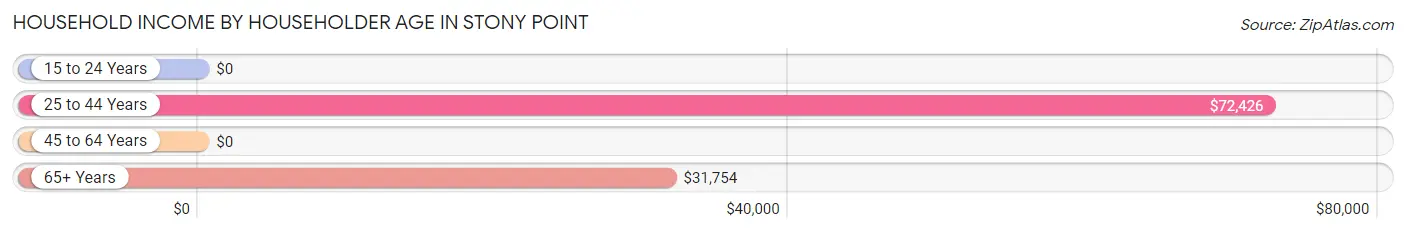
| Income Bracket | # Households | Median Income |
| 15 to 24 Years | 23 (3.8%) | $0 |
| 25 to 44 Years | 222 (36.5%) | $72,426 |
| 45 to 64 Years | 109 (17.9%) | $0 |
| 65+ Years | 254 (41.8%) | $31,754 |
| Total | 608 (100.0%) | $68,371 |
Poverty in Stony Point
Income Below Poverty by Sex and Age in Stony Point
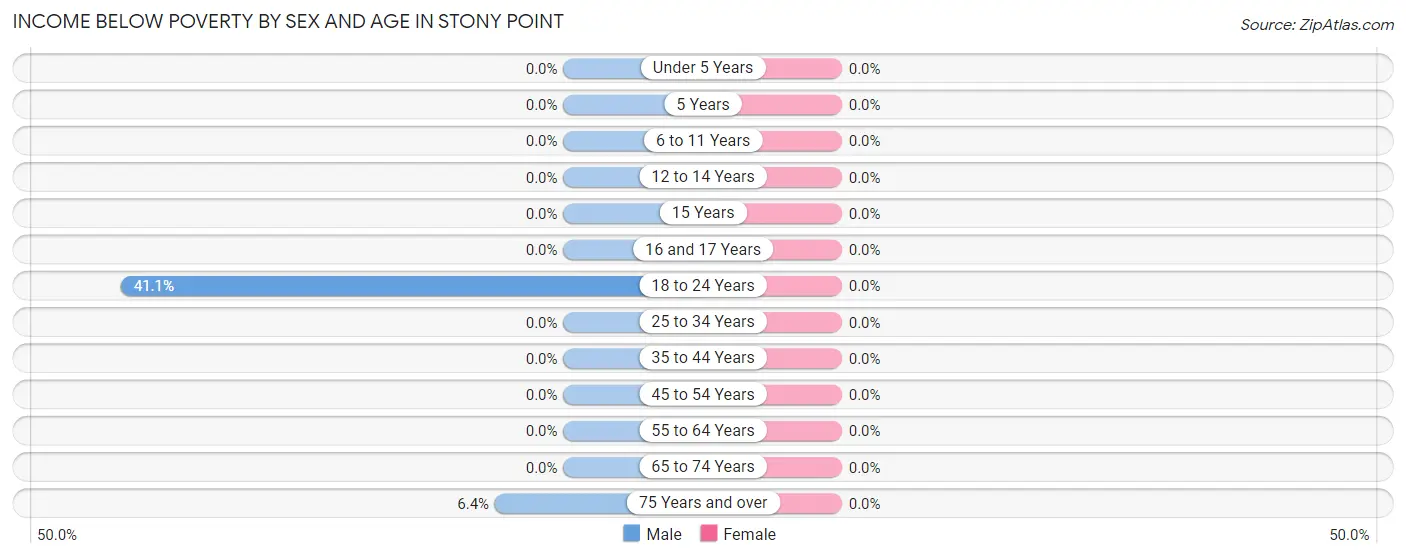
| Age Bracket | Male | Female |
| Under 5 Years | 0 (0.0%) | 0 (0.0%) |
| 5 Years | 0 (0.0%) | 0 (0.0%) |
| 6 to 11 Years | 0 (0.0%) | 0 (0.0%) |
| 12 to 14 Years | 0 (0.0%) | 0 (0.0%) |
| 15 Years | 0 (0.0%) | 0 (0.0%) |
| 16 and 17 Years | 0 (0.0%) | 0 (0.0%) |
| 18 to 24 Years | 23 (41.1%) | 0 (0.0%) |
| 25 to 34 Years | 0 (0.0%) | 0 (0.0%) |
| 35 to 44 Years | 0 (0.0%) | 0 (0.0%) |
| 45 to 54 Years | 0 (0.0%) | 0 (0.0%) |
| 55 to 64 Years | 0 (0.0%) | 0 (0.0%) |
| 65 to 74 Years | 0 (0.0%) | 0 (0.0%) |
| 75 Years and over | 12 (6.4%) | 0 (0.0%) |
| Total | 35 (4.2%) | 0 (0.0%) |
Income Above Poverty by Sex and Age in Stony Point
According to the poverty statistics in Stony Point, males aged under 5 years and females aged 12 to 14 years are the age groups that are most secure financially, with 100.0% of males and 100.0% of females in these age groups living above the poverty line.
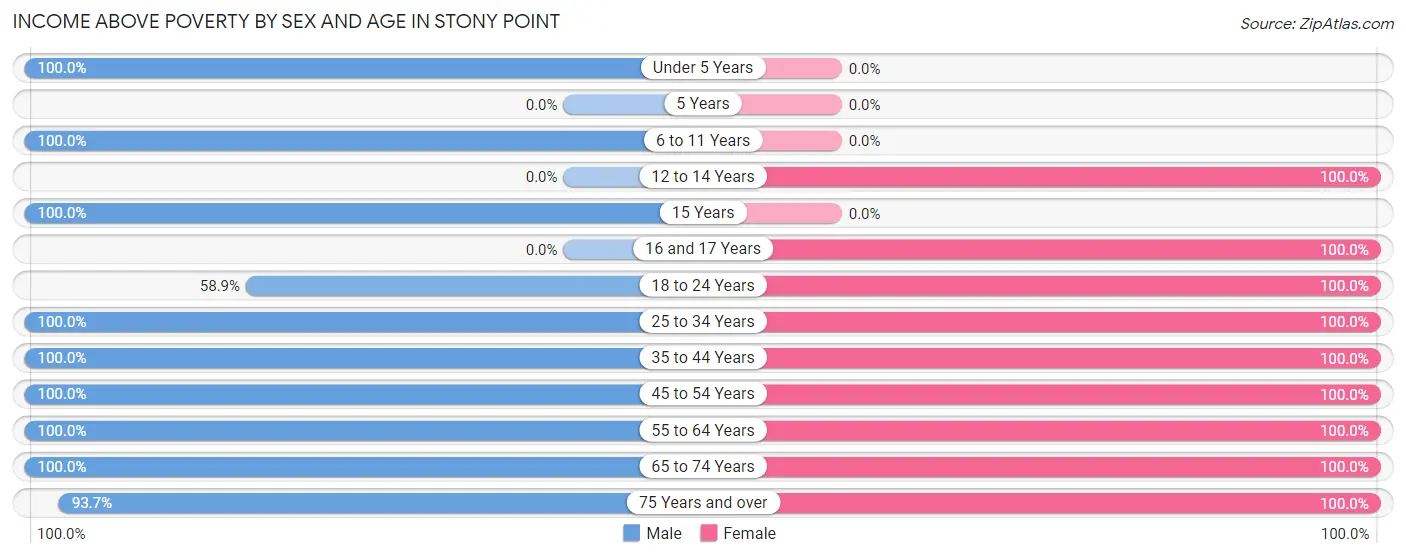
| Age Bracket | Male | Female |
| Under 5 Years | 107 (100.0%) | 0 (0.0%) |
| 5 Years | 0 (0.0%) | 0 (0.0%) |
| 6 to 11 Years | 18 (100.0%) | 0 (0.0%) |
| 12 to 14 Years | 0 (0.0%) | 89 (100.0%) |
| 15 Years | 50 (100.0%) | 0 (0.0%) |
| 16 and 17 Years | 0 (0.0%) | 24 (100.0%) |
| 18 to 24 Years | 33 (58.9%) | 49 (100.0%) |
| 25 to 34 Years | 13 (100.0%) | 119 (100.0%) |
| 35 to 44 Years | 226 (100.0%) | 13 (100.0%) |
| 45 to 54 Years | 30 (100.0%) | 45 (100.0%) |
| 55 to 64 Years | 109 (100.0%) | 77 (100.0%) |
| 65 to 74 Years | 33 (100.0%) | 43 (100.0%) |
| 75 Years and over | 177 (93.6%) | 204 (100.0%) |
| Total | 796 (95.8%) | 663 (100.0%) |
Income Below Poverty Among Married-Couple Families in Stony Point
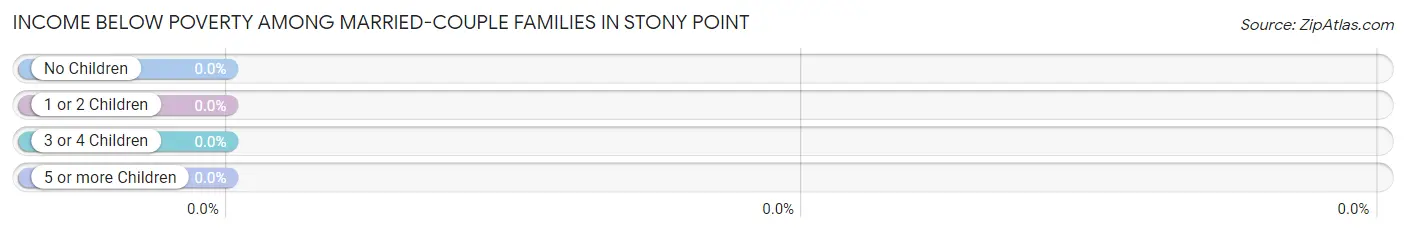
| Children | Above Poverty | Below Poverty |
| No Children | 218 (100.0%) | 0 (0.0%) |
| 1 or 2 Children | 194 (100.0%) | 0 (0.0%) |
| 3 or 4 Children | 0 (0.0%) | 0 (0.0%) |
| 5 or more Children | 0 (0.0%) | 0 (0.0%) |
| Total | 412 (100.0%) | 0 (0.0%) |
Income Below Poverty Among Single-Parent Households in Stony Point
| Children | Single Father | Single Mother |
| No Children | 0 (0.0%) | 0 (0.0%) |
| 1 or 2 Children | 0 (0.0%) | 0 (0.0%) |
| 3 or 4 Children | 0 (0.0%) | 0 (0.0%) |
| 5 or more Children | 0 (0.0%) | 0 (0.0%) |
| Total | 0 (0.0%) | 0 (0.0%) |
Income Below Poverty Among Married-Couple vs Single-Parent Households in Stony Point
| Children | Married-Couple Families | Single-Parent Households |
| No Children | 0 (0.0%) | 0 (0.0%) |
| 1 or 2 Children | 0 (0.0%) | 0 (0.0%) |
| 3 or 4 Children | 0 (0.0%) | 0 (0.0%) |
| 5 or more Children | 0 (0.0%) | 0 (0.0%) |
| Total | 0 (0.0%) | 0 (0.0%) |
Employment Characteristics in Stony Point
Employment by Class of Employer in Stony Point
Among the 768 employed individuals in Stony Point, private company employees (504 | 65.6%), self-employed (not incorporated) (101 | 13.2%), and state government employees (76 | 9.9%) make up the most common classes of employment.
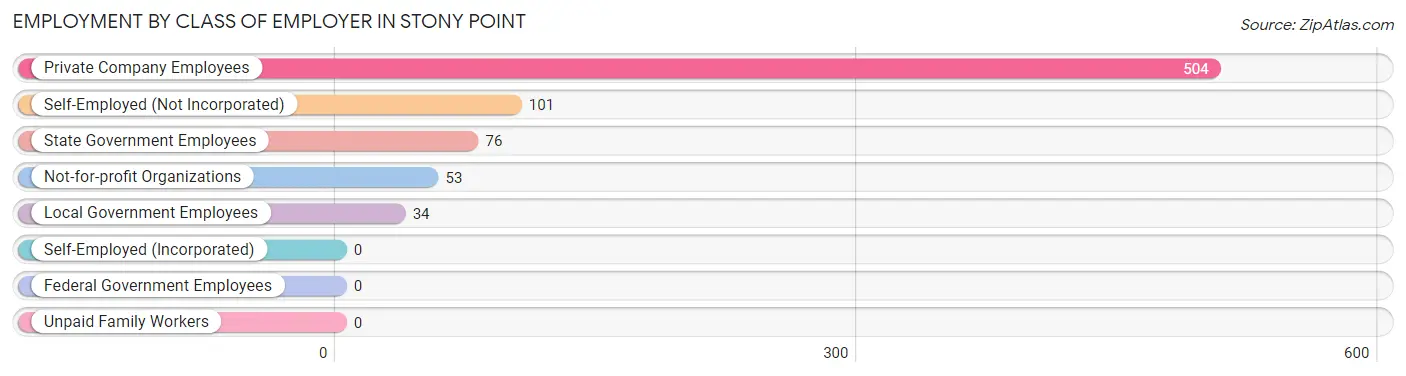
| Employer Class | # Employees | % Employees |
| Private Company Employees | 504 | 65.6% |
| Self-Employed (Incorporated) | 0 | 0.0% |
| Self-Employed (Not Incorporated) | 101 | 13.2% |
| Not-for-profit Organizations | 53 | 6.9% |
| Local Government Employees | 34 | 4.4% |
| State Government Employees | 76 | 9.9% |
| Federal Government Employees | 0 | 0.0% |
| Unpaid Family Workers | 0 | 0.0% |
| Total | 768 | 100.0% |
Employment Status by Age in Stony Point
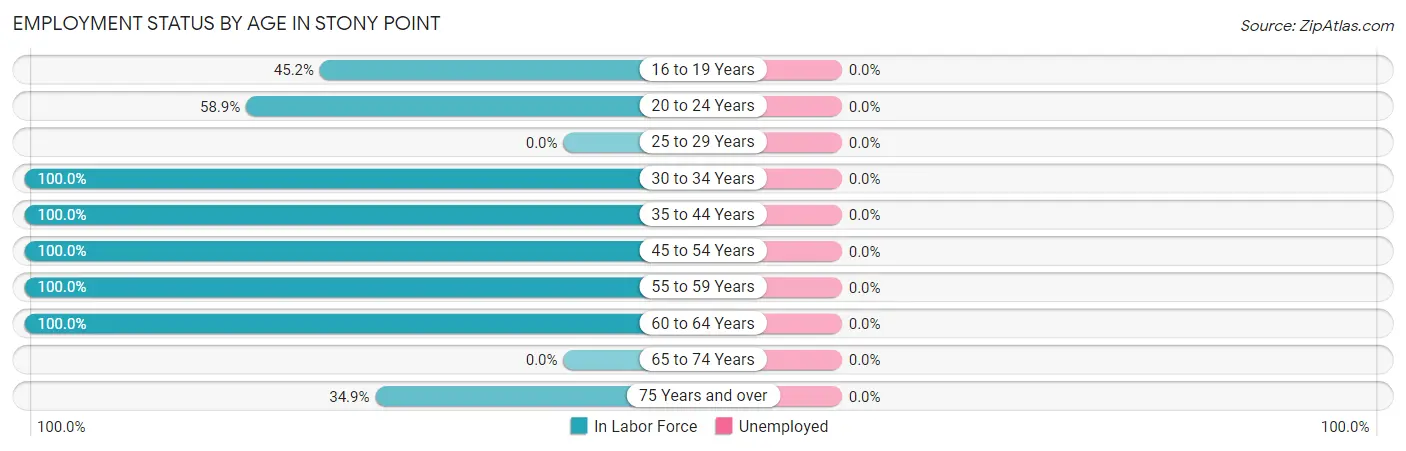
| Age Bracket | In Labor Force | Unemployed |
| 16 to 19 Years | 33 (45.2%) | 0 (0.0%) |
| 20 to 24 Years | 33 (58.9%) | 0 (0.0%) |
| 25 to 29 Years | 0 (0.0%) | 0 (0.0%) |
| 30 to 34 Years | 132 (100.0%) | 0 (0.0%) |
| 35 to 44 Years | 239 (100.0%) | 0 (0.0%) |
| 45 to 54 Years | 75 (100.0%) | 0 (0.0%) |
| 55 to 59 Years | 87 (100.0%) | 0 (0.0%) |
| 60 to 64 Years | 99 (100.0%) | 0 (0.0%) |
| 65 to 74 Years | 0 (0.0%) | 0 (0.0%) |
| 75 Years and over | 137 (34.9%) | 0 (0.0%) |
| Total | 835 (67.9%) | 0 (0.0%) |
Employment Status by Educational Attainment in Stony Point
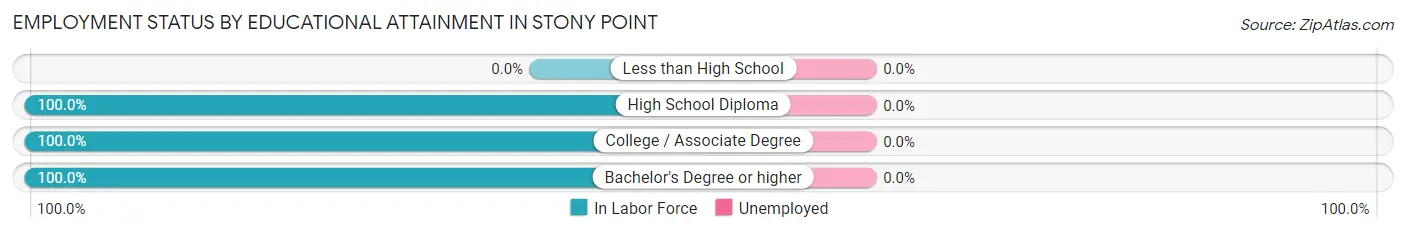
| Educational Attainment | In Labor Force | Unemployed |
| Less than High School | 0 (0.0%) | 0 (0.0%) |
| High School Diploma | 393 (100.0%) | 0 (0.0%) |
| College / Associate Degree | 64 (100.0%) | 0 (0.0%) |
| Bachelor's Degree or higher | 175 (100.0%) | 0 (0.0%) |
| Total | 632 (100.0%) | 0 (0.0%) |
Employment Occupations by Sex in Stony Point
Management, Business, Science and Arts Occupations
The most common Management, Business, Science and Arts occupations in Stony Point are Community & Social Service (79 | 9.5%), Education Instruction & Library (79 | 9.5%), and Management (8 | 1.0%).
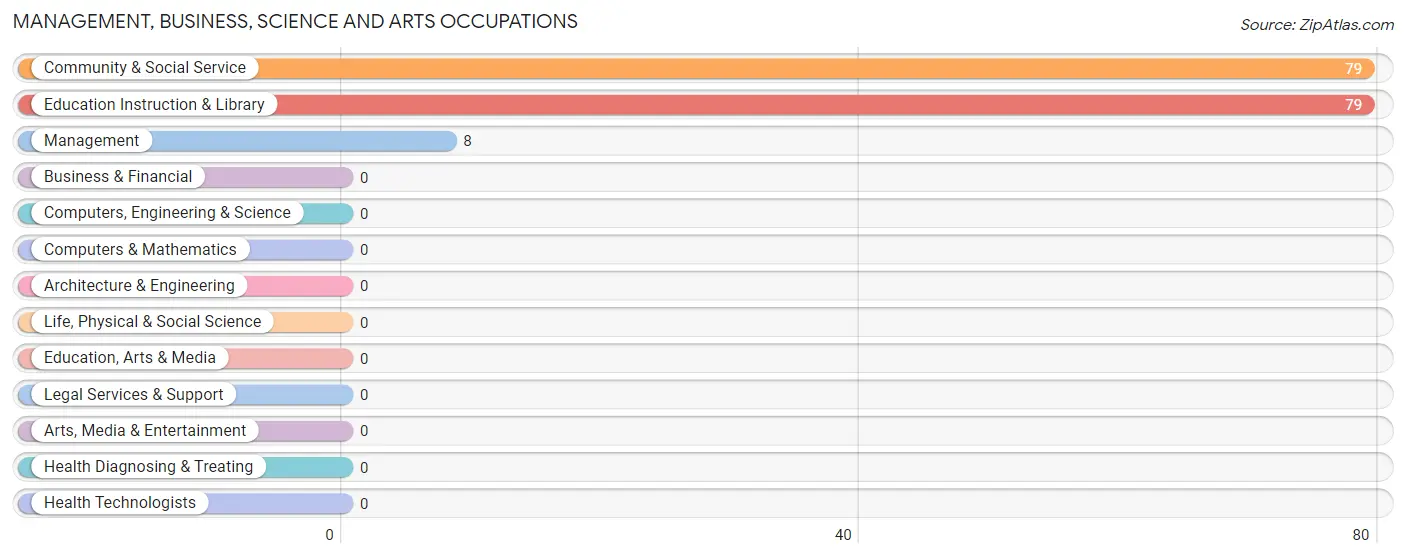
Management, Business, Science and Arts Occupations by Sex
Within the Management, Business, Science and Arts occupations in Stony Point, the most male-oriented occupations are Community & Social Service (26.6%), and Education Instruction & Library (26.6%), while the most female-oriented occupations are Management (100.0%), Community & Social Service (73.4%), and Education Instruction & Library (73.4%).
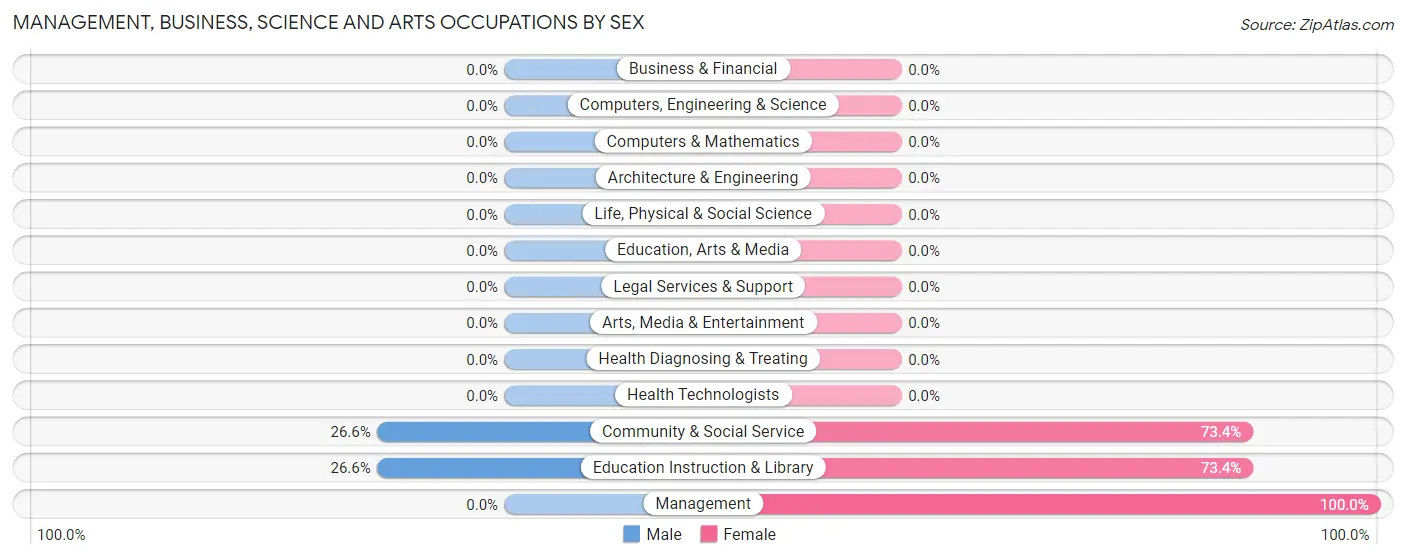
| Occupation | Male | Female |
| Management | 0 (0.0%) | 8 (100.0%) |
| Business & Financial | 0 (0.0%) | 0 (0.0%) |
| Computers, Engineering & Science | 0 (0.0%) | 0 (0.0%) |
| Computers & Mathematics | 0 (0.0%) | 0 (0.0%) |
| Architecture & Engineering | 0 (0.0%) | 0 (0.0%) |
| Life, Physical & Social Science | 0 (0.0%) | 0 (0.0%) |
| Community & Social Service | 21 (26.6%) | 58 (73.4%) |
| Education, Arts & Media | 0 (0.0%) | 0 (0.0%) |
| Legal Services & Support | 0 (0.0%) | 0 (0.0%) |
| Education Instruction & Library | 21 (26.6%) | 58 (73.4%) |
| Arts, Media & Entertainment | 0 (0.0%) | 0 (0.0%) |
| Health Diagnosing & Treating | 0 (0.0%) | 0 (0.0%) |
| Health Technologists | 0 (0.0%) | 0 (0.0%) |
| Total (Category) | 21 (24.1%) | 66 (75.9%) |
| Total (Overall) | 411 (49.2%) | 424 (50.8%) |
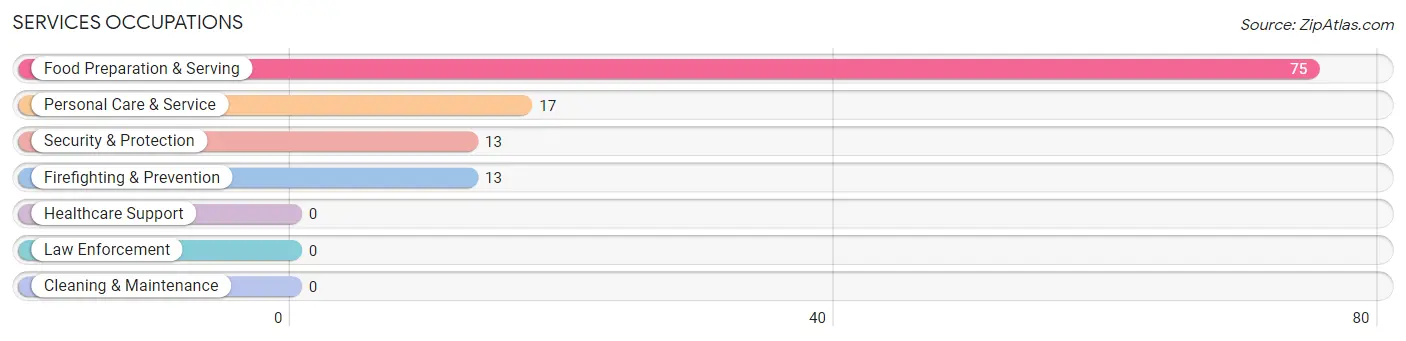
Services Occupations
The most common Services occupations in Stony Point are Food Preparation & Serving (75 | 9.0%), Personal Care & Service (17 | 2.0%), Security & Protection (13 | 1.6%), and Firefighting & Prevention (13 | 1.6%).
Services Occupations by Sex
Within the Services occupations in Stony Point, the most male-oriented occupations are Security & Protection (100.0%), Firefighting & Prevention (100.0%), and Food Preparation & Serving (84.0%), while the most female-oriented occupations are Personal Care & Service (100.0%), and Food Preparation & Serving (16.0%).
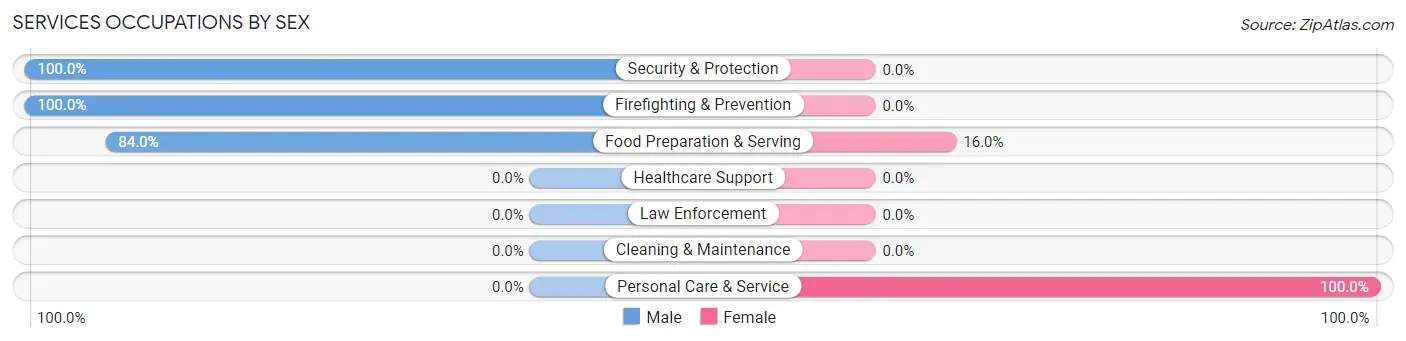
| Occupation | Male | Female |
| Healthcare Support | 0 (0.0%) | 0 (0.0%) |
| Security & Protection | 13 (100.0%) | 0 (0.0%) |
| Firefighting & Prevention | 13 (100.0%) | 0 (0.0%) |
| Law Enforcement | 0 (0.0%) | 0 (0.0%) |
| Food Preparation & Serving | 63 (84.0%) | 12 (16.0%) |
| Cleaning & Maintenance | 0 (0.0%) | 0 (0.0%) |
| Personal Care & Service | 0 (0.0%) | 17 (100.0%) |
| Total (Category) | 76 (72.4%) | 29 (27.6%) |
| Total (Overall) | 411 (49.2%) | 424 (50.8%) |
Sales and Office Occupations
The most common Sales and Office occupations in Stony Point are Office & Administration (159 | 19.0%), and Sales & Related (50 | 6.0%).
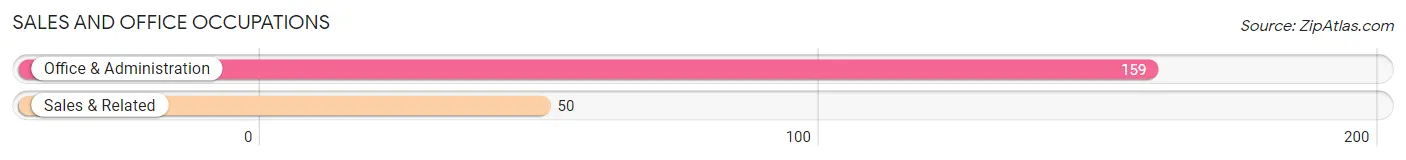
Sales and Office Occupations by Sex
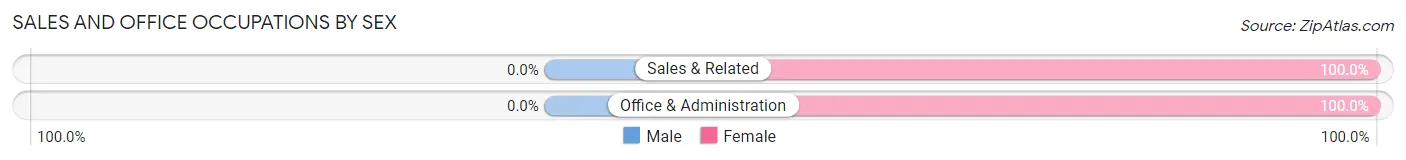
| Occupation | Male | Female |
| Sales & Related | 0 (0.0%) | 50 (100.0%) |
| Office & Administration | 0 (0.0%) | 159 (100.0%) |
| Total (Category) | 0 (0.0%) | 209 (100.0%) |
| Total (Overall) | 411 (49.2%) | 424 (50.8%) |
Natural Resources, Construction and Maintenance Occupations
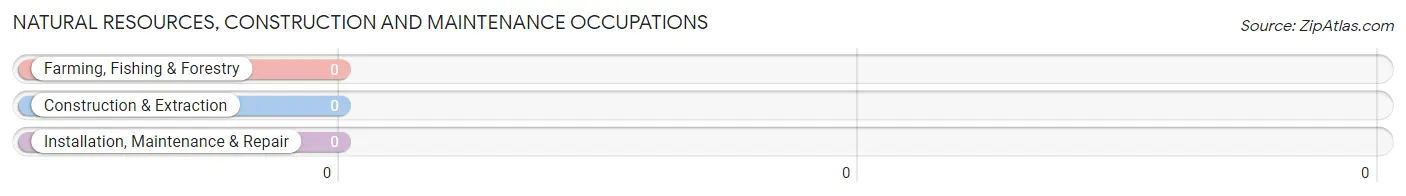
Natural Resources, Construction and Maintenance Occupations by Sex
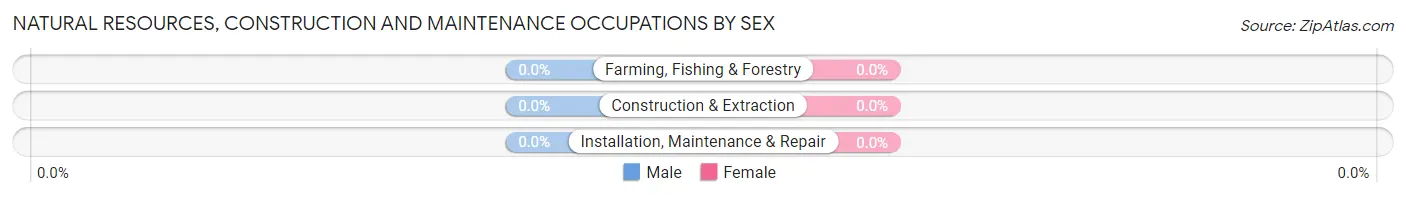
| Occupation | Male | Female |
| Farming, Fishing & Forestry | 0 (0.0%) | 0 (0.0%) |
| Construction & Extraction | 0 (0.0%) | 0 (0.0%) |
| Installation, Maintenance & Repair | 0 (0.0%) | 0 (0.0%) |
| Total (Category) | 0 (0.0%) | 0 (0.0%) |
| Total (Overall) | 411 (49.2%) | 424 (50.8%) |
Production, Transportation and Moving Occupations
The most common Production, Transportation and Moving occupations in Stony Point are Production (333 | 39.9%), and Transportation (101 | 12.1%).
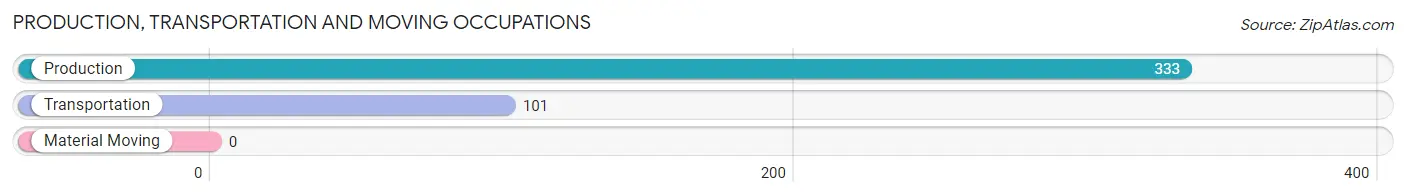
Production, Transportation and Moving Occupations by Sex
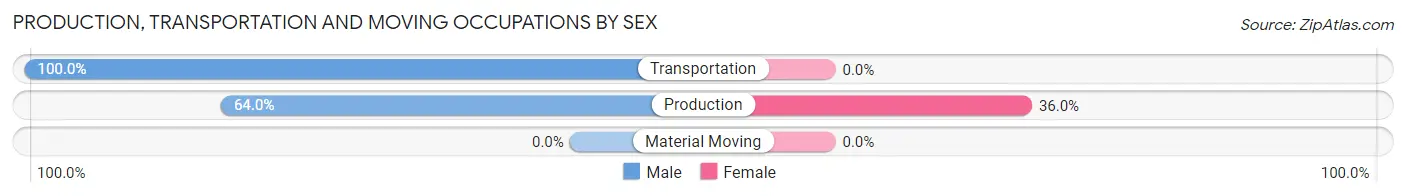
| Occupation | Male | Female |
| Production | 213 (64.0%) | 120 (36.0%) |
| Transportation | 101 (100.0%) | 0 (0.0%) |
| Material Moving | 0 (0.0%) | 0 (0.0%) |
| Total (Category) | 314 (72.4%) | 120 (27.7%) |
| Total (Overall) | 411 (49.2%) | 424 (50.8%) |
Employment Industries by Sex in Stony Point
Employment Industries in Stony Point
The major employment industries in Stony Point include Manufacturing (333 | 39.9%), Transportation & Warehousing (101 | 12.1%), Accommodation & Food Services (91 | 10.9%), Administrative & Support (80 | 9.6%), and Educational Services (79 | 9.5%).
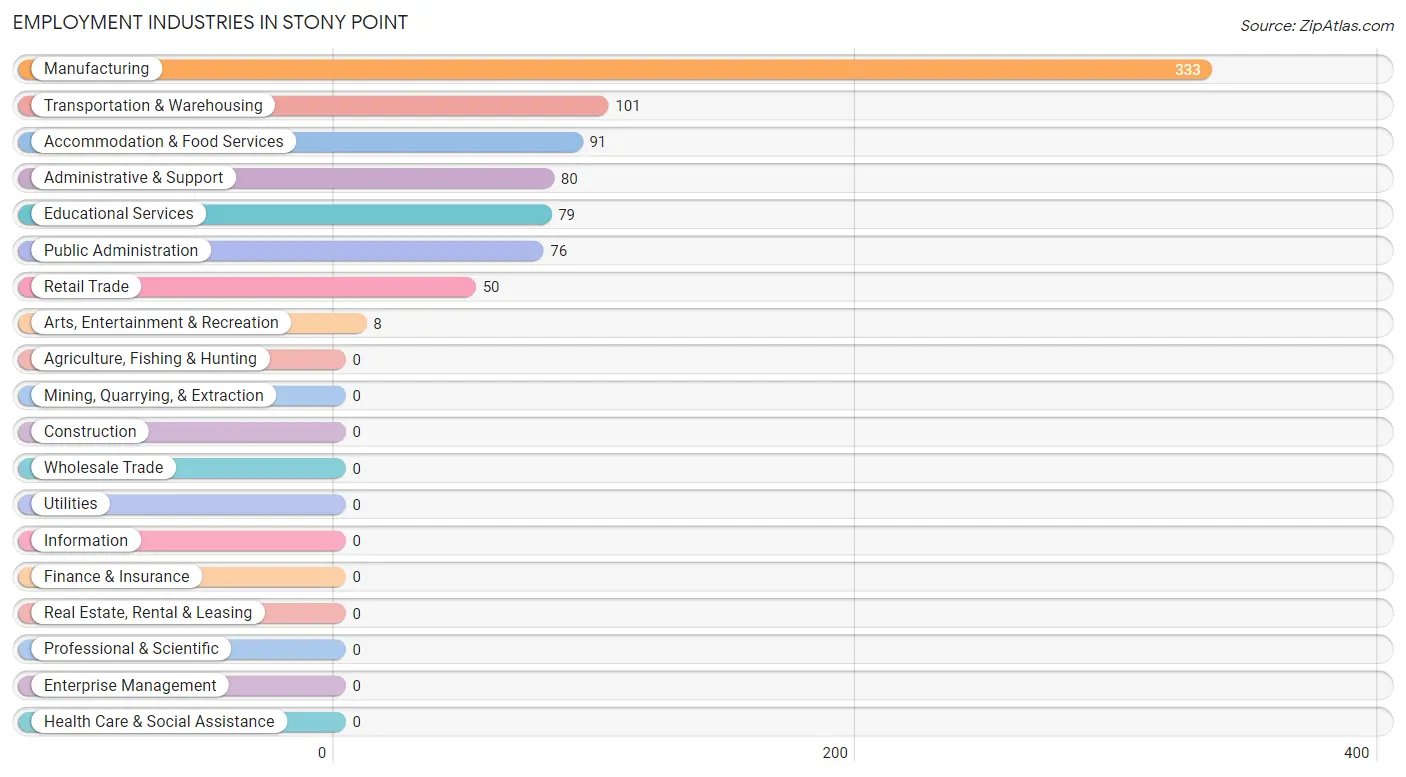
Employment Industries by Sex in Stony Point
The Stony Point industries that see more men than women are Transportation & Warehousing (100.0%), Accommodation & Food Services (69.2%), and Manufacturing (64.0%), whereas the industries that tend to have a higher number of women are Retail Trade (100.0%), Arts, Entertainment & Recreation (100.0%), and Public Administration (100.0%).
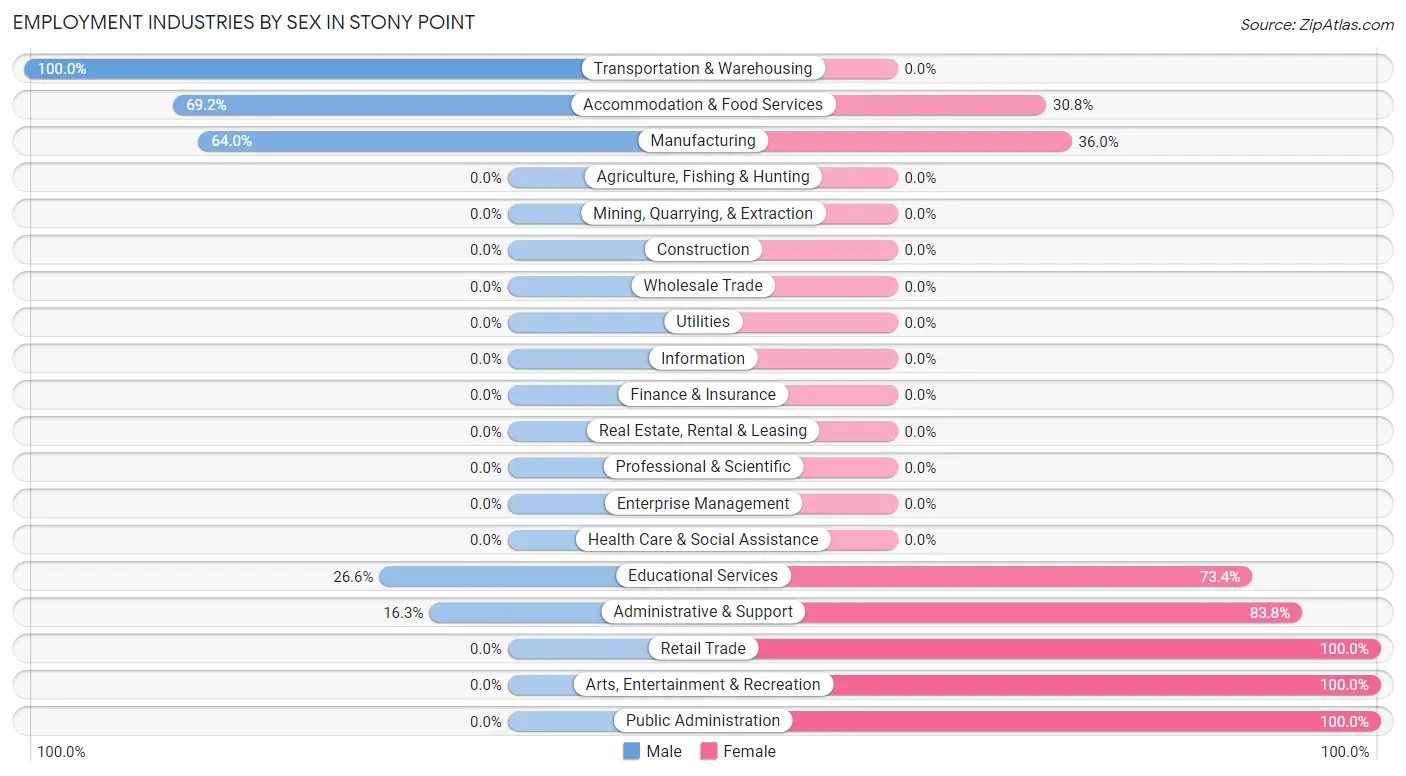
| Industry | Male | Female |
| Agriculture, Fishing & Hunting | 0 (0.0%) | 0 (0.0%) |
| Mining, Quarrying, & Extraction | 0 (0.0%) | 0 (0.0%) |
| Construction | 0 (0.0%) | 0 (0.0%) |
| Manufacturing | 213 (64.0%) | 120 (36.0%) |
| Wholesale Trade | 0 (0.0%) | 0 (0.0%) |
| Retail Trade | 0 (0.0%) | 50 (100.0%) |
| Transportation & Warehousing | 101 (100.0%) | 0 (0.0%) |
| Utilities | 0 (0.0%) | 0 (0.0%) |
| Information | 0 (0.0%) | 0 (0.0%) |
| Finance & Insurance | 0 (0.0%) | 0 (0.0%) |
| Real Estate, Rental & Leasing | 0 (0.0%) | 0 (0.0%) |
| Professional & Scientific | 0 (0.0%) | 0 (0.0%) |
| Enterprise Management | 0 (0.0%) | 0 (0.0%) |
| Administrative & Support | 13 (16.3%) | 67 (83.8%) |
| Educational Services | 21 (26.6%) | 58 (73.4%) |
| Health Care & Social Assistance | 0 (0.0%) | 0 (0.0%) |
| Arts, Entertainment & Recreation | 0 (0.0%) | 8 (100.0%) |
| Accommodation & Food Services | 63 (69.2%) | 28 (30.8%) |
| Public Administration | 0 (0.0%) | 76 (100.0%) |
| Total | 411 (49.2%) | 424 (50.8%) |
Education in Stony Point
School Enrollment in Stony Point
The most common levels of schooling among the 260 students in Stony Point are middle school (89 | 34.2%), college / undergraduate (79 | 30.4%), and high school (74 | 28.5%).
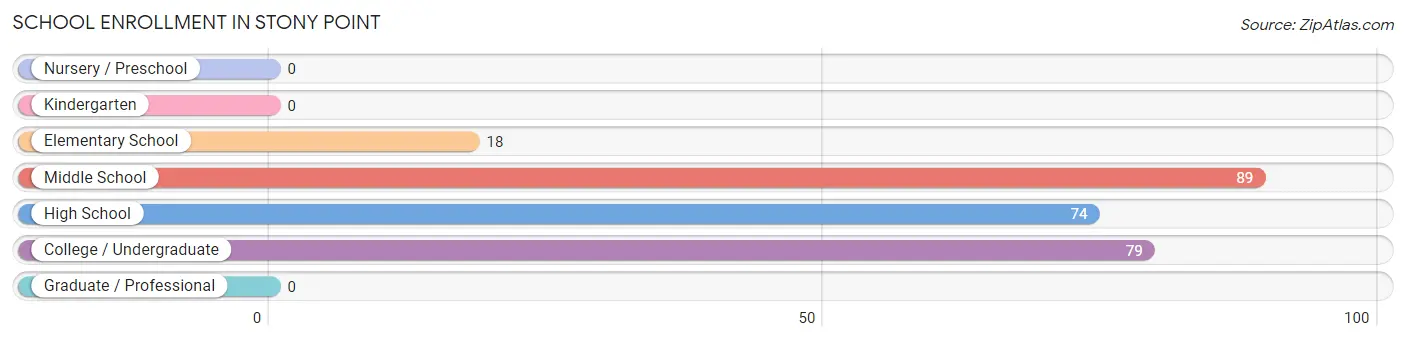
| School Level | # Students | % Students |
| Nursery / Preschool | 0 | 0.0% |
| Kindergarten | 0 | 0.0% |
| Elementary School | 18 | 6.9% |
| Middle School | 89 | 34.2% |
| High School | 74 | 28.5% |
| College / Undergraduate | 79 | 30.4% |
| Graduate / Professional | 0 | 0.0% |
| Total | 260 | 100.0% |
School Enrollment by Age by Funding Source in Stony Point
Out of a total of 260 students who are enrolled in schools in Stony Point, 53 (20.4%) attend a private institution, while the remaining 207 (79.6%) are enrolled in public schools. The age group of 15 to 17 year olds has the highest likelihood of being enrolled in private schools, with 30 (40.5% in the age bracket) enrolled. Conversely, the age group of 5 to 9 year old has the lowest likelihood of being enrolled in a private school, with 18 (100.0% in the age bracket) attending a public institution.
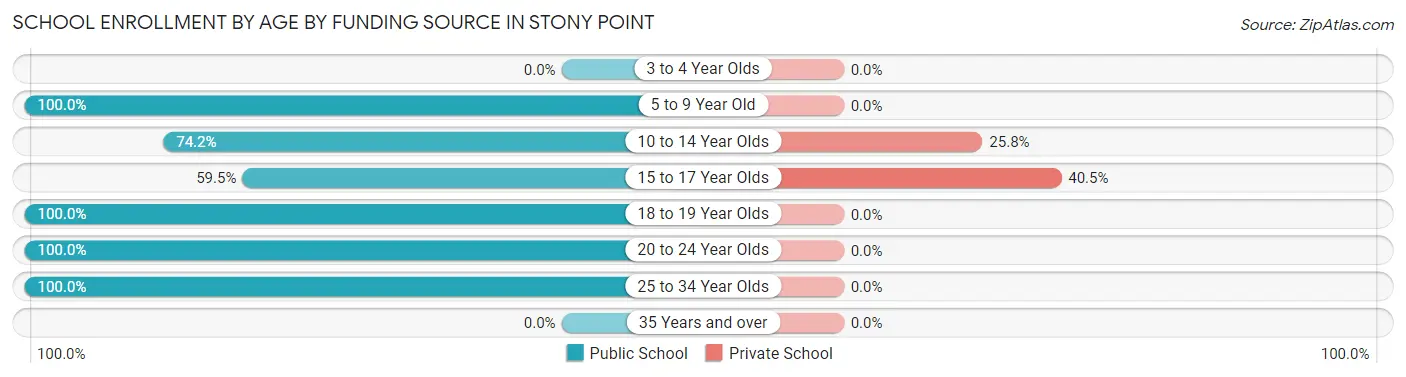
| Age Bracket | Public School | Private School |
| 3 to 4 Year Olds | 0 (0.0%) | 0 (0.0%) |
| 5 to 9 Year Old | 18 (100.0%) | 0 (0.0%) |
| 10 to 14 Year Olds | 66 (74.2%) | 23 (25.8%) |
| 15 to 17 Year Olds | 44 (59.5%) | 30 (40.5%) |
| 18 to 19 Year Olds | 33 (100.0%) | 0 (0.0%) |
| 20 to 24 Year Olds | 33 (100.0%) | 0 (0.0%) |
| 25 to 34 Year Olds | 13 (100.0%) | 0 (0.0%) |
| 35 Years and over | 0 (0.0%) | 0 (0.0%) |
| Total | 207 (79.6%) | 53 (20.4%) |
Educational Attainment by Field of Study in Stony Point
Education (106 | 57.9%), business (43 | 23.5%), and communications (34 | 18.6%) are the most common fields of study among 183 individuals in Stony Point who have obtained a bachelor's degree or higher.
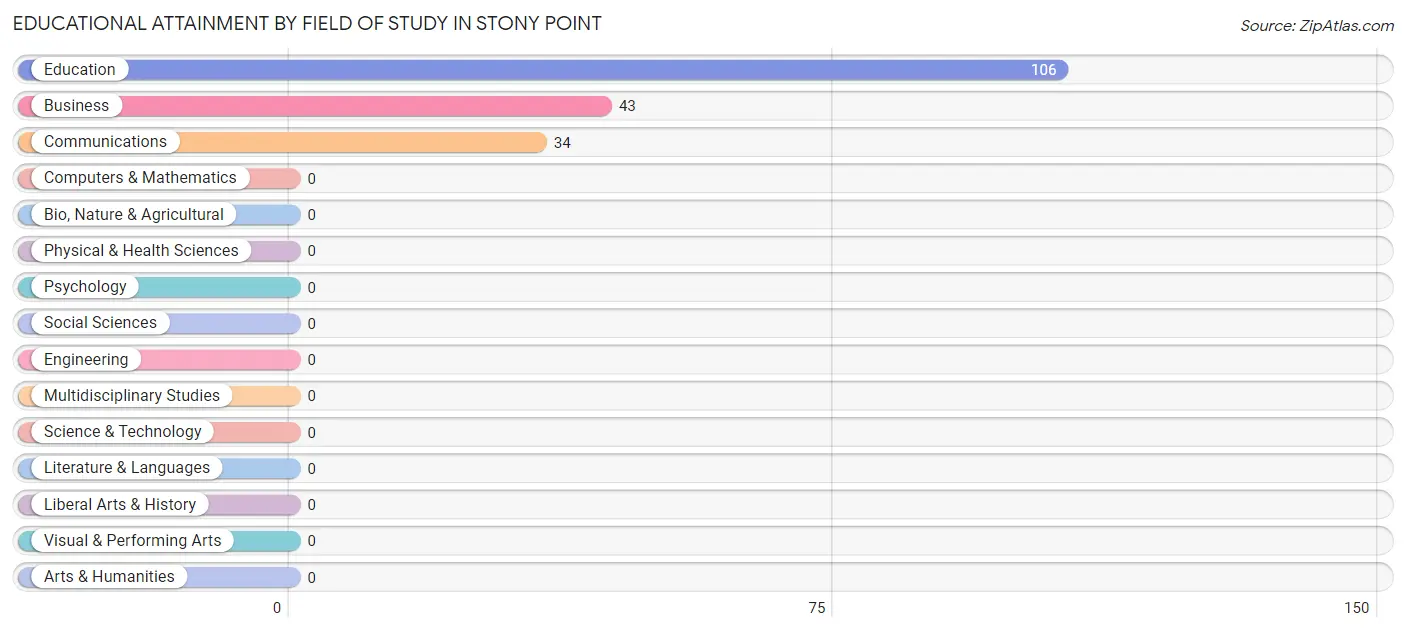
| Field of Study | # Graduates | % Graduates |
| Computers & Mathematics | 0 | 0.0% |
| Bio, Nature & Agricultural | 0 | 0.0% |
| Physical & Health Sciences | 0 | 0.0% |
| Psychology | 0 | 0.0% |
| Social Sciences | 0 | 0.0% |
| Engineering | 0 | 0.0% |
| Multidisciplinary Studies | 0 | 0.0% |
| Science & Technology | 0 | 0.0% |
| Business | 43 | 23.5% |
| Education | 106 | 57.9% |
| Literature & Languages | 0 | 0.0% |
| Liberal Arts & History | 0 | 0.0% |
| Visual & Performing Arts | 0 | 0.0% |
| Communications | 34 | 18.6% |
| Arts & Humanities | 0 | 0.0% |
| Total | 183 | 100.0% |
Transportation & Commute in Stony Point
Vehicle Availability by Sex in Stony Point
The most prevalent vehicle ownership categories in Stony Point are males with 2 vehicles (272, accounting for 66.2%) and females with 2 vehicles (196, making up 76.2%).
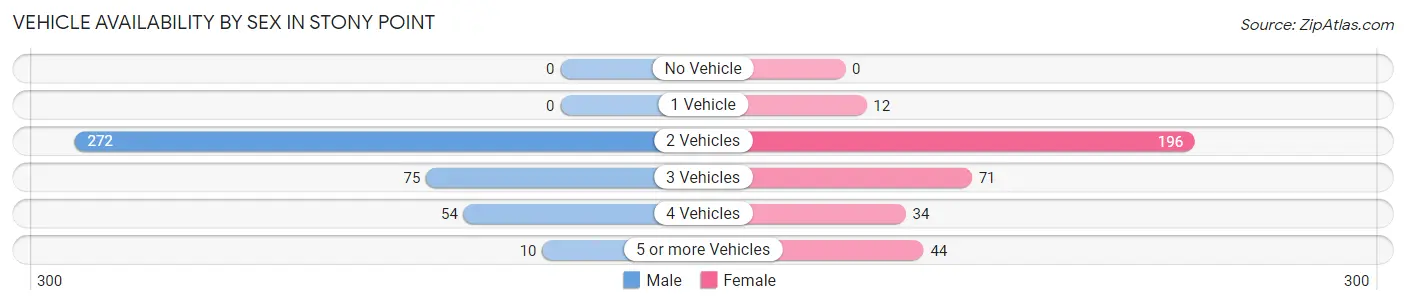
| Vehicles Available | Male | Female |
| No Vehicle | 0 (0.0%) | 0 (0.0%) |
| 1 Vehicle | 0 (0.0%) | 12 (3.4%) |
| 2 Vehicles | 272 (66.2%) | 196 (54.9%) |
| 3 Vehicles | 75 (18.2%) | 71 (19.9%) |
| 4 Vehicles | 54 (13.1%) | 34 (9.5%) |
| 5 or more Vehicles | 10 (2.4%) | 44 (12.3%) |
| Total | 411 (100.0%) | 357 (100.0%) |
Commute Time in Stony Point
The most frequently occuring commute durations in Stony Point are 20 to 24 minutes (232 commuters, 30.2%), 45 to 59 minutes (193 commuters, 25.1%), and 10 to 14 minutes (147 commuters, 19.1%).
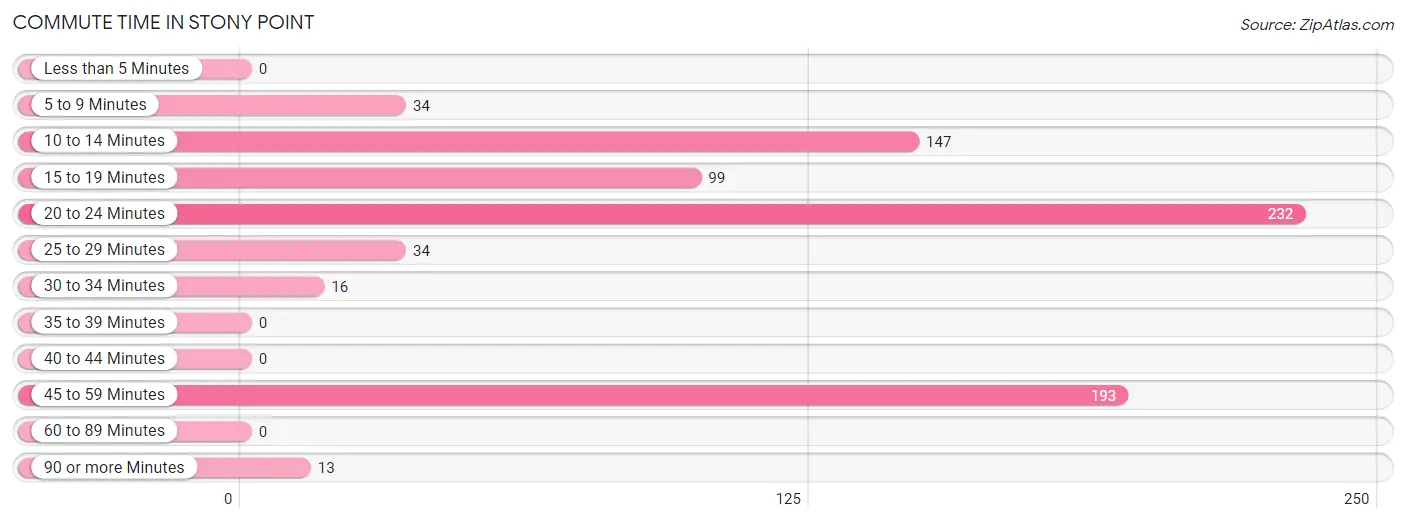
| Commute Time | # Commuters | % Commuters |
| Less than 5 Minutes | 0 | 0.0% |
| 5 to 9 Minutes | 34 | 4.4% |
| 10 to 14 Minutes | 147 | 19.1% |
| 15 to 19 Minutes | 99 | 12.9% |
| 20 to 24 Minutes | 232 | 30.2% |
| 25 to 29 Minutes | 34 | 4.4% |
| 30 to 34 Minutes | 16 | 2.1% |
| 35 to 39 Minutes | 0 | 0.0% |
| 40 to 44 Minutes | 0 | 0.0% |
| 45 to 59 Minutes | 193 | 25.1% |
| 60 to 89 Minutes | 0 | 0.0% |
| 90 or more Minutes | 13 | 1.7% |
Commute Time by Sex in Stony Point
The most common commute times in Stony Point are 20 to 24 minutes (144 commuters, 35.0%) for males and 45 to 59 minutes (94 commuters, 26.3%) for females.
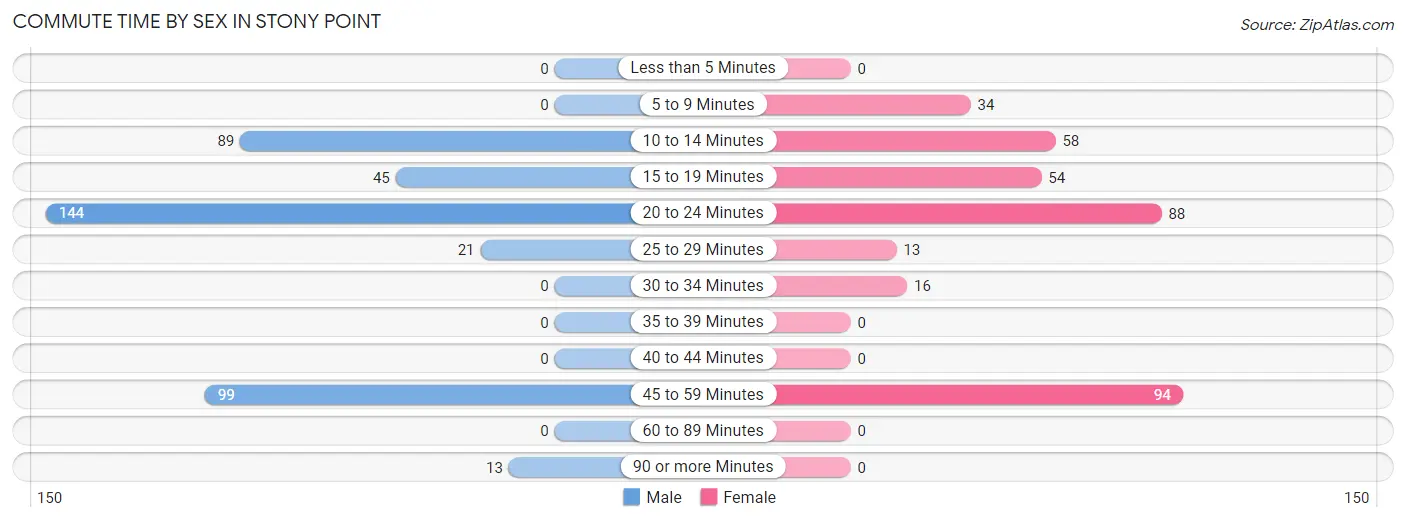
| Commute Time | Male | Female |
| Less than 5 Minutes | 0 (0.0%) | 0 (0.0%) |
| 5 to 9 Minutes | 0 (0.0%) | 34 (9.5%) |
| 10 to 14 Minutes | 89 (21.6%) | 58 (16.3%) |
| 15 to 19 Minutes | 45 (11.0%) | 54 (15.1%) |
| 20 to 24 Minutes | 144 (35.0%) | 88 (24.6%) |
| 25 to 29 Minutes | 21 (5.1%) | 13 (3.6%) |
| 30 to 34 Minutes | 0 (0.0%) | 16 (4.5%) |
| 35 to 39 Minutes | 0 (0.0%) | 0 (0.0%) |
| 40 to 44 Minutes | 0 (0.0%) | 0 (0.0%) |
| 45 to 59 Minutes | 99 (24.1%) | 94 (26.3%) |
| 60 to 89 Minutes | 0 (0.0%) | 0 (0.0%) |
| 90 or more Minutes | 13 (3.2%) | 0 (0.0%) |
Time of Departure to Work by Sex in Stony Point
The most frequent times of departure to work in Stony Point are 5:00 AM to 5:29 AM (114, 27.7%) for males and 5:00 AM to 5:29 AM (94, 26.3%) for females.
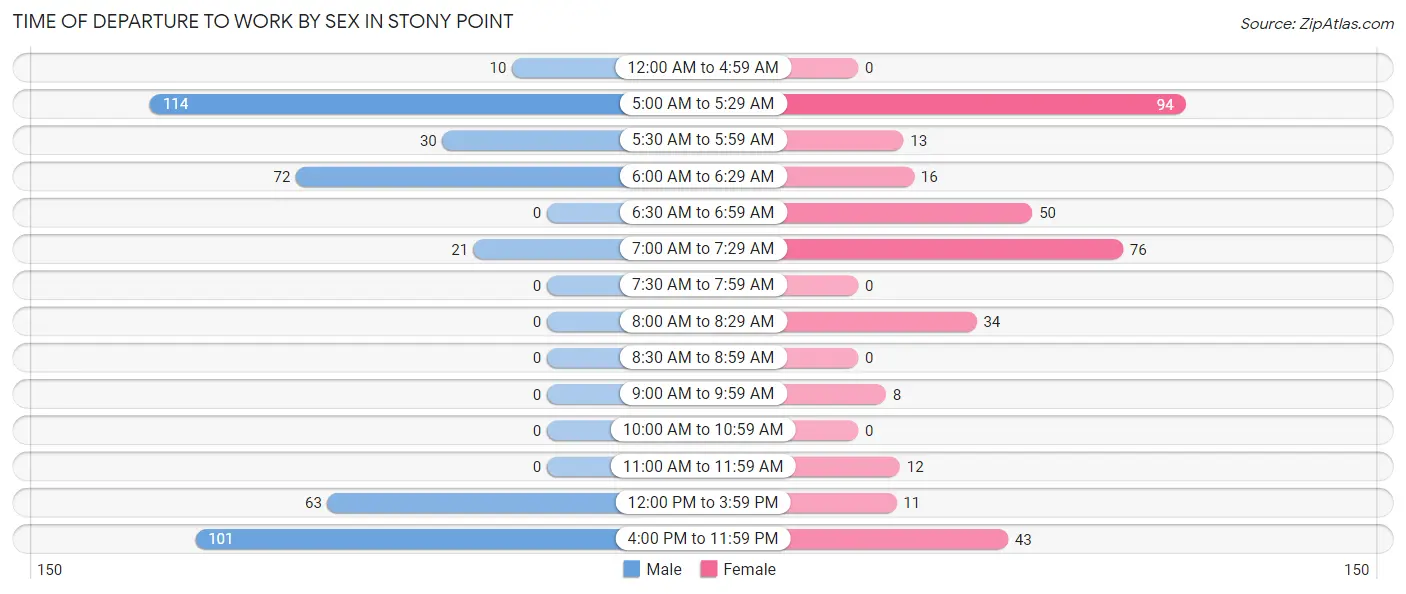
| Time of Departure | Male | Female |
| 12:00 AM to 4:59 AM | 10 (2.4%) | 0 (0.0%) |
| 5:00 AM to 5:29 AM | 114 (27.7%) | 94 (26.3%) |
| 5:30 AM to 5:59 AM | 30 (7.3%) | 13 (3.6%) |
| 6:00 AM to 6:29 AM | 72 (17.5%) | 16 (4.5%) |
| 6:30 AM to 6:59 AM | 0 (0.0%) | 50 (14.0%) |
| 7:00 AM to 7:29 AM | 21 (5.1%) | 76 (21.3%) |
| 7:30 AM to 7:59 AM | 0 (0.0%) | 0 (0.0%) |
| 8:00 AM to 8:29 AM | 0 (0.0%) | 34 (9.5%) |
| 8:30 AM to 8:59 AM | 0 (0.0%) | 0 (0.0%) |
| 9:00 AM to 9:59 AM | 0 (0.0%) | 8 (2.2%) |
| 10:00 AM to 10:59 AM | 0 (0.0%) | 0 (0.0%) |
| 11:00 AM to 11:59 AM | 0 (0.0%) | 12 (3.4%) |
| 12:00 PM to 3:59 PM | 63 (15.3%) | 11 (3.1%) |
| 4:00 PM to 11:59 PM | 101 (24.6%) | 43 (12.0%) |
| Total | 411 (100.0%) | 357 (100.0%) |
Housing Occupancy in Stony Point
Occupancy by Ownership in Stony Point
Of the total 608 dwellings in Stony Point, owner-occupied units account for 595 (97.9%), while renter-occupied units make up 13 (2.1%).
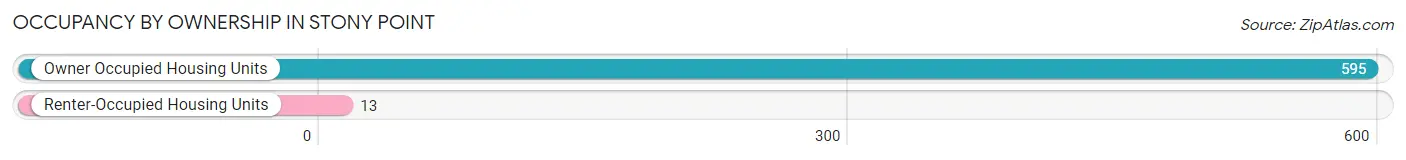
| Occupancy | # Housing Units | % Housing Units |
| Owner Occupied Housing Units | 595 | 97.9% |
| Renter-Occupied Housing Units | 13 | 2.1% |
| Total Occupied Housing Units | 608 | 100.0% |
Occupancy by Household Size in Stony Point
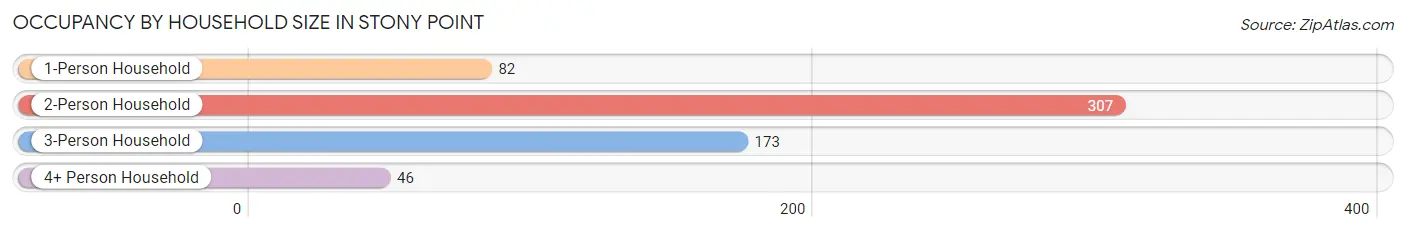
| Household Size | # Housing Units | % Housing Units |
| 1-Person Household | 82 | 13.5% |
| 2-Person Household | 307 | 50.5% |
| 3-Person Household | 173 | 28.4% |
| 4+ Person Household | 46 | 7.6% |
| Total Housing Units | 608 | 100.0% |
Occupancy by Ownership by Household Size in Stony Point
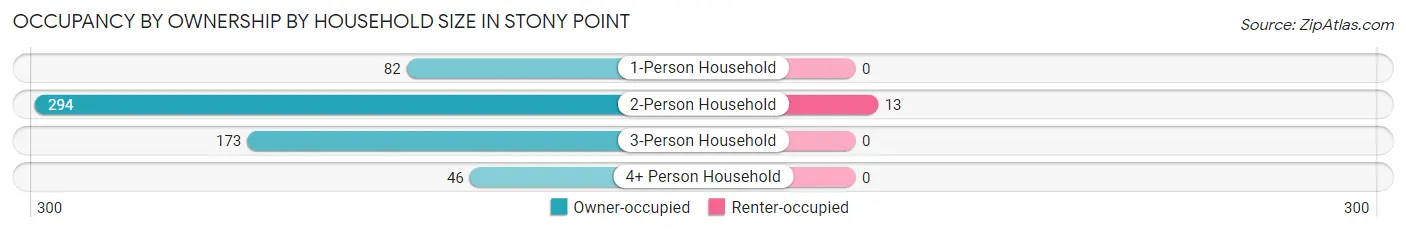
| Household Size | Owner-occupied | Renter-occupied |
| 1-Person Household | 82 (100.0%) | 0 (0.0%) |
| 2-Person Household | 294 (95.8%) | 13 (4.2%) |
| 3-Person Household | 173 (100.0%) | 0 (0.0%) |
| 4+ Person Household | 46 (100.0%) | 0 (0.0%) |
| Total Housing Units | 595 (97.9%) | 13 (2.1%) |
Occupancy by Educational Attainment in Stony Point
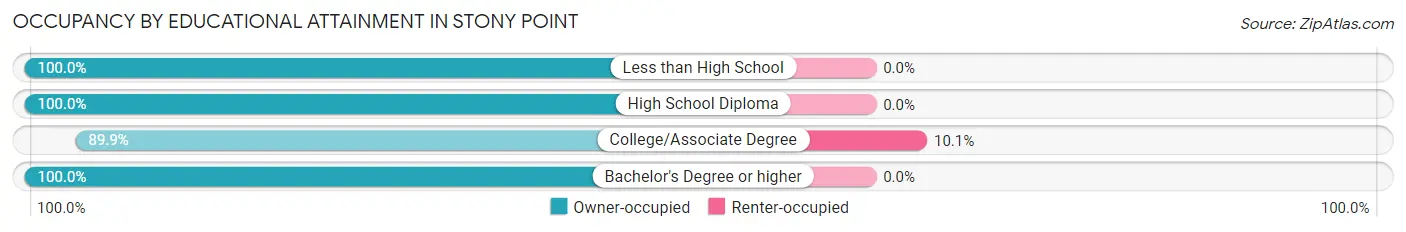
| Household Size | Owner-occupied | Renter-occupied |
| Less than High School | 19 (100.0%) | 0 (0.0%) |
| High School Diploma | 431 (100.0%) | 0 (0.0%) |
| College/Associate Degree | 116 (89.9%) | 13 (10.1%) |
| Bachelor's Degree or higher | 29 (100.0%) | 0 (0.0%) |
Occupancy by Age of Householder in Stony Point
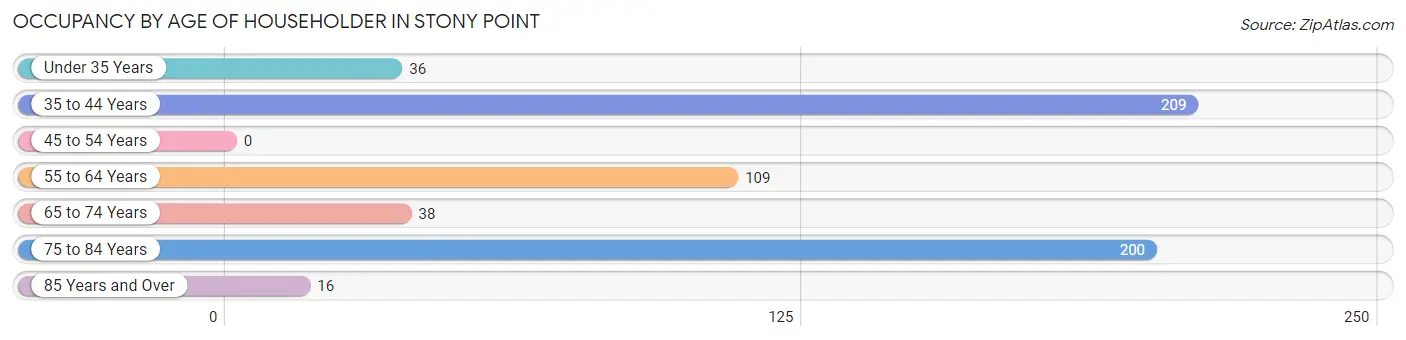
| Age Bracket | # Households | % Households |
| Under 35 Years | 36 | 5.9% |
| 35 to 44 Years | 209 | 34.4% |
| 45 to 54 Years | 0 | 0.0% |
| 55 to 64 Years | 109 | 17.9% |
| 65 to 74 Years | 38 | 6.2% |
| 75 to 84 Years | 200 | 32.9% |
| 85 Years and Over | 16 | 2.6% |
| Total | 608 | 100.0% |
Housing Finances in Stony Point
Median Income by Occupancy in Stony Point
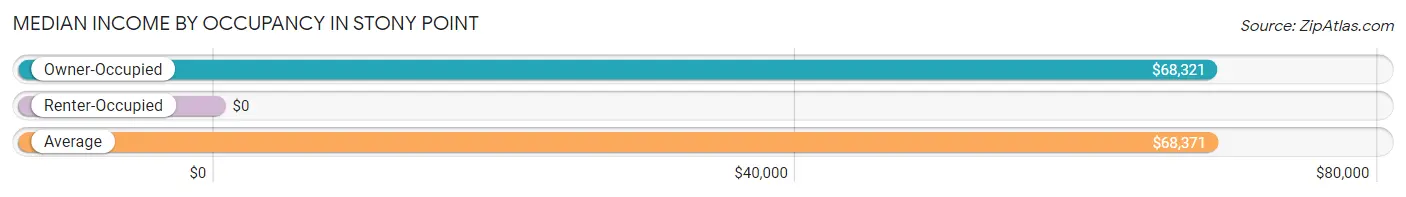
| Occupancy Type | # Households | Median Income |
| Owner-Occupied | 595 (97.9%) | $68,321 |
| Renter-Occupied | 13 (2.1%) | $0 |
| Average | 608 (100.0%) | $68,371 |
Occupancy by Householder Income Bracket in Stony Point
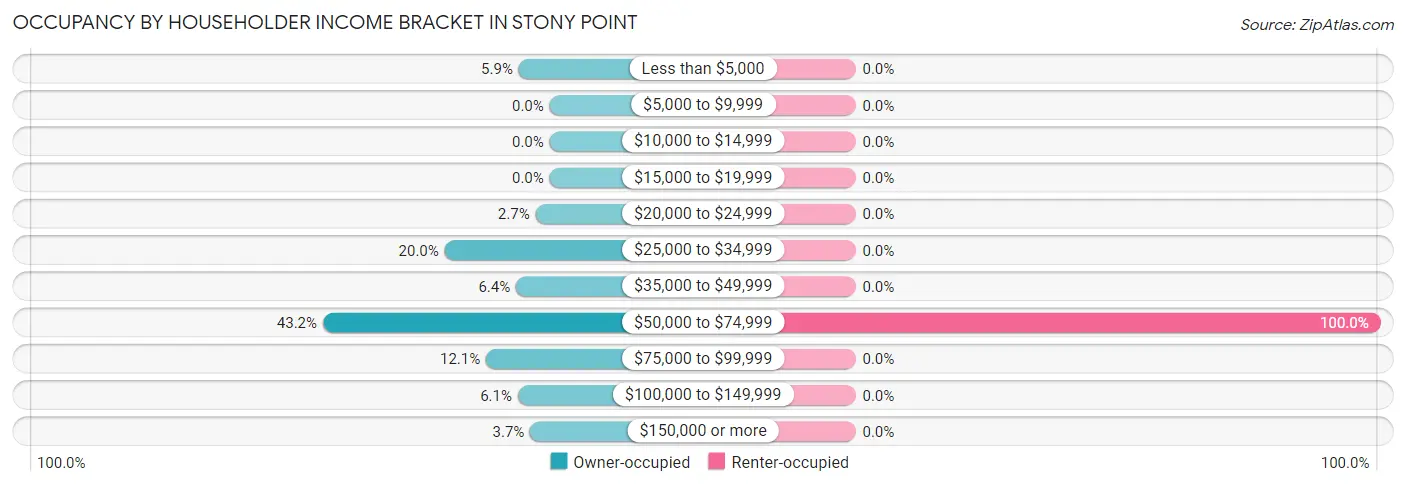
| Income Bracket | Owner-occupied | Renter-occupied |
| Less than $5,000 | 35 (5.9%) | 0 (0.0%) |
| $5,000 to $9,999 | 0 (0.0%) | 0 (0.0%) |
| $10,000 to $14,999 | 0 (0.0%) | 0 (0.0%) |
| $15,000 to $19,999 | 0 (0.0%) | 0 (0.0%) |
| $20,000 to $24,999 | 16 (2.7%) | 0 (0.0%) |
| $25,000 to $34,999 | 119 (20.0%) | 0 (0.0%) |
| $35,000 to $49,999 | 38 (6.4%) | 0 (0.0%) |
| $50,000 to $74,999 | 257 (43.2%) | 13 (100.0%) |
| $75,000 to $99,999 | 72 (12.1%) | 0 (0.0%) |
| $100,000 to $149,999 | 36 (6.0%) | 0 (0.0%) |
| $150,000 or more | 22 (3.7%) | 0 (0.0%) |
| Total | 595 (100.0%) | 13 (100.0%) |
Monthly Housing Cost Tiers in Stony Point
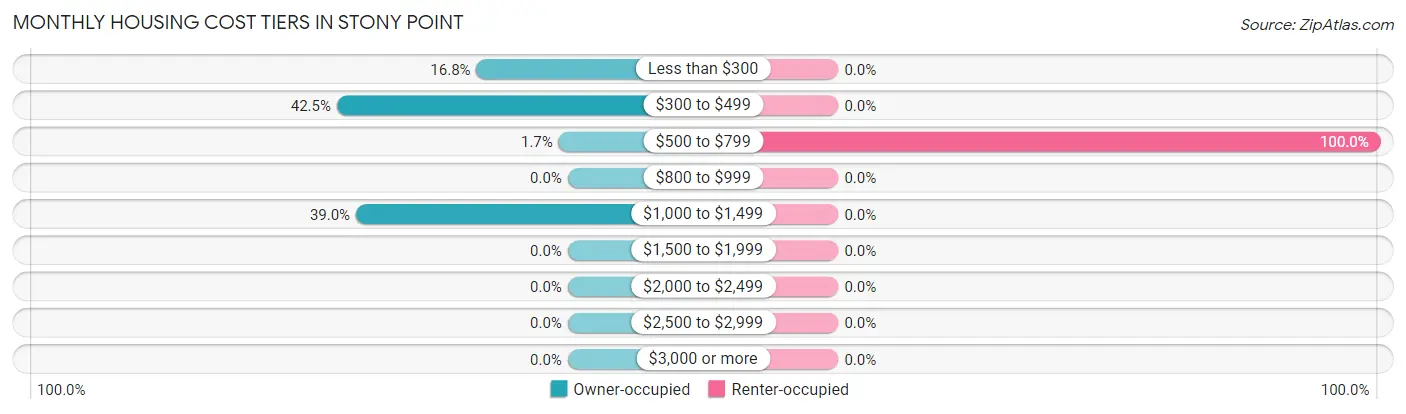
| Monthly Cost | Owner-occupied | Renter-occupied |
| Less than $300 | 100 (16.8%) | 0 (0.0%) |
| $300 to $499 | 253 (42.5%) | 0 (0.0%) |
| $500 to $799 | 10 (1.7%) | 13 (100.0%) |
| $800 to $999 | 0 (0.0%) | 0 (0.0%) |
| $1,000 to $1,499 | 232 (39.0%) | 0 (0.0%) |
| $1,500 to $1,999 | 0 (0.0%) | 0 (0.0%) |
| $2,000 to $2,499 | 0 (0.0%) | 0 (0.0%) |
| $2,500 to $2,999 | 0 (0.0%) | 0 (0.0%) |
| $3,000 or more | 0 (0.0%) | 0 (0.0%) |
| Total | 595 (100.0%) | 13 (100.0%) |
Physical Housing Characteristics in Stony Point
Housing Structures in Stony Point
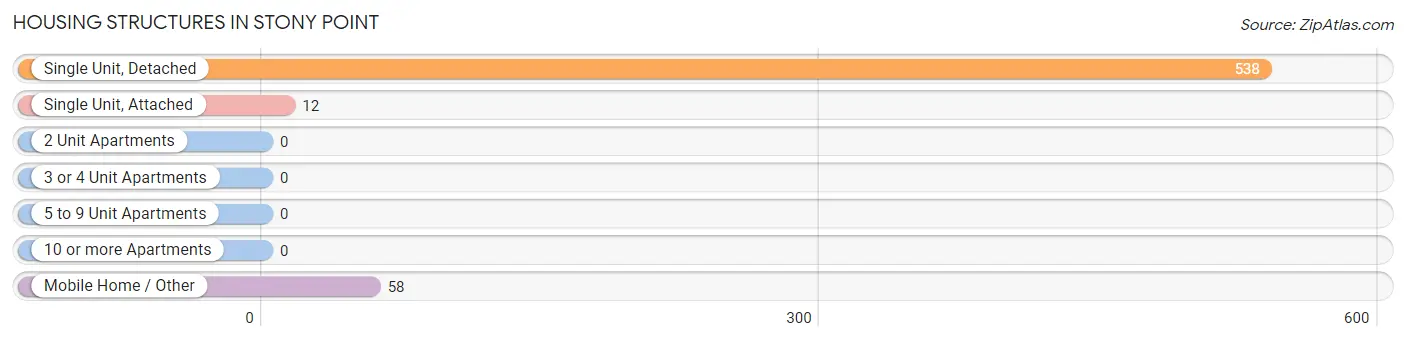
| Structure Type | # Housing Units | % Housing Units |
| Single Unit, Detached | 538 | 88.5% |
| Single Unit, Attached | 12 | 2.0% |
| 2 Unit Apartments | 0 | 0.0% |
| 3 or 4 Unit Apartments | 0 | 0.0% |
| 5 to 9 Unit Apartments | 0 | 0.0% |
| 10 or more Apartments | 0 | 0.0% |
| Mobile Home / Other | 58 | 9.5% |
| Total | 608 | 100.0% |
Housing Structures by Occupancy in Stony Point
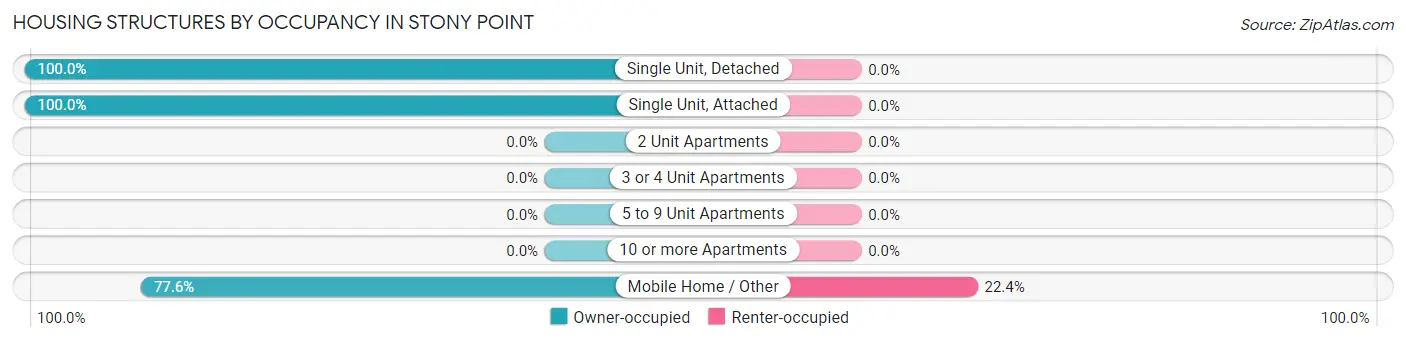
| Structure Type | Owner-occupied | Renter-occupied |
| Single Unit, Detached | 538 (100.0%) | 0 (0.0%) |
| Single Unit, Attached | 12 (100.0%) | 0 (0.0%) |
| 2 Unit Apartments | 0 (0.0%) | 0 (0.0%) |
| 3 or 4 Unit Apartments | 0 (0.0%) | 0 (0.0%) |
| 5 to 9 Unit Apartments | 0 (0.0%) | 0 (0.0%) |
| 10 or more Apartments | 0 (0.0%) | 0 (0.0%) |
| Mobile Home / Other | 45 (77.6%) | 13 (22.4%) |
| Total | 595 (97.9%) | 13 (2.1%) |
Housing Structures by Number of Rooms in Stony Point
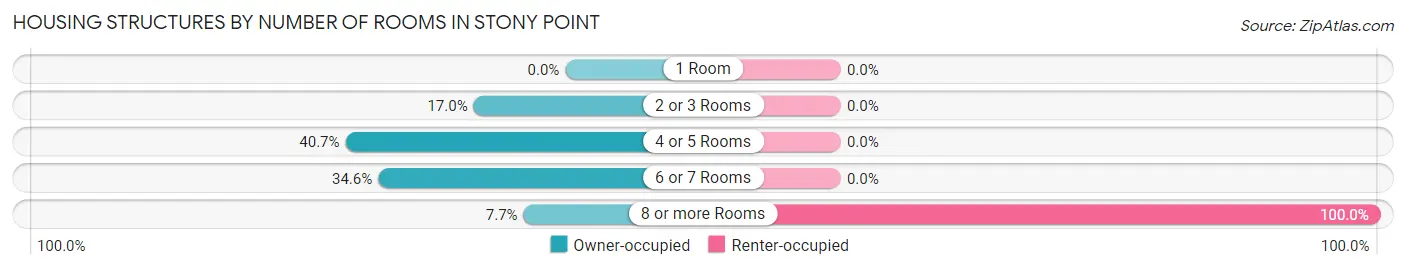
| Number of Rooms | Owner-occupied | Renter-occupied |
| 1 Room | 0 (0.0%) | 0 (0.0%) |
| 2 or 3 Rooms | 101 (17.0%) | 0 (0.0%) |
| 4 or 5 Rooms | 242 (40.7%) | 0 (0.0%) |
| 6 or 7 Rooms | 206 (34.6%) | 0 (0.0%) |
| 8 or more Rooms | 46 (7.7%) | 13 (100.0%) |
| Total | 595 (100.0%) | 13 (100.0%) |
Housing Structure by Heating Type in Stony Point
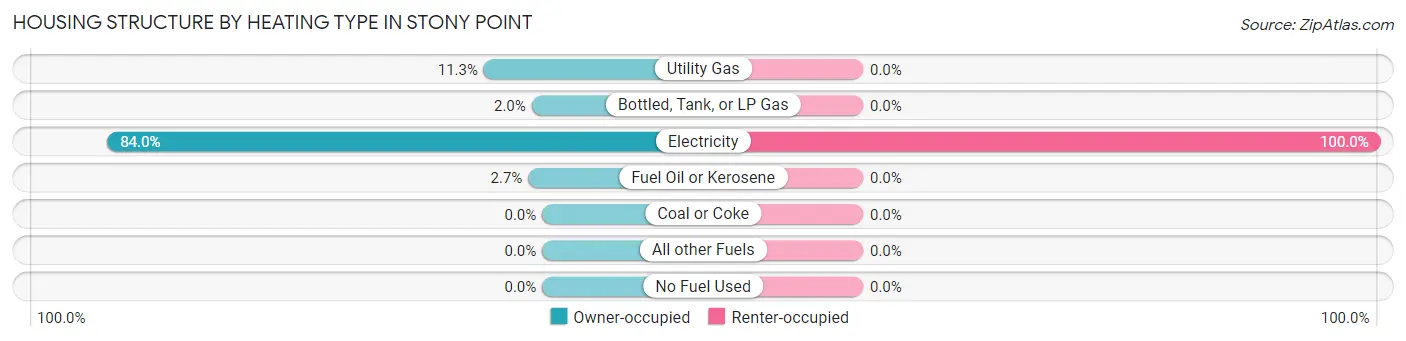
| Heating Type | Owner-occupied | Renter-occupied |
| Utility Gas | 67 (11.3%) | 0 (0.0%) |
| Bottled, Tank, or LP Gas | 12 (2.0%) | 0 (0.0%) |
| Electricity | 500 (84.0%) | 13 (100.0%) |
| Fuel Oil or Kerosene | 16 (2.7%) | 0 (0.0%) |
| Coal or Coke | 0 (0.0%) | 0 (0.0%) |
| All other Fuels | 0 (0.0%) | 0 (0.0%) |
| No Fuel Used | 0 (0.0%) | 0 (0.0%) |
| Total | 595 (100.0%) | 13 (100.0%) |
Household Vehicle Usage in Stony Point
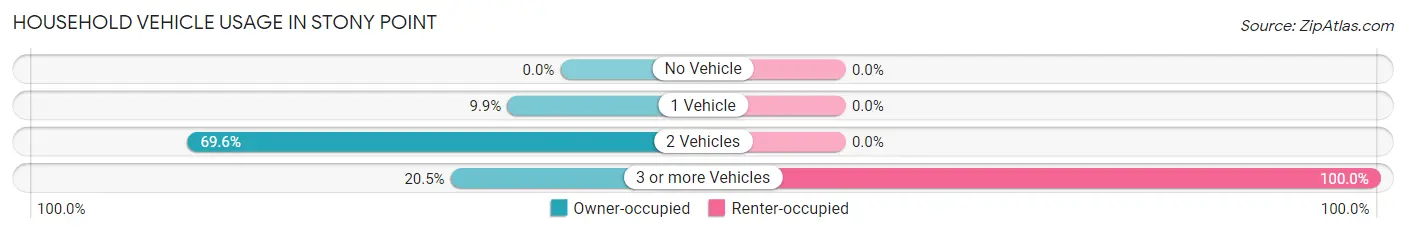
| Vehicles per Household | Owner-occupied | Renter-occupied |
| No Vehicle | 0 (0.0%) | 0 (0.0%) |
| 1 Vehicle | 59 (9.9%) | 0 (0.0%) |
| 2 Vehicles | 414 (69.6%) | 0 (0.0%) |
| 3 or more Vehicles | 122 (20.5%) | 13 (100.0%) |
| Total | 595 (100.0%) | 13 (100.0%) |
Real Estate & Mortgages in Stony Point
Real Estate and Mortgage Overview in Stony Point
| Characteristic | Without Mortgage | With Mortgage |
| Housing Units | 363 | 232 |
| Median Property Value | $163,400 | $175,000 |
| Median Household Income | $49,539 | $0 |
| Monthly Housing Costs | $327 | $0 |
| Real Estate Taxes | $1,115 | $0 |
Property Value by Mortgage Status in Stony Point
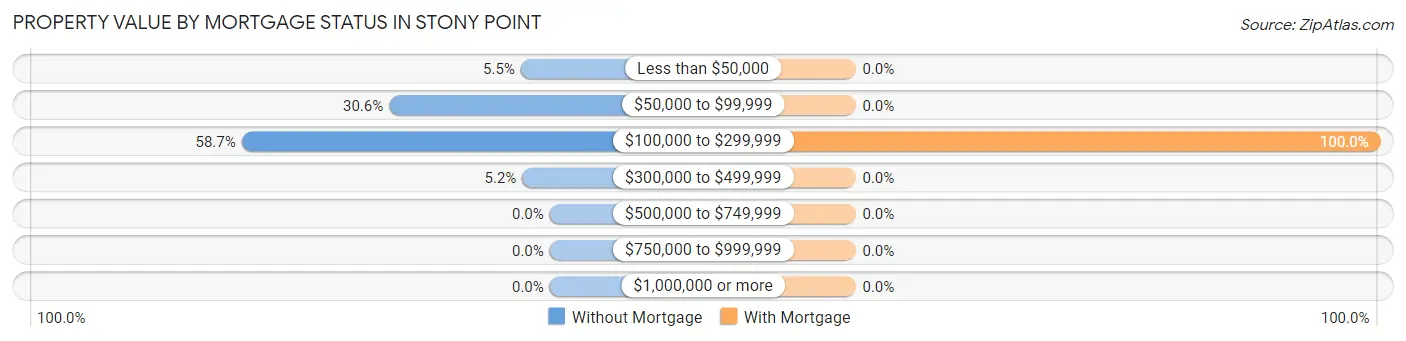
| Property Value | Without Mortgage | With Mortgage |
| Less than $50,000 | 20 (5.5%) | 0 (0.0%) |
| $50,000 to $99,999 | 111 (30.6%) | 0 (0.0%) |
| $100,000 to $299,999 | 213 (58.7%) | 232 (100.0%) |
| $300,000 to $499,999 | 19 (5.2%) | 0 (0.0%) |
| $500,000 to $749,999 | 0 (0.0%) | 0 (0.0%) |
| $750,000 to $999,999 | 0 (0.0%) | 0 (0.0%) |
| $1,000,000 or more | 0 (0.0%) | 0 (0.0%) |
| Total | 363 (100.0%) | 232 (100.0%) |
Household Income by Mortgage Status in Stony Point
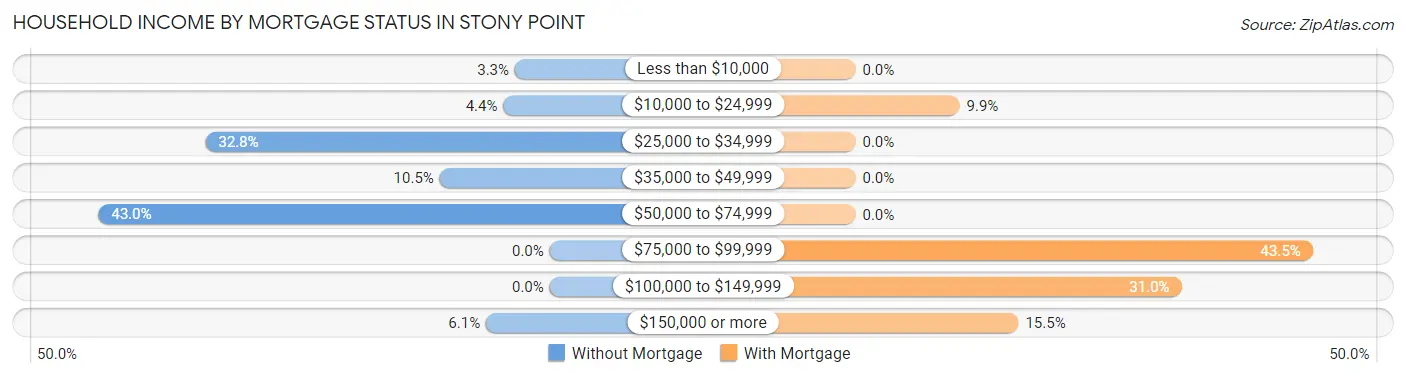
| Household Income | Without Mortgage | With Mortgage |
| Less than $10,000 | 12 (3.3%) | 0 (0.0%) |
| $10,000 to $24,999 | 16 (4.4%) | 23 (9.9%) |
| $25,000 to $34,999 | 119 (32.8%) | 0 (0.0%) |
| $35,000 to $49,999 | 38 (10.5%) | 0 (0.0%) |
| $50,000 to $74,999 | 156 (43.0%) | 0 (0.0%) |
| $75,000 to $99,999 | 0 (0.0%) | 101 (43.5%) |
| $100,000 to $149,999 | 0 (0.0%) | 72 (31.0%) |
| $150,000 or more | 22 (6.1%) | 36 (15.5%) |
| Total | 363 (100.0%) | 232 (100.0%) |
Property Value to Household Income Ratio in Stony Point
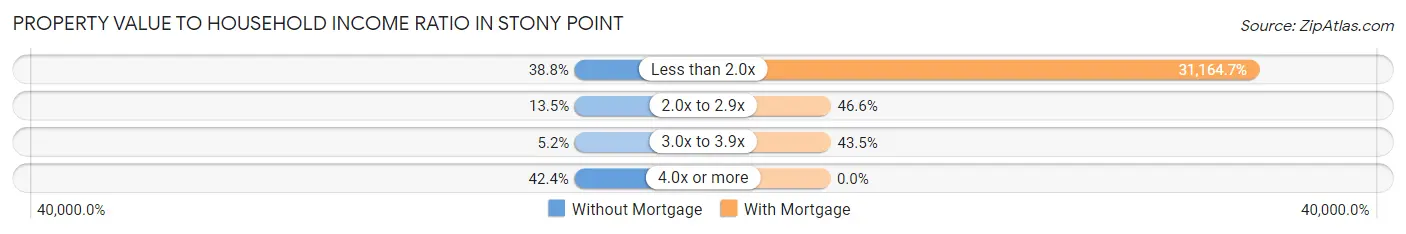
| Value-to-Income Ratio | Without Mortgage | With Mortgage |
| Less than 2.0x | 141 (38.8%) | 72,302 (31,164.7%) |
| 2.0x to 2.9x | 49 (13.5%) | 108 (46.6%) |
| 3.0x to 3.9x | 19 (5.2%) | 101 (43.5%) |
| 4.0x or more | 154 (42.4%) | 0 (0.0%) |
| Total | 363 (100.0%) | 232 (100.0%) |
Real Estate Taxes by Mortgage Status in Stony Point
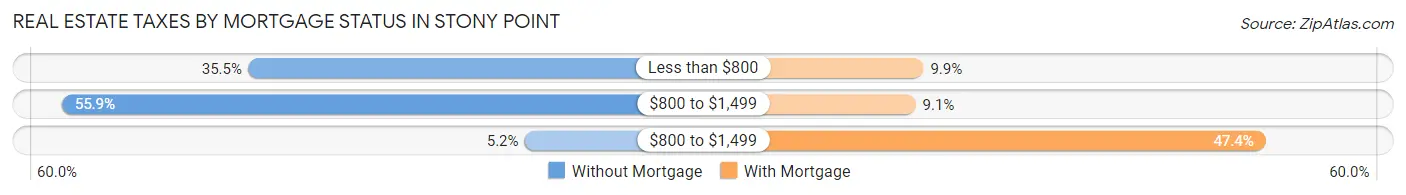
| Property Taxes | Without Mortgage | With Mortgage |
| Less than $800 | 129 (35.5%) | 23 (9.9%) |
| $800 to $1,499 | 203 (55.9%) | 21 (9.0%) |
| $800 to $1,499 | 19 (5.2%) | 110 (47.4%) |
| Total | 363 (100.0%) | 232 (100.0%) |
Health & Disability in Stony Point
Health Insurance Coverage by Age in Stony Point
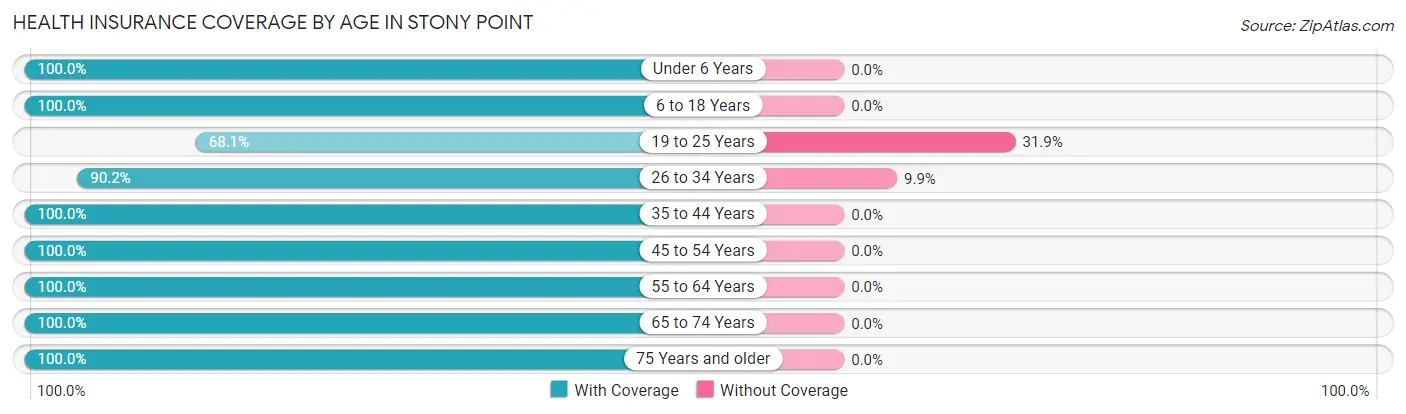
| Age Bracket | With Coverage | Without Coverage |
| Under 6 Years | 107 (100.0%) | 0 (0.0%) |
| 6 to 18 Years | 214 (100.0%) | 0 (0.0%) |
| 19 to 25 Years | 49 (68.1%) | 23 (31.9%) |
| 26 to 34 Years | 119 (90.1%) | 13 (9.9%) |
| 35 to 44 Years | 239 (100.0%) | 0 (0.0%) |
| 45 to 54 Years | 75 (100.0%) | 0 (0.0%) |
| 55 to 64 Years | 186 (100.0%) | 0 (0.0%) |
| 65 to 74 Years | 76 (100.0%) | 0 (0.0%) |
| 75 Years and older | 393 (100.0%) | 0 (0.0%) |
| Total | 1,458 (97.6%) | 36 (2.4%) |
Health Insurance Coverage by Citizenship Status in Stony Point
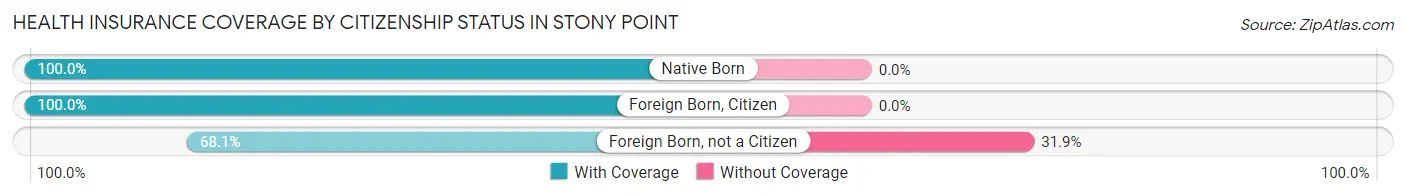
| Citizenship Status | With Coverage | Without Coverage |
| Native Born | 107 (100.0%) | 0 (0.0%) |
| Foreign Born, Citizen | 214 (100.0%) | 0 (0.0%) |
| Foreign Born, not a Citizen | 49 (68.1%) | 23 (31.9%) |
Health Insurance Coverage by Household Income in Stony Point
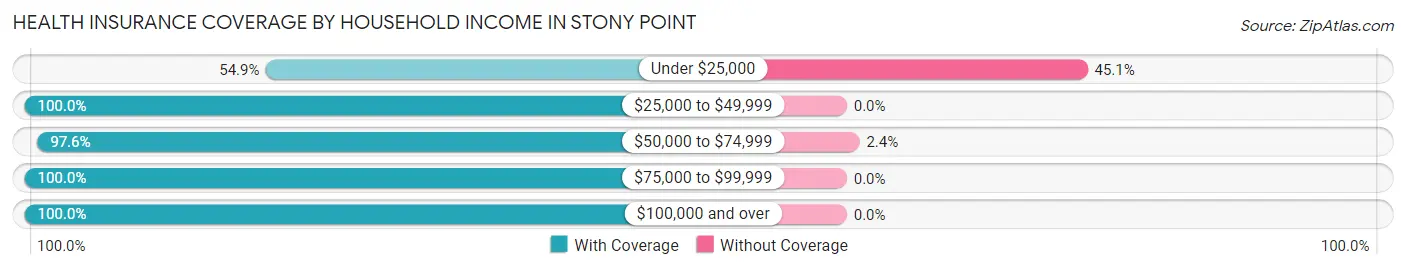
| Household Income | With Coverage | Without Coverage |
| Under $25,000 | 28 (54.9%) | 23 (45.1%) |
| $25,000 to $49,999 | 290 (100.0%) | 0 (0.0%) |
| $50,000 to $74,999 | 534 (97.6%) | 13 (2.4%) |
| $75,000 to $99,999 | 214 (100.0%) | 0 (0.0%) |
| $100,000 and over | 392 (100.0%) | 0 (0.0%) |
Public vs Private Health Insurance Coverage by Age in Stony Point
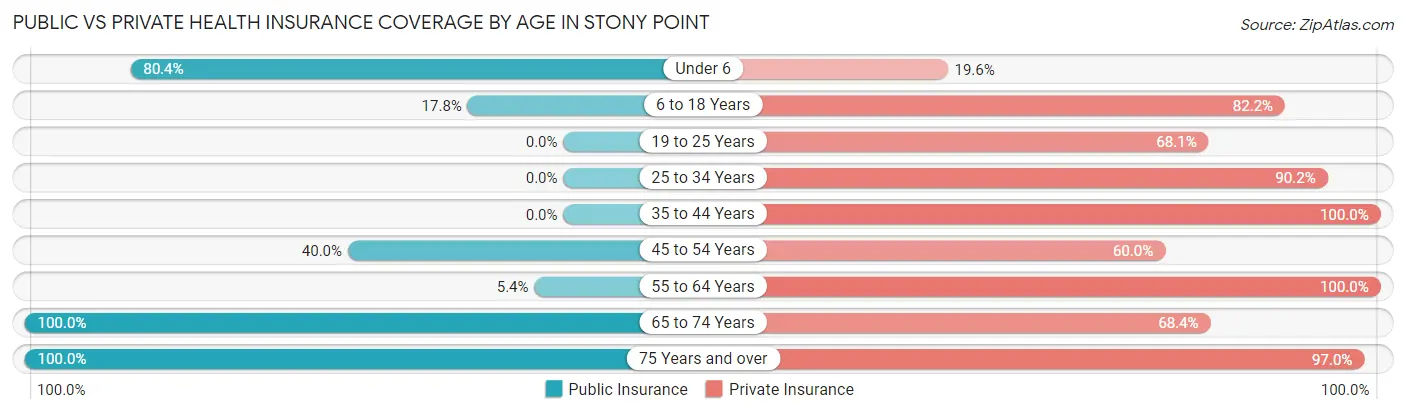
| Age Bracket | Public Insurance | Private Insurance |
| Under 6 | 86 (80.4%) | 21 (19.6%) |
| 6 to 18 Years | 38 (17.8%) | 176 (82.2%) |
| 19 to 25 Years | 0 (0.0%) | 49 (68.1%) |
| 25 to 34 Years | 0 (0.0%) | 119 (90.1%) |
| 35 to 44 Years | 0 (0.0%) | 239 (100.0%) |
| 45 to 54 Years | 30 (40.0%) | 45 (60.0%) |
| 55 to 64 Years | 10 (5.4%) | 186 (100.0%) |
| 65 to 74 Years | 76 (100.0%) | 52 (68.4%) |
| 75 Years and over | 393 (100.0%) | 381 (97.0%) |
| Total | 633 (42.4%) | 1,268 (84.9%) |
Disability Status by Sex by Age in Stony Point
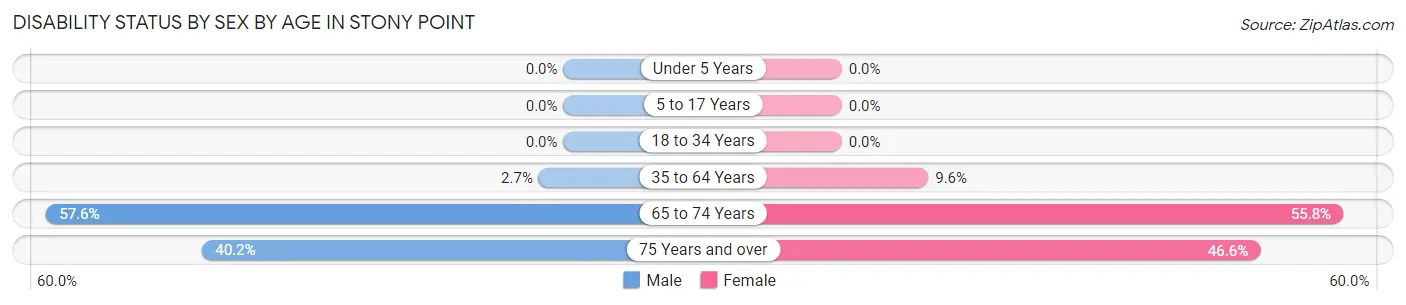
| Age Bracket | Male | Female |
| Under 5 Years | 0 (0.0%) | 0 (0.0%) |
| 5 to 17 Years | 0 (0.0%) | 0 (0.0%) |
| 18 to 34 Years | 0 (0.0%) | 0 (0.0%) |
| 35 to 64 Years | 10 (2.7%) | 13 (9.6%) |
| 65 to 74 Years | 19 (57.6%) | 24 (55.8%) |
| 75 Years and over | 76 (40.2%) | 95 (46.6%) |
Disability Class by Sex by Age in Stony Point
Disability Class: Hearing Difficulty
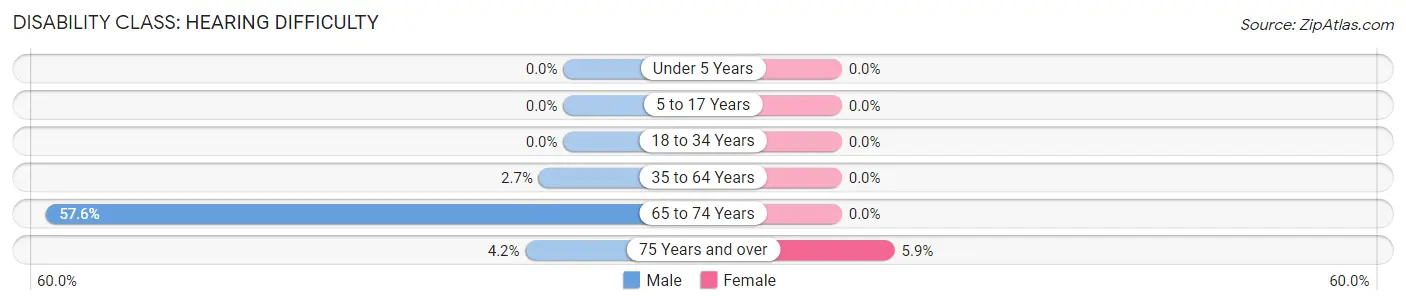
| Age Bracket | Male | Female |
| Under 5 Years | 0 (0.0%) | 0 (0.0%) |
| 5 to 17 Years | 0 (0.0%) | 0 (0.0%) |
| 18 to 34 Years | 0 (0.0%) | 0 (0.0%) |
| 35 to 64 Years | 10 (2.7%) | 0 (0.0%) |
| 65 to 74 Years | 19 (57.6%) | 0 (0.0%) |
| 75 Years and over | 8 (4.2%) | 12 (5.9%) |
Disability Class: Vision Difficulty
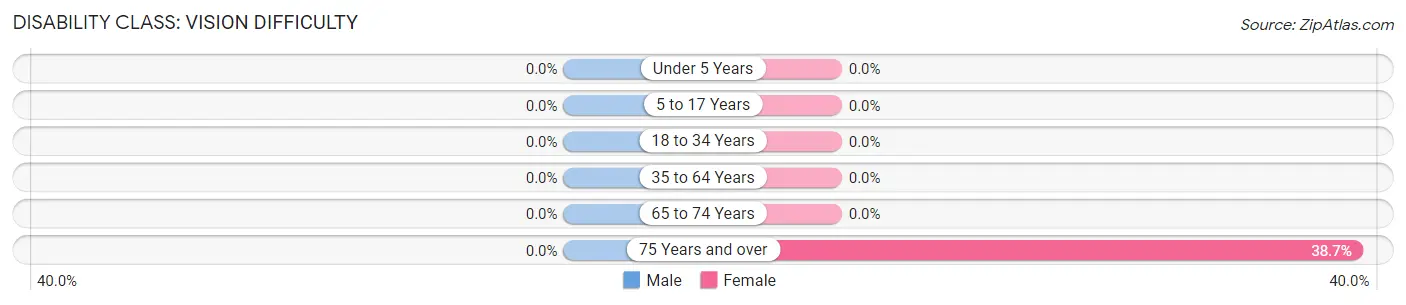
| Age Bracket | Male | Female |
| Under 5 Years | 0 (0.0%) | 0 (0.0%) |
| 5 to 17 Years | 0 (0.0%) | 0 (0.0%) |
| 18 to 34 Years | 0 (0.0%) | 0 (0.0%) |
| 35 to 64 Years | 0 (0.0%) | 0 (0.0%) |
| 65 to 74 Years | 0 (0.0%) | 0 (0.0%) |
| 75 Years and over | 0 (0.0%) | 79 (38.7%) |
Disability Class: Cognitive Difficulty
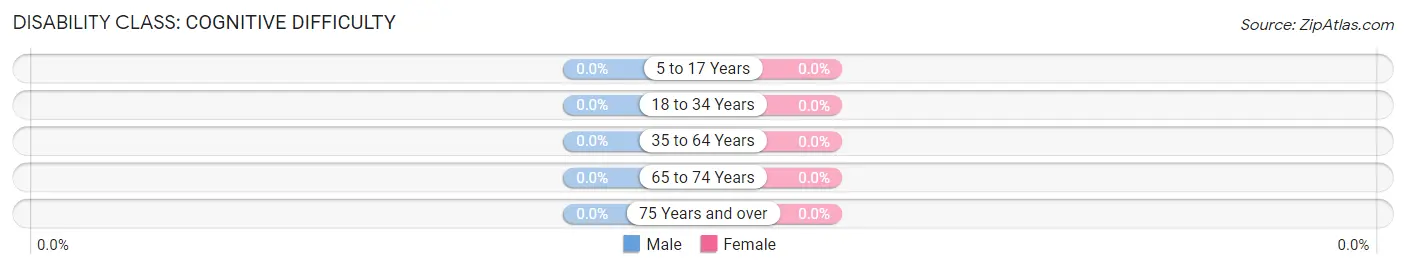
| Age Bracket | Male | Female |
| 5 to 17 Years | 0 (0.0%) | 0 (0.0%) |
| 18 to 34 Years | 0 (0.0%) | 0 (0.0%) |
| 35 to 64 Years | 0 (0.0%) | 0 (0.0%) |
| 65 to 74 Years | 0 (0.0%) | 0 (0.0%) |
| 75 Years and over | 0 (0.0%) | 0 (0.0%) |
Disability Class: Ambulatory Difficulty
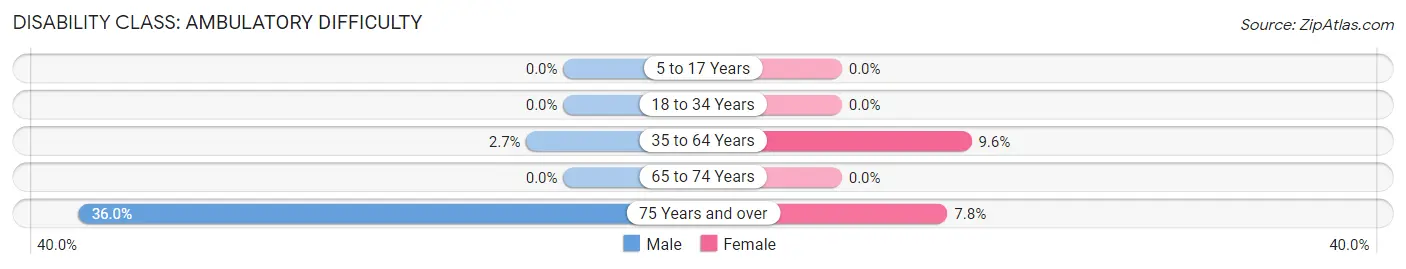
| Age Bracket | Male | Female |
| 5 to 17 Years | 0 (0.0%) | 0 (0.0%) |
| 18 to 34 Years | 0 (0.0%) | 0 (0.0%) |
| 35 to 64 Years | 10 (2.7%) | 13 (9.6%) |
| 65 to 74 Years | 0 (0.0%) | 0 (0.0%) |
| 75 Years and over | 68 (36.0%) | 16 (7.8%) |
Disability Class: Self-Care Difficulty
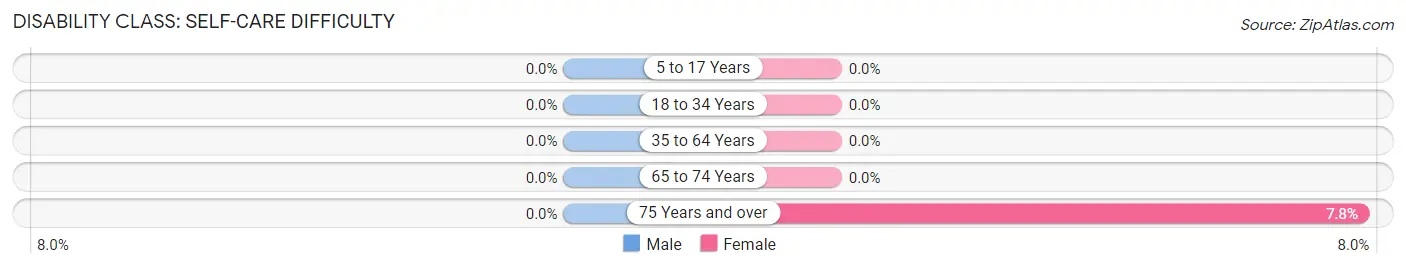
| Age Bracket | Male | Female |
| 5 to 17 Years | 0 (0.0%) | 0 (0.0%) |
| 18 to 34 Years | 0 (0.0%) | 0 (0.0%) |
| 35 to 64 Years | 0 (0.0%) | 0 (0.0%) |
| 65 to 74 Years | 0 (0.0%) | 0 (0.0%) |
| 75 Years and over | 0 (0.0%) | 16 (7.8%) |
Technology Access in Stony Point
Computing Device Access in Stony Point
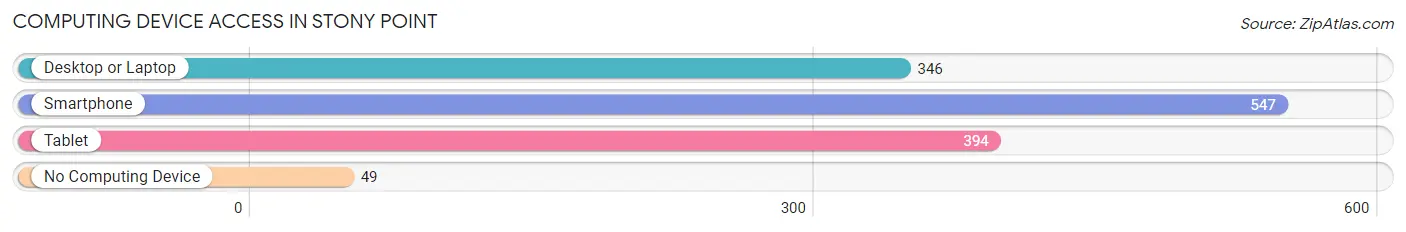
| Device Type | # Households | % Households |
| Desktop or Laptop | 346 | 56.9% |
| Smartphone | 547 | 90.0% |
| Tablet | 394 | 64.8% |
| No Computing Device | 49 | 8.1% |
| Total | 608 | 100.0% |
Internet Access in Stony Point
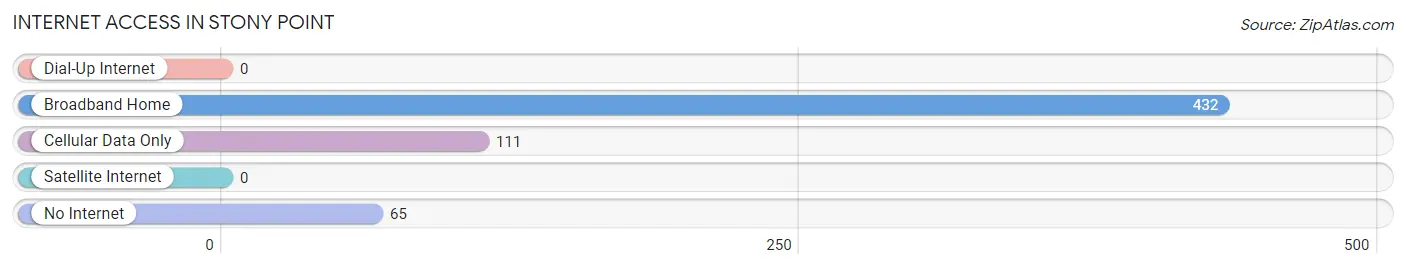
| Internet Type | # Households | % Households |
| Dial-Up Internet | 0 | 0.0% |
| Broadband Home | 432 | 71.1% |
| Cellular Data Only | 111 | 18.3% |
| Satellite Internet | 0 | 0.0% |
| No Internet | 65 | 10.7% |
| Total | 608 | 100.0% |
Stony Point Summary
Stony Point is a small town located in Alexander County, North Carolina. It is situated in the foothills of the Blue Ridge Mountains, about 25 miles northeast of Hickory. The town was founded in 1887 and has a population of approximately 1,000 people.
Geography
Stony Point is located in the foothills of the Blue Ridge Mountains, about 25 miles northeast of Hickory. The town is situated on the Catawba River, which is a major tributary of the Yadkin River. The town is surrounded by rolling hills and forests, and is home to several small lakes. The town is located at an elevation of 890 feet above sea level.
History
Stony Point was founded in 1887 by a group of settlers from the nearby town of Taylorsville. The town was named after a nearby rocky outcropping, which was known as Stony Point. The town was originally a farming community, and the main crops grown were corn, wheat, and tobacco. In the early 1900s, the town began to grow and develop, and several businesses were established. The town was incorporated in 1911.
In the 1950s, the town began to experience a period of growth and development. Several new businesses were established, and the town began to attract new residents. In the 1960s, the town was home to several manufacturing plants, including a furniture factory and a textile mill. The town also had a thriving retail sector, with several stores and restaurants.
Economy
The economy of Stony Point is largely based on agriculture and manufacturing. The town is home to several farms, which produce corn, wheat, and tobacco. The town also has several manufacturing plants, including a furniture factory and a textile mill. The town also has a thriving retail sector, with several stores and restaurants.
Demographics
As of the 2010 census, the population of Stony Point was 1,000 people. The racial makeup of the town was 95.2% White, 1.2% African American, 0.2% Native American, 0.2% Asian, 0.2% from other races, and 2.2% from two or more races. The median household income was $35,000, and the median family income was $41,000.
Conclusion
Stony Point is a small town located in Alexander County, North Carolina. It is situated in the foothills of the Blue Ridge Mountains, about 25 miles northeast of Hickory. The town was founded in 1887 and has a population of approximately 1,000 people. The economy of Stony Point is largely based on agriculture and manufacturing, and the town has a thriving retail sector. The racial makeup of the town is predominantly White, with a small percentage of African American, Native American, and Asian residents. The median household income is $35,000, and the median family income is $41,000.
Common Questions
What is the Total Population of Stony Point?
Total Population of Stony Point is 1,494.
What is the Total Male Population of Stony Point?
Total Male Population of Stony Point is 831.
What is the Total Female Population of Stony Point?
Total Female Population of Stony Point is 663.
What is the Ratio of Males per 100 Females in Stony Point?
There are 125.34 Males per 100 Females in Stony Point.
What is the Ratio of Females per 100 Males in Stony Point?
There are 79.78 Females per 100 Males in Stony Point.
What is the Median Population Age in Stony Point?
Median Population Age in Stony Point is 44.2 Years.
What is the Average Family Size in Stony Point
Average Family Size in Stony Point is 2.8 People.
What is the Average Household Size in Stony Point
Average Household Size in Stony Point is 2.5 People.
What is Per Capita Income in Stony Point?
Per Capita income in Stony Point is $29,251.
What is the Median Family Income in Stony Point?
Median Family Income in Stony Point is $70,136.
What is the Median Household income in Stony Point?
Median Household Income in Stony Point is $68,371.
What is Inequality or Gini Index in Stony Point?
Inequality or Gini Index in Stony Point is 0.40.
How Large is the Labor Force in Stony Point?
There are 835 People in the Labor Forcein in Stony Point.
What is the Percentage of People in the Labor Force in Stony Point?
67.9% of People are in the Labor Force in Stony Point.