Loma Linda, MO
Loma Linda Map
Loma Linda Overview
986
TOTAL POPULATION
520
MALE POPULATION
466
FEMALE POPULATION
111.59
MALES / 100 FEMALES
89.62
FEMALES / 100 MALES
45.7
MEDIAN AGE
2.7
AVG FAMILY SIZE
2.3
AVG HOUSEHOLD SIZE
$41,842
PER CAPITA INCOME
$91,250
AVG FAMILY INCOME
$80,250
AVG HOUSEHOLD INCOME
24.7%
WAGE / INCOME GAP [ % ]
75.3¢/ $1
WAGE / INCOME GAP [ $ ]
0.42
INEQUALITY / GINI INDEX
557
LABOR FORCE [ PEOPLE ]
66.4%
PERCENT IN LABOR FORCE
2.7%
UNEMPLOYMENT RATE
Loma Linda Area Codes
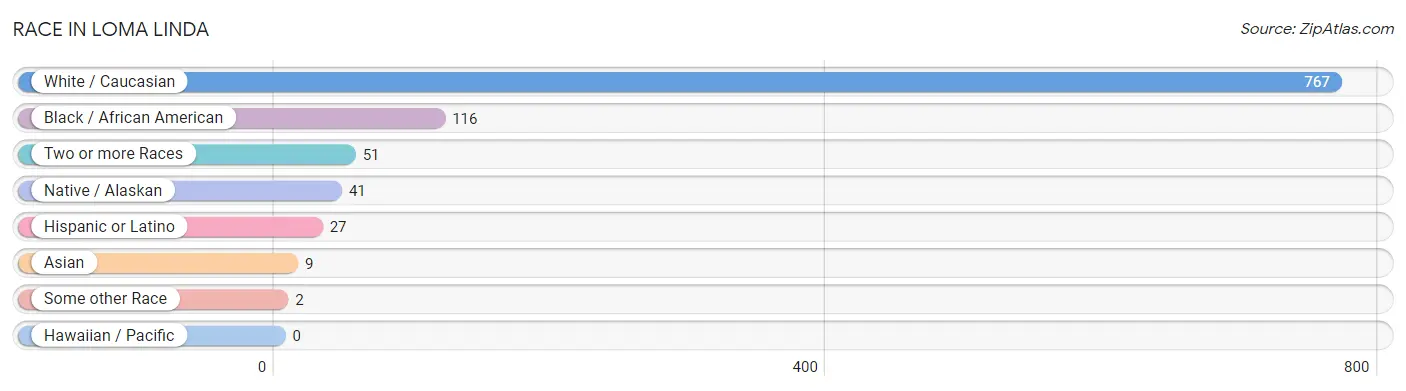
Race in Loma Linda
The most populous races in Loma Linda are White / Caucasian (767 | 77.8%), Black / African American (116 | 11.8%), and Two or more Races (51 | 5.2%).
| Race | # Population | % Population |
| Asian | 9 | 0.9% |
| Black / African American | 116 | 11.8% |
| Hawaiian / Pacific | 0 | 0.0% |
| Hispanic or Latino | 27 | 2.7% |
| Native / Alaskan | 41 | 4.2% |
| White / Caucasian | 767 | 77.8% |
| Two or more Races | 51 | 5.2% |
| Some other Race | 2 | 0.2% |
| Total | 986 | 100.0% |
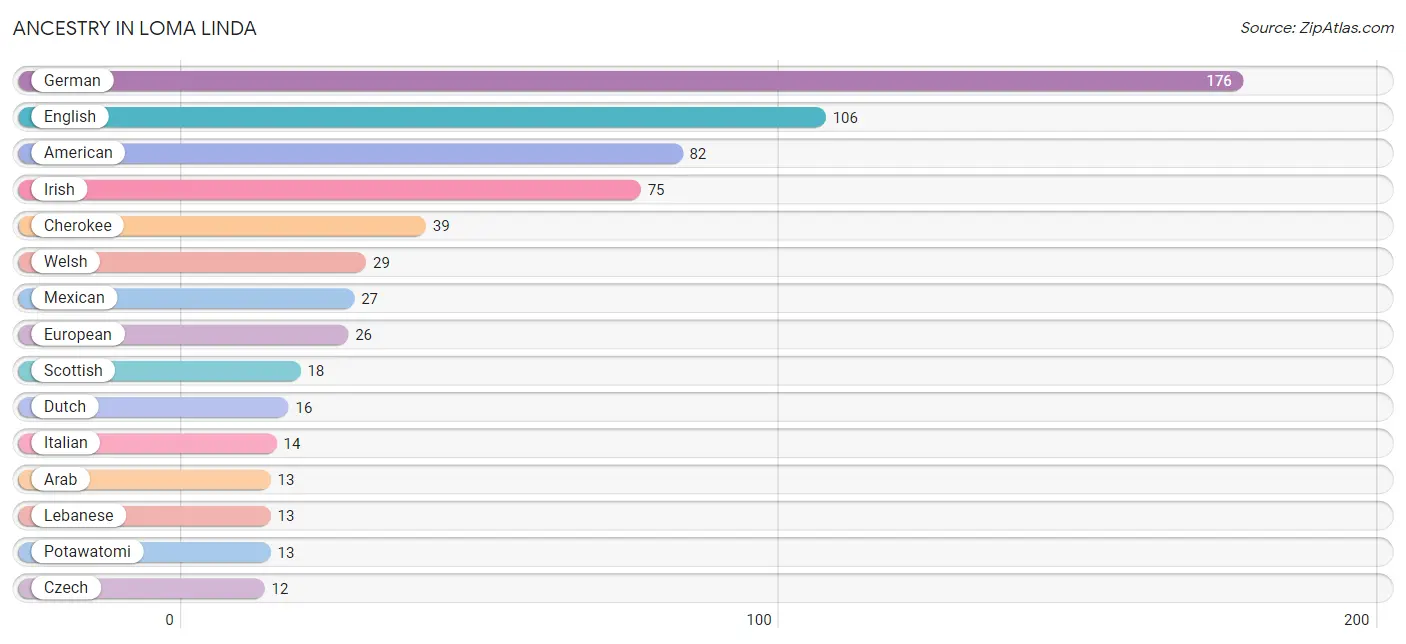
Ancestry in Loma Linda
The most populous ancestries reported in Loma Linda are German (176 | 17.8%), English (106 | 10.7%), American (82 | 8.3%), Irish (75 | 7.6%), and Cherokee (39 | 4.0%), together accounting for 48.5% of all Loma Linda residents.
| Ancestry | # Population | % Population |
| American | 82 | 8.3% |
| Arab | 13 | 1.3% |
| Austrian | 3 | 0.3% |
| British | 3 | 0.3% |
| Cherokee | 39 | 4.0% |
| Chickasaw | 3 | 0.3% |
| Chippewa | 4 | 0.4% |
| Choctaw | 8 | 0.8% |
| Czech | 12 | 1.2% |
| Danish | 1 | 0.1% |
| Dutch | 16 | 1.6% |
| Dutch West Indian | 3 | 0.3% |
| English | 106 | 10.7% |
| European | 26 | 2.6% |
| French | 4 | 0.4% |
| German | 176 | 17.8% |
| Irish | 75 | 7.6% |
| Iroquois | 5 | 0.5% |
| Italian | 14 | 1.4% |
| Korean | 1 | 0.1% |
| Lebanese | 13 | 1.3% |
| Lithuanian | 6 | 0.6% |
| Mexican | 27 | 2.7% |
| Northern European | 9 | 0.9% |
| Norwegian | 2 | 0.2% |
| Polish | 11 | 1.1% |
| Potawatomi | 13 | 1.3% |
| Russian | 5 | 0.5% |
| Scotch-Irish | 10 | 1.0% |
| Scottish | 18 | 1.8% |
| Swedish | 2 | 0.2% |
| Thai | 9 | 0.9% |
| Ukrainian | 4 | 0.4% |
| Welsh | 29 | 2.9% | View All 34 Rows |
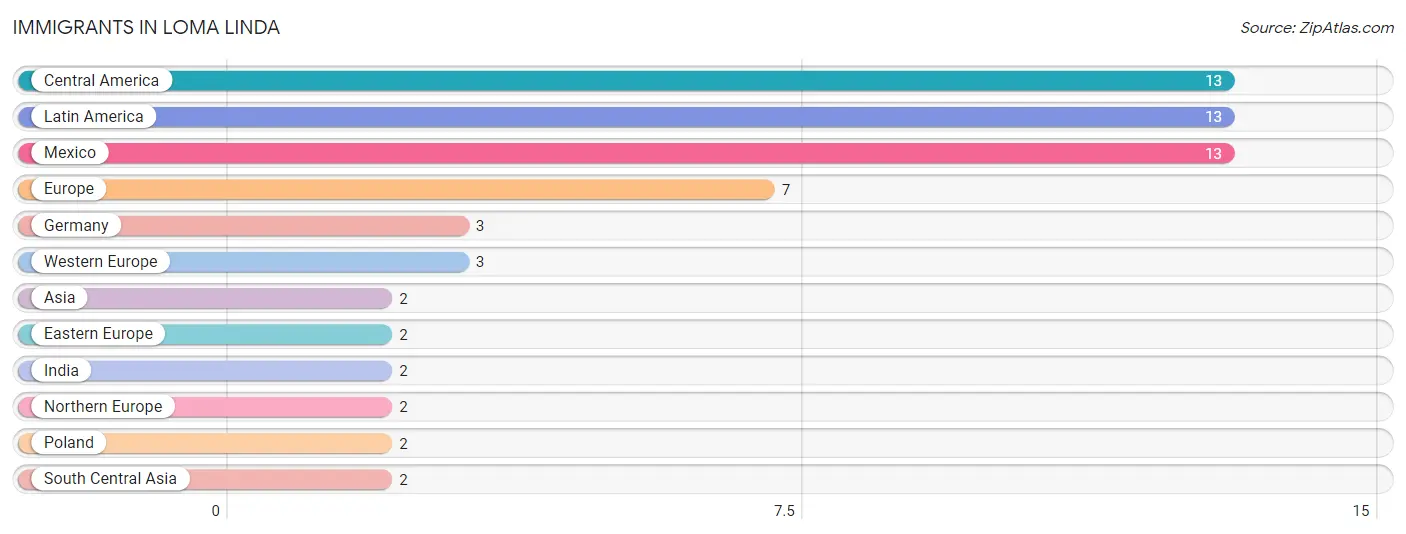
Immigrants in Loma Linda
The most numerous immigrant groups reported in Loma Linda came from Central America (13 | 1.3%), Latin America (13 | 1.3%), Mexico (13 | 1.3%), Europe (7 | 0.7%), and Germany (3 | 0.3%), together accounting for 5.0% of all Loma Linda residents.
| Immigration Origin | # Population | % Population |
| Asia | 2 | 0.2% |
| Central America | 13 | 1.3% |
| Eastern Europe | 2 | 0.2% |
| Europe | 7 | 0.7% |
| Germany | 3 | 0.3% |
| India | 2 | 0.2% |
| Latin America | 13 | 1.3% |
| Mexico | 13 | 1.3% |
| Northern Europe | 2 | 0.2% |
| Poland | 2 | 0.2% |
| South Central Asia | 2 | 0.2% |
| Western Europe | 3 | 0.3% | View All 12 Rows |
Sex and Age in Loma Linda
Sex and Age in Loma Linda
The most populous age groups in Loma Linda are 45 to 49 Years (79 | 15.2%) for men and 20 to 24 Years (58 | 12.4%) for women.
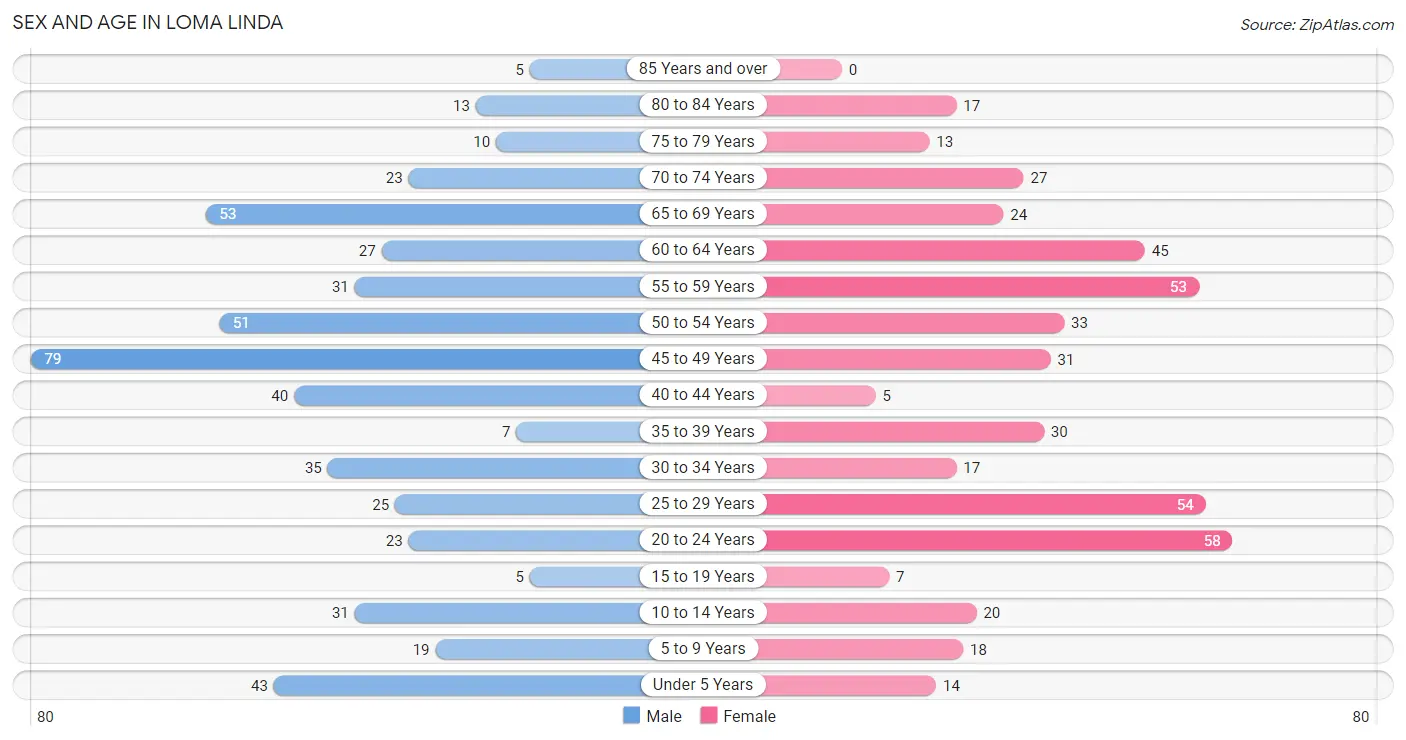
| Age Bracket | Male | Female |
| Under 5 Years | 43 (8.3%) | 14 (3.0%) |
| 5 to 9 Years | 19 (3.6%) | 18 (3.9%) |
| 10 to 14 Years | 31 (6.0%) | 20 (4.3%) |
| 15 to 19 Years | 5 (1.0%) | 7 (1.5%) |
| 20 to 24 Years | 23 (4.4%) | 58 (12.4%) |
| 25 to 29 Years | 25 (4.8%) | 54 (11.6%) |
| 30 to 34 Years | 35 (6.7%) | 17 (3.6%) |
| 35 to 39 Years | 7 (1.3%) | 30 (6.4%) |
| 40 to 44 Years | 40 (7.7%) | 5 (1.1%) |
| 45 to 49 Years | 79 (15.2%) | 31 (6.7%) |
| 50 to 54 Years | 51 (9.8%) | 33 (7.1%) |
| 55 to 59 Years | 31 (6.0%) | 53 (11.4%) |
| 60 to 64 Years | 27 (5.2%) | 45 (9.7%) |
| 65 to 69 Years | 53 (10.2%) | 24 (5.1%) |
| 70 to 74 Years | 23 (4.4%) | 27 (5.8%) |
| 75 to 79 Years | 10 (1.9%) | 13 (2.8%) |
| 80 to 84 Years | 13 (2.5%) | 17 (3.6%) |
| 85 Years and over | 5 (1.0%) | 0 (0.0%) |
| Total | 520 (100.0%) | 466 (100.0%) |
Families and Households in Loma Linda
Median Family Size in Loma Linda
The median family size in Loma Linda is 2.70 persons per family, with married-couple families (234 | 75.0%) accounting for the largest median family size of 2.94 persons per family. On the other hand, single female/mother families (12 | 3.8%) represent the smallest median family size with 1.92 persons per family.
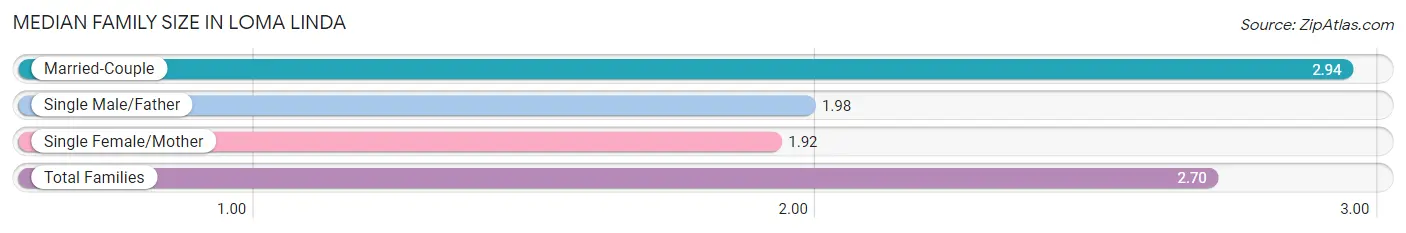
| Family Type | # Families | Family Size |
| Married-Couple | 234 (75.0%) | 2.94 |
| Single Male/Father | 66 (21.1%) | 1.98 |
| Single Female/Mother | 12 (3.8%) | 1.92 |
| Total Families | 312 (100.0%) | 2.70 |
Median Household Size in Loma Linda
The median household size in Loma Linda is 2.28 persons per household, with married-couple households (234 | 54.0%) accounting for the largest median household size of 2.94 persons per household. non-family households (121 | 27.9%) represent the smallest median household size with 1.14 persons per household.
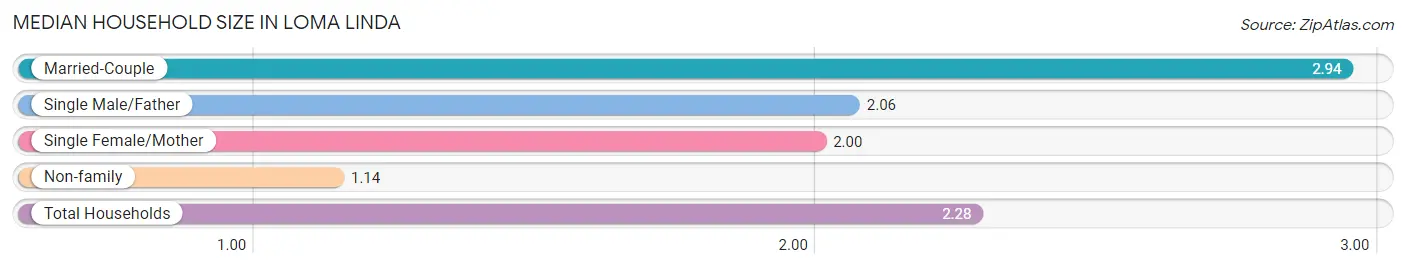
| Household Type | # Households | Household Size |
| Married-Couple | 234 (54.0%) | 2.94 |
| Single Male/Father | 66 (15.2%) | 2.06 |
| Single Female/Mother | 12 (2.8%) | 2.00 |
| Non-family | 121 (27.9%) | 1.14 |
| Total Households | 433 (100.0%) | 2.28 |
Household Size by Marriage Status in Loma Linda
Out of a total of 433 households in Loma Linda, 312 (72.1%) are family households, while 121 (27.9%) are nonfamily households. The most numerous type of family households are 2-person households, comprising 162, and the most common type of nonfamily households are 1-person households, comprising 101.
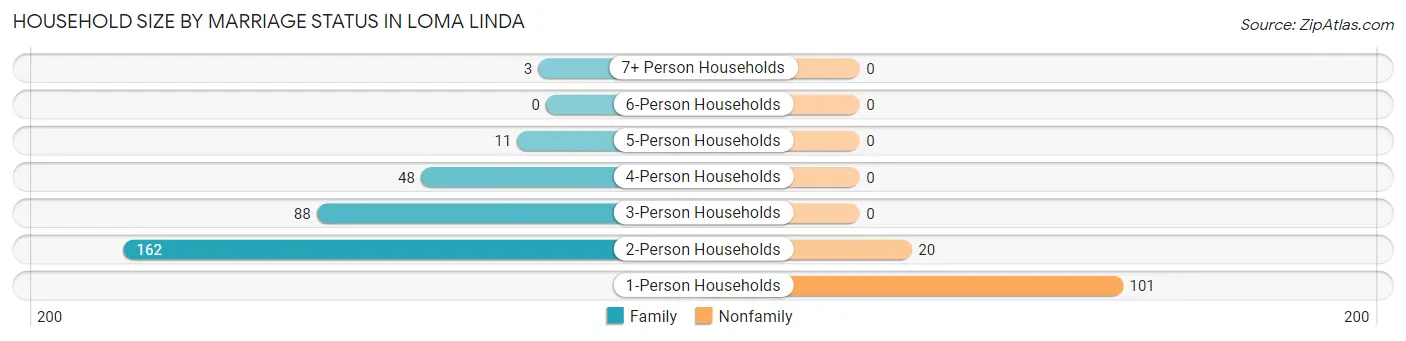
| Household Size | Family Households | Nonfamily Households |
| 1-Person Households | - | 101 (23.3%) |
| 2-Person Households | 162 (37.4%) | 20 (4.6%) |
| 3-Person Households | 88 (20.3%) | 0 (0.0%) |
| 4-Person Households | 48 (11.1%) | 0 (0.0%) |
| 5-Person Households | 11 (2.5%) | 0 (0.0%) |
| 6-Person Households | 0 (0.0%) | 0 (0.0%) |
| 7+ Person Households | 3 (0.7%) | 0 (0.0%) |
| Total | 312 (72.1%) | 121 (27.9%) |
Female Fertility in Loma Linda
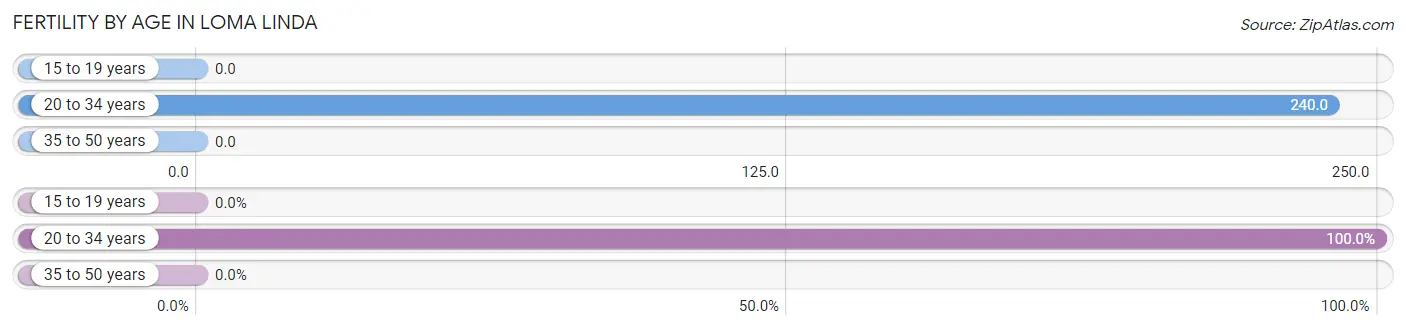
Fertility by Age in Loma Linda
Average fertility rate in Loma Linda is 153.0 births per 1,000 women. Women in the age bracket of 20 to 34 years have the highest fertility rate with 240.0 births per 1,000 women. Women in the age bracket of 20 to 34 years acount for 100.0% of all women with births.
| Age Bracket | Women with Births | Births / 1,000 Women |
| 15 to 19 years | 0 (0.0%) | 0.0 |
| 20 to 34 years | 31 (100.0%) | 240.0 |
| 35 to 50 years | 0 (0.0%) | 0.0 |
| Total | 31 (100.0%) | 153.0 |
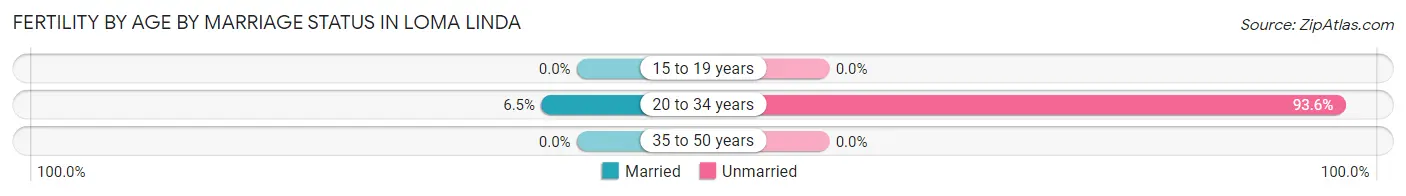
Fertility by Age by Marriage Status in Loma Linda
6.5% of women with births (31) in Loma Linda are married. The highest percentage of unmarried women with births falls into 20 to 34 years age bracket with 93.5% of them unmarried at the time of birth, while the lowest percentage of unmarried women with births belong to 20 to 34 years age bracket with 93.5% of them unmarried.
| Age Bracket | Married | Unmarried |
| 15 to 19 years | 0 (0.0%) | 0 (0.0%) |
| 20 to 34 years | 2 (6.5%) | 29 (93.5%) |
| 35 to 50 years | 0 (0.0%) | 0 (0.0%) |
| Total | 2 (6.5%) | 29 (93.5%) |
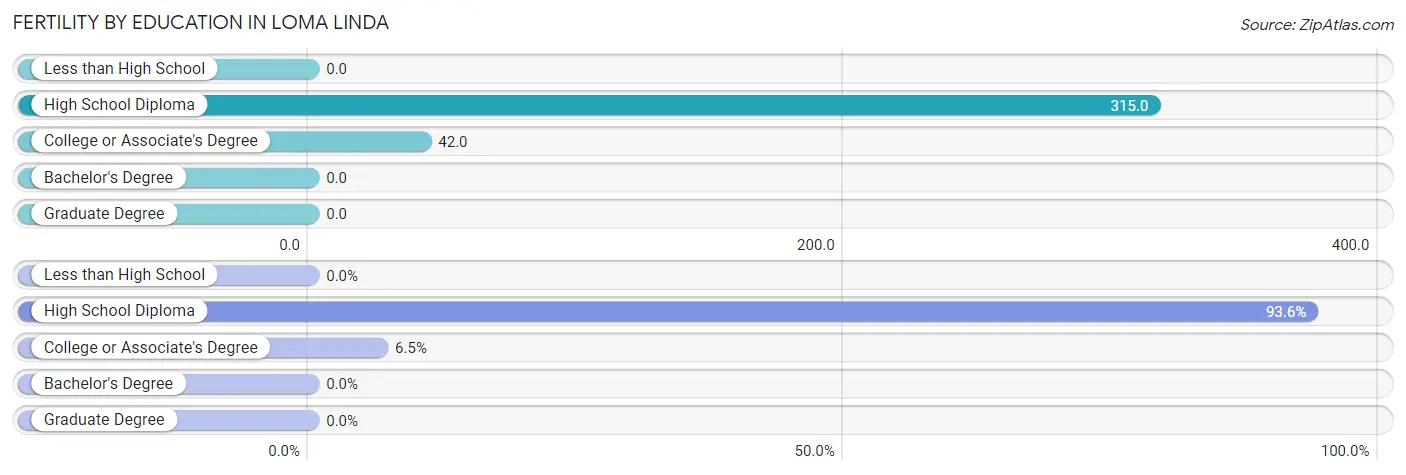
Fertility by Education in Loma Linda
| Educational Attainment | Women with Births | Births / 1,000 Women |
| Less than High School | 0 (0.0%) | 0.0 |
| High School Diploma | 29 (93.5%) | 315.0 |
| College or Associate's Degree | 2 (6.5%) | 42.0 |
| Bachelor's Degree | 0 (0.0%) | 0.0 |
| Graduate Degree | 0 (0.0%) | 0.0 |
| Total | 31 (100.0%) | 153.0 |
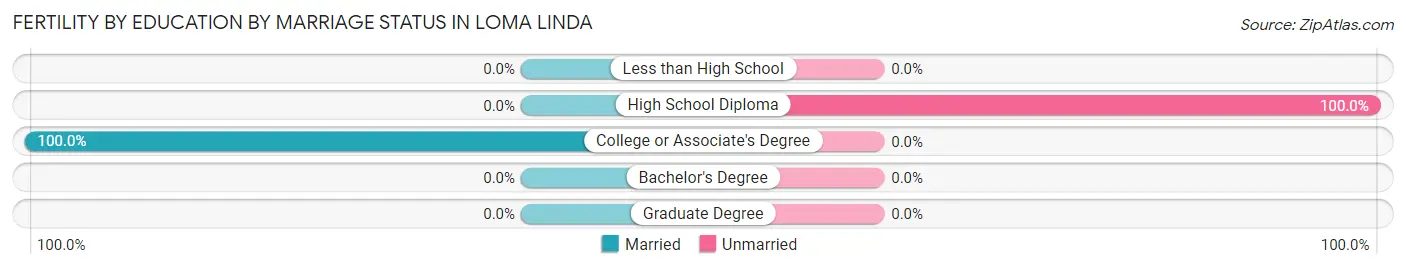
Fertility by Education by Marriage Status in Loma Linda
93.5% of women with births in Loma Linda are unmarried. Women with the educational attainment of college or associate's degree are most likely to be married with 100.0% of them married at childbirth, while women with the educational attainment of high school diploma are least likely to be married with 100.0% of them unmarried at childbirth.
| Educational Attainment | Married | Unmarried |
| Less than High School | 0 (0.0%) | 0 (0.0%) |
| High School Diploma | 0 (0.0%) | 29 (100.0%) |
| College or Associate's Degree | 2 (100.0%) | 0 (0.0%) |
| Bachelor's Degree | 0 (0.0%) | 0 (0.0%) |
| Graduate Degree | 0 (0.0%) | 0 (0.0%) |
| Total | 2 (6.5%) | 29 (93.5%) |
Income in Loma Linda
Income Overview in Loma Linda
Per Capita Income in Loma Linda is $41,842, while median incomes of families and households are $91,250 and $80,250 respectively.
| Characteristic | Number | Measure |
| Per Capita Income | 986 | $41,842 |
| Median Family Income | 312 | $91,250 |
| Mean Family Income | 312 | $102,106 |
| Median Household Income | 433 | $80,250 |
| Mean Household Income | 433 | $94,920 |
| Income Deficit | 312 | $0 |
| Wage / Income Gap (%) | 986 | 24.74% |
| Wage / Income Gap ($) | 986 | 75.26¢ per $1 |
| Gini / Inequality Index | 986 | 0.42 |
Earnings by Sex in Loma Linda
Average Earnings in Loma Linda are $38,750, $43,125 for men and $32,457 for women, a difference of 24.7%.
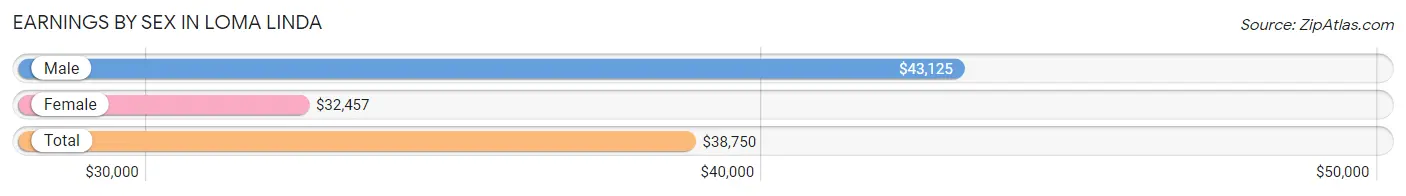
| Sex | Number | Average Earnings |
| Male | 330 (57.4%) | $43,125 |
| Female | 245 (42.6%) | $32,457 |
| Total | 575 (100.0%) | $38,750 |
Earnings by Sex by Income Bracket in Loma Linda
The most common earnings brackets in Loma Linda are $10,000 to $12,499 for men (56 | 17.0%) and $30,000 to $34,999 for women (36 | 14.7%).
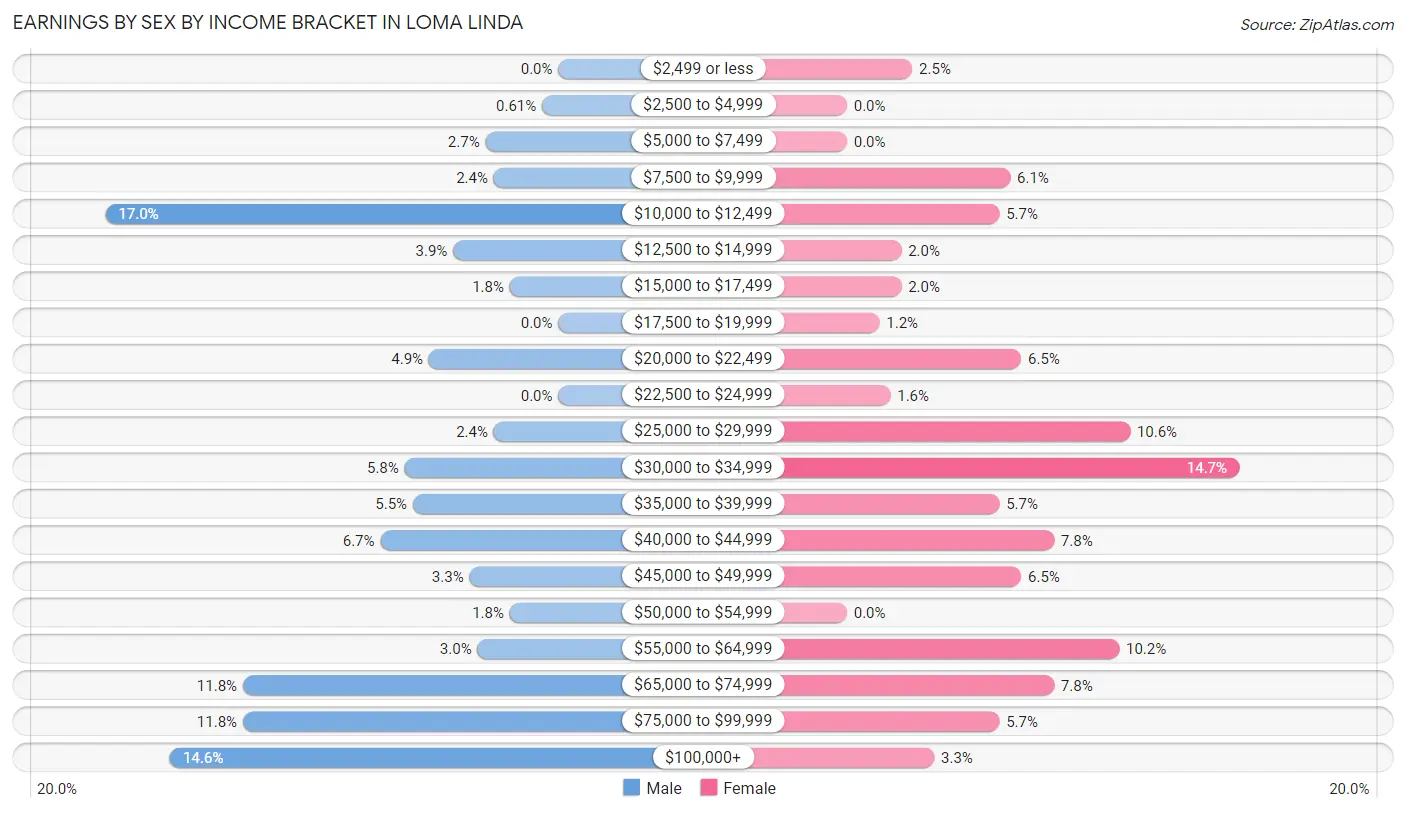
| Income | Male | Female |
| $2,499 or less | 0 (0.0%) | 6 (2.5%) |
| $2,500 to $4,999 | 2 (0.6%) | 0 (0.0%) |
| $5,000 to $7,499 | 9 (2.7%) | 0 (0.0%) |
| $7,500 to $9,999 | 8 (2.4%) | 15 (6.1%) |
| $10,000 to $12,499 | 56 (17.0%) | 14 (5.7%) |
| $12,500 to $14,999 | 13 (3.9%) | 5 (2.0%) |
| $15,000 to $17,499 | 6 (1.8%) | 5 (2.0%) |
| $17,500 to $19,999 | 0 (0.0%) | 3 (1.2%) |
| $20,000 to $22,499 | 16 (4.9%) | 16 (6.5%) |
| $22,500 to $24,999 | 0 (0.0%) | 4 (1.6%) |
| $25,000 to $29,999 | 8 (2.4%) | 26 (10.6%) |
| $30,000 to $34,999 | 19 (5.8%) | 36 (14.7%) |
| $35,000 to $39,999 | 18 (5.4%) | 14 (5.7%) |
| $40,000 to $44,999 | 22 (6.7%) | 19 (7.8%) |
| $45,000 to $49,999 | 11 (3.3%) | 16 (6.5%) |
| $50,000 to $54,999 | 6 (1.8%) | 0 (0.0%) |
| $55,000 to $64,999 | 10 (3.0%) | 25 (10.2%) |
| $65,000 to $74,999 | 39 (11.8%) | 19 (7.8%) |
| $75,000 to $99,999 | 39 (11.8%) | 14 (5.7%) |
| $100,000+ | 48 (14.5%) | 8 (3.3%) |
| Total | 330 (100.0%) | 245 (100.0%) |
Earnings by Sex by Educational Attainment in Loma Linda
Average earnings in Loma Linda are $44,688 for men and $34,107 for women, a difference of 23.7%. Men with an educational attainment of graduate degree enjoy the highest average annual earnings of $86,250, while those with college or associate's degree education earn the least with $43,750. Women with an educational attainment of graduate degree earn the most with the average annual earnings of $58,750, while those with less than high school education have the smallest earnings of $24,688.
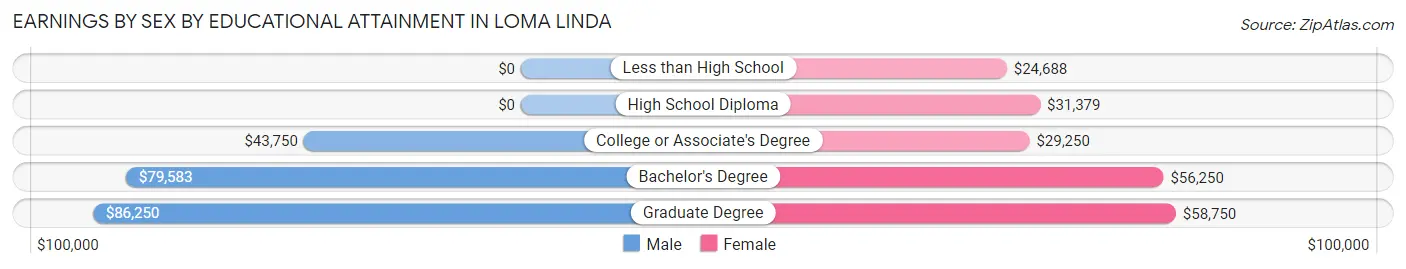
| Educational Attainment | Male Income | Female Income |
| Less than High School | - | - |
| High School Diploma | - | - |
| College or Associate's Degree | $43,750 | $29,250 |
| Bachelor's Degree | $79,583 | $56,250 |
| Graduate Degree | $86,250 | $58,750 |
| Total | $44,688 | $34,107 |
Family Income in Loma Linda
Family Income Brackets in Loma Linda
According to the Loma Linda family income data, there are 66 families falling into the $100,000 to $149,999 income range, which is the most common income bracket and makes up 21.1% of all families.
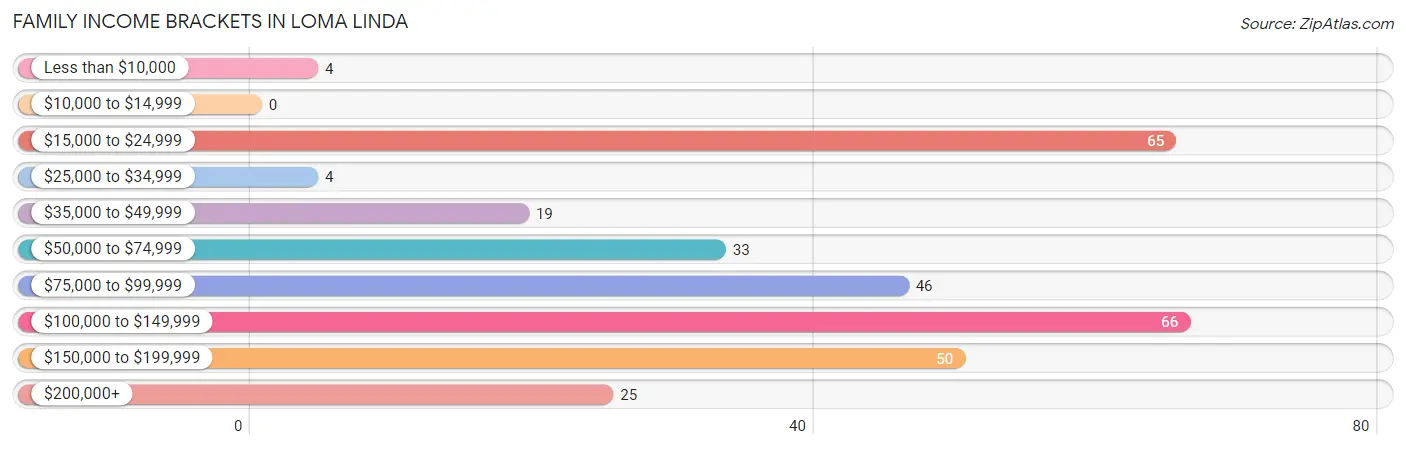
| Income Bracket | # Families | % Families |
| Less than $10,000 | 4 | 1.3% |
| $10,000 to $14,999 | 0 | 0.0% |
| $15,000 to $24,999 | 65 | 20.8% |
| $25,000 to $34,999 | 4 | 1.3% |
| $35,000 to $49,999 | 19 | 6.1% |
| $50,000 to $74,999 | 33 | 10.6% |
| $75,000 to $99,999 | 46 | 14.7% |
| $100,000 to $149,999 | 66 | 21.2% |
| $150,000 to $199,999 | 50 | 16.0% |
| $200,000+ | 25 | 8.0% |
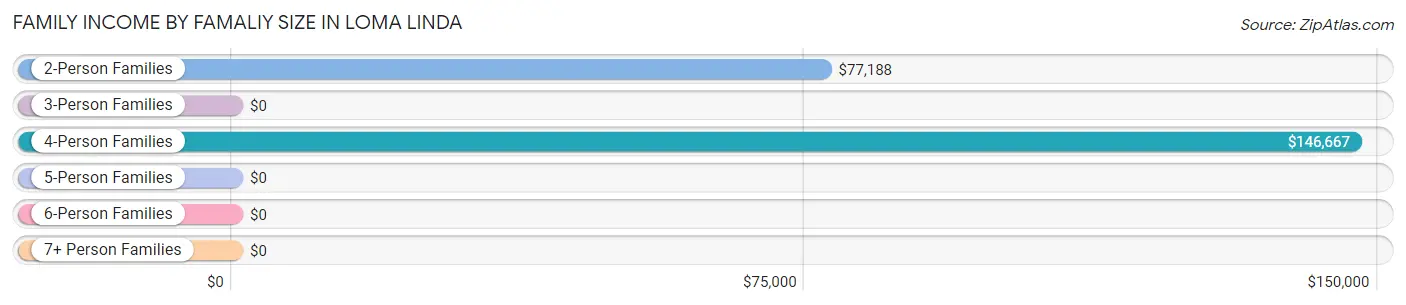
Family Income by Famaliy Size in Loma Linda
4-person families (48 | 15.4%) account for the highest median family income in Loma Linda with $146,667 per family, while 2-person families (220 | 70.5%) have the highest median income of $38,594 per family member.
| Income Bracket | # Families | Median Income |
| 2-Person Families | 220 (70.5%) | $77,188 |
| 3-Person Families | 30 (9.6%) | $0 |
| 4-Person Families | 48 (15.4%) | $146,667 |
| 5-Person Families | 11 (3.5%) | $0 |
| 6-Person Families | 0 (0.0%) | $0 |
| 7+ Person Families | 3 (1.0%) | $0 |
| Total | 312 (100.0%) | $91,250 |
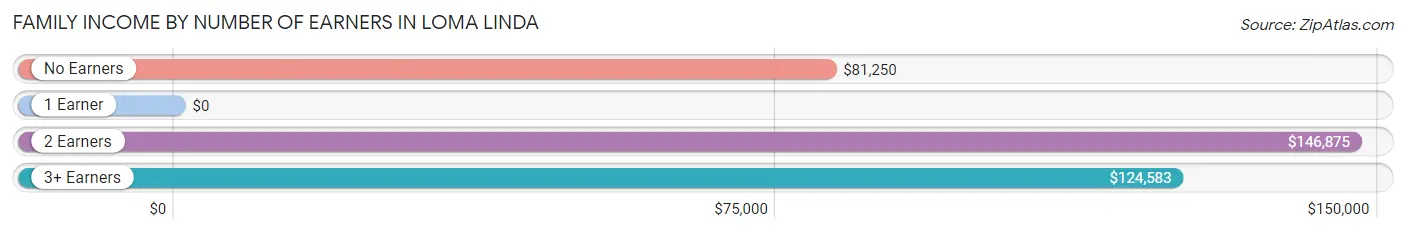
Family Income by Number of Earners in Loma Linda
| Number of Earners | # Families | Median Income |
| No Earners | 53 (17.0%) | $81,250 |
| 1 Earner | 123 (39.4%) | $0 |
| 2 Earners | 109 (34.9%) | $146,875 |
| 3+ Earners | 27 (8.6%) | $124,583 |
| Total | 312 (100.0%) | $91,250 |
Household Income in Loma Linda
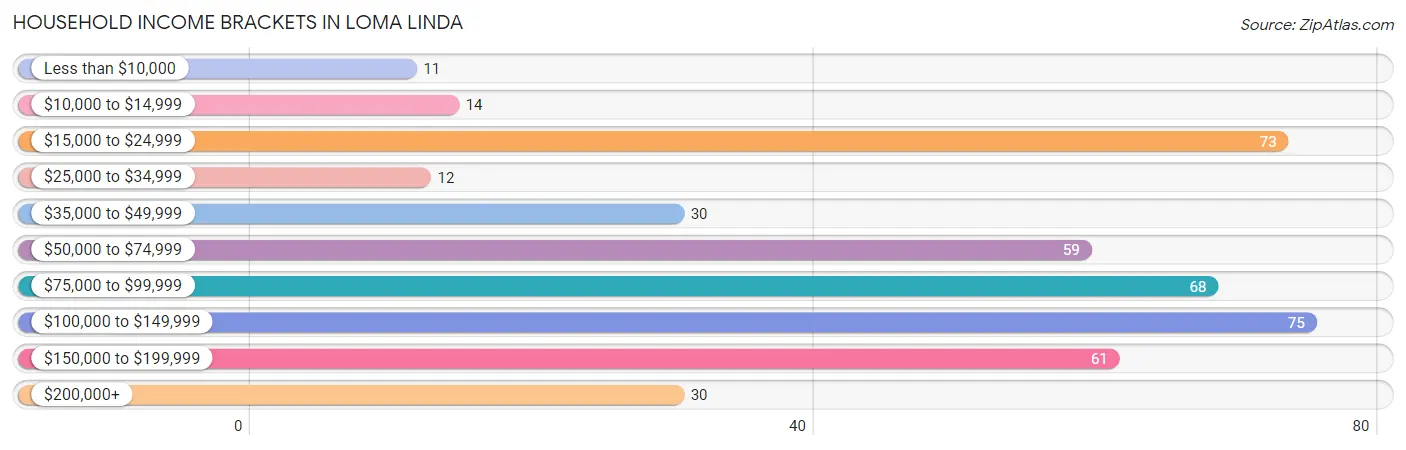
Household Income Brackets in Loma Linda
With 75 households falling in the category, the $100,000 to $149,999 income range is the most frequent in Loma Linda, accounting for 17.3% of all households. In contrast, only 11 households (2.5%) fall into the less than $10,000 income bracket, making it the least populous group.
| Income Bracket | # Households | % Households |
| Less than $10,000 | 11 | 2.5% |
| $10,000 to $14,999 | 14 | 3.2% |
| $15,000 to $24,999 | 73 | 16.9% |
| $25,000 to $34,999 | 12 | 2.8% |
| $35,000 to $49,999 | 30 | 6.9% |
| $50,000 to $74,999 | 59 | 13.6% |
| $75,000 to $99,999 | 68 | 15.7% |
| $100,000 to $149,999 | 75 | 17.3% |
| $150,000 to $199,999 | 61 | 14.1% |
| $200,000+ | 30 | 6.9% |
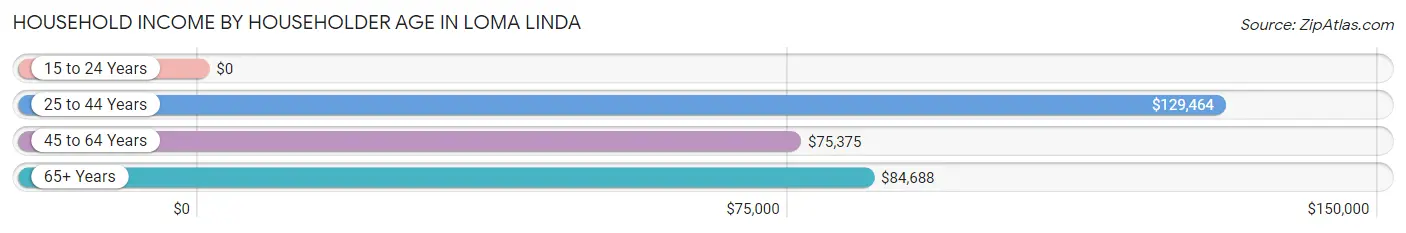
Household Income by Householder Age in Loma Linda
The median household income in Loma Linda is $80,250, with the highest median household income of $129,464 found in the 25 to 44 years age bracket for the primary householder. A total of 99 households (22.9%) fall into this category. Meanwhile, the 15 to 24 years age bracket for the primary householder has the lowest median household income of $0, with 6 households (1.4%) in this group.
| Income Bracket | # Households | Median Income |
| 15 to 24 Years | 6 (1.4%) | $0 |
| 25 to 44 Years | 99 (22.9%) | $129,464 |
| 45 to 64 Years | 221 (51.0%) | $75,375 |
| 65+ Years | 107 (24.7%) | $84,688 |
| Total | 433 (100.0%) | $80,250 |
Poverty in Loma Linda
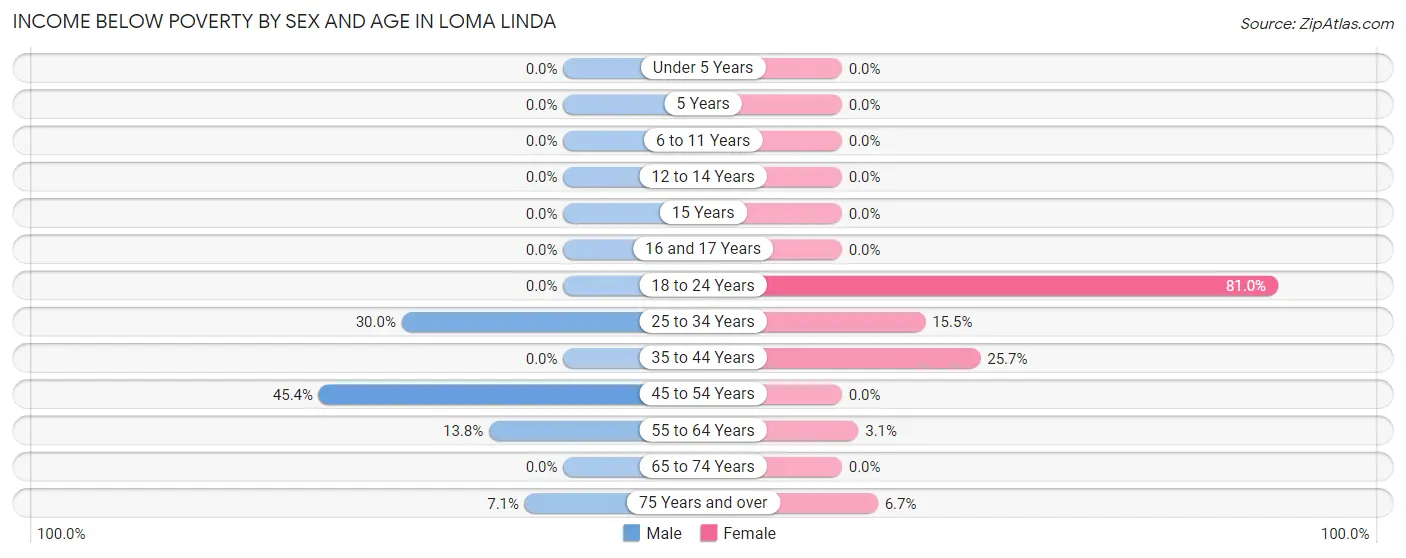
Income Below Poverty by Sex and Age in Loma Linda
With 16.7% poverty level for males and 16.3% for females among the residents of Loma Linda, 45 to 54 year old males and 18 to 24 year old females are the most vulnerable to poverty, with 59 males (45.4%) and 51 females (80.9%) in their respective age groups living below the poverty level.
| Age Bracket | Male | Female |
| Under 5 Years | 0 (0.0%) | 0 (0.0%) |
| 5 Years | 0 (0.0%) | 0 (0.0%) |
| 6 to 11 Years | 0 (0.0%) | 0 (0.0%) |
| 12 to 14 Years | 0 (0.0%) | 0 (0.0%) |
| 15 Years | 0 (0.0%) | 0 (0.0%) |
| 16 and 17 Years | 0 (0.0%) | 0 (0.0%) |
| 18 to 24 Years | 0 (0.0%) | 51 (80.9%) |
| 25 to 34 Years | 18 (30.0%) | 11 (15.5%) |
| 35 to 44 Years | 0 (0.0%) | 9 (25.7%) |
| 45 to 54 Years | 59 (45.4%) | 0 (0.0%) |
| 55 to 64 Years | 8 (13.8%) | 3 (3.1%) |
| 65 to 74 Years | 0 (0.0%) | 0 (0.0%) |
| 75 Years and over | 2 (7.1%) | 2 (6.7%) |
| Total | 87 (16.7%) | 76 (16.3%) |
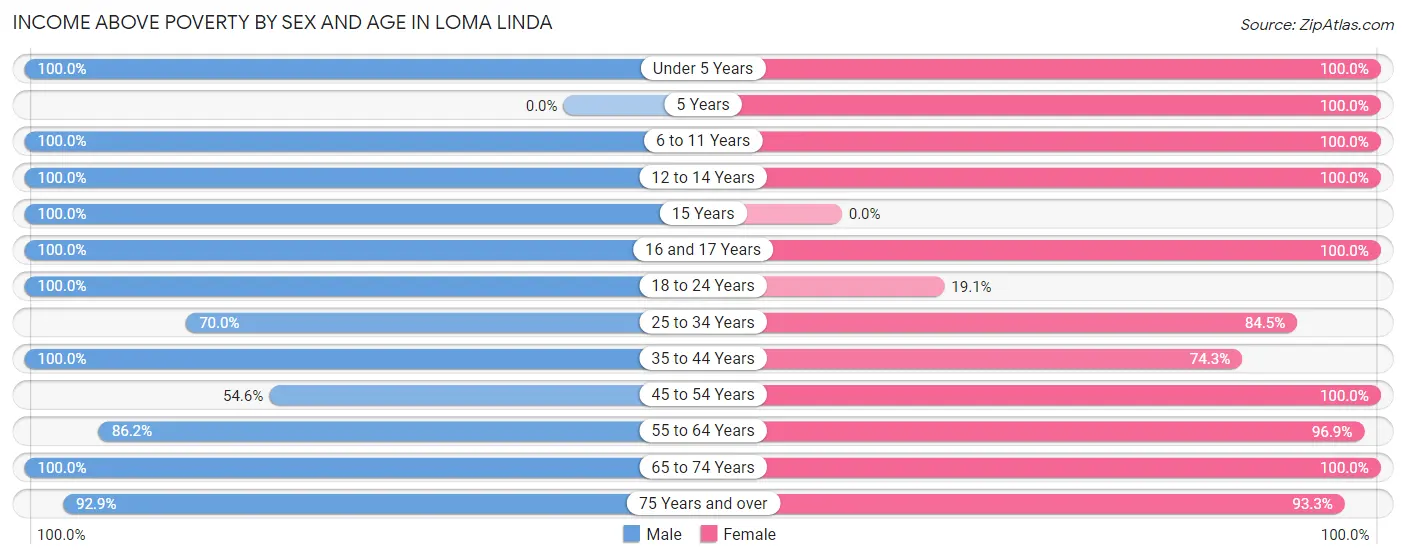
Income Above Poverty by Sex and Age in Loma Linda
According to the poverty statistics in Loma Linda, males aged under 5 years and females aged under 5 years are the age groups that are most secure financially, with 100.0% of males and 100.0% of females in these age groups living above the poverty line.
| Age Bracket | Male | Female |
| Under 5 Years | 43 (100.0%) | 14 (100.0%) |
| 5 Years | 0 (0.0%) | 6 (100.0%) |
| 6 to 11 Years | 32 (100.0%) | 25 (100.0%) |
| 12 to 14 Years | 18 (100.0%) | 7 (100.0%) |
| 15 Years | 2 (100.0%) | 0 (0.0%) |
| 16 and 17 Years | 2 (100.0%) | 2 (100.0%) |
| 18 to 24 Years | 24 (100.0%) | 12 (19.1%) |
| 25 to 34 Years | 42 (70.0%) | 60 (84.5%) |
| 35 to 44 Years | 47 (100.0%) | 26 (74.3%) |
| 45 to 54 Years | 71 (54.6%) | 64 (100.0%) |
| 55 to 64 Years | 50 (86.2%) | 95 (96.9%) |
| 65 to 74 Years | 76 (100.0%) | 51 (100.0%) |
| 75 Years and over | 26 (92.9%) | 28 (93.3%) |
| Total | 433 (83.3%) | 390 (83.7%) |
Income Below Poverty Among Married-Couple Families in Loma Linda
The poverty statistics for married-couple families in Loma Linda show that 3.0% or 7 of the total 234 families live below the poverty line. Families with no children have the highest poverty rate of 4.2%, comprising of 7 families. On the other hand, families with 1 or 2 children have the lowest poverty rate of 0.0%, which includes 0 families.

| Children | Above Poverty | Below Poverty |
| No Children | 159 (95.8%) | 7 (4.2%) |
| 1 or 2 Children | 59 (100.0%) | 0 (0.0%) |
| 3 or 4 Children | 9 (100.0%) | 0 (0.0%) |
| 5 or more Children | 0 (0.0%) | 0 (0.0%) |
| Total | 227 (97.0%) | 7 (3.0%) |
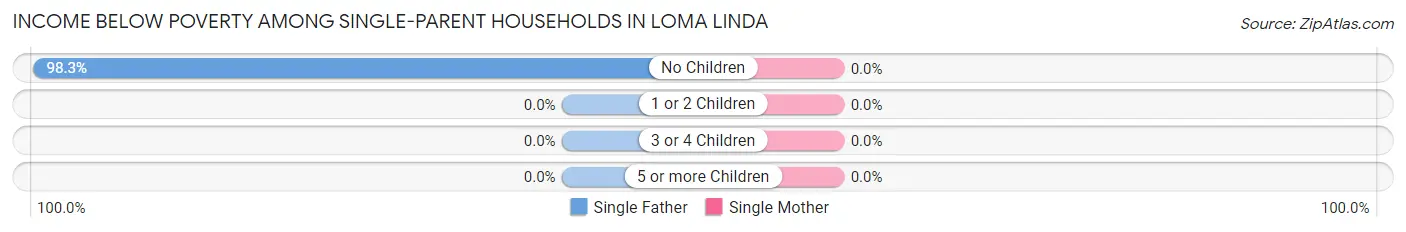
Income Below Poverty Among Single-Parent Households in Loma Linda
| Children | Single Father | Single Mother |
| No Children | 58 (98.3%) | 0 (0.0%) |
| 1 or 2 Children | 0 (0.0%) | 0 (0.0%) |
| 3 or 4 Children | 0 (0.0%) | 0 (0.0%) |
| 5 or more Children | 0 (0.0%) | 0 (0.0%) |
| Total | 58 (87.9%) | 0 (0.0%) |
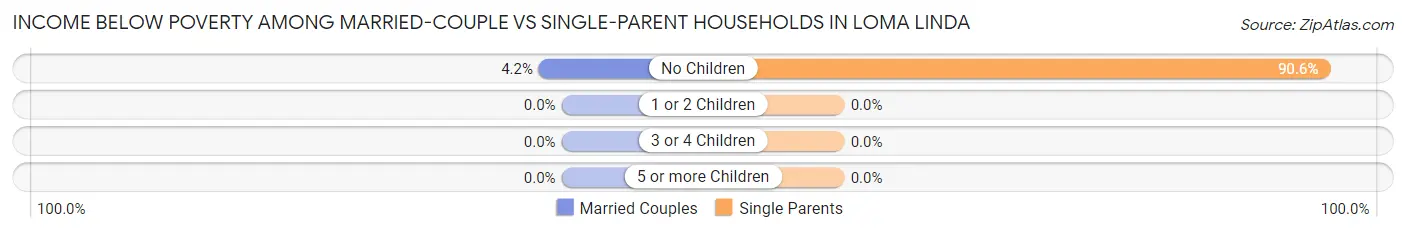
Income Below Poverty Among Married-Couple vs Single-Parent Households in Loma Linda
The poverty data for Loma Linda shows that 7 of the married-couple family households (3.0%) and 58 of the single-parent households (74.4%) are living below the poverty level. Within the married-couple family households, those with no children have the highest poverty rate, with 7 households (4.2%) falling below the poverty line. Among the single-parent households, those with no children have the highest poverty rate, with 58 household (90.6%) living below poverty.
| Children | Married-Couple Families | Single-Parent Households |
| No Children | 7 (4.2%) | 58 (90.6%) |
| 1 or 2 Children | 0 (0.0%) | 0 (0.0%) |
| 3 or 4 Children | 0 (0.0%) | 0 (0.0%) |
| 5 or more Children | 0 (0.0%) | 0 (0.0%) |
| Total | 7 (3.0%) | 58 (74.4%) |
Employment Characteristics in Loma Linda
Employment by Class of Employer in Loma Linda
Among the 531 employed individuals in Loma Linda, private company employees (282 | 53.1%), self-employed (not incorporated) (93 | 17.5%), and not-for-profit organizations (64 | 12.0%) make up the most common classes of employment.
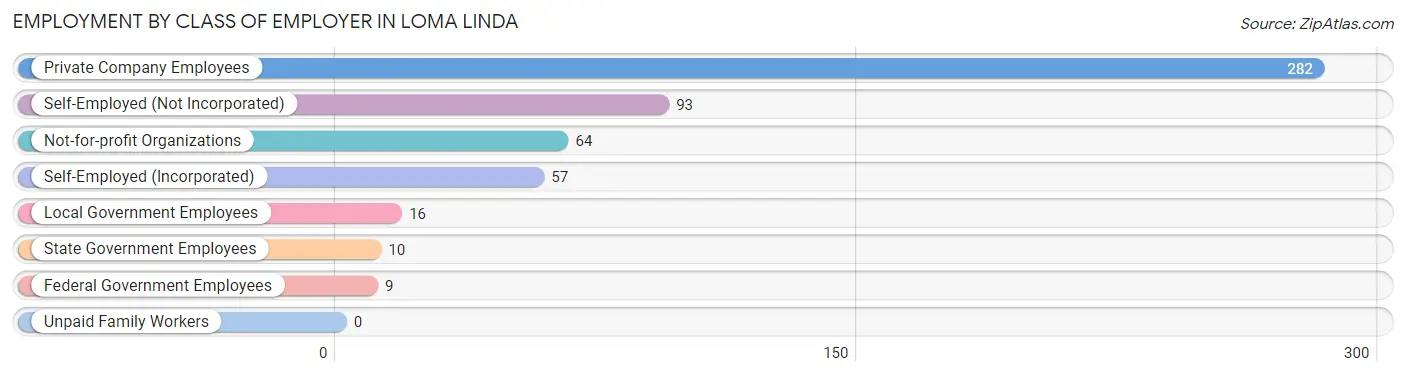
| Employer Class | # Employees | % Employees |
| Private Company Employees | 282 | 53.1% |
| Self-Employed (Incorporated) | 57 | 10.7% |
| Self-Employed (Not Incorporated) | 93 | 17.5% |
| Not-for-profit Organizations | 64 | 12.0% |
| Local Government Employees | 16 | 3.0% |
| State Government Employees | 10 | 1.9% |
| Federal Government Employees | 9 | 1.7% |
| Unpaid Family Workers | 0 | 0.0% |
| Total | 531 | 100.0% |
Employment Status by Age in Loma Linda
According to the labor force statistics for Loma Linda, out of the total population over 16 years of age (839), 66.4% or 557 individuals are in the labor force, with 2.7% or 15 of them unemployed. The age group with the highest labor force participation rate is 45 to 54 years, with 94.3% or 183 individuals in the labor force. Within the labor force, the 20 to 24 years age range has the highest percentage of unemployed individuals, with 20.0% or 6 of them being unemployed.
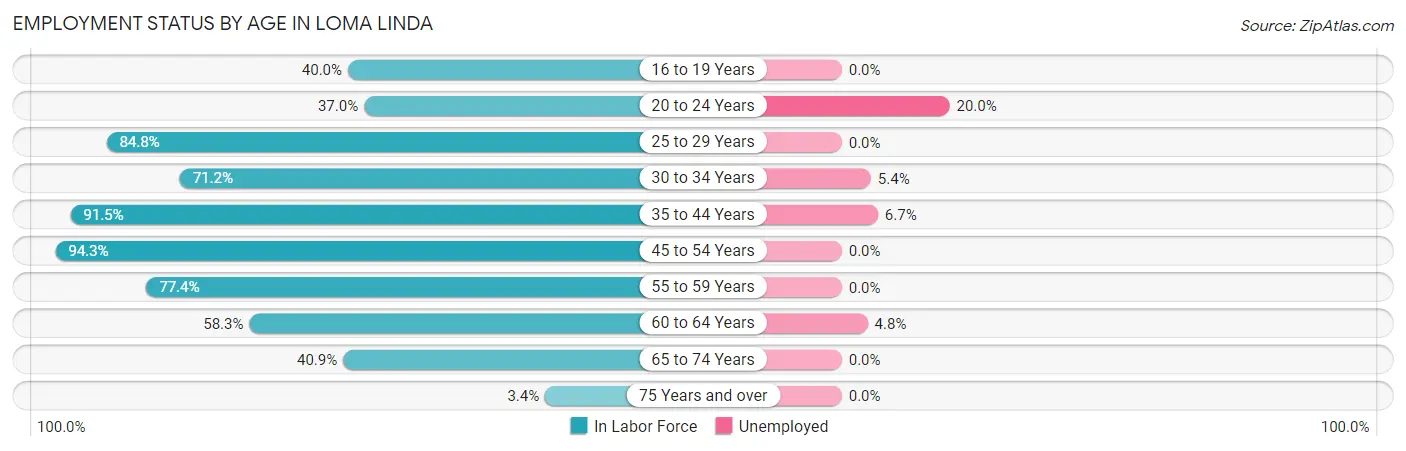
| Age Bracket | In Labor Force | Unemployed |
| 16 to 19 Years | 4 (40.0%) | 0 (0.0%) |
| 20 to 24 Years | 30 (37.0%) | 6 (20.0%) |
| 25 to 29 Years | 67 (84.8%) | 0 (0.0%) |
| 30 to 34 Years | 37 (71.2%) | 2 (5.4%) |
| 35 to 44 Years | 75 (91.5%) | 5 (6.7%) |
| 45 to 54 Years | 183 (94.3%) | 0 (0.0%) |
| 55 to 59 Years | 65 (77.4%) | 0 (0.0%) |
| 60 to 64 Years | 42 (58.3%) | 2 (4.8%) |
| 65 to 74 Years | 52 (40.9%) | 0 (0.0%) |
| 75 Years and over | 2 (3.4%) | 0 (0.0%) |
| Total | 557 (66.4%) | 15 (2.7%) |
Employment Status by Educational Attainment in Loma Linda
According to labor force statistics for Loma Linda, 83.3% of individuals (469) out of the total population between 25 and 64 years of age (563) are in the labor force, with 1.9% or 9 of them being unemployed. The group with the highest labor force participation rate are those with the educational attainment of high school diploma, with 95.5% or 169 individuals in the labor force. Within the labor force, individuals with college / associate degree education have the highest percentage of unemployment, with 3.5% or 5 of them being unemployed.
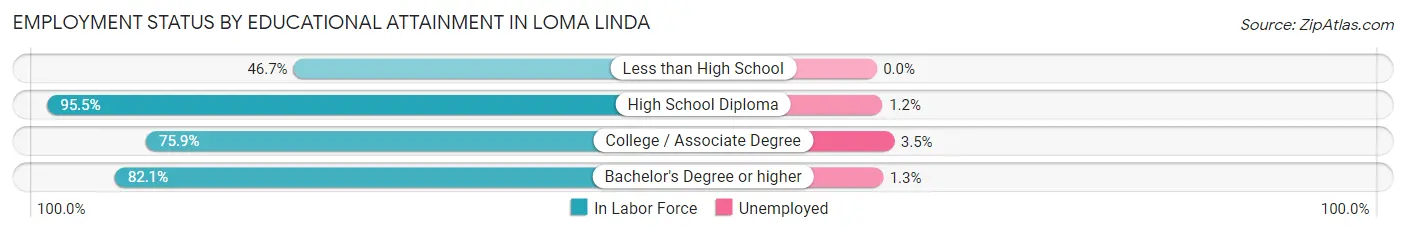
| Educational Attainment | In Labor Force | Unemployed |
| Less than High School | 7 (46.7%) | 0 (0.0%) |
| High School Diploma | 169 (95.5%) | 2 (1.2%) |
| College / Associate Degree | 142 (75.9%) | 7 (3.5%) |
| Bachelor's Degree or higher | 151 (82.1%) | 2 (1.3%) |
| Total | 469 (83.3%) | 11 (1.9%) |
Employment Occupations by Sex in Loma Linda
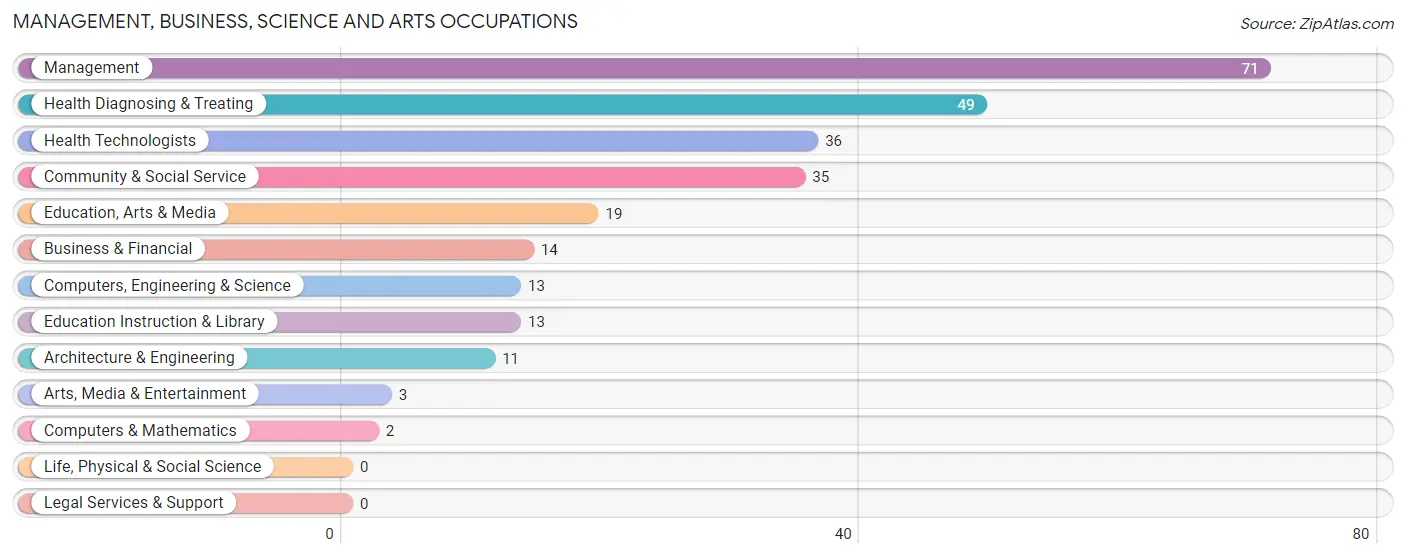
Management, Business, Science and Arts Occupations
The most common Management, Business, Science and Arts occupations in Loma Linda are Management (71 | 13.1%), Health Diagnosing & Treating (49 | 9.0%), Health Technologists (36 | 6.6%), Community & Social Service (35 | 6.5%), and Education, Arts & Media (19 | 3.5%).
Management, Business, Science and Arts Occupations by Sex
Within the Management, Business, Science and Arts occupations in Loma Linda, the most male-oriented occupations are Computers, Engineering & Science (100.0%), Computers & Mathematics (100.0%), and Architecture & Engineering (100.0%), while the most female-oriented occupations are Business & Financial (71.4%), Education Instruction & Library (61.5%), and Health Diagnosing & Treating (61.2%).
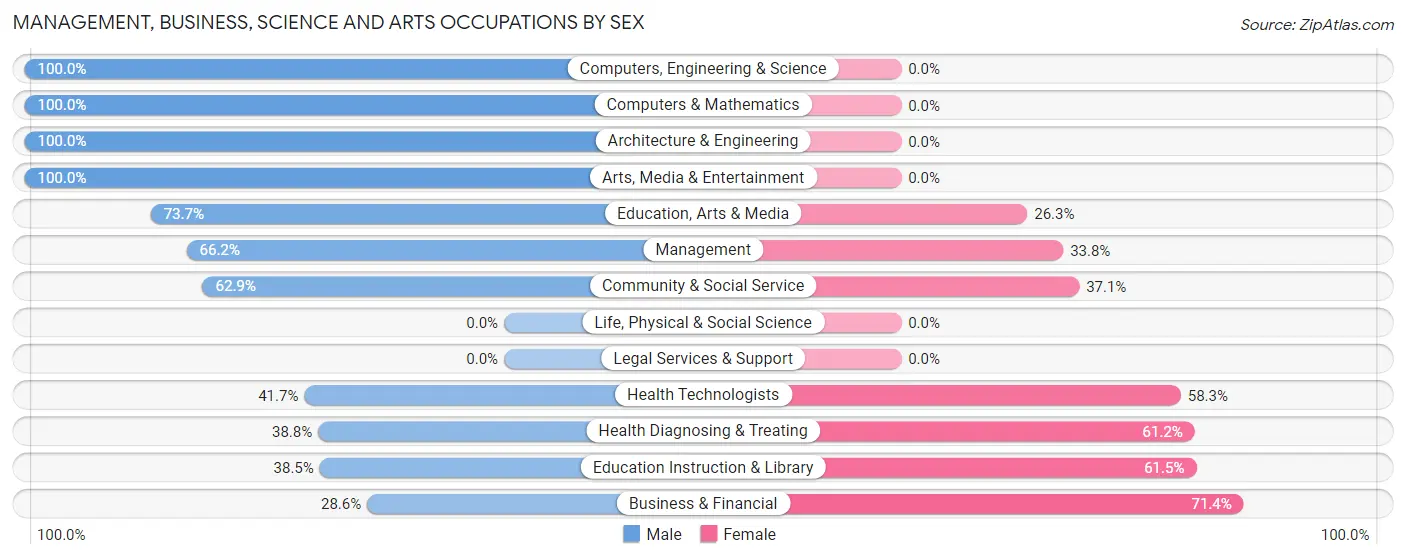
| Occupation | Male | Female |
| Management | 47 (66.2%) | 24 (33.8%) |
| Business & Financial | 4 (28.6%) | 10 (71.4%) |
| Computers, Engineering & Science | 13 (100.0%) | 0 (0.0%) |
| Computers & Mathematics | 2 (100.0%) | 0 (0.0%) |
| Architecture & Engineering | 11 (100.0%) | 0 (0.0%) |
| Life, Physical & Social Science | 0 (0.0%) | 0 (0.0%) |
| Community & Social Service | 22 (62.9%) | 13 (37.1%) |
| Education, Arts & Media | 14 (73.7%) | 5 (26.3%) |
| Legal Services & Support | 0 (0.0%) | 0 (0.0%) |
| Education Instruction & Library | 5 (38.5%) | 8 (61.5%) |
| Arts, Media & Entertainment | 3 (100.0%) | 0 (0.0%) |
| Health Diagnosing & Treating | 19 (38.8%) | 30 (61.2%) |
| Health Technologists | 15 (41.7%) | 21 (58.3%) |
| Total (Category) | 105 (57.7%) | 77 (42.3%) |
| Total (Overall) | 313 (57.8%) | 229 (42.2%) |
Services Occupations
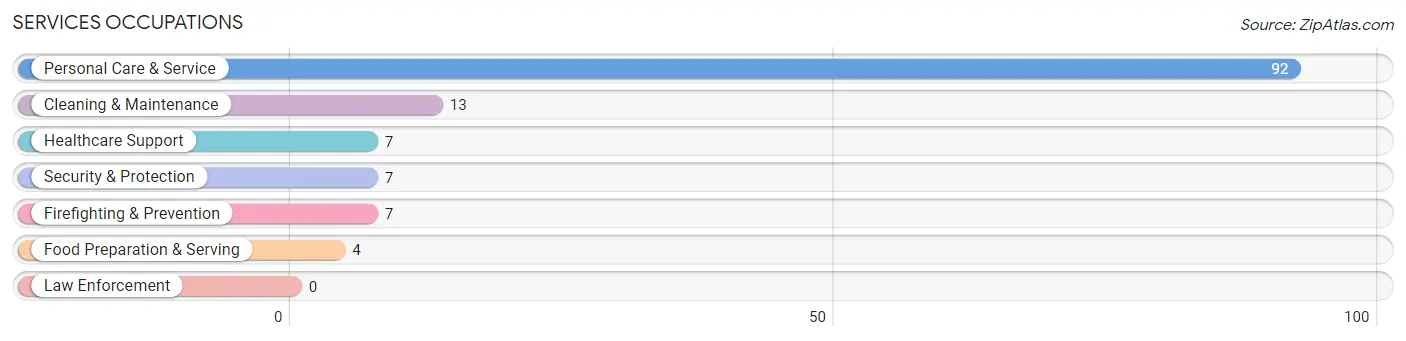
The most common Services occupations in Loma Linda are Personal Care & Service (92 | 17.0%), Cleaning & Maintenance (13 | 2.4%), Healthcare Support (7 | 1.3%), Security & Protection (7 | 1.3%), and Firefighting & Prevention (7 | 1.3%).
Services Occupations by Sex
Within the Services occupations in Loma Linda, the most male-oriented occupations are Cleaning & Maintenance (76.9%), Personal Care & Service (69.6%), and Healthcare Support (28.6%), while the most female-oriented occupations are Security & Protection (85.7%), Firefighting & Prevention (85.7%), and Food Preparation & Serving (75.0%).
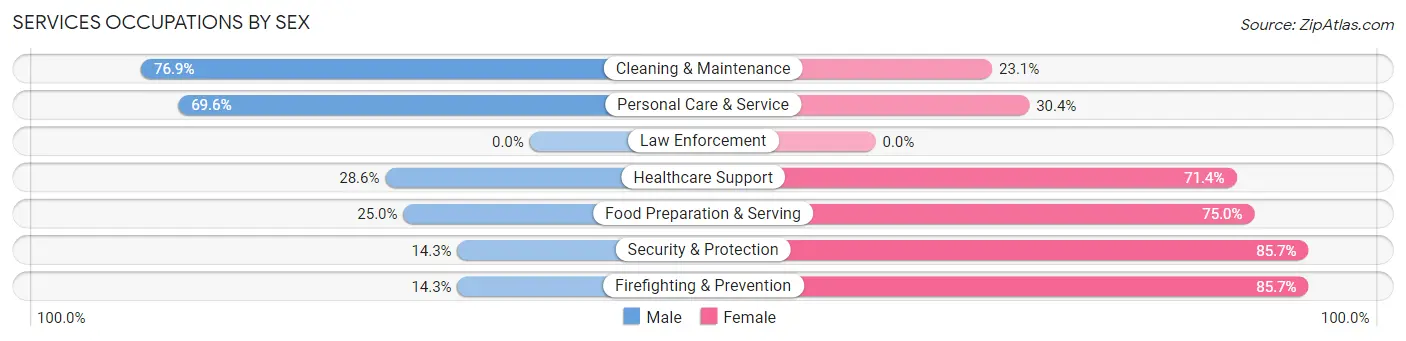
| Occupation | Male | Female |
| Healthcare Support | 2 (28.6%) | 5 (71.4%) |
| Security & Protection | 1 (14.3%) | 6 (85.7%) |
| Firefighting & Prevention | 1 (14.3%) | 6 (85.7%) |
| Law Enforcement | 0 (0.0%) | 0 (0.0%) |
| Food Preparation & Serving | 1 (25.0%) | 3 (75.0%) |
| Cleaning & Maintenance | 10 (76.9%) | 3 (23.1%) |
| Personal Care & Service | 64 (69.6%) | 28 (30.4%) |
| Total (Category) | 78 (63.4%) | 45 (36.6%) |
| Total (Overall) | 313 (57.8%) | 229 (42.2%) |
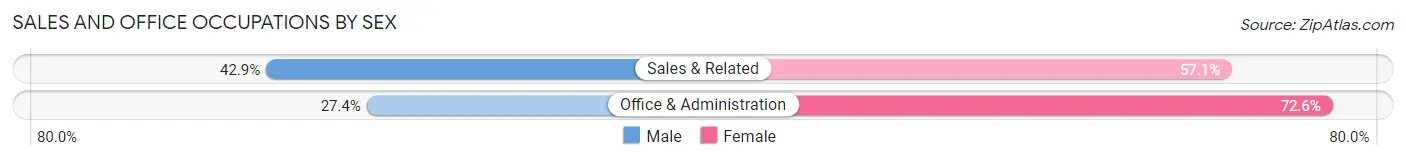
Sales and Office Occupations
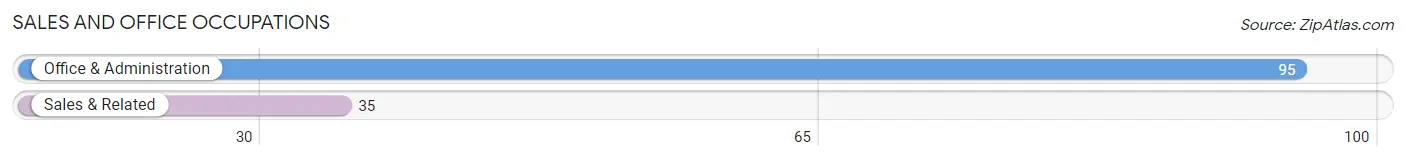
The most common Sales and Office occupations in Loma Linda are Office & Administration (95 | 17.5%), and Sales & Related (35 | 6.5%).
Sales and Office Occupations by Sex
| Occupation | Male | Female |
| Sales & Related | 15 (42.9%) | 20 (57.1%) |
| Office & Administration | 26 (27.4%) | 69 (72.6%) |
| Total (Category) | 41 (31.5%) | 89 (68.5%) |
| Total (Overall) | 313 (57.8%) | 229 (42.2%) |
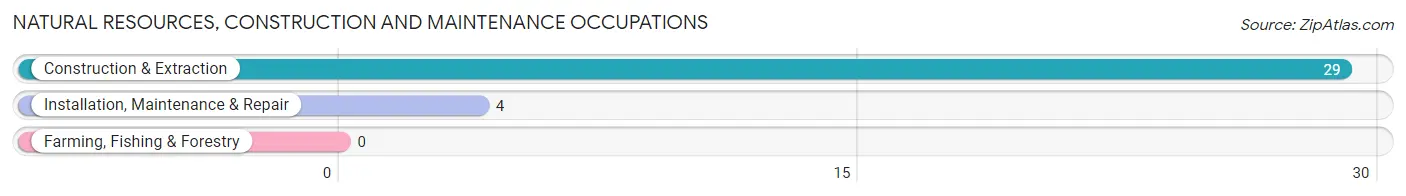
Natural Resources, Construction and Maintenance Occupations
The most common Natural Resources, Construction and Maintenance occupations in Loma Linda are Construction & Extraction (29 | 5.3%), and Installation, Maintenance & Repair (4 | 0.7%).
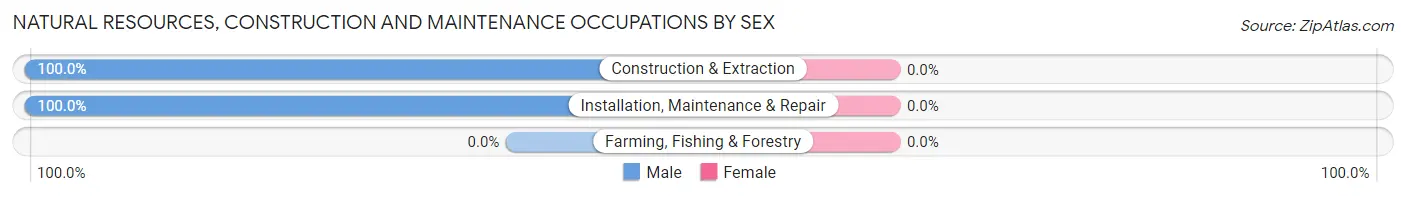
Natural Resources, Construction and Maintenance Occupations by Sex
| Occupation | Male | Female |
| Farming, Fishing & Forestry | 0 (0.0%) | 0 (0.0%) |
| Construction & Extraction | 29 (100.0%) | 0 (0.0%) |
| Installation, Maintenance & Repair | 4 (100.0%) | 0 (0.0%) |
| Total (Category) | 33 (100.0%) | 0 (0.0%) |
| Total (Overall) | 313 (57.8%) | 229 (42.2%) |
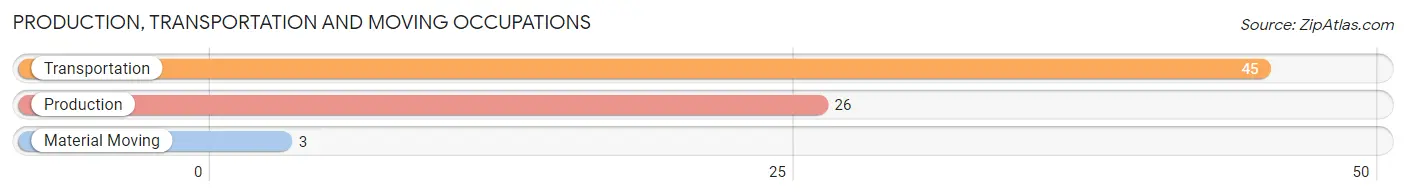
Production, Transportation and Moving Occupations
The most common Production, Transportation and Moving occupations in Loma Linda are Transportation (45 | 8.3%), Production (26 | 4.8%), and Material Moving (3 | 0.5%).
Production, Transportation and Moving Occupations by Sex
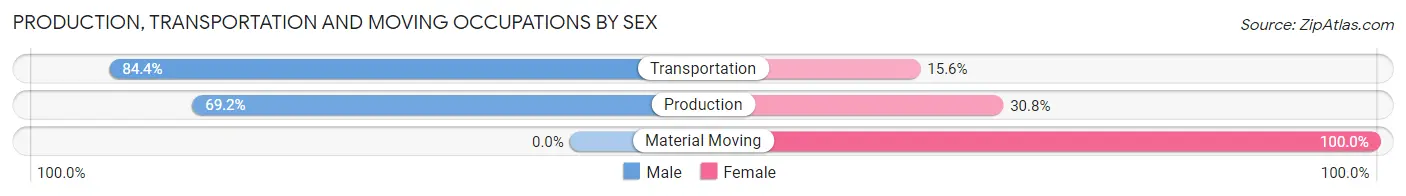
| Occupation | Male | Female |
| Production | 18 (69.2%) | 8 (30.8%) |
| Transportation | 38 (84.4%) | 7 (15.6%) |
| Material Moving | 0 (0.0%) | 3 (100.0%) |
| Total (Category) | 56 (75.7%) | 18 (24.3%) |
| Total (Overall) | 313 (57.8%) | 229 (42.2%) |
Employment Industries by Sex in Loma Linda
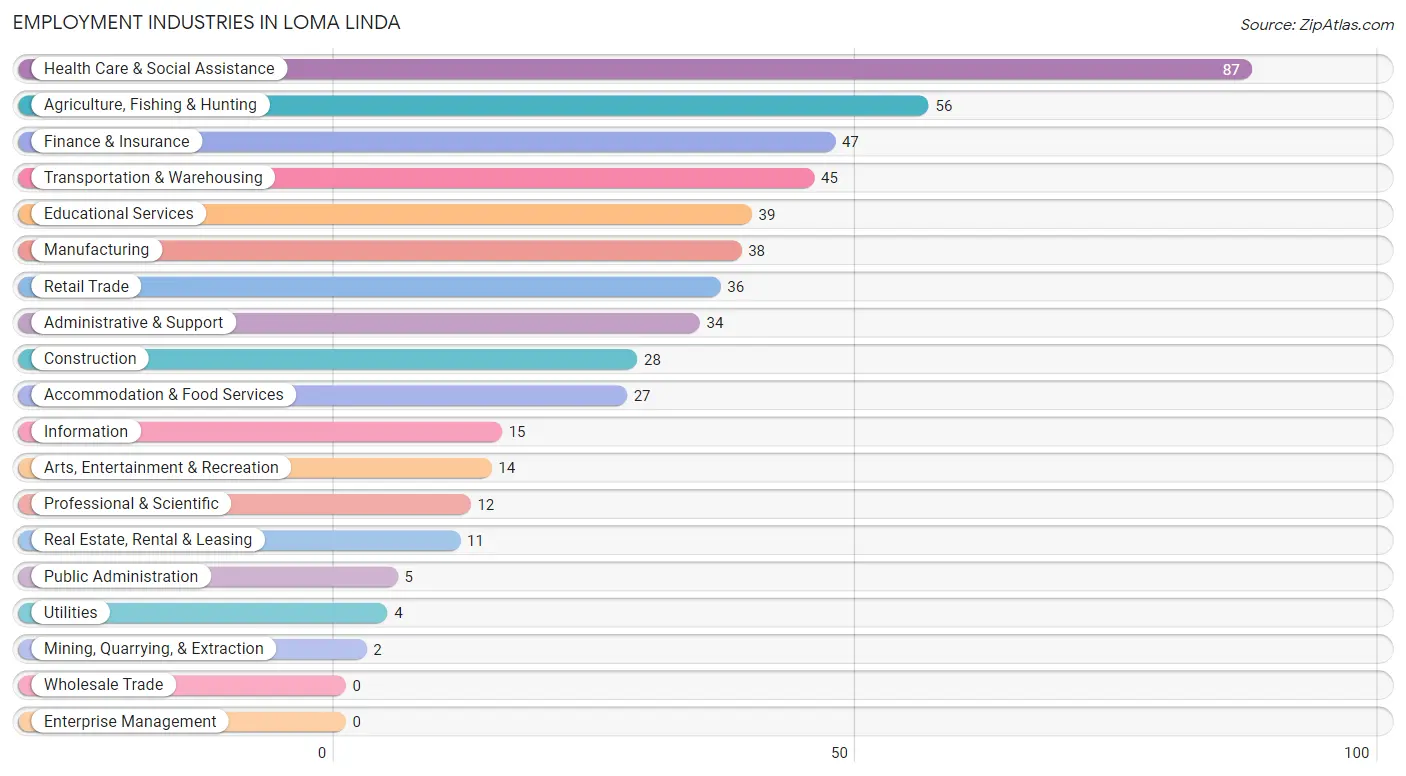
Employment Industries in Loma Linda
The major employment industries in Loma Linda include Health Care & Social Assistance (87 | 16.1%), Agriculture, Fishing & Hunting (56 | 10.3%), Finance & Insurance (47 | 8.7%), Transportation & Warehousing (45 | 8.3%), and Educational Services (39 | 7.2%).
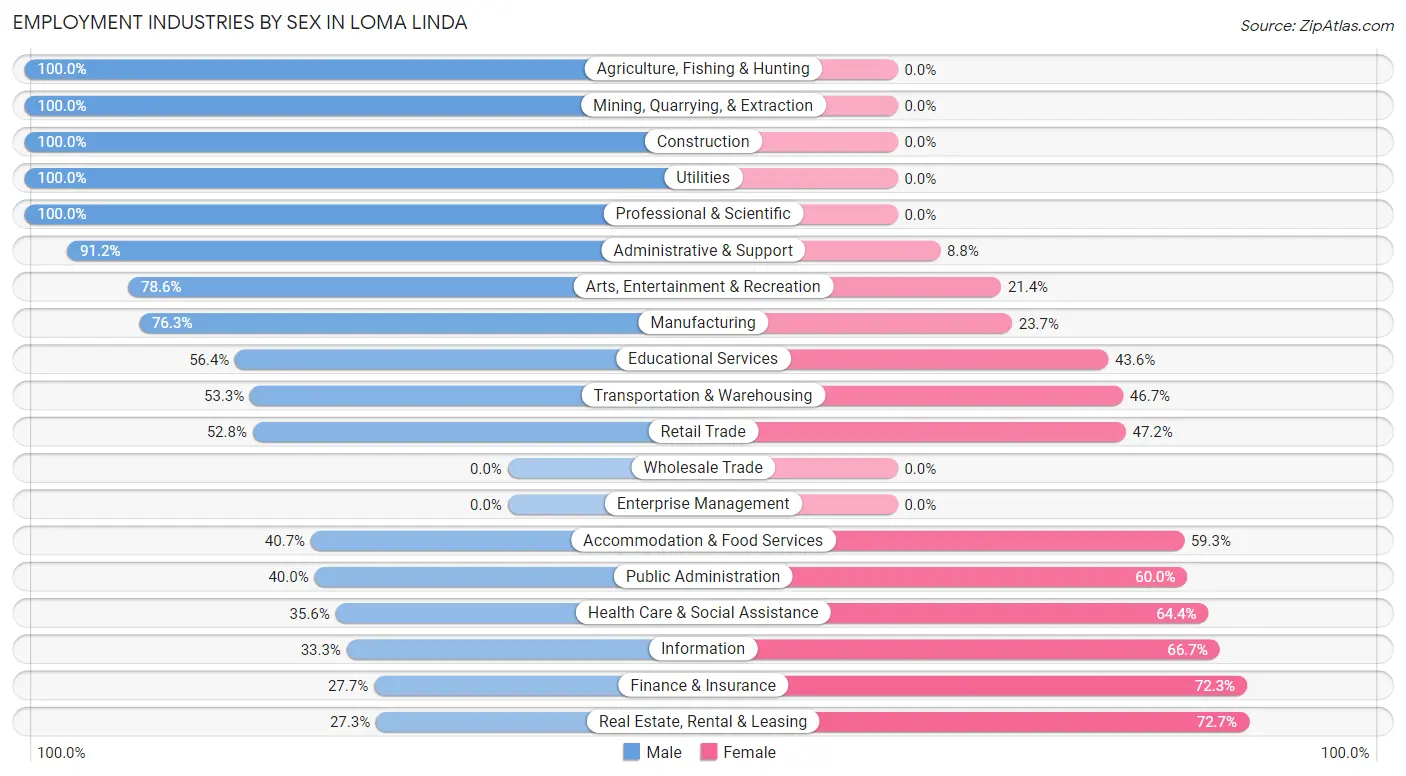
Employment Industries by Sex in Loma Linda
The Loma Linda industries that see more men than women are Agriculture, Fishing & Hunting (100.0%), Mining, Quarrying, & Extraction (100.0%), and Construction (100.0%), whereas the industries that tend to have a higher number of women are Real Estate, Rental & Leasing (72.7%), Finance & Insurance (72.3%), and Information (66.7%).
| Industry | Male | Female |
| Agriculture, Fishing & Hunting | 56 (100.0%) | 0 (0.0%) |
| Mining, Quarrying, & Extraction | 2 (100.0%) | 0 (0.0%) |
| Construction | 28 (100.0%) | 0 (0.0%) |
| Manufacturing | 29 (76.3%) | 9 (23.7%) |
| Wholesale Trade | 0 (0.0%) | 0 (0.0%) |
| Retail Trade | 19 (52.8%) | 17 (47.2%) |
| Transportation & Warehousing | 24 (53.3%) | 21 (46.7%) |
| Utilities | 4 (100.0%) | 0 (0.0%) |
| Information | 5 (33.3%) | 10 (66.7%) |
| Finance & Insurance | 13 (27.7%) | 34 (72.3%) |
| Real Estate, Rental & Leasing | 3 (27.3%) | 8 (72.7%) |
| Professional & Scientific | 12 (100.0%) | 0 (0.0%) |
| Enterprise Management | 0 (0.0%) | 0 (0.0%) |
| Administrative & Support | 31 (91.2%) | 3 (8.8%) |
| Educational Services | 22 (56.4%) | 17 (43.6%) |
| Health Care & Social Assistance | 31 (35.6%) | 56 (64.4%) |
| Arts, Entertainment & Recreation | 11 (78.6%) | 3 (21.4%) |
| Accommodation & Food Services | 11 (40.7%) | 16 (59.3%) |
| Public Administration | 2 (40.0%) | 3 (60.0%) |
| Total | 313 (57.8%) | 229 (42.2%) |
Education in Loma Linda
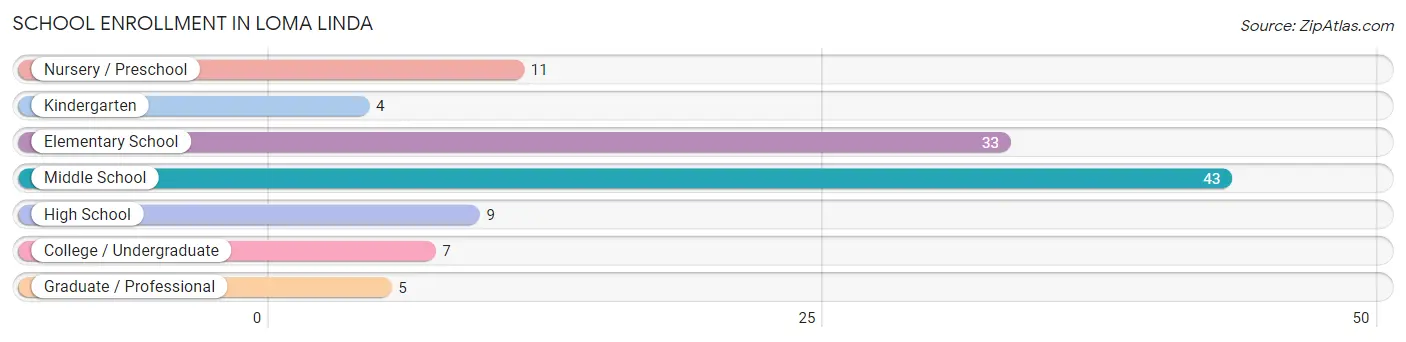
School Enrollment in Loma Linda
The most common levels of schooling among the 112 students in Loma Linda are middle school (43 | 38.4%), elementary school (33 | 29.5%), and nursery / preschool (11 | 9.8%).
| School Level | # Students | % Students |
| Nursery / Preschool | 11 | 9.8% |
| Kindergarten | 4 | 3.6% |
| Elementary School | 33 | 29.5% |
| Middle School | 43 | 38.4% |
| High School | 9 | 8.0% |
| College / Undergraduate | 7 | 6.2% |
| Graduate / Professional | 5 | 4.5% |
| Total | 112 | 100.0% |
School Enrollment by Age by Funding Source in Loma Linda
Out of a total of 112 students who are enrolled in schools in Loma Linda, 41 (36.6%) attend a private institution, while the remaining 71 (63.4%) are enrolled in public schools. The age group of 3 to 4 year olds has the highest likelihood of being enrolled in private schools, with 5 (55.6% in the age bracket) enrolled. Conversely, the age group of 15 to 17 year olds has the lowest likelihood of being enrolled in a private school, with 6 (100.0% in the age bracket) attending a public institution.
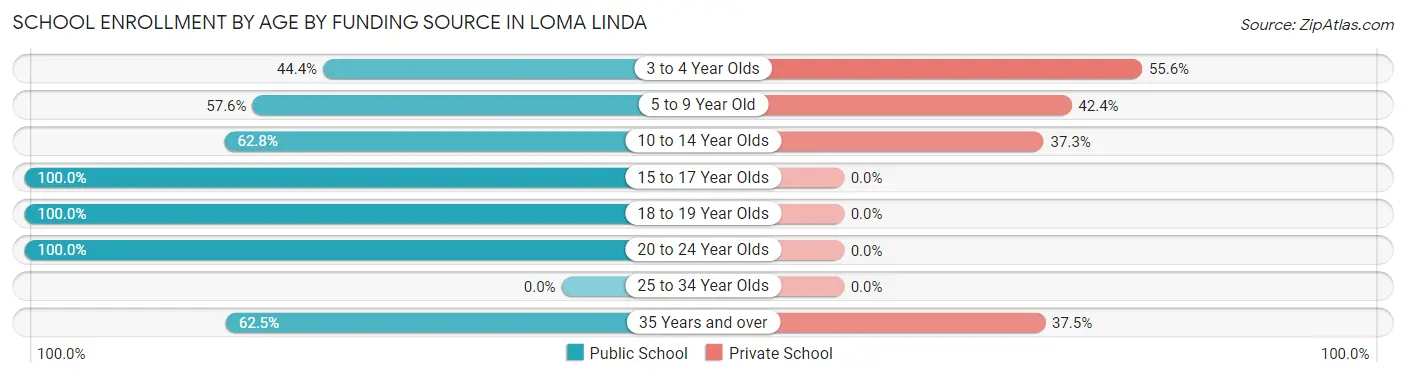
| Age Bracket | Public School | Private School |
| 3 to 4 Year Olds | 4 (44.4%) | 5 (55.6%) |
| 5 to 9 Year Old | 19 (57.6%) | 14 (42.4%) |
| 10 to 14 Year Olds | 32 (62.7%) | 19 (37.2%) |
| 15 to 17 Year Olds | 6 (100.0%) | 0 (0.0%) |
| 18 to 19 Year Olds | 1 (100.0%) | 0 (0.0%) |
| 20 to 24 Year Olds | 4 (100.0%) | 0 (0.0%) |
| 25 to 34 Year Olds | 0 (0.0%) | 0 (0.0%) |
| 35 Years and over | 5 (62.5%) | 3 (37.5%) |
| Total | 71 (63.4%) | 41 (36.6%) |
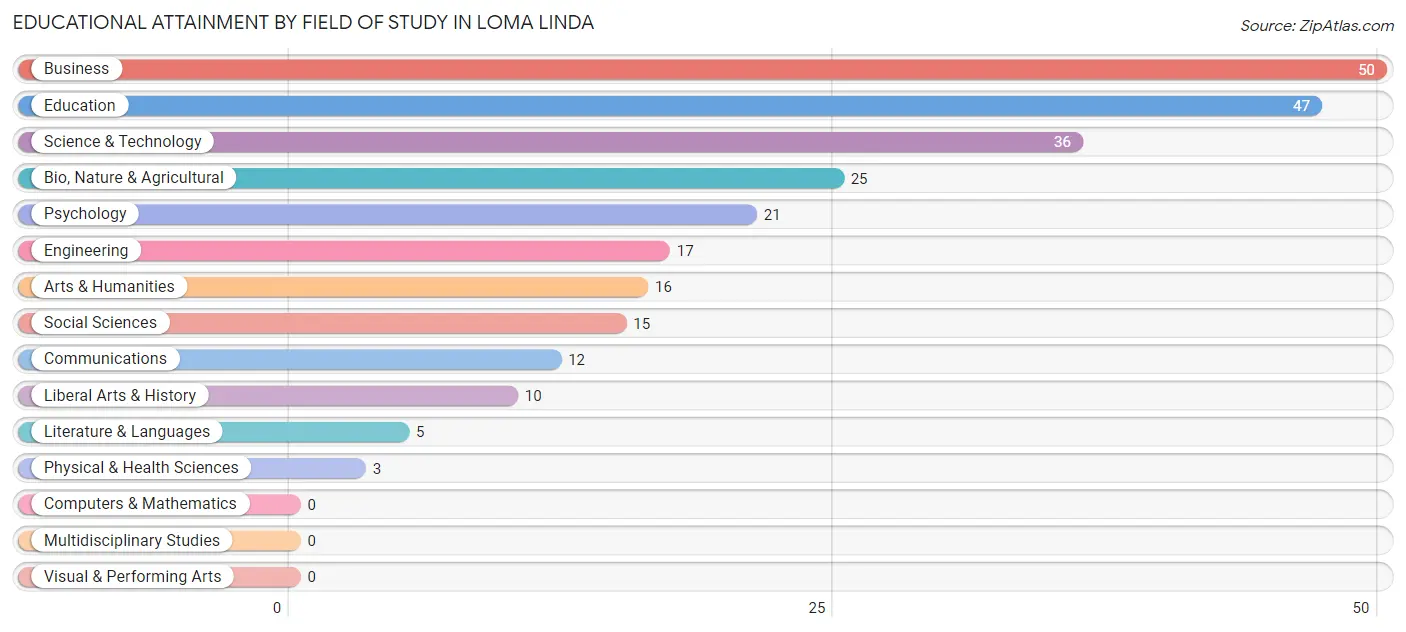
Educational Attainment by Field of Study in Loma Linda
Business (50 | 19.5%), education (47 | 18.3%), science & technology (36 | 14.0%), bio, nature & agricultural (25 | 9.7%), and psychology (21 | 8.2%) are the most common fields of study among 257 individuals in Loma Linda who have obtained a bachelor's degree or higher.
| Field of Study | # Graduates | % Graduates |
| Computers & Mathematics | 0 | 0.0% |
| Bio, Nature & Agricultural | 25 | 9.7% |
| Physical & Health Sciences | 3 | 1.2% |
| Psychology | 21 | 8.2% |
| Social Sciences | 15 | 5.8% |
| Engineering | 17 | 6.6% |
| Multidisciplinary Studies | 0 | 0.0% |
| Science & Technology | 36 | 14.0% |
| Business | 50 | 19.5% |
| Education | 47 | 18.3% |
| Literature & Languages | 5 | 1.9% |
| Liberal Arts & History | 10 | 3.9% |
| Visual & Performing Arts | 0 | 0.0% |
| Communications | 12 | 4.7% |
| Arts & Humanities | 16 | 6.2% |
| Total | 257 | 100.0% |
Transportation & Commute in Loma Linda
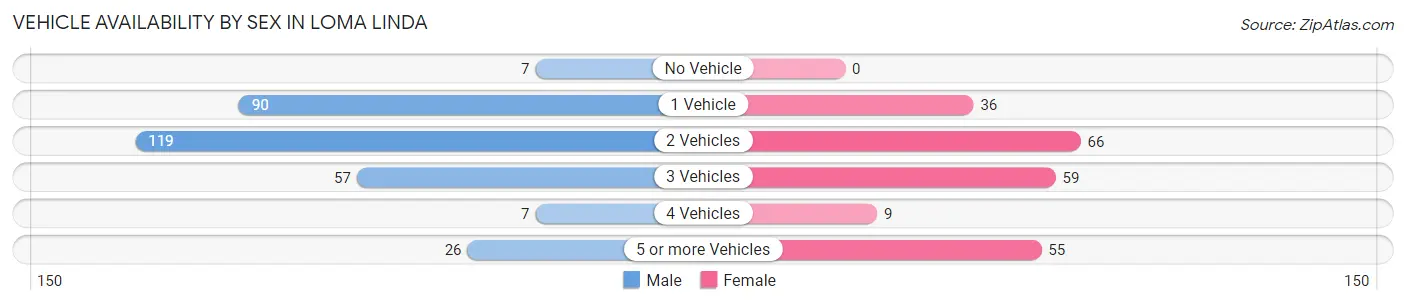
Vehicle Availability by Sex in Loma Linda
The most prevalent vehicle ownership categories in Loma Linda are males with 2 vehicles (119, accounting for 38.9%) and females with 2 vehicles (66, making up 52.9%).
| Vehicles Available | Male | Female |
| No Vehicle | 7 (2.3%) | 0 (0.0%) |
| 1 Vehicle | 90 (29.4%) | 36 (16.0%) |
| 2 Vehicles | 119 (38.9%) | 66 (29.3%) |
| 3 Vehicles | 57 (18.6%) | 59 (26.2%) |
| 4 Vehicles | 7 (2.3%) | 9 (4.0%) |
| 5 or more Vehicles | 26 (8.5%) | 55 (24.4%) |
| Total | 306 (100.0%) | 225 (100.0%) |
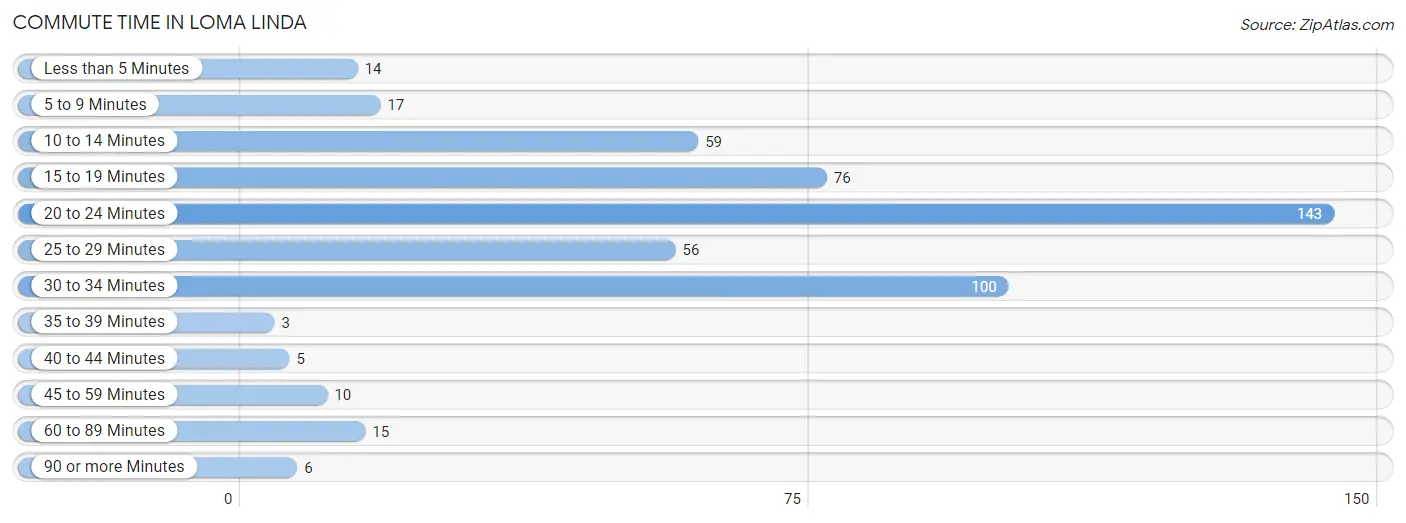
Commute Time in Loma Linda
The most frequently occuring commute durations in Loma Linda are 20 to 24 minutes (143 commuters, 28.4%), 30 to 34 minutes (100 commuters, 19.8%), and 15 to 19 minutes (76 commuters, 15.1%).
| Commute Time | # Commuters | % Commuters |
| Less than 5 Minutes | 14 | 2.8% |
| 5 to 9 Minutes | 17 | 3.4% |
| 10 to 14 Minutes | 59 | 11.7% |
| 15 to 19 Minutes | 76 | 15.1% |
| 20 to 24 Minutes | 143 | 28.4% |
| 25 to 29 Minutes | 56 | 11.1% |
| 30 to 34 Minutes | 100 | 19.8% |
| 35 to 39 Minutes | 3 | 0.6% |
| 40 to 44 Minutes | 5 | 1.0% |
| 45 to 59 Minutes | 10 | 2.0% |
| 60 to 89 Minutes | 15 | 3.0% |
| 90 or more Minutes | 6 | 1.2% |
Commute Time by Sex in Loma Linda
The most common commute times in Loma Linda are 30 to 34 minutes (86 commuters, 30.3%) for males and 20 to 24 minutes (94 commuters, 42.7%) for females.
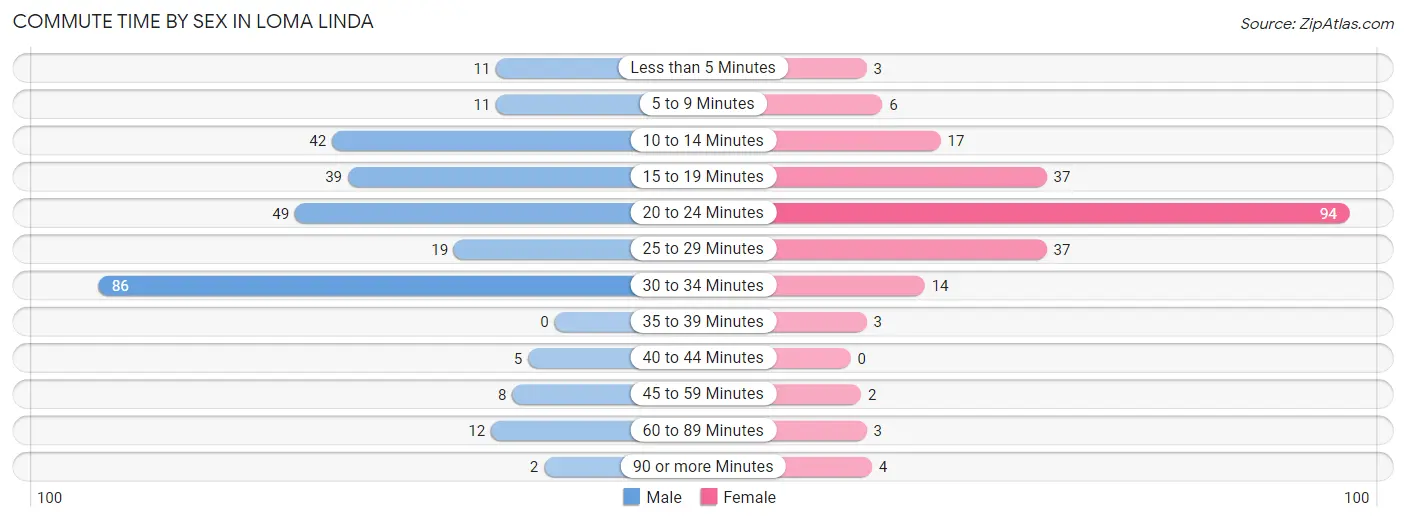
| Commute Time | Male | Female |
| Less than 5 Minutes | 11 (3.9%) | 3 (1.4%) |
| 5 to 9 Minutes | 11 (3.9%) | 6 (2.7%) |
| 10 to 14 Minutes | 42 (14.8%) | 17 (7.7%) |
| 15 to 19 Minutes | 39 (13.7%) | 37 (16.8%) |
| 20 to 24 Minutes | 49 (17.2%) | 94 (42.7%) |
| 25 to 29 Minutes | 19 (6.7%) | 37 (16.8%) |
| 30 to 34 Minutes | 86 (30.3%) | 14 (6.4%) |
| 35 to 39 Minutes | 0 (0.0%) | 3 (1.4%) |
| 40 to 44 Minutes | 5 (1.8%) | 0 (0.0%) |
| 45 to 59 Minutes | 8 (2.8%) | 2 (0.9%) |
| 60 to 89 Minutes | 12 (4.2%) | 3 (1.4%) |
| 90 or more Minutes | 2 (0.7%) | 4 (1.8%) |
Time of Departure to Work by Sex in Loma Linda
The most frequent times of departure to work in Loma Linda are 8:00 AM to 8:29 AM (74, 26.1%) for males and 4:00 PM to 11:59 PM (46, 20.9%) for females.
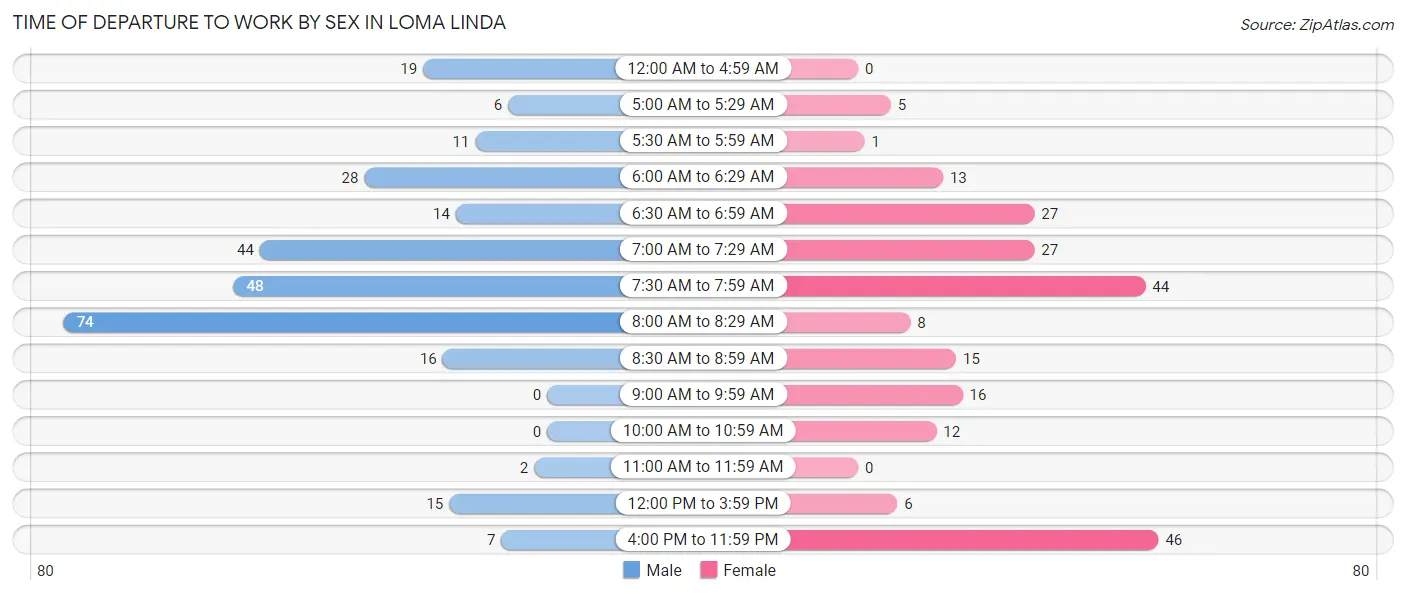
| Time of Departure | Male | Female |
| 12:00 AM to 4:59 AM | 19 (6.7%) | 0 (0.0%) |
| 5:00 AM to 5:29 AM | 6 (2.1%) | 5 (2.3%) |
| 5:30 AM to 5:59 AM | 11 (3.9%) | 1 (0.4%) |
| 6:00 AM to 6:29 AM | 28 (9.9%) | 13 (5.9%) |
| 6:30 AM to 6:59 AM | 14 (4.9%) | 27 (12.3%) |
| 7:00 AM to 7:29 AM | 44 (15.5%) | 27 (12.3%) |
| 7:30 AM to 7:59 AM | 48 (16.9%) | 44 (20.0%) |
| 8:00 AM to 8:29 AM | 74 (26.1%) | 8 (3.6%) |
| 8:30 AM to 8:59 AM | 16 (5.6%) | 15 (6.8%) |
| 9:00 AM to 9:59 AM | 0 (0.0%) | 16 (7.3%) |
| 10:00 AM to 10:59 AM | 0 (0.0%) | 12 (5.4%) |
| 11:00 AM to 11:59 AM | 2 (0.7%) | 0 (0.0%) |
| 12:00 PM to 3:59 PM | 15 (5.3%) | 6 (2.7%) |
| 4:00 PM to 11:59 PM | 7 (2.5%) | 46 (20.9%) |
| Total | 284 (100.0%) | 220 (100.0%) |
Housing Occupancy in Loma Linda
Occupancy by Ownership in Loma Linda
Of the total 433 dwellings in Loma Linda, owner-occupied units account for 347 (80.1%), while renter-occupied units make up 86 (19.9%).
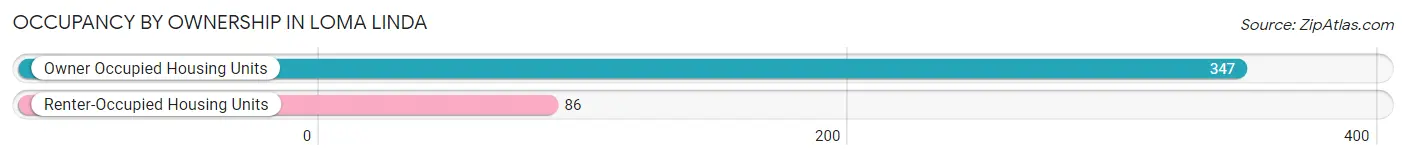
| Occupancy | # Housing Units | % Housing Units |
| Owner Occupied Housing Units | 347 | 80.1% |
| Renter-Occupied Housing Units | 86 | 19.9% |
| Total Occupied Housing Units | 433 | 100.0% |
Occupancy by Household Size in Loma Linda
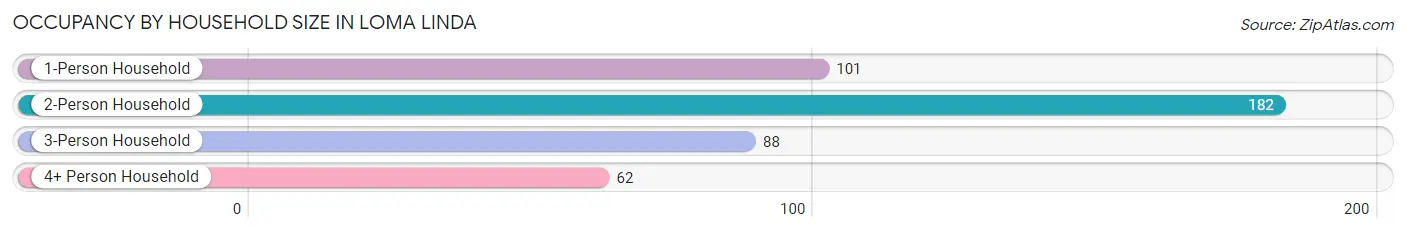
| Household Size | # Housing Units | % Housing Units |
| 1-Person Household | 101 | 23.3% |
| 2-Person Household | 182 | 42.0% |
| 3-Person Household | 88 | 20.3% |
| 4+ Person Household | 62 | 14.3% |
| Total Housing Units | 433 | 100.0% |
Occupancy by Ownership by Household Size in Loma Linda
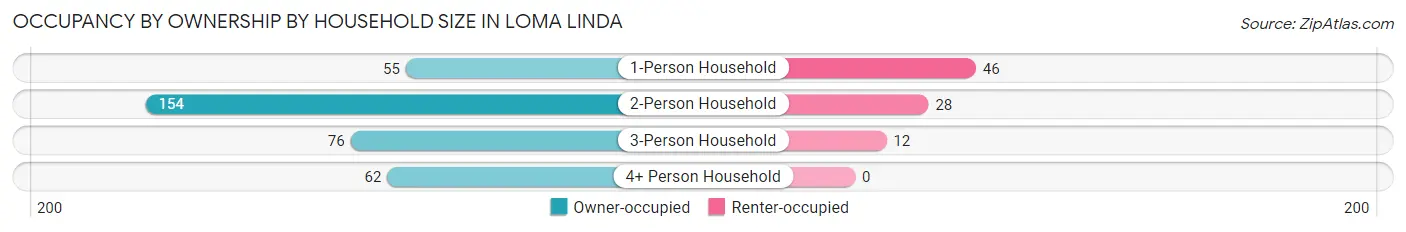
| Household Size | Owner-occupied | Renter-occupied |
| 1-Person Household | 55 (54.5%) | 46 (45.5%) |
| 2-Person Household | 154 (84.6%) | 28 (15.4%) |
| 3-Person Household | 76 (86.4%) | 12 (13.6%) |
| 4+ Person Household | 62 (100.0%) | 0 (0.0%) |
| Total Housing Units | 347 (80.1%) | 86 (19.9%) |
Occupancy by Educational Attainment in Loma Linda
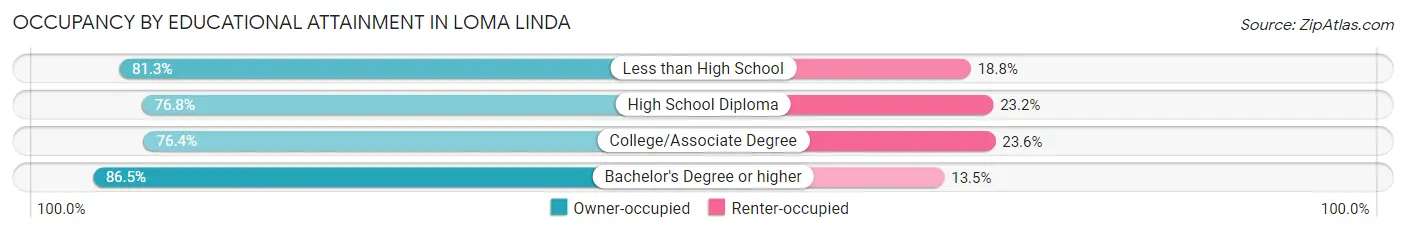
| Household Size | Owner-occupied | Renter-occupied |
| Less than High School | 13 (81.2%) | 3 (18.8%) |
| High School Diploma | 96 (76.8%) | 29 (23.2%) |
| College/Associate Degree | 110 (76.4%) | 34 (23.6%) |
| Bachelor's Degree or higher | 128 (86.5%) | 20 (13.5%) |
Occupancy by Age of Householder in Loma Linda
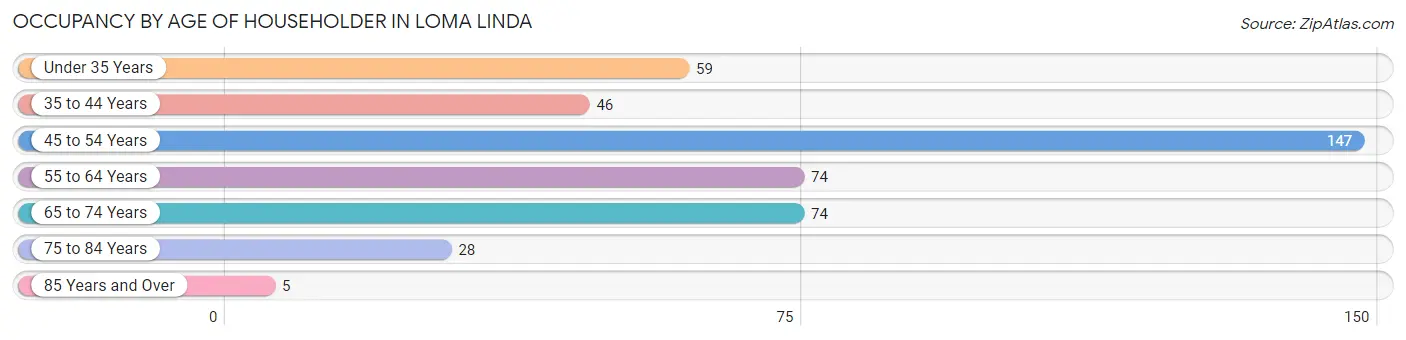
| Age Bracket | # Households | % Households |
| Under 35 Years | 59 | 13.6% |
| 35 to 44 Years | 46 | 10.6% |
| 45 to 54 Years | 147 | 34.0% |
| 55 to 64 Years | 74 | 17.1% |
| 65 to 74 Years | 74 | 17.1% |
| 75 to 84 Years | 28 | 6.5% |
| 85 Years and Over | 5 | 1.1% |
| Total | 433 | 100.0% |
Housing Finances in Loma Linda
Median Income by Occupancy in Loma Linda
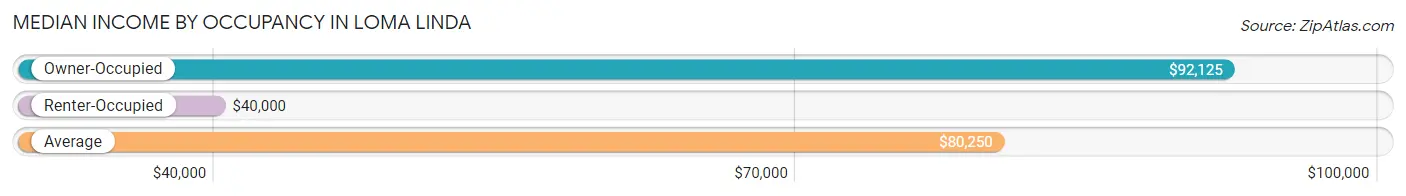
| Occupancy Type | # Households | Median Income |
| Owner-Occupied | 347 (80.1%) | $92,125 |
| Renter-Occupied | 86 (19.9%) | $40,000 |
| Average | 433 (100.0%) | $80,250 |
Occupancy by Householder Income Bracket in Loma Linda
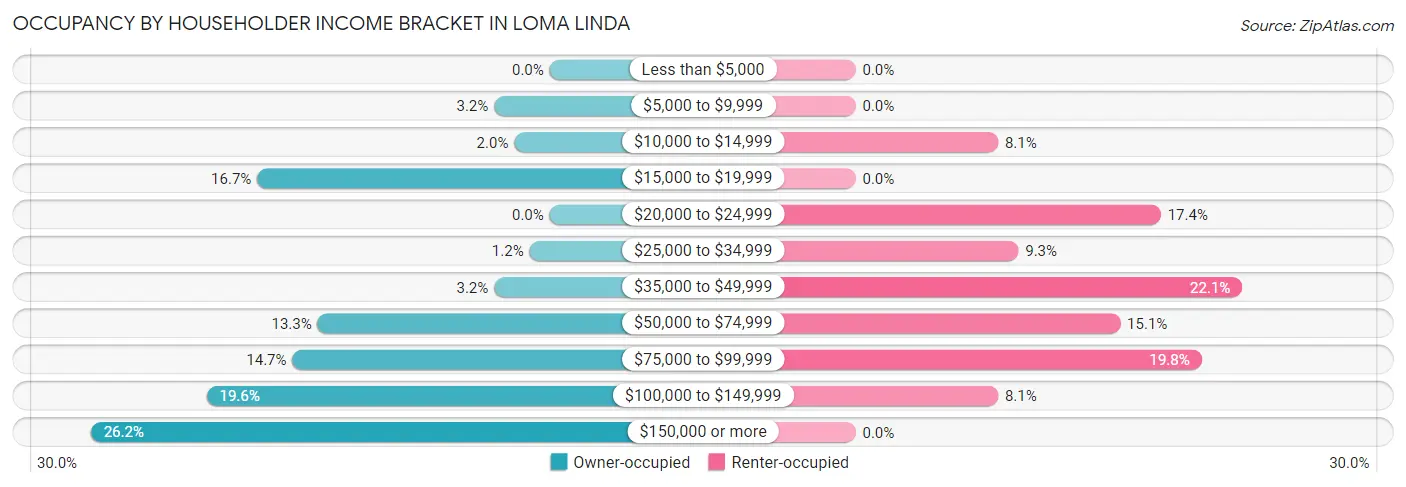
| Income Bracket | Owner-occupied | Renter-occupied |
| Less than $5,000 | 0 (0.0%) | 0 (0.0%) |
| $5,000 to $9,999 | 11 (3.2%) | 0 (0.0%) |
| $10,000 to $14,999 | 7 (2.0%) | 7 (8.1%) |
| $15,000 to $19,999 | 58 (16.7%) | 0 (0.0%) |
| $20,000 to $24,999 | 0 (0.0%) | 15 (17.4%) |
| $25,000 to $34,999 | 4 (1.1%) | 8 (9.3%) |
| $35,000 to $49,999 | 11 (3.2%) | 19 (22.1%) |
| $50,000 to $74,999 | 46 (13.3%) | 13 (15.1%) |
| $75,000 to $99,999 | 51 (14.7%) | 17 (19.8%) |
| $100,000 to $149,999 | 68 (19.6%) | 7 (8.1%) |
| $150,000 or more | 91 (26.2%) | 0 (0.0%) |
| Total | 347 (100.0%) | 86 (100.0%) |
Monthly Housing Cost Tiers in Loma Linda
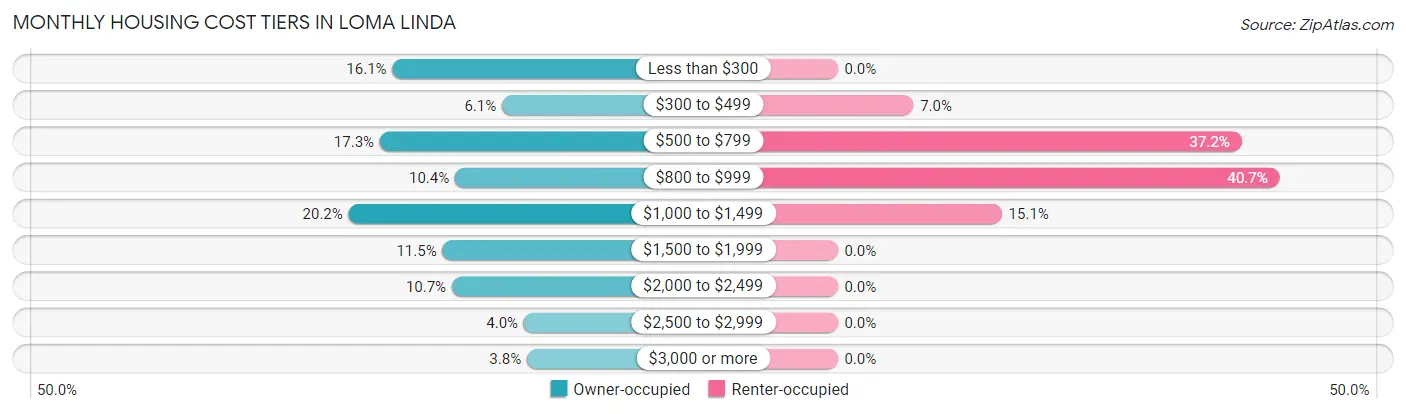
| Monthly Cost | Owner-occupied | Renter-occupied |
| Less than $300 | 56 (16.1%) | 0 (0.0%) |
| $300 to $499 | 21 (6.0%) | 6 (7.0%) |
| $500 to $799 | 60 (17.3%) | 32 (37.2%) |
| $800 to $999 | 36 (10.4%) | 35 (40.7%) |
| $1,000 to $1,499 | 70 (20.2%) | 13 (15.1%) |
| $1,500 to $1,999 | 40 (11.5%) | 0 (0.0%) |
| $2,000 to $2,499 | 37 (10.7%) | 0 (0.0%) |
| $2,500 to $2,999 | 14 (4.0%) | 0 (0.0%) |
| $3,000 or more | 13 (3.7%) | 0 (0.0%) |
| Total | 347 (100.0%) | 86 (100.0%) |
Physical Housing Characteristics in Loma Linda
Housing Structures in Loma Linda
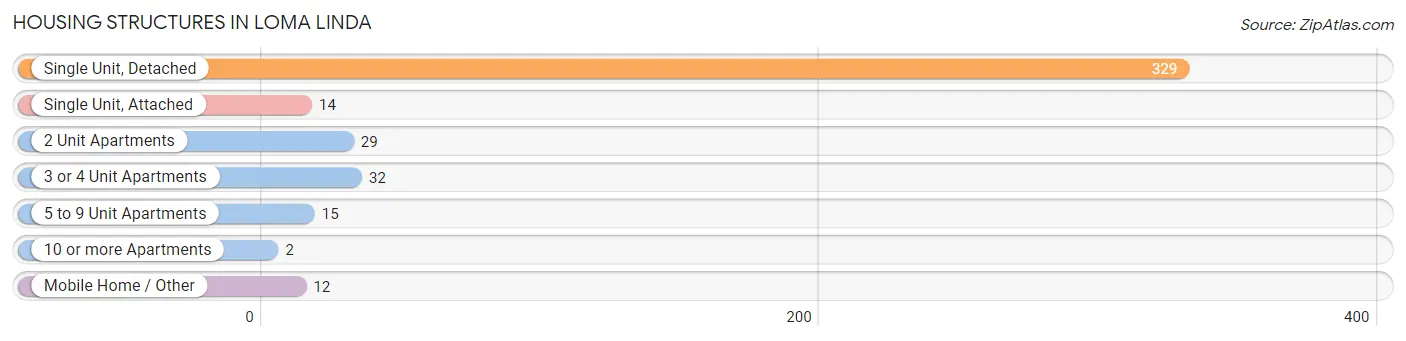
| Structure Type | # Housing Units | % Housing Units |
| Single Unit, Detached | 329 | 76.0% |
| Single Unit, Attached | 14 | 3.2% |
| 2 Unit Apartments | 29 | 6.7% |
| 3 or 4 Unit Apartments | 32 | 7.4% |
| 5 to 9 Unit Apartments | 15 | 3.5% |
| 10 or more Apartments | 2 | 0.5% |
| Mobile Home / Other | 12 | 2.8% |
| Total | 433 | 100.0% |
Housing Structures by Occupancy in Loma Linda
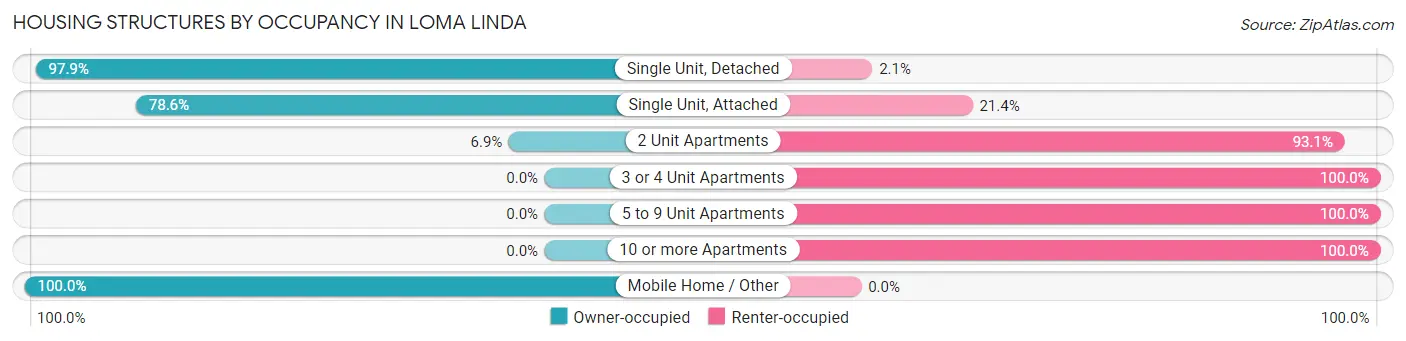
| Structure Type | Owner-occupied | Renter-occupied |
| Single Unit, Detached | 322 (97.9%) | 7 (2.1%) |
| Single Unit, Attached | 11 (78.6%) | 3 (21.4%) |
| 2 Unit Apartments | 2 (6.9%) | 27 (93.1%) |
| 3 or 4 Unit Apartments | 0 (0.0%) | 32 (100.0%) |
| 5 to 9 Unit Apartments | 0 (0.0%) | 15 (100.0%) |
| 10 or more Apartments | 0 (0.0%) | 2 (100.0%) |
| Mobile Home / Other | 12 (100.0%) | 0 (0.0%) |
| Total | 347 (80.1%) | 86 (19.9%) |
Housing Structures by Number of Rooms in Loma Linda
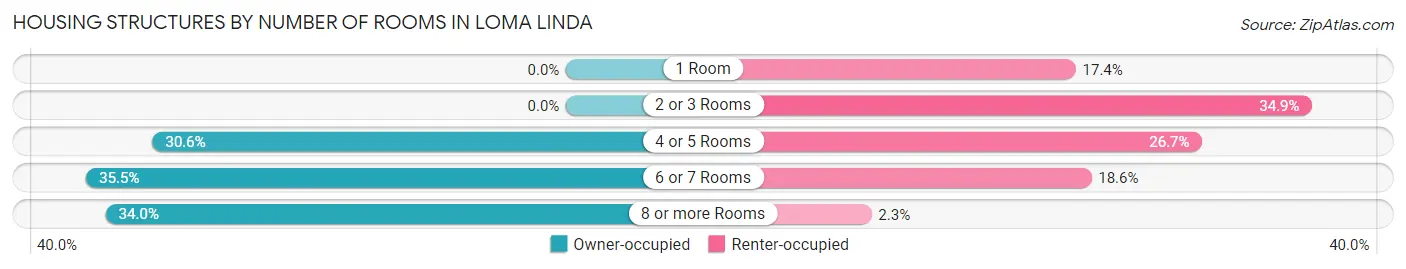
| Number of Rooms | Owner-occupied | Renter-occupied |
| 1 Room | 0 (0.0%) | 15 (17.4%) |
| 2 or 3 Rooms | 0 (0.0%) | 30 (34.9%) |
| 4 or 5 Rooms | 106 (30.5%) | 23 (26.7%) |
| 6 or 7 Rooms | 123 (35.4%) | 16 (18.6%) |
| 8 or more Rooms | 118 (34.0%) | 2 (2.3%) |
| Total | 347 (100.0%) | 86 (100.0%) |
Housing Structure by Heating Type in Loma Linda
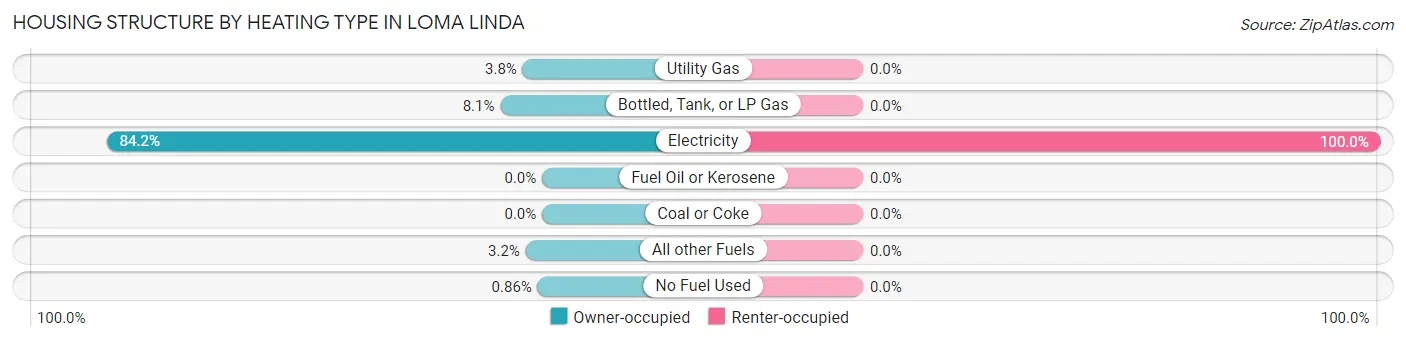
| Heating Type | Owner-occupied | Renter-occupied |
| Utility Gas | 13 (3.7%) | 0 (0.0%) |
| Bottled, Tank, or LP Gas | 28 (8.1%) | 0 (0.0%) |
| Electricity | 292 (84.2%) | 86 (100.0%) |
| Fuel Oil or Kerosene | 0 (0.0%) | 0 (0.0%) |
| Coal or Coke | 0 (0.0%) | 0 (0.0%) |
| All other Fuels | 11 (3.2%) | 0 (0.0%) |
| No Fuel Used | 3 (0.9%) | 0 (0.0%) |
| Total | 347 (100.0%) | 86 (100.0%) |
Household Vehicle Usage in Loma Linda
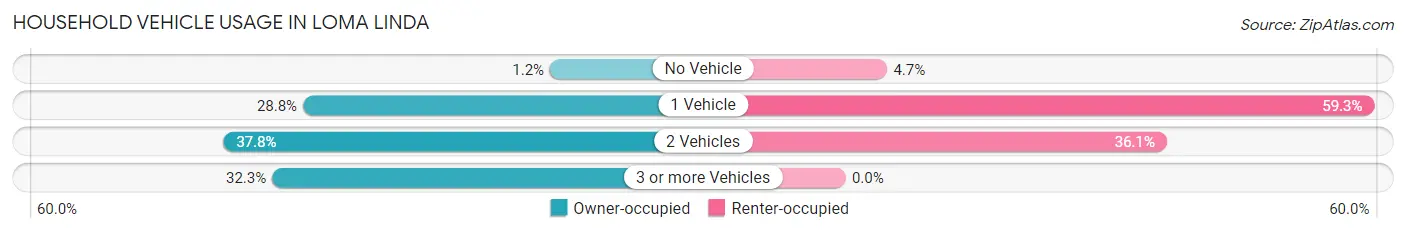
| Vehicles per Household | Owner-occupied | Renter-occupied |
| No Vehicle | 4 (1.1%) | 4 (4.6%) |
| 1 Vehicle | 100 (28.8%) | 51 (59.3%) |
| 2 Vehicles | 131 (37.8%) | 31 (36.0%) |
| 3 or more Vehicles | 112 (32.3%) | 0 (0.0%) |
| Total | 347 (100.0%) | 86 (100.0%) |
Real Estate & Mortgages in Loma Linda
Real Estate and Mortgage Overview in Loma Linda
| Characteristic | Without Mortgage | With Mortgage |
| Housing Units | 181 | 166 |
| Median Property Value | $205,800 | $248,000 |
| Median Household Income | $88,942 | $54 |
| Monthly Housing Costs | $606 | $13 |
| Real Estate Taxes | $1,547 | $0 |
Property Value by Mortgage Status in Loma Linda
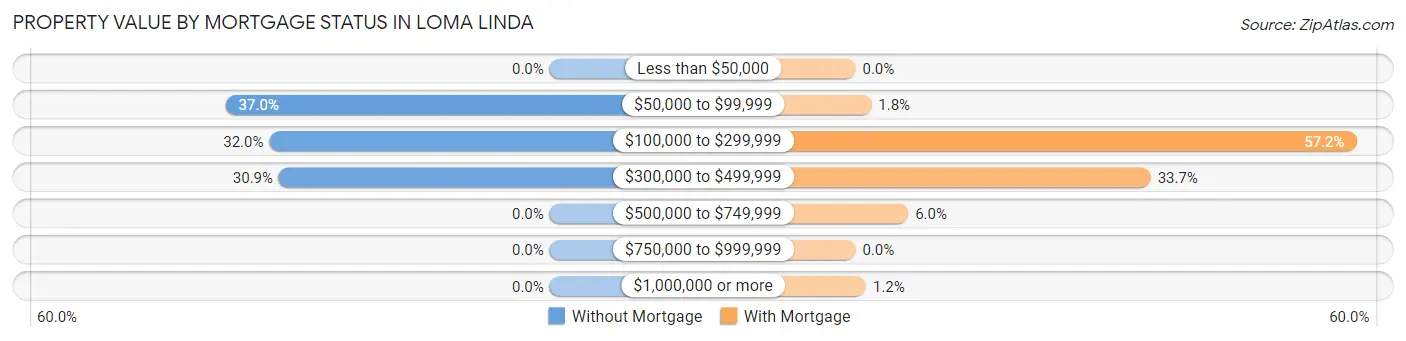
| Property Value | Without Mortgage | With Mortgage |
| Less than $50,000 | 0 (0.0%) | 0 (0.0%) |
| $50,000 to $99,999 | 67 (37.0%) | 3 (1.8%) |
| $100,000 to $299,999 | 58 (32.0%) | 95 (57.2%) |
| $300,000 to $499,999 | 56 (30.9%) | 56 (33.7%) |
| $500,000 to $749,999 | 0 (0.0%) | 10 (6.0%) |
| $750,000 to $999,999 | 0 (0.0%) | 0 (0.0%) |
| $1,000,000 or more | 0 (0.0%) | 2 (1.2%) |
| Total | 181 (100.0%) | 166 (100.0%) |
Household Income by Mortgage Status in Loma Linda
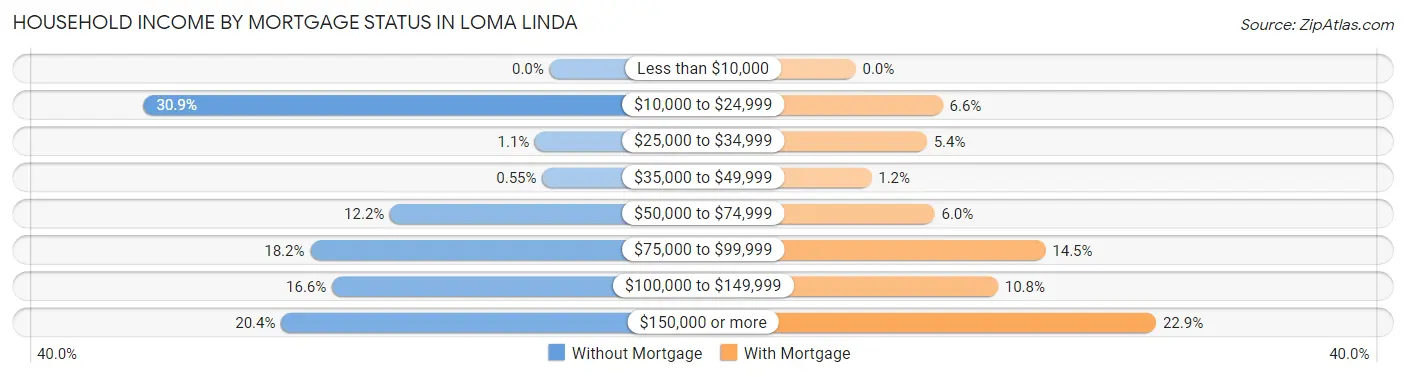
| Household Income | Without Mortgage | With Mortgage |
| Less than $10,000 | 0 (0.0%) | 0 (0.0%) |
| $10,000 to $24,999 | 56 (30.9%) | 11 (6.6%) |
| $25,000 to $34,999 | 2 (1.1%) | 9 (5.4%) |
| $35,000 to $49,999 | 1 (0.5%) | 2 (1.2%) |
| $50,000 to $74,999 | 22 (12.1%) | 10 (6.0%) |
| $75,000 to $99,999 | 33 (18.2%) | 24 (14.5%) |
| $100,000 to $149,999 | 30 (16.6%) | 18 (10.8%) |
| $150,000 or more | 37 (20.4%) | 38 (22.9%) |
| Total | 181 (100.0%) | 166 (100.0%) |
Property Value to Household Income Ratio in Loma Linda
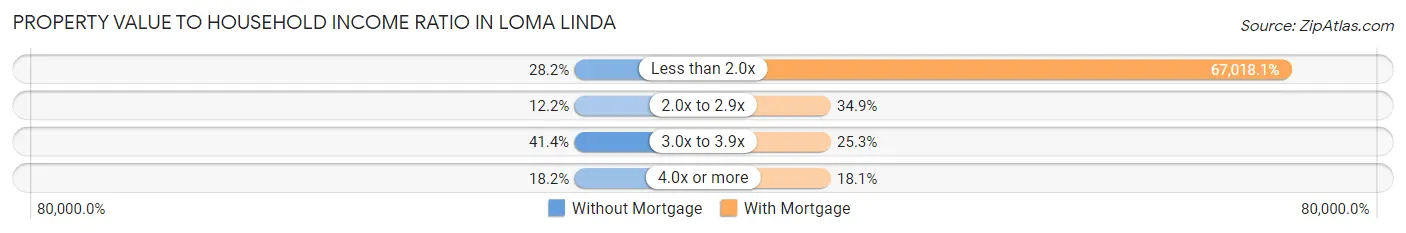
| Value-to-Income Ratio | Without Mortgage | With Mortgage |
| Less than 2.0x | 51 (28.2%) | 111,250 (67,018.1%) |
| 2.0x to 2.9x | 22 (12.1%) | 58 (34.9%) |
| 3.0x to 3.9x | 75 (41.4%) | 42 (25.3%) |
| 4.0x or more | 33 (18.2%) | 30 (18.1%) |
| Total | 181 (100.0%) | 166 (100.0%) |
Real Estate Taxes by Mortgage Status in Loma Linda
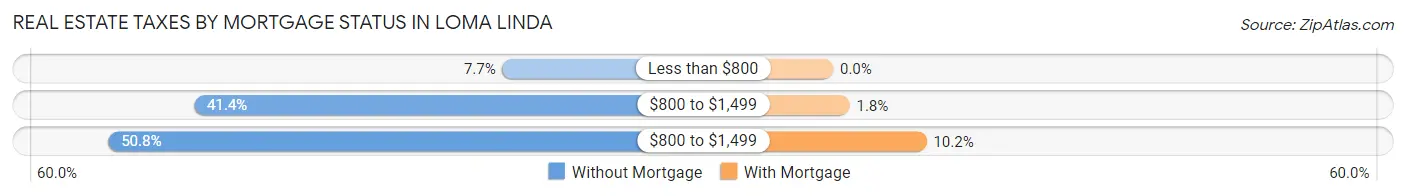
| Property Taxes | Without Mortgage | With Mortgage |
| Less than $800 | 14 (7.7%) | 0 (0.0%) |
| $800 to $1,499 | 75 (41.4%) | 3 (1.8%) |
| $800 to $1,499 | 92 (50.8%) | 17 (10.2%) |
| Total | 181 (100.0%) | 166 (100.0%) |
Health & Disability in Loma Linda
Health Insurance Coverage by Age in Loma Linda
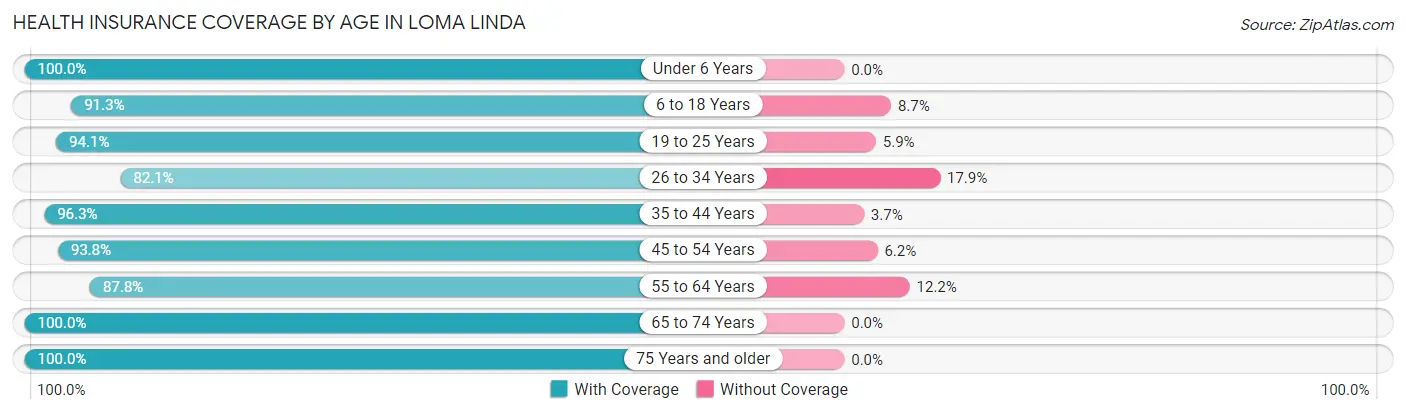
| Age Bracket | With Coverage | Without Coverage |
| Under 6 Years | 63 (100.0%) | 0 (0.0%) |
| 6 to 18 Years | 84 (91.3%) | 8 (8.7%) |
| 19 to 25 Years | 96 (94.1%) | 6 (5.9%) |
| 26 to 34 Years | 92 (82.1%) | 20 (17.9%) |
| 35 to 44 Years | 79 (96.3%) | 3 (3.7%) |
| 45 to 54 Years | 182 (93.8%) | 12 (6.2%) |
| 55 to 64 Years | 137 (87.8%) | 19 (12.2%) |
| 65 to 74 Years | 127 (100.0%) | 0 (0.0%) |
| 75 Years and older | 58 (100.0%) | 0 (0.0%) |
| Total | 918 (93.1%) | 68 (6.9%) |
Health Insurance Coverage by Citizenship Status in Loma Linda
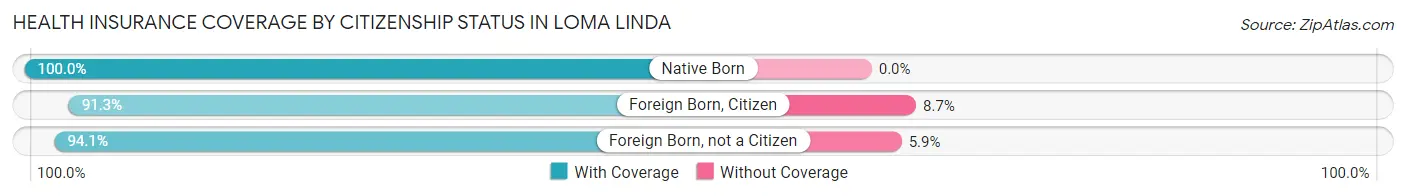
| Citizenship Status | With Coverage | Without Coverage |
| Native Born | 63 (100.0%) | 0 (0.0%) |
| Foreign Born, Citizen | 84 (91.3%) | 8 (8.7%) |
| Foreign Born, not a Citizen | 96 (94.1%) | 6 (5.9%) |
Health Insurance Coverage by Household Income in Loma Linda
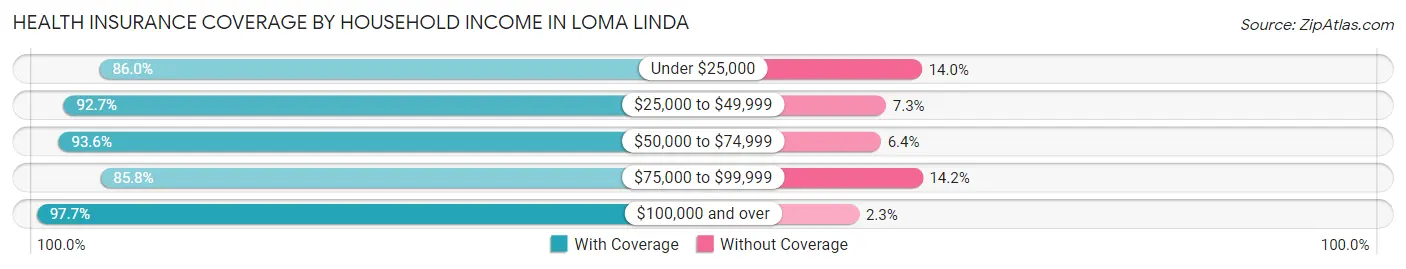
| Household Income | With Coverage | Without Coverage |
| Under $25,000 | 153 (86.0%) | 25 (14.0%) |
| $25,000 to $49,999 | 76 (92.7%) | 6 (7.3%) |
| $50,000 to $74,999 | 103 (93.6%) | 7 (6.4%) |
| $75,000 to $99,999 | 115 (85.8%) | 19 (14.2%) |
| $100,000 and over | 471 (97.7%) | 11 (2.3%) |
Public vs Private Health Insurance Coverage by Age in Loma Linda
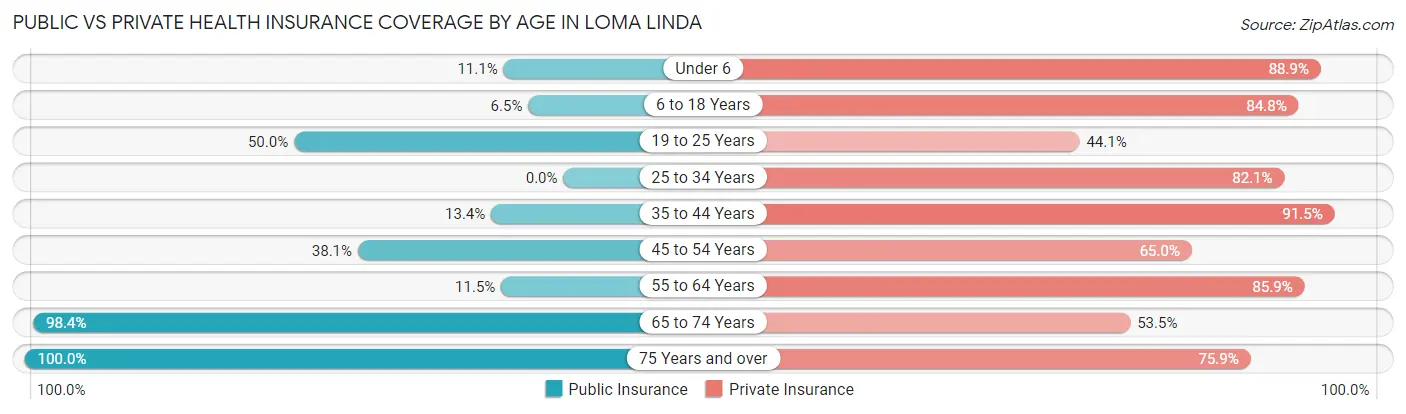
| Age Bracket | Public Insurance | Private Insurance |
| Under 6 | 7 (11.1%) | 56 (88.9%) |
| 6 to 18 Years | 6 (6.5%) | 78 (84.8%) |
| 19 to 25 Years | 51 (50.0%) | 45 (44.1%) |
| 25 to 34 Years | 0 (0.0%) | 92 (82.1%) |
| 35 to 44 Years | 11 (13.4%) | 75 (91.5%) |
| 45 to 54 Years | 74 (38.1%) | 126 (64.9%) |
| 55 to 64 Years | 18 (11.5%) | 134 (85.9%) |
| 65 to 74 Years | 125 (98.4%) | 68 (53.5%) |
| 75 Years and over | 58 (100.0%) | 44 (75.9%) |
| Total | 350 (35.5%) | 718 (72.8%) |
Disability Status by Sex by Age in Loma Linda
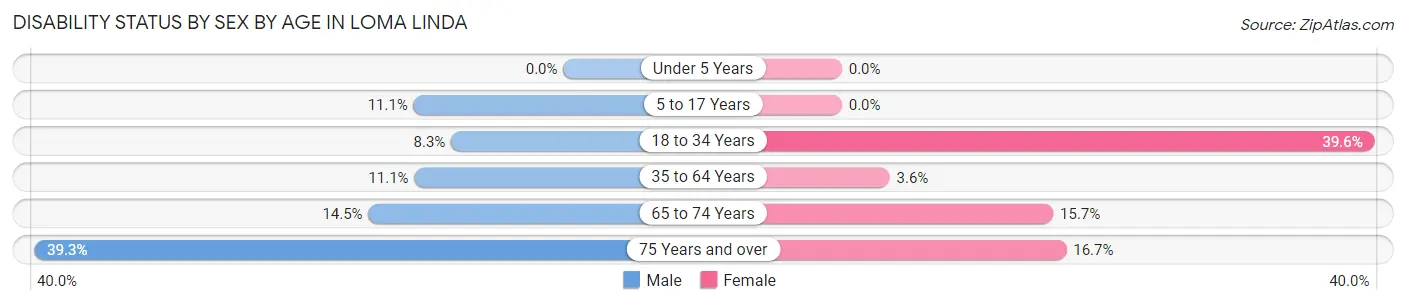
| Age Bracket | Male | Female |
| Under 5 Years | 0 (0.0%) | 0 (0.0%) |
| 5 to 17 Years | 6 (11.1%) | 0 (0.0%) |
| 18 to 34 Years | 7 (8.3%) | 53 (39.6%) |
| 35 to 64 Years | 26 (11.1%) | 7 (3.5%) |
| 65 to 74 Years | 11 (14.5%) | 8 (15.7%) |
| 75 Years and over | 11 (39.3%) | 5 (16.7%) |
Disability Class by Sex by Age in Loma Linda
Disability Class: Hearing Difficulty
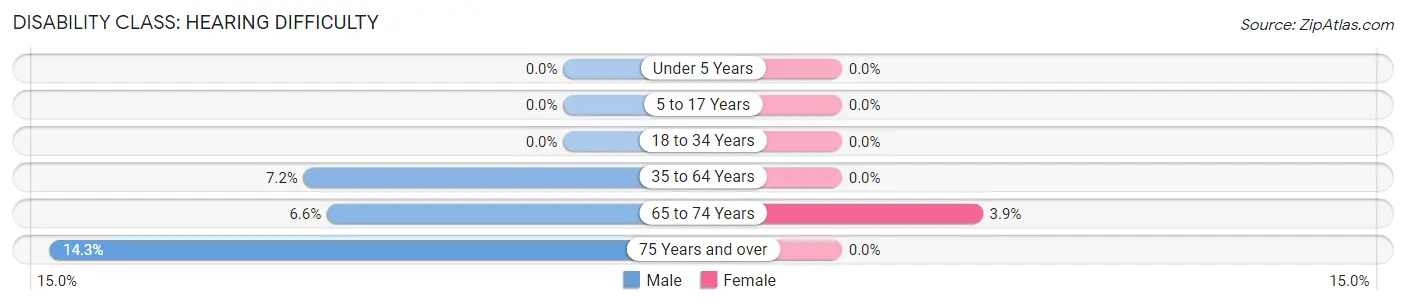
| Age Bracket | Male | Female |
| Under 5 Years | 0 (0.0%) | 0 (0.0%) |
| 5 to 17 Years | 0 (0.0%) | 0 (0.0%) |
| 18 to 34 Years | 0 (0.0%) | 0 (0.0%) |
| 35 to 64 Years | 17 (7.2%) | 0 (0.0%) |
| 65 to 74 Years | 5 (6.6%) | 2 (3.9%) |
| 75 Years and over | 4 (14.3%) | 0 (0.0%) |
Disability Class: Vision Difficulty
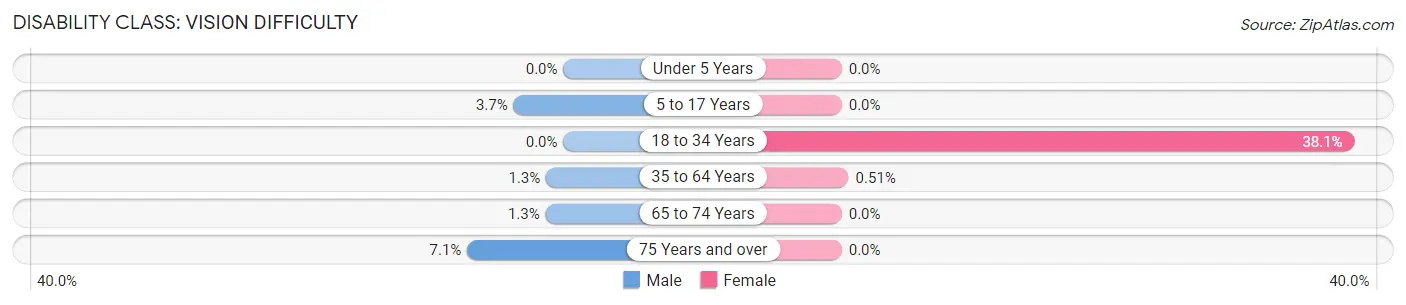
| Age Bracket | Male | Female |
| Under 5 Years | 0 (0.0%) | 0 (0.0%) |
| 5 to 17 Years | 2 (3.7%) | 0 (0.0%) |
| 18 to 34 Years | 0 (0.0%) | 51 (38.1%) |
| 35 to 64 Years | 3 (1.3%) | 1 (0.5%) |
| 65 to 74 Years | 1 (1.3%) | 0 (0.0%) |
| 75 Years and over | 2 (7.1%) | 0 (0.0%) |
Disability Class: Cognitive Difficulty
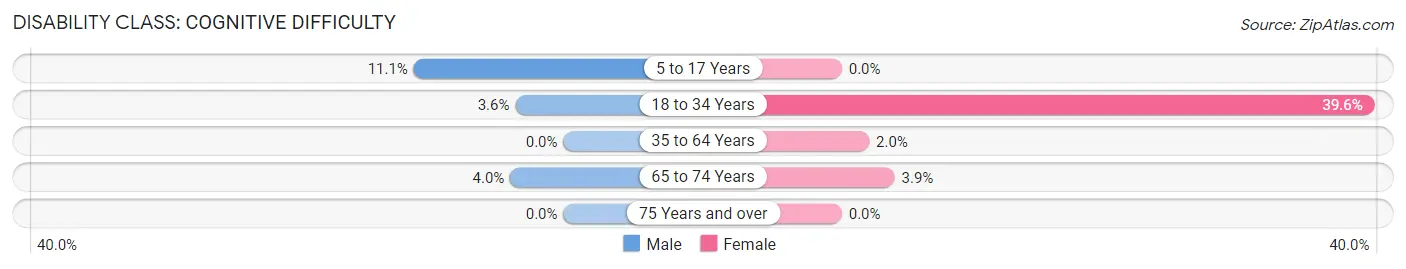
| Age Bracket | Male | Female |
| 5 to 17 Years | 6 (11.1%) | 0 (0.0%) |
| 18 to 34 Years | 3 (3.6%) | 53 (39.6%) |
| 35 to 64 Years | 0 (0.0%) | 4 (2.0%) |
| 65 to 74 Years | 3 (4.0%) | 2 (3.9%) |
| 75 Years and over | 0 (0.0%) | 0 (0.0%) |
Disability Class: Ambulatory Difficulty
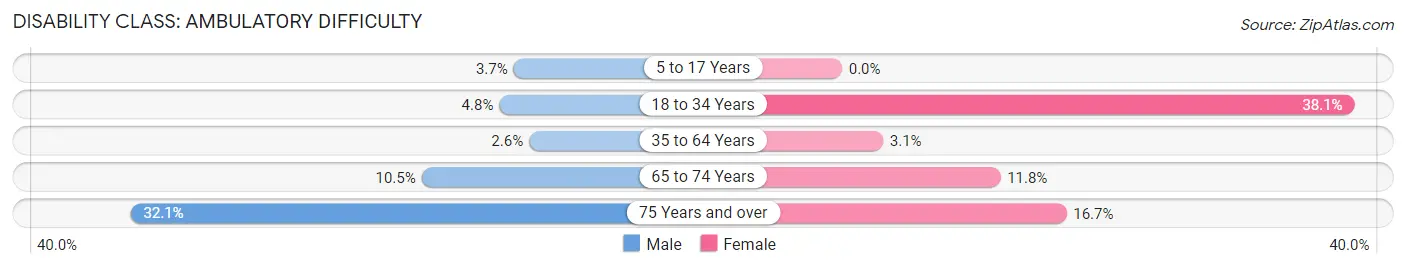
| Age Bracket | Male | Female |
| 5 to 17 Years | 2 (3.7%) | 0 (0.0%) |
| 18 to 34 Years | 4 (4.8%) | 51 (38.1%) |
| 35 to 64 Years | 6 (2.5%) | 6 (3.0%) |
| 65 to 74 Years | 8 (10.5%) | 6 (11.8%) |
| 75 Years and over | 9 (32.1%) | 5 (16.7%) |
Disability Class: Self-Care Difficulty
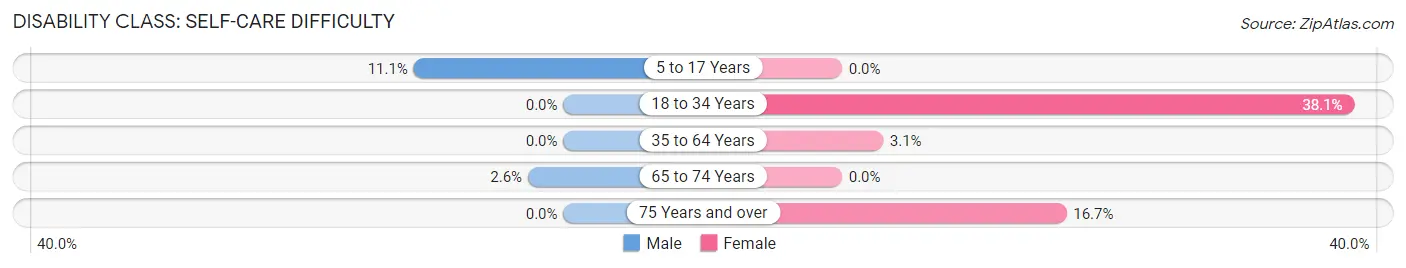
| Age Bracket | Male | Female |
| 5 to 17 Years | 6 (11.1%) | 0 (0.0%) |
| 18 to 34 Years | 0 (0.0%) | 51 (38.1%) |
| 35 to 64 Years | 0 (0.0%) | 6 (3.0%) |
| 65 to 74 Years | 2 (2.6%) | 0 (0.0%) |
| 75 Years and over | 0 (0.0%) | 5 (16.7%) |
Technology Access in Loma Linda
Computing Device Access in Loma Linda
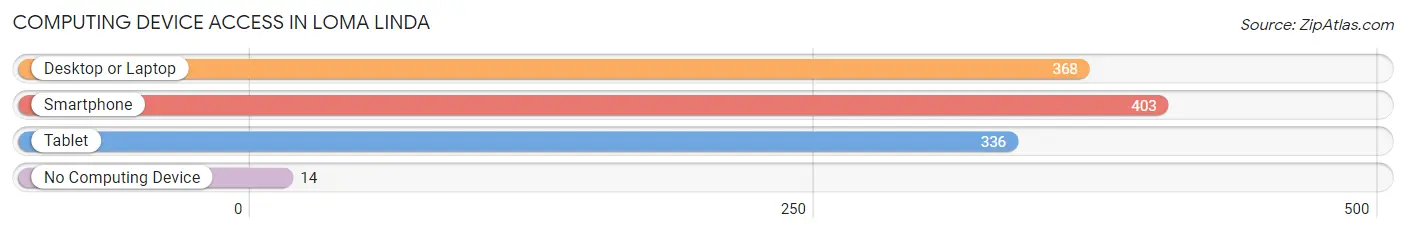
| Device Type | # Households | % Households |
| Desktop or Laptop | 368 | 85.0% |
| Smartphone | 403 | 93.1% |
| Tablet | 336 | 77.6% |
| No Computing Device | 14 | 3.2% |
| Total | 433 | 100.0% |
Internet Access in Loma Linda
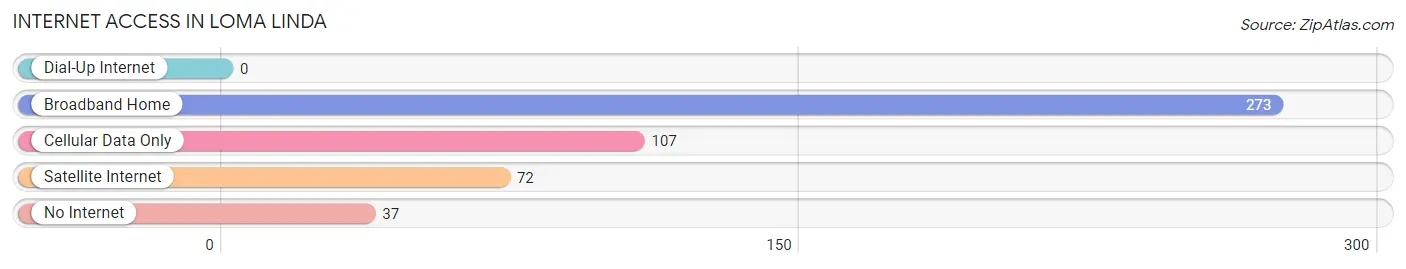
| Internet Type | # Households | % Households |
| Dial-Up Internet | 0 | 0.0% |
| Broadband Home | 273 | 63.0% |
| Cellular Data Only | 107 | 24.7% |
| Satellite Internet | 72 | 16.6% |
| No Internet | 37 | 8.6% |
| Total | 433 | 100.0% |
Loma Linda Summary
Loma Linda, Missouri is a small town located in the Ozark Mountains of southern Missouri. It is situated in Taney County, approximately 20 miles south of Branson and about 40 miles north of Springfield. The town was founded in 1883 and has a population of approximately 500 people.
History
Loma Linda was founded in 1883 by a group of settlers from the nearby town of Forsyth. The settlers were looking for a place to settle and start a new life. The town was named after a nearby mountain, which was named after the Spanish phrase for “beautiful hill.” The town was originally a farming community, but it soon became a popular tourist destination due to its scenic beauty and proximity to the Ozark Mountains.
In the early 1900s, the town began to grow and develop. The first school was built in 1906 and the first post office was established in 1907. The town also had a general store, a blacksmith shop, and a few other businesses.
In the 1920s, the town began to experience a decline in population due to the Great Depression. However, the town was able to survive and eventually began to grow again in the 1950s. The town was incorporated in 1959 and has since become a popular tourist destination.
Geography
Loma Linda is located in the Ozark Mountains of southern Missouri. The town is situated in Taney County, approximately 20 miles south of Branson and about 40 miles north of Springfield. The town is surrounded by rolling hills and is located near several lakes, including Table Rock Lake and Bull Shoals Lake.
The town has a total area of 0.7 square miles, all of which is land. The town is located at an elevation of 1,072 feet above sea level. The climate in Loma Linda is humid subtropical, with hot summers and mild winters.
Economy
The economy of Loma Linda is largely based on tourism. The town is a popular destination for visitors who are looking to enjoy the scenic beauty of the Ozark Mountains. The town also has several businesses, including restaurants, shops, and lodging.
The town also has a few manufacturing businesses, including a furniture factory and a woodworking shop. The town also has a few small farms that produce vegetables and livestock.
Demographics
As of the 2010 census, the population of Loma Linda was 498. The racial makeup of the town was 97.2% White, 0.2% African American, 0.2% Native American, 0.2% Asian, 0.2% from other races, and 1.8% from two or more races. Hispanic or Latino of any race were 0.8% of the population.
The median income for a household in the town was $30,000, and the median income for a family was $35,000. The per capita income for the town was $15,000. About 10.2% of families and 12.2% of the population were below the poverty line, including 16.7% of those under age 18 and 8.3% of those age 65 or over.
Conclusion
Loma Linda, Missouri is a small town located in the Ozark Mountains of southern Missouri. It was founded in 1883 and has a population of approximately 500 people. The town is a popular tourist destination due to its scenic beauty and proximity to the Ozark Mountains. The economy of the town is largely based on tourism, and it also has several businesses, including restaurants, shops, and lodging. The racial makeup of the town is predominantly White, with a small percentage of African American, Native American, and Asian residents. The median income for a household in the town is $30,000, and the per capita income is $15,000.
Common Questions
What is the Total Population of Loma Linda?
Total Population of Loma Linda is 986.
What is the Total Male Population of Loma Linda?
Total Male Population of Loma Linda is 520.
What is the Total Female Population of Loma Linda?
Total Female Population of Loma Linda is 466.
What is the Ratio of Males per 100 Females in Loma Linda?
There are 111.59 Males per 100 Females in Loma Linda.
What is the Ratio of Females per 100 Males in Loma Linda?
There are 89.62 Females per 100 Males in Loma Linda.
What is the Median Population Age in Loma Linda?
Median Population Age in Loma Linda is 45.7 Years.
What is the Average Family Size in Loma Linda
Average Family Size in Loma Linda is 2.7 People.
What is the Average Household Size in Loma Linda
Average Household Size in Loma Linda is 2.3 People.
What is Per Capita Income in Loma Linda?
Per Capita income in Loma Linda is $41,842.
What is the Median Family Income in Loma Linda?
Median Family Income in Loma Linda is $91,250.
What is the Median Household income in Loma Linda?
Median Household Income in Loma Linda is $80,250.
What is Income or Wage Gap in Loma Linda?
Income or Wage Gap in Loma Linda is 24.7%.
Women in Loma Linda earn 75.3 cents for every dollar earned by a man.
What is Inequality or Gini Index in Loma Linda?
Inequality or Gini Index in Loma Linda is 0.42.
How Large is the Labor Force in Loma Linda?
There are 557 People in the Labor Forcein in Loma Linda.
What is the Percentage of People in the Labor Force in Loma Linda?
66.4% of People are in the Labor Force in Loma Linda.
What is the Unemployment Rate in Loma Linda?
Unemployment Rate in Loma Linda is 2.7%.