Cities with the Highest Percentage of Immigrants from Ukraine in Missouri
RELATED REPORTS & OPTIONS
Ukraine
Missouri
Compare Cities
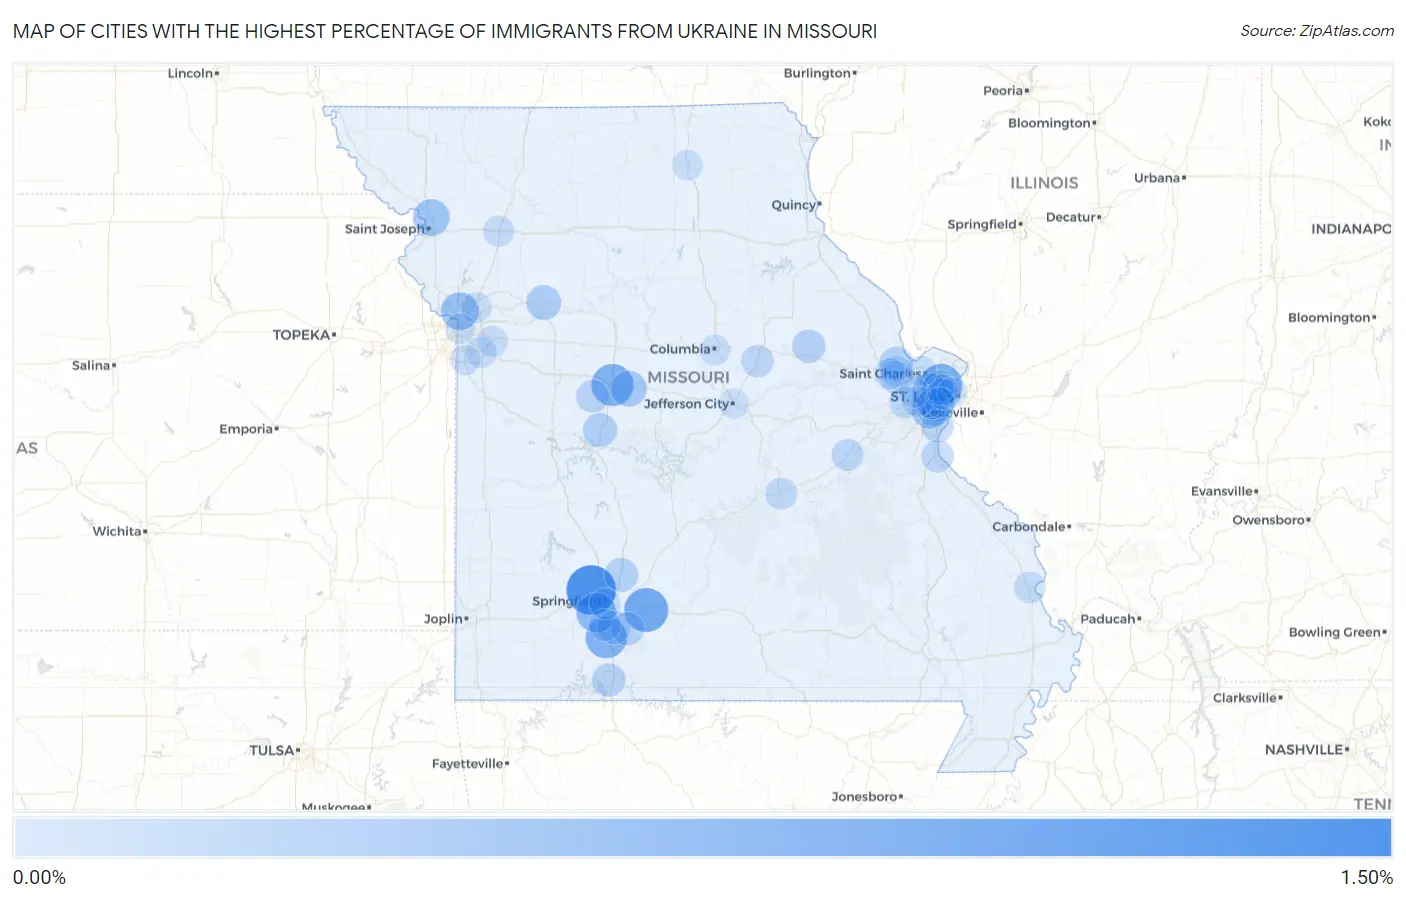
Map of Cities with the Highest Percentage of Immigrants from Ukraine in Missouri
0.00%
1.50%
Cities with the Highest Percentage of Immigrants from Ukraine in Missouri
| City | Ukraine | vs State | vs National | |
| 1. | Willard | 1.34% | 0.047%(+1.29)#1 | 0.12%(+1.22)#249 |
| 2. | Fordland | 0.95% | 0.047%(+0.899)#2 | 0.12%(+0.831)#377 |
| 3. | Charlack | 0.83% | 0.047%(+0.781)#3 | 0.12%(+0.712)#424 |
| 4. | Sedalia | 0.81% | 0.047%(+0.766)#4 | 0.12%(+0.697)#434 |
| 5. | Highlandville | 0.77% | 0.047%(+0.723)#5 | 0.12%(+0.654)#459 |
| 6. | Battlefield | 0.65% | 0.047%(+0.598)#6 | 0.12%(+0.529)#562 |
| 7. | Oakview | 0.52% | 0.047%(+0.471)#7 | 0.12%(+0.402)#696 |
| 8. | Fenton | 0.46% | 0.047%(+0.417)#8 | 0.12%(+0.348)#769 |
| 9. | Country Club | 0.44% | 0.047%(+0.392)#9 | 0.12%(+0.323)#813 |
| 10. | Smithton | 0.39% | 0.047%(+0.342)#10 | 0.12%(+0.273)#903 |
| 11. | Creve Coeur | 0.37% | 0.047%(+0.322)#11 | 0.12%(+0.254)#952 |
| 12. | Oakland | 0.37% | 0.047%(+0.320)#12 | 0.12%(+0.252)#954 |
| 13. | Hardin | 0.30% | 0.047%(+0.256)#13 | 0.12%(+0.188)#1,087 |
| 14. | Lincoln | 0.27% | 0.047%(+0.221)#14 | 0.12%(+0.152)#1,168 |
| 15. | St Paul | 0.25% | 0.047%(+0.207)#15 | 0.12%(+0.138)#1,201 |
| 16. | Fair Grove | 0.25% | 0.047%(+0.199)#16 | 0.12%(+0.130)#1,237 |
| 17. | Ozark | 0.22% | 0.047%(+0.172)#17 | 0.12%(+0.103)#1,335 |
| 18. | Montgomery City | 0.21% | 0.047%(+0.166)#18 | 0.12%(+0.097)#1,362 |
| 19. | Branson | 0.21% | 0.047%(+0.158)#19 | 0.12%(+0.090)#1,391 |
| 20. | Sparta | 0.20% | 0.047%(+0.158)#20 | 0.12%(+0.089)#1,393 |
| 21. | Green Ridge | 0.19% | 0.047%(+0.140)#21 | 0.12%(+0.071)#1,463 |
| 22. | Sunset Hills | 0.18% | 0.047%(+0.128)#22 | 0.12%(+0.060)#1,516 |
| 23. | Dardenne Prairie | 0.16% | 0.047%(+0.116)#23 | 0.12%(+0.047)#1,577 |
| 24. | Fulton | 0.16% | 0.047%(+0.111)#24 | 0.12%(+0.042)#1,595 |
| 25. | Arnold | 0.15% | 0.047%(+0.107)#25 | 0.12%(+0.038)#1,614 |
| 26. | Crystal City | 0.15% | 0.047%(+0.101)#26 | 0.12%(+0.032)#1,643 |
| 27. | Sullivan | 0.12% | 0.047%(+0.077)#27 | 0.12%(+0.008)#1,767 |
| 28. | Nixa | 0.12% | 0.047%(+0.076)#28 | 0.12%(+0.007)#1,773 |
| 29. | Rolla | 0.11% | 0.047%(+0.063)#29 | 0.12%(-0.006)#1,863 |
| 30. | Des Peres | 0.11% | 0.047%(+0.062)#30 | 0.12%(-0.006)#1,870 |
| 31. | Olivette | 0.11% | 0.047%(+0.060)#31 | 0.12%(-0.009)#1,889 |
| 32. | Wildwood | 0.10% | 0.047%(+0.058)#32 | 0.12%(-0.011)#1,900 |
| 33. | O Fallon | 0.091% | 0.047%(+0.044)#33 | 0.12%(-0.024)#1,989 |
| 34. | Overland | 0.088% | 0.047%(+0.041)#34 | 0.12%(-0.027)#2,008 |
| 35. | Cape Girardeau | 0.088% | 0.047%(+0.041)#35 | 0.12%(-0.028)#2,015 |
| 36. | Lake St Louis | 0.082% | 0.047%(+0.035)#36 | 0.12%(-0.034)#2,065 |
| 37. | Springfield | 0.080% | 0.047%(+0.033)#37 | 0.12%(-0.036)#2,076 |
| 38. | Cameron | 0.066% | 0.047%(+0.019)#38 | 0.12%(-0.050)#2,207 |
| 39. | Lee S Summit | 0.065% | 0.047%(+0.018)#39 | 0.12%(-0.051)#2,223 |
| 40. | Kirkwood | 0.061% | 0.047%(+0.014)#40 | 0.12%(-0.054)#2,250 |
| 41. | Liberty | 0.053% | 0.047%(+0.006)#41 | 0.12%(-0.063)#2,326 |
| 42. | Clayton | 0.046% | 0.047%(-0.001)#42 | 0.12%(-0.069)#2,389 |
| 43. | Ballwin | 0.045% | 0.047%(-0.002)#43 | 0.12%(-0.071)#2,403 |
| 44. | University City | 0.043% | 0.047%(-0.004)#44 | 0.12%(-0.073)#2,427 |
| 45. | Blue Springs | 0.041% | 0.047%(-0.006)#45 | 0.12%(-0.075)#2,451 |
| 46. | Columbia | 0.040% | 0.047%(-0.007)#46 | 0.12%(-0.076)#2,461 |
| 47. | St Charles | 0.035% | 0.047%(-0.012)#47 | 0.12%(-0.080)#2,511 |
| 48. | Chesterfield | 0.026% | 0.047%(-0.021)#48 | 0.12%(-0.090)#2,620 |
| 49. | Grandview | 0.023% | 0.047%(-0.024)#49 | 0.12%(-0.093)#2,655 |
| 50. | Kirksville | 0.023% | 0.047%(-0.024)#50 | 0.12%(-0.093)#2,661 |
| 51. | Kansas City | 0.0099% | 0.047%(-0.037)#51 | 0.12%(-0.106)#2,795 |
| 52. | St Louis | 0.0094% | 0.047%(-0.038)#52 | 0.12%(-0.106)#2,801 |
| 53. | Jefferson City | 0.0094% | 0.047%(-0.038)#53 | 0.12%(-0.106)#2,803 |
| 54. | Webster Groves | 0.0042% | 0.047%(-0.043)#54 | 0.12%(-0.112)#2,851 |
Common Questions
What are the Top 10 Cities with the Highest Percentage of Immigrants from Ukraine in Missouri?
Top 10 Cities with the Highest Percentage of Immigrants from Ukraine in Missouri are:
#1
1.34%
#2
0.95%
#3
0.83%
#4
0.81%
#5
0.77%
#6
0.65%
#7
0.52%
#8
0.46%
#9
0.44%
#10
0.39%
What city has the Highest Percentage of Immigrants from Ukraine in Missouri?
Willard has the Highest Percentage of Immigrants from Ukraine in Missouri with 1.34%.
What is the Percentage of Immigrants from Ukraine in the State of Missouri?
Percentage of Immigrants from Ukraine in Missouri is 0.047%.
What is the Percentage of Immigrants from Ukraine in the United States?
Percentage of Immigrants from Ukraine in the United States is 0.12%.