Country Club, MO
Country Club Map
Country Club Overview
3,191
TOTAL POPULATION
1,611
MALE POPULATION
1,580
FEMALE POPULATION
101.96
MALES / 100 FEMALES
98.08
FEMALES / 100 MALES
35.5
MEDIAN AGE
3.4
AVG FAMILY SIZE
3.0
AVG HOUSEHOLD SIZE
$31,954
PER CAPITA INCOME
$92,581
AVG FAMILY INCOME
$79,688
AVG HOUSEHOLD INCOME
26.0%
WAGE / INCOME GAP [ % ]
74.0¢/ $1
WAGE / INCOME GAP [ $ ]
0.36
INEQUALITY / GINI INDEX
1,605
LABOR FORCE [ PEOPLE ]
68.6%
PERCENT IN LABOR FORCE
6.3%
UNEMPLOYMENT RATE
Country Club Area Codes
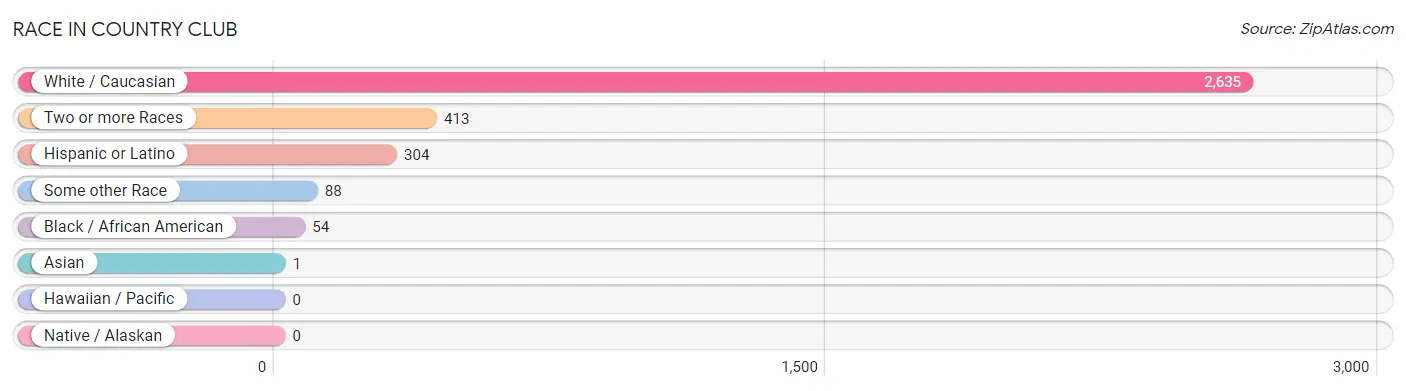
Race in Country Club
The most populous races in Country Club are White / Caucasian (2,635 | 82.6%), Two or more Races (413 | 12.9%), and Hispanic or Latino (304 | 9.5%).
| Race | # Population | % Population |
| Asian | 1 | 0.0% |
| Black / African American | 54 | 1.7% |
| Hawaiian / Pacific | 0 | 0.0% |
| Hispanic or Latino | 304 | 9.5% |
| Native / Alaskan | 0 | 0.0% |
| White / Caucasian | 2,635 | 82.6% |
| Two or more Races | 413 | 12.9% |
| Some other Race | 88 | 2.8% |
| Total | 3,191 | 100.0% |
Ancestry in Country Club
The most populous ancestries reported in Country Club are German (901 | 28.2%), English (448 | 14.0%), Irish (398 | 12.5%), Mexican (247 | 7.7%), and French (158 | 5.0%), together accounting for 67.4% of all Country Club residents.

| Ancestry | # Population | % Population |
| African | 12 | 0.4% |
| American | 85 | 2.7% |
| Austrian | 6 | 0.2% |
| Bhutanese | 7 | 0.2% |
| British | 64 | 2.0% |
| Central American | 41 | 1.3% |
| Costa Rican | 10 | 0.3% |
| Cuban | 16 | 0.5% |
| Danish | 11 | 0.3% |
| Dutch | 19 | 0.6% |
| Eastern European | 10 | 0.3% |
| English | 448 | 14.0% |
| European | 33 | 1.0% |
| French | 158 | 5.0% |
| German | 901 | 28.2% |
| Indian (Asian) | 1 | 0.0% |
| Irish | 398 | 12.5% |
| Italian | 67 | 2.1% |
| Mexican | 247 | 7.7% |
| Norwegian | 29 | 0.9% |
| Polish | 37 | 1.2% |
| Salvadoran | 31 | 1.0% |
| Scotch-Irish | 7 | 0.2% |
| Scottish | 61 | 1.9% |
| Subsaharan African | 12 | 0.4% |
| Swedish | 73 | 2.3% |
| Swiss | 20 | 0.6% |
| Ukrainian | 16 | 0.5% |
| Welsh | 4 | 0.1% | View All 29 Rows |
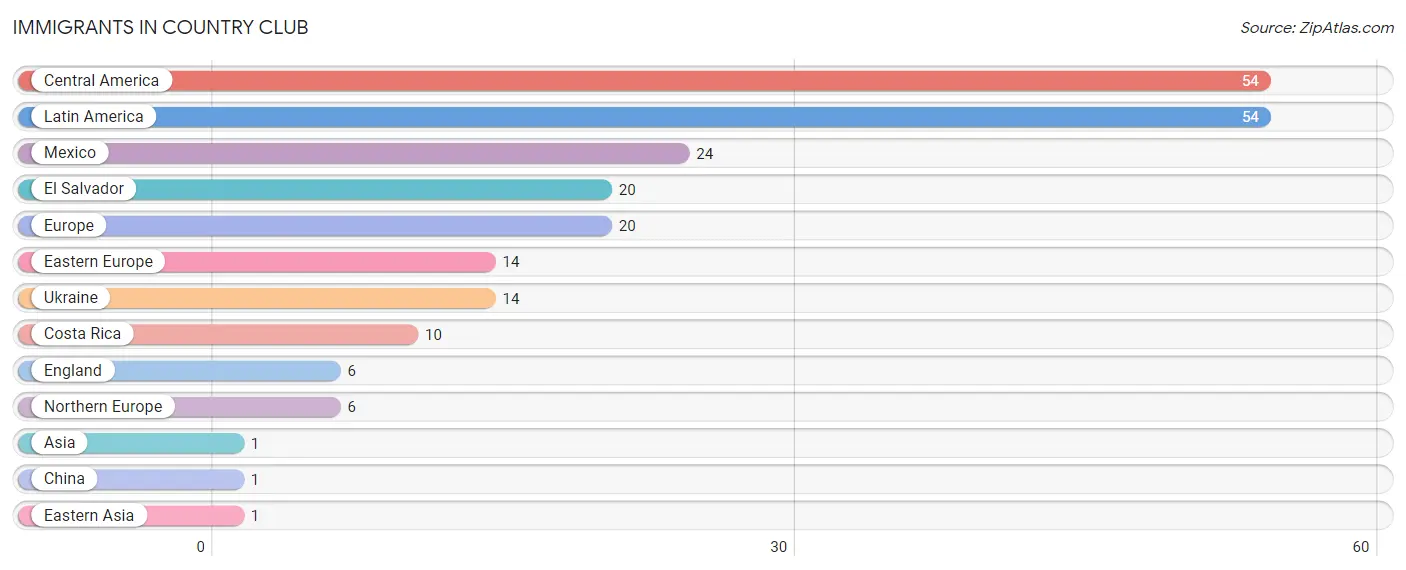
Immigrants in Country Club
The most numerous immigrant groups reported in Country Club came from Central America (54 | 1.7%), Latin America (54 | 1.7%), Mexico (24 | 0.7%), El Salvador (20 | 0.6%), and Europe (20 | 0.6%), together accounting for 5.4% of all Country Club residents.
| Immigration Origin | # Population | % Population |
| Asia | 1 | 0.0% |
| Central America | 54 | 1.7% |
| China | 1 | 0.0% |
| Costa Rica | 10 | 0.3% |
| Eastern Asia | 1 | 0.0% |
| Eastern Europe | 14 | 0.4% |
| El Salvador | 20 | 0.6% |
| England | 6 | 0.2% |
| Europe | 20 | 0.6% |
| Latin America | 54 | 1.7% |
| Mexico | 24 | 0.7% |
| Northern Europe | 6 | 0.2% |
| Ukraine | 14 | 0.4% | View All 13 Rows |
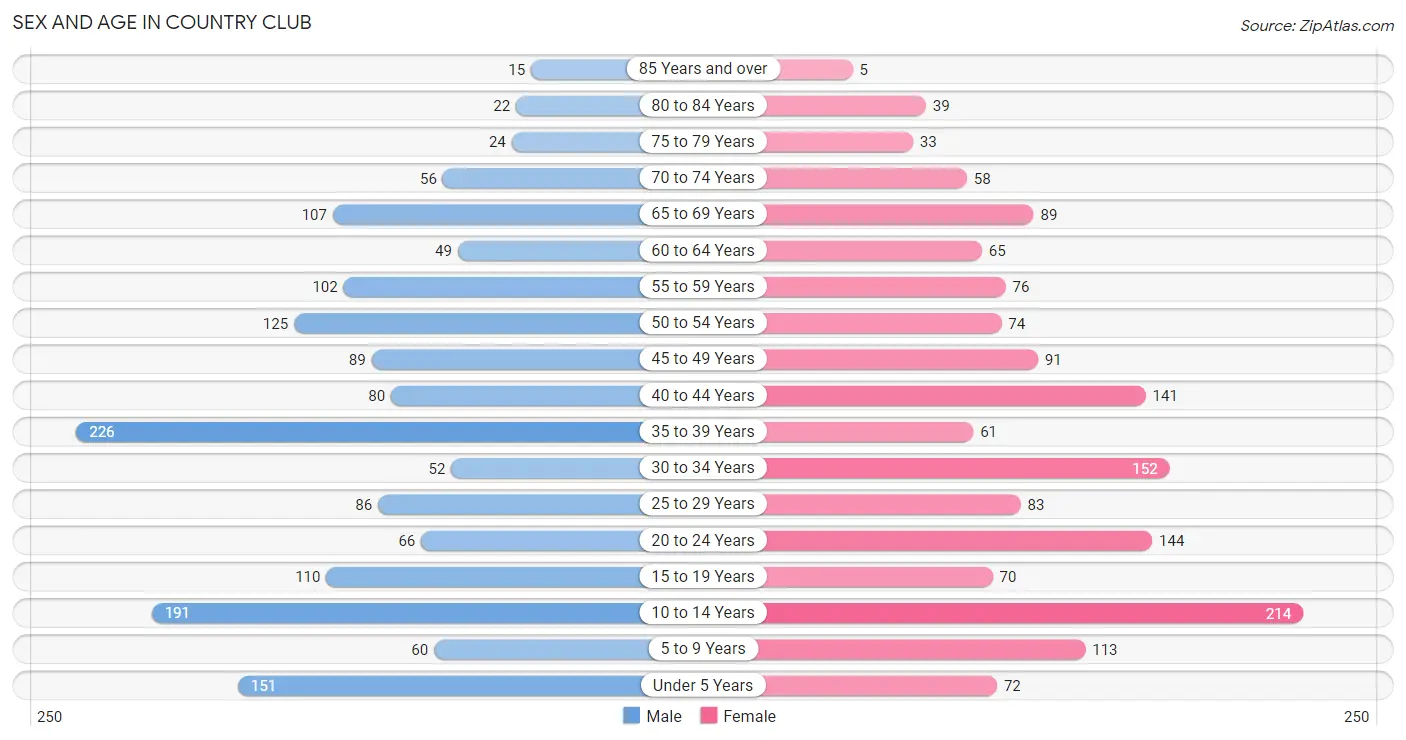
Sex and Age in Country Club
Sex and Age in Country Club
The most populous age groups in Country Club are 35 to 39 Years (226 | 14.0%) for men and 10 to 14 Years (214 | 13.5%) for women.
| Age Bracket | Male | Female |
| Under 5 Years | 151 (9.4%) | 72 (4.6%) |
| 5 to 9 Years | 60 (3.7%) | 113 (7.1%) |
| 10 to 14 Years | 191 (11.9%) | 214 (13.5%) |
| 15 to 19 Years | 110 (6.8%) | 70 (4.4%) |
| 20 to 24 Years | 66 (4.1%) | 144 (9.1%) |
| 25 to 29 Years | 86 (5.3%) | 83 (5.2%) |
| 30 to 34 Years | 52 (3.2%) | 152 (9.6%) |
| 35 to 39 Years | 226 (14.0%) | 61 (3.9%) |
| 40 to 44 Years | 80 (5.0%) | 141 (8.9%) |
| 45 to 49 Years | 89 (5.5%) | 91 (5.8%) |
| 50 to 54 Years | 125 (7.8%) | 74 (4.7%) |
| 55 to 59 Years | 102 (6.3%) | 76 (4.8%) |
| 60 to 64 Years | 49 (3.0%) | 65 (4.1%) |
| 65 to 69 Years | 107 (6.6%) | 89 (5.6%) |
| 70 to 74 Years | 56 (3.5%) | 58 (3.7%) |
| 75 to 79 Years | 24 (1.5%) | 33 (2.1%) |
| 80 to 84 Years | 22 (1.4%) | 39 (2.5%) |
| 85 Years and over | 15 (0.9%) | 5 (0.3%) |
| Total | 1,611 (100.0%) | 1,580 (100.0%) |
Families and Households in Country Club
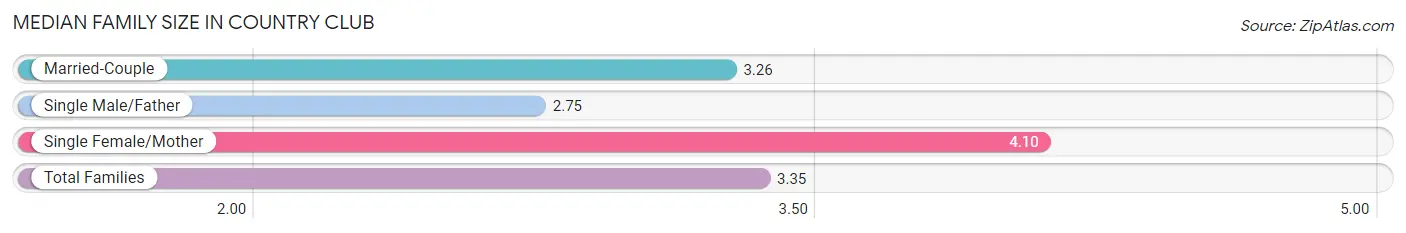
Median Family Size in Country Club
The median family size in Country Club is 3.35 persons per family, with single female/mother families (108 | 13.1%) accounting for the largest median family size of 4.1 persons per family. On the other hand, single male/father families (32 | 3.9%) represent the smallest median family size with 2.75 persons per family.
| Family Type | # Families | Family Size |
| Married-Couple | 686 (83.1%) | 3.26 |
| Single Male/Father | 32 (3.9%) | 2.75 |
| Single Female/Mother | 108 (13.1%) | 4.10 |
| Total Families | 826 (100.0%) | 3.35 |
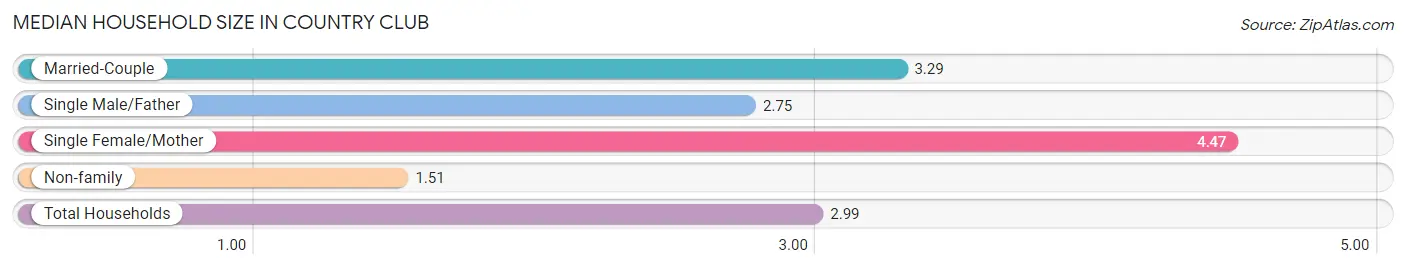
Median Household Size in Country Club
The median household size in Country Club is 2.99 persons per household, with single female/mother households (108 | 10.1%) accounting for the largest median household size of 4.47 persons per household. non-family households (241 | 22.6%) represent the smallest median household size with 1.51 persons per household.
| Household Type | # Households | Household Size |
| Married-Couple | 686 (64.3%) | 3.29 |
| Single Male/Father | 32 (3.0%) | 2.75 |
| Single Female/Mother | 108 (10.1%) | 4.47 |
| Non-family | 241 (22.6%) | 1.51 |
| Total Households | 1,067 (100.0%) | 2.99 |
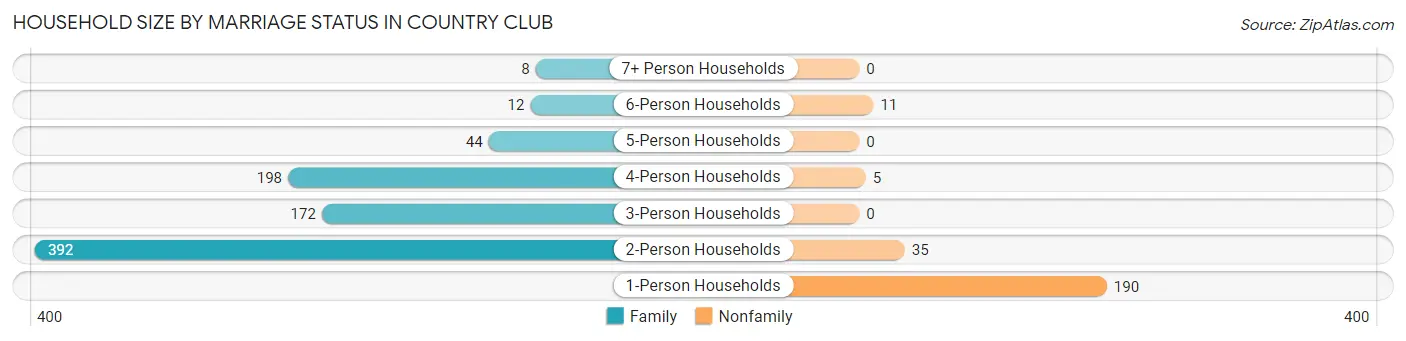
Household Size by Marriage Status in Country Club
Out of a total of 1,067 households in Country Club, 826 (77.4%) are family households, while 241 (22.6%) are nonfamily households. The most numerous type of family households are 2-person households, comprising 392, and the most common type of nonfamily households are 1-person households, comprising 190.
| Household Size | Family Households | Nonfamily Households |
| 1-Person Households | - | 190 (17.8%) |
| 2-Person Households | 392 (36.7%) | 35 (3.3%) |
| 3-Person Households | 172 (16.1%) | 0 (0.0%) |
| 4-Person Households | 198 (18.6%) | 5 (0.5%) |
| 5-Person Households | 44 (4.1%) | 0 (0.0%) |
| 6-Person Households | 12 (1.1%) | 11 (1.0%) |
| 7+ Person Households | 8 (0.7%) | 0 (0.0%) |
| Total | 826 (77.4%) | 241 (22.6%) |
Female Fertility in Country Club
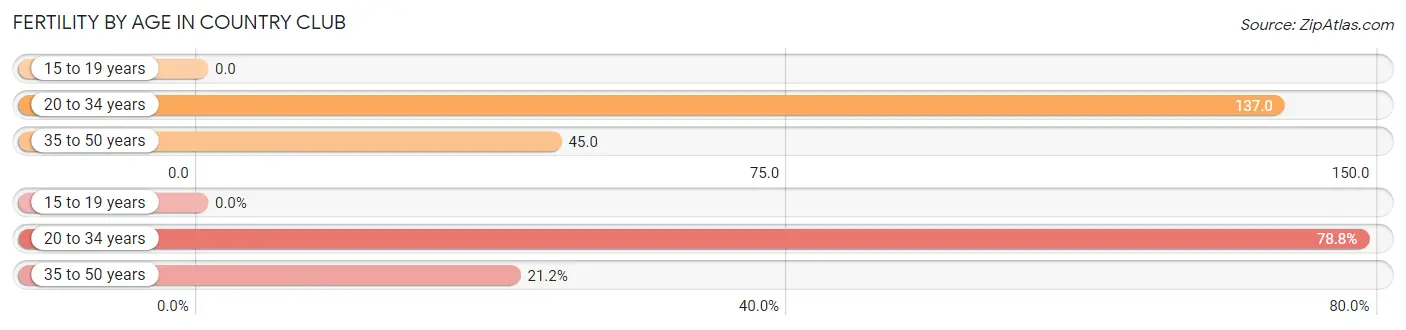
Fertility by Age in Country Club
Average fertility rate in Country Club is 87.0 births per 1,000 women. Women in the age bracket of 20 to 34 years have the highest fertility rate with 137.0 births per 1,000 women. Women in the age bracket of 20 to 34 years acount for 78.8% of all women with births.
| Age Bracket | Women with Births | Births / 1,000 Women |
| 15 to 19 years | 0 (0.0%) | 0.0 |
| 20 to 34 years | 52 (78.8%) | 137.0 |
| 35 to 50 years | 14 (21.2%) | 45.0 |
| Total | 66 (100.0%) | 87.0 |
Fertility by Age by Marriage Status in Country Club
65.2% of women with births (66) in Country Club are married. The highest percentage of unmarried women with births falls into 35 to 50 years age bracket with 57.1% of them unmarried at the time of birth, while the lowest percentage of unmarried women with births belong to 20 to 34 years age bracket with 28.8% of them unmarried.
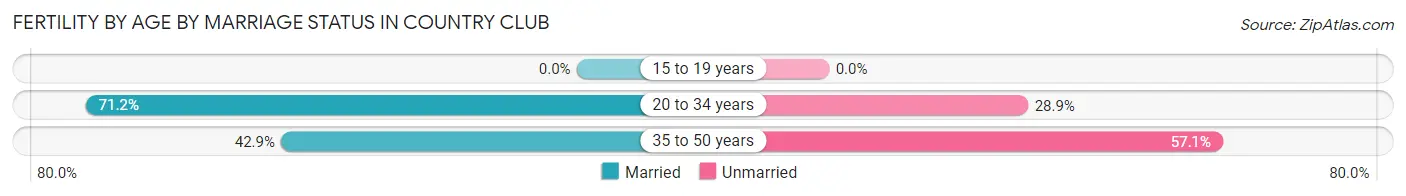
| Age Bracket | Married | Unmarried |
| 15 to 19 years | 0 (0.0%) | 0 (0.0%) |
| 20 to 34 years | 37 (71.2%) | 15 (28.8%) |
| 35 to 50 years | 6 (42.9%) | 8 (57.1%) |
| Total | 43 (65.1%) | 23 (34.8%) |
Fertility by Education in Country Club
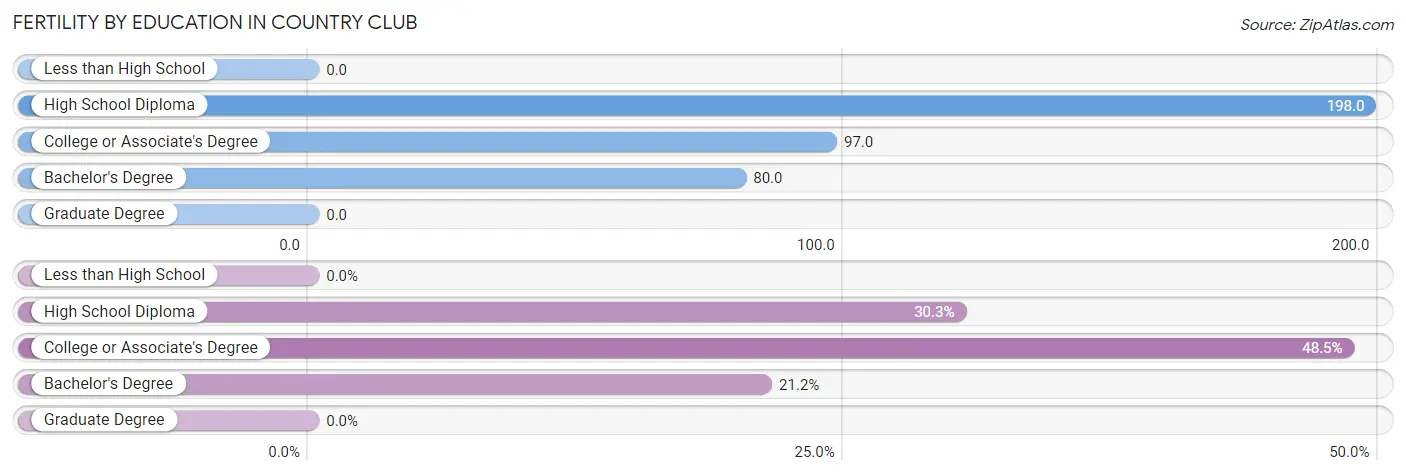
| Educational Attainment | Women with Births | Births / 1,000 Women |
| Less than High School | 0 (0.0%) | 0.0 |
| High School Diploma | 20 (30.3%) | 198.0 |
| College or Associate's Degree | 32 (48.5%) | 97.0 |
| Bachelor's Degree | 14 (21.2%) | 80.0 |
| Graduate Degree | 0 (0.0%) | 0.0 |
| Total | 66 (100.0%) | 87.0 |
Fertility by Education by Marriage Status in Country Club
34.8% of women with births in Country Club are unmarried. Women with the educational attainment of high school diploma are most likely to be married with 100.0% of them married at childbirth, while women with the educational attainment of bachelor's degree are least likely to be married with 57.1% of them unmarried at childbirth.
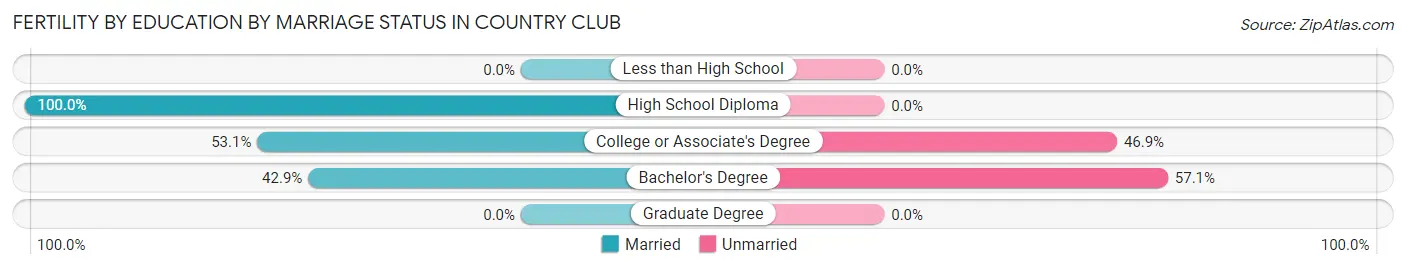
| Educational Attainment | Married | Unmarried |
| Less than High School | 0 (0.0%) | 0 (0.0%) |
| High School Diploma | 20 (100.0%) | 0 (0.0%) |
| College or Associate's Degree | 17 (53.1%) | 15 (46.9%) |
| Bachelor's Degree | 6 (42.9%) | 8 (57.1%) |
| Graduate Degree | 0 (0.0%) | 0 (0.0%) |
| Total | 43 (65.1%) | 23 (34.8%) |
Income in Country Club
Income Overview in Country Club
Per Capita Income in Country Club is $31,954, while median incomes of families and households are $92,581 and $79,688 respectively.
| Characteristic | Number | Measure |
| Per Capita Income | 3,191 | $31,954 |
| Median Family Income | 826 | $92,581 |
| Mean Family Income | 826 | $96,253 |
| Median Household Income | 1,067 | $79,688 |
| Mean Household Income | 1,067 | $90,479 |
| Income Deficit | 826 | $0 |
| Wage / Income Gap (%) | 3,191 | 25.96% |
| Wage / Income Gap ($) | 3,191 | 74.04¢ per $1 |
| Gini / Inequality Index | 3,191 | 0.36 |
Earnings by Sex in Country Club
Average Earnings in Country Club are $43,125, $45,902 for men and $33,987 for women, a difference of 26.0%.
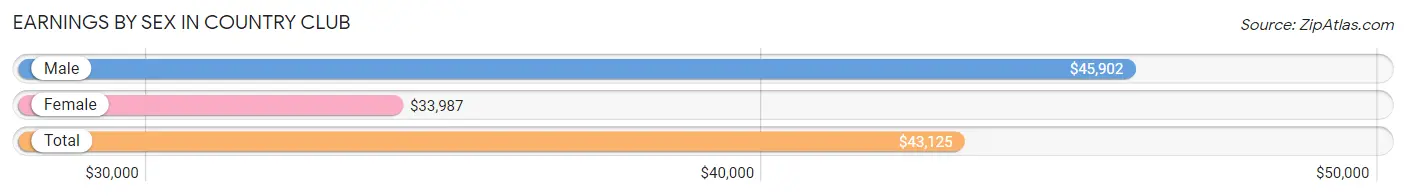
| Sex | Number | Average Earnings |
| Male | 874 (53.5%) | $45,902 |
| Female | 761 (46.5%) | $33,987 |
| Total | 1,635 (100.0%) | $43,125 |
Earnings by Sex by Income Bracket in Country Club
The most common earnings brackets in Country Club are $100,000+ for men (132 | 15.1%) and $55,000 to $64,999 for women (143 | 18.8%).
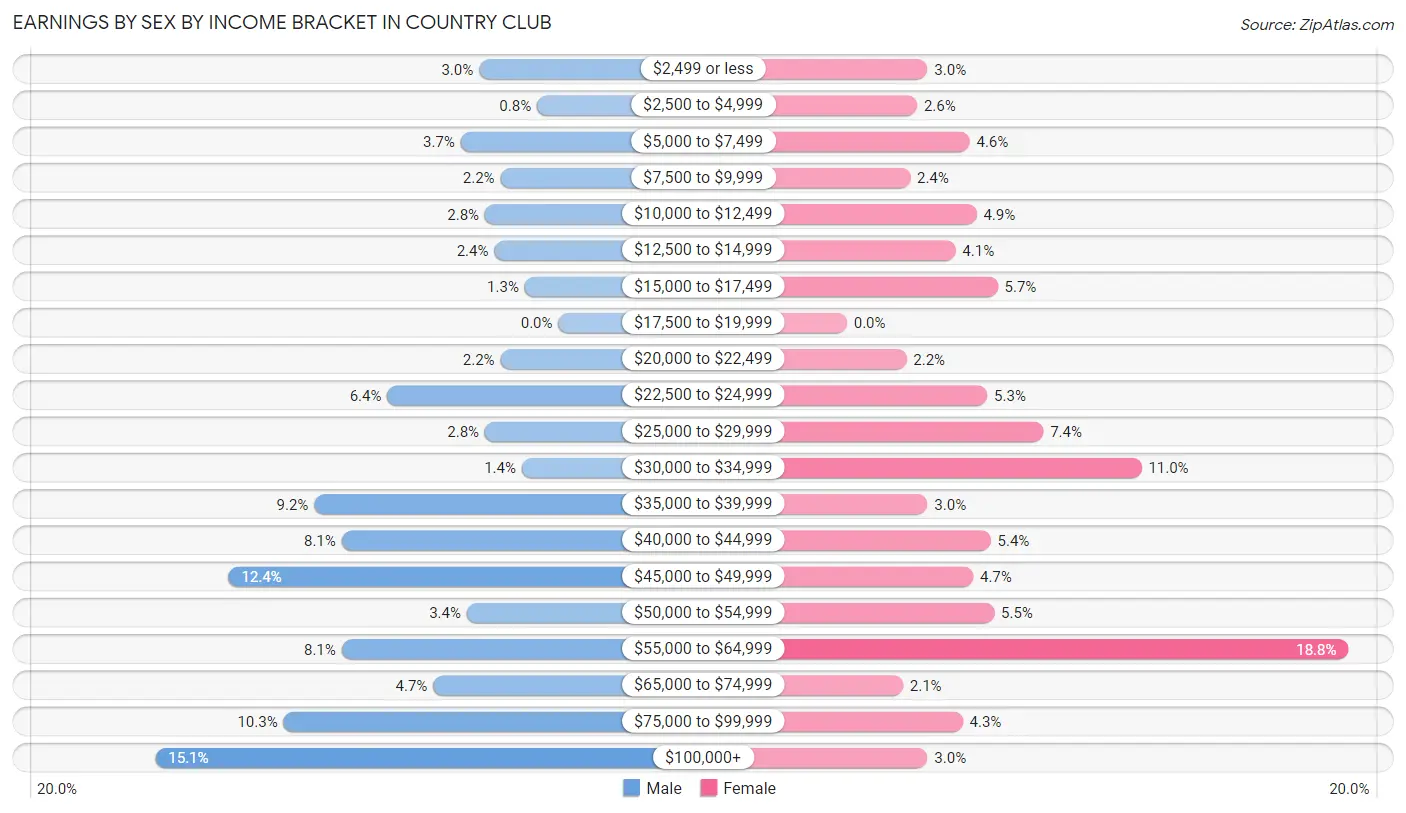
| Income | Male | Female |
| $2,499 or less | 26 (3.0%) | 23 (3.0%) |
| $2,500 to $4,999 | 7 (0.8%) | 20 (2.6%) |
| $5,000 to $7,499 | 32 (3.7%) | 35 (4.6%) |
| $7,500 to $9,999 | 19 (2.2%) | 18 (2.4%) |
| $10,000 to $12,499 | 24 (2.8%) | 37 (4.9%) |
| $12,500 to $14,999 | 21 (2.4%) | 31 (4.1%) |
| $15,000 to $17,499 | 11 (1.3%) | 43 (5.7%) |
| $17,500 to $19,999 | 0 (0.0%) | 0 (0.0%) |
| $20,000 to $22,499 | 19 (2.2%) | 17 (2.2%) |
| $22,500 to $24,999 | 56 (6.4%) | 40 (5.3%) |
| $25,000 to $29,999 | 24 (2.8%) | 56 (7.4%) |
| $30,000 to $34,999 | 12 (1.4%) | 84 (11.0%) |
| $35,000 to $39,999 | 80 (9.1%) | 23 (3.0%) |
| $40,000 to $44,999 | 71 (8.1%) | 41 (5.4%) |
| $45,000 to $49,999 | 108 (12.4%) | 36 (4.7%) |
| $50,000 to $54,999 | 30 (3.4%) | 42 (5.5%) |
| $55,000 to $64,999 | 71 (8.1%) | 143 (18.8%) |
| $65,000 to $74,999 | 41 (4.7%) | 16 (2.1%) |
| $75,000 to $99,999 | 90 (10.3%) | 33 (4.3%) |
| $100,000+ | 132 (15.1%) | 23 (3.0%) |
| Total | 874 (100.0%) | 761 (100.0%) |
Earnings by Sex by Educational Attainment in Country Club
Average earnings in Country Club are $47,152 for men and $43,200 for women, a difference of 8.4%. Men with an educational attainment of college or associate's degree enjoy the highest average annual earnings of $77,955, while those with high school diploma education earn the least with $44,704. Women with an educational attainment of graduate degree earn the most with the average annual earnings of $48,214, while those with high school diploma education have the smallest earnings of $31,250.
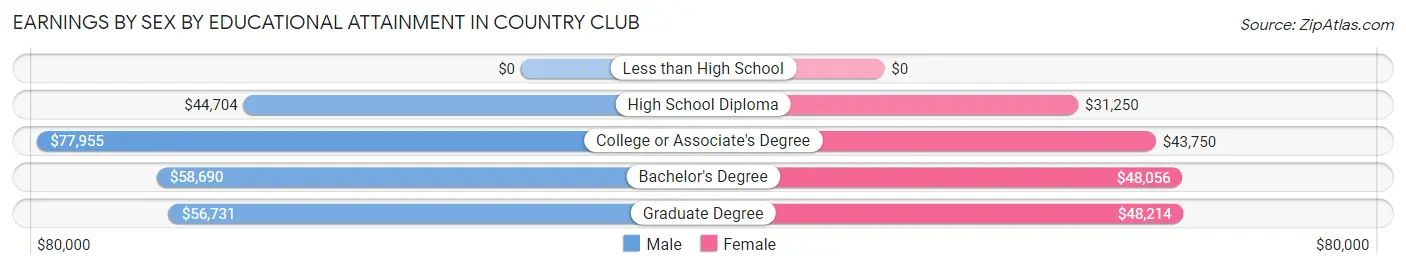
| Educational Attainment | Male Income | Female Income |
| Less than High School | - | - |
| High School Diploma | $44,704 | $31,250 |
| College or Associate's Degree | $77,955 | $43,750 |
| Bachelor's Degree | $58,690 | $48,056 |
| Graduate Degree | $56,731 | $48,214 |
| Total | $47,152 | $43,200 |
Family Income in Country Club
Family Income Brackets in Country Club
According to the Country Club family income data, there are 223 families falling into the $100,000 to $149,999 income range, which is the most common income bracket and makes up 27.0% of all families. Conversely, the less than $10,000 income bracket is the least frequent group with only 6 families (0.7%) belonging to this category.
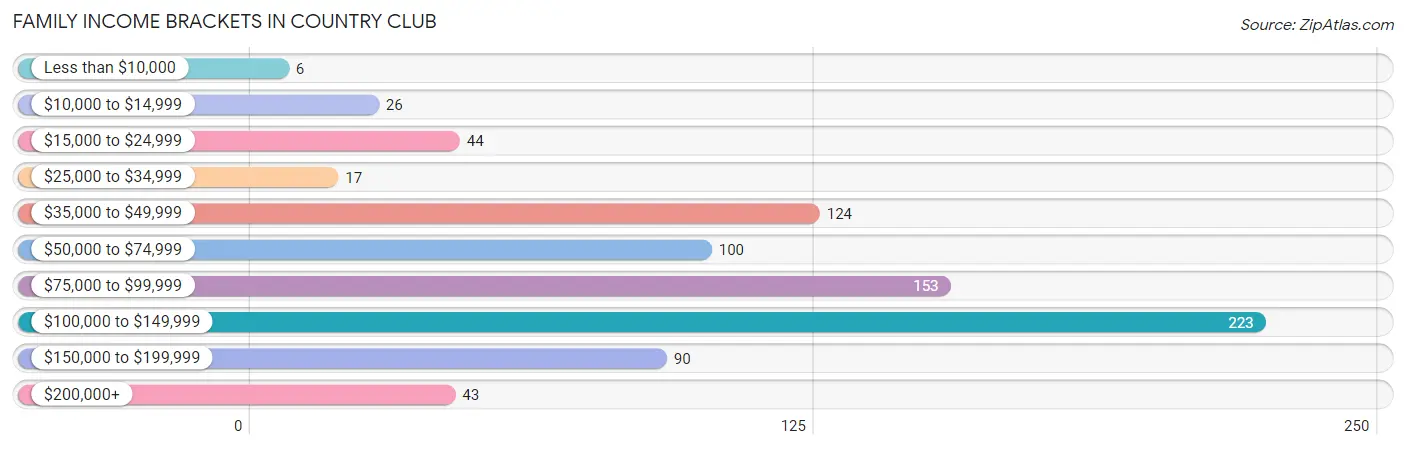
| Income Bracket | # Families | % Families |
| Less than $10,000 | 6 | 0.7% |
| $10,000 to $14,999 | 26 | 3.1% |
| $15,000 to $24,999 | 44 | 5.3% |
| $25,000 to $34,999 | 17 | 2.1% |
| $35,000 to $49,999 | 124 | 15.0% |
| $50,000 to $74,999 | 100 | 12.1% |
| $75,000 to $99,999 | 153 | 18.5% |
| $100,000 to $149,999 | 223 | 27.0% |
| $150,000 to $199,999 | 90 | 10.9% |
| $200,000+ | 43 | 5.2% |
Family Income by Famaliy Size in Country Club
3-person families (160 | 19.4%) account for the highest median family income in Country Club with $107,917 per family, while 2-person families (412 | 49.9%) have the highest median income of $36,719 per family member.
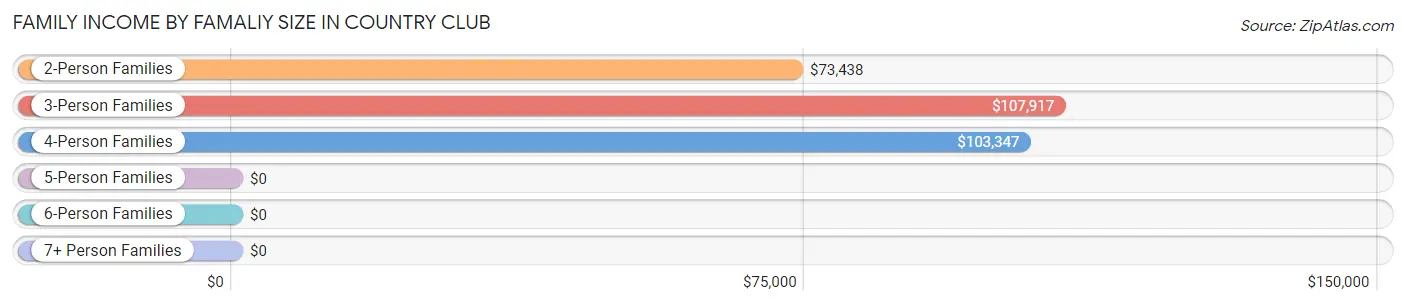
| Income Bracket | # Families | Median Income |
| 2-Person Families | 412 (49.9%) | $73,438 |
| 3-Person Families | 160 (19.4%) | $107,917 |
| 4-Person Families | 194 (23.5%) | $103,347 |
| 5-Person Families | 44 (5.3%) | $0 |
| 6-Person Families | 12 (1.5%) | $0 |
| 7+ Person Families | 4 (0.5%) | $0 |
| Total | 826 (100.0%) | $92,581 |
Family Income by Number of Earners in Country Club
The median family income in Country Club is $92,581, with families comprising 3+ earners (56) having the highest median family income of $111,071, while families with no earners (147) have the lowest median family income of $37,321, accounting for 6.8% and 17.8% of families, respectively.
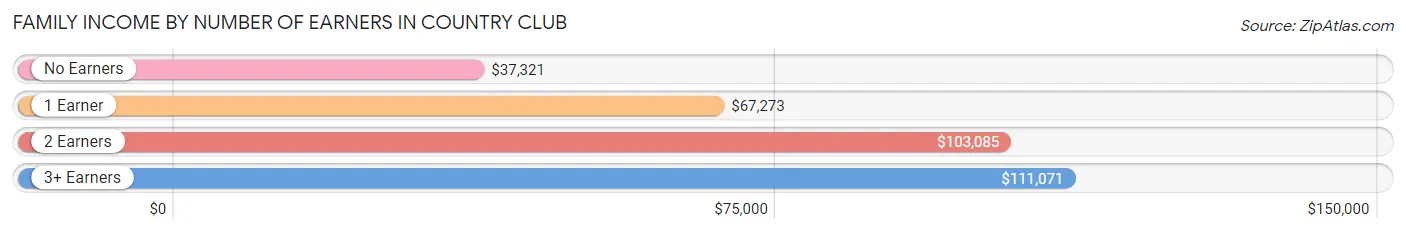
| Number of Earners | # Families | Median Income |
| No Earners | 147 (17.8%) | $37,321 |
| 1 Earner | 240 (29.1%) | $67,273 |
| 2 Earners | 383 (46.4%) | $103,085 |
| 3+ Earners | 56 (6.8%) | $111,071 |
| Total | 826 (100.0%) | $92,581 |
Household Income in Country Club
Household Income Brackets in Country Club
With 243 households falling in the category, the $100,000 to $149,999 income range is the most frequent in Country Club, accounting for 22.8% of all households. In contrast, only 6 households (0.6%) fall into the less than $10,000 income bracket, making it the least populous group.
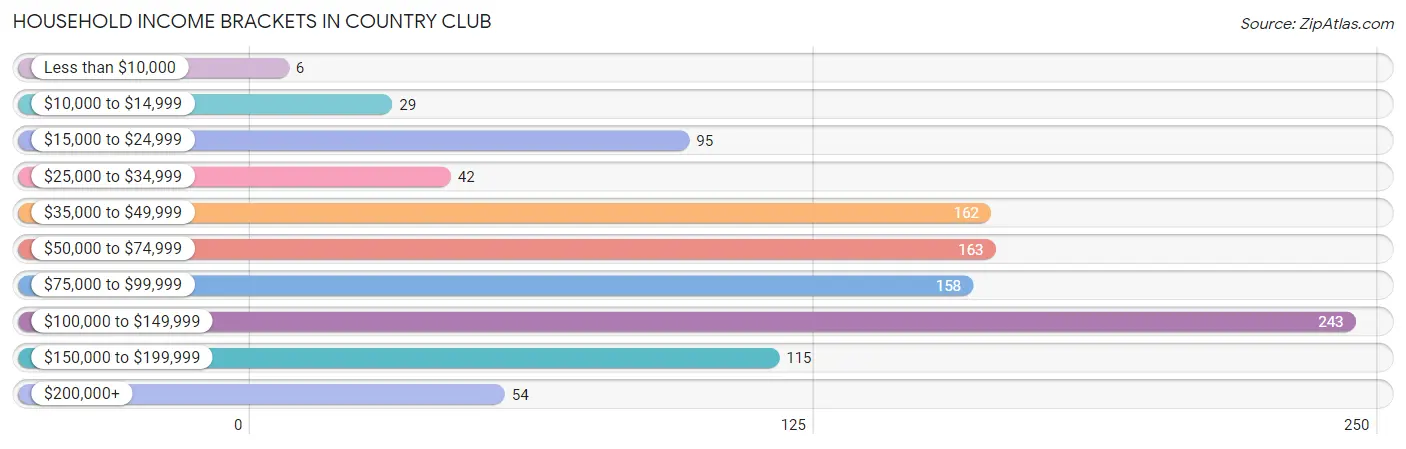
| Income Bracket | # Households | % Households |
| Less than $10,000 | 6 | 0.6% |
| $10,000 to $14,999 | 29 | 2.7% |
| $15,000 to $24,999 | 95 | 8.9% |
| $25,000 to $34,999 | 42 | 3.9% |
| $35,000 to $49,999 | 162 | 15.2% |
| $50,000 to $74,999 | 163 | 15.3% |
| $75,000 to $99,999 | 158 | 14.8% |
| $100,000 to $149,999 | 243 | 22.8% |
| $150,000 to $199,999 | 115 | 10.8% |
| $200,000+ | 54 | 5.1% |
Household Income by Householder Age in Country Club
The median household income in Country Club is $79,688, with the highest median household income of $94,583 found in the 25 to 44 years age bracket for the primary householder. A total of 413 households (38.7%) fall into this category. Meanwhile, the 65+ years age bracket for the primary householder has the lowest median household income of $54,145, with 245 households (23.0%) in this group.
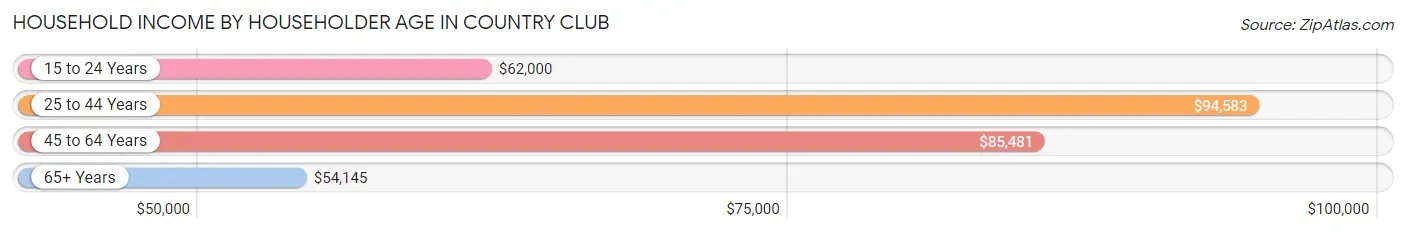
| Income Bracket | # Households | Median Income |
| 15 to 24 Years | 50 (4.7%) | $62,000 |
| 25 to 44 Years | 413 (38.7%) | $94,583 |
| 45 to 64 Years | 359 (33.7%) | $85,481 |
| 65+ Years | 245 (23.0%) | $54,145 |
| Total | 1,067 (100.0%) | $79,688 |
Poverty in Country Club
Income Below Poverty by Sex and Age in Country Club
With 9.0% poverty level for males and 10.7% for females among the residents of Country Club, 6 to 11 year old males and 6 to 11 year old females are the most vulnerable to poverty, with 73 males (42.7%) and 73 females (51.0%) in their respective age groups living below the poverty level.
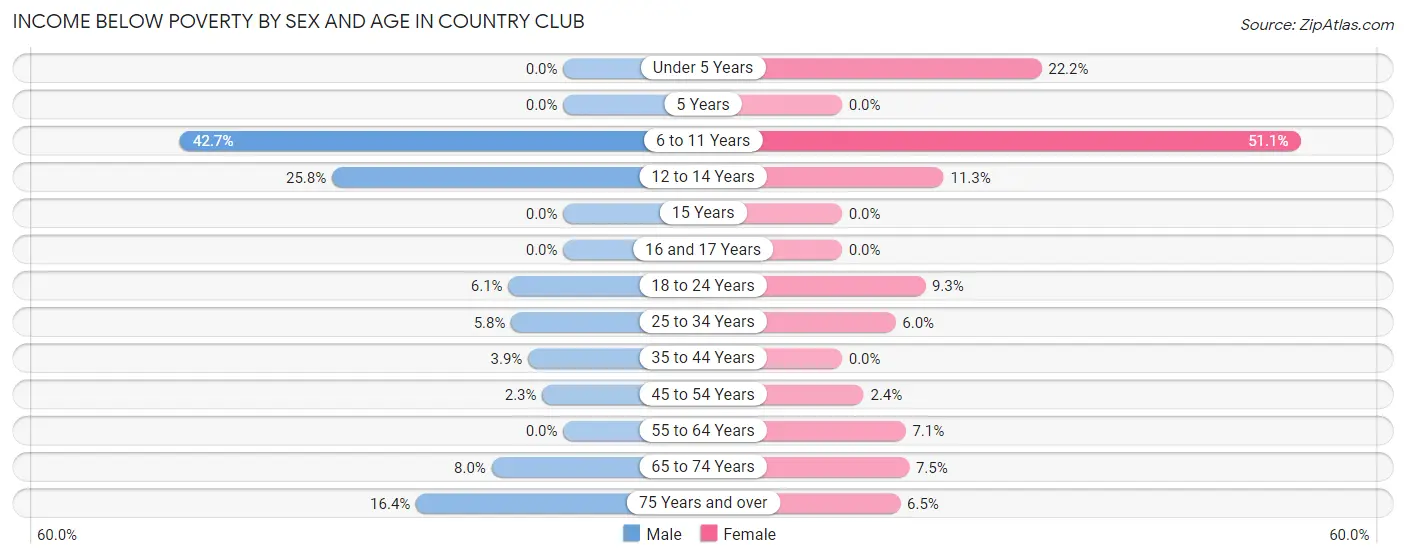
| Age Bracket | Male | Female |
| Under 5 Years | 0 (0.0%) | 16 (22.2%) |
| 5 Years | 0 (0.0%) | 0 (0.0%) |
| 6 to 11 Years | 73 (42.7%) | 73 (51.0%) |
| 12 to 14 Years | 17 (25.8%) | 17 (11.3%) |
| 15 Years | 0 (0.0%) | 0 (0.0%) |
| 16 and 17 Years | 0 (0.0%) | 0 (0.0%) |
| 18 to 24 Years | 6 (6.1%) | 15 (9.3%) |
| 25 to 34 Years | 8 (5.8%) | 14 (6.0%) |
| 35 to 44 Years | 12 (3.9%) | 0 (0.0%) |
| 45 to 54 Years | 5 (2.3%) | 4 (2.4%) |
| 55 to 64 Years | 0 (0.0%) | 10 (7.1%) |
| 65 to 74 Years | 13 (8.0%) | 11 (7.5%) |
| 75 Years and over | 10 (16.4%) | 5 (6.5%) |
| Total | 144 (9.0%) | 165 (10.7%) |
Income Above Poverty by Sex and Age in Country Club
According to the poverty statistics in Country Club, males aged under 5 years and females aged 15 years are the age groups that are most secure financially, with 100.0% of males and 100.0% of females in these age groups living above the poverty line.
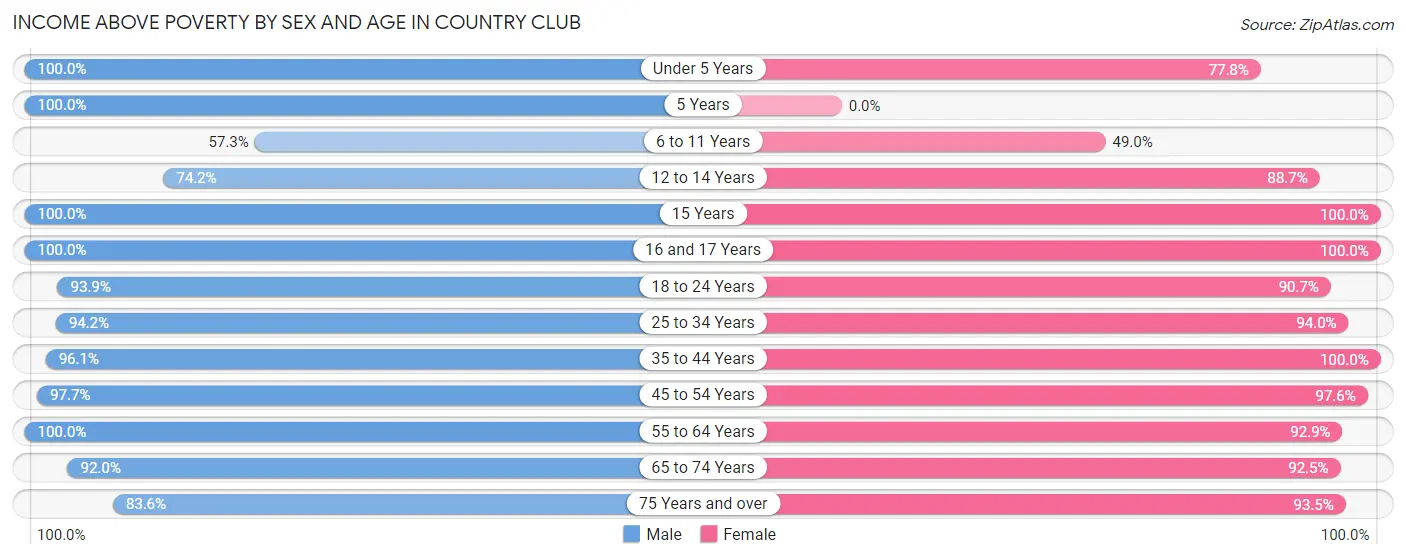
| Age Bracket | Male | Female |
| Under 5 Years | 141 (100.0%) | 56 (77.8%) |
| 5 Years | 8 (100.0%) | 0 (0.0%) |
| 6 to 11 Years | 98 (57.3%) | 70 (48.9%) |
| 12 to 14 Years | 49 (74.2%) | 133 (88.7%) |
| 15 Years | 42 (100.0%) | 8 (100.0%) |
| 16 and 17 Years | 36 (100.0%) | 44 (100.0%) |
| 18 to 24 Years | 92 (93.9%) | 147 (90.7%) |
| 25 to 34 Years | 130 (94.2%) | 221 (94.0%) |
| 35 to 44 Years | 294 (96.1%) | 202 (100.0%) |
| 45 to 54 Years | 209 (97.7%) | 161 (97.6%) |
| 55 to 64 Years | 151 (100.0%) | 131 (92.9%) |
| 65 to 74 Years | 150 (92.0%) | 136 (92.5%) |
| 75 Years and over | 51 (83.6%) | 72 (93.5%) |
| Total | 1,451 (91.0%) | 1,381 (89.3%) |
Income Below Poverty Among Married-Couple Families in Country Club
The poverty statistics for married-couple families in Country Club show that 3.4% or 23 of the total 686 families live below the poverty line. Families with 3 or 4 children have the highest poverty rate of 23.1%, comprising of 6 families. On the other hand, families with 1 or 2 children have the lowest poverty rate of 0.0%, which includes 0 families.
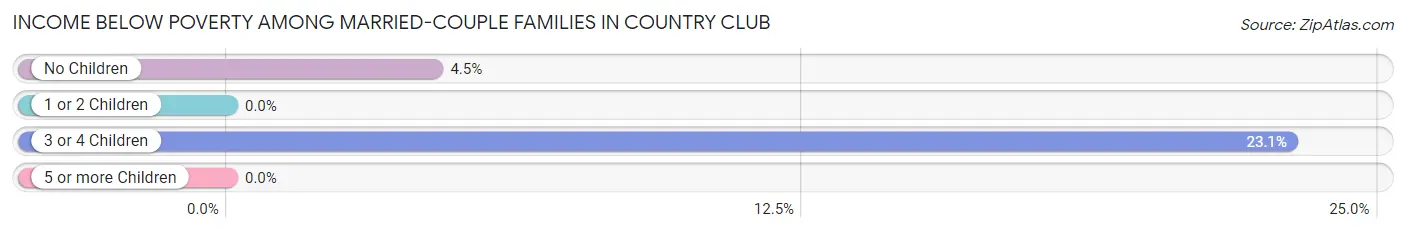
| Children | Above Poverty | Below Poverty |
| No Children | 363 (95.5%) | 17 (4.5%) |
| 1 or 2 Children | 280 (100.0%) | 0 (0.0%) |
| 3 or 4 Children | 20 (76.9%) | 6 (23.1%) |
| 5 or more Children | 0 (0.0%) | 0 (0.0%) |
| Total | 663 (96.7%) | 23 (3.4%) |
Income Below Poverty Among Single-Parent Households in Country Club
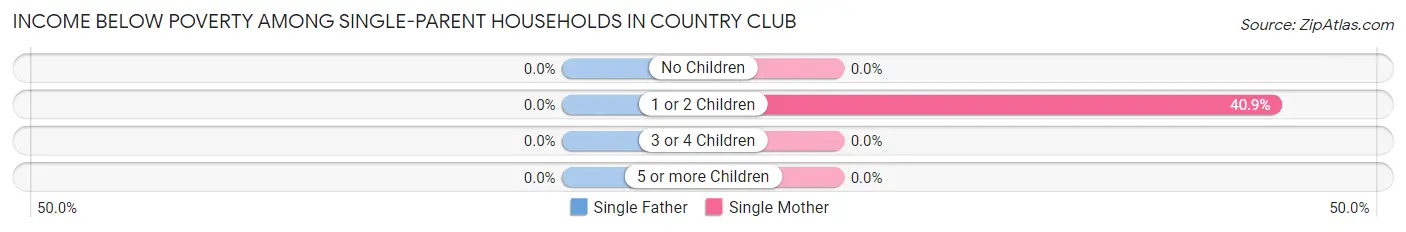
| Children | Single Father | Single Mother |
| No Children | 0 (0.0%) | 0 (0.0%) |
| 1 or 2 Children | 0 (0.0%) | 29 (40.8%) |
| 3 or 4 Children | 0 (0.0%) | 0 (0.0%) |
| 5 or more Children | 0 (0.0%) | 0 (0.0%) |
| Total | 0 (0.0%) | 29 (26.9%) |
Income Below Poverty Among Married-Couple vs Single-Parent Households in Country Club
The poverty data for Country Club shows that 23 of the married-couple family households (3.4%) and 29 of the single-parent households (20.7%) are living below the poverty level. Within the married-couple family households, those with 3 or 4 children have the highest poverty rate, with 6 households (23.1%) falling below the poverty line. Among the single-parent households, those with 1 or 2 children have the highest poverty rate, with 29 household (32.6%) living below poverty.
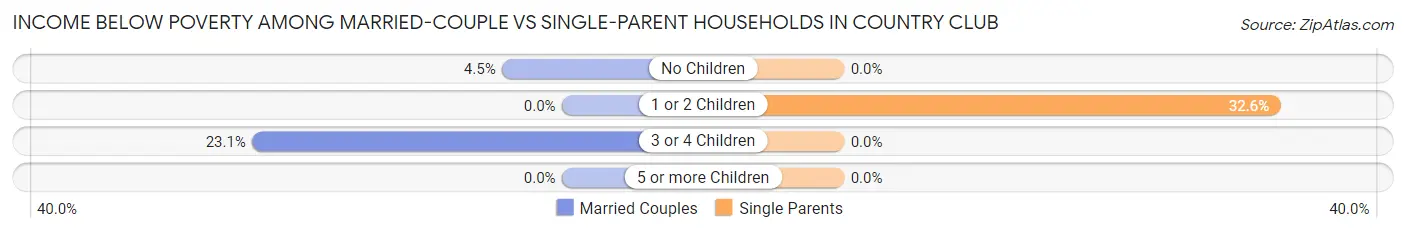
| Children | Married-Couple Families | Single-Parent Households |
| No Children | 17 (4.5%) | 0 (0.0%) |
| 1 or 2 Children | 0 (0.0%) | 29 (32.6%) |
| 3 or 4 Children | 6 (23.1%) | 0 (0.0%) |
| 5 or more Children | 0 (0.0%) | 0 (0.0%) |
| Total | 23 (3.4%) | 29 (20.7%) |
Employment Characteristics in Country Club
Employment by Class of Employer in Country Club
Among the 1,493 employed individuals in Country Club, private company employees (916 | 61.4%), not-for-profit organizations (177 | 11.9%), and federal government employees (103 | 6.9%) make up the most common classes of employment.
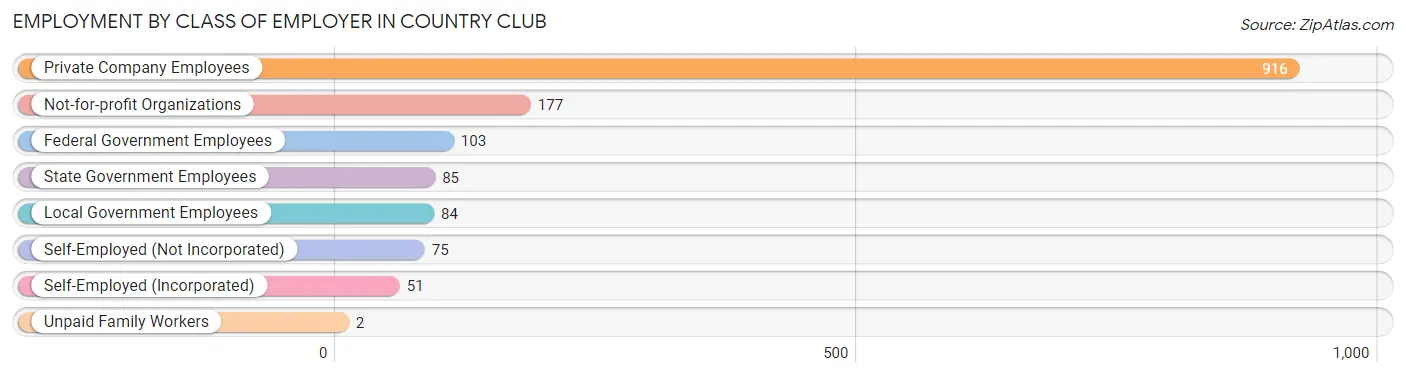
| Employer Class | # Employees | % Employees |
| Private Company Employees | 916 | 61.4% |
| Self-Employed (Incorporated) | 51 | 3.4% |
| Self-Employed (Not Incorporated) | 75 | 5.0% |
| Not-for-profit Organizations | 177 | 11.9% |
| Local Government Employees | 84 | 5.6% |
| State Government Employees | 85 | 5.7% |
| Federal Government Employees | 103 | 6.9% |
| Unpaid Family Workers | 2 | 0.1% |
| Total | 1,493 | 100.0% |
Employment Status by Age in Country Club
According to the labor force statistics for Country Club, out of the total population over 16 years of age (2,340), 68.6% or 1,605 individuals are in the labor force, with 6.3% or 101 of them unemployed. The age group with the highest labor force participation rate is 35 to 44 years, with 94.9% or 482 individuals in the labor force. Within the labor force, the 55 to 59 years age range has the highest percentage of unemployed individuals, with 20.5% or 27 of them being unemployed.
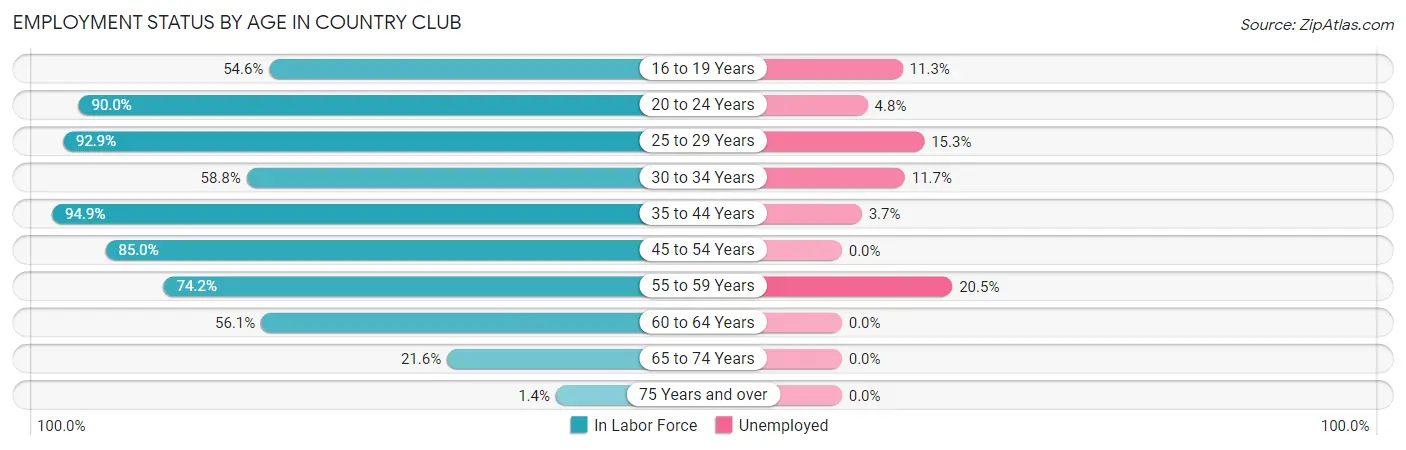
| Age Bracket | In Labor Force | Unemployed |
| 16 to 19 Years | 71 (54.6%) | 8 (11.3%) |
| 20 to 24 Years | 189 (90.0%) | 9 (4.8%) |
| 25 to 29 Years | 157 (92.9%) | 24 (15.3%) |
| 30 to 34 Years | 120 (58.8%) | 14 (11.7%) |
| 35 to 44 Years | 482 (94.9%) | 18 (3.7%) |
| 45 to 54 Years | 322 (85.0%) | 0 (0.0%) |
| 55 to 59 Years | 132 (74.2%) | 27 (20.5%) |
| 60 to 64 Years | 64 (56.1%) | 0 (0.0%) |
| 65 to 74 Years | 67 (21.6%) | 0 (0.0%) |
| 75 Years and over | 2 (1.4%) | 0 (0.0%) |
| Total | 1,605 (68.6%) | 101 (6.3%) |
Employment Status by Educational Attainment in Country Club
According to labor force statistics for Country Club, 82.3% of individuals (1,277) out of the total population between 25 and 64 years of age (1,552) are in the labor force, with 6.7% or 86 of them being unemployed. The group with the highest labor force participation rate are those with the educational attainment of high school diploma, with 95.5% or 441 individuals in the labor force. Within the labor force, individuals with college / associate degree education have the highest percentage of unemployment, with 9.5% or 34 of them being unemployed.
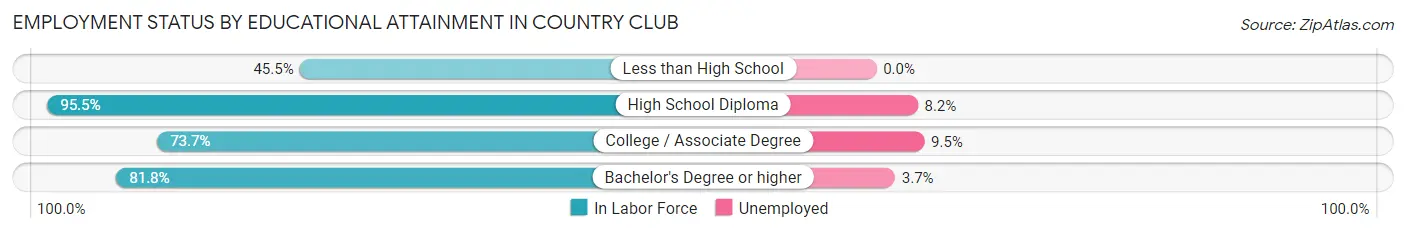
| Educational Attainment | In Labor Force | Unemployed |
| Less than High School | 20 (45.5%) | 0 (0.0%) |
| High School Diploma | 441 (95.5%) | 38 (8.2%) |
| College / Associate Degree | 358 (73.7%) | 46 (9.5%) |
| Bachelor's Degree or higher | 458 (81.8%) | 21 (3.7%) |
| Total | 1,277 (82.3%) | 104 (6.7%) |
Employment Occupations by Sex in Country Club
Management, Business, Science and Arts Occupations
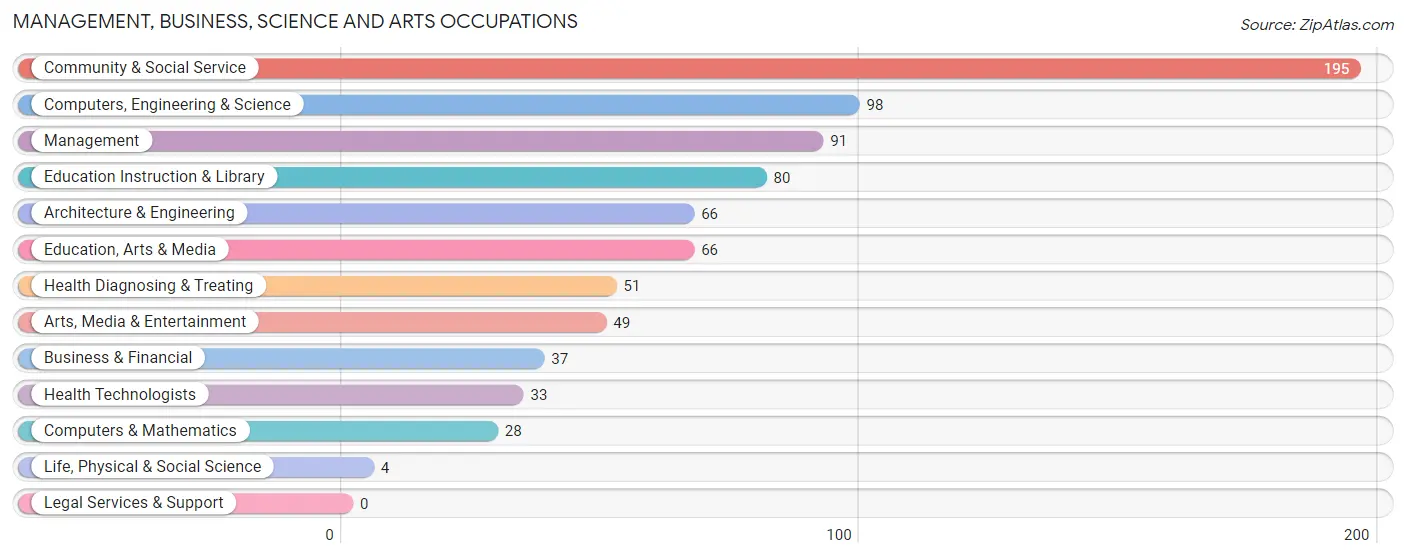
The most common Management, Business, Science and Arts occupations in Country Club are Community & Social Service (195 | 13.6%), Computers, Engineering & Science (98 | 6.8%), Management (91 | 6.3%), Education Instruction & Library (80 | 5.6%), and Architecture & Engineering (66 | 4.6%).
Management, Business, Science and Arts Occupations by Sex
Within the Management, Business, Science and Arts occupations in Country Club, the most male-oriented occupations are Architecture & Engineering (100.0%), Life, Physical & Social Science (100.0%), and Computers, Engineering & Science (93.9%), while the most female-oriented occupations are Health Technologists (100.0%), Health Diagnosing & Treating (90.2%), and Education Instruction & Library (86.3%).
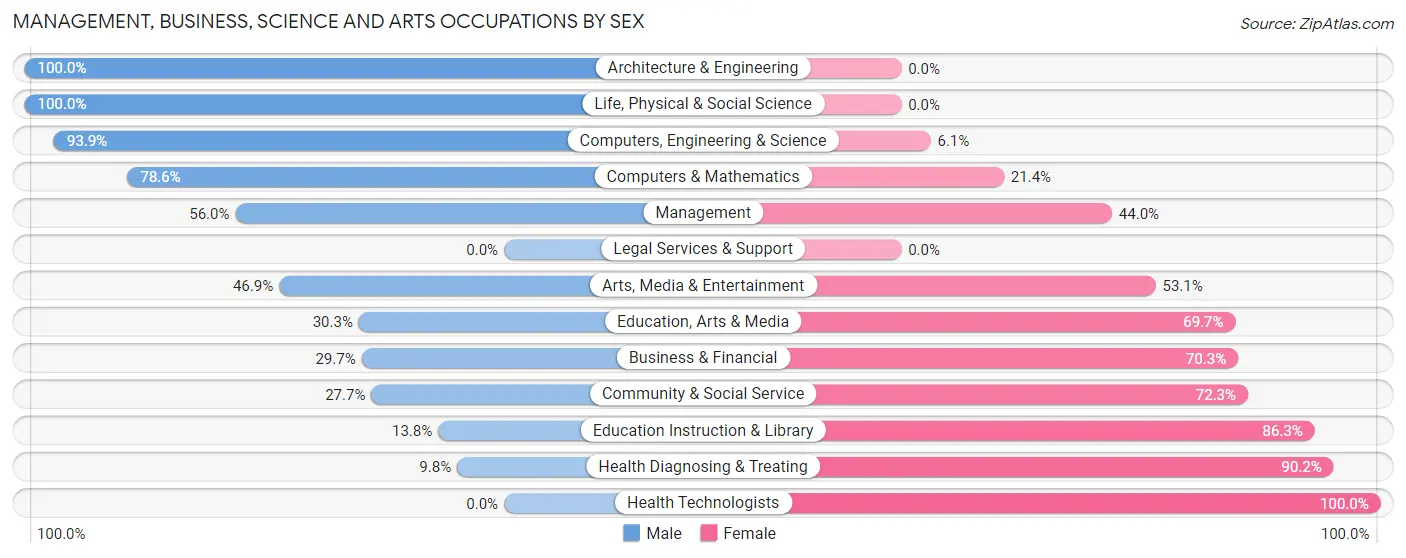
| Occupation | Male | Female |
| Management | 51 (56.0%) | 40 (44.0%) |
| Business & Financial | 11 (29.7%) | 26 (70.3%) |
| Computers, Engineering & Science | 92 (93.9%) | 6 (6.1%) |
| Computers & Mathematics | 22 (78.6%) | 6 (21.4%) |
| Architecture & Engineering | 66 (100.0%) | 0 (0.0%) |
| Life, Physical & Social Science | 4 (100.0%) | 0 (0.0%) |
| Community & Social Service | 54 (27.7%) | 141 (72.3%) |
| Education, Arts & Media | 20 (30.3%) | 46 (69.7%) |
| Legal Services & Support | 0 (0.0%) | 0 (0.0%) |
| Education Instruction & Library | 11 (13.8%) | 69 (86.3%) |
| Arts, Media & Entertainment | 23 (46.9%) | 26 (53.1%) |
| Health Diagnosing & Treating | 5 (9.8%) | 46 (90.2%) |
| Health Technologists | 0 (0.0%) | 33 (100.0%) |
| Total (Category) | 213 (45.1%) | 259 (54.9%) |
| Total (Overall) | 807 (56.2%) | 628 (43.8%) |
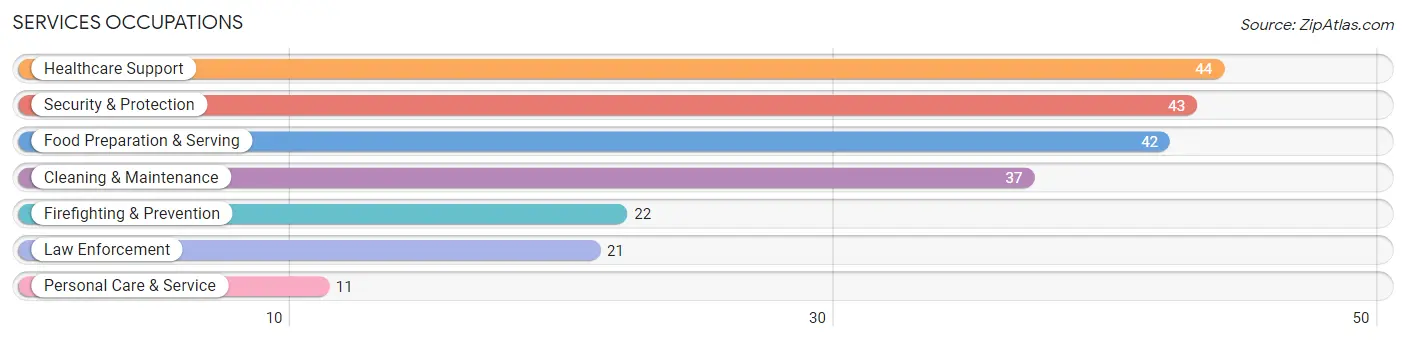
Services Occupations
The most common Services occupations in Country Club are Healthcare Support (44 | 3.1%), Security & Protection (43 | 3.0%), Food Preparation & Serving (42 | 2.9%), Cleaning & Maintenance (37 | 2.6%), and Firefighting & Prevention (22 | 1.5%).
Services Occupations by Sex
Within the Services occupations in Country Club, the most male-oriented occupations are Security & Protection (100.0%), Firefighting & Prevention (100.0%), and Law Enforcement (100.0%), while the most female-oriented occupations are Healthcare Support (100.0%), Personal Care & Service (100.0%), and Cleaning & Maintenance (59.5%).
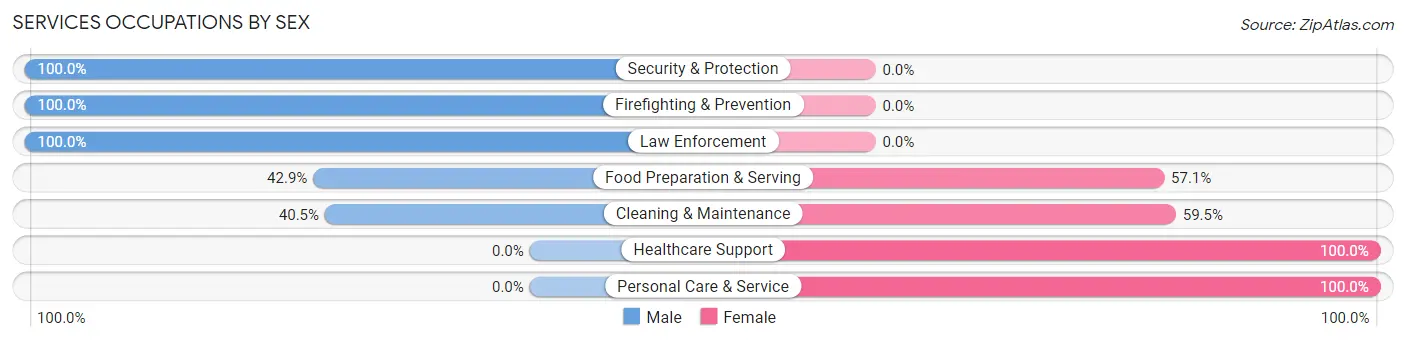
| Occupation | Male | Female |
| Healthcare Support | 0 (0.0%) | 44 (100.0%) |
| Security & Protection | 43 (100.0%) | 0 (0.0%) |
| Firefighting & Prevention | 22 (100.0%) | 0 (0.0%) |
| Law Enforcement | 21 (100.0%) | 0 (0.0%) |
| Food Preparation & Serving | 18 (42.9%) | 24 (57.1%) |
| Cleaning & Maintenance | 15 (40.5%) | 22 (59.5%) |
| Personal Care & Service | 0 (0.0%) | 11 (100.0%) |
| Total (Category) | 76 (42.9%) | 101 (57.1%) |
| Total (Overall) | 807 (56.2%) | 628 (43.8%) |
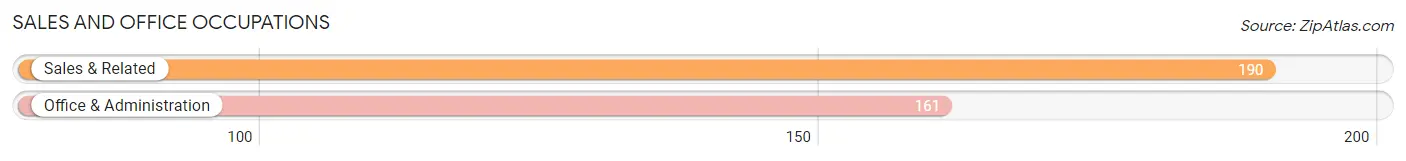
Sales and Office Occupations
The most common Sales and Office occupations in Country Club are Sales & Related (190 | 13.2%), and Office & Administration (161 | 11.2%).
Sales and Office Occupations by Sex
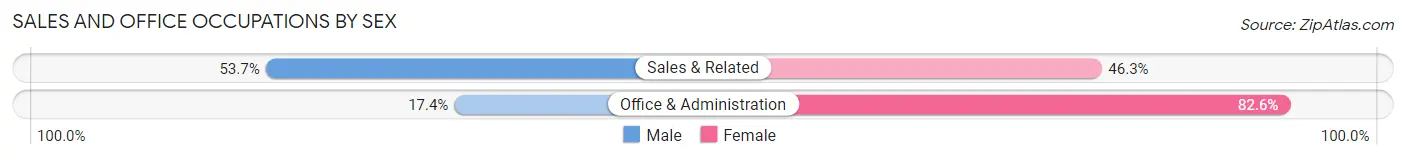
| Occupation | Male | Female |
| Sales & Related | 102 (53.7%) | 88 (46.3%) |
| Office & Administration | 28 (17.4%) | 133 (82.6%) |
| Total (Category) | 130 (37.0%) | 221 (63.0%) |
| Total (Overall) | 807 (56.2%) | 628 (43.8%) |
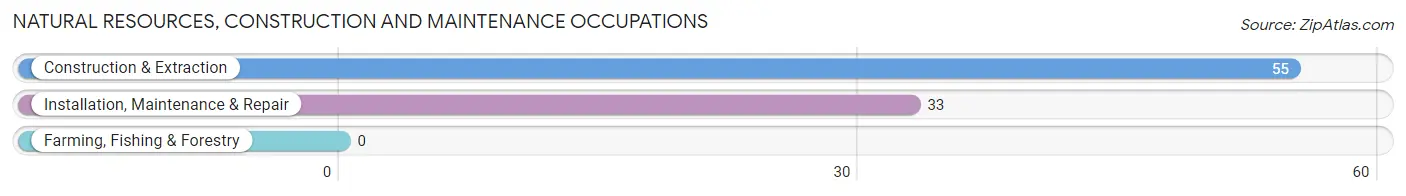
Natural Resources, Construction and Maintenance Occupations
The most common Natural Resources, Construction and Maintenance occupations in Country Club are Construction & Extraction (55 | 3.8%), and Installation, Maintenance & Repair (33 | 2.3%).
Natural Resources, Construction and Maintenance Occupations by Sex
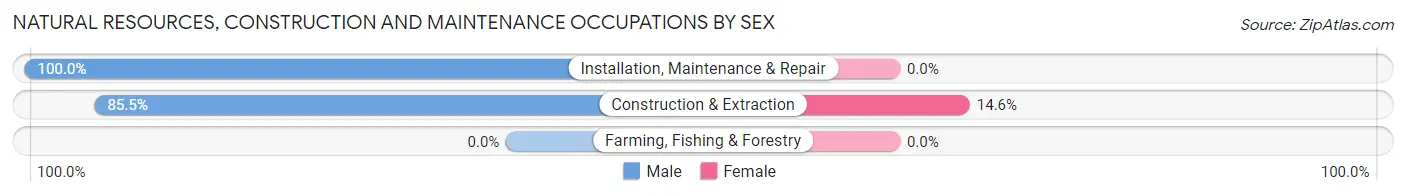
| Occupation | Male | Female |
| Farming, Fishing & Forestry | 0 (0.0%) | 0 (0.0%) |
| Construction & Extraction | 47 (85.5%) | 8 (14.5%) |
| Installation, Maintenance & Repair | 33 (100.0%) | 0 (0.0%) |
| Total (Category) | 80 (90.9%) | 8 (9.1%) |
| Total (Overall) | 807 (56.2%) | 628 (43.8%) |
Production, Transportation and Moving Occupations
The most common Production, Transportation and Moving occupations in Country Club are Production (194 | 13.5%), Material Moving (104 | 7.2%), and Transportation (49 | 3.4%).
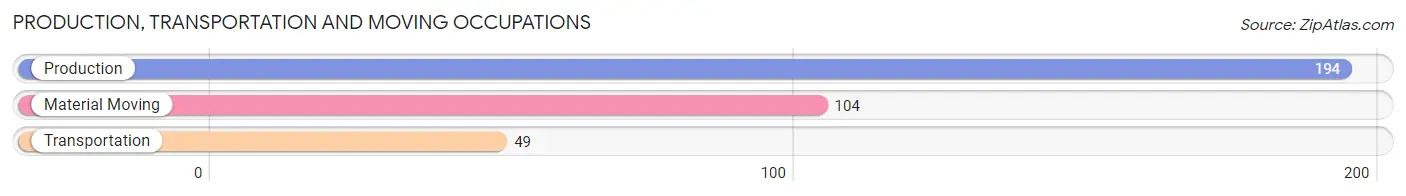
Production, Transportation and Moving Occupations by Sex
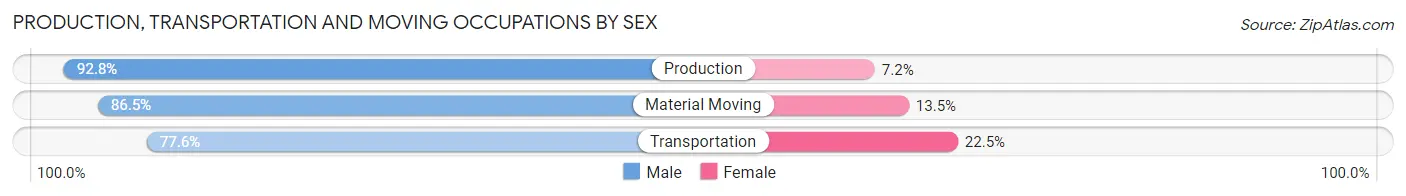
| Occupation | Male | Female |
| Production | 180 (92.8%) | 14 (7.2%) |
| Transportation | 38 (77.5%) | 11 (22.5%) |
| Material Moving | 90 (86.5%) | 14 (13.5%) |
| Total (Category) | 308 (88.8%) | 39 (11.2%) |
| Total (Overall) | 807 (56.2%) | 628 (43.8%) |
Employment Industries by Sex in Country Club
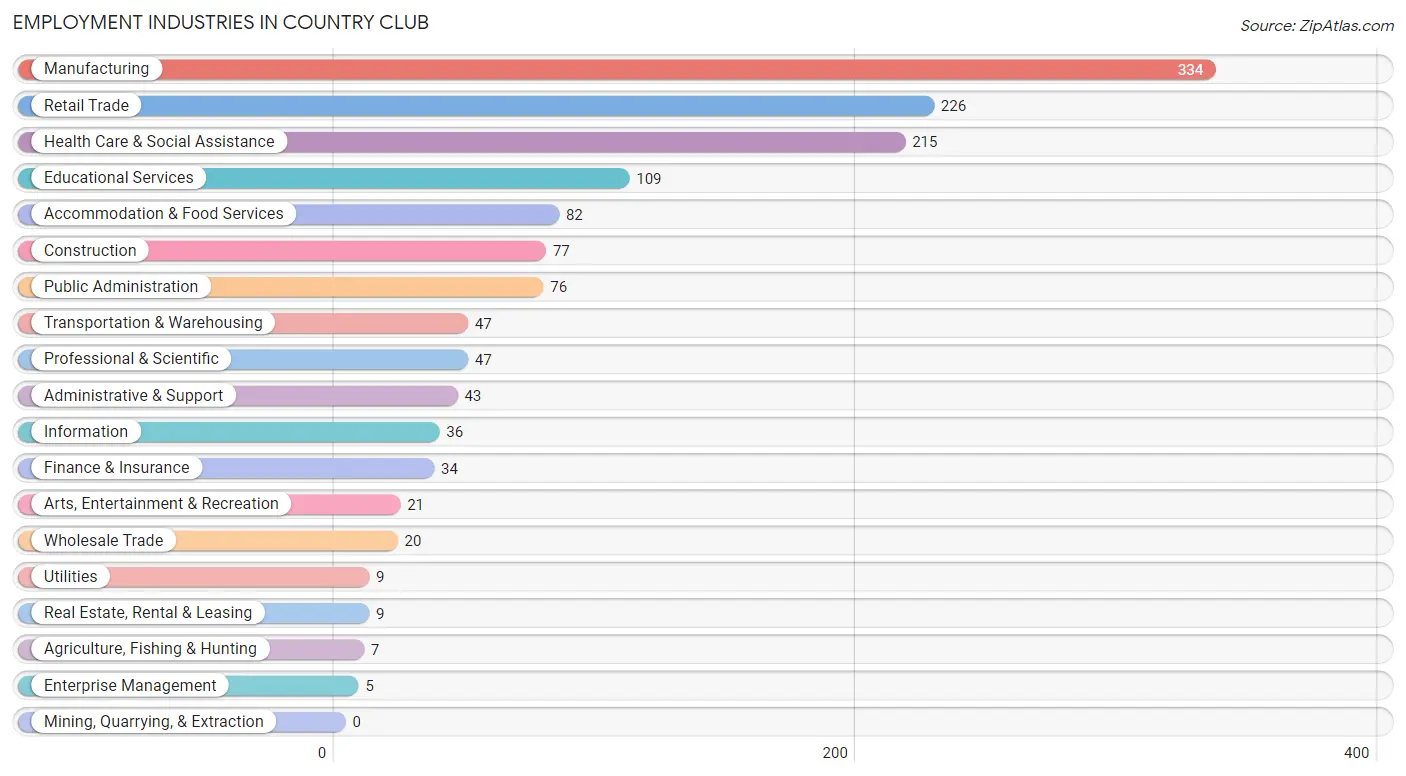
Employment Industries in Country Club
The major employment industries in Country Club include Manufacturing (334 | 23.3%), Retail Trade (226 | 15.8%), Health Care & Social Assistance (215 | 15.0%), Educational Services (109 | 7.6%), and Accommodation & Food Services (82 | 5.7%).
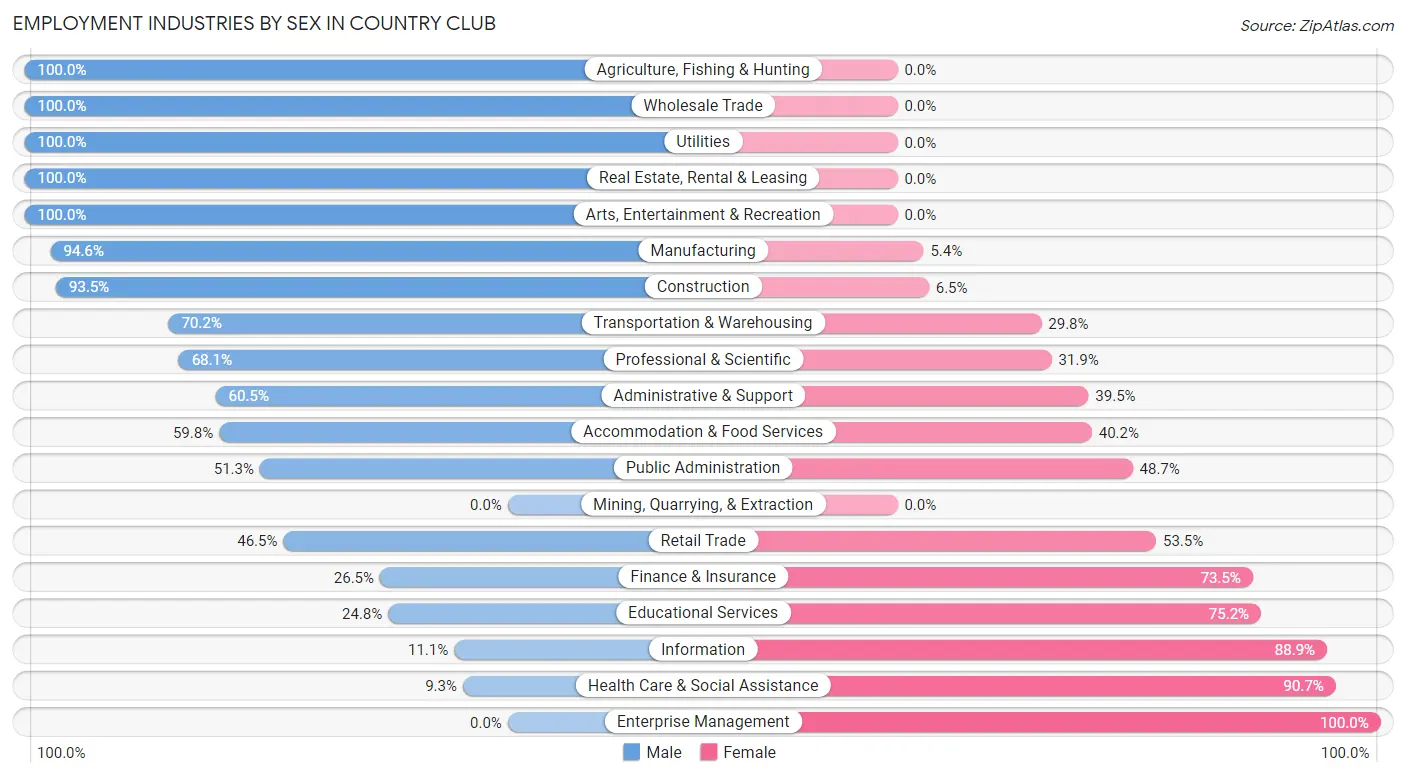
Employment Industries by Sex in Country Club
The Country Club industries that see more men than women are Agriculture, Fishing & Hunting (100.0%), Wholesale Trade (100.0%), and Utilities (100.0%), whereas the industries that tend to have a higher number of women are Enterprise Management (100.0%), Health Care & Social Assistance (90.7%), and Information (88.9%).
| Industry | Male | Female |
| Agriculture, Fishing & Hunting | 7 (100.0%) | 0 (0.0%) |
| Mining, Quarrying, & Extraction | 0 (0.0%) | 0 (0.0%) |
| Construction | 72 (93.5%) | 5 (6.5%) |
| Manufacturing | 316 (94.6%) | 18 (5.4%) |
| Wholesale Trade | 20 (100.0%) | 0 (0.0%) |
| Retail Trade | 105 (46.5%) | 121 (53.5%) |
| Transportation & Warehousing | 33 (70.2%) | 14 (29.8%) |
| Utilities | 9 (100.0%) | 0 (0.0%) |
| Information | 4 (11.1%) | 32 (88.9%) |
| Finance & Insurance | 9 (26.5%) | 25 (73.5%) |
| Real Estate, Rental & Leasing | 9 (100.0%) | 0 (0.0%) |
| Professional & Scientific | 32 (68.1%) | 15 (31.9%) |
| Enterprise Management | 0 (0.0%) | 5 (100.0%) |
| Administrative & Support | 26 (60.5%) | 17 (39.5%) |
| Educational Services | 27 (24.8%) | 82 (75.2%) |
| Health Care & Social Assistance | 20 (9.3%) | 195 (90.7%) |
| Arts, Entertainment & Recreation | 21 (100.0%) | 0 (0.0%) |
| Accommodation & Food Services | 49 (59.8%) | 33 (40.2%) |
| Public Administration | 39 (51.3%) | 37 (48.7%) |
| Total | 807 (56.2%) | 628 (43.8%) |
Education in Country Club
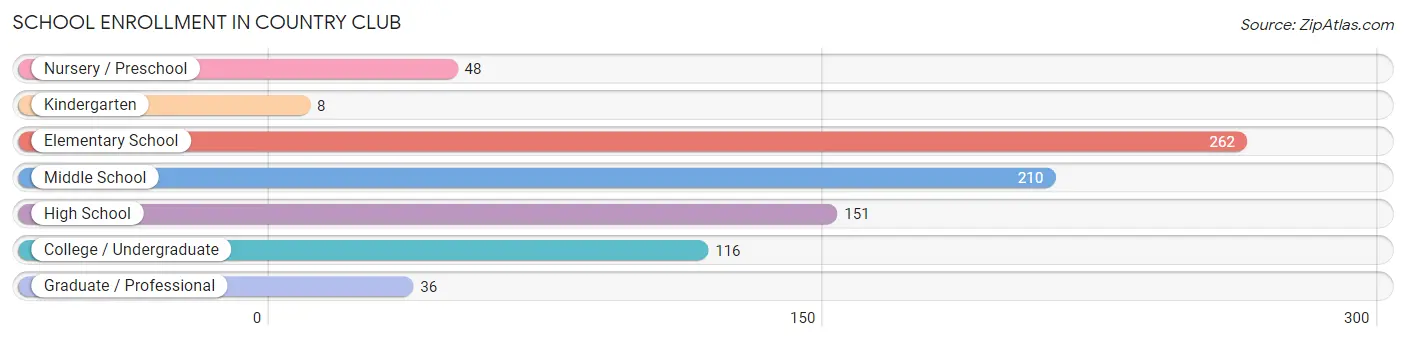
School Enrollment in Country Club
The most common levels of schooling among the 831 students in Country Club are elementary school (262 | 31.5%), middle school (210 | 25.3%), and high school (151 | 18.2%).
| School Level | # Students | % Students |
| Nursery / Preschool | 48 | 5.8% |
| Kindergarten | 8 | 1.0% |
| Elementary School | 262 | 31.5% |
| Middle School | 210 | 25.3% |
| High School | 151 | 18.2% |
| College / Undergraduate | 116 | 14.0% |
| Graduate / Professional | 36 | 4.3% |
| Total | 831 | 100.0% |
School Enrollment by Age by Funding Source in Country Club
Out of a total of 831 students who are enrolled in schools in Country Club, 67 (8.1%) attend a private institution, while the remaining 764 (91.9%) are enrolled in public schools. The age group of 35 years and over has the highest likelihood of being enrolled in private schools, with 6 (26.1% in the age bracket) enrolled. Conversely, the age group of 18 to 19 year olds has the lowest likelihood of being enrolled in a private school, with 32 (100.0% in the age bracket) attending a public institution.
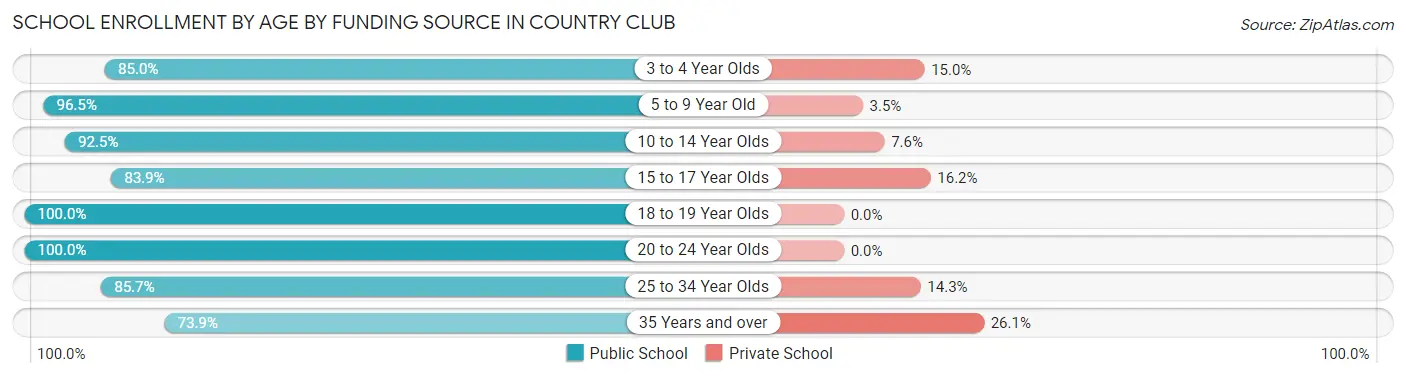
| Age Bracket | Public School | Private School |
| 3 to 4 Year Olds | 34 (85.0%) | 6 (15.0%) |
| 5 to 9 Year Old | 164 (96.5%) | 6 (3.5%) |
| 10 to 14 Year Olds | 294 (92.4%) | 24 (7.5%) |
| 15 to 17 Year Olds | 109 (83.9%) | 21 (16.2%) |
| 18 to 19 Year Olds | 32 (100.0%) | 0 (0.0%) |
| 20 to 24 Year Olds | 90 (100.0%) | 0 (0.0%) |
| 25 to 34 Year Olds | 24 (85.7%) | 4 (14.3%) |
| 35 Years and over | 17 (73.9%) | 6 (26.1%) |
| Total | 764 (91.9%) | 67 (8.1%) |
Educational Attainment by Field of Study in Country Club
Education (146 | 19.1%), business (138 | 18.1%), arts & humanities (125 | 16.4%), science & technology (105 | 13.8%), and psychology (52 | 6.8%) are the most common fields of study among 763 individuals in Country Club who have obtained a bachelor's degree or higher.
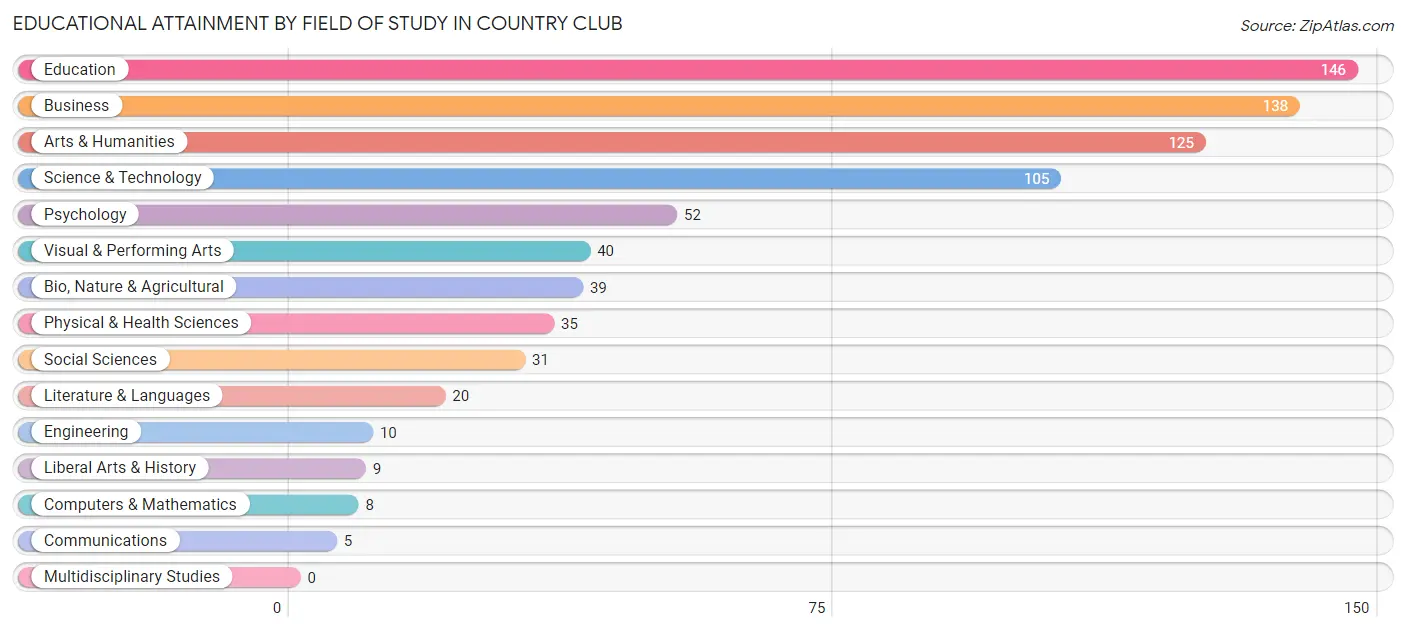
| Field of Study | # Graduates | % Graduates |
| Computers & Mathematics | 8 | 1.1% |
| Bio, Nature & Agricultural | 39 | 5.1% |
| Physical & Health Sciences | 35 | 4.6% |
| Psychology | 52 | 6.8% |
| Social Sciences | 31 | 4.1% |
| Engineering | 10 | 1.3% |
| Multidisciplinary Studies | 0 | 0.0% |
| Science & Technology | 105 | 13.8% |
| Business | 138 | 18.1% |
| Education | 146 | 19.1% |
| Literature & Languages | 20 | 2.6% |
| Liberal Arts & History | 9 | 1.2% |
| Visual & Performing Arts | 40 | 5.2% |
| Communications | 5 | 0.7% |
| Arts & Humanities | 125 | 16.4% |
| Total | 763 | 100.0% |
Transportation & Commute in Country Club
Vehicle Availability by Sex in Country Club
The most prevalent vehicle ownership categories in Country Club are males with 2 vehicles (475, accounting for 60.1%) and females with 2 vehicles (353, making up 67.7%).
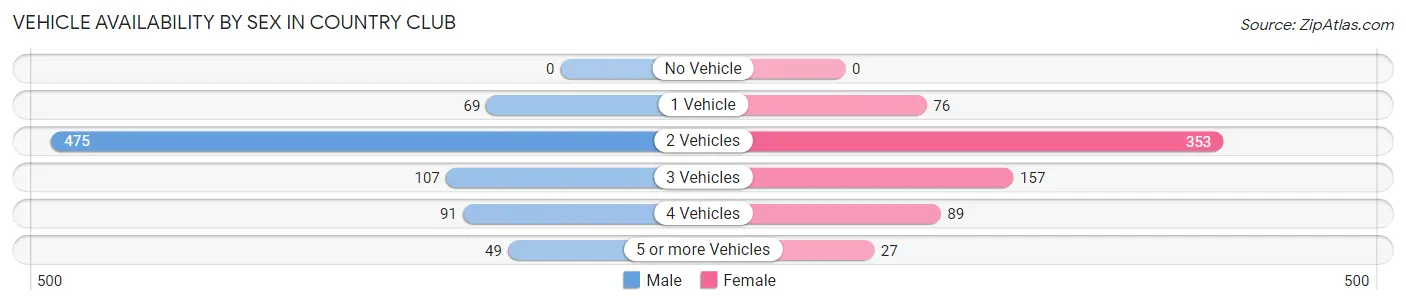
| Vehicles Available | Male | Female |
| No Vehicle | 0 (0.0%) | 0 (0.0%) |
| 1 Vehicle | 69 (8.7%) | 76 (10.8%) |
| 2 Vehicles | 475 (60.1%) | 353 (50.3%) |
| 3 Vehicles | 107 (13.5%) | 157 (22.4%) |
| 4 Vehicles | 91 (11.5%) | 89 (12.7%) |
| 5 or more Vehicles | 49 (6.2%) | 27 (3.8%) |
| Total | 791 (100.0%) | 702 (100.0%) |
Commute Time in Country Club
The most frequently occuring commute durations in Country Club are 15 to 19 minutes (505 commuters, 35.2%), 10 to 14 minutes (407 commuters, 28.4%), and 20 to 24 minutes (143 commuters, 10.0%).
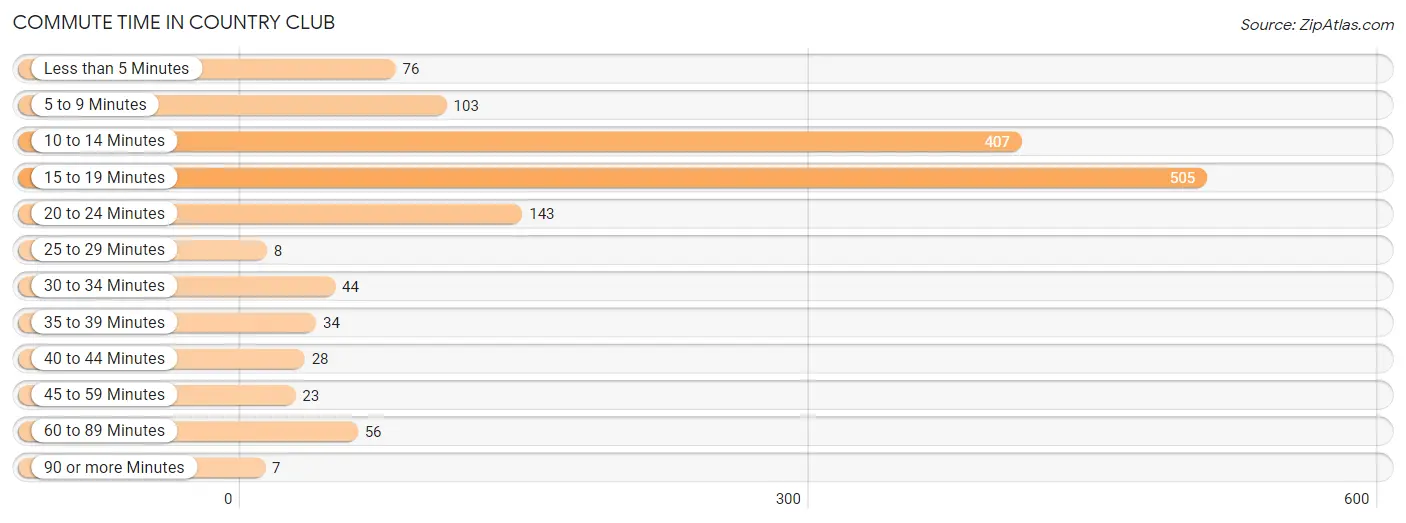
| Commute Time | # Commuters | % Commuters |
| Less than 5 Minutes | 76 | 5.3% |
| 5 to 9 Minutes | 103 | 7.2% |
| 10 to 14 Minutes | 407 | 28.4% |
| 15 to 19 Minutes | 505 | 35.2% |
| 20 to 24 Minutes | 143 | 10.0% |
| 25 to 29 Minutes | 8 | 0.6% |
| 30 to 34 Minutes | 44 | 3.1% |
| 35 to 39 Minutes | 34 | 2.4% |
| 40 to 44 Minutes | 28 | 1.9% |
| 45 to 59 Minutes | 23 | 1.6% |
| 60 to 89 Minutes | 56 | 3.9% |
| 90 or more Minutes | 7 | 0.5% |
Commute Time by Sex in Country Club
The most common commute times in Country Club are 15 to 19 minutes (236 commuters, 31.2%) for males and 15 to 19 minutes (269 commuters, 39.7%) for females.
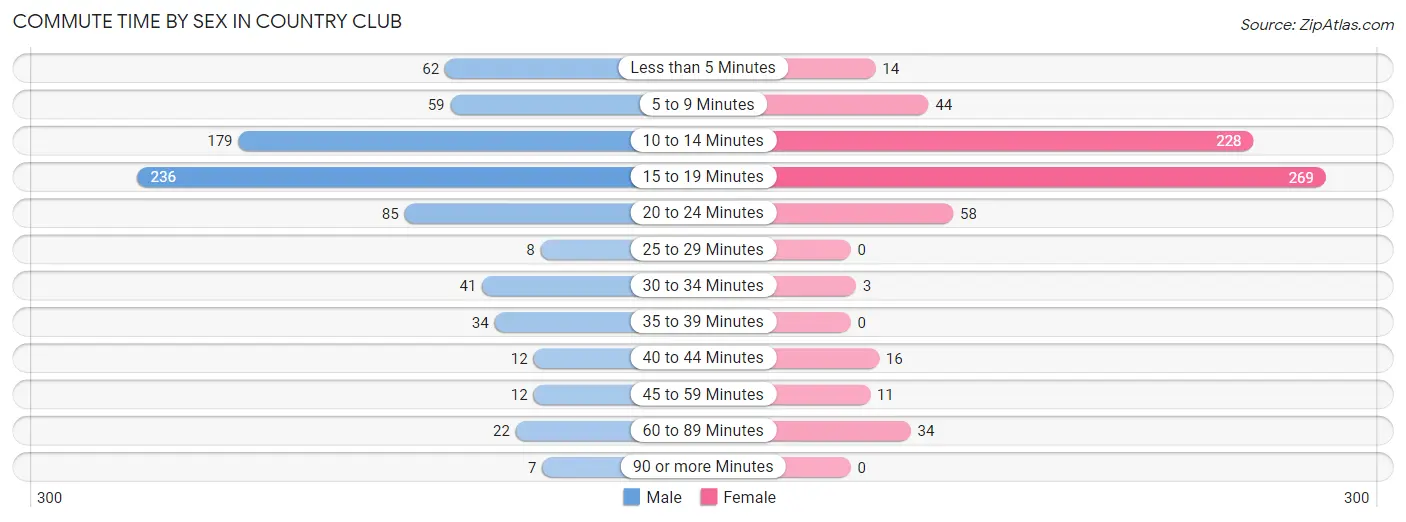
| Commute Time | Male | Female |
| Less than 5 Minutes | 62 (8.2%) | 14 (2.1%) |
| 5 to 9 Minutes | 59 (7.8%) | 44 (6.5%) |
| 10 to 14 Minutes | 179 (23.6%) | 228 (33.7%) |
| 15 to 19 Minutes | 236 (31.2%) | 269 (39.7%) |
| 20 to 24 Minutes | 85 (11.2%) | 58 (8.6%) |
| 25 to 29 Minutes | 8 (1.1%) | 0 (0.0%) |
| 30 to 34 Minutes | 41 (5.4%) | 3 (0.4%) |
| 35 to 39 Minutes | 34 (4.5%) | 0 (0.0%) |
| 40 to 44 Minutes | 12 (1.6%) | 16 (2.4%) |
| 45 to 59 Minutes | 12 (1.6%) | 11 (1.6%) |
| 60 to 89 Minutes | 22 (2.9%) | 34 (5.0%) |
| 90 or more Minutes | 7 (0.9%) | 0 (0.0%) |
Time of Departure to Work by Sex in Country Club
The most frequent times of departure to work in Country Club are 7:00 AM to 7:29 AM (133, 17.6%) for males and 8:00 AM to 8:29 AM (137, 20.2%) for females.
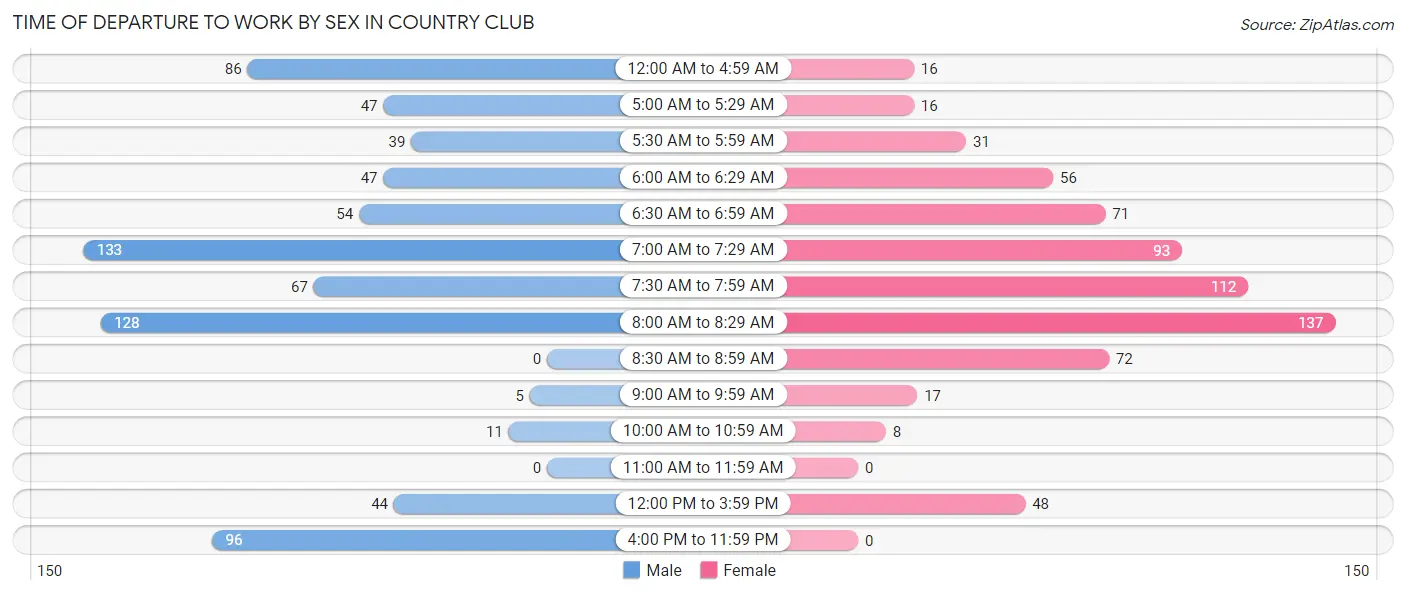
| Time of Departure | Male | Female |
| 12:00 AM to 4:59 AM | 86 (11.4%) | 16 (2.4%) |
| 5:00 AM to 5:29 AM | 47 (6.2%) | 16 (2.4%) |
| 5:30 AM to 5:59 AM | 39 (5.1%) | 31 (4.6%) |
| 6:00 AM to 6:29 AM | 47 (6.2%) | 56 (8.3%) |
| 6:30 AM to 6:59 AM | 54 (7.1%) | 71 (10.5%) |
| 7:00 AM to 7:29 AM | 133 (17.6%) | 93 (13.7%) |
| 7:30 AM to 7:59 AM | 67 (8.8%) | 112 (16.5%) |
| 8:00 AM to 8:29 AM | 128 (16.9%) | 137 (20.2%) |
| 8:30 AM to 8:59 AM | 0 (0.0%) | 72 (10.6%) |
| 9:00 AM to 9:59 AM | 5 (0.7%) | 17 (2.5%) |
| 10:00 AM to 10:59 AM | 11 (1.5%) | 8 (1.2%) |
| 11:00 AM to 11:59 AM | 0 (0.0%) | 0 (0.0%) |
| 12:00 PM to 3:59 PM | 44 (5.8%) | 48 (7.1%) |
| 4:00 PM to 11:59 PM | 96 (12.7%) | 0 (0.0%) |
| Total | 757 (100.0%) | 677 (100.0%) |
Housing Occupancy in Country Club
Occupancy by Ownership in Country Club
Of the total 1,067 dwellings in Country Club, owner-occupied units account for 786 (73.7%), while renter-occupied units make up 281 (26.3%).
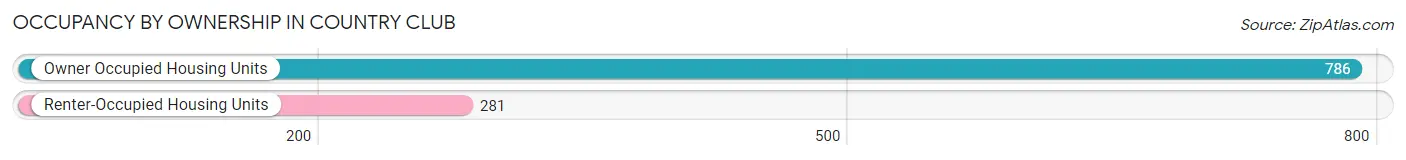
| Occupancy | # Housing Units | % Housing Units |
| Owner Occupied Housing Units | 786 | 73.7% |
| Renter-Occupied Housing Units | 281 | 26.3% |
| Total Occupied Housing Units | 1,067 | 100.0% |
Occupancy by Household Size in Country Club
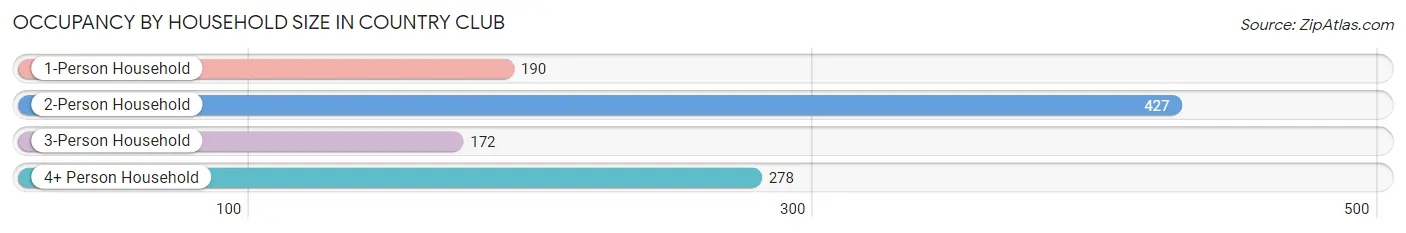
| Household Size | # Housing Units | % Housing Units |
| 1-Person Household | 190 | 17.8% |
| 2-Person Household | 427 | 40.0% |
| 3-Person Household | 172 | 16.1% |
| 4+ Person Household | 278 | 26.1% |
| Total Housing Units | 1,067 | 100.0% |
Occupancy by Ownership by Household Size in Country Club
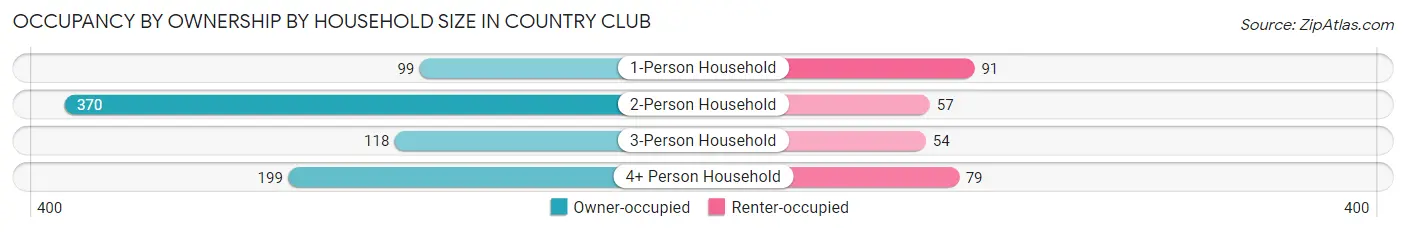
| Household Size | Owner-occupied | Renter-occupied |
| 1-Person Household | 99 (52.1%) | 91 (47.9%) |
| 2-Person Household | 370 (86.7%) | 57 (13.4%) |
| 3-Person Household | 118 (68.6%) | 54 (31.4%) |
| 4+ Person Household | 199 (71.6%) | 79 (28.4%) |
| Total Housing Units | 786 (73.7%) | 281 (26.3%) |
Occupancy by Educational Attainment in Country Club
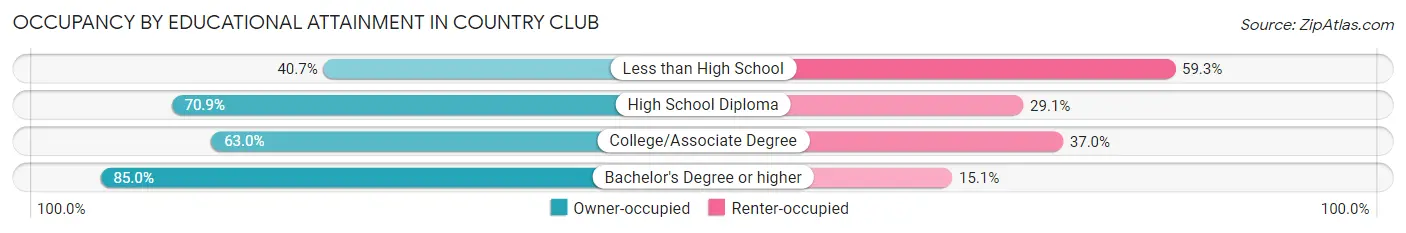
| Household Size | Owner-occupied | Renter-occupied |
| Less than High School | 11 (40.7%) | 16 (59.3%) |
| High School Diploma | 265 (70.9%) | 109 (29.1%) |
| College/Associate Degree | 160 (63.0%) | 94 (37.0%) |
| Bachelor's Degree or higher | 350 (85.0%) | 62 (15.0%) |
Occupancy by Age of Householder in Country Club
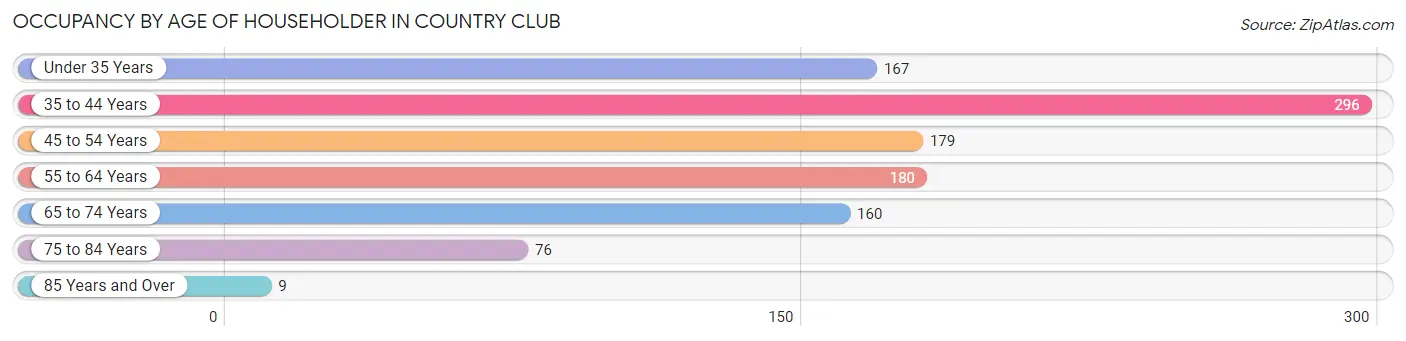
| Age Bracket | # Households | % Households |
| Under 35 Years | 167 | 15.7% |
| 35 to 44 Years | 296 | 27.7% |
| 45 to 54 Years | 179 | 16.8% |
| 55 to 64 Years | 180 | 16.9% |
| 65 to 74 Years | 160 | 15.0% |
| 75 to 84 Years | 76 | 7.1% |
| 85 Years and Over | 9 | 0.8% |
| Total | 1,067 | 100.0% |
Housing Finances in Country Club
Median Income by Occupancy in Country Club
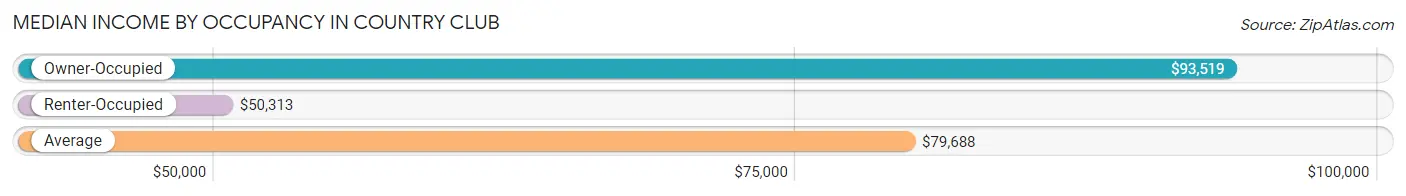
| Occupancy Type | # Households | Median Income |
| Owner-Occupied | 786 (73.7%) | $93,519 |
| Renter-Occupied | 281 (26.3%) | $50,313 |
| Average | 1,067 (100.0%) | $79,688 |
Occupancy by Householder Income Bracket in Country Club
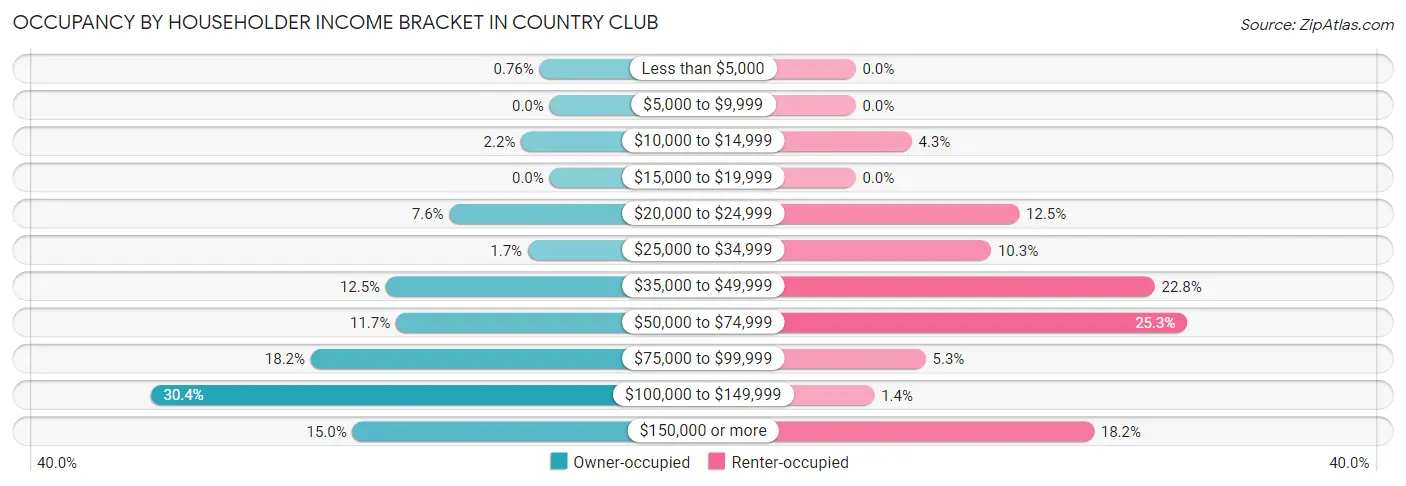
| Income Bracket | Owner-occupied | Renter-occupied |
| Less than $5,000 | 6 (0.8%) | 0 (0.0%) |
| $5,000 to $9,999 | 0 (0.0%) | 0 (0.0%) |
| $10,000 to $14,999 | 17 (2.2%) | 12 (4.3%) |
| $15,000 to $19,999 | 0 (0.0%) | 0 (0.0%) |
| $20,000 to $24,999 | 60 (7.6%) | 35 (12.5%) |
| $25,000 to $34,999 | 13 (1.7%) | 29 (10.3%) |
| $35,000 to $49,999 | 98 (12.5%) | 64 (22.8%) |
| $50,000 to $74,999 | 92 (11.7%) | 71 (25.3%) |
| $75,000 to $99,999 | 143 (18.2%) | 15 (5.3%) |
| $100,000 to $149,999 | 239 (30.4%) | 4 (1.4%) |
| $150,000 or more | 118 (15.0%) | 51 (18.1%) |
| Total | 786 (100.0%) | 281 (100.0%) |
Monthly Housing Cost Tiers in Country Club
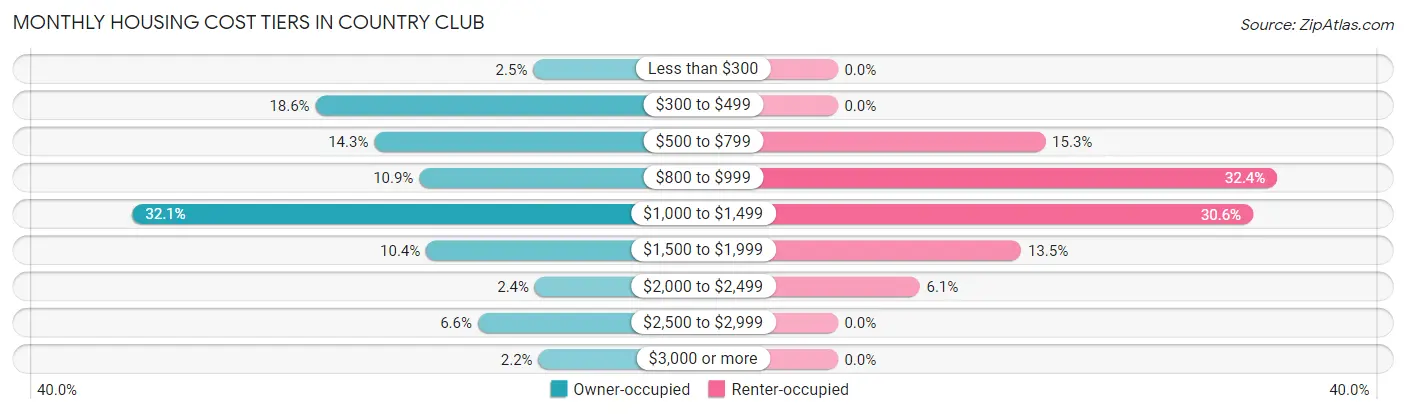
| Monthly Cost | Owner-occupied | Renter-occupied |
| Less than $300 | 20 (2.5%) | 0 (0.0%) |
| $300 to $499 | 146 (18.6%) | 0 (0.0%) |
| $500 to $799 | 112 (14.2%) | 43 (15.3%) |
| $800 to $999 | 86 (10.9%) | 91 (32.4%) |
| $1,000 to $1,499 | 252 (32.1%) | 86 (30.6%) |
| $1,500 to $1,999 | 82 (10.4%) | 38 (13.5%) |
| $2,000 to $2,499 | 19 (2.4%) | 17 (6.0%) |
| $2,500 to $2,999 | 52 (6.6%) | 0 (0.0%) |
| $3,000 or more | 17 (2.2%) | 0 (0.0%) |
| Total | 786 (100.0%) | 281 (100.0%) |
Physical Housing Characteristics in Country Club
Housing Structures in Country Club
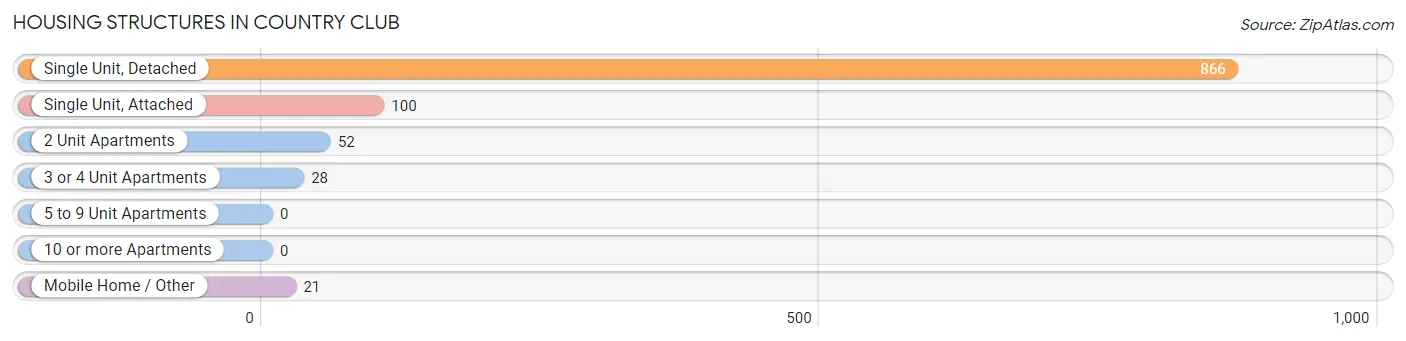
| Structure Type | # Housing Units | % Housing Units |
| Single Unit, Detached | 866 | 81.2% |
| Single Unit, Attached | 100 | 9.4% |
| 2 Unit Apartments | 52 | 4.9% |
| 3 or 4 Unit Apartments | 28 | 2.6% |
| 5 to 9 Unit Apartments | 0 | 0.0% |
| 10 or more Apartments | 0 | 0.0% |
| Mobile Home / Other | 21 | 2.0% |
| Total | 1,067 | 100.0% |
Housing Structures by Occupancy in Country Club
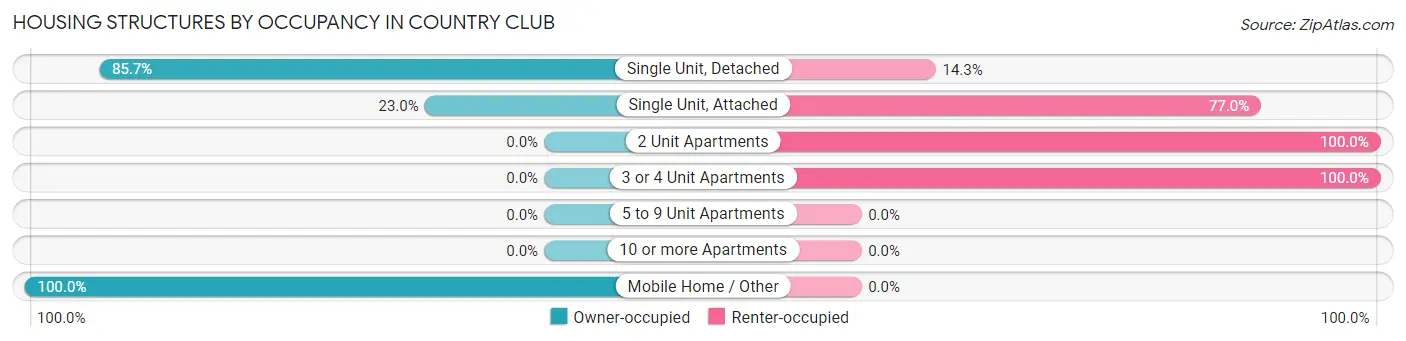
| Structure Type | Owner-occupied | Renter-occupied |
| Single Unit, Detached | 742 (85.7%) | 124 (14.3%) |
| Single Unit, Attached | 23 (23.0%) | 77 (77.0%) |
| 2 Unit Apartments | 0 (0.0%) | 52 (100.0%) |
| 3 or 4 Unit Apartments | 0 (0.0%) | 28 (100.0%) |
| 5 to 9 Unit Apartments | 0 (0.0%) | 0 (0.0%) |
| 10 or more Apartments | 0 (0.0%) | 0 (0.0%) |
| Mobile Home / Other | 21 (100.0%) | 0 (0.0%) |
| Total | 786 (73.7%) | 281 (26.3%) |
Housing Structures by Number of Rooms in Country Club
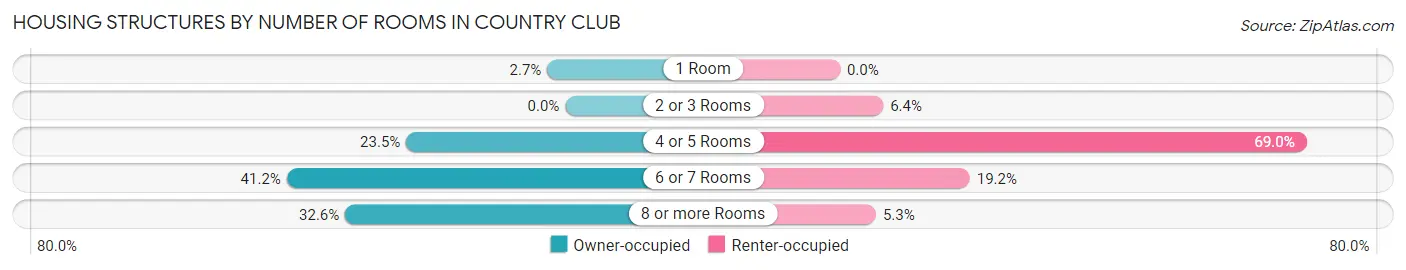
| Number of Rooms | Owner-occupied | Renter-occupied |
| 1 Room | 21 (2.7%) | 0 (0.0%) |
| 2 or 3 Rooms | 0 (0.0%) | 18 (6.4%) |
| 4 or 5 Rooms | 185 (23.5%) | 194 (69.0%) |
| 6 or 7 Rooms | 324 (41.2%) | 54 (19.2%) |
| 8 or more Rooms | 256 (32.6%) | 15 (5.3%) |
| Total | 786 (100.0%) | 281 (100.0%) |
Housing Structure by Heating Type in Country Club
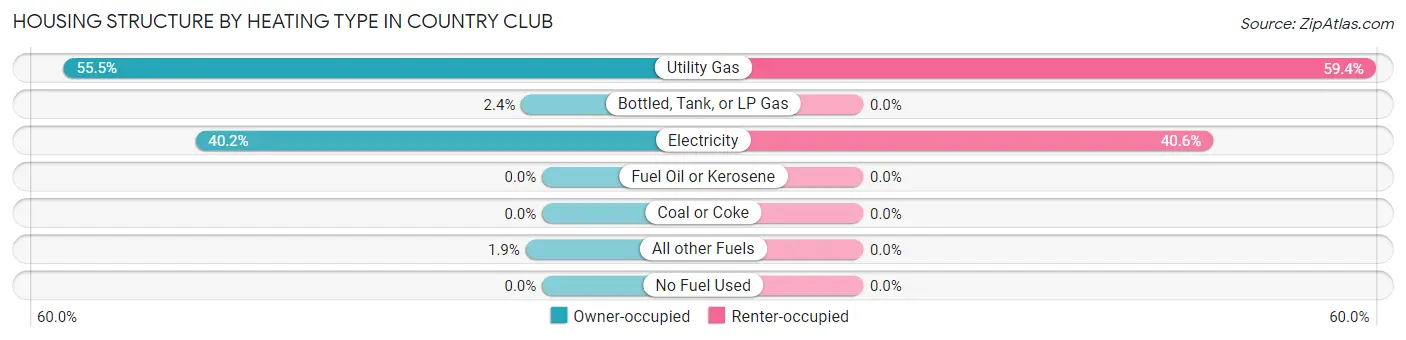
| Heating Type | Owner-occupied | Renter-occupied |
| Utility Gas | 436 (55.5%) | 167 (59.4%) |
| Bottled, Tank, or LP Gas | 19 (2.4%) | 0 (0.0%) |
| Electricity | 316 (40.2%) | 114 (40.6%) |
| Fuel Oil or Kerosene | 0 (0.0%) | 0 (0.0%) |
| Coal or Coke | 0 (0.0%) | 0 (0.0%) |
| All other Fuels | 15 (1.9%) | 0 (0.0%) |
| No Fuel Used | 0 (0.0%) | 0 (0.0%) |
| Total | 786 (100.0%) | 281 (100.0%) |
Household Vehicle Usage in Country Club
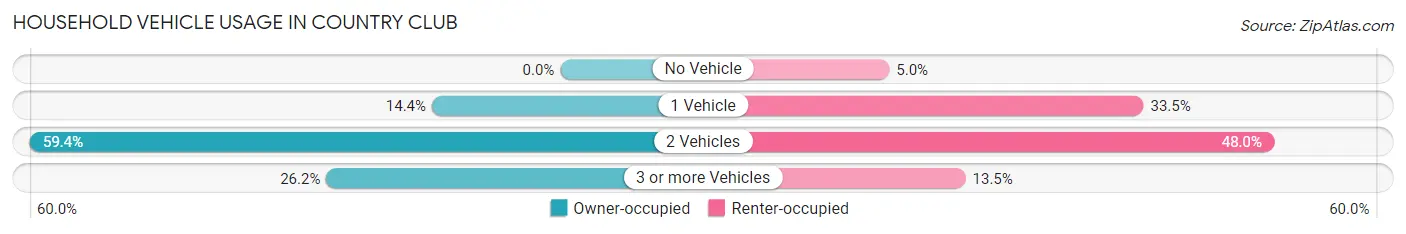
| Vehicles per Household | Owner-occupied | Renter-occupied |
| No Vehicle | 0 (0.0%) | 14 (5.0%) |
| 1 Vehicle | 113 (14.4%) | 94 (33.5%) |
| 2 Vehicles | 467 (59.4%) | 135 (48.0%) |
| 3 or more Vehicles | 206 (26.2%) | 38 (13.5%) |
| Total | 786 (100.0%) | 281 (100.0%) |
Real Estate & Mortgages in Country Club
Real Estate and Mortgage Overview in Country Club
| Characteristic | Without Mortgage | With Mortgage |
| Housing Units | 309 | 477 |
| Median Property Value | $178,100 | $178,800 |
| Median Household Income | $53,355 | $102 |
| Monthly Housing Costs | $488 | $17 |
| Real Estate Taxes | $1,759 | $15 |
Property Value by Mortgage Status in Country Club

| Property Value | Without Mortgage | With Mortgage |
| Less than $50,000 | 27 (8.7%) | 9 (1.9%) |
| $50,000 to $99,999 | 53 (17.2%) | 0 (0.0%) |
| $100,000 to $299,999 | 150 (48.5%) | 378 (79.2%) |
| $300,000 to $499,999 | 41 (13.3%) | 60 (12.6%) |
| $500,000 to $749,999 | 38 (12.3%) | 30 (6.3%) |
| $750,000 to $999,999 | 0 (0.0%) | 0 (0.0%) |
| $1,000,000 or more | 0 (0.0%) | 0 (0.0%) |
| Total | 309 (100.0%) | 477 (100.0%) |
Household Income by Mortgage Status in Country Club
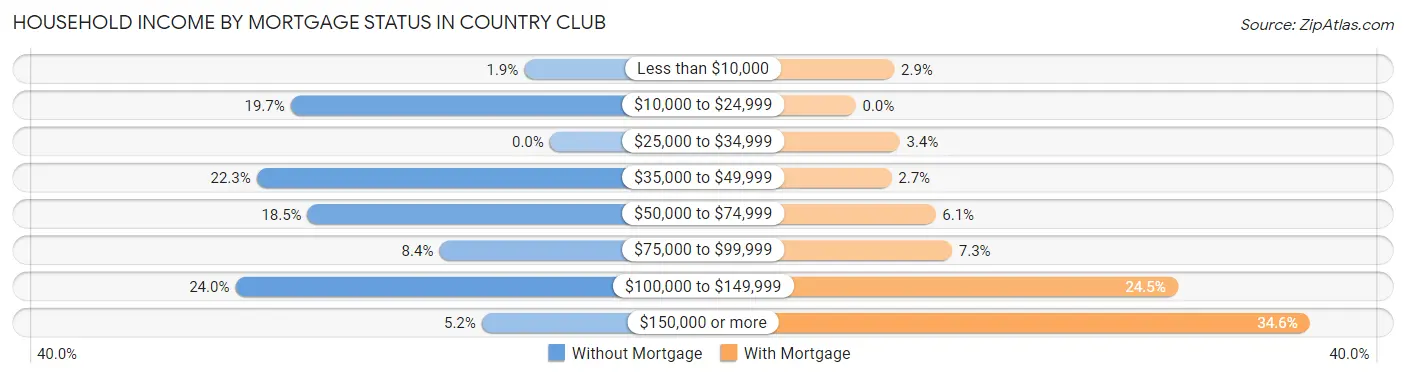
| Household Income | Without Mortgage | With Mortgage |
| Less than $10,000 | 6 (1.9%) | 14 (2.9%) |
| $10,000 to $24,999 | 61 (19.7%) | 0 (0.0%) |
| $25,000 to $34,999 | 0 (0.0%) | 16 (3.4%) |
| $35,000 to $49,999 | 69 (22.3%) | 13 (2.7%) |
| $50,000 to $74,999 | 57 (18.4%) | 29 (6.1%) |
| $75,000 to $99,999 | 26 (8.4%) | 35 (7.3%) |
| $100,000 to $149,999 | 74 (23.9%) | 117 (24.5%) |
| $150,000 or more | 16 (5.2%) | 165 (34.6%) |
| Total | 309 (100.0%) | 477 (100.0%) |
Property Value to Household Income Ratio in Country Club
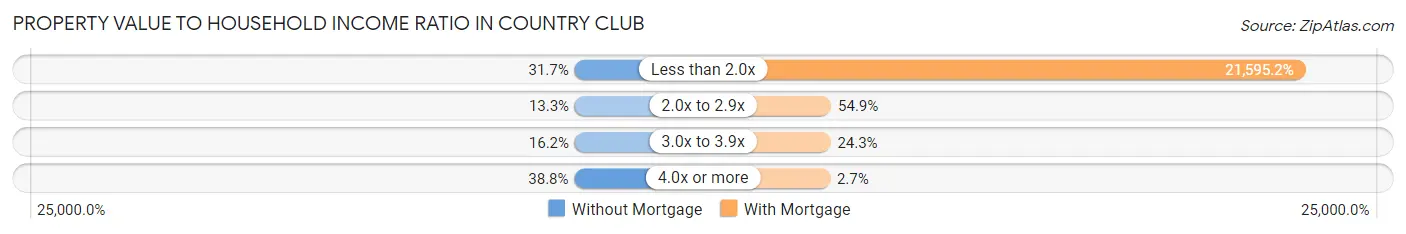
| Value-to-Income Ratio | Without Mortgage | With Mortgage |
| Less than 2.0x | 98 (31.7%) | 103,009 (21,595.2%) |
| 2.0x to 2.9x | 41 (13.3%) | 262 (54.9%) |
| 3.0x to 3.9x | 50 (16.2%) | 116 (24.3%) |
| 4.0x or more | 120 (38.8%) | 13 (2.7%) |
| Total | 309 (100.0%) | 477 (100.0%) |
Real Estate Taxes by Mortgage Status in Country Club
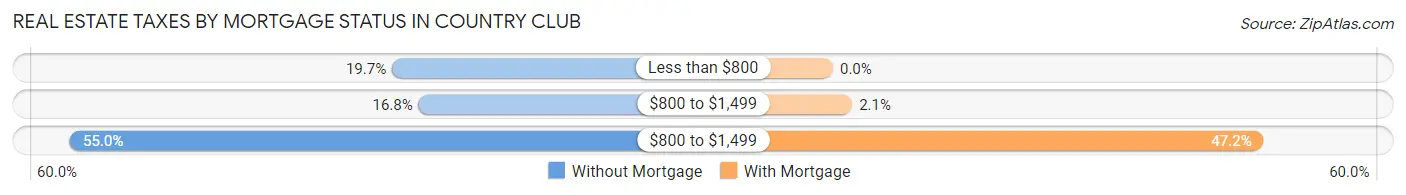
| Property Taxes | Without Mortgage | With Mortgage |
| Less than $800 | 61 (19.7%) | 0 (0.0%) |
| $800 to $1,499 | 52 (16.8%) | 10 (2.1%) |
| $800 to $1,499 | 170 (55.0%) | 225 (47.2%) |
| Total | 309 (100.0%) | 477 (100.0%) |
Health & Disability in Country Club
Health Insurance Coverage by Age in Country Club
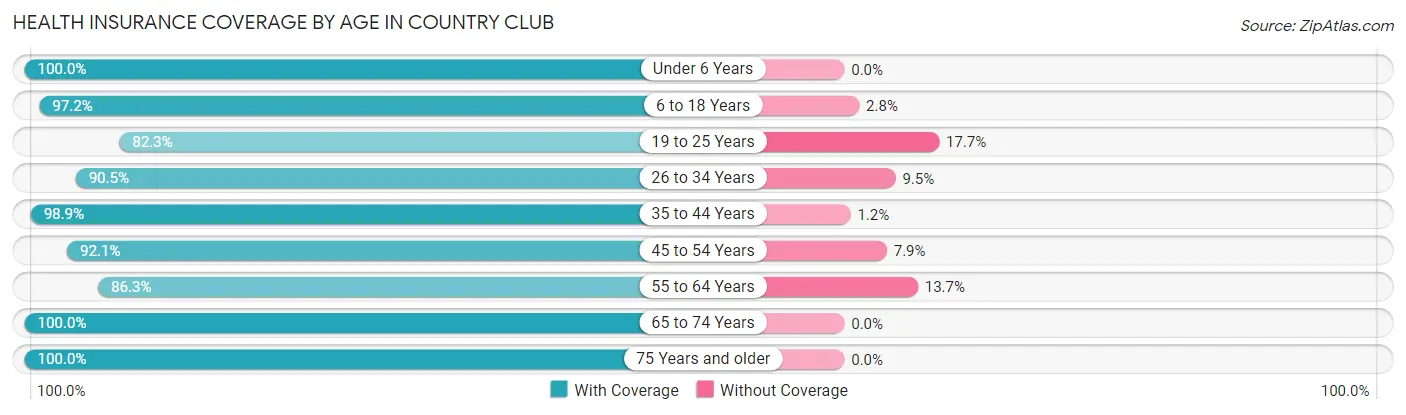
| Age Bracket | With Coverage | Without Coverage |
| Under 6 Years | 231 (100.0%) | 0 (0.0%) |
| 6 to 18 Years | 701 (97.2%) | 20 (2.8%) |
| 19 to 25 Years | 219 (82.3%) | 47 (17.7%) |
| 26 to 34 Years | 313 (90.5%) | 33 (9.5%) |
| 35 to 44 Years | 429 (98.9%) | 5 (1.1%) |
| 45 to 54 Years | 349 (92.1%) | 30 (7.9%) |
| 55 to 64 Years | 252 (86.3%) | 40 (13.7%) |
| 65 to 74 Years | 310 (100.0%) | 0 (0.0%) |
| 75 Years and older | 138 (100.0%) | 0 (0.0%) |
| Total | 2,942 (94.4%) | 175 (5.6%) |
Health Insurance Coverage by Citizenship Status in Country Club
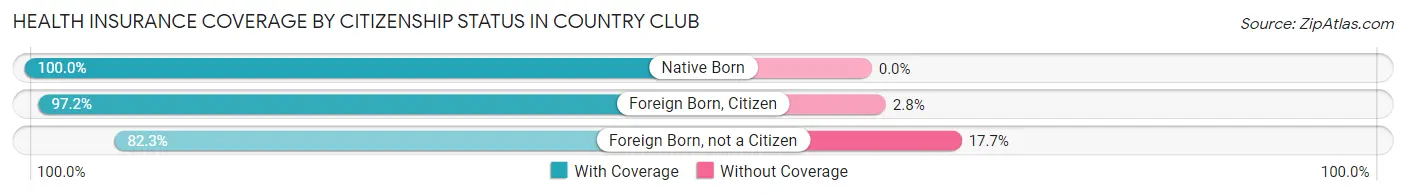
| Citizenship Status | With Coverage | Without Coverage |
| Native Born | 231 (100.0%) | 0 (0.0%) |
| Foreign Born, Citizen | 701 (97.2%) | 20 (2.8%) |
| Foreign Born, not a Citizen | 219 (82.3%) | 47 (17.7%) |
Health Insurance Coverage by Household Income in Country Club
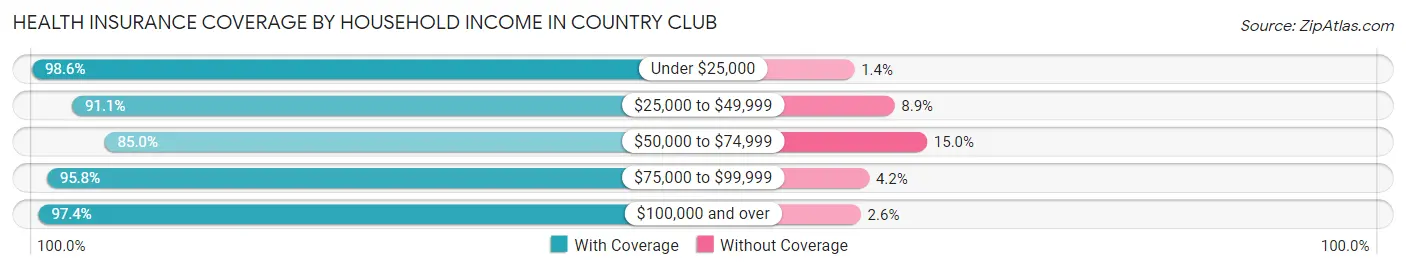
| Household Income | With Coverage | Without Coverage |
| Under $25,000 | 283 (98.6%) | 4 (1.4%) |
| $25,000 to $49,999 | 511 (91.1%) | 50 (8.9%) |
| $50,000 to $74,999 | 374 (85.0%) | 66 (15.0%) |
| $75,000 to $99,999 | 461 (95.8%) | 20 (4.2%) |
| $100,000 and over | 1,313 (97.4%) | 35 (2.6%) |
Public vs Private Health Insurance Coverage by Age in Country Club
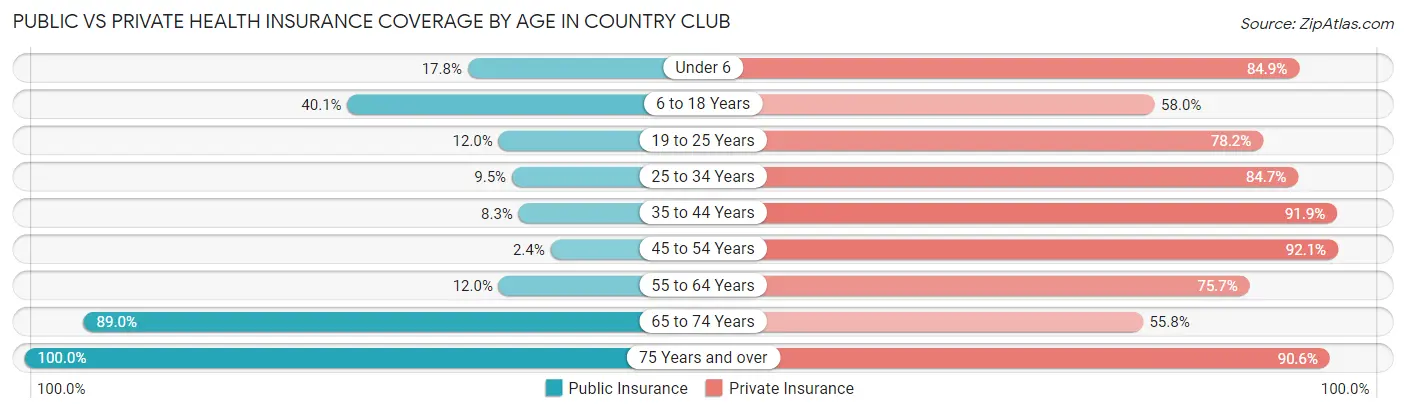
| Age Bracket | Public Insurance | Private Insurance |
| Under 6 | 41 (17.7%) | 196 (84.9%) |
| 6 to 18 Years | 289 (40.1%) | 418 (58.0%) |
| 19 to 25 Years | 32 (12.0%) | 208 (78.2%) |
| 25 to 34 Years | 33 (9.5%) | 293 (84.7%) |
| 35 to 44 Years | 36 (8.3%) | 399 (91.9%) |
| 45 to 54 Years | 9 (2.4%) | 349 (92.1%) |
| 55 to 64 Years | 35 (12.0%) | 221 (75.7%) |
| 65 to 74 Years | 276 (89.0%) | 173 (55.8%) |
| 75 Years and over | 138 (100.0%) | 125 (90.6%) |
| Total | 889 (28.5%) | 2,382 (76.4%) |
Disability Status by Sex by Age in Country Club
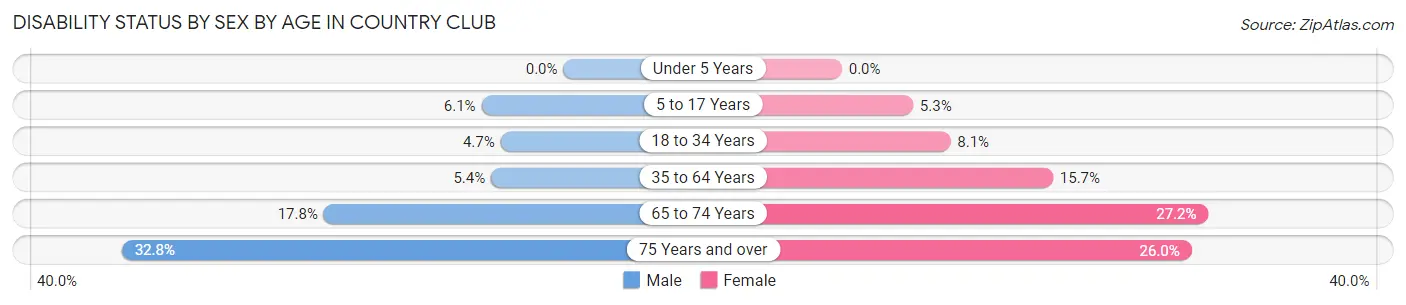
| Age Bracket | Male | Female |
| Under 5 Years | 0 (0.0%) | 0 (0.0%) |
| 5 to 17 Years | 20 (6.1%) | 20 (5.3%) |
| 18 to 34 Years | 11 (4.7%) | 32 (8.1%) |
| 35 to 64 Years | 36 (5.4%) | 68 (15.7%) |
| 65 to 74 Years | 29 (17.8%) | 40 (27.2%) |
| 75 Years and over | 20 (32.8%) | 20 (26.0%) |
Disability Class by Sex by Age in Country Club
Disability Class: Hearing Difficulty
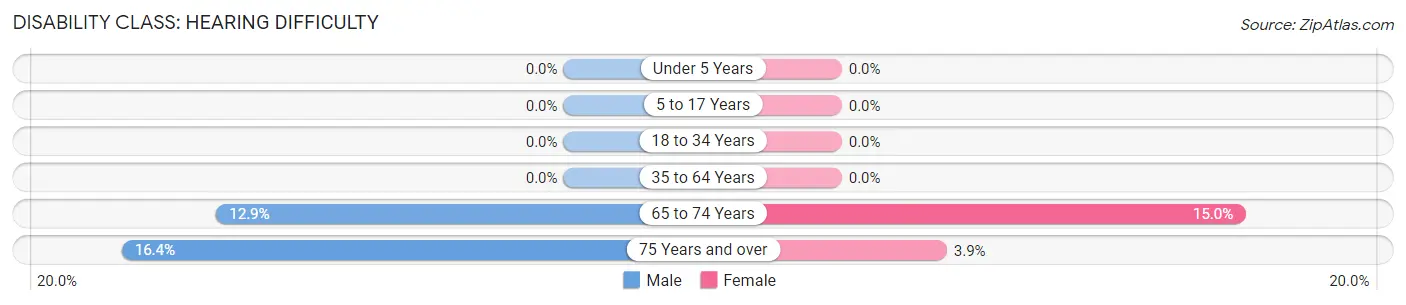
| Age Bracket | Male | Female |
| Under 5 Years | 0 (0.0%) | 0 (0.0%) |
| 5 to 17 Years | 0 (0.0%) | 0 (0.0%) |
| 18 to 34 Years | 0 (0.0%) | 0 (0.0%) |
| 35 to 64 Years | 0 (0.0%) | 0 (0.0%) |
| 65 to 74 Years | 21 (12.9%) | 22 (15.0%) |
| 75 Years and over | 10 (16.4%) | 3 (3.9%) |
Disability Class: Vision Difficulty
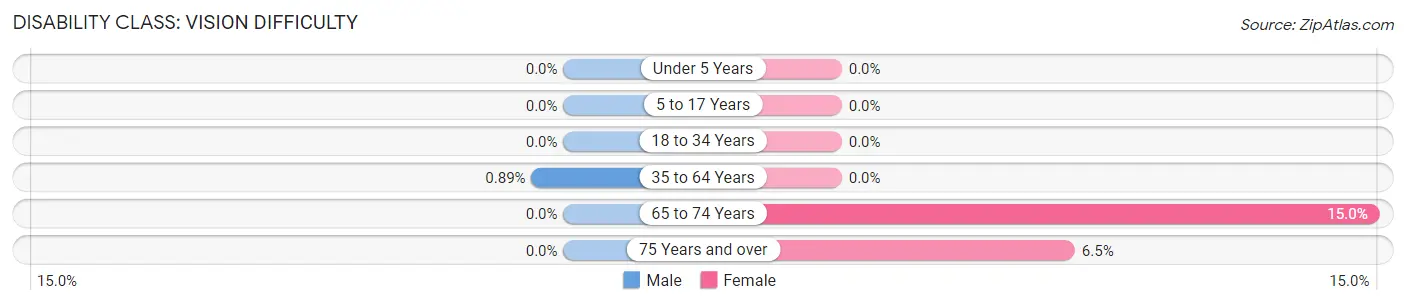
| Age Bracket | Male | Female |
| Under 5 Years | 0 (0.0%) | 0 (0.0%) |
| 5 to 17 Years | 0 (0.0%) | 0 (0.0%) |
| 18 to 34 Years | 0 (0.0%) | 0 (0.0%) |
| 35 to 64 Years | 6 (0.9%) | 0 (0.0%) |
| 65 to 74 Years | 0 (0.0%) | 22 (15.0%) |
| 75 Years and over | 0 (0.0%) | 5 (6.5%) |
Disability Class: Cognitive Difficulty
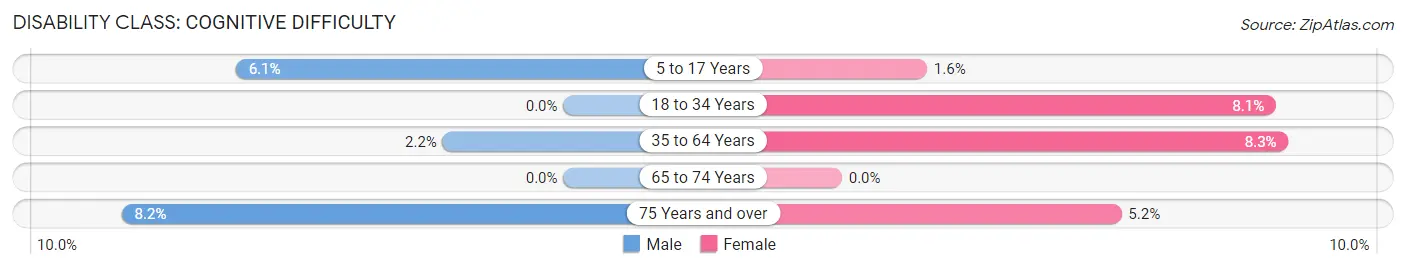
| Age Bracket | Male | Female |
| 5 to 17 Years | 20 (6.1%) | 6 (1.6%) |
| 18 to 34 Years | 0 (0.0%) | 32 (8.1%) |
| 35 to 64 Years | 15 (2.2%) | 36 (8.3%) |
| 65 to 74 Years | 0 (0.0%) | 0 (0.0%) |
| 75 Years and over | 5 (8.2%) | 4 (5.2%) |
Disability Class: Ambulatory Difficulty
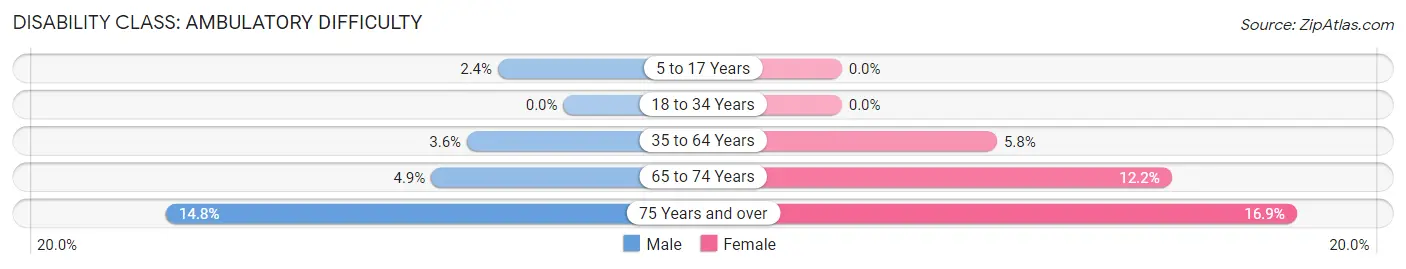
| Age Bracket | Male | Female |
| 5 to 17 Years | 8 (2.4%) | 0 (0.0%) |
| 18 to 34 Years | 0 (0.0%) | 0 (0.0%) |
| 35 to 64 Years | 24 (3.6%) | 25 (5.8%) |
| 65 to 74 Years | 8 (4.9%) | 18 (12.2%) |
| 75 Years and over | 9 (14.7%) | 13 (16.9%) |
Disability Class: Self-Care Difficulty
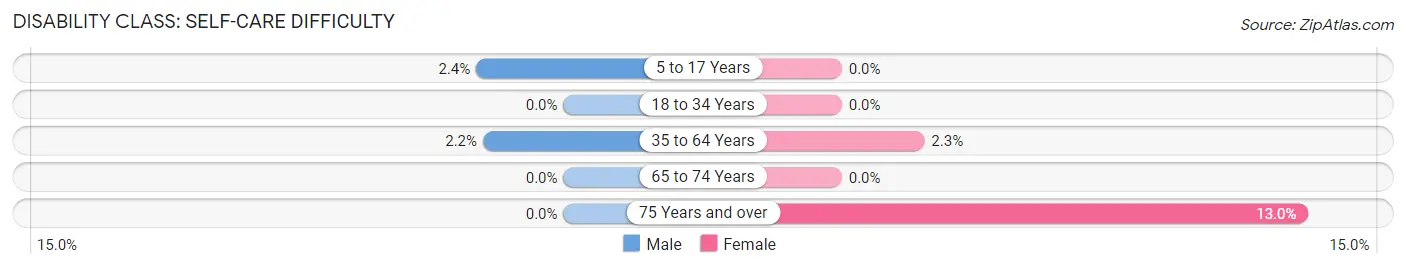
| Age Bracket | Male | Female |
| 5 to 17 Years | 8 (2.4%) | 0 (0.0%) |
| 18 to 34 Years | 0 (0.0%) | 0 (0.0%) |
| 35 to 64 Years | 15 (2.2%) | 10 (2.3%) |
| 65 to 74 Years | 0 (0.0%) | 0 (0.0%) |
| 75 Years and over | 0 (0.0%) | 10 (13.0%) |
Technology Access in Country Club
Computing Device Access in Country Club

| Device Type | # Households | % Households |
| Desktop or Laptop | 805 | 75.4% |
| Smartphone | 1,019 | 95.5% |
| Tablet | 488 | 45.7% |
| No Computing Device | 15 | 1.4% |
| Total | 1,067 | 100.0% |
Internet Access in Country Club
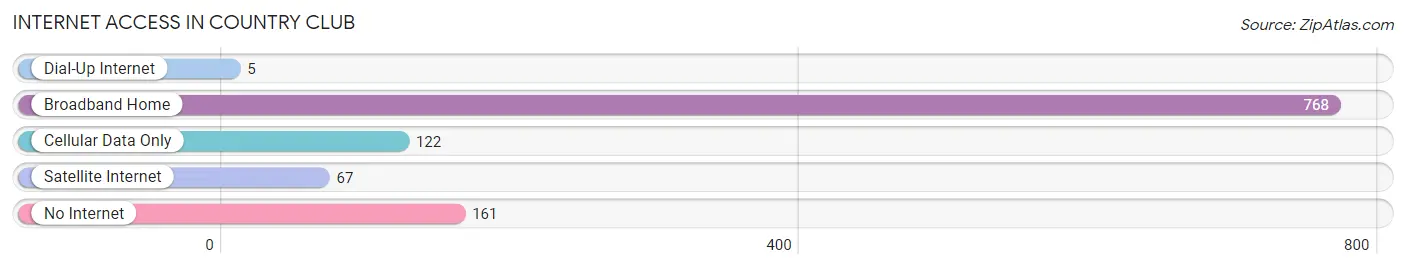
| Internet Type | # Households | % Households |
| Dial-Up Internet | 5 | 0.5% |
| Broadband Home | 768 | 72.0% |
| Cellular Data Only | 122 | 11.4% |
| Satellite Internet | 67 | 6.3% |
| No Internet | 161 | 15.1% |
| Total | 1,067 | 100.0% |
Country Club Summary
Club, MO is a small town located in the southeastern corner of Missouri. It is situated in the Ozark Mountains and is part of the Ozark Plateau. The town is located in St. Francois County and is approximately 30 miles from the city of St. Louis. The population of Country Club, MO was 1,845 in the year 2000.
Geography
Country Club, MO is located in the southeastern corner of Missouri, in the Ozark Mountains. The town is situated in the Ozark Plateau, which is a region of rolling hills and valleys. The town is located in St. Francois County and is approximately 30 miles from the city of St. Louis. The town is surrounded by the Mark Twain National Forest, which provides a variety of recreational activities. The town is also located near the Big River, which is a popular destination for fishing and canoeing.
Climate
Country Club, MO has a humid subtropical climate, with hot, humid summers and mild winters. The average temperature in the summer is around 80 degrees Fahrenheit, and the average temperature in the winter is around 40 degrees Fahrenheit. The town receives an average of 45 inches of precipitation per year, with most of the precipitation occurring in the spring and summer months.
Economy
The economy of Country Club, MO is largely based on agriculture and tourism. The town is home to several farms, which produce a variety of crops, including corn, soybeans, wheat, and hay. The town is also home to several wineries, which produce a variety of wines. Tourism is also an important part of the economy, as the town is located near several popular attractions, such as the Mark Twain National Forest and the Big River.
Demographics
The population of Country Club, MO was 1,845 in the year 2000. The town is predominantly white, with a small African American population. The median household income in the town is $37,000, and the median home value is $90,000. The town has a low unemployment rate, and the majority of the population is employed in the agricultural and tourism industries.
Conclusion
Country Club, MO is a small town located in the southeastern corner of Missouri. It is situated in the Ozark Mountains and is part of the Ozark Plateau. The town is located in St. Francois County and is approximately 30 miles from the city of St. Louis. The population of Country Club, MO was 1,845 in the year 2000. The town has a humid subtropical climate, with hot, humid summers and mild winters. The economy of Country Club, MO is largely based on agriculture and tourism. The town is predominantly white, with a small African American population. The median household income in the town is $37,000, and the median home value is $90,000. The town has a low unemployment rate, and the majority of the population is employed in the agricultural and tourism industries.
Common Questions
What is the Total Population of Country Club?
Total Population of Country Club is 3,191.
What is the Total Male Population of Country Club?
Total Male Population of Country Club is 1,611.
What is the Total Female Population of Country Club?
Total Female Population of Country Club is 1,580.
What is the Ratio of Males per 100 Females in Country Club?
There are 101.96 Males per 100 Females in Country Club.
What is the Ratio of Females per 100 Males in Country Club?
There are 98.08 Females per 100 Males in Country Club.
What is the Median Population Age in Country Club?
Median Population Age in Country Club is 35.5 Years.
What is the Average Family Size in Country Club
Average Family Size in Country Club is 3.4 People.
What is the Average Household Size in Country Club
Average Household Size in Country Club is 3.0 People.
What is Per Capita Income in Country Club?
Per Capita income in Country Club is $31,954.
What is the Median Family Income in Country Club?
Median Family Income in Country Club is $92,581.
What is the Median Household income in Country Club?
Median Household Income in Country Club is $79,688.
What is Income or Wage Gap in Country Club?
Income or Wage Gap in Country Club is 26.0%.
Women in Country Club earn 74.0 cents for every dollar earned by a man.
What is Inequality or Gini Index in Country Club?
Inequality or Gini Index in Country Club is 0.36.
How Large is the Labor Force in Country Club?
There are 1,605 People in the Labor Forcein in Country Club.
What is the Percentage of People in the Labor Force in Country Club?
68.6% of People are in the Labor Force in Country Club.
What is the Unemployment Rate in Country Club?
Unemployment Rate in Country Club is 6.3%.