Cities with the Largest Salvadoran Community in Missouri
RELATED REPORTS & OPTIONS
Salvadoran
Missouri
Compare Cities
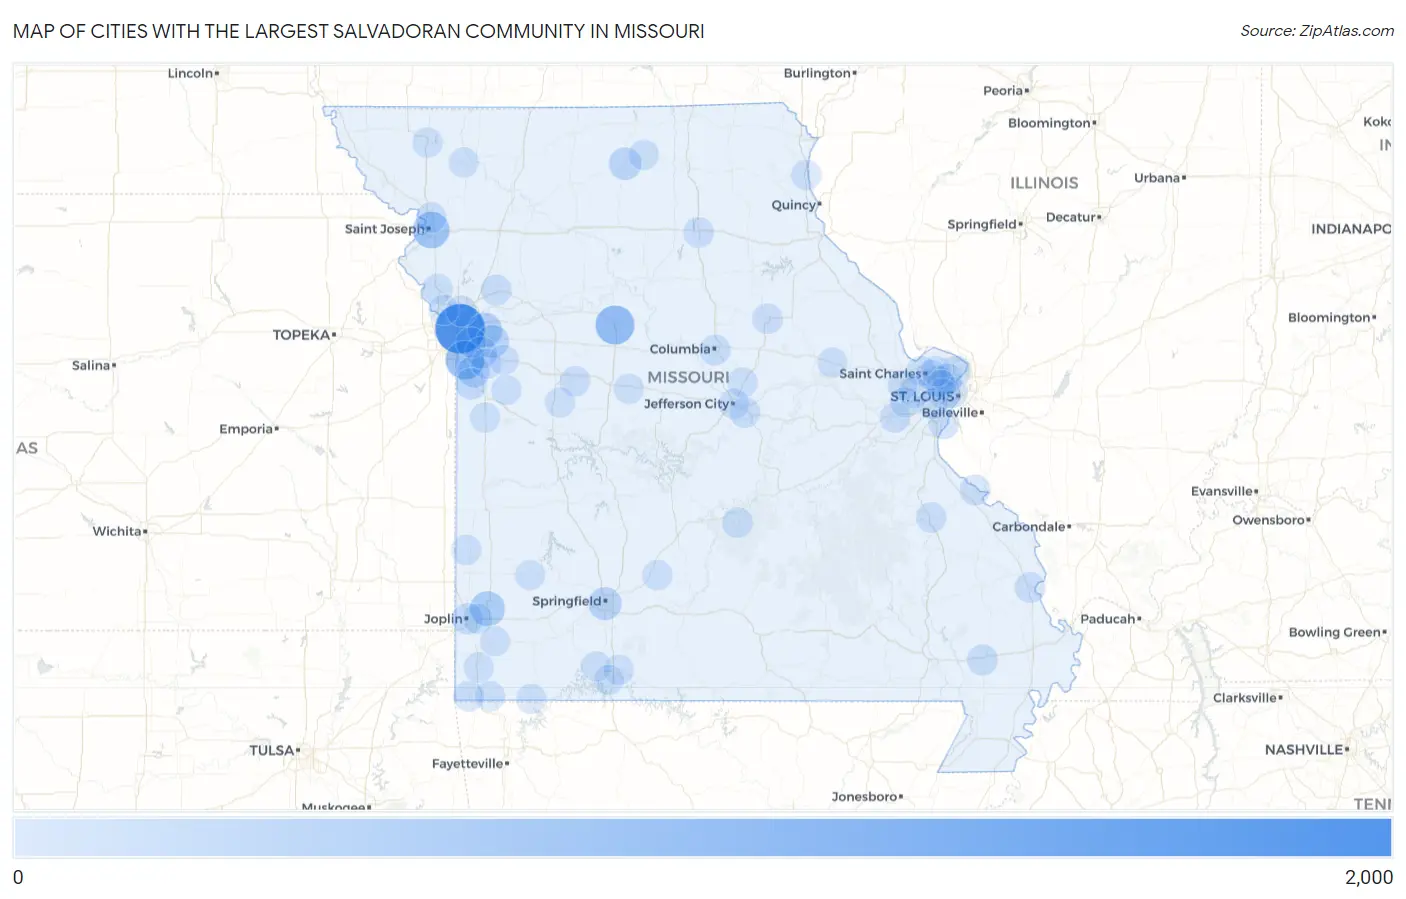
Map of Cities with the Largest Salvadoran Community in Missouri
0
2,000
Cities with the Largest Salvadoran Community in Missouri
| City | Salvadoran | vs State | vs National | |
| 1. | Kansas City | 1,857 | 8,003(23.20%)#1 | 2,389,469(0.08%)#206 |
| 2. | Marshall | 819 | 8,003(10.23%)#2 | 2,389,469(0.03%)#432 |
| 3. | Grandview | 801 | 8,003(10.01%)#3 | 2,389,469(0.03%)#440 |
| 4. | St Joseph | 592 | 8,003(7.40%)#4 | 2,389,469(0.02%)#569 |
| 5. | Carthage | 445 | 8,003(5.56%)#5 | 2,389,469(0.02%)#727 |
| 6. | Independence | 392 | 8,003(4.90%)#6 | 2,389,469(0.02%)#795 |
| 7. | Springfield | 259 | 8,003(3.24%)#7 | 2,389,469(0.01%)#1,050 |
| 8. | Blue Springs | 244 | 8,003(3.05%)#8 | 2,389,469(0.01%)#1,106 |
| 9. | Milan | 208 | 8,003(2.60%)#9 | 2,389,469(0.01%)#1,233 |
| 10. | Raymore | 187 | 8,003(2.34%)#10 | 2,389,469(0.01%)#1,304 |
| 11. | Lee S Summit | 150 | 8,003(1.87%)#11 | 2,389,469(0.01%)#1,477 |
| 12. | Peculiar | 118 | 8,003(1.47%)#12 | 2,389,469(0.00%)#1,652 |
| 13. | Joplin | 109 | 8,003(1.36%)#13 | 2,389,469(0.00%)#1,716 |
| 14. | Excelsior Springs | 71 | 8,003(0.89%)#14 | 2,389,469(0.00%)#2,132 |
| 15. | Dexter | 70 | 8,003(0.87%)#15 | 2,389,469(0.00%)#2,151 |
| 16. | Spanish Lake | 64 | 8,003(0.80%)#16 | 2,389,469(0.00%)#2,242 |
| 17. | Chesterfield | 62 | 8,003(0.77%)#17 | 2,389,469(0.00%)#2,273 |
| 18. | Oakville | 61 | 8,003(0.76%)#18 | 2,389,469(0.00%)#2,292 |
| 19. | Columbia | 54 | 8,003(0.67%)#19 | 2,389,469(0.00%)#2,407 |
| 20. | Woodson Terrace | 54 | 8,003(0.67%)#20 | 2,389,469(0.00%)#2,420 |
| 21. | St Louis | 50 | 8,003(0.62%)#21 | 2,389,469(0.00%)#2,478 |
| 22. | Ste Genevieve | 48 | 8,003(0.60%)#22 | 2,389,469(0.00%)#2,546 |
| 23. | Fort Leonard Wood | 46 | 8,003(0.57%)#23 | 2,389,469(0.00%)#2,576 |
| 24. | Cape Girardeau | 37 | 8,003(0.46%)#24 | 2,389,469(0.00%)#2,807 |
| 25. | Mexico | 37 | 8,003(0.46%)#25 | 2,389,469(0.00%)#2,819 |
| 26. | Macon | 34 | 8,003(0.42%)#26 | 2,389,469(0.00%)#2,899 |
| 27. | Country Club | 31 | 8,003(0.39%)#27 | 2,389,469(0.00%)#3,015 |
| 28. | Jefferson City | 29 | 8,003(0.36%)#28 | 2,389,469(0.00%)#3,054 |
| 29. | Bridgeton | 29 | 8,003(0.36%)#29 | 2,389,469(0.00%)#3,066 |
| 30. | Farmington | 25 | 8,003(0.31%)#30 | 2,389,469(0.00%)#3,222 |
| 31. | Taos | 22 | 8,003(0.27%)#31 | 2,389,469(0.00%)#3,363 |
| 32. | Ferguson | 21 | 8,003(0.26%)#32 | 2,389,469(0.00%)#3,375 |
| 33. | Gladstone | 20 | 8,003(0.25%)#33 | 2,389,469(0.00%)#3,414 |
| 34. | Whiteman Afb | 20 | 8,003(0.25%)#34 | 2,389,469(0.00%)#3,440 |
| 35. | Noel | 20 | 8,003(0.25%)#35 | 2,389,469(0.00%)#3,447 |
| 36. | Kirkwood | 19 | 8,003(0.24%)#36 | 2,389,469(0.00%)#3,462 |
| 37. | Pacific | 18 | 8,003(0.22%)#37 | 2,389,469(0.00%)#3,531 |
| 38. | Platte City | 17 | 8,003(0.21%)#38 | 2,389,469(0.00%)#3,585 |
| 39. | Niangua | 17 | 8,003(0.21%)#39 | 2,389,469(0.00%)#3,611 |
| 40. | Merriam Woods | 16 | 8,003(0.20%)#40 | 2,389,469(0.00%)#3,661 |
| 41. | Maryville | 15 | 8,003(0.19%)#41 | 2,389,469(0.00%)#3,695 |
| 42. | Green City | 15 | 8,003(0.19%)#42 | 2,389,469(0.00%)#3,730 |
| 43. | Liberal | 12 | 8,003(0.15%)#43 | 2,389,469(0.00%)#3,928 |
| 44. | Raytown | 10 | 8,003(0.12%)#44 | 2,389,469(0.00%)#3,998 |
| 45. | Archie | 10 | 8,003(0.12%)#45 | 2,389,469(0.00%)#4,046 |
| 46. | New Bloomfield | 9 | 8,003(0.11%)#46 | 2,389,469(0.00%)#4,129 |
| 47. | Leeton | 9 | 8,003(0.11%)#47 | 2,389,469(0.00%)#4,132 |
| 48. | St Charles | 8 | 8,003(0.10%)#48 | 2,389,469(0.00%)#4,141 |
| 49. | Greenwood | 8 | 8,003(0.10%)#49 | 2,389,469(0.00%)#4,174 |
| 50. | Canton | 8 | 8,003(0.10%)#50 | 2,389,469(0.00%)#4,193 |
| 51. | Goodman | 8 | 8,003(0.10%)#51 | 2,389,469(0.00%)#4,212 |
| 52. | Jane | 8 | 8,003(0.10%)#52 | 2,389,469(0.00%)#4,221 |
| 53. | Wildwood | 7 | 8,003(0.09%)#53 | 2,389,469(0.00%)#4,235 |
| 54. | Clayton | 7 | 8,003(0.09%)#54 | 2,389,469(0.00%)#4,244 |
| 55. | Lockwood | 7 | 8,003(0.09%)#55 | 2,389,469(0.00%)#4,281 |
| 56. | Reeds Spring | 7 | 8,003(0.09%)#56 | 2,389,469(0.00%)#4,284 |
| 57. | Stanberry | 6 | 8,003(0.07%)#57 | 2,389,469(0.00%)#4,380 |
| 58. | Parkville | 5 | 8,003(0.06%)#58 | 2,389,469(0.00%)#4,423 |
| 59. | Duenweg | 5 | 8,003(0.06%)#59 | 2,389,469(0.00%)#4,455 |
| 60. | Jonesburg | 5 | 8,003(0.06%)#60 | 2,389,469(0.00%)#4,467 |
| 61. | Gunn City | 5 | 8,003(0.06%)#61 | 2,389,469(0.00%)#4,481 |
| 62. | Hazelwood | 4 | 8,003(0.05%)#62 | 2,389,469(0.00%)#4,488 |
| 63. | Lone Jack | 4 | 8,003(0.05%)#63 | 2,389,469(0.00%)#4,536 |
| 64. | Branson | 3 | 8,003(0.04%)#64 | 2,389,469(0.00%)#4,578 |
| 65. | Granby | 3 | 8,003(0.04%)#65 | 2,389,469(0.00%)#4,605 |
| 66. | Charlack | 3 | 8,003(0.04%)#66 | 2,389,469(0.00%)#4,613 |
| 67. | Seligman | 2 | 8,003(0.02%)#67 | 2,389,469(0.00%)#4,707 |
| 68. | Smithton | 2 | 8,003(0.02%)#68 | 2,389,469(0.00%)#4,723 |
| 69. | Weldon Spring Heights | 2 | 8,003(0.02%)#69 | 2,389,469(0.00%)#4,738 |
Common Questions
What are the Top 10 Cities with the Largest Salvadoran Community in Missouri?
Top 10 Cities with the Largest Salvadoran Community in Missouri are:
#1
1,857
#2
819
#3
801
#4
592
#5
445
#6
392
#7
259
#8
244
#9
208
#10
187
What city has the Largest Salvadoran Community in Missouri?
Kansas City has the Largest Salvadoran Community in Missouri with 1,857.
What is the Total Salvadoran Population in the State of Missouri?
Total Salvadoran Population in Missouri is 8,003.
What is the Total Salvadoran Population in the United States?
Total Salvadoran Population in the United States is 2,389,469.