Old Jamestown, MO
Old Jamestown Map
Old Jamestown Overview
20,387
TOTAL POPULATION
9,309
MALE POPULATION
11,078
FEMALE POPULATION
84.03
MALES / 100 FEMALES
119.00
FEMALES / 100 MALES
41.4
MEDIAN AGE
3.4
AVG FAMILY SIZE
3.0
AVG HOUSEHOLD SIZE
$40,494
PER CAPITA INCOME
$110,321
AVG FAMILY INCOME
$103,943
AVG HOUSEHOLD INCOME
14.1%
WAGE / INCOME GAP [ % ]
85.9¢/ $1
WAGE / INCOME GAP [ $ ]
0.35
INEQUALITY / GINI INDEX
10,286
LABOR FORCE [ PEOPLE ]
65.4%
PERCENT IN LABOR FORCE
4.3%
UNEMPLOYMENT RATE
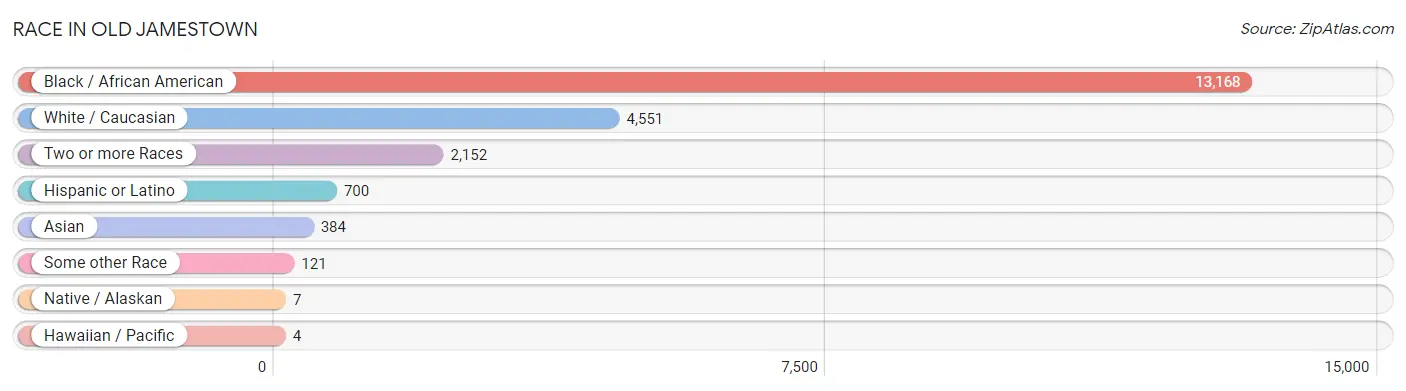
Race in Old Jamestown
The most populous races in Old Jamestown are Black / African American (13,168 | 64.6%), White / Caucasian (4,551 | 22.3%), and Two or more Races (2,152 | 10.6%).
| Race | # Population | % Population |
| Asian | 384 | 1.9% |
| Black / African American | 13,168 | 64.6% |
| Hawaiian / Pacific | 4 | 0.0% |
| Hispanic or Latino | 700 | 3.4% |
| Native / Alaskan | 7 | 0.0% |
| White / Caucasian | 4,551 | 22.3% |
| Two or more Races | 2,152 | 10.6% |
| Some other Race | 121 | 0.6% |
| Total | 20,387 | 100.0% |
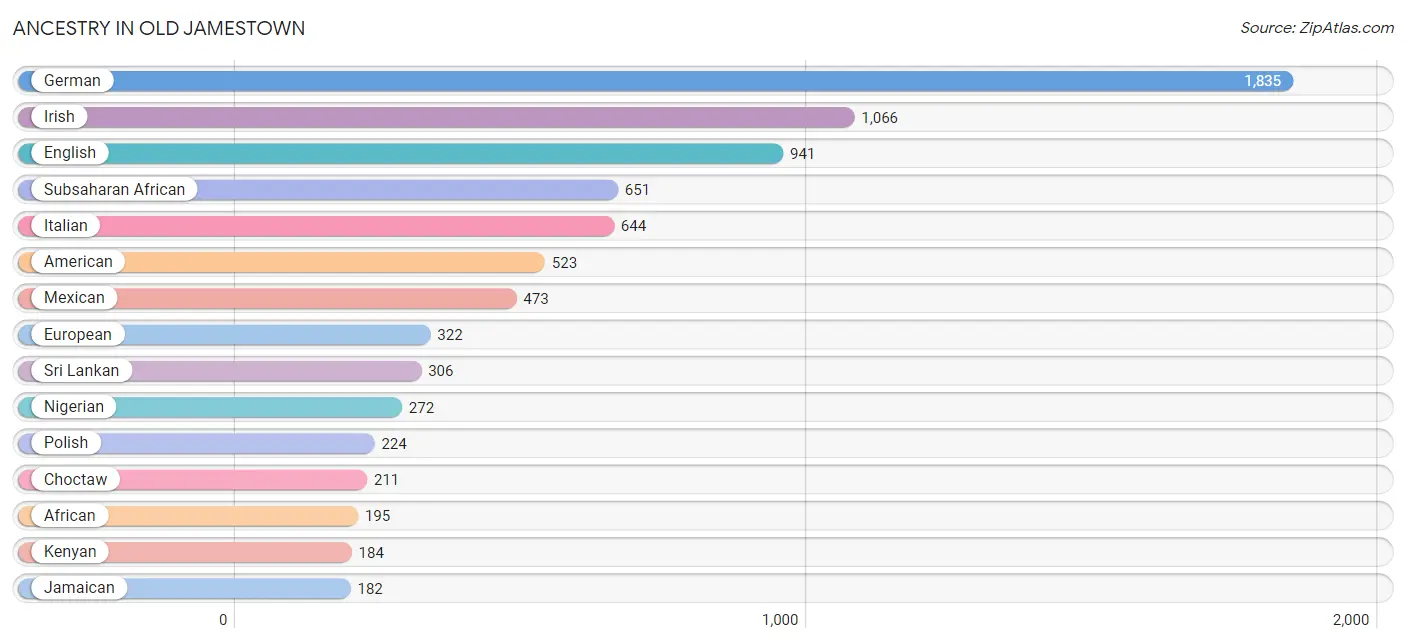
Ancestry in Old Jamestown
The most populous ancestries reported in Old Jamestown are German (1,835 | 9.0%), Irish (1,066 | 5.2%), English (941 | 4.6%), Subsaharan African (651 | 3.2%), and Italian (644 | 3.2%), together accounting for 25.2% of all Old Jamestown residents.
| Ancestry | # Population | % Population |
| African | 195 | 1.0% |
| American | 523 | 2.6% |
| Apache | 52 | 0.3% |
| Arab | 89 | 0.4% |
| Austrian | 40 | 0.2% |
| Bhutanese | 80 | 0.4% |
| Blackfeet | 52 | 0.3% |
| British | 36 | 0.2% |
| British West Indian | 53 | 0.3% |
| Central American | 23 | 0.1% |
| Central American Indian | 11 | 0.1% |
| Cherokee | 90 | 0.4% |
| Choctaw | 211 | 1.0% |
| Cuban | 4 | 0.0% |
| Czech | 35 | 0.2% |
| Eastern European | 26 | 0.1% |
| English | 941 | 4.6% |
| European | 322 | 1.6% |
| French | 170 | 0.8% |
| German | 1,835 | 9.0% |
| Haitian | 61 | 0.3% |
| Indian (Asian) | 68 | 0.3% |
| Iranian | 9 | 0.0% |
| Irish | 1,066 | 5.2% |
| Israeli | 24 | 0.1% |
| Italian | 644 | 3.2% |
| Jamaican | 182 | 0.9% |
| Jordanian | 89 | 0.4% |
| Kenyan | 184 | 0.9% |
| Korean | 10 | 0.1% |
| Lithuanian | 18 | 0.1% |
| Mexican | 473 | 2.3% |
| Nigerian | 272 | 1.3% |
| Northern European | 19 | 0.1% |
| Norwegian | 26 | 0.1% |
| Panamanian | 23 | 0.1% |
| Polish | 224 | 1.1% |
| Puerto Rican | 148 | 0.7% |
| Romanian | 11 | 0.1% |
| Scandinavian | 15 | 0.1% |
| Scotch-Irish | 114 | 0.6% |
| Scottish | 109 | 0.5% |
| Spaniard | 27 | 0.1% |
| Sri Lankan | 306 | 1.5% |
| Subsaharan African | 651 | 3.2% |
| Swedish | 59 | 0.3% |
| Swiss | 11 | 0.1% |
| Trinidadian and Tobagonian | 68 | 0.3% |
| Ukrainian | 11 | 0.1% |
| Welsh | 90 | 0.4% |
| West Indian | 92 | 0.4% | View All 51 Rows |
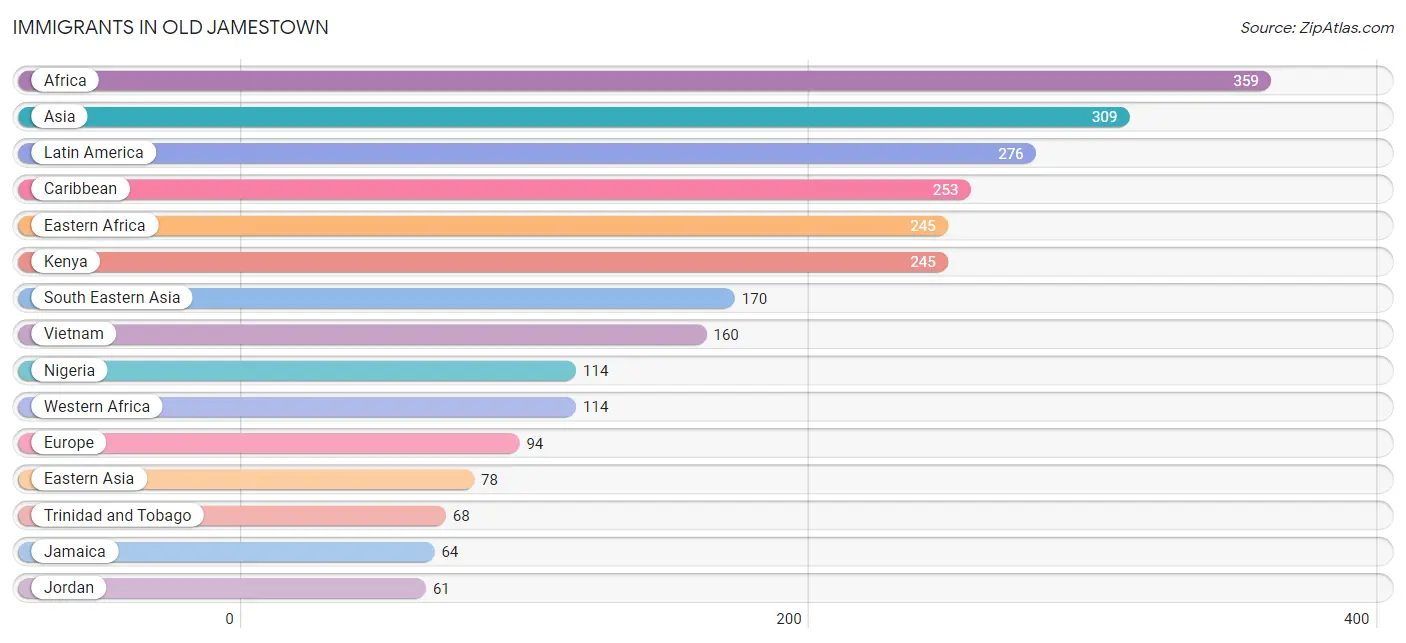
Immigrants in Old Jamestown
The most numerous immigrant groups reported in Old Jamestown came from Africa (359 | 1.8%), Asia (309 | 1.5%), Latin America (276 | 1.3%), Caribbean (253 | 1.2%), and Eastern Africa (245 | 1.2%), together accounting for 7.1% of all Old Jamestown residents.
| Immigration Origin | # Population | % Population |
| Africa | 359 | 1.8% |
| Asia | 309 | 1.5% |
| Caribbean | 253 | 1.2% |
| Central America | 23 | 0.1% |
| China | 44 | 0.2% |
| Cuba | 4 | 0.0% |
| Dominican Republic | 17 | 0.1% |
| Eastern Africa | 245 | 1.2% |
| Eastern Asia | 78 | 0.4% |
| Eastern Europe | 9 | 0.0% |
| Europe | 94 | 0.5% |
| Fiji | 4 | 0.0% |
| Haiti | 8 | 0.0% |
| Italy | 42 | 0.2% |
| Jamaica | 64 | 0.3% |
| Japan | 34 | 0.2% |
| Jordan | 61 | 0.3% |
| Kenya | 245 | 1.2% |
| Latin America | 276 | 1.3% |
| Nigeria | 114 | 0.6% |
| Northern Europe | 42 | 0.2% |
| Oceania | 4 | 0.0% |
| Panama | 23 | 0.1% |
| Philippines | 10 | 0.1% |
| Poland | 9 | 0.0% |
| South Eastern Asia | 170 | 0.8% |
| Southern Europe | 43 | 0.2% |
| Spain | 1 | 0.0% |
| Sweden | 42 | 0.2% |
| Trinidad and Tobago | 68 | 0.3% |
| Vietnam | 160 | 0.8% |
| Western Africa | 114 | 0.6% |
| Western Asia | 61 | 0.3% | View All 33 Rows |
Sex and Age in Old Jamestown
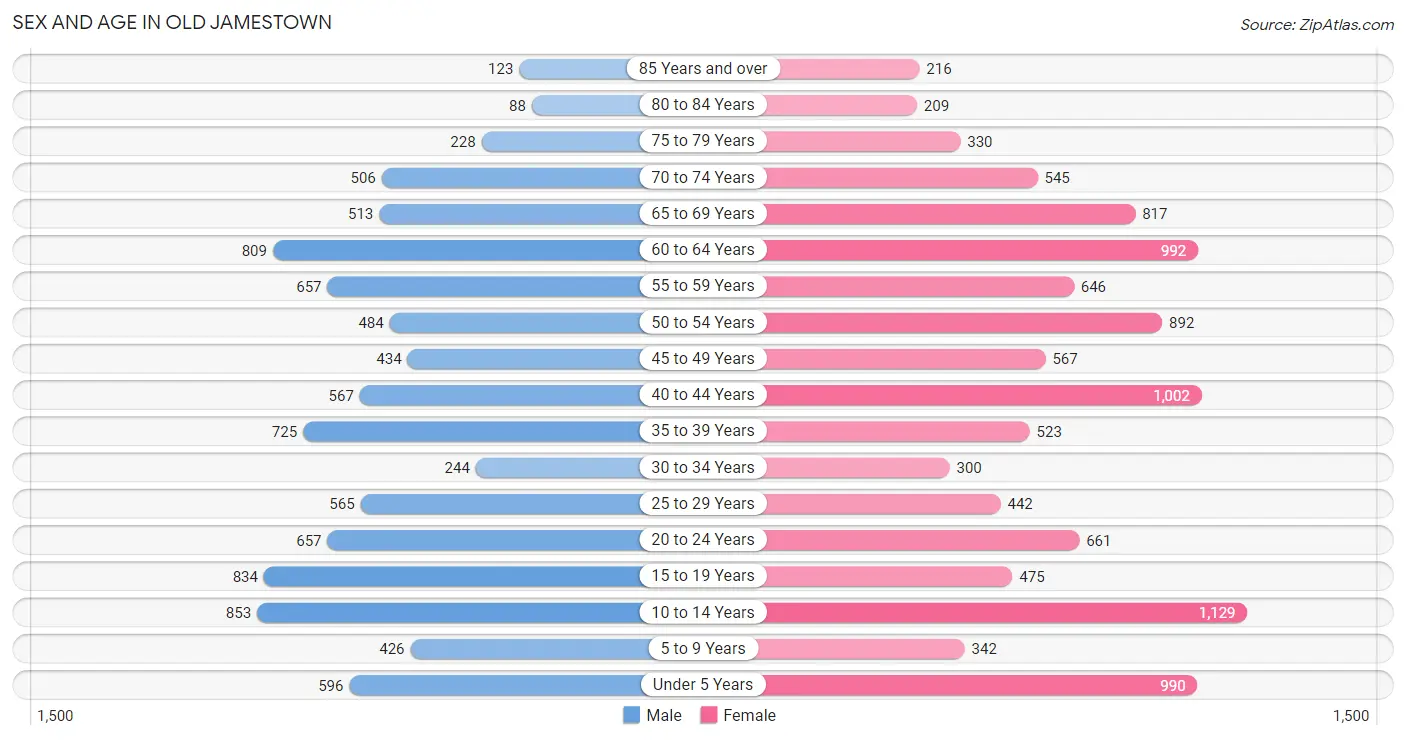
Sex and Age in Old Jamestown
The most populous age groups in Old Jamestown are 10 to 14 Years (853 | 9.2%) for men and 10 to 14 Years (1,129 | 10.2%) for women.
| Age Bracket | Male | Female |
| Under 5 Years | 596 (6.4%) | 990 (8.9%) |
| 5 to 9 Years | 426 (4.6%) | 342 (3.1%) |
| 10 to 14 Years | 853 (9.2%) | 1,129 (10.2%) |
| 15 to 19 Years | 834 (9.0%) | 475 (4.3%) |
| 20 to 24 Years | 657 (7.1%) | 661 (6.0%) |
| 25 to 29 Years | 565 (6.1%) | 442 (4.0%) |
| 30 to 34 Years | 244 (2.6%) | 300 (2.7%) |
| 35 to 39 Years | 725 (7.8%) | 523 (4.7%) |
| 40 to 44 Years | 567 (6.1%) | 1,002 (9.0%) |
| 45 to 49 Years | 434 (4.7%) | 567 (5.1%) |
| 50 to 54 Years | 484 (5.2%) | 892 (8.1%) |
| 55 to 59 Years | 657 (7.1%) | 646 (5.8%) |
| 60 to 64 Years | 809 (8.7%) | 992 (8.9%) |
| 65 to 69 Years | 513 (5.5%) | 817 (7.4%) |
| 70 to 74 Years | 506 (5.4%) | 545 (4.9%) |
| 75 to 79 Years | 228 (2.5%) | 330 (3.0%) |
| 80 to 84 Years | 88 (0.9%) | 209 (1.9%) |
| 85 Years and over | 123 (1.3%) | 216 (1.9%) |
| Total | 9,309 (100.0%) | 11,078 (100.0%) |
Families and Households in Old Jamestown
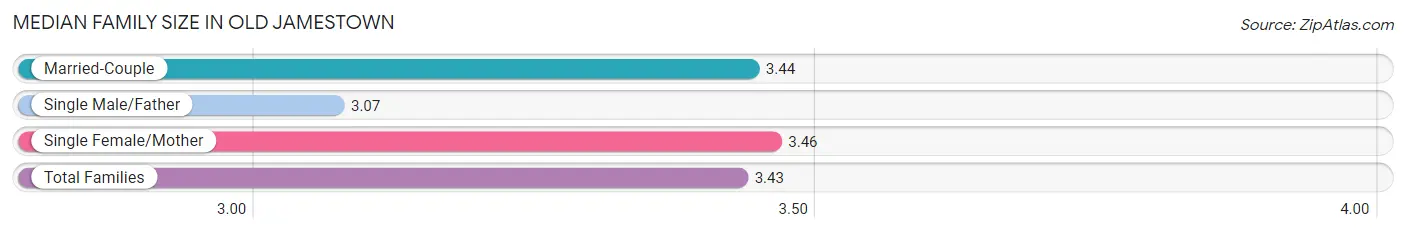
Median Family Size in Old Jamestown
The median family size in Old Jamestown is 3.43 persons per family, with single female/mother families (957 | 18.8%) accounting for the largest median family size of 3.46 persons per family. On the other hand, single male/father families (192 | 3.8%) represent the smallest median family size with 3.07 persons per family.
| Family Type | # Families | Family Size |
| Married-Couple | 3,942 (77.4%) | 3.44 |
| Single Male/Father | 192 (3.8%) | 3.07 |
| Single Female/Mother | 957 (18.8%) | 3.46 |
| Total Families | 5,091 (100.0%) | 3.43 |
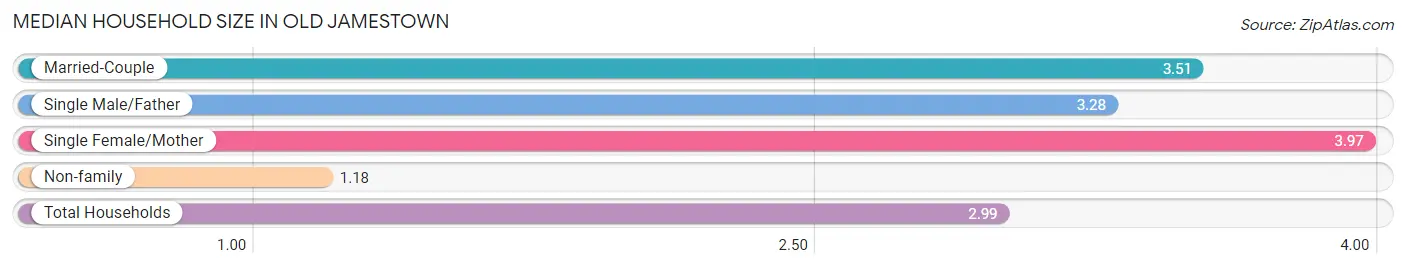
Median Household Size in Old Jamestown
The median household size in Old Jamestown is 2.99 persons per household, with single female/mother households (957 | 14.1%) accounting for the largest median household size of 3.97 persons per household. non-family households (1,698 | 25.0%) represent the smallest median household size with 1.18 persons per household.
| Household Type | # Households | Household Size |
| Married-Couple | 3,942 (58.1%) | 3.51 |
| Single Male/Father | 192 (2.8%) | 3.28 |
| Single Female/Mother | 957 (14.1%) | 3.97 |
| Non-family | 1,698 (25.0%) | 1.18 |
| Total Households | 6,789 (100.0%) | 2.99 |
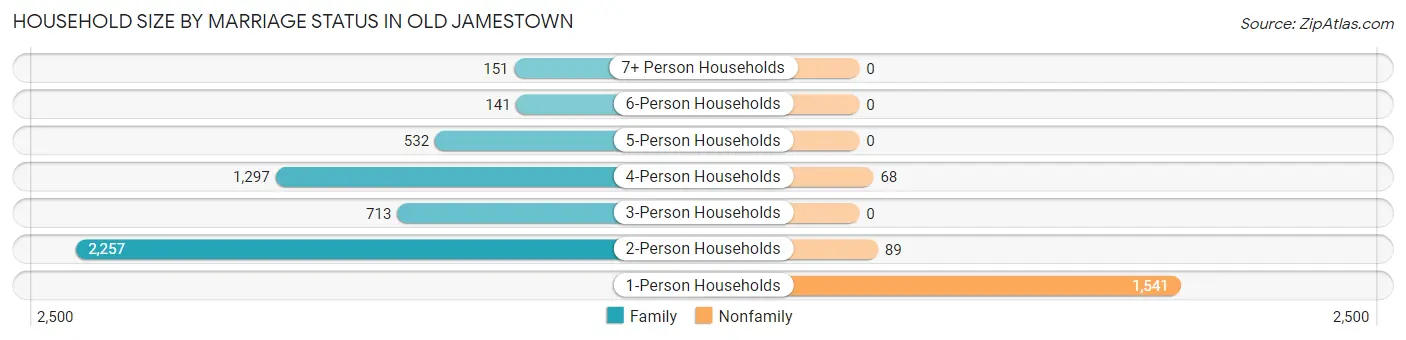
Household Size by Marriage Status in Old Jamestown
Out of a total of 6,789 households in Old Jamestown, 5,091 (75.0%) are family households, while 1,698 (25.0%) are nonfamily households. The most numerous type of family households are 2-person households, comprising 2,257, and the most common type of nonfamily households are 1-person households, comprising 1,541.
| Household Size | Family Households | Nonfamily Households |
| 1-Person Households | - | 1,541 (22.7%) |
| 2-Person Households | 2,257 (33.2%) | 89 (1.3%) |
| 3-Person Households | 713 (10.5%) | 0 (0.0%) |
| 4-Person Households | 1,297 (19.1%) | 68 (1.0%) |
| 5-Person Households | 532 (7.8%) | 0 (0.0%) |
| 6-Person Households | 141 (2.1%) | 0 (0.0%) |
| 7+ Person Households | 151 (2.2%) | 0 (0.0%) |
| Total | 5,091 (75.0%) | 1,698 (25.0%) |
Female Fertility in Old Jamestown
Fertility by Age in Old Jamestown
Average fertility rate in Old Jamestown is 17.0 births per 1,000 women. Women in the age bracket of 35 to 50 years have the highest fertility rate with 25.0 births per 1,000 women. Women in the age bracket of 35 to 50 years acount for 80.9% of all women with births.
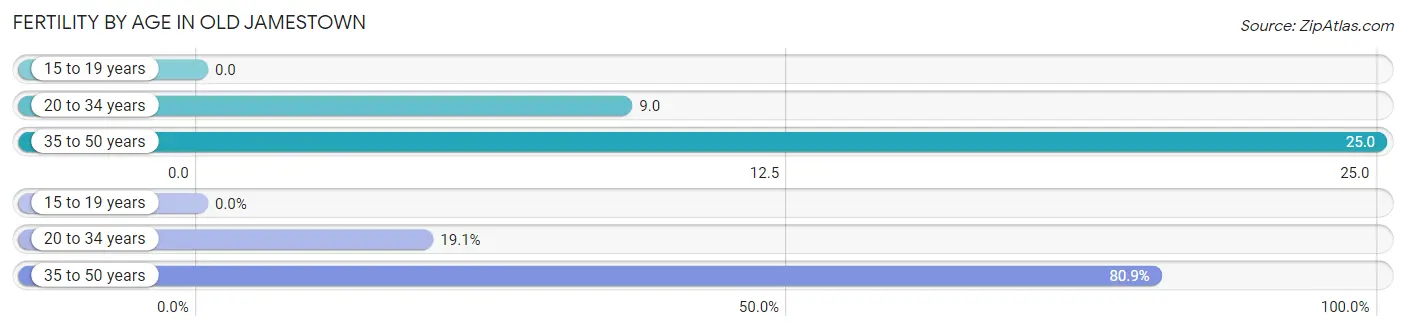
| Age Bracket | Women with Births | Births / 1,000 Women |
| 15 to 19 years | 0 (0.0%) | 0.0 |
| 20 to 34 years | 13 (19.1%) | 9.0 |
| 35 to 50 years | 55 (80.9%) | 25.0 |
| Total | 68 (100.0%) | 17.0 |
Fertility by Age by Marriage Status in Old Jamestown
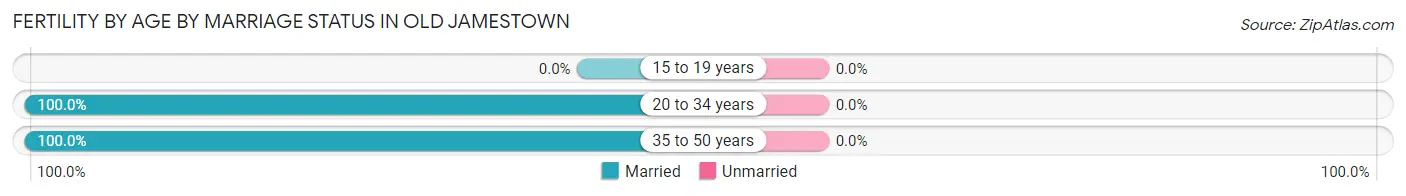
| Age Bracket | Married | Unmarried |
| 15 to 19 years | 0 (0.0%) | 0 (0.0%) |
| 20 to 34 years | 13 (100.0%) | 0 (0.0%) |
| 35 to 50 years | 55 (100.0%) | 0 (0.0%) |
| Total | 68 (100.0%) | 0 (0.0%) |
Fertility by Education in Old Jamestown
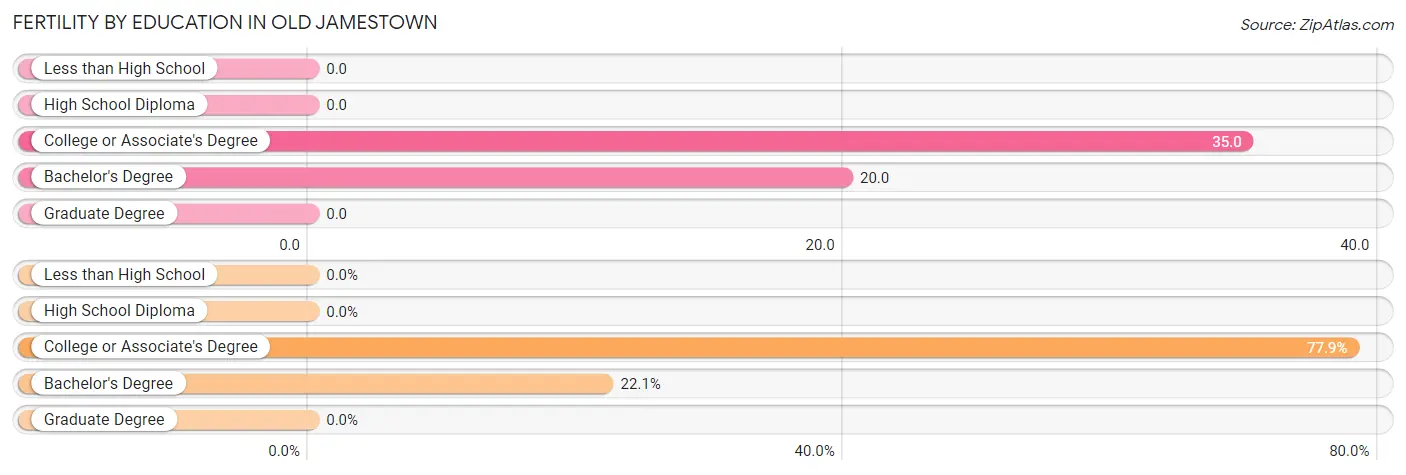
| Educational Attainment | Women with Births | Births / 1,000 Women |
| Less than High School | 0 (0.0%) | 0.0 |
| High School Diploma | 0 (0.0%) | 0.0 |
| College or Associate's Degree | 53 (77.9%) | 35.0 |
| Bachelor's Degree | 15 (22.1%) | 20.0 |
| Graduate Degree | 0 (0.0%) | 0.0 |
| Total | 68 (100.0%) | 17.0 |
Fertility by Education by Marriage Status in Old Jamestown
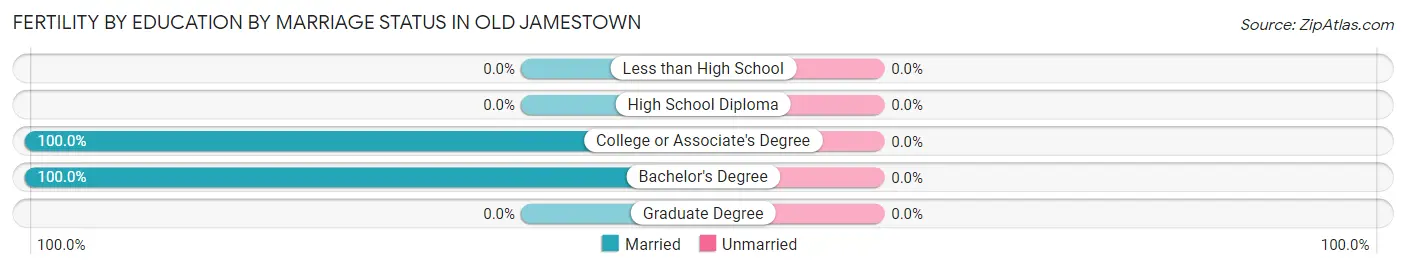
| Educational Attainment | Married | Unmarried |
| Less than High School | 0 (0.0%) | 0 (0.0%) |
| High School Diploma | 0 (0.0%) | 0 (0.0%) |
| College or Associate's Degree | 53 (100.0%) | 0 (0.0%) |
| Bachelor's Degree | 15 (100.0%) | 0 (0.0%) |
| Graduate Degree | 0 (0.0%) | 0 (0.0%) |
| Total | 68 (100.0%) | 0 (0.0%) |
Income in Old Jamestown
Income Overview in Old Jamestown
Per Capita Income in Old Jamestown is $40,494, while median incomes of families and households are $110,321 and $103,943 respectively.
| Characteristic | Number | Measure |
| Per Capita Income | 20,387 | $40,494 |
| Median Family Income | 5,091 | $110,321 |
| Mean Family Income | 5,091 | $124,538 |
| Median Household Income | 6,789 | $103,943 |
| Mean Household Income | 6,789 | $114,610 |
| Income Deficit | 5,091 | $0 |
| Wage / Income Gap (%) | 20,387 | 14.15% |
| Wage / Income Gap ($) | 20,387 | 85.85¢ per $1 |
| Gini / Inequality Index | 20,387 | 0.35 |
Earnings by Sex in Old Jamestown
Average Earnings in Old Jamestown are $44,452, $48,516 for men and $41,652 for women, a difference of 14.1%.
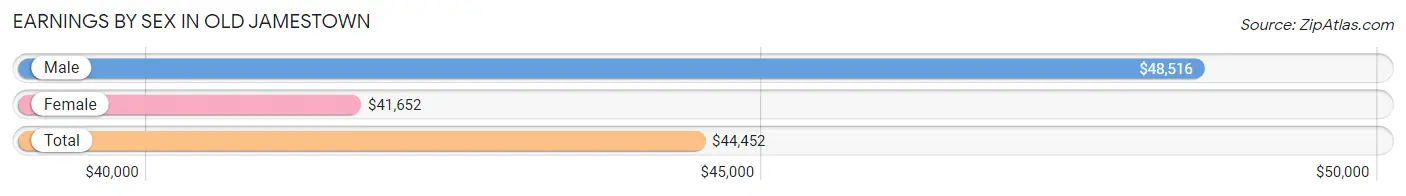
| Sex | Number | Average Earnings |
| Male | 5,256 (48.2%) | $48,516 |
| Female | 5,644 (51.8%) | $41,652 |
| Total | 10,900 (100.0%) | $44,452 |
Earnings by Sex by Income Bracket in Old Jamestown
The most common earnings brackets in Old Jamestown are $100,000+ for men (1,066 | 20.3%) and $100,000+ for women (952 | 16.9%).
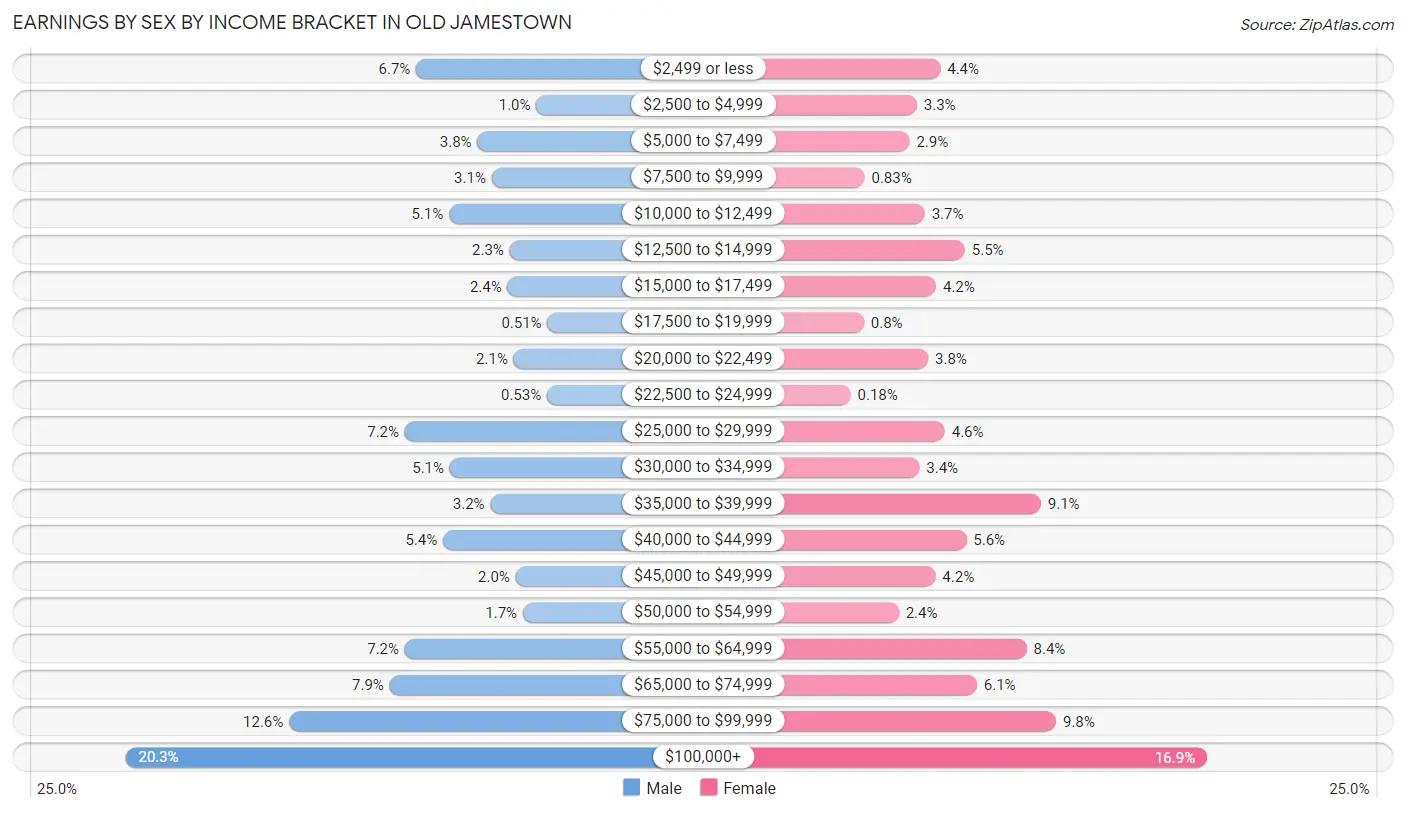
| Income | Male | Female |
| $2,499 or less | 350 (6.7%) | 247 (4.4%) |
| $2,500 to $4,999 | 54 (1.0%) | 185 (3.3%) |
| $5,000 to $7,499 | 199 (3.8%) | 166 (2.9%) |
| $7,500 to $9,999 | 164 (3.1%) | 47 (0.8%) |
| $10,000 to $12,499 | 269 (5.1%) | 206 (3.6%) |
| $12,500 to $14,999 | 120 (2.3%) | 312 (5.5%) |
| $15,000 to $17,499 | 125 (2.4%) | 236 (4.2%) |
| $17,500 to $19,999 | 27 (0.5%) | 45 (0.8%) |
| $20,000 to $22,499 | 110 (2.1%) | 215 (3.8%) |
| $22,500 to $24,999 | 28 (0.5%) | 10 (0.2%) |
| $25,000 to $29,999 | 378 (7.2%) | 259 (4.6%) |
| $30,000 to $34,999 | 267 (5.1%) | 192 (3.4%) |
| $35,000 to $39,999 | 167 (3.2%) | 513 (9.1%) |
| $40,000 to $44,999 | 284 (5.4%) | 316 (5.6%) |
| $45,000 to $49,999 | 105 (2.0%) | 234 (4.2%) |
| $50,000 to $54,999 | 87 (1.7%) | 137 (2.4%) |
| $55,000 to $64,999 | 378 (7.2%) | 475 (8.4%) |
| $65,000 to $74,999 | 415 (7.9%) | 344 (6.1%) |
| $75,000 to $99,999 | 663 (12.6%) | 553 (9.8%) |
| $100,000+ | 1,066 (20.3%) | 952 (16.9%) |
| Total | 5,256 (100.0%) | 5,644 (100.0%) |
Earnings by Sex by Educational Attainment in Old Jamestown
Average earnings in Old Jamestown are $61,365 for men and $48,170 for women, a difference of 21.5%. Men with an educational attainment of bachelor's degree enjoy the highest average annual earnings of $85,402, while those with college or associate's degree education earn the least with $53,696. Women with an educational attainment of graduate degree earn the most with the average annual earnings of $105,700, while those with less than high school education have the smallest earnings of $14,257.
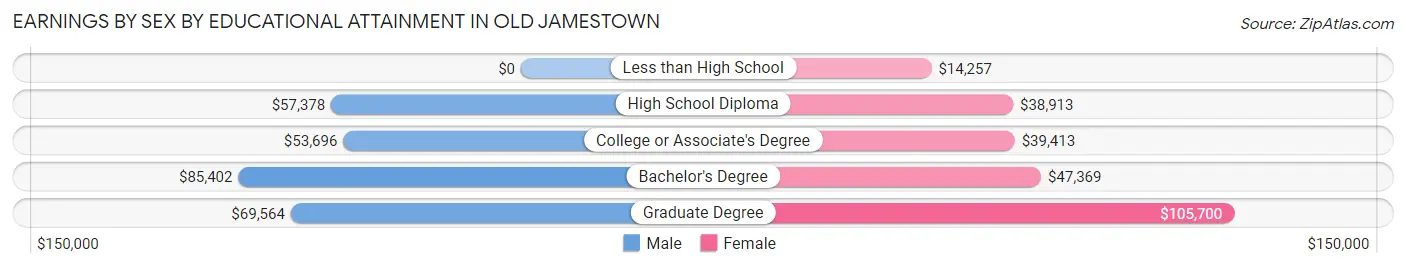
| Educational Attainment | Male Income | Female Income |
| Less than High School | - | - |
| High School Diploma | $57,378 | $38,913 |
| College or Associate's Degree | $53,696 | $39,413 |
| Bachelor's Degree | $85,402 | $47,369 |
| Graduate Degree | $69,564 | $105,700 |
| Total | $61,365 | $48,170 |
Family Income in Old Jamestown
Family Income Brackets in Old Jamestown
According to the Old Jamestown family income data, there are 1,746 families falling into the $100,000 to $149,999 income range, which is the most common income bracket and makes up 34.3% of all families. Conversely, the less than $10,000 income bracket is the least frequent group with only 61 families (1.2%) belonging to this category.
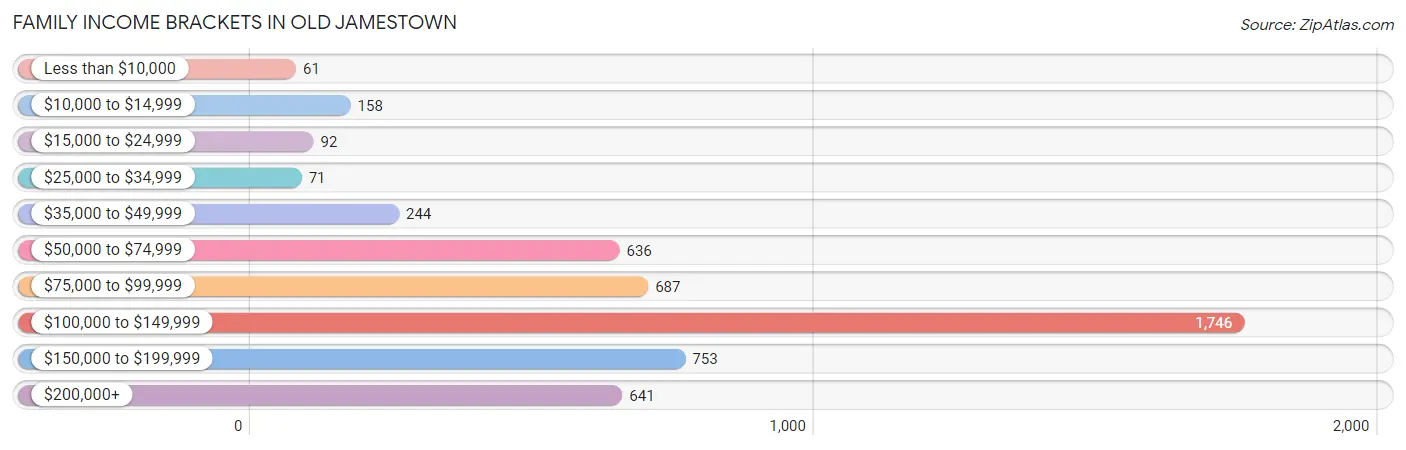
| Income Bracket | # Families | % Families |
| Less than $10,000 | 61 | 1.2% |
| $10,000 to $14,999 | 158 | 3.1% |
| $15,000 to $24,999 | 92 | 1.8% |
| $25,000 to $34,999 | 71 | 1.4% |
| $35,000 to $49,999 | 244 | 4.8% |
| $50,000 to $74,999 | 636 | 12.5% |
| $75,000 to $99,999 | 687 | 13.5% |
| $100,000 to $149,999 | 1,746 | 34.3% |
| $150,000 to $199,999 | 753 | 14.8% |
| $200,000+ | 641 | 12.6% |
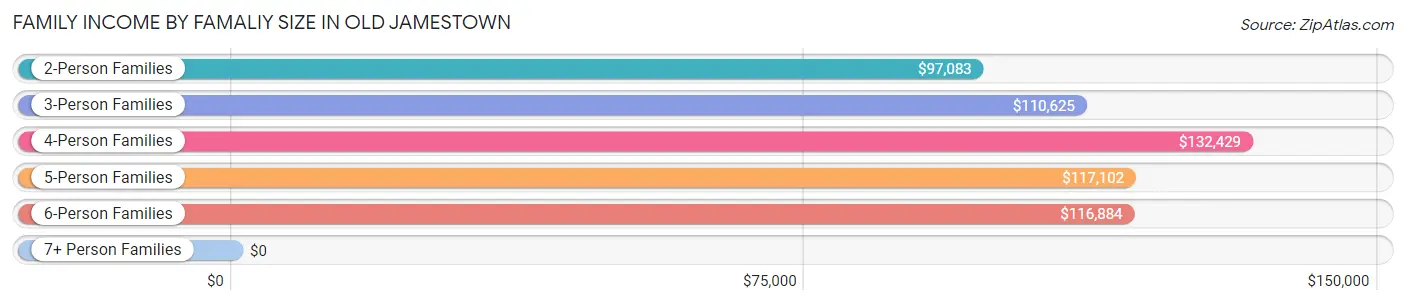
Family Income by Famaliy Size in Old Jamestown
4-person families (1,235 | 24.3%) account for the highest median family income in Old Jamestown with $132,429 per family, while 2-person families (2,403 | 47.2%) have the highest median income of $48,542 per family member.
| Income Bracket | # Families | Median Income |
| 2-Person Families | 2,403 (47.2%) | $97,083 |
| 3-Person Families | 704 (13.8%) | $110,625 |
| 4-Person Families | 1,235 (24.3%) | $132,429 |
| 5-Person Families | 535 (10.5%) | $117,102 |
| 6-Person Families | 177 (3.5%) | $116,884 |
| 7+ Person Families | 37 (0.7%) | $0 |
| Total | 5,091 (100.0%) | $110,321 |
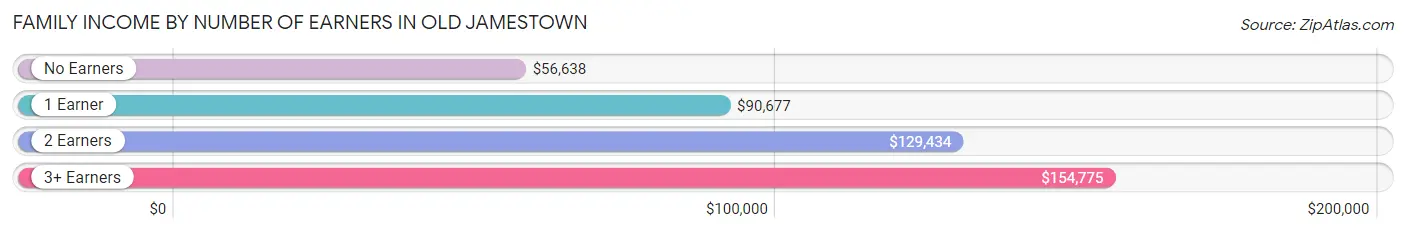
Family Income by Number of Earners in Old Jamestown
The median family income in Old Jamestown is $110,321, with families comprising 3+ earners (775) having the highest median family income of $154,775, while families with no earners (604) have the lowest median family income of $56,638, accounting for 15.2% and 11.9% of families, respectively.
| Number of Earners | # Families | Median Income |
| No Earners | 604 (11.9%) | $56,638 |
| 1 Earner | 1,322 (26.0%) | $90,677 |
| 2 Earners | 2,390 (46.9%) | $129,434 |
| 3+ Earners | 775 (15.2%) | $154,775 |
| Total | 5,091 (100.0%) | $110,321 |
Household Income in Old Jamestown
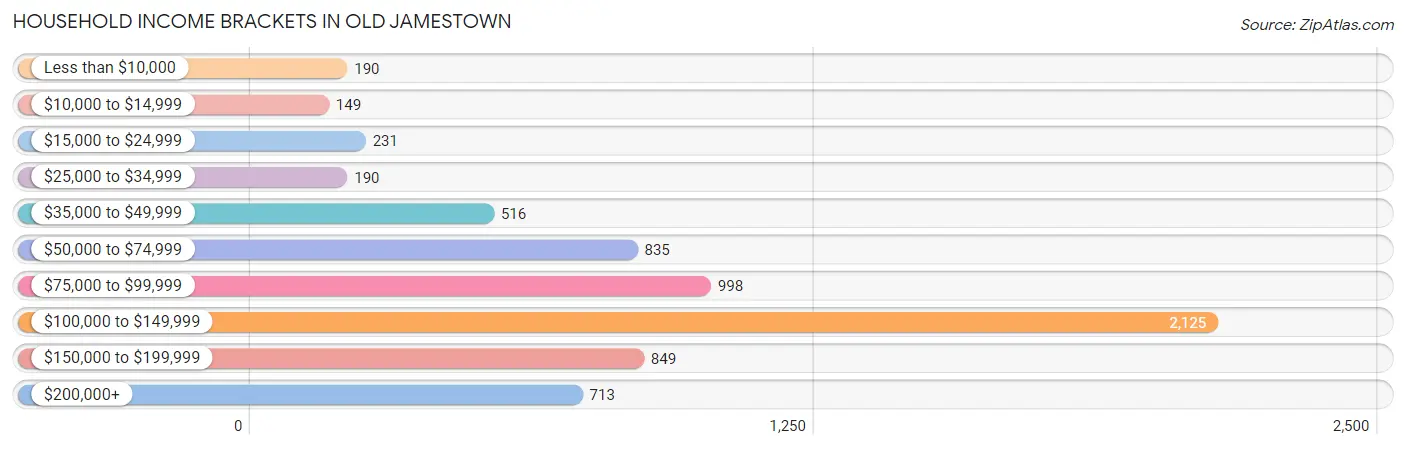
Household Income Brackets in Old Jamestown
With 2,125 households falling in the category, the $100,000 to $149,999 income range is the most frequent in Old Jamestown, accounting for 31.3% of all households. In contrast, only 149 households (2.2%) fall into the $10,000 to $14,999 income bracket, making it the least populous group.
| Income Bracket | # Households | % Households |
| Less than $10,000 | 190 | 2.8% |
| $10,000 to $14,999 | 149 | 2.2% |
| $15,000 to $24,999 | 231 | 3.4% |
| $25,000 to $34,999 | 190 | 2.8% |
| $35,000 to $49,999 | 516 | 7.6% |
| $50,000 to $74,999 | 835 | 12.3% |
| $75,000 to $99,999 | 998 | 14.7% |
| $100,000 to $149,999 | 2,125 | 31.3% |
| $150,000 to $199,999 | 849 | 12.5% |
| $200,000+ | 713 | 10.5% |
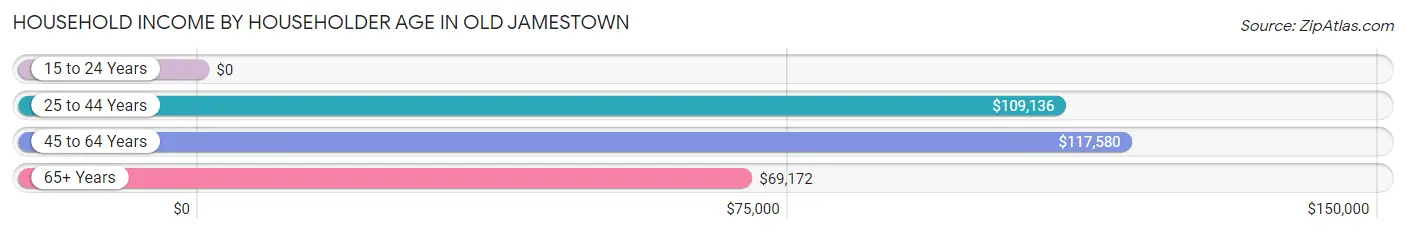
Household Income by Householder Age in Old Jamestown
The median household income in Old Jamestown is $103,943, with the highest median household income of $117,580 found in the 45 to 64 years age bracket for the primary householder. A total of 2,903 households (42.8%) fall into this category. Meanwhile, the 15 to 24 years age bracket for the primary householder has the lowest median household income of $0, with 16 households (0.2%) in this group.
| Income Bracket | # Households | Median Income |
| 15 to 24 Years | 16 (0.2%) | $0 |
| 25 to 44 Years | 1,709 (25.2%) | $109,136 |
| 45 to 64 Years | 2,903 (42.8%) | $117,580 |
| 65+ Years | 2,161 (31.8%) | $69,172 |
| Total | 6,789 (100.0%) | $103,943 |
Poverty in Old Jamestown
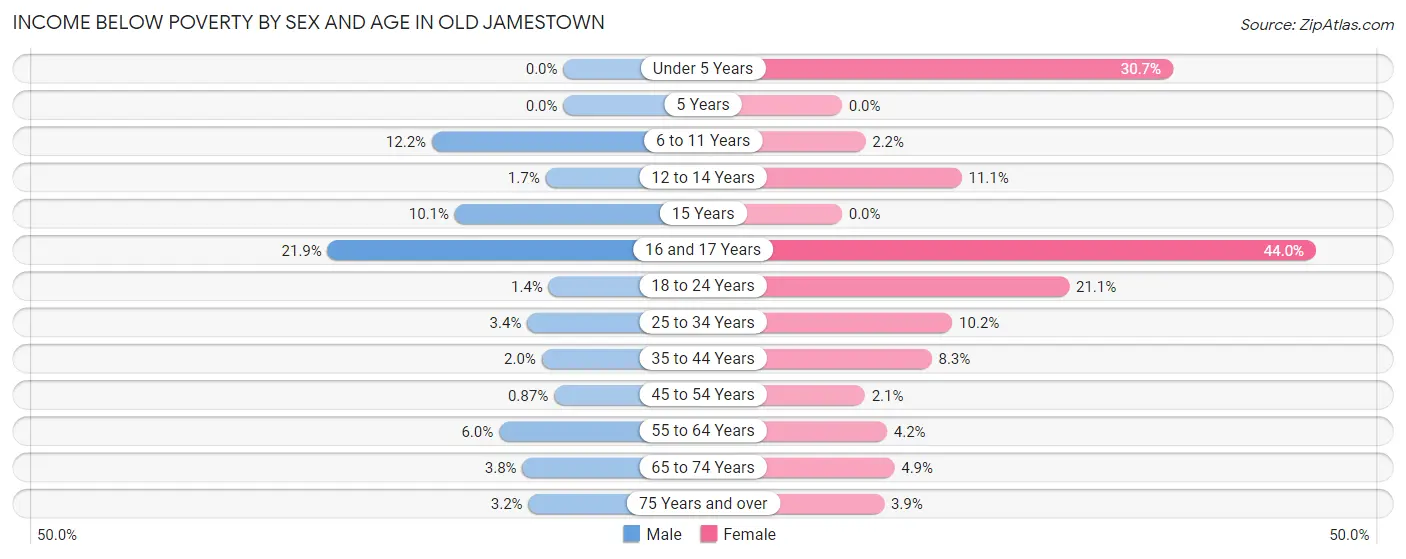
Income Below Poverty by Sex and Age in Old Jamestown
With 4.4% poverty level for males and 8.9% for females among the residents of Old Jamestown, 16 and 17 year old males and 16 and 17 year old females are the most vulnerable to poverty, with 84 males (21.9%) and 77 females (44.0%) in their respective age groups living below the poverty level.
| Age Bracket | Male | Female |
| Under 5 Years | 0 (0.0%) | 204 (30.7%) |
| 5 Years | 0 (0.0%) | 0 (0.0%) |
| 6 to 11 Years | 81 (12.2%) | 13 (2.2%) |
| 12 to 14 Years | 8 (1.7%) | 81 (11.1%) |
| 15 Years | 15 (10.1%) | 0 (0.0%) |
| 16 and 17 Years | 84 (21.9%) | 77 (44.0%) |
| 18 to 24 Years | 13 (1.4%) | 166 (21.1%) |
| 25 to 34 Years | 27 (3.4%) | 76 (10.2%) |
| 35 to 44 Years | 26 (2.0%) | 127 (8.3%) |
| 45 to 54 Years | 8 (0.9%) | 31 (2.1%) |
| 55 to 64 Years | 87 (6.0%) | 68 (4.2%) |
| 65 to 74 Years | 38 (3.8%) | 66 (4.9%) |
| 75 Years and over | 14 (3.2%) | 28 (3.9%) |
| Total | 401 (4.4%) | 937 (8.9%) |
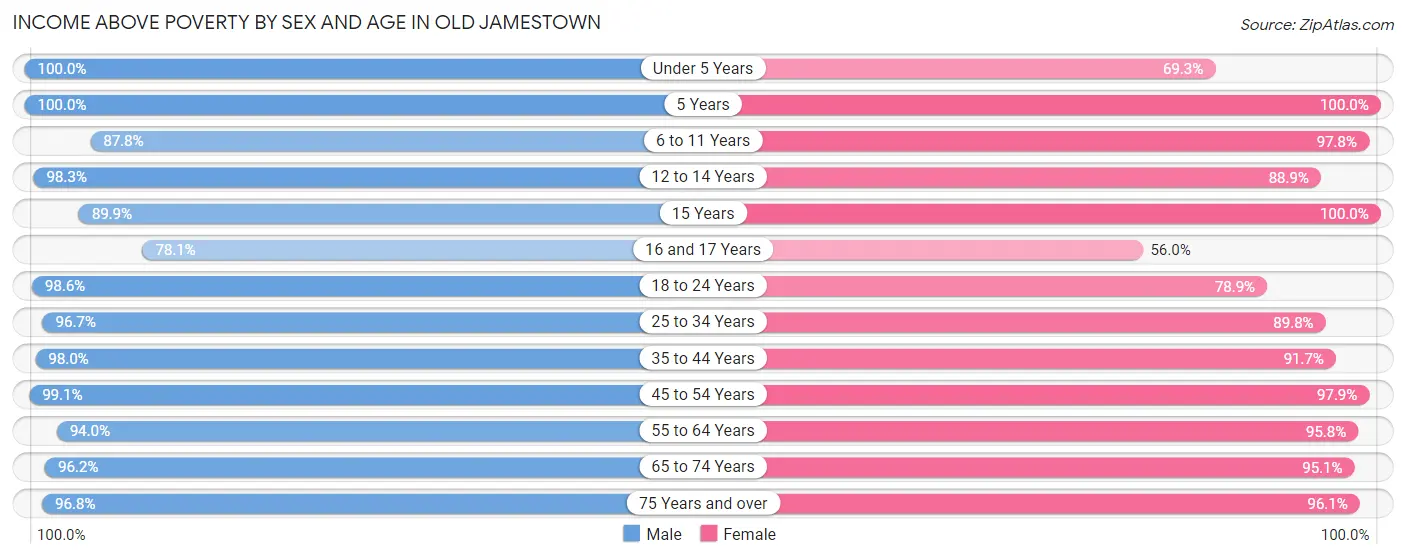
Income Above Poverty by Sex and Age in Old Jamestown
According to the poverty statistics in Old Jamestown, males aged under 5 years and females aged 5 years are the age groups that are most secure financially, with 100.0% of males and 100.0% of females in these age groups living above the poverty line.
| Age Bracket | Male | Female |
| Under 5 Years | 546 (100.0%) | 460 (69.3%) |
| 5 Years | 88 (100.0%) | 22 (100.0%) |
| 6 to 11 Years | 583 (87.8%) | 584 (97.8%) |
| 12 to 14 Years | 474 (98.3%) | 648 (88.9%) |
| 15 Years | 134 (89.9%) | 174 (100.0%) |
| 16 and 17 Years | 300 (78.1%) | 98 (56.0%) |
| 18 to 24 Years | 942 (98.6%) | 621 (78.9%) |
| 25 to 34 Years | 779 (96.7%) | 666 (89.8%) |
| 35 to 44 Years | 1,266 (98.0%) | 1,398 (91.7%) |
| 45 to 54 Years | 910 (99.1%) | 1,424 (97.9%) |
| 55 to 64 Years | 1,371 (94.0%) | 1,560 (95.8%) |
| 65 to 74 Years | 963 (96.2%) | 1,290 (95.1%) |
| 75 Years and over | 418 (96.8%) | 688 (96.1%) |
| Total | 8,774 (95.6%) | 9,633 (91.1%) |
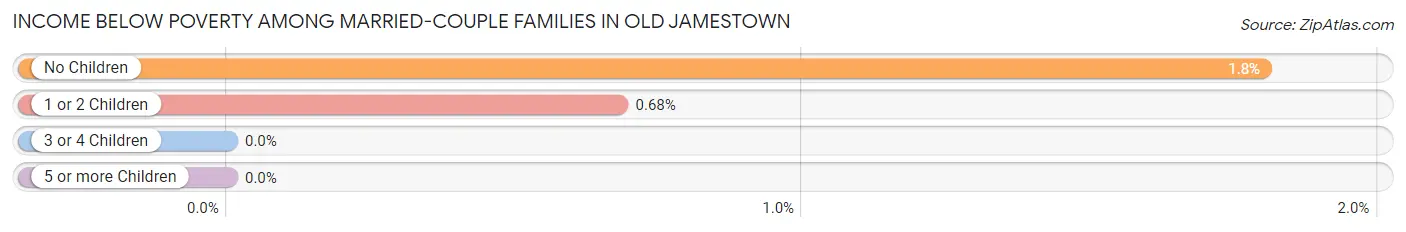
Income Below Poverty Among Married-Couple Families in Old Jamestown
The poverty statistics for married-couple families in Old Jamestown show that 1.3% or 51 of the total 3,942 families live below the poverty line. Families with no children have the highest poverty rate of 1.8%, comprising of 43 families. On the other hand, families with 3 or 4 children have the lowest poverty rate of 0.0%, which includes 0 families.
| Children | Above Poverty | Below Poverty |
| No Children | 2,341 (98.2%) | 43 (1.8%) |
| 1 or 2 Children | 1,160 (99.3%) | 8 (0.7%) |
| 3 or 4 Children | 375 (100.0%) | 0 (0.0%) |
| 5 or more Children | 15 (100.0%) | 0 (0.0%) |
| Total | 3,891 (98.7%) | 51 (1.3%) |
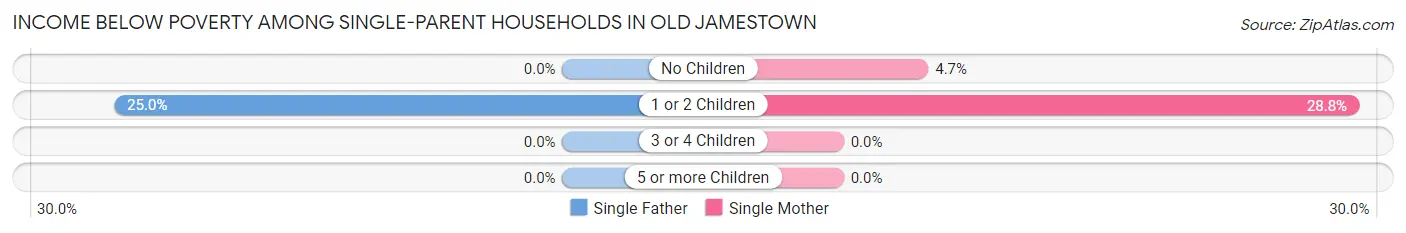
Income Below Poverty Among Single-Parent Households in Old Jamestown
According to the poverty data in Old Jamestown, 4.7% or 9 single-father households and 17.8% or 170 single-mother households are living below the poverty line. Among single-father households, those with 1 or 2 children have the highest poverty rate, with 9 households (25.0%) experiencing poverty. Likewise, among single-mother households, those with 1 or 2 children have the highest poverty rate, with 150 households (28.8%) falling below the poverty line.
| Children | Single Father | Single Mother |
| No Children | 0 (0.0%) | 20 (4.7%) |
| 1 or 2 Children | 9 (25.0%) | 150 (28.8%) |
| 3 or 4 Children | 0 (0.0%) | 0 (0.0%) |
| 5 or more Children | 0 (0.0%) | 0 (0.0%) |
| Total | 9 (4.7%) | 170 (17.8%) |
Income Below Poverty Among Married-Couple vs Single-Parent Households in Old Jamestown
The poverty data for Old Jamestown shows that 51 of the married-couple family households (1.3%) and 179 of the single-parent households (15.6%) are living below the poverty level. Within the married-couple family households, those with no children have the highest poverty rate, with 43 households (1.8%) falling below the poverty line. Among the single-parent households, those with 1 or 2 children have the highest poverty rate, with 159 household (28.5%) living below poverty.
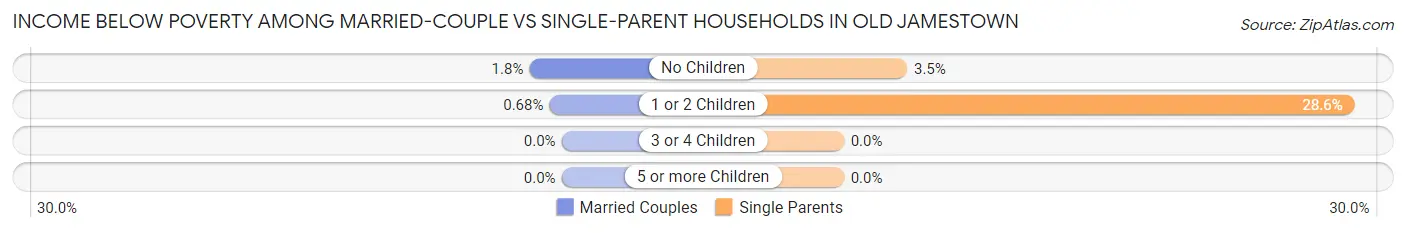
| Children | Married-Couple Families | Single-Parent Households |
| No Children | 43 (1.8%) | 20 (3.5%) |
| 1 or 2 Children | 8 (0.7%) | 159 (28.5%) |
| 3 or 4 Children | 0 (0.0%) | 0 (0.0%) |
| 5 or more Children | 0 (0.0%) | 0 (0.0%) |
| Total | 51 (1.3%) | 179 (15.6%) |
Employment Characteristics in Old Jamestown
Employment by Class of Employer in Old Jamestown
Among the 9,775 employed individuals in Old Jamestown, private company employees (6,008 | 61.5%), not-for-profit organizations (1,561 | 16.0%), and local government employees (661 | 6.8%) make up the most common classes of employment.
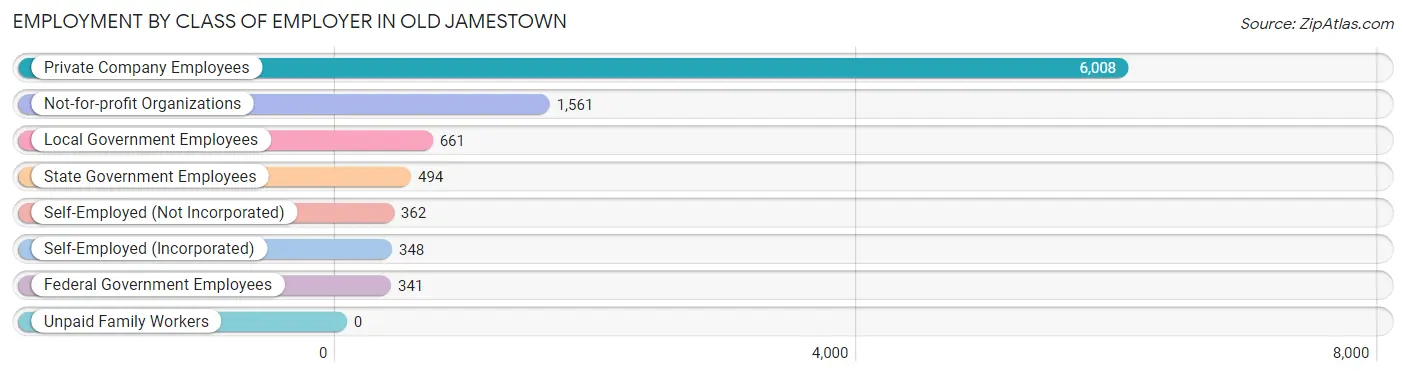
| Employer Class | # Employees | % Employees |
| Private Company Employees | 6,008 | 61.5% |
| Self-Employed (Incorporated) | 348 | 3.6% |
| Self-Employed (Not Incorporated) | 362 | 3.7% |
| Not-for-profit Organizations | 1,561 | 16.0% |
| Local Government Employees | 661 | 6.8% |
| State Government Employees | 494 | 5.1% |
| Federal Government Employees | 341 | 3.5% |
| Unpaid Family Workers | 0 | 0.0% |
| Total | 9,775 | 100.0% |
Employment Status by Age in Old Jamestown
According to the labor force statistics for Old Jamestown, out of the total population over 16 years of age (15,728), 65.4% or 10,286 individuals are in the labor force, with 4.3% or 442 of them unemployed. The age group with the highest labor force participation rate is 35 to 44 years, with 93.2% or 2,625 individuals in the labor force. Within the labor force, the 16 to 19 years age range has the highest percentage of unemployed individuals, with 16.4% or 62 of them being unemployed.
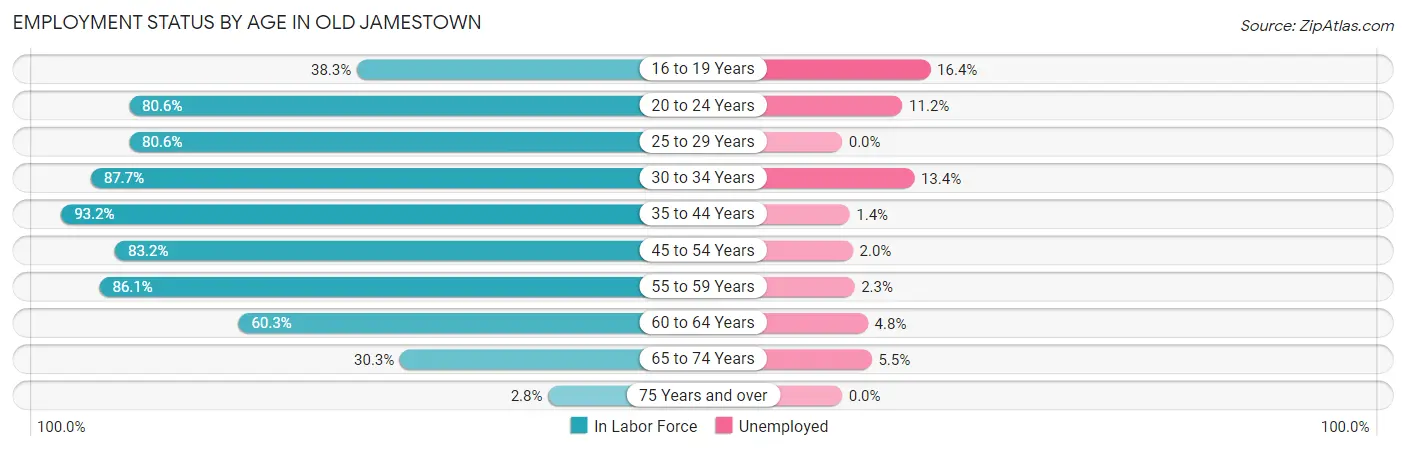
| Age Bracket | In Labor Force | Unemployed |
| 16 to 19 Years | 378 (38.3%) | 62 (16.4%) |
| 20 to 24 Years | 1,062 (80.6%) | 119 (11.2%) |
| 25 to 29 Years | 812 (80.6%) | 0 (0.0%) |
| 30 to 34 Years | 477 (87.7%) | 64 (13.4%) |
| 35 to 44 Years | 2,625 (93.2%) | 37 (1.4%) |
| 45 to 54 Years | 1,978 (83.2%) | 40 (2.0%) |
| 55 to 59 Years | 1,122 (86.1%) | 26 (2.3%) |
| 60 to 64 Years | 1,086 (60.3%) | 52 (4.8%) |
| 65 to 74 Years | 721 (30.3%) | 40 (5.5%) |
| 75 Years and over | 33 (2.8%) | 0 (0.0%) |
| Total | 10,286 (65.4%) | 442 (4.3%) |
Employment Status by Educational Attainment in Old Jamestown
According to labor force statistics for Old Jamestown, 82.2% of individuals (8,096) out of the total population between 25 and 64 years of age (9,849) are in the labor force, with 2.7% or 219 of them being unemployed. The group with the highest labor force participation rate are those with the educational attainment of bachelor's degree or higher, with 88.5% or 3,505 individuals in the labor force. Within the labor force, individuals with less than high school education have the highest percentage of unemployment, with 6.0% or 21 of them being unemployed.
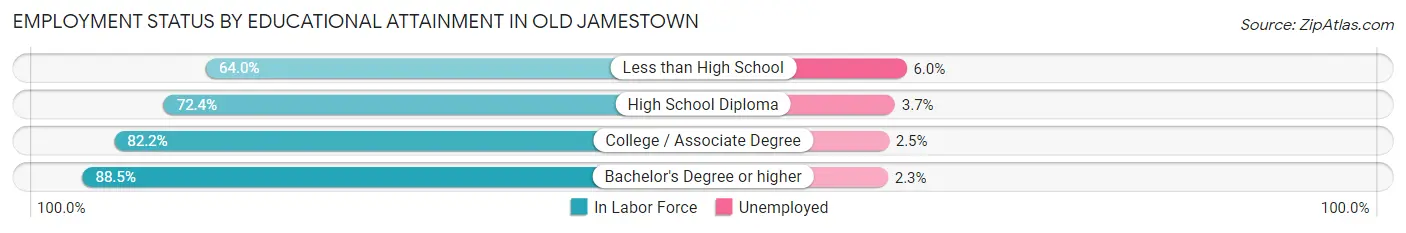
| Educational Attainment | In Labor Force | Unemployed |
| Less than High School | 352 (64.0%) | 33 (6.0%) |
| High School Diploma | 1,066 (72.4%) | 54 (3.7%) |
| College / Associate Degree | 3,179 (82.2%) | 97 (2.5%) |
| Bachelor's Degree or higher | 3,505 (88.5%) | 91 (2.3%) |
| Total | 8,096 (82.2%) | 266 (2.7%) |
Employment Occupations by Sex in Old Jamestown
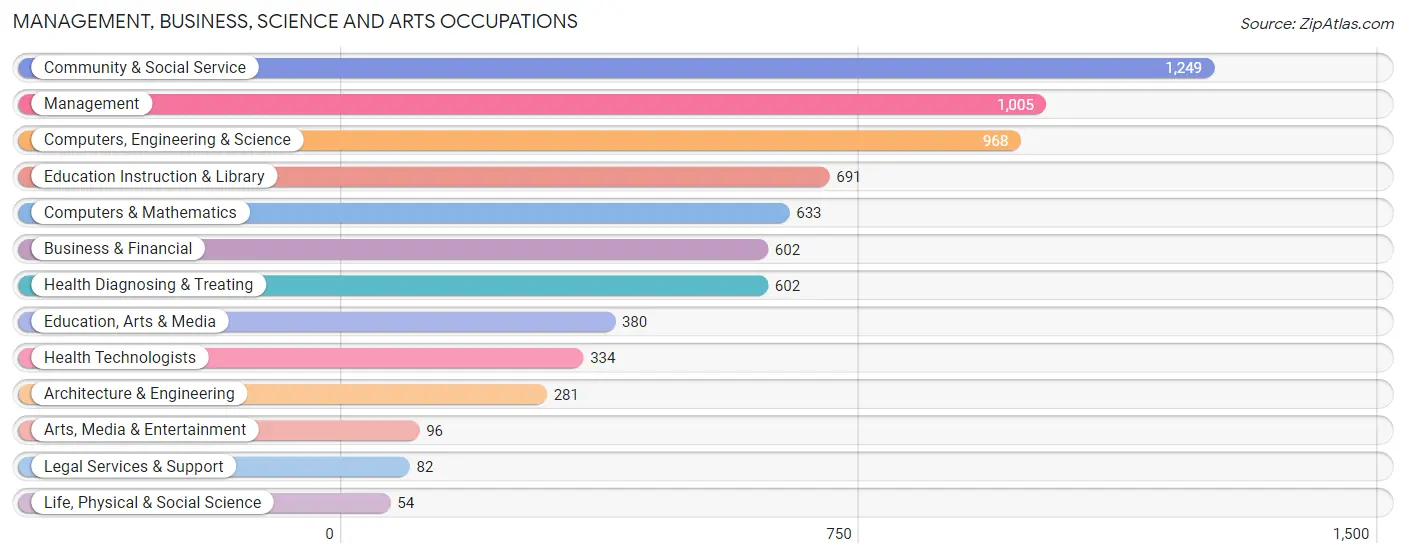
Management, Business, Science and Arts Occupations
The most common Management, Business, Science and Arts occupations in Old Jamestown are Community & Social Service (1,249 | 12.8%), Management (1,005 | 10.3%), Computers, Engineering & Science (968 | 9.9%), Education Instruction & Library (691 | 7.0%), and Computers & Mathematics (633 | 6.5%).
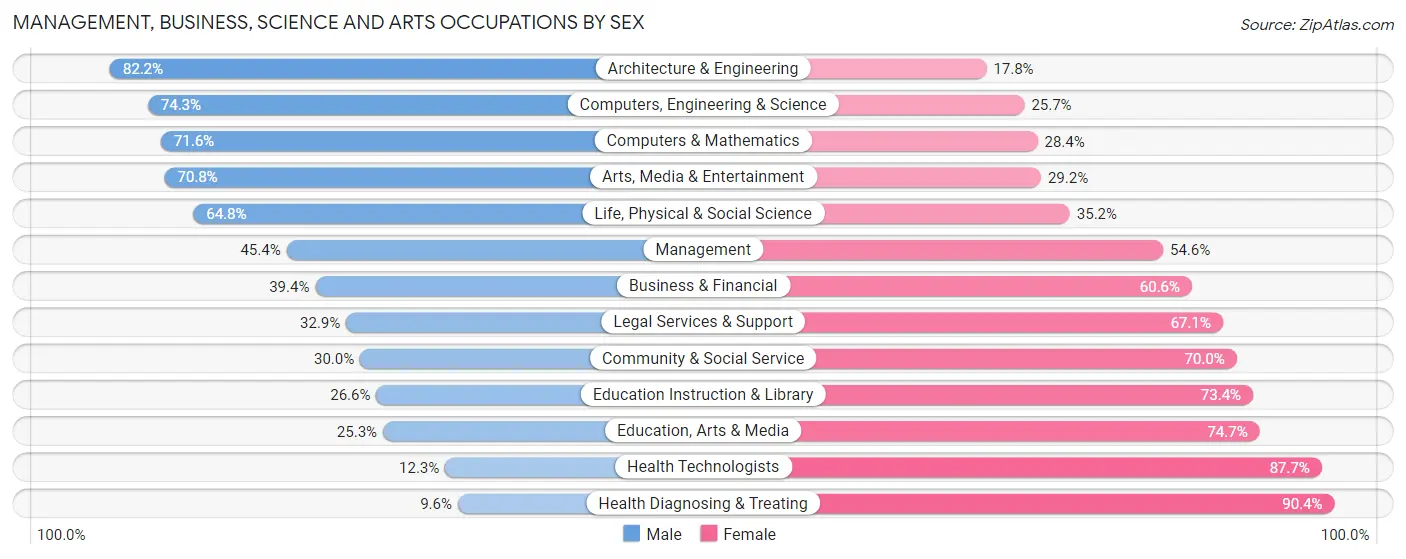
Management, Business, Science and Arts Occupations by Sex
Within the Management, Business, Science and Arts occupations in Old Jamestown, the most male-oriented occupations are Architecture & Engineering (82.2%), Computers, Engineering & Science (74.3%), and Computers & Mathematics (71.6%), while the most female-oriented occupations are Health Diagnosing & Treating (90.4%), Health Technologists (87.7%), and Education, Arts & Media (74.7%).
| Occupation | Male | Female |
| Management | 456 (45.4%) | 549 (54.6%) |
| Business & Financial | 237 (39.4%) | 365 (60.6%) |
| Computers, Engineering & Science | 719 (74.3%) | 249 (25.7%) |
| Computers & Mathematics | 453 (71.6%) | 180 (28.4%) |
| Architecture & Engineering | 231 (82.2%) | 50 (17.8%) |
| Life, Physical & Social Science | 35 (64.8%) | 19 (35.2%) |
| Community & Social Service | 375 (30.0%) | 874 (70.0%) |
| Education, Arts & Media | 96 (25.3%) | 284 (74.7%) |
| Legal Services & Support | 27 (32.9%) | 55 (67.1%) |
| Education Instruction & Library | 184 (26.6%) | 507 (73.4%) |
| Arts, Media & Entertainment | 68 (70.8%) | 28 (29.2%) |
| Health Diagnosing & Treating | 58 (9.6%) | 544 (90.4%) |
| Health Technologists | 41 (12.3%) | 293 (87.7%) |
| Total (Category) | 1,845 (41.7%) | 2,581 (58.3%) |
| Total (Overall) | 4,644 (47.4%) | 5,152 (52.6%) |
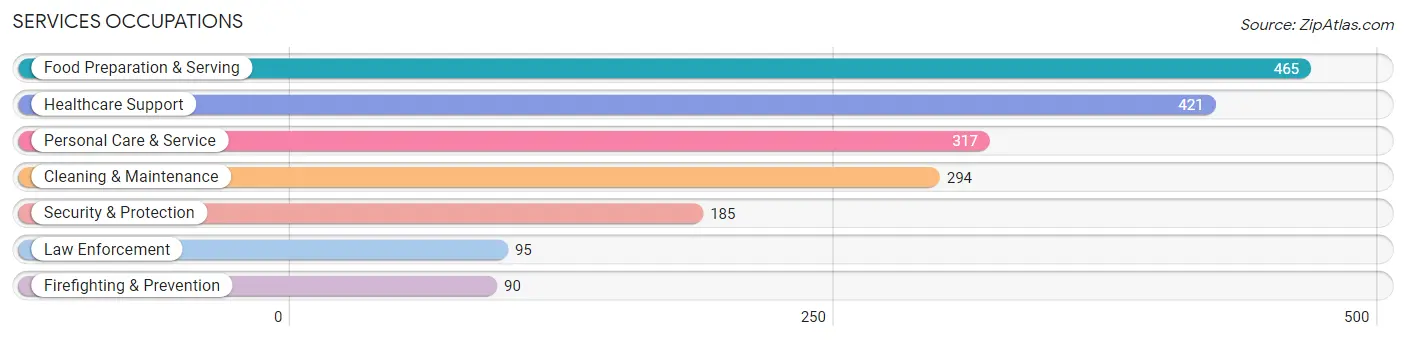
Services Occupations
The most common Services occupations in Old Jamestown are Food Preparation & Serving (465 | 4.8%), Healthcare Support (421 | 4.3%), Personal Care & Service (317 | 3.2%), Cleaning & Maintenance (294 | 3.0%), and Security & Protection (185 | 1.9%).
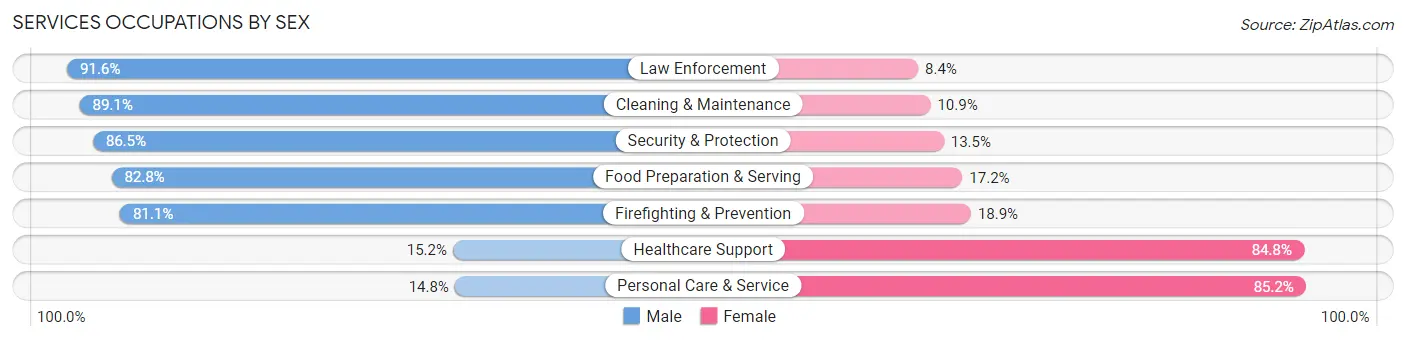
Services Occupations by Sex
Within the Services occupations in Old Jamestown, the most male-oriented occupations are Law Enforcement (91.6%), Cleaning & Maintenance (89.1%), and Security & Protection (86.5%), while the most female-oriented occupations are Personal Care & Service (85.2%), Healthcare Support (84.8%), and Firefighting & Prevention (18.9%).
| Occupation | Male | Female |
| Healthcare Support | 64 (15.2%) | 357 (84.8%) |
| Security & Protection | 160 (86.5%) | 25 (13.5%) |
| Firefighting & Prevention | 73 (81.1%) | 17 (18.9%) |
| Law Enforcement | 87 (91.6%) | 8 (8.4%) |
| Food Preparation & Serving | 385 (82.8%) | 80 (17.2%) |
| Cleaning & Maintenance | 262 (89.1%) | 32 (10.9%) |
| Personal Care & Service | 47 (14.8%) | 270 (85.2%) |
| Total (Category) | 918 (54.6%) | 764 (45.4%) |
| Total (Overall) | 4,644 (47.4%) | 5,152 (52.6%) |
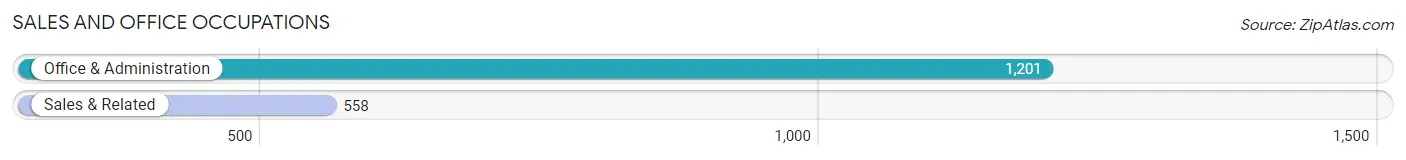
Sales and Office Occupations
The most common Sales and Office occupations in Old Jamestown are Office & Administration (1,201 | 12.3%), and Sales & Related (558 | 5.7%).
Sales and Office Occupations by Sex
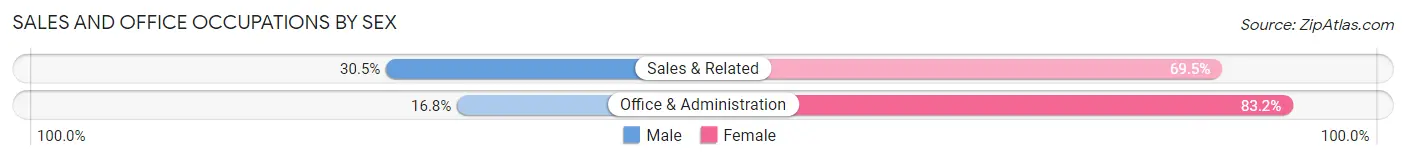
| Occupation | Male | Female |
| Sales & Related | 170 (30.5%) | 388 (69.5%) |
| Office & Administration | 202 (16.8%) | 999 (83.2%) |
| Total (Category) | 372 (21.1%) | 1,387 (78.8%) |
| Total (Overall) | 4,644 (47.4%) | 5,152 (52.6%) |
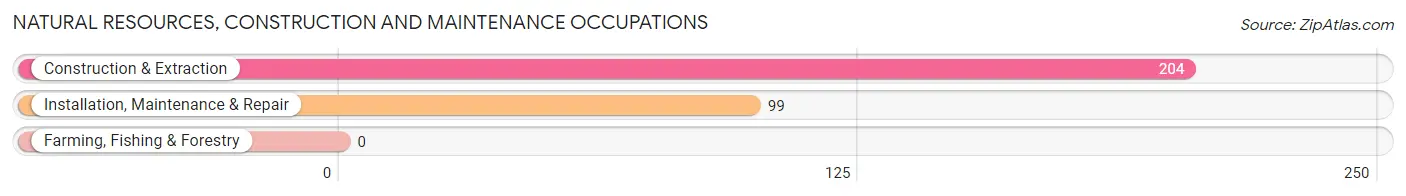
Natural Resources, Construction and Maintenance Occupations
The most common Natural Resources, Construction and Maintenance occupations in Old Jamestown are Construction & Extraction (204 | 2.1%), and Installation, Maintenance & Repair (99 | 1.0%).
Natural Resources, Construction and Maintenance Occupations by Sex
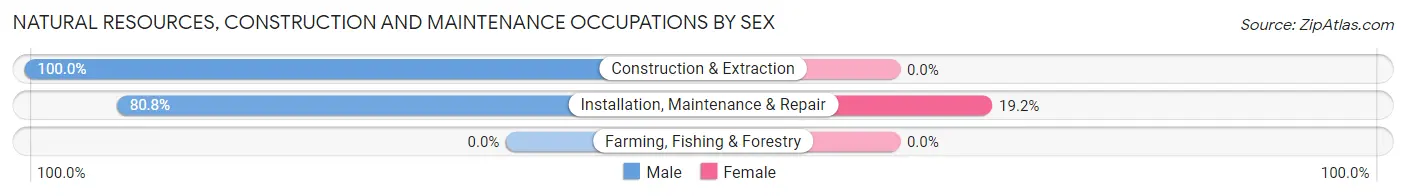
| Occupation | Male | Female |
| Farming, Fishing & Forestry | 0 (0.0%) | 0 (0.0%) |
| Construction & Extraction | 204 (100.0%) | 0 (0.0%) |
| Installation, Maintenance & Repair | 80 (80.8%) | 19 (19.2%) |
| Total (Category) | 284 (93.7%) | 19 (6.3%) |
| Total (Overall) | 4,644 (47.4%) | 5,152 (52.6%) |
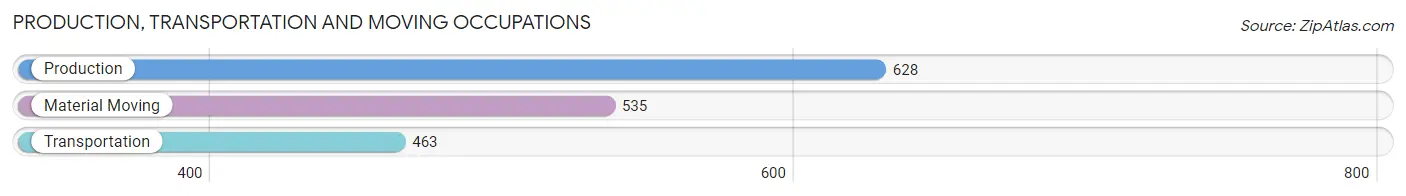
Production, Transportation and Moving Occupations
The most common Production, Transportation and Moving occupations in Old Jamestown are Production (628 | 6.4%), Material Moving (535 | 5.5%), and Transportation (463 | 4.7%).
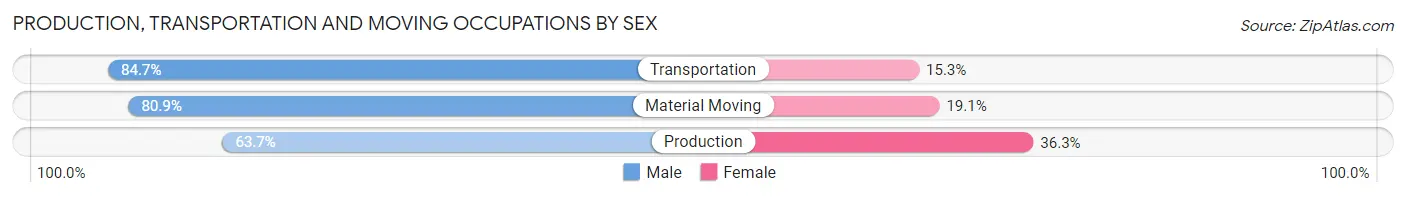
Production, Transportation and Moving Occupations by Sex
| Occupation | Male | Female |
| Production | 400 (63.7%) | 228 (36.3%) |
| Transportation | 392 (84.7%) | 71 (15.3%) |
| Material Moving | 433 (80.9%) | 102 (19.1%) |
| Total (Category) | 1,225 (75.3%) | 401 (24.7%) |
| Total (Overall) | 4,644 (47.4%) | 5,152 (52.6%) |
Employment Industries by Sex in Old Jamestown
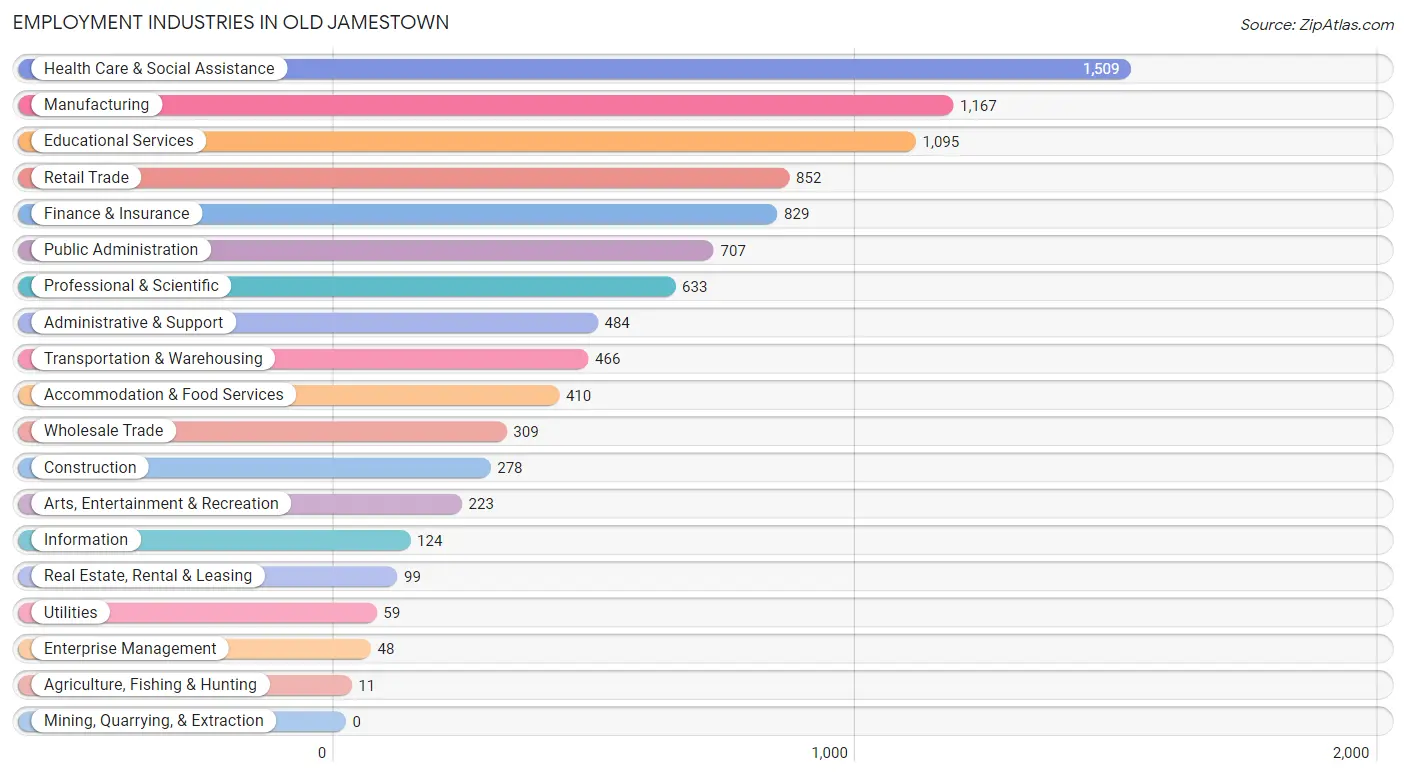
Employment Industries in Old Jamestown
The major employment industries in Old Jamestown include Health Care & Social Assistance (1,509 | 15.4%), Manufacturing (1,167 | 11.9%), Educational Services (1,095 | 11.2%), Retail Trade (852 | 8.7%), and Finance & Insurance (829 | 8.5%).
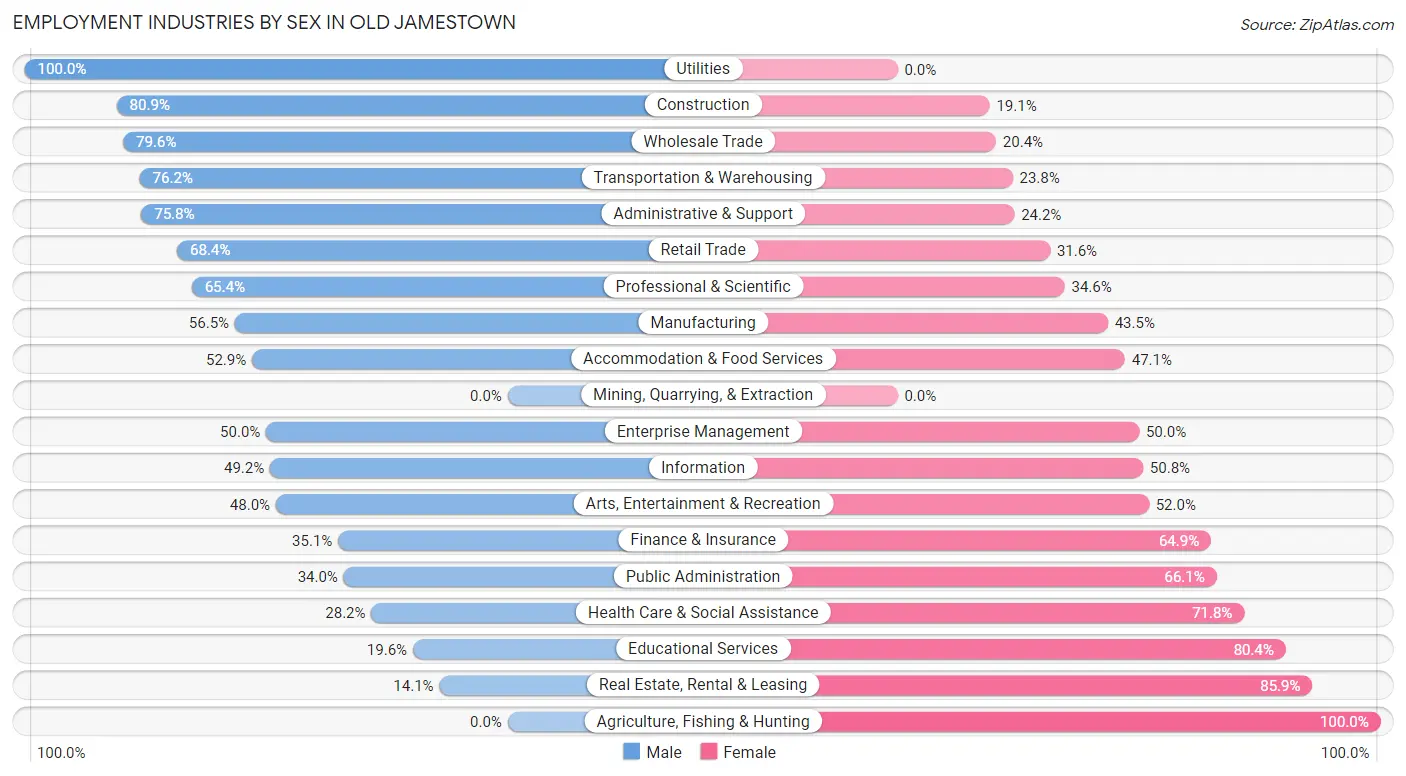
Employment Industries by Sex in Old Jamestown
The Old Jamestown industries that see more men than women are Utilities (100.0%), Construction (80.9%), and Wholesale Trade (79.6%), whereas the industries that tend to have a higher number of women are Agriculture, Fishing & Hunting (100.0%), Real Estate, Rental & Leasing (85.9%), and Educational Services (80.4%).
| Industry | Male | Female |
| Agriculture, Fishing & Hunting | 0 (0.0%) | 11 (100.0%) |
| Mining, Quarrying, & Extraction | 0 (0.0%) | 0 (0.0%) |
| Construction | 225 (80.9%) | 53 (19.1%) |
| Manufacturing | 659 (56.5%) | 508 (43.5%) |
| Wholesale Trade | 246 (79.6%) | 63 (20.4%) |
| Retail Trade | 583 (68.4%) | 269 (31.6%) |
| Transportation & Warehousing | 355 (76.2%) | 111 (23.8%) |
| Utilities | 59 (100.0%) | 0 (0.0%) |
| Information | 61 (49.2%) | 63 (50.8%) |
| Finance & Insurance | 291 (35.1%) | 538 (64.9%) |
| Real Estate, Rental & Leasing | 14 (14.1%) | 85 (85.9%) |
| Professional & Scientific | 414 (65.4%) | 219 (34.6%) |
| Enterprise Management | 24 (50.0%) | 24 (50.0%) |
| Administrative & Support | 367 (75.8%) | 117 (24.2%) |
| Educational Services | 215 (19.6%) | 880 (80.4%) |
| Health Care & Social Assistance | 426 (28.2%) | 1,083 (71.8%) |
| Arts, Entertainment & Recreation | 107 (48.0%) | 116 (52.0%) |
| Accommodation & Food Services | 217 (52.9%) | 193 (47.1%) |
| Public Administration | 240 (34.0%) | 467 (66.0%) |
| Total | 4,644 (47.4%) | 5,152 (52.6%) |
Education in Old Jamestown
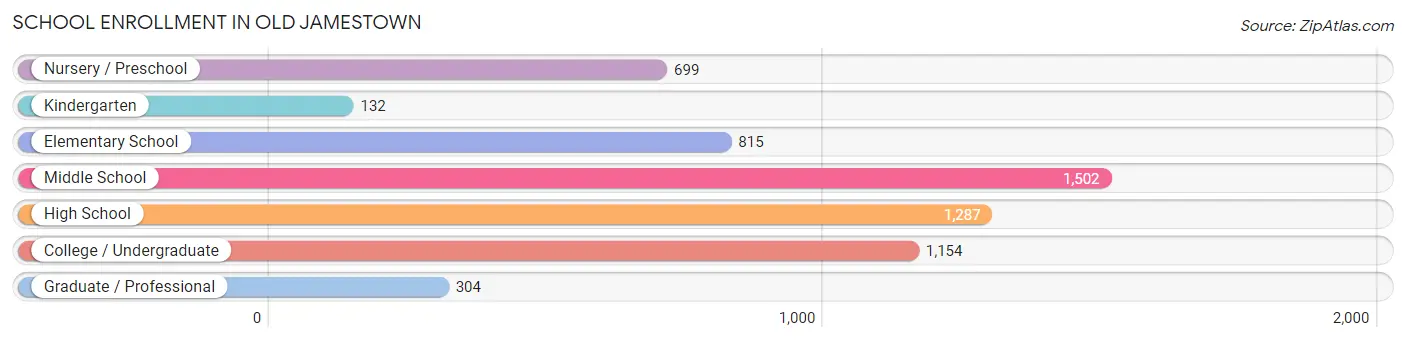
School Enrollment in Old Jamestown
The most common levels of schooling among the 5,893 students in Old Jamestown are middle school (1,502 | 25.5%), high school (1,287 | 21.8%), and college / undergraduate (1,154 | 19.6%).
| School Level | # Students | % Students |
| Nursery / Preschool | 699 | 11.9% |
| Kindergarten | 132 | 2.2% |
| Elementary School | 815 | 13.8% |
| Middle School | 1,502 | 25.5% |
| High School | 1,287 | 21.8% |
| College / Undergraduate | 1,154 | 19.6% |
| Graduate / Professional | 304 | 5.2% |
| Total | 5,893 | 100.0% |
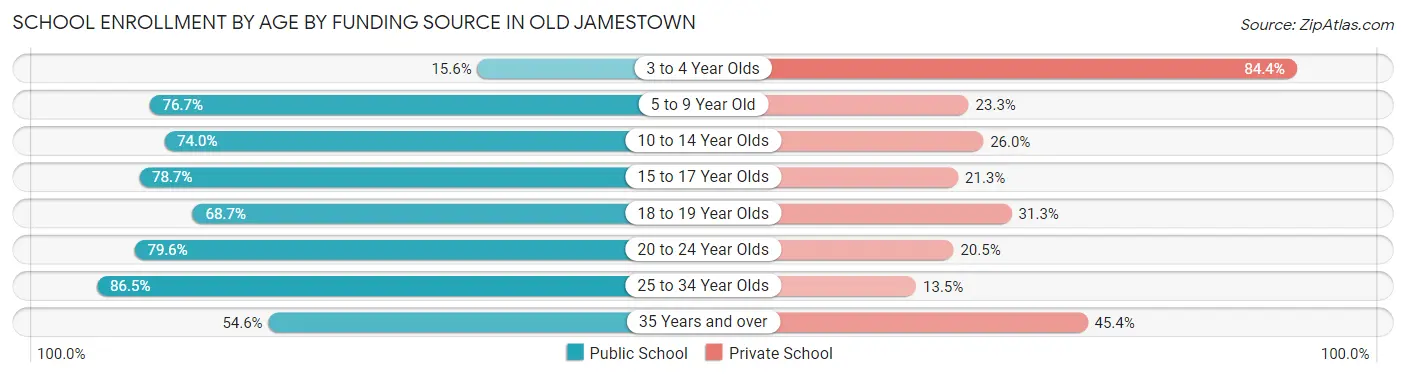
School Enrollment by Age by Funding Source in Old Jamestown
Out of a total of 5,893 students who are enrolled in schools in Old Jamestown, 1,856 (31.5%) attend a private institution, while the remaining 4,037 (68.5%) are enrolled in public schools. The age group of 3 to 4 year olds has the highest likelihood of being enrolled in private schools, with 577 (84.4% in the age bracket) enrolled. Conversely, the age group of 25 to 34 year olds has the lowest likelihood of being enrolled in a private school, with 340 (86.5% in the age bracket) attending a public institution.
| Age Bracket | Public School | Private School |
| 3 to 4 Year Olds | 107 (15.6%) | 577 (84.4%) |
| 5 to 9 Year Old | 557 (76.7%) | 169 (23.3%) |
| 10 to 14 Year Olds | 1,418 (74.0%) | 498 (26.0%) |
| 15 to 17 Year Olds | 694 (78.7%) | 188 (21.3%) |
| 18 to 19 Year Olds | 292 (68.7%) | 133 (31.3%) |
| 20 to 24 Year Olds | 490 (79.5%) | 126 (20.4%) |
| 25 to 34 Year Olds | 340 (86.5%) | 53 (13.5%) |
| 35 Years and over | 137 (54.6%) | 114 (45.4%) |
| Total | 4,037 (68.5%) | 1,856 (31.5%) |
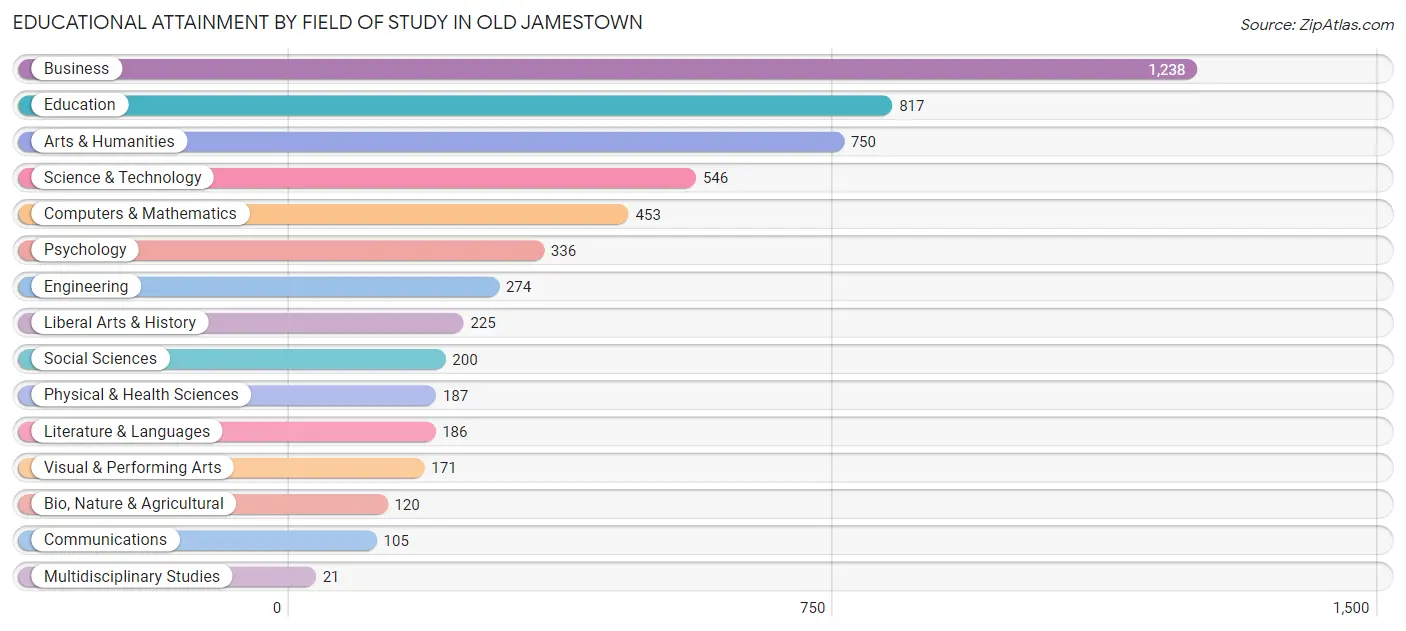
Educational Attainment by Field of Study in Old Jamestown
Business (1,238 | 22.0%), education (817 | 14.5%), arts & humanities (750 | 13.3%), science & technology (546 | 9.7%), and computers & mathematics (453 | 8.1%) are the most common fields of study among 5,629 individuals in Old Jamestown who have obtained a bachelor's degree or higher.
| Field of Study | # Graduates | % Graduates |
| Computers & Mathematics | 453 | 8.1% |
| Bio, Nature & Agricultural | 120 | 2.1% |
| Physical & Health Sciences | 187 | 3.3% |
| Psychology | 336 | 6.0% |
| Social Sciences | 200 | 3.5% |
| Engineering | 274 | 4.9% |
| Multidisciplinary Studies | 21 | 0.4% |
| Science & Technology | 546 | 9.7% |
| Business | 1,238 | 22.0% |
| Education | 817 | 14.5% |
| Literature & Languages | 186 | 3.3% |
| Liberal Arts & History | 225 | 4.0% |
| Visual & Performing Arts | 171 | 3.0% |
| Communications | 105 | 1.9% |
| Arts & Humanities | 750 | 13.3% |
| Total | 5,629 | 100.0% |
Transportation & Commute in Old Jamestown
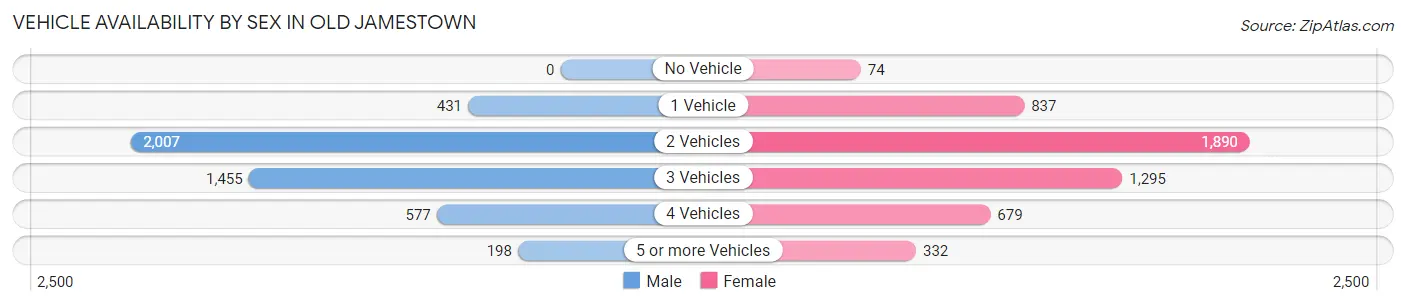
Vehicle Availability by Sex in Old Jamestown
The most prevalent vehicle ownership categories in Old Jamestown are males with 2 vehicles (2,007, accounting for 43.0%) and females with 2 vehicles (1,890, making up 39.3%).
| Vehicles Available | Male | Female |
| No Vehicle | 0 (0.0%) | 74 (1.5%) |
| 1 Vehicle | 431 (9.2%) | 837 (16.4%) |
| 2 Vehicles | 2,007 (43.0%) | 1,890 (37.0%) |
| 3 Vehicles | 1,455 (31.2%) | 1,295 (25.4%) |
| 4 Vehicles | 577 (12.4%) | 679 (13.3%) |
| 5 or more Vehicles | 198 (4.2%) | 332 (6.5%) |
| Total | 4,668 (100.0%) | 5,107 (100.0%) |
Commute Time in Old Jamestown
The most frequently occuring commute durations in Old Jamestown are 30 to 34 minutes (1,740 commuters, 21.2%), 20 to 24 minutes (1,296 commuters, 15.8%), and 25 to 29 minutes (1,016 commuters, 12.4%).
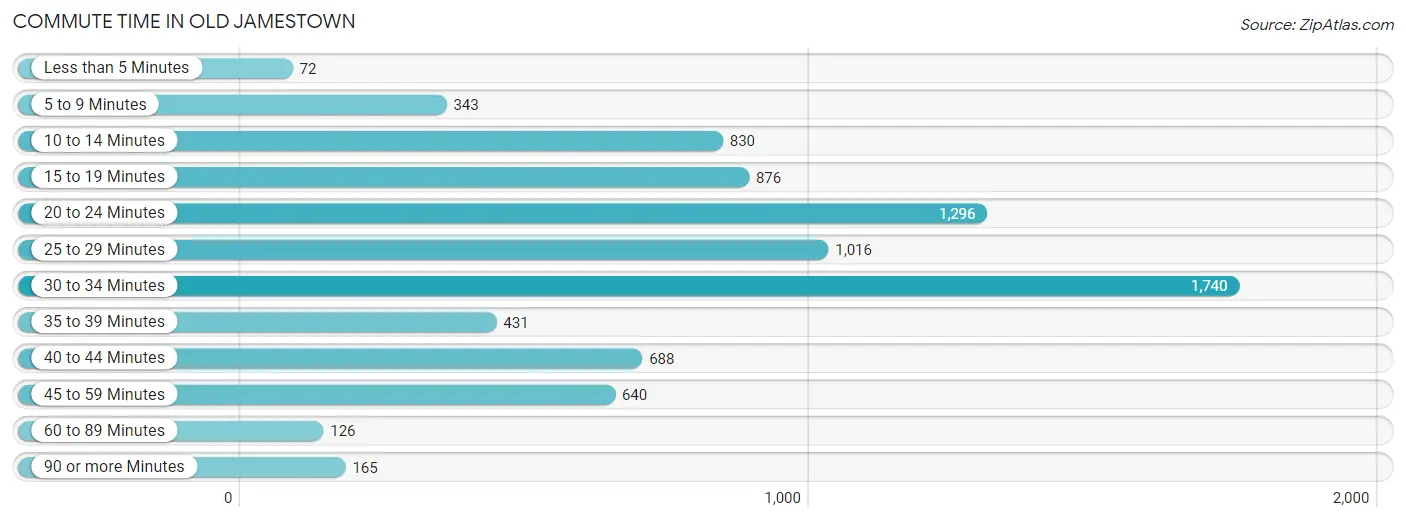
| Commute Time | # Commuters | % Commuters |
| Less than 5 Minutes | 72 | 0.9% |
| 5 to 9 Minutes | 343 | 4.2% |
| 10 to 14 Minutes | 830 | 10.1% |
| 15 to 19 Minutes | 876 | 10.6% |
| 20 to 24 Minutes | 1,296 | 15.8% |
| 25 to 29 Minutes | 1,016 | 12.4% |
| 30 to 34 Minutes | 1,740 | 21.2% |
| 35 to 39 Minutes | 431 | 5.2% |
| 40 to 44 Minutes | 688 | 8.4% |
| 45 to 59 Minutes | 640 | 7.8% |
| 60 to 89 Minutes | 126 | 1.5% |
| 90 or more Minutes | 165 | 2.0% |
Commute Time by Sex in Old Jamestown
The most common commute times in Old Jamestown are 30 to 34 minutes (866 commuters, 21.2%) for males and 30 to 34 minutes (874 commuters, 21.1%) for females.
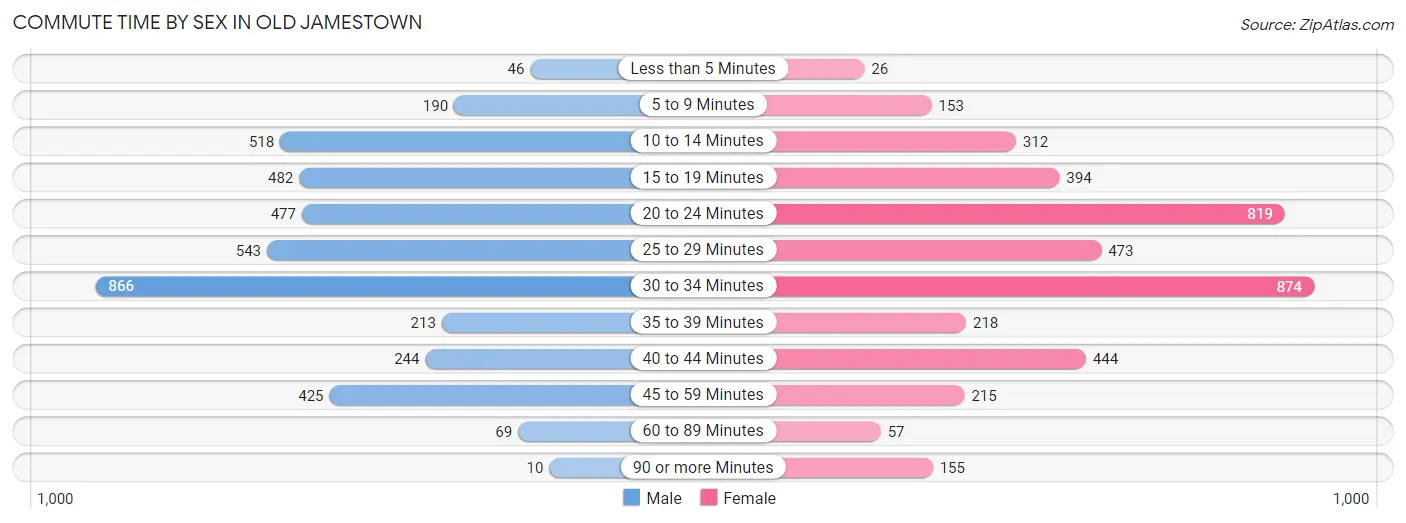
| Commute Time | Male | Female |
| Less than 5 Minutes | 46 (1.1%) | 26 (0.6%) |
| 5 to 9 Minutes | 190 (4.6%) | 153 (3.7%) |
| 10 to 14 Minutes | 518 (12.7%) | 312 (7.5%) |
| 15 to 19 Minutes | 482 (11.8%) | 394 (9.5%) |
| 20 to 24 Minutes | 477 (11.7%) | 819 (19.8%) |
| 25 to 29 Minutes | 543 (13.3%) | 473 (11.4%) |
| 30 to 34 Minutes | 866 (21.2%) | 874 (21.1%) |
| 35 to 39 Minutes | 213 (5.2%) | 218 (5.3%) |
| 40 to 44 Minutes | 244 (6.0%) | 444 (10.7%) |
| 45 to 59 Minutes | 425 (10.4%) | 215 (5.2%) |
| 60 to 89 Minutes | 69 (1.7%) | 57 (1.4%) |
| 90 or more Minutes | 10 (0.2%) | 155 (3.7%) |
Time of Departure to Work by Sex in Old Jamestown
The most frequent times of departure to work in Old Jamestown are 7:00 AM to 7:29 AM (708, 17.3%) for males and 7:30 AM to 7:59 AM (699, 16.9%) for females.
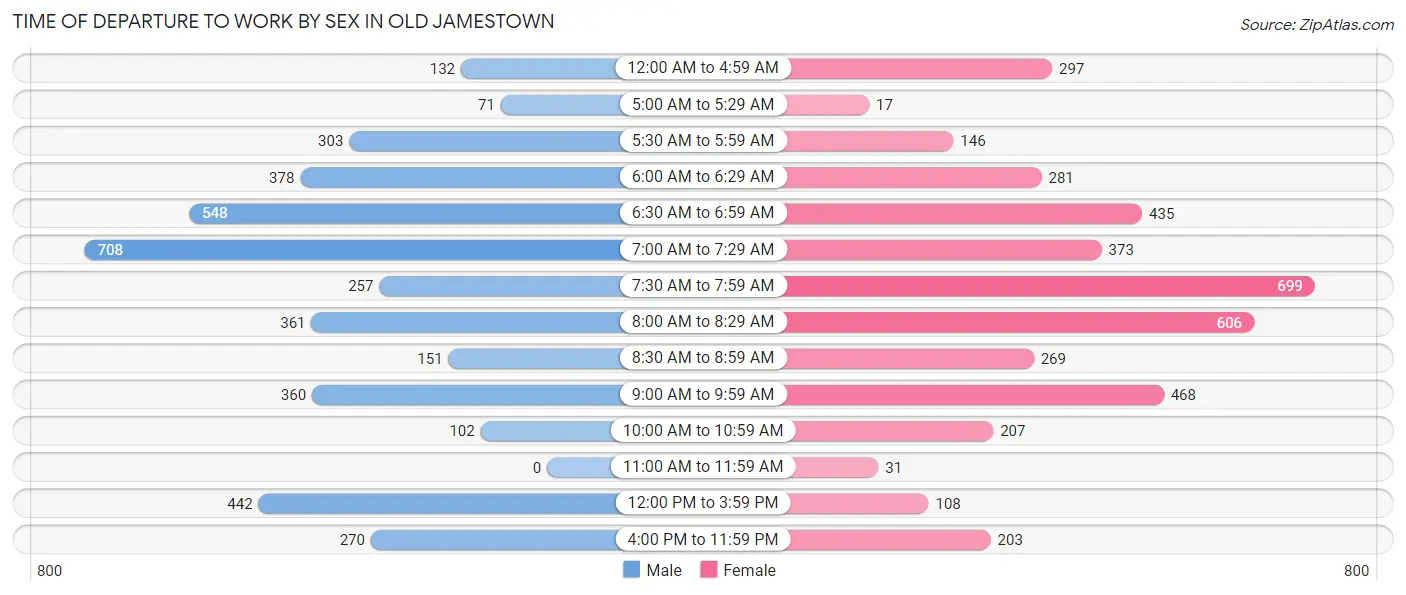
| Time of Departure | Male | Female |
| 12:00 AM to 4:59 AM | 132 (3.2%) | 297 (7.2%) |
| 5:00 AM to 5:29 AM | 71 (1.7%) | 17 (0.4%) |
| 5:30 AM to 5:59 AM | 303 (7.4%) | 146 (3.5%) |
| 6:00 AM to 6:29 AM | 378 (9.3%) | 281 (6.8%) |
| 6:30 AM to 6:59 AM | 548 (13.4%) | 435 (10.5%) |
| 7:00 AM to 7:29 AM | 708 (17.3%) | 373 (9.0%) |
| 7:30 AM to 7:59 AM | 257 (6.3%) | 699 (16.9%) |
| 8:00 AM to 8:29 AM | 361 (8.8%) | 606 (14.6%) |
| 8:30 AM to 8:59 AM | 151 (3.7%) | 269 (6.5%) |
| 9:00 AM to 9:59 AM | 360 (8.8%) | 468 (11.3%) |
| 10:00 AM to 10:59 AM | 102 (2.5%) | 207 (5.0%) |
| 11:00 AM to 11:59 AM | 0 (0.0%) | 31 (0.7%) |
| 12:00 PM to 3:59 PM | 442 (10.8%) | 108 (2.6%) |
| 4:00 PM to 11:59 PM | 270 (6.6%) | 203 (4.9%) |
| Total | 4,083 (100.0%) | 4,140 (100.0%) |
Housing Occupancy in Old Jamestown
Occupancy by Ownership in Old Jamestown
Of the total 6,789 dwellings in Old Jamestown, owner-occupied units account for 6,051 (89.1%), while renter-occupied units make up 738 (10.9%).
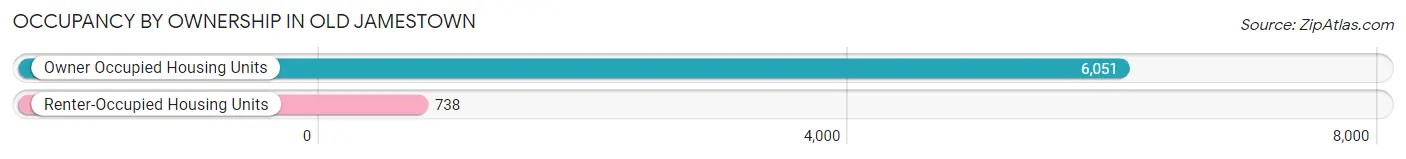
| Occupancy | # Housing Units | % Housing Units |
| Owner Occupied Housing Units | 6,051 | 89.1% |
| Renter-Occupied Housing Units | 738 | 10.9% |
| Total Occupied Housing Units | 6,789 | 100.0% |
Occupancy by Household Size in Old Jamestown
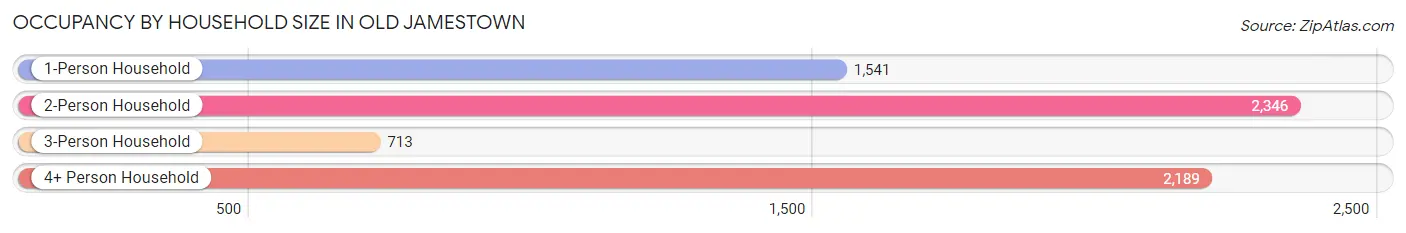
| Household Size | # Housing Units | % Housing Units |
| 1-Person Household | 1,541 | 22.7% |
| 2-Person Household | 2,346 | 34.6% |
| 3-Person Household | 713 | 10.5% |
| 4+ Person Household | 2,189 | 32.2% |
| Total Housing Units | 6,789 | 100.0% |
Occupancy by Ownership by Household Size in Old Jamestown
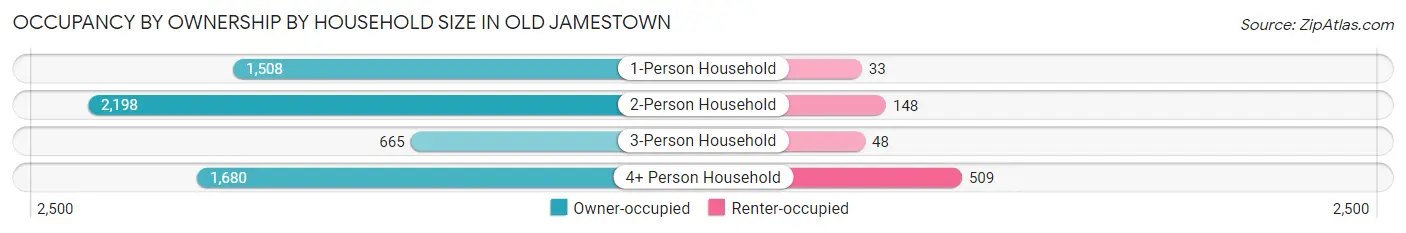
| Household Size | Owner-occupied | Renter-occupied |
| 1-Person Household | 1,508 (97.9%) | 33 (2.1%) |
| 2-Person Household | 2,198 (93.7%) | 148 (6.3%) |
| 3-Person Household | 665 (93.3%) | 48 (6.7%) |
| 4+ Person Household | 1,680 (76.7%) | 509 (23.3%) |
| Total Housing Units | 6,051 (89.1%) | 738 (10.9%) |
Occupancy by Educational Attainment in Old Jamestown
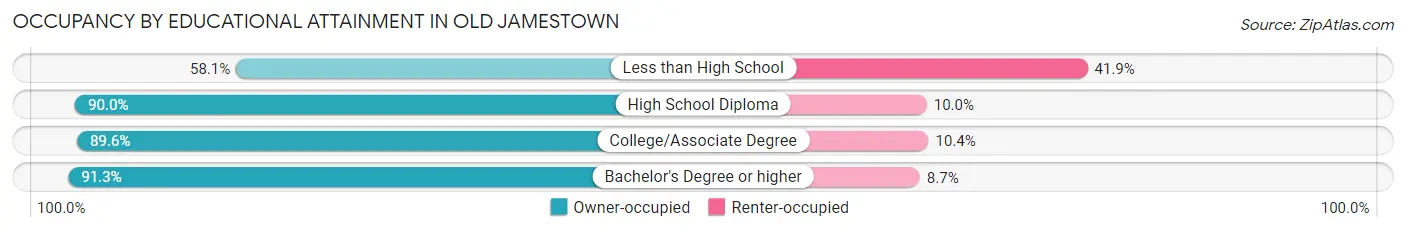
| Household Size | Owner-occupied | Renter-occupied |
| Less than High School | 169 (58.1%) | 122 (41.9%) |
| High School Diploma | 1,058 (90.0%) | 118 (10.0%) |
| College/Associate Degree | 1,907 (89.6%) | 221 (10.4%) |
| Bachelor's Degree or higher | 2,917 (91.3%) | 277 (8.7%) |
Occupancy by Age of Householder in Old Jamestown
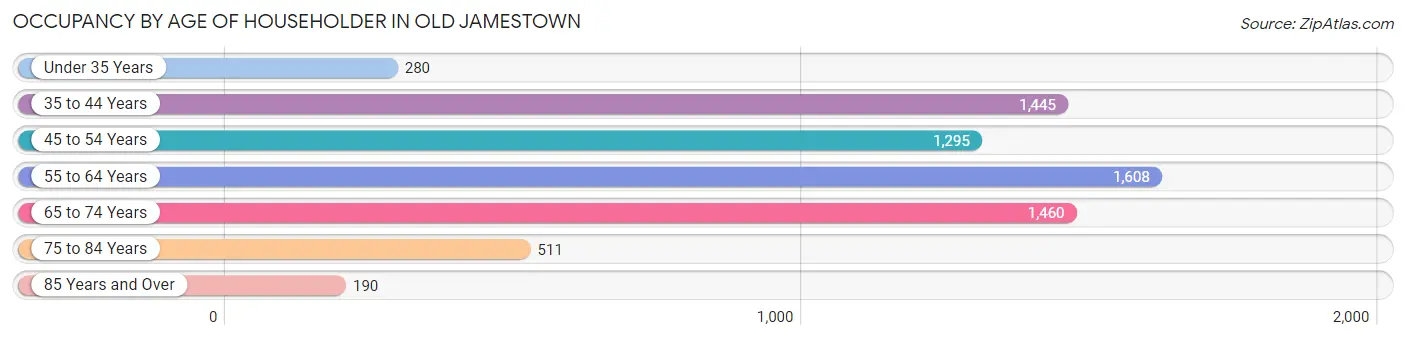
| Age Bracket | # Households | % Households |
| Under 35 Years | 280 | 4.1% |
| 35 to 44 Years | 1,445 | 21.3% |
| 45 to 54 Years | 1,295 | 19.1% |
| 55 to 64 Years | 1,608 | 23.7% |
| 65 to 74 Years | 1,460 | 21.5% |
| 75 to 84 Years | 511 | 7.5% |
| 85 Years and Over | 190 | 2.8% |
| Total | 6,789 | 100.0% |
Housing Finances in Old Jamestown
Median Income by Occupancy in Old Jamestown
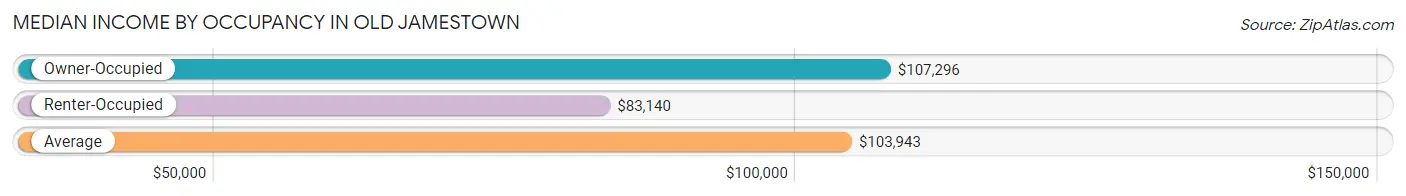
| Occupancy Type | # Households | Median Income |
| Owner-Occupied | 6,051 (89.1%) | $107,296 |
| Renter-Occupied | 738 (10.9%) | $83,140 |
| Average | 6,789 (100.0%) | $103,943 |
Occupancy by Householder Income Bracket in Old Jamestown
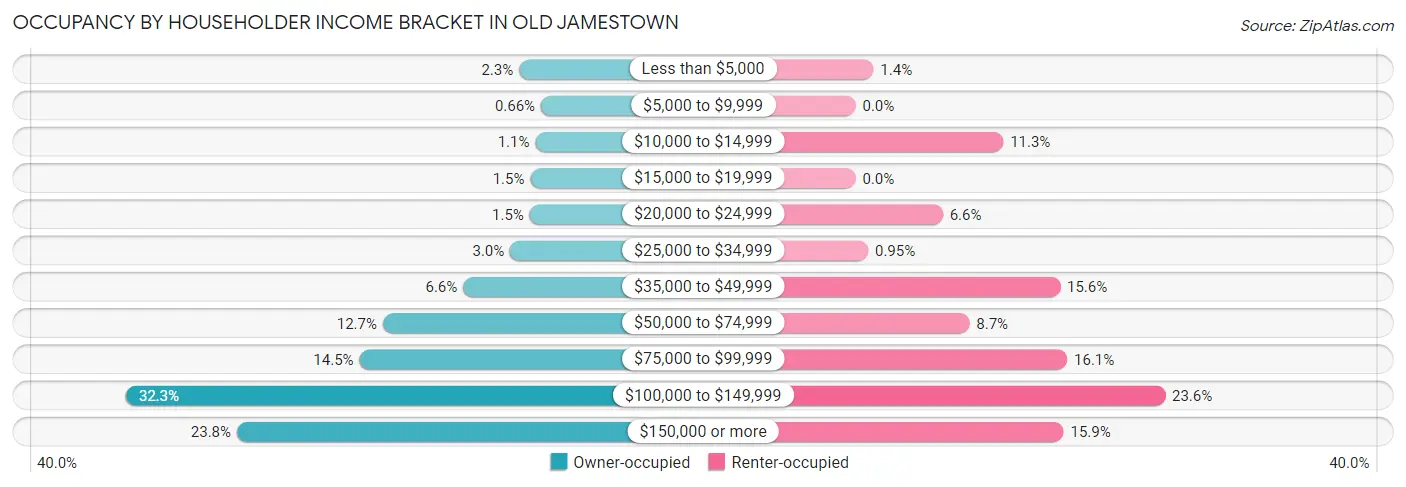
| Income Bracket | Owner-occupied | Renter-occupied |
| Less than $5,000 | 141 (2.3%) | 10 (1.4%) |
| $5,000 to $9,999 | 40 (0.7%) | 0 (0.0%) |
| $10,000 to $14,999 | 66 (1.1%) | 83 (11.3%) |
| $15,000 to $19,999 | 89 (1.5%) | 0 (0.0%) |
| $20,000 to $24,999 | 92 (1.5%) | 49 (6.6%) |
| $25,000 to $34,999 | 182 (3.0%) | 7 (0.9%) |
| $35,000 to $49,999 | 399 (6.6%) | 115 (15.6%) |
| $50,000 to $74,999 | 769 (12.7%) | 64 (8.7%) |
| $75,000 to $99,999 | 877 (14.5%) | 119 (16.1%) |
| $100,000 to $149,999 | 1,954 (32.3%) | 174 (23.6%) |
| $150,000 or more | 1,442 (23.8%) | 117 (15.9%) |
| Total | 6,051 (100.0%) | 738 (100.0%) |
Monthly Housing Cost Tiers in Old Jamestown
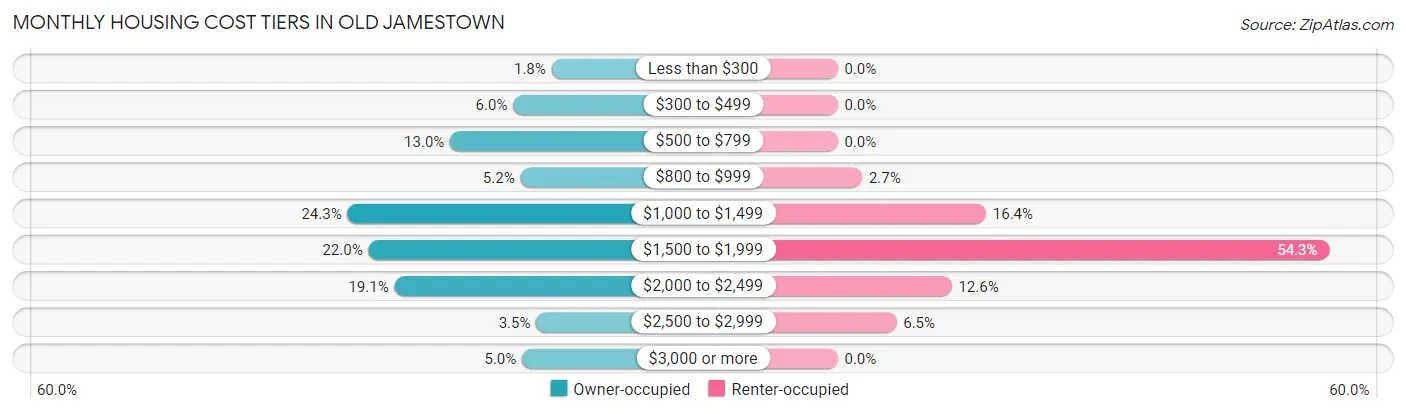
| Monthly Cost | Owner-occupied | Renter-occupied |
| Less than $300 | 108 (1.8%) | 0 (0.0%) |
| $300 to $499 | 364 (6.0%) | 0 (0.0%) |
| $500 to $799 | 786 (13.0%) | 0 (0.0%) |
| $800 to $999 | 316 (5.2%) | 20 (2.7%) |
| $1,000 to $1,499 | 1,472 (24.3%) | 121 (16.4%) |
| $1,500 to $1,999 | 1,332 (22.0%) | 401 (54.3%) |
| $2,000 to $2,499 | 1,158 (19.1%) | 93 (12.6%) |
| $2,500 to $2,999 | 210 (3.5%) | 48 (6.5%) |
| $3,000 or more | 305 (5.0%) | 0 (0.0%) |
| Total | 6,051 (100.0%) | 738 (100.0%) |
Physical Housing Characteristics in Old Jamestown
Housing Structures in Old Jamestown
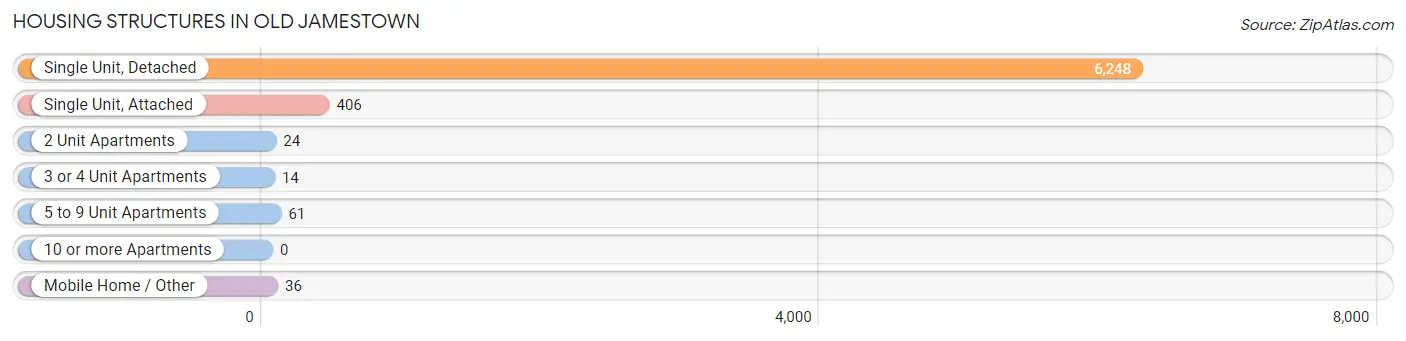
| Structure Type | # Housing Units | % Housing Units |
| Single Unit, Detached | 6,248 | 92.0% |
| Single Unit, Attached | 406 | 6.0% |
| 2 Unit Apartments | 24 | 0.4% |
| 3 or 4 Unit Apartments | 14 | 0.2% |
| 5 to 9 Unit Apartments | 61 | 0.9% |
| 10 or more Apartments | 0 | 0.0% |
| Mobile Home / Other | 36 | 0.5% |
| Total | 6,789 | 100.0% |
Housing Structures by Occupancy in Old Jamestown
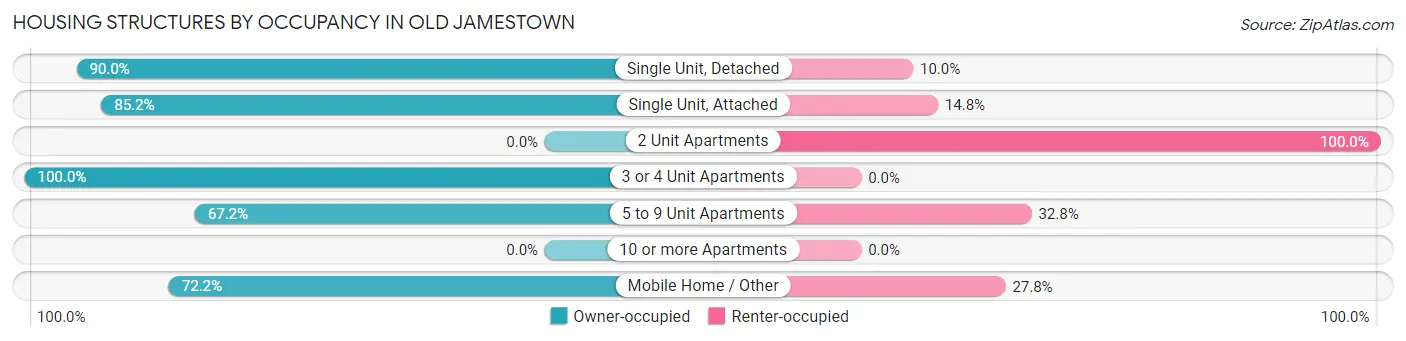
| Structure Type | Owner-occupied | Renter-occupied |
| Single Unit, Detached | 5,624 (90.0%) | 624 (10.0%) |
| Single Unit, Attached | 346 (85.2%) | 60 (14.8%) |
| 2 Unit Apartments | 0 (0.0%) | 24 (100.0%) |
| 3 or 4 Unit Apartments | 14 (100.0%) | 0 (0.0%) |
| 5 to 9 Unit Apartments | 41 (67.2%) | 20 (32.8%) |
| 10 or more Apartments | 0 (0.0%) | 0 (0.0%) |
| Mobile Home / Other | 26 (72.2%) | 10 (27.8%) |
| Total | 6,051 (89.1%) | 738 (10.9%) |
Housing Structures by Number of Rooms in Old Jamestown
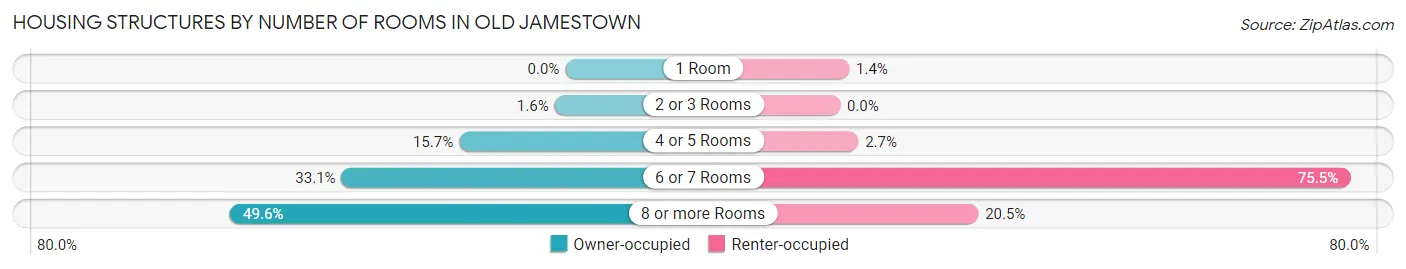
| Number of Rooms | Owner-occupied | Renter-occupied |
| 1 Room | 0 (0.0%) | 10 (1.4%) |
| 2 or 3 Rooms | 96 (1.6%) | 0 (0.0%) |
| 4 or 5 Rooms | 951 (15.7%) | 20 (2.7%) |
| 6 or 7 Rooms | 2,004 (33.1%) | 557 (75.5%) |
| 8 or more Rooms | 3,000 (49.6%) | 151 (20.5%) |
| Total | 6,051 (100.0%) | 738 (100.0%) |
Housing Structure by Heating Type in Old Jamestown
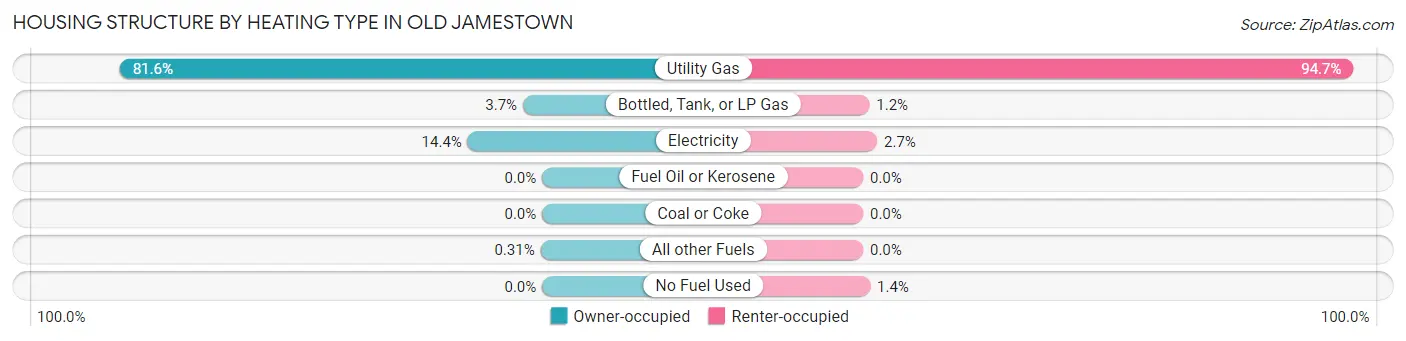
| Heating Type | Owner-occupied | Renter-occupied |
| Utility Gas | 4,938 (81.6%) | 699 (94.7%) |
| Bottled, Tank, or LP Gas | 224 (3.7%) | 9 (1.2%) |
| Electricity | 870 (14.4%) | 20 (2.7%) |
| Fuel Oil or Kerosene | 0 (0.0%) | 0 (0.0%) |
| Coal or Coke | 0 (0.0%) | 0 (0.0%) |
| All other Fuels | 19 (0.3%) | 0 (0.0%) |
| No Fuel Used | 0 (0.0%) | 10 (1.4%) |
| Total | 6,051 (100.0%) | 738 (100.0%) |
Household Vehicle Usage in Old Jamestown
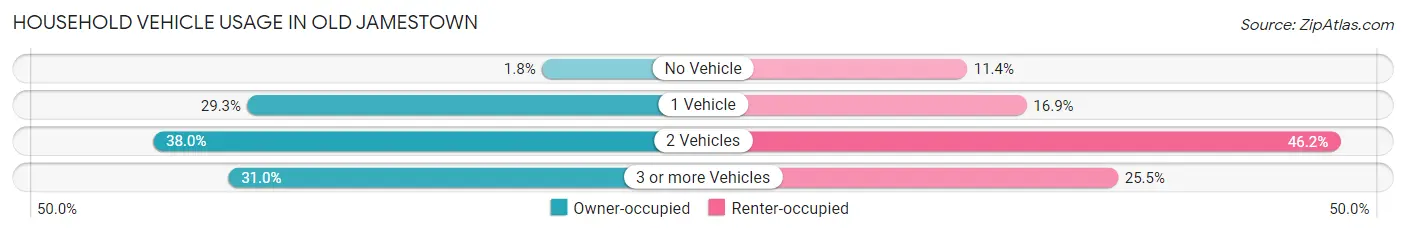
| Vehicles per Household | Owner-occupied | Renter-occupied |
| No Vehicle | 106 (1.8%) | 84 (11.4%) |
| 1 Vehicle | 1,770 (29.2%) | 125 (16.9%) |
| 2 Vehicles | 2,300 (38.0%) | 341 (46.2%) |
| 3 or more Vehicles | 1,875 (31.0%) | 188 (25.5%) |
| Total | 6,051 (100.0%) | 738 (100.0%) |
Real Estate & Mortgages in Old Jamestown
Real Estate and Mortgage Overview in Old Jamestown
| Characteristic | Without Mortgage | With Mortgage |
| Housing Units | 1,566 | 4,485 |
| Median Property Value | $198,600 | $220,200 |
| Median Household Income | $75,000 | $1,084 |
| Monthly Housing Costs | $658 | $305 |
| Real Estate Taxes | $2,854 | $7 |
Property Value by Mortgage Status in Old Jamestown
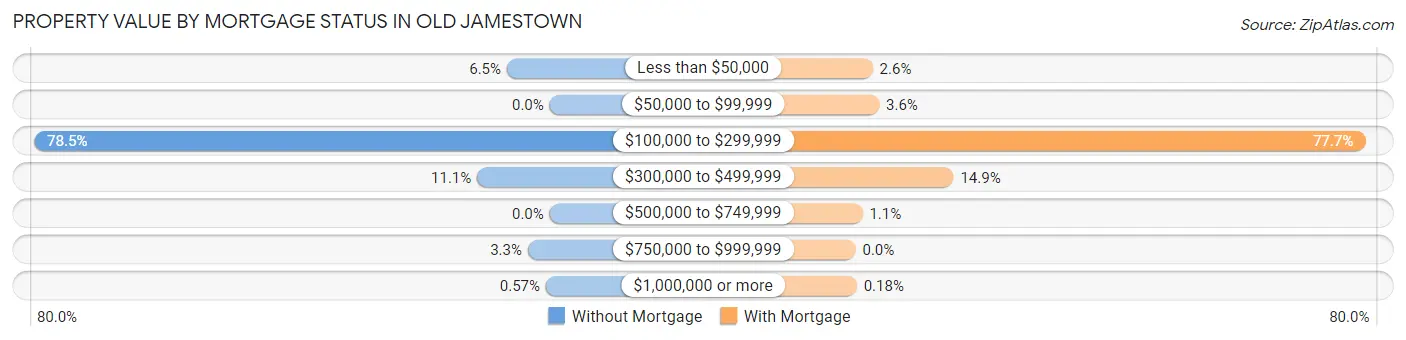
| Property Value | Without Mortgage | With Mortgage |
| Less than $50,000 | 102 (6.5%) | 117 (2.6%) |
| $50,000 to $99,999 | 0 (0.0%) | 161 (3.6%) |
| $100,000 to $299,999 | 1,230 (78.5%) | 3,483 (77.7%) |
| $300,000 to $499,999 | 173 (11.1%) | 669 (14.9%) |
| $500,000 to $749,999 | 0 (0.0%) | 47 (1.1%) |
| $750,000 to $999,999 | 52 (3.3%) | 0 (0.0%) |
| $1,000,000 or more | 9 (0.6%) | 8 (0.2%) |
| Total | 1,566 (100.0%) | 4,485 (100.0%) |
Household Income by Mortgage Status in Old Jamestown
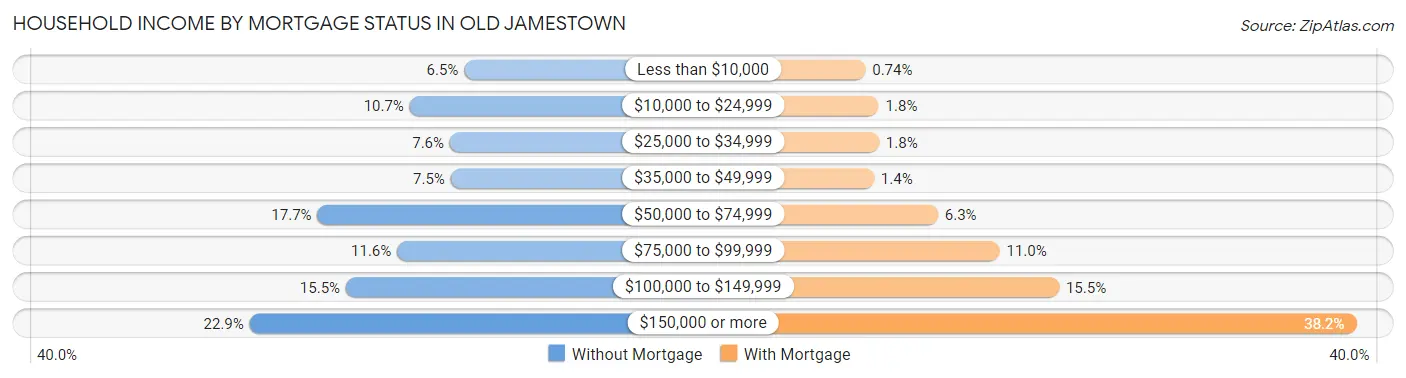
| Household Income | Without Mortgage | With Mortgage |
| Less than $10,000 | 102 (6.5%) | 33 (0.7%) |
| $10,000 to $24,999 | 167 (10.7%) | 79 (1.8%) |
| $25,000 to $34,999 | 119 (7.6%) | 80 (1.8%) |
| $35,000 to $49,999 | 118 (7.5%) | 63 (1.4%) |
| $50,000 to $74,999 | 277 (17.7%) | 281 (6.3%) |
| $75,000 to $99,999 | 182 (11.6%) | 492 (11.0%) |
| $100,000 to $149,999 | 243 (15.5%) | 695 (15.5%) |
| $150,000 or more | 358 (22.9%) | 1,711 (38.2%) |
| Total | 1,566 (100.0%) | 4,485 (100.0%) |
Property Value to Household Income Ratio in Old Jamestown
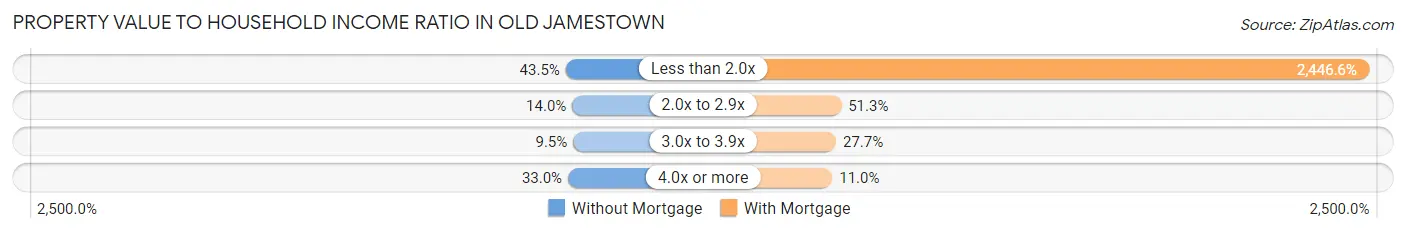
| Value-to-Income Ratio | Without Mortgage | With Mortgage |
| Less than 2.0x | 681 (43.5%) | 109,731 (2,446.6%) |
| 2.0x to 2.9x | 219 (14.0%) | 2,299 (51.3%) |
| 3.0x to 3.9x | 149 (9.5%) | 1,241 (27.7%) |
| 4.0x or more | 517 (33.0%) | 493 (11.0%) |
| Total | 1,566 (100.0%) | 4,485 (100.0%) |
Real Estate Taxes by Mortgage Status in Old Jamestown
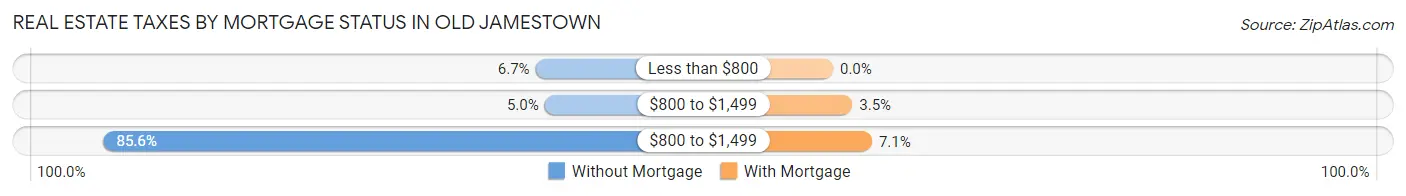
| Property Taxes | Without Mortgage | With Mortgage |
| Less than $800 | 105 (6.7%) | 0 (0.0%) |
| $800 to $1,499 | 79 (5.0%) | 158 (3.5%) |
| $800 to $1,499 | 1,340 (85.6%) | 319 (7.1%) |
| Total | 1,566 (100.0%) | 4,485 (100.0%) |
Health & Disability in Old Jamestown
Health Insurance Coverage by Age in Old Jamestown
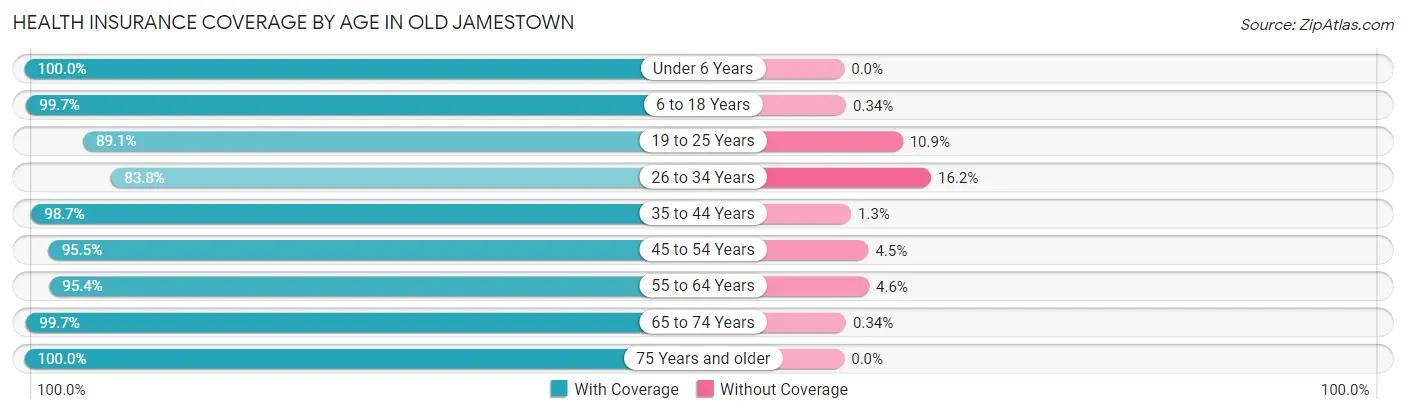
| Age Bracket | With Coverage | Without Coverage |
| Under 6 Years | 1,696 (100.0%) | 0 (0.0%) |
| 6 to 18 Years | 3,771 (99.7%) | 13 (0.3%) |
| 19 to 25 Years | 1,586 (89.1%) | 194 (10.9%) |
| 26 to 34 Years | 1,046 (83.8%) | 202 (16.2%) |
| 35 to 44 Years | 2,723 (98.7%) | 35 (1.3%) |
| 45 to 54 Years | 2,266 (95.5%) | 107 (4.5%) |
| 55 to 64 Years | 2,943 (95.4%) | 143 (4.6%) |
| 65 to 74 Years | 2,349 (99.7%) | 8 (0.3%) |
| 75 Years and older | 1,148 (100.0%) | 0 (0.0%) |
| Total | 19,528 (96.5%) | 702 (3.5%) |
Health Insurance Coverage by Citizenship Status in Old Jamestown
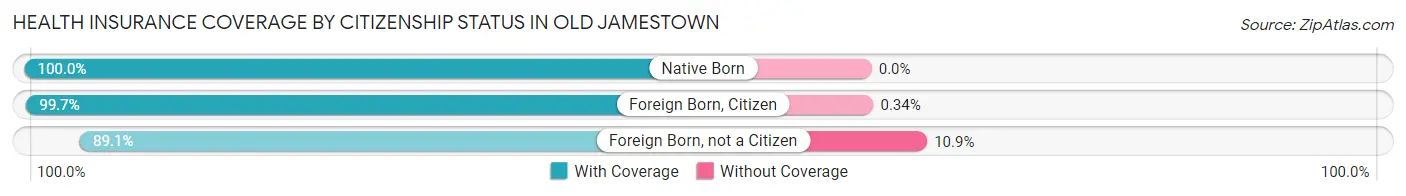
| Citizenship Status | With Coverage | Without Coverage |
| Native Born | 1,696 (100.0%) | 0 (0.0%) |
| Foreign Born, Citizen | 3,771 (99.7%) | 13 (0.3%) |
| Foreign Born, not a Citizen | 1,586 (89.1%) | 194 (10.9%) |
Health Insurance Coverage by Household Income in Old Jamestown
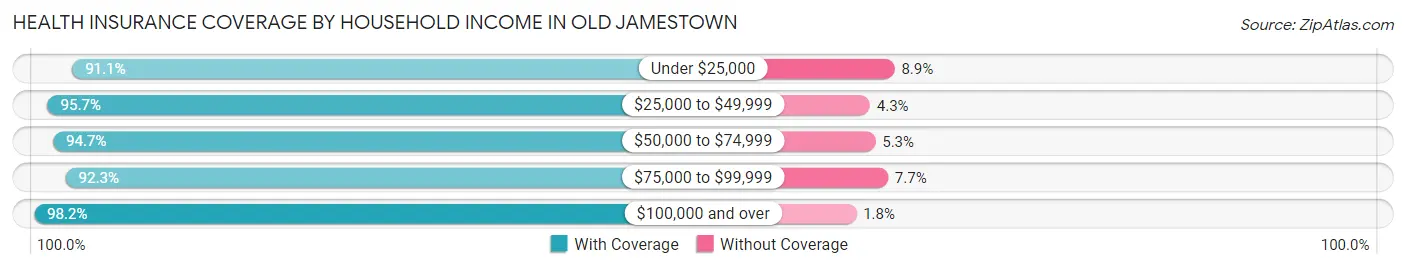
| Household Income | With Coverage | Without Coverage |
| Under $25,000 | 989 (91.1%) | 97 (8.9%) |
| $25,000 to $49,999 | 1,726 (95.7%) | 78 (4.3%) |
| $50,000 to $74,999 | 1,808 (94.7%) | 102 (5.3%) |
| $75,000 to $99,999 | 2,303 (92.3%) | 192 (7.7%) |
| $100,000 and over | 12,683 (98.2%) | 229 (1.8%) |
Public vs Private Health Insurance Coverage by Age in Old Jamestown
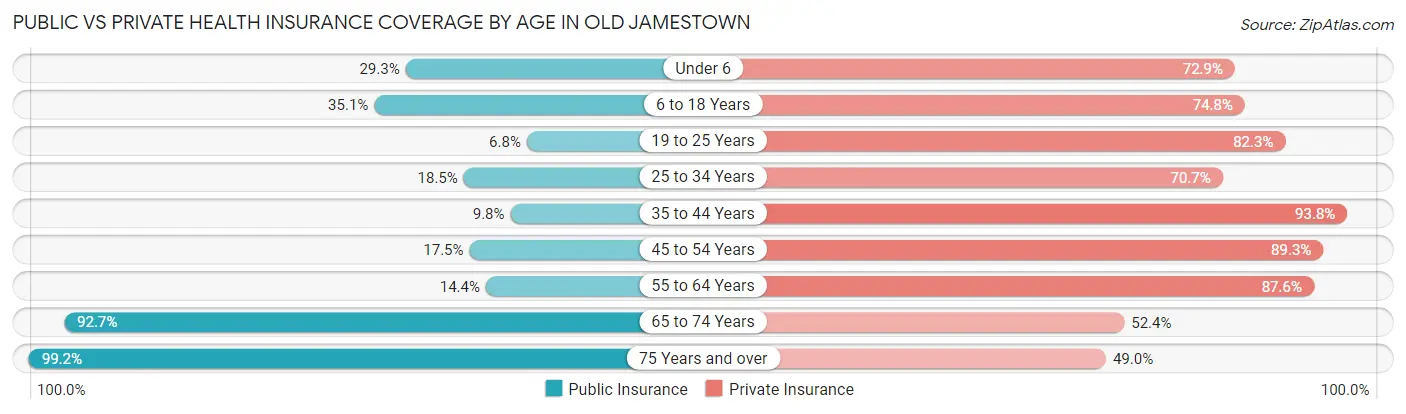
| Age Bracket | Public Insurance | Private Insurance |
| Under 6 | 497 (29.3%) | 1,237 (72.9%) |
| 6 to 18 Years | 1,329 (35.1%) | 2,830 (74.8%) |
| 19 to 25 Years | 121 (6.8%) | 1,465 (82.3%) |
| 25 to 34 Years | 231 (18.5%) | 882 (70.7%) |
| 35 to 44 Years | 271 (9.8%) | 2,587 (93.8%) |
| 45 to 54 Years | 414 (17.4%) | 2,120 (89.3%) |
| 55 to 64 Years | 444 (14.4%) | 2,703 (87.6%) |
| 65 to 74 Years | 2,184 (92.7%) | 1,236 (52.4%) |
| 75 Years and over | 1,139 (99.2%) | 563 (49.0%) |
| Total | 6,630 (32.8%) | 15,623 (77.2%) |
Disability Status by Sex by Age in Old Jamestown
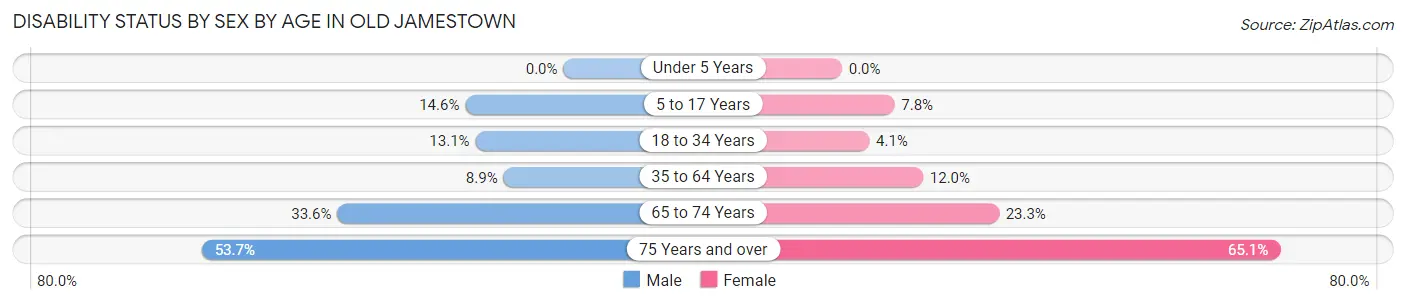
| Age Bracket | Male | Female |
| Under 5 Years | 0 (0.0%) | 0 (0.0%) |
| 5 to 17 Years | 264 (14.6%) | 142 (7.8%) |
| 18 to 34 Years | 230 (13.1%) | 62 (4.1%) |
| 35 to 64 Years | 321 (8.9%) | 555 (12.0%) |
| 65 to 74 Years | 336 (33.6%) | 316 (23.3%) |
| 75 Years and over | 232 (53.7%) | 466 (65.1%) |
Disability Class by Sex by Age in Old Jamestown
Disability Class: Hearing Difficulty
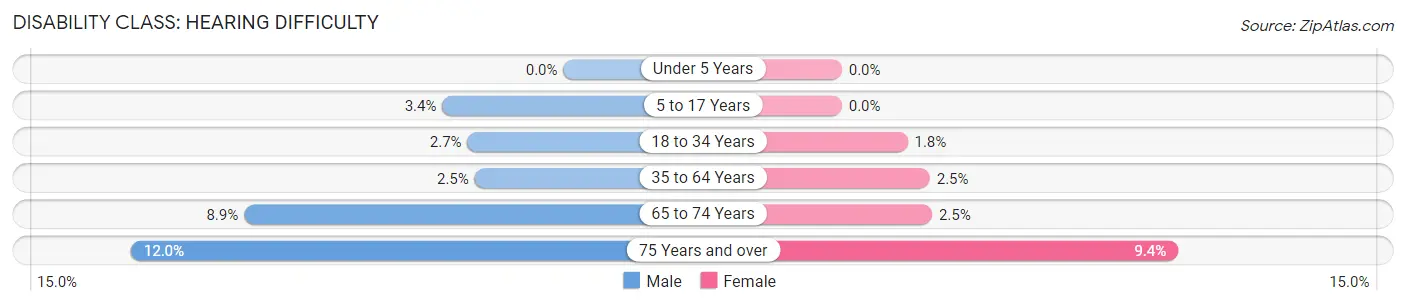
| Age Bracket | Male | Female |
| Under 5 Years | 0 (0.0%) | 0 (0.0%) |
| 5 to 17 Years | 61 (3.4%) | 0 (0.0%) |
| 18 to 34 Years | 47 (2.7%) | 28 (1.8%) |
| 35 to 64 Years | 89 (2.5%) | 113 (2.5%) |
| 65 to 74 Years | 89 (8.9%) | 34 (2.5%) |
| 75 Years and over | 52 (12.0%) | 67 (9.4%) |
Disability Class: Vision Difficulty
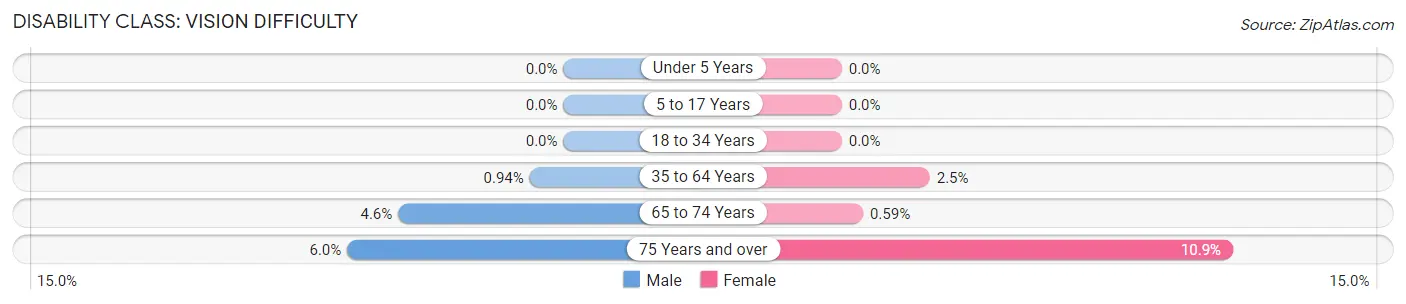
| Age Bracket | Male | Female |
| Under 5 Years | 0 (0.0%) | 0 (0.0%) |
| 5 to 17 Years | 0 (0.0%) | 0 (0.0%) |
| 18 to 34 Years | 0 (0.0%) | 0 (0.0%) |
| 35 to 64 Years | 34 (0.9%) | 113 (2.5%) |
| 65 to 74 Years | 46 (4.6%) | 8 (0.6%) |
| 75 Years and over | 26 (6.0%) | 78 (10.9%) |
Disability Class: Cognitive Difficulty
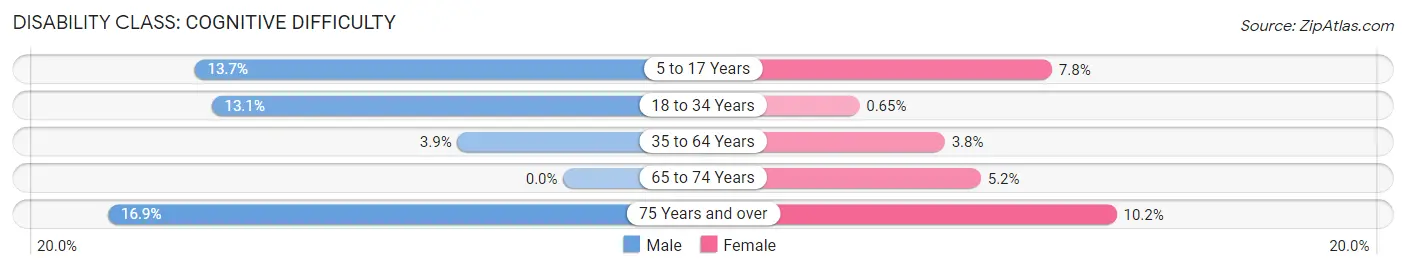
| Age Bracket | Male | Female |
| 5 to 17 Years | 248 (13.7%) | 142 (7.8%) |
| 18 to 34 Years | 230 (13.1%) | 10 (0.6%) |
| 35 to 64 Years | 142 (3.9%) | 176 (3.8%) |
| 65 to 74 Years | 0 (0.0%) | 70 (5.2%) |
| 75 Years and over | 73 (16.9%) | 73 (10.2%) |
Disability Class: Ambulatory Difficulty
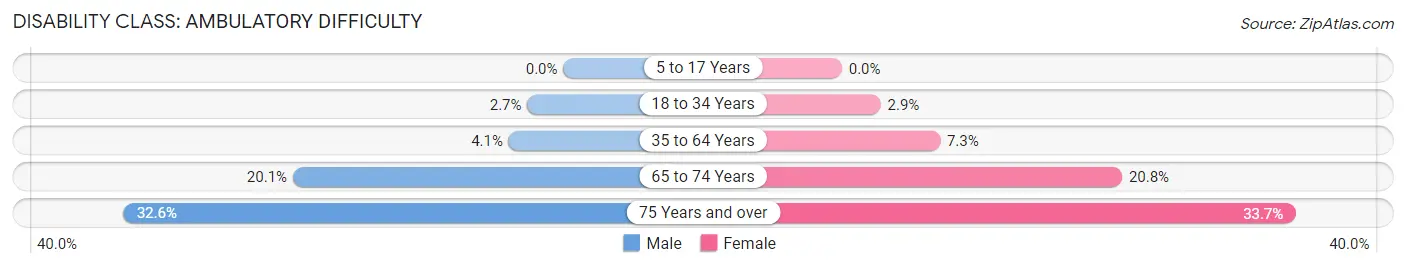
| Age Bracket | Male | Female |
| 5 to 17 Years | 0 (0.0%) | 0 (0.0%) |
| 18 to 34 Years | 47 (2.7%) | 44 (2.9%) |
| 35 to 64 Years | 146 (4.1%) | 336 (7.3%) |
| 65 to 74 Years | 201 (20.1%) | 282 (20.8%) |
| 75 Years and over | 141 (32.6%) | 241 (33.7%) |
Disability Class: Self-Care Difficulty
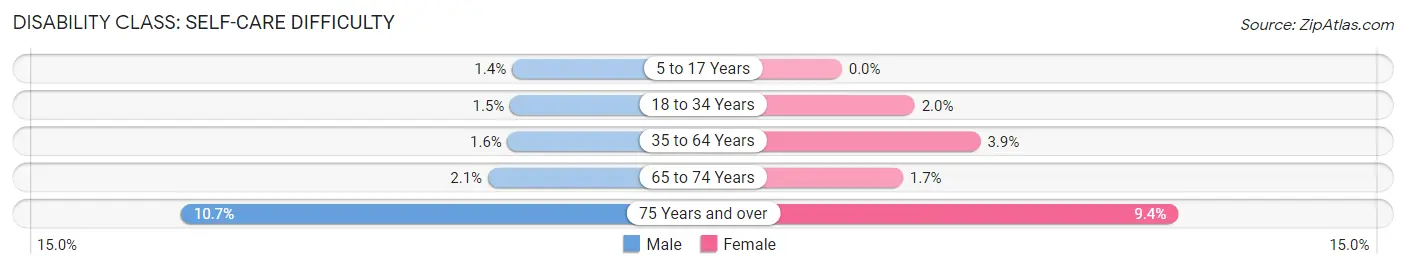
| Age Bracket | Male | Female |
| 5 to 17 Years | 26 (1.4%) | 0 (0.0%) |
| 18 to 34 Years | 26 (1.5%) | 31 (2.0%) |
| 35 to 64 Years | 56 (1.5%) | 178 (3.9%) |
| 65 to 74 Years | 21 (2.1%) | 23 (1.7%) |
| 75 Years and over | 46 (10.6%) | 67 (9.4%) |
Technology Access in Old Jamestown
Computing Device Access in Old Jamestown
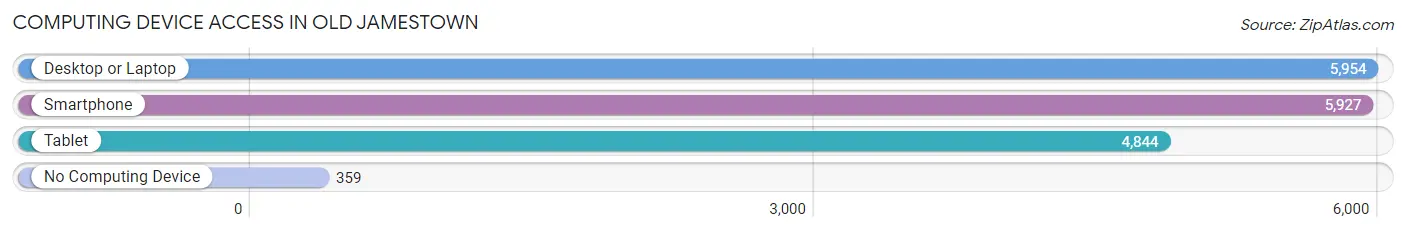
| Device Type | # Households | % Households |
| Desktop or Laptop | 5,954 | 87.7% |
| Smartphone | 5,927 | 87.3% |
| Tablet | 4,844 | 71.4% |
| No Computing Device | 359 | 5.3% |
| Total | 6,789 | 100.0% |
Internet Access in Old Jamestown
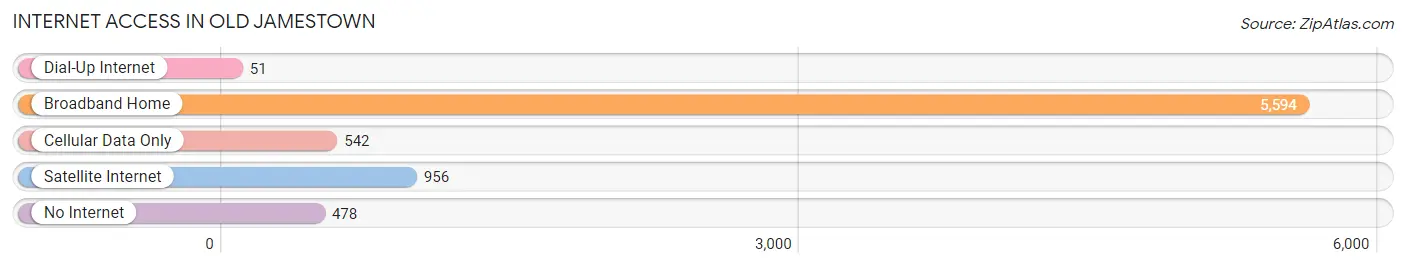
| Internet Type | # Households | % Households |
| Dial-Up Internet | 51 | 0.7% |
| Broadband Home | 5,594 | 82.4% |
| Cellular Data Only | 542 | 8.0% |
| Satellite Internet | 956 | 14.1% |
| No Internet | 478 | 7.0% |
| Total | 6,789 | 100.0% |
Old Jamestown Summary
Jamestown, Missouri is a small town located in Moniteau County, Missouri. It is situated on the banks of the Missouri River, approximately 30 miles west of Jefferson City. The town was founded in 1837 and was named after James Madison, the fourth President of the United States. The population of Jamestown was estimated to be around 1,000 people in 2000.
History
Jamestown was founded in 1837 by a group of settlers from Kentucky. The town was named after James Madison, the fourth President of the United States. The town was originally a trading post and was used as a stopover for travelers heading west. The town grew quickly and by the mid-1800s, it had become a thriving community with a variety of businesses, including a blacksmith, a general store, a hotel, and a post office.
In the late 1800s, Jamestown was a popular destination for steamboat travelers. The town was also home to a number of churches, including the First Baptist Church, which was founded in 1845.
In the early 1900s, Jamestown was a popular destination for hunters and fishermen. The town was also home to a number of businesses, including a sawmill, a gristmill, and a creamery.
Geography
Jamestown is located in Moniteau County, Missouri. It is situated on the banks of the Missouri River, approximately 30 miles west of Jefferson City. The town is located in a rural area and is surrounded by rolling hills and farmland. The climate in Jamestown is mild, with hot summers and cold winters.
Economy
The economy of Jamestown is largely based on agriculture. The town is home to a number of farms, which produce a variety of crops, including corn, soybeans, wheat, and hay. The town is also home to a number of businesses, including a sawmill, a gristmill, and a creamery.
Demographics
In 2000, the population of Jamestown was estimated to be around 1,000 people. The racial makeup of the town was 97.2% White, 0.7% African American, 0.3% Native American, 0.3% Asian, and 1.5% from other races. The median household income in Jamestown was $30,000 in 2000. The median age of the town's residents was 38.
Conclusion
Jamestown, Missouri is a small town located in Moniteau County, Missouri. It was founded in 1837 and was named after James Madison, the fourth President of the United States. The town is situated on the banks of the Missouri River, approximately 30 miles west of Jefferson City. The population of Jamestown was estimated to be around 1,000 people in 2000. The economy of Jamestown is largely based on agriculture, and the town is home to a number of businesses, including a sawmill, a gristmill, and a creamery. The racial makeup of the town was 97.2% White, 0.7% African American, 0.3% Native American, 0.3% Asian, and 1.5% from other races. The median household income in Jamestown was $30,000 in 2000.
Common Questions
What is the Total Population of Old Jamestown?
Total Population of Old Jamestown is 20,387.
What is the Total Male Population of Old Jamestown?
Total Male Population of Old Jamestown is 9,309.
What is the Total Female Population of Old Jamestown?
Total Female Population of Old Jamestown is 11,078.
What is the Ratio of Males per 100 Females in Old Jamestown?
There are 84.03 Males per 100 Females in Old Jamestown.
What is the Ratio of Females per 100 Males in Old Jamestown?
There are 119.00 Females per 100 Males in Old Jamestown.
What is the Median Population Age in Old Jamestown?
Median Population Age in Old Jamestown is 41.4 Years.
What is the Average Family Size in Old Jamestown
Average Family Size in Old Jamestown is 3.4 People.
What is the Average Household Size in Old Jamestown
Average Household Size in Old Jamestown is 3.0 People.
What is Per Capita Income in Old Jamestown?
Per Capita income in Old Jamestown is $40,494.
What is the Median Family Income in Old Jamestown?
Median Family Income in Old Jamestown is $110,321.
What is the Median Household income in Old Jamestown?
Median Household Income in Old Jamestown is $103,943.
What is Income or Wage Gap in Old Jamestown?
Income or Wage Gap in Old Jamestown is 14.1%.
Women in Old Jamestown earn 85.9 cents for every dollar earned by a man.
What is Inequality or Gini Index in Old Jamestown?
Inequality or Gini Index in Old Jamestown is 0.35.
How Large is the Labor Force in Old Jamestown?
There are 10,286 People in the Labor Forcein in Old Jamestown.
What is the Percentage of People in the Labor Force in Old Jamestown?
65.4% of People are in the Labor Force in Old Jamestown.
What is the Unemployment Rate in Old Jamestown?
Unemployment Rate in Old Jamestown is 4.3%.