Cottleville, MO
Cottleville Map
Cottleville Overview
5,584
TOTAL POPULATION
2,864
MALE POPULATION
2,720
FEMALE POPULATION
105.29
MALES / 100 FEMALES
94.97
FEMALES / 100 MALES
37.6
MEDIAN AGE
3.1
AVG FAMILY SIZE
2.8
AVG HOUSEHOLD SIZE
$62,224
PER CAPITA INCOME
$148,551
AVG FAMILY INCOME
$130,139
AVG HOUSEHOLD INCOME
36.4%
WAGE / INCOME GAP [ % ]
63.6¢/ $1
WAGE / INCOME GAP [ $ ]
0.41
INEQUALITY / GINI INDEX
3,539
LABOR FORCE [ PEOPLE ]
80.3%
PERCENT IN LABOR FORCE
1.6%
UNEMPLOYMENT RATE
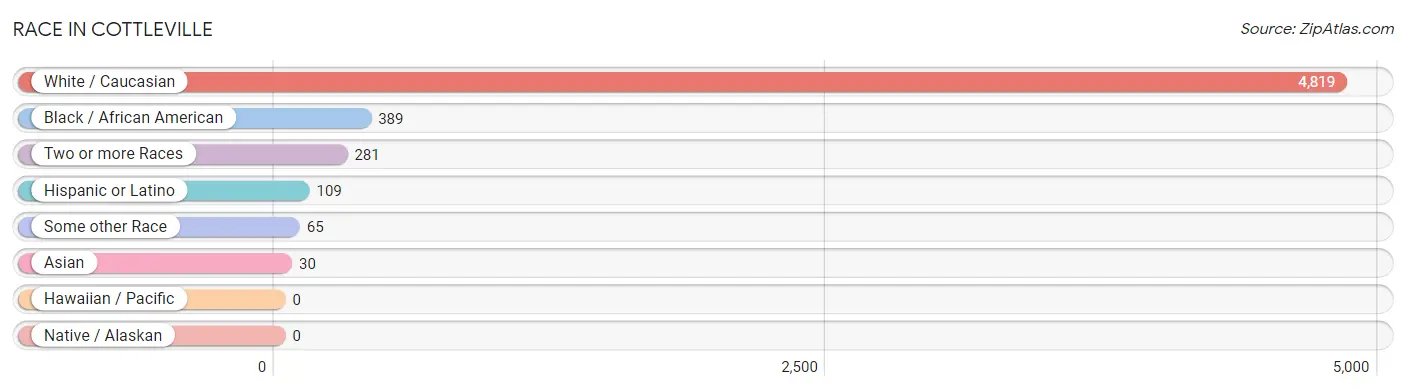
Race in Cottleville
The most populous races in Cottleville are White / Caucasian (4,819 | 86.3%), Black / African American (389 | 7.0%), and Two or more Races (281 | 5.0%).
| Race | # Population | % Population |
| Asian | 30 | 0.5% |
| Black / African American | 389 | 7.0% |
| Hawaiian / Pacific | 0 | 0.0% |
| Hispanic or Latino | 109 | 1.9% |
| Native / Alaskan | 0 | 0.0% |
| White / Caucasian | 4,819 | 86.3% |
| Two or more Races | 281 | 5.0% |
| Some other Race | 65 | 1.2% |
| Total | 5,584 | 100.0% |
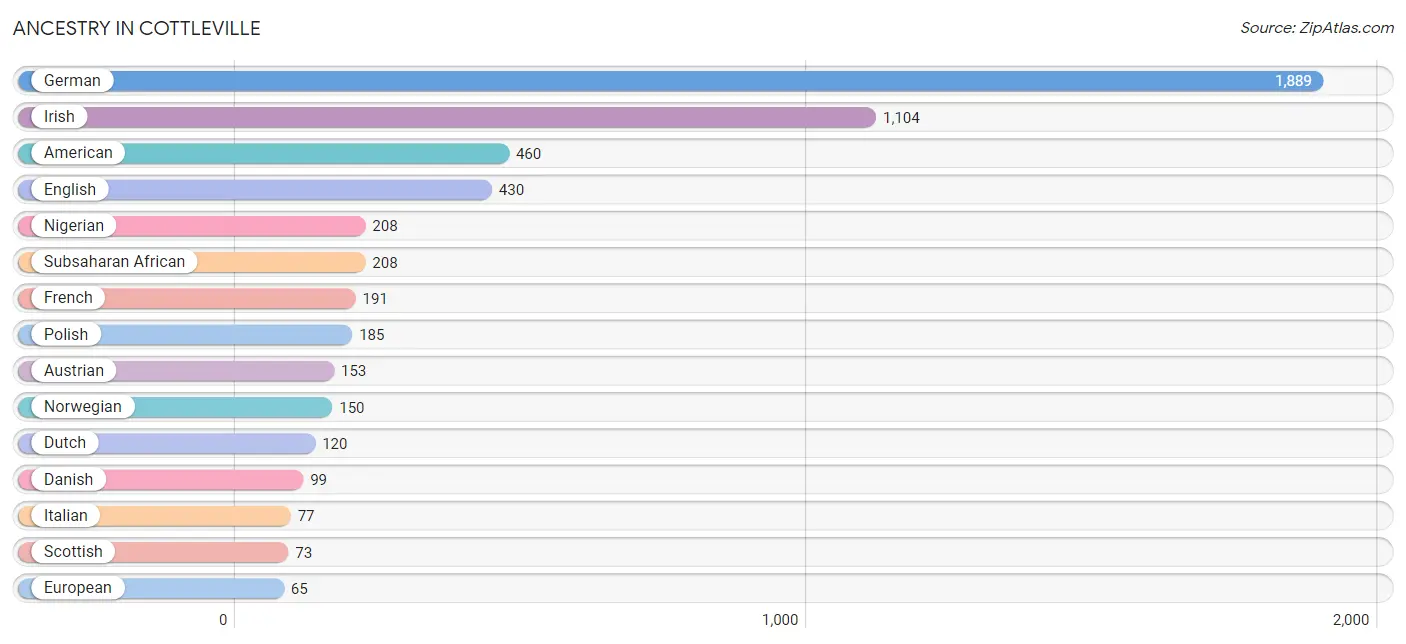
Ancestry in Cottleville
The most populous ancestries reported in Cottleville are German (1,889 | 33.8%), Irish (1,104 | 19.8%), American (460 | 8.2%), English (430 | 7.7%), and Nigerian (208 | 3.7%), together accounting for 73.3% of all Cottleville residents.
| Ancestry | # Population | % Population |
| American | 460 | 8.2% |
| Apache | 19 | 0.3% |
| Arab | 11 | 0.2% |
| Austrian | 153 | 2.7% |
| Bhutanese | 27 | 0.5% |
| British | 22 | 0.4% |
| Czech | 42 | 0.7% |
| Danish | 99 | 1.8% |
| Dutch | 120 | 2.1% |
| English | 430 | 7.7% |
| European | 65 | 1.2% |
| Finnish | 21 | 0.4% |
| French | 191 | 3.4% |
| French Canadian | 21 | 0.4% |
| German | 1,889 | 33.8% |
| Greek | 29 | 0.5% |
| Hungarian | 9 | 0.2% |
| Indian (Asian) | 16 | 0.3% |
| Irish | 1,104 | 19.8% |
| Italian | 77 | 1.4% |
| Lebanese | 11 | 0.2% |
| Lithuanian | 6 | 0.1% |
| Luxembourger | 14 | 0.3% |
| Mexican | 38 | 0.7% |
| Nigerian | 208 | 3.7% |
| Northern European | 25 | 0.4% |
| Norwegian | 150 | 2.7% |
| Polish | 185 | 3.3% |
| Puerto Rican | 52 | 0.9% |
| Romanian | 16 | 0.3% |
| Russian | 51 | 0.9% |
| Scotch-Irish | 25 | 0.4% |
| Scottish | 73 | 1.3% |
| Slovak | 21 | 0.4% |
| Sri Lankan | 3 | 0.1% |
| Subsaharan African | 208 | 3.7% |
| Swedish | 51 | 0.9% |
| Thai | 11 | 0.2% | View All 38 Rows |
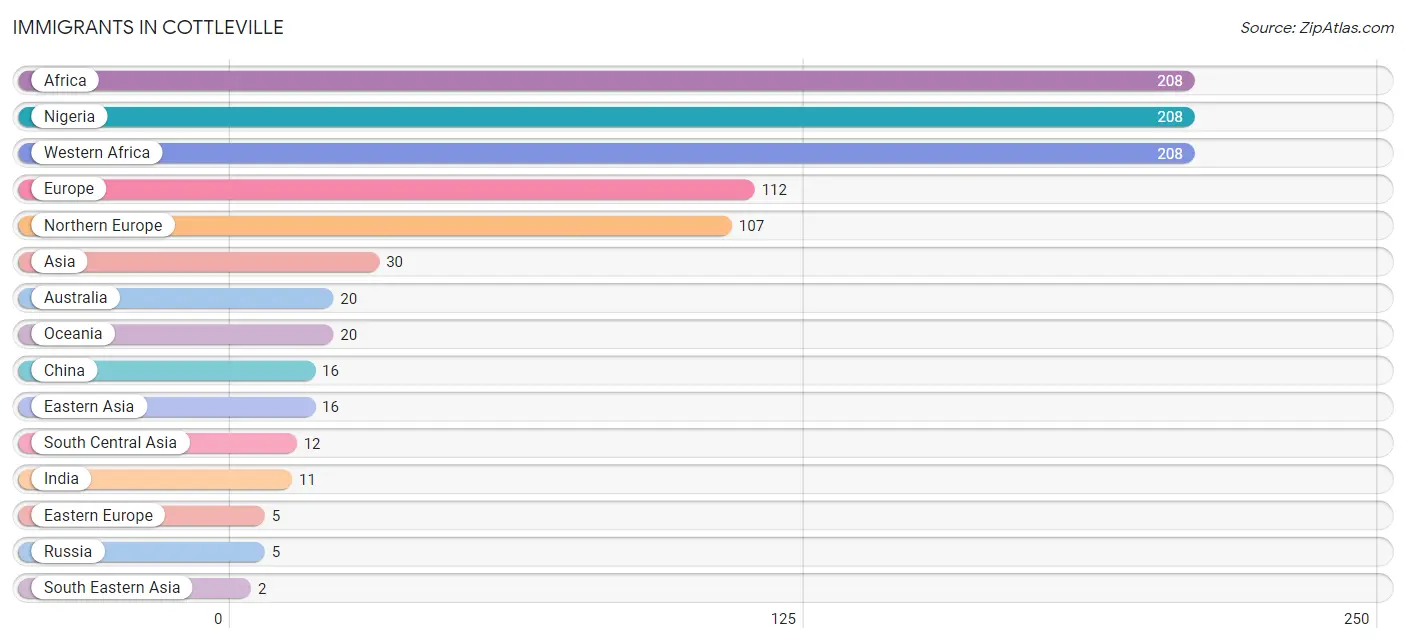
Immigrants in Cottleville
The most numerous immigrant groups reported in Cottleville came from Africa (208 | 3.7%), Nigeria (208 | 3.7%), Western Africa (208 | 3.7%), Europe (112 | 2.0%), and Northern Europe (107 | 1.9%), together accounting for 15.1% of all Cottleville residents.
| Immigration Origin | # Population | % Population |
| Africa | 208 | 3.7% |
| Asia | 30 | 0.5% |
| Australia | 20 | 0.4% |
| China | 16 | 0.3% |
| Eastern Asia | 16 | 0.3% |
| Eastern Europe | 5 | 0.1% |
| Europe | 112 | 2.0% |
| India | 11 | 0.2% |
| Kazakhstan | 1 | 0.0% |
| Nigeria | 208 | 3.7% |
| Northern Europe | 107 | 1.9% |
| Oceania | 20 | 0.4% |
| Russia | 5 | 0.1% |
| South Central Asia | 12 | 0.2% |
| South Eastern Asia | 2 | 0.0% |
| Vietnam | 2 | 0.0% |
| Western Africa | 208 | 3.7% | View All 17 Rows |
Sex and Age in Cottleville
Sex and Age in Cottleville
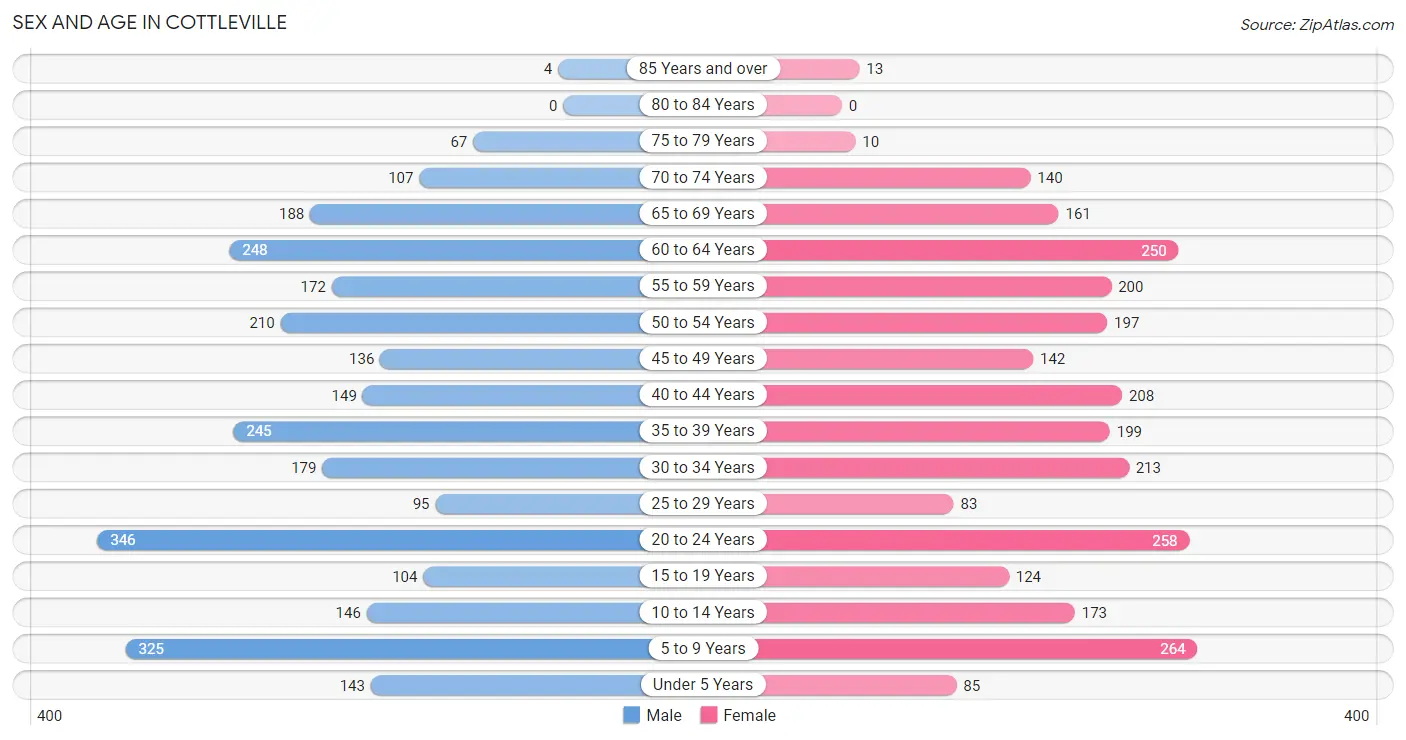
The most populous age groups in Cottleville are 20 to 24 Years (346 | 12.1%) for men and 5 to 9 Years (264 | 9.7%) for women.
| Age Bracket | Male | Female |
| Under 5 Years | 143 (5.0%) | 85 (3.1%) |
| 5 to 9 Years | 325 (11.4%) | 264 (9.7%) |
| 10 to 14 Years | 146 (5.1%) | 173 (6.4%) |
| 15 to 19 Years | 104 (3.6%) | 124 (4.6%) |
| 20 to 24 Years | 346 (12.1%) | 258 (9.5%) |
| 25 to 29 Years | 95 (3.3%) | 83 (3.0%) |
| 30 to 34 Years | 179 (6.2%) | 213 (7.8%) |
| 35 to 39 Years | 245 (8.6%) | 199 (7.3%) |
| 40 to 44 Years | 149 (5.2%) | 208 (7.6%) |
| 45 to 49 Years | 136 (4.8%) | 142 (5.2%) |
| 50 to 54 Years | 210 (7.3%) | 197 (7.2%) |
| 55 to 59 Years | 172 (6.0%) | 200 (7.3%) |
| 60 to 64 Years | 248 (8.7%) | 250 (9.2%) |
| 65 to 69 Years | 188 (6.6%) | 161 (5.9%) |
| 70 to 74 Years | 107 (3.7%) | 140 (5.1%) |
| 75 to 79 Years | 67 (2.3%) | 10 (0.4%) |
| 80 to 84 Years | 0 (0.0%) | 0 (0.0%) |
| 85 Years and over | 4 (0.1%) | 13 (0.5%) |
| Total | 2,864 (100.0%) | 2,720 (100.0%) |
Families and Households in Cottleville
Median Family Size in Cottleville
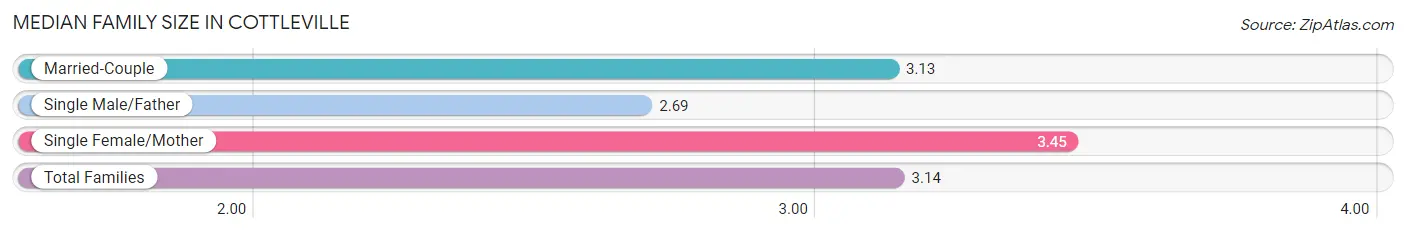
The median family size in Cottleville is 3.14 persons per family, with single female/mother families (155 | 10.3%) accounting for the largest median family size of 3.45 persons per family. On the other hand, single male/father families (81 | 5.4%) represent the smallest median family size with 2.69 persons per family.
| Family Type | # Families | Family Size |
| Married-Couple | 1,269 (84.3%) | 3.13 |
| Single Male/Father | 81 (5.4%) | 2.69 |
| Single Female/Mother | 155 (10.3%) | 3.45 |
| Total Families | 1,505 (100.0%) | 3.14 |
Median Household Size in Cottleville
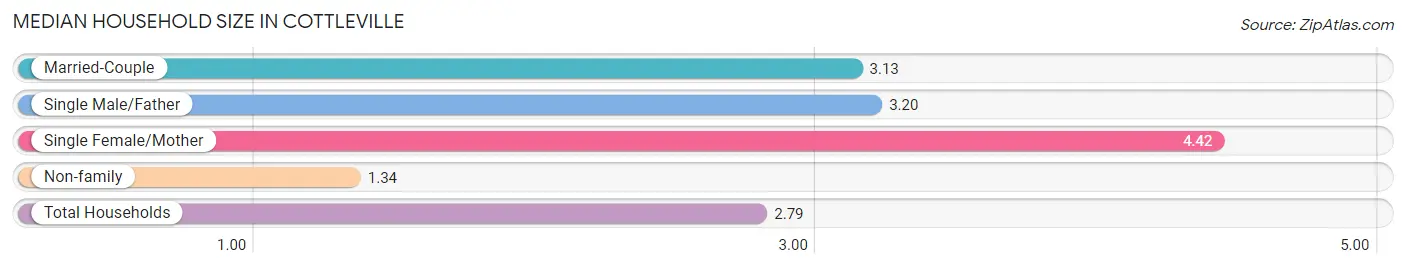
The median household size in Cottleville is 2.79 persons per household, with single female/mother households (155 | 7.8%) accounting for the largest median household size of 4.42 persons per household. non-family households (492 | 24.6%) represent the smallest median household size with 1.34 persons per household.
| Household Type | # Households | Household Size |
| Married-Couple | 1,269 (63.5%) | 3.13 |
| Single Male/Father | 81 (4.1%) | 3.20 |
| Single Female/Mother | 155 (7.8%) | 4.42 |
| Non-family | 492 (24.6%) | 1.34 |
| Total Households | 1,997 (100.0%) | 2.79 |
Household Size by Marriage Status in Cottleville
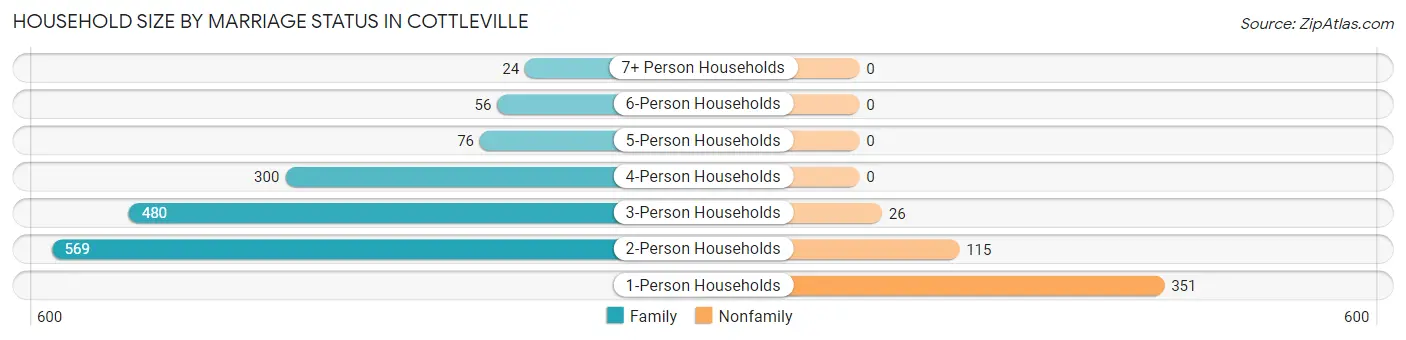
Out of a total of 1,997 households in Cottleville, 1,505 (75.4%) are family households, while 492 (24.6%) are nonfamily households. The most numerous type of family households are 2-person households, comprising 569, and the most common type of nonfamily households are 1-person households, comprising 351.
| Household Size | Family Households | Nonfamily Households |
| 1-Person Households | - | 351 (17.6%) |
| 2-Person Households | 569 (28.5%) | 115 (5.8%) |
| 3-Person Households | 480 (24.0%) | 26 (1.3%) |
| 4-Person Households | 300 (15.0%) | 0 (0.0%) |
| 5-Person Households | 76 (3.8%) | 0 (0.0%) |
| 6-Person Households | 56 (2.8%) | 0 (0.0%) |
| 7+ Person Households | 24 (1.2%) | 0 (0.0%) |
| Total | 1,505 (75.4%) | 492 (24.6%) |
Female Fertility in Cottleville
Fertility by Age in Cottleville
Average fertility rate in Cottleville is 36.0 births per 1,000 women. Women in the age bracket of 35 to 50 years have the highest fertility rate with 49.0 births per 1,000 women. Women in the age bracket of 35 to 50 years acount for 62.2% of all women with births.
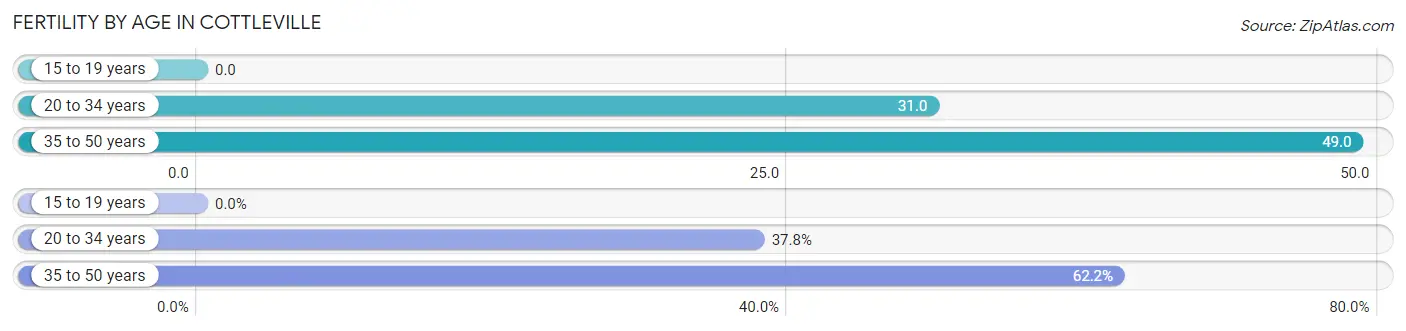
| Age Bracket | Women with Births | Births / 1,000 Women |
| 15 to 19 years | 0 (0.0%) | 0.0 |
| 20 to 34 years | 17 (37.8%) | 31.0 |
| 35 to 50 years | 28 (62.2%) | 49.0 |
| Total | 45 (100.0%) | 36.0 |
Fertility by Age by Marriage Status in Cottleville
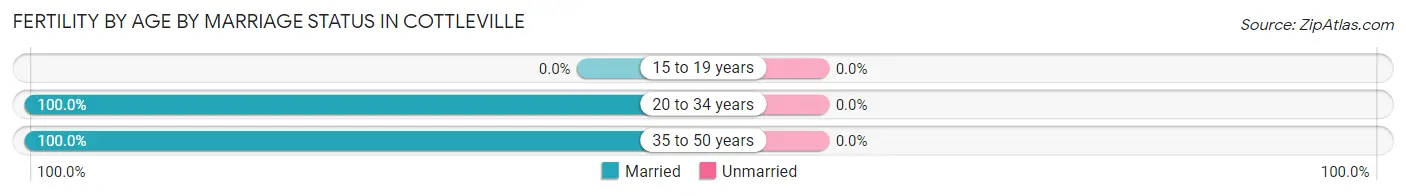
| Age Bracket | Married | Unmarried |
| 15 to 19 years | 0 (0.0%) | 0 (0.0%) |
| 20 to 34 years | 17 (100.0%) | 0 (0.0%) |
| 35 to 50 years | 28 (100.0%) | 0 (0.0%) |
| Total | 45 (100.0%) | 0 (0.0%) |
Fertility by Education in Cottleville
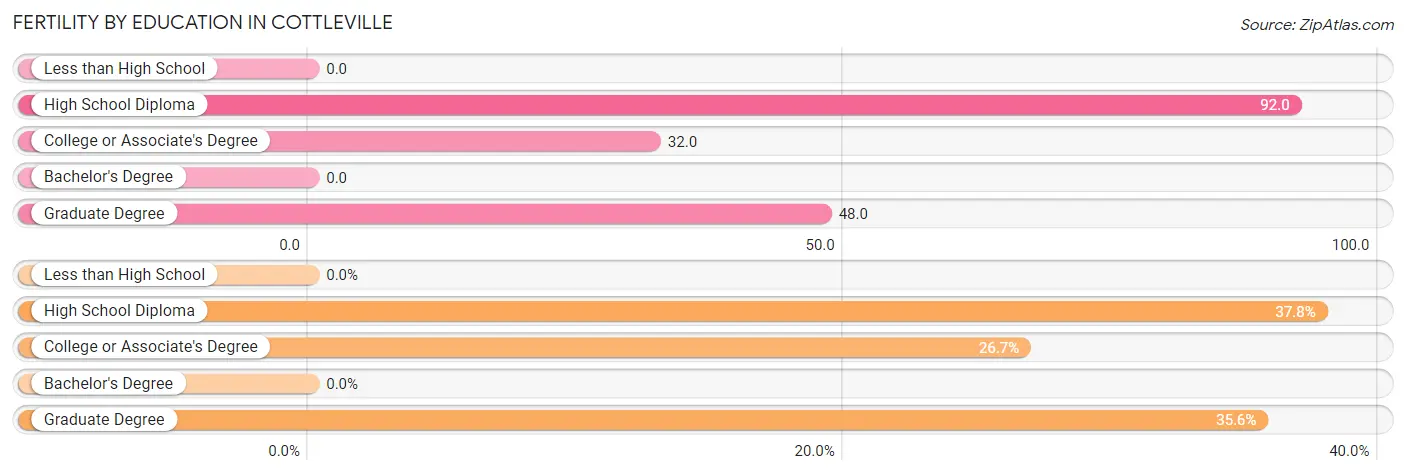
| Educational Attainment | Women with Births | Births / 1,000 Women |
| Less than High School | 0 (0.0%) | 0.0 |
| High School Diploma | 17 (37.8%) | 92.0 |
| College or Associate's Degree | 12 (26.7%) | 32.0 |
| Bachelor's Degree | 0 (0.0%) | 0.0 |
| Graduate Degree | 16 (35.6%) | 48.0 |
| Total | 45 (100.0%) | 36.0 |
Fertility by Education by Marriage Status in Cottleville
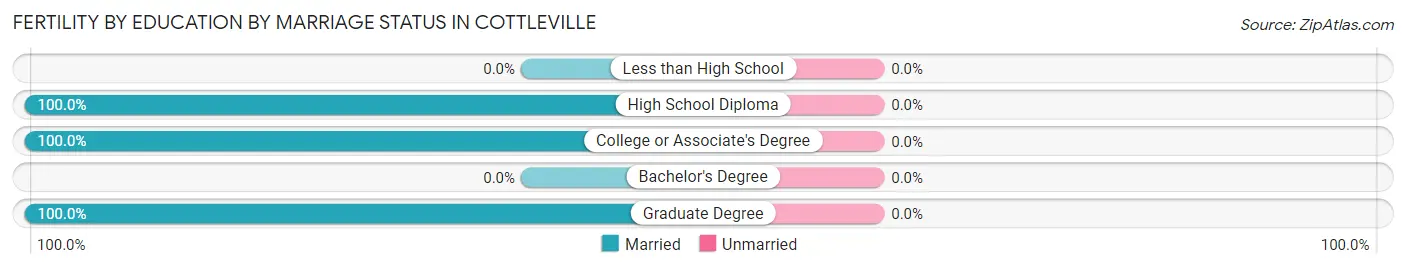
| Educational Attainment | Married | Unmarried |
| Less than High School | 0 (0.0%) | 0 (0.0%) |
| High School Diploma | 17 (100.0%) | 0 (0.0%) |
| College or Associate's Degree | 12 (100.0%) | 0 (0.0%) |
| Bachelor's Degree | 0 (0.0%) | 0 (0.0%) |
| Graduate Degree | 16 (100.0%) | 0 (0.0%) |
| Total | 45 (100.0%) | 0 (0.0%) |
Income in Cottleville
Income Overview in Cottleville
Per Capita Income in Cottleville is $62,224, while median incomes of families and households are $148,551 and $130,139 respectively.
| Characteristic | Number | Measure |
| Per Capita Income | 5,584 | $62,224 |
| Median Family Income | 1,505 | $148,551 |
| Mean Family Income | 1,505 | $172,207 |
| Median Household Income | 1,997 | $130,139 |
| Mean Household Income | 1,997 | $167,071 |
| Income Deficit | 1,505 | $0 |
| Wage / Income Gap (%) | 5,584 | 36.39% |
| Wage / Income Gap ($) | 5,584 | 63.61¢ per $1 |
| Gini / Inequality Index | 5,584 | 0.41 |
Earnings by Sex in Cottleville
Average Earnings in Cottleville are $52,964, $67,917 for men and $43,205 for women, a difference of 36.4%.
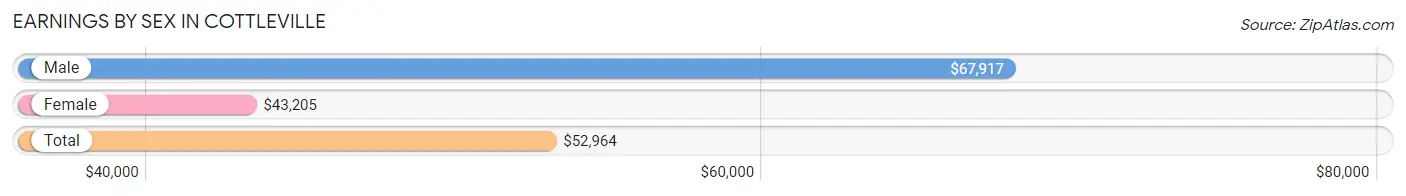
| Sex | Number | Average Earnings |
| Male | 1,859 (51.8%) | $67,917 |
| Female | 1,729 (48.2%) | $43,205 |
| Total | 3,588 (100.0%) | $52,964 |
Earnings by Sex by Income Bracket in Cottleville
The most common earnings brackets in Cottleville are $100,000+ for men (565 | 30.4%) and $75,000 to $99,999 for women (228 | 13.2%).
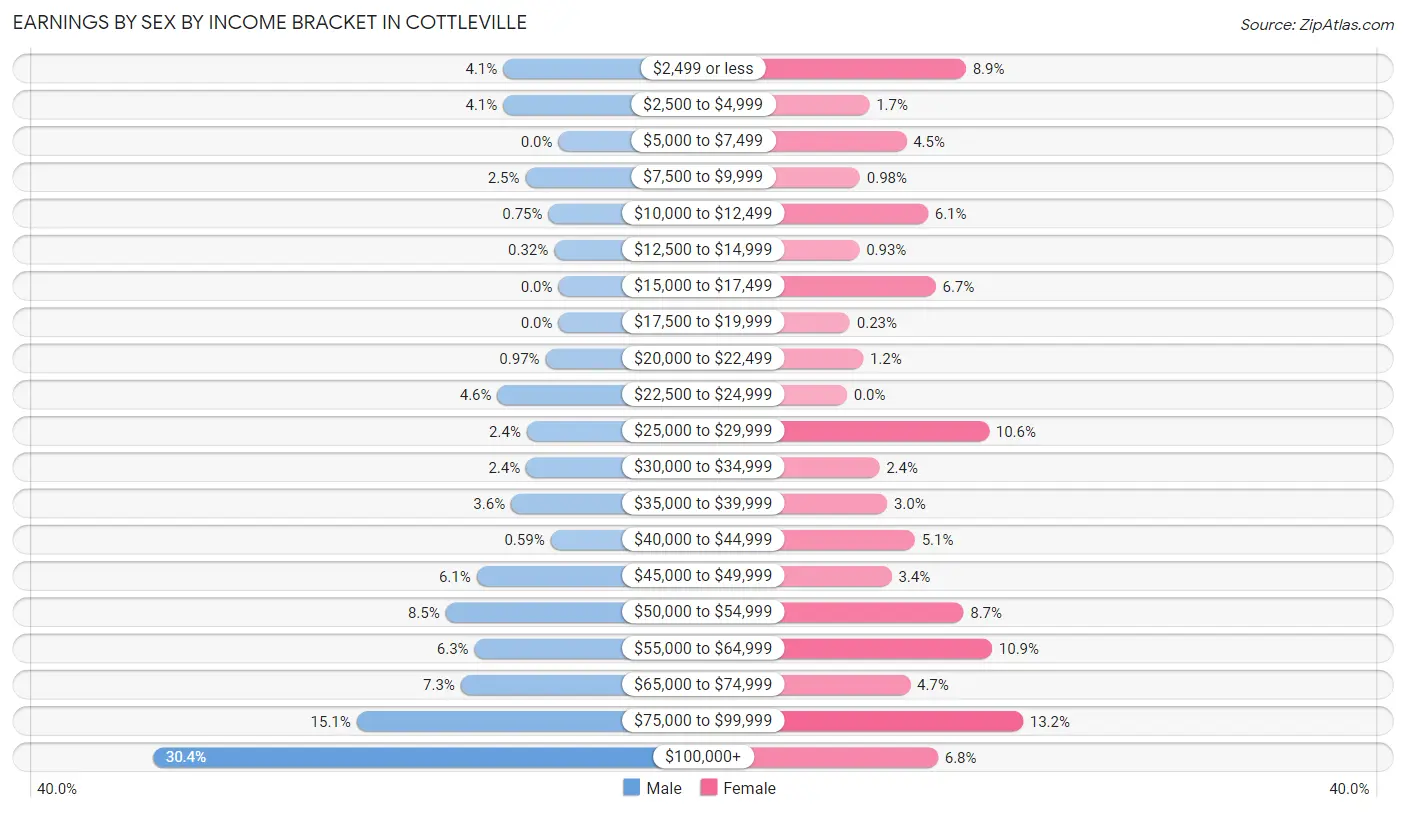
| Income | Male | Female |
| $2,499 or less | 77 (4.1%) | 154 (8.9%) |
| $2,500 to $4,999 | 77 (4.1%) | 29 (1.7%) |
| $5,000 to $7,499 | 0 (0.0%) | 77 (4.4%) |
| $7,500 to $9,999 | 46 (2.5%) | 17 (1.0%) |
| $10,000 to $12,499 | 14 (0.7%) | 105 (6.1%) |
| $12,500 to $14,999 | 6 (0.3%) | 16 (0.9%) |
| $15,000 to $17,499 | 0 (0.0%) | 115 (6.7%) |
| $17,500 to $19,999 | 0 (0.0%) | 4 (0.2%) |
| $20,000 to $22,499 | 18 (1.0%) | 21 (1.2%) |
| $22,500 to $24,999 | 85 (4.6%) | 0 (0.0%) |
| $25,000 to $29,999 | 44 (2.4%) | 184 (10.6%) |
| $30,000 to $34,999 | 45 (2.4%) | 42 (2.4%) |
| $35,000 to $39,999 | 66 (3.5%) | 52 (3.0%) |
| $40,000 to $44,999 | 11 (0.6%) | 88 (5.1%) |
| $45,000 to $49,999 | 114 (6.1%) | 58 (3.4%) |
| $50,000 to $54,999 | 157 (8.5%) | 151 (8.7%) |
| $55,000 to $64,999 | 117 (6.3%) | 188 (10.9%) |
| $65,000 to $74,999 | 136 (7.3%) | 82 (4.7%) |
| $75,000 to $99,999 | 281 (15.1%) | 228 (13.2%) |
| $100,000+ | 565 (30.4%) | 118 (6.8%) |
| Total | 1,859 (100.0%) | 1,729 (100.0%) |
Earnings by Sex by Educational Attainment in Cottleville
Average earnings in Cottleville are $85,700 for men and $52,097 for women, a difference of 39.2%. Men with an educational attainment of graduate degree enjoy the highest average annual earnings of $148,750, while those with high school diploma education earn the least with $55,203. Women with an educational attainment of bachelor's degree earn the most with the average annual earnings of $62,578, while those with college or associate's degree education have the smallest earnings of $40,903.
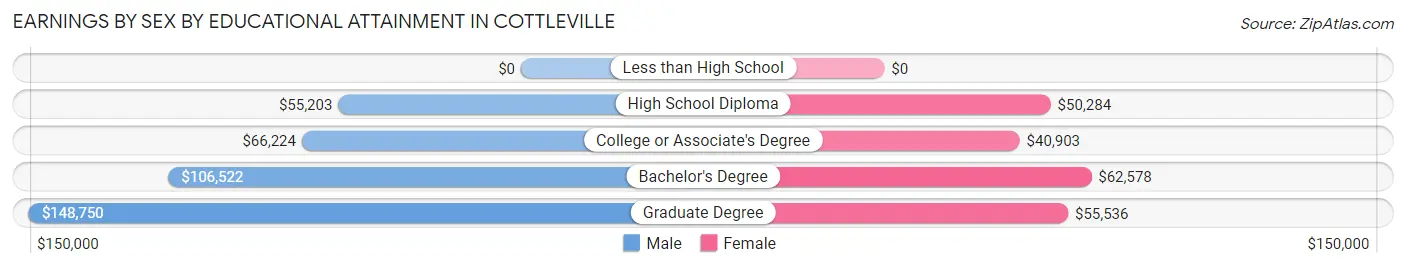
| Educational Attainment | Male Income | Female Income |
| Less than High School | - | - |
| High School Diploma | $55,203 | $50,284 |
| College or Associate's Degree | $66,224 | $40,903 |
| Bachelor's Degree | $106,522 | $62,578 |
| Graduate Degree | $148,750 | $55,536 |
| Total | $85,700 | $52,097 |
Family Income in Cottleville
Family Income Brackets in Cottleville
According to the Cottleville family income data, there are 439 families falling into the $200,000+ income range, which is the most common income bracket and makes up 29.2% of all families.
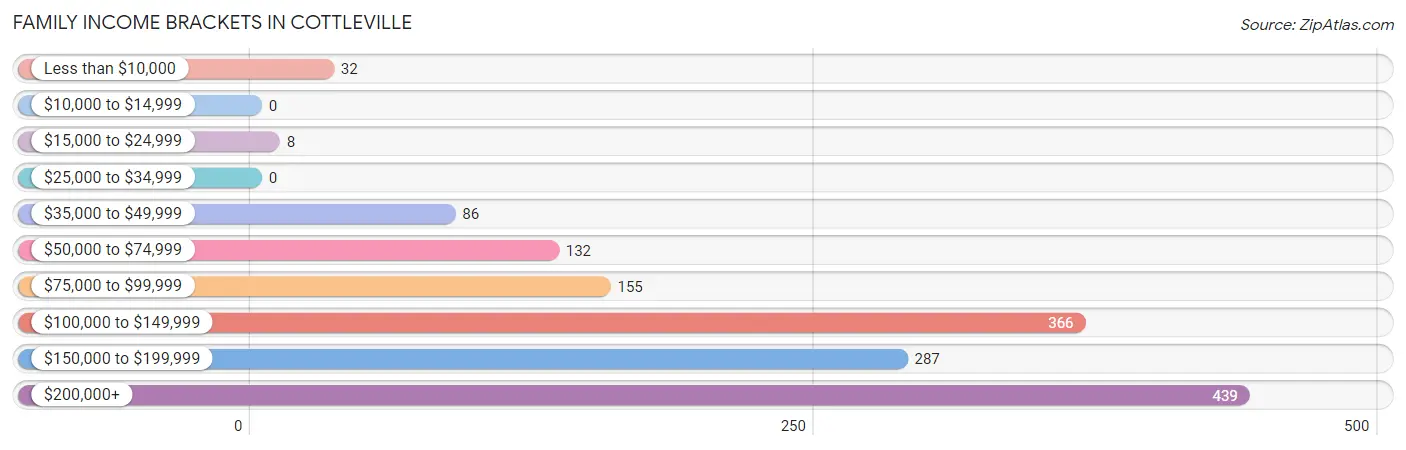
| Income Bracket | # Families | % Families |
| Less than $10,000 | 32 | 2.1% |
| $10,000 to $14,999 | 0 | 0.0% |
| $15,000 to $24,999 | 8 | 0.5% |
| $25,000 to $34,999 | 0 | 0.0% |
| $35,000 to $49,999 | 86 | 5.7% |
| $50,000 to $74,999 | 132 | 8.8% |
| $75,000 to $99,999 | 155 | 10.3% |
| $100,000 to $149,999 | 366 | 24.3% |
| $150,000 to $199,999 | 287 | 19.1% |
| $200,000+ | 439 | 29.2% |
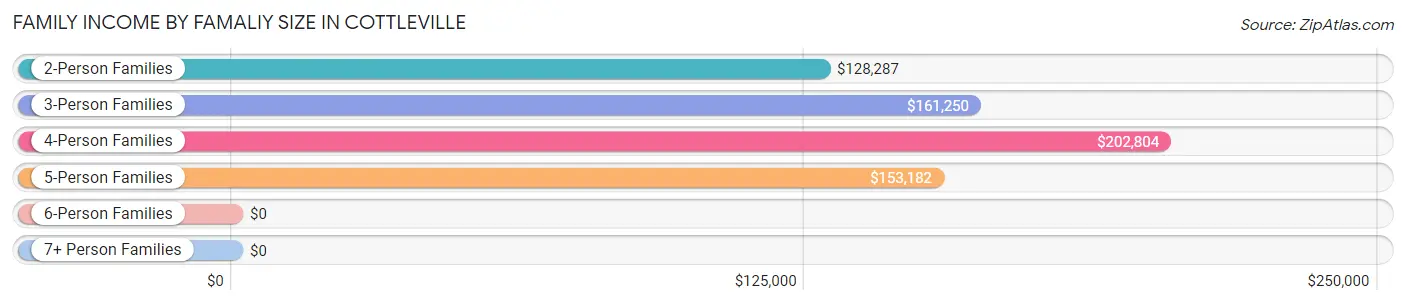
Family Income by Famaliy Size in Cottleville
4-person families (259 | 17.2%) account for the highest median family income in Cottleville with $202,804 per family, while 2-person families (615 | 40.9%) have the highest median income of $64,144 per family member.
| Income Bracket | # Families | Median Income |
| 2-Person Families | 615 (40.9%) | $128,287 |
| 3-Person Families | 500 (33.2%) | $161,250 |
| 4-Person Families | 259 (17.2%) | $202,804 |
| 5-Person Families | 88 (5.9%) | $153,182 |
| 6-Person Families | 19 (1.3%) | $0 |
| 7+ Person Families | 24 (1.6%) | $0 |
| Total | 1,505 (100.0%) | $148,551 |
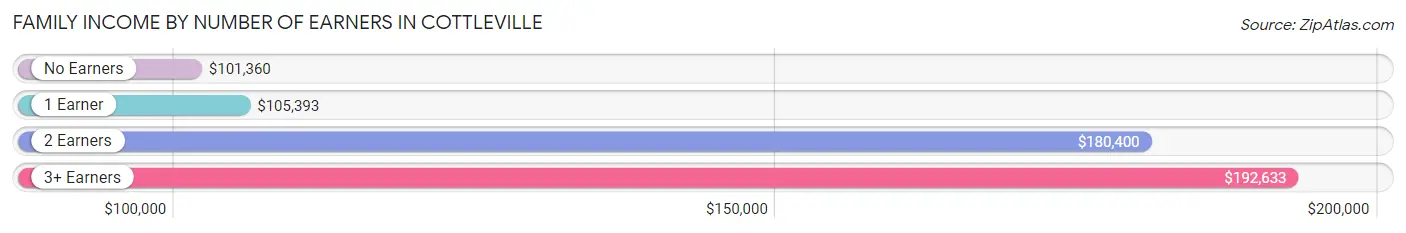
Family Income by Number of Earners in Cottleville
The median family income in Cottleville is $148,551, with families comprising 3+ earners (273) having the highest median family income of $192,633, while families with no earners (129) have the lowest median family income of $101,360, accounting for 18.1% and 8.6% of families, respectively.
| Number of Earners | # Families | Median Income |
| No Earners | 129 (8.6%) | $101,360 |
| 1 Earner | 291 (19.3%) | $105,393 |
| 2 Earners | 812 (53.9%) | $180,400 |
| 3+ Earners | 273 (18.1%) | $192,633 |
| Total | 1,505 (100.0%) | $148,551 |
Household Income in Cottleville
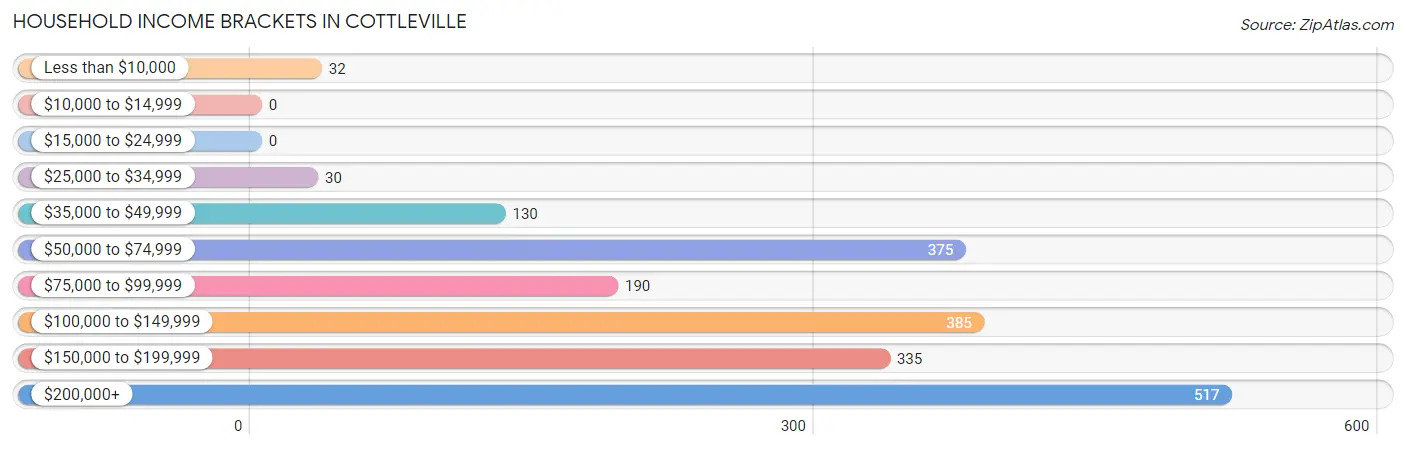
Household Income Brackets in Cottleville
With 517 households falling in the category, the $200,000+ income range is the most frequent in Cottleville, accounting for 25.9% of all households.
| Income Bracket | # Households | % Households |
| Less than $10,000 | 32 | 1.6% |
| $10,000 to $14,999 | 0 | 0.0% |
| $15,000 to $24,999 | 0 | 0.0% |
| $25,000 to $34,999 | 30 | 1.5% |
| $35,000 to $49,999 | 130 | 6.5% |
| $50,000 to $74,999 | 375 | 18.8% |
| $75,000 to $99,999 | 190 | 9.5% |
| $100,000 to $149,999 | 385 | 19.3% |
| $150,000 to $199,999 | 335 | 16.8% |
| $200,000+ | 517 | 25.9% |
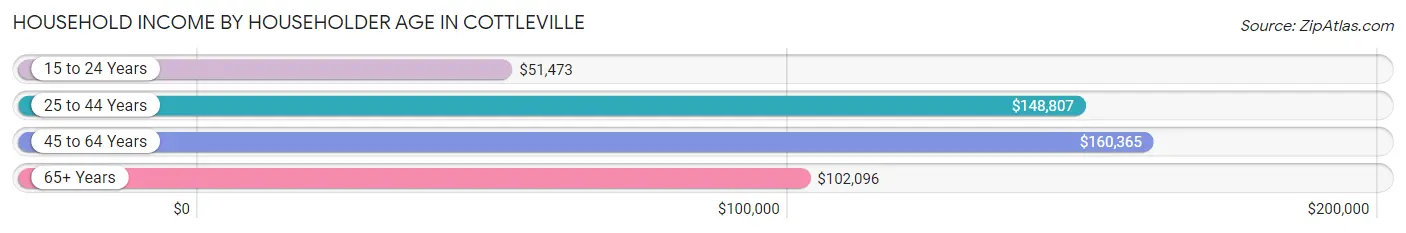
Household Income by Householder Age in Cottleville
The median household income in Cottleville is $130,139, with the highest median household income of $160,365 found in the 45 to 64 years age bracket for the primary householder. A total of 841 households (42.1%) fall into this category. Meanwhile, the 15 to 24 years age bracket for the primary householder has the lowest median household income of $51,473, with 117 households (5.9%) in this group.
| Income Bracket | # Households | Median Income |
| 15 to 24 Years | 117 (5.9%) | $51,473 |
| 25 to 44 Years | 652 (32.7%) | $148,807 |
| 45 to 64 Years | 841 (42.1%) | $160,365 |
| 65+ Years | 387 (19.4%) | $102,096 |
| Total | 1,997 (100.0%) | $130,139 |
Poverty in Cottleville
Income Below Poverty by Sex and Age in Cottleville
With 3.6% poverty level for males and 3.3% for females among the residents of Cottleville, 16 and 17 year old males and 5 year old females are the most vulnerable to poverty, with 20 males (25.0%) and 19 females (24.7%) in their respective age groups living below the poverty level.
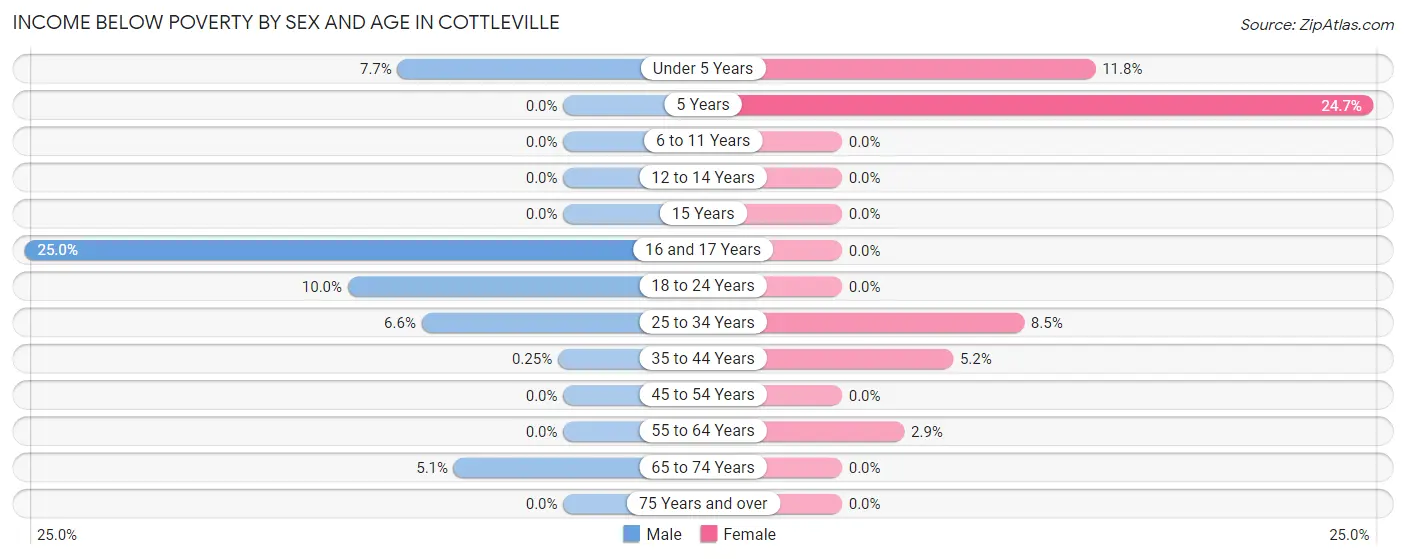
| Age Bracket | Male | Female |
| Under 5 Years | 11 (7.7%) | 10 (11.8%) |
| 5 Years | 0 (0.0%) | 19 (24.7%) |
| 6 to 11 Years | 0 (0.0%) | 0 (0.0%) |
| 12 to 14 Years | 0 (0.0%) | 0 (0.0%) |
| 15 Years | 0 (0.0%) | 0 (0.0%) |
| 16 and 17 Years | 20 (25.0%) | 0 (0.0%) |
| 18 to 24 Years | 36 (10.0%) | 0 (0.0%) |
| 25 to 34 Years | 18 (6.6%) | 25 (8.5%) |
| 35 to 44 Years | 1 (0.3%) | 21 (5.2%) |
| 45 to 54 Years | 0 (0.0%) | 0 (0.0%) |
| 55 to 64 Years | 0 (0.0%) | 13 (2.9%) |
| 65 to 74 Years | 15 (5.1%) | 0 (0.0%) |
| 75 Years and over | 0 (0.0%) | 0 (0.0%) |
| Total | 101 (3.6%) | 88 (3.3%) |
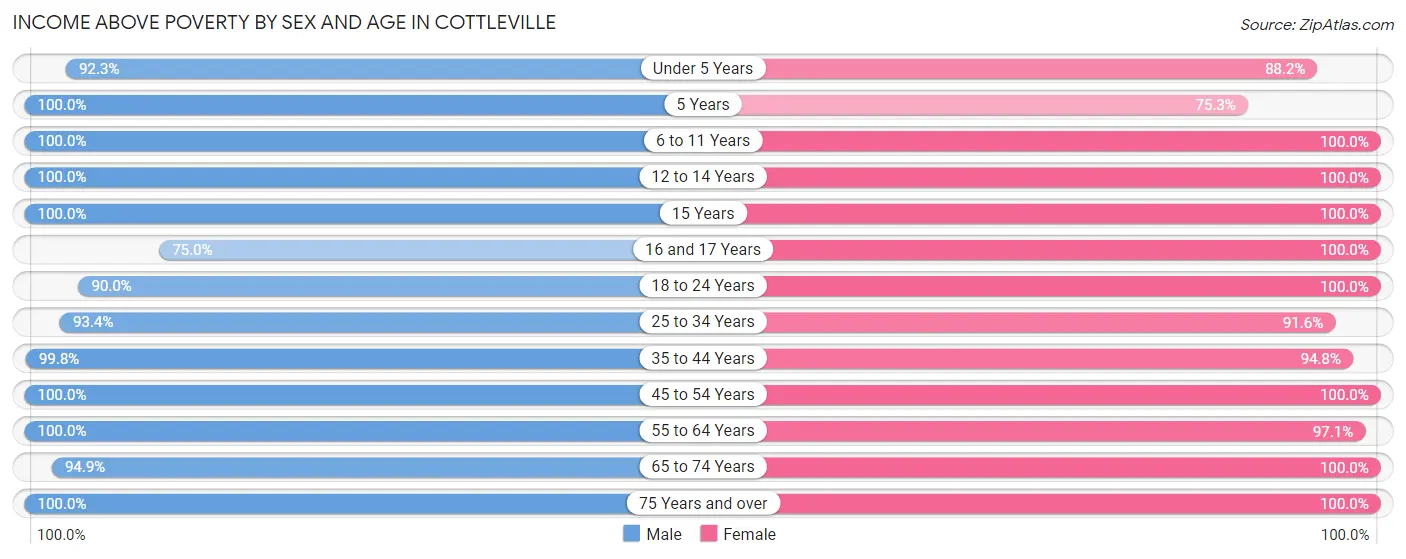
Income Above Poverty by Sex and Age in Cottleville
According to the poverty statistics in Cottleville, males aged 5 years and females aged 6 to 11 years are the age groups that are most secure financially, with 100.0% of males and 100.0% of females in these age groups living above the poverty line.
| Age Bracket | Male | Female |
| Under 5 Years | 132 (92.3%) | 75 (88.2%) |
| 5 Years | 65 (100.0%) | 58 (75.3%) |
| 6 to 11 Years | 203 (100.0%) | 277 (100.0%) |
| 12 to 14 Years | 117 (100.0%) | 59 (100.0%) |
| 15 Years | 10 (100.0%) | 31 (100.0%) |
| 16 and 17 Years | 60 (75.0%) | 64 (100.0%) |
| 18 to 24 Years | 324 (90.0%) | 287 (100.0%) |
| 25 to 34 Years | 256 (93.4%) | 271 (91.5%) |
| 35 to 44 Years | 393 (99.8%) | 386 (94.8%) |
| 45 to 54 Years | 346 (100.0%) | 339 (100.0%) |
| 55 to 64 Years | 420 (100.0%) | 437 (97.1%) |
| 65 to 74 Years | 280 (94.9%) | 301 (100.0%) |
| 75 Years and over | 71 (100.0%) | 22 (100.0%) |
| Total | 2,677 (96.4%) | 2,607 (96.7%) |
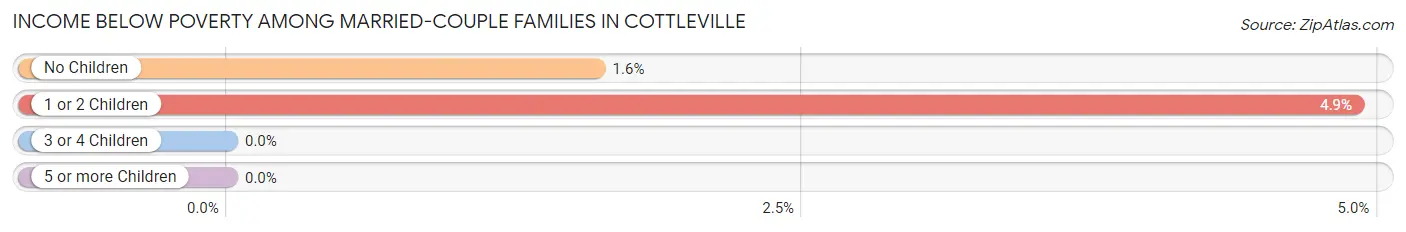
Income Below Poverty Among Married-Couple Families in Cottleville
The poverty statistics for married-couple families in Cottleville show that 2.4% or 31 of the total 1,269 families live below the poverty line. Families with 1 or 2 children have the highest poverty rate of 4.9%, comprising of 18 families. On the other hand, families with 3 or 4 children have the lowest poverty rate of 0.0%, which includes 0 families.
| Children | Above Poverty | Below Poverty |
| No Children | 802 (98.4%) | 13 (1.6%) |
| 1 or 2 Children | 349 (95.1%) | 18 (4.9%) |
| 3 or 4 Children | 63 (100.0%) | 0 (0.0%) |
| 5 or more Children | 24 (100.0%) | 0 (0.0%) |
| Total | 1,238 (97.6%) | 31 (2.4%) |
Income Below Poverty Among Single-Parent Households in Cottleville
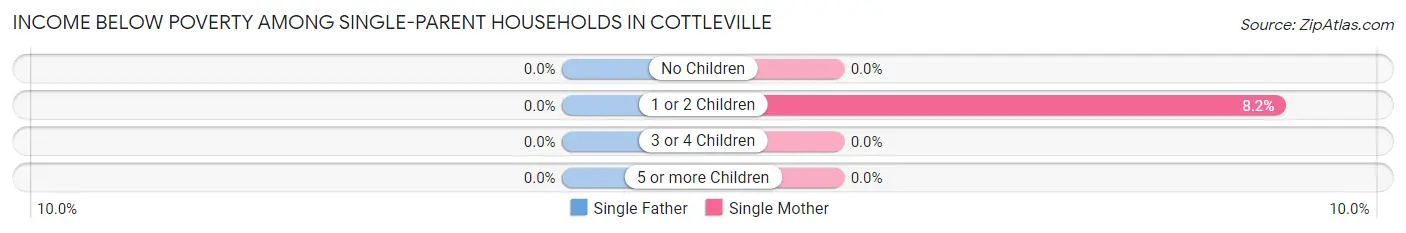
| Children | Single Father | Single Mother |
| No Children | 0 (0.0%) | 0 (0.0%) |
| 1 or 2 Children | 0 (0.0%) | 7 (8.2%) |
| 3 or 4 Children | 0 (0.0%) | 0 (0.0%) |
| 5 or more Children | 0 (0.0%) | 0 (0.0%) |
| Total | 0 (0.0%) | 7 (4.5%) |
Income Below Poverty Among Married-Couple vs Single-Parent Households in Cottleville
The poverty data for Cottleville shows that 31 of the married-couple family households (2.4%) and 7 of the single-parent households (3.0%) are living below the poverty level. Within the married-couple family households, those with 1 or 2 children have the highest poverty rate, with 18 households (4.9%) falling below the poverty line. Among the single-parent households, those with 1 or 2 children have the highest poverty rate, with 7 household (5.1%) living below poverty.
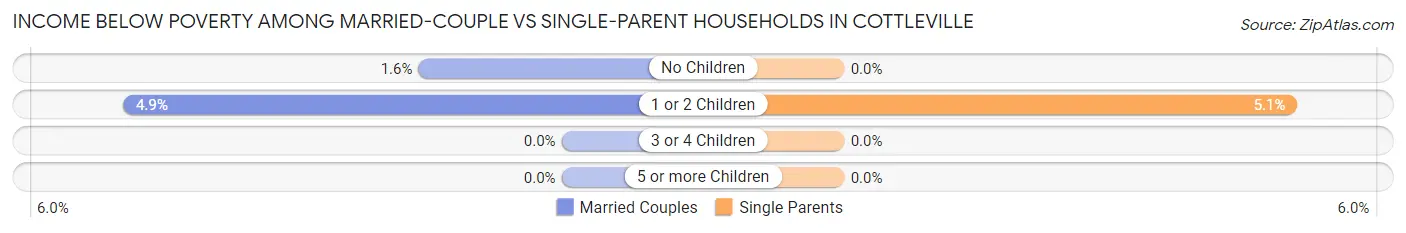
| Children | Married-Couple Families | Single-Parent Households |
| No Children | 13 (1.6%) | 0 (0.0%) |
| 1 or 2 Children | 18 (4.9%) | 7 (5.1%) |
| 3 or 4 Children | 0 (0.0%) | 0 (0.0%) |
| 5 or more Children | 0 (0.0%) | 0 (0.0%) |
| Total | 31 (2.4%) | 7 (3.0%) |
Employment Characteristics in Cottleville
Employment by Class of Employer in Cottleville
Among the 3,405 employed individuals in Cottleville, private company employees (2,389 | 70.2%), not-for-profit organizations (344 | 10.1%), and local government employees (217 | 6.4%) make up the most common classes of employment.
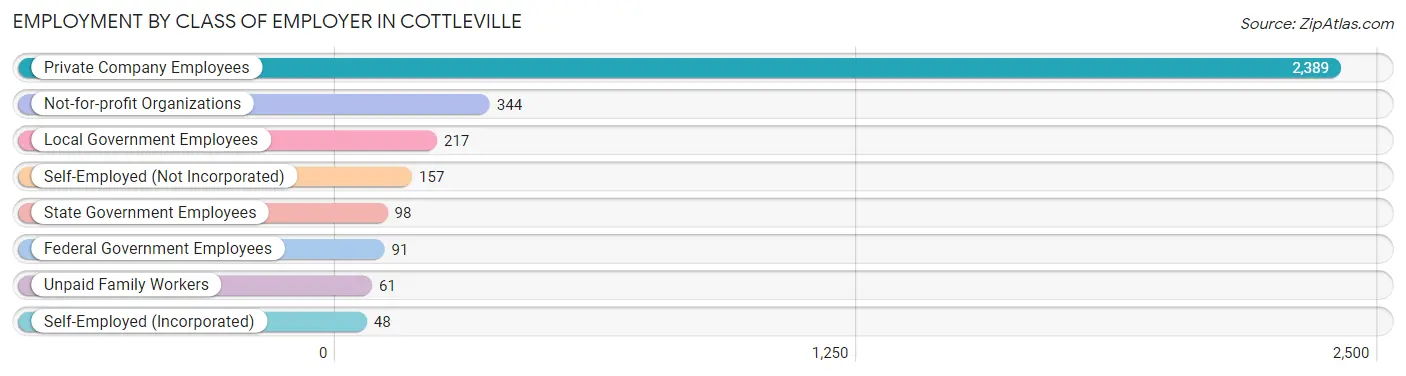
| Employer Class | # Employees | % Employees |
| Private Company Employees | 2,389 | 70.2% |
| Self-Employed (Incorporated) | 48 | 1.4% |
| Self-Employed (Not Incorporated) | 157 | 4.6% |
| Not-for-profit Organizations | 344 | 10.1% |
| Local Government Employees | 217 | 6.4% |
| State Government Employees | 98 | 2.9% |
| Federal Government Employees | 91 | 2.7% |
| Unpaid Family Workers | 61 | 1.8% |
| Total | 3,405 | 100.0% |
Employment Status by Age in Cottleville
According to the labor force statistics for Cottleville, out of the total population over 16 years of age (4,407), 80.3% or 3,539 individuals are in the labor force, with 1.6% or 57 of them unemployed. The age group with the highest labor force participation rate is 30 to 34 years, with 99.0% or 388 individuals in the labor force. Within the labor force, the 25 to 29 years age range has the highest percentage of unemployed individuals, with 6.1% or 10 of them being unemployed.
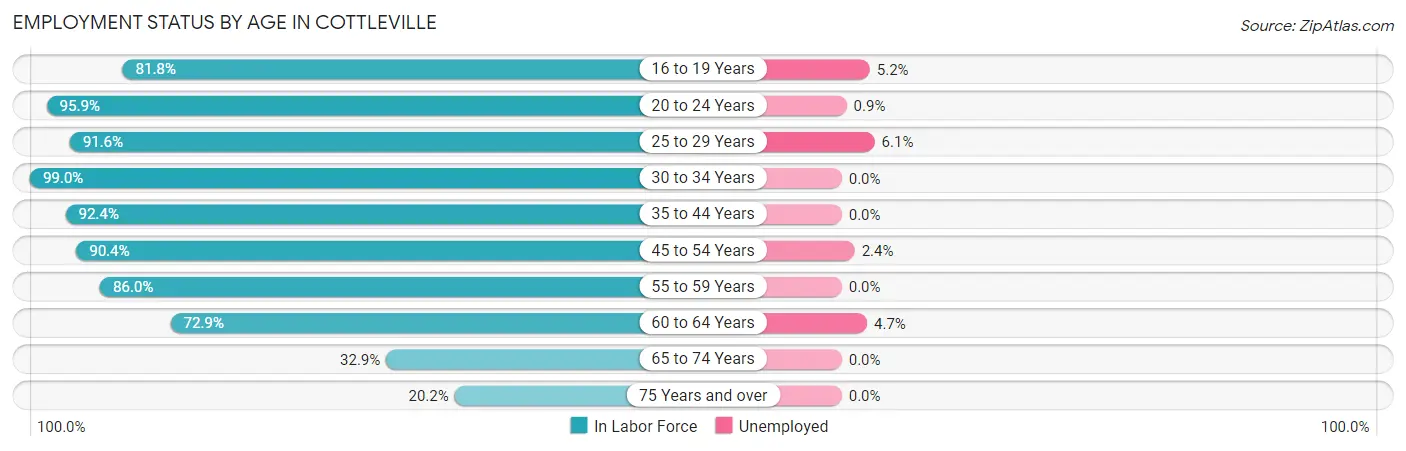
| Age Bracket | In Labor Force | Unemployed |
| 16 to 19 Years | 153 (81.8%) | 8 (5.2%) |
| 20 to 24 Years | 579 (95.9%) | 5 (0.9%) |
| 25 to 29 Years | 163 (91.6%) | 10 (6.1%) |
| 30 to 34 Years | 388 (99.0%) | 0 (0.0%) |
| 35 to 44 Years | 740 (92.4%) | 0 (0.0%) |
| 45 to 54 Years | 619 (90.4%) | 15 (2.4%) |
| 55 to 59 Years | 320 (86.0%) | 0 (0.0%) |
| 60 to 64 Years | 363 (72.9%) | 17 (4.7%) |
| 65 to 74 Years | 196 (32.9%) | 0 (0.0%) |
| 75 Years and over | 19 (20.2%) | 0 (0.0%) |
| Total | 3,539 (80.3%) | 57 (1.6%) |
Employment Status by Educational Attainment in Cottleville
According to labor force statistics for Cottleville, 88.6% of individuals (2,592) out of the total population between 25 and 64 years of age (2,926) are in the labor force, with 1.6% or 41 of them being unemployed. The group with the highest labor force participation rate are those with the educational attainment of less than high school, with 100.0% or 35 individuals in the labor force. Within the labor force, individuals with high school diploma education have the highest percentage of unemployment, with 3.1% or 15 of them being unemployed.
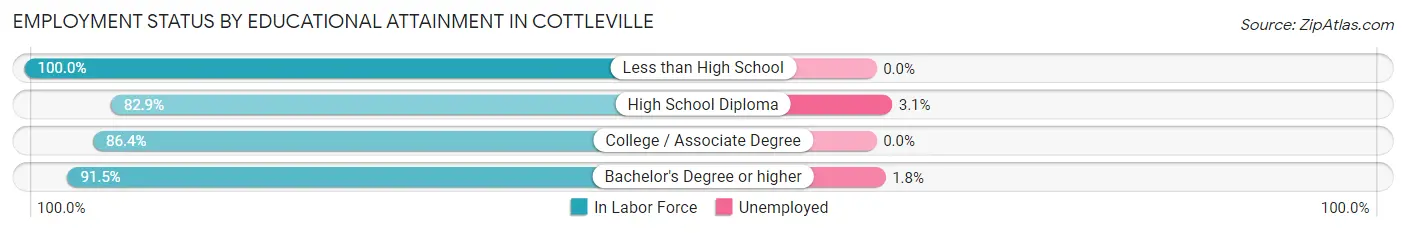
| Educational Attainment | In Labor Force | Unemployed |
| Less than High School | 35 (100.0%) | 0 (0.0%) |
| High School Diploma | 488 (82.9%) | 18 (3.1%) |
| College / Associate Degree | 602 (86.4%) | 0 (0.0%) |
| Bachelor's Degree or higher | 1,469 (91.5%) | 29 (1.8%) |
| Total | 2,592 (88.6%) | 47 (1.6%) |
Employment Occupations by Sex in Cottleville
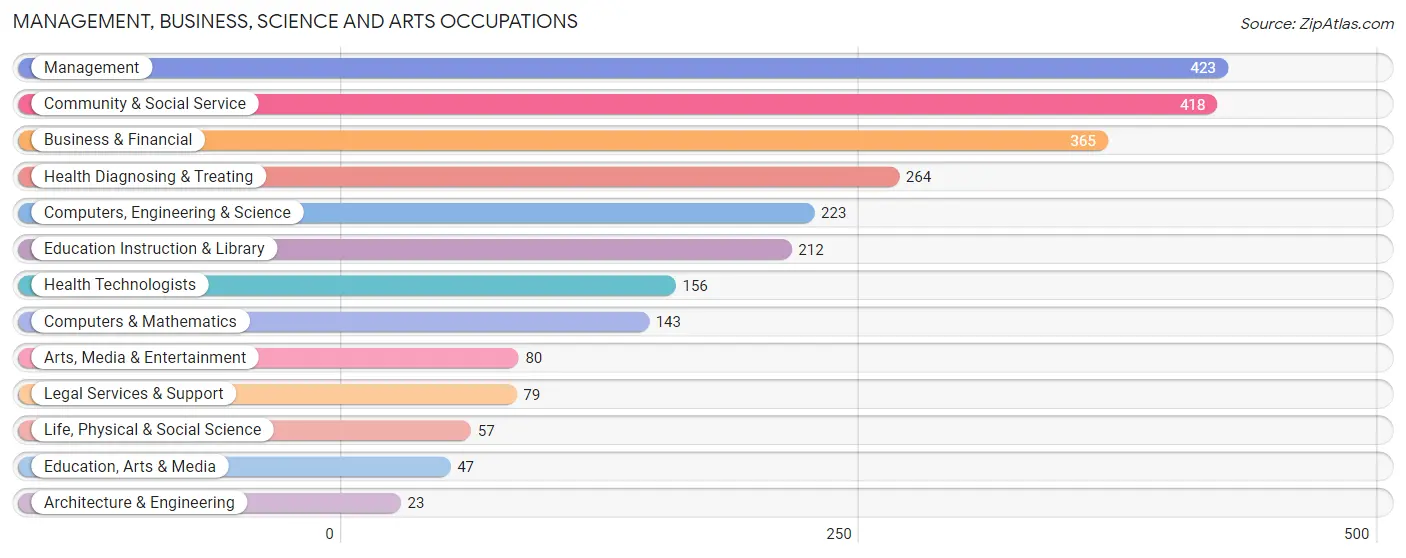
Management, Business, Science and Arts Occupations
The most common Management, Business, Science and Arts occupations in Cottleville are Management (423 | 12.1%), Community & Social Service (418 | 12.0%), Business & Financial (365 | 10.5%), Health Diagnosing & Treating (264 | 7.6%), and Computers, Engineering & Science (223 | 6.4%).
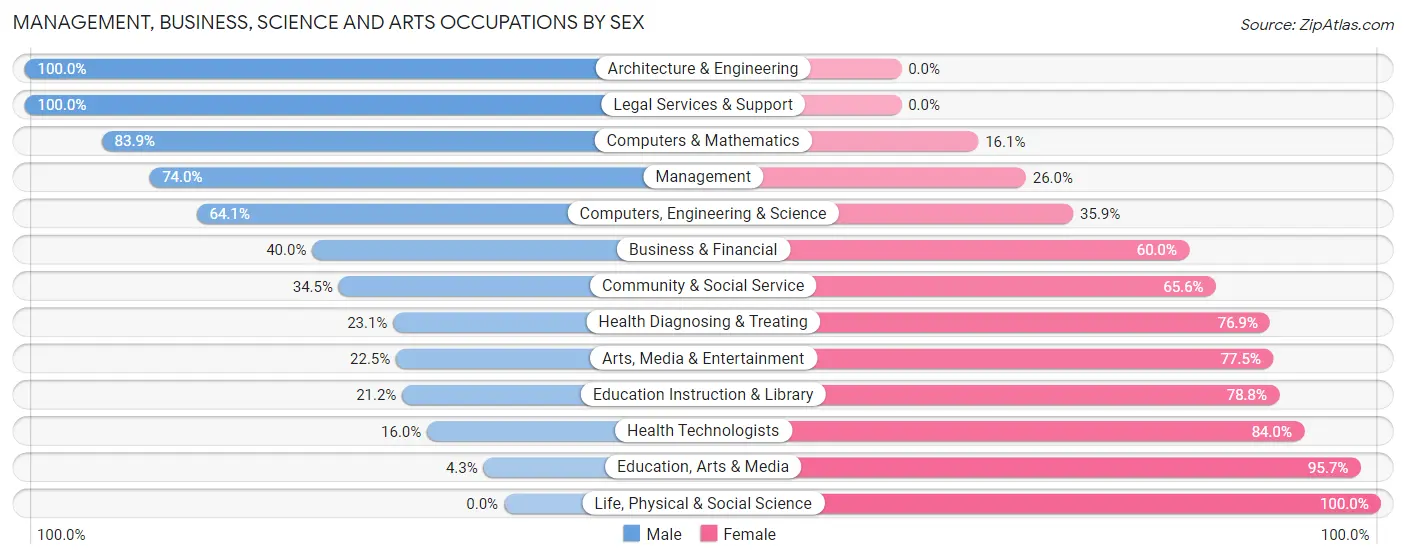
Management, Business, Science and Arts Occupations by Sex
Within the Management, Business, Science and Arts occupations in Cottleville, the most male-oriented occupations are Architecture & Engineering (100.0%), Legal Services & Support (100.0%), and Computers & Mathematics (83.9%), while the most female-oriented occupations are Life, Physical & Social Science (100.0%), Education, Arts & Media (95.7%), and Health Technologists (84.0%).
| Occupation | Male | Female |
| Management | 313 (74.0%) | 110 (26.0%) |
| Business & Financial | 146 (40.0%) | 219 (60.0%) |
| Computers, Engineering & Science | 143 (64.1%) | 80 (35.9%) |
| Computers & Mathematics | 120 (83.9%) | 23 (16.1%) |
| Architecture & Engineering | 23 (100.0%) | 0 (0.0%) |
| Life, Physical & Social Science | 0 (0.0%) | 57 (100.0%) |
| Community & Social Service | 144 (34.4%) | 274 (65.5%) |
| Education, Arts & Media | 2 (4.3%) | 45 (95.7%) |
| Legal Services & Support | 79 (100.0%) | 0 (0.0%) |
| Education Instruction & Library | 45 (21.2%) | 167 (78.8%) |
| Arts, Media & Entertainment | 18 (22.5%) | 62 (77.5%) |
| Health Diagnosing & Treating | 61 (23.1%) | 203 (76.9%) |
| Health Technologists | 25 (16.0%) | 131 (84.0%) |
| Total (Category) | 807 (47.7%) | 886 (52.3%) |
| Total (Overall) | 1,794 (51.5%) | 1,691 (48.5%) |
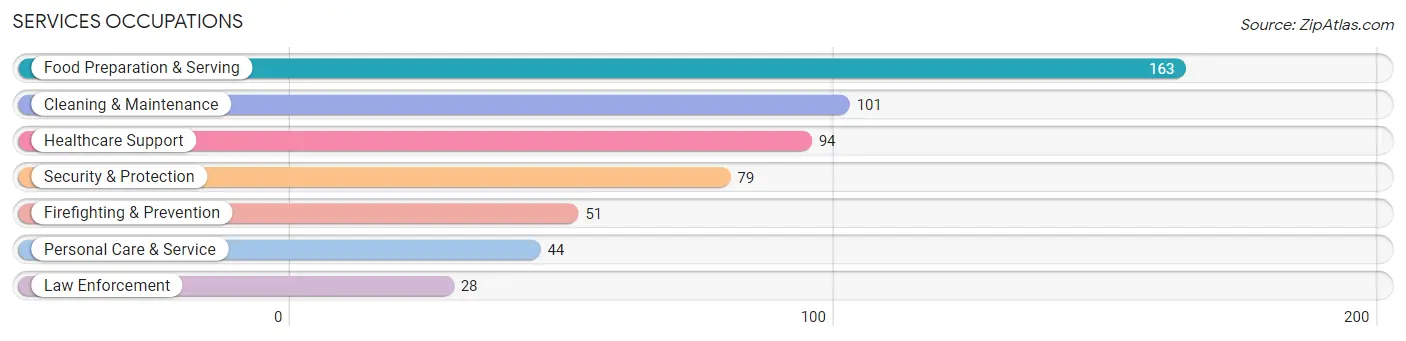
Services Occupations
The most common Services occupations in Cottleville are Food Preparation & Serving (163 | 4.7%), Cleaning & Maintenance (101 | 2.9%), Healthcare Support (94 | 2.7%), Security & Protection (79 | 2.3%), and Firefighting & Prevention (51 | 1.5%).
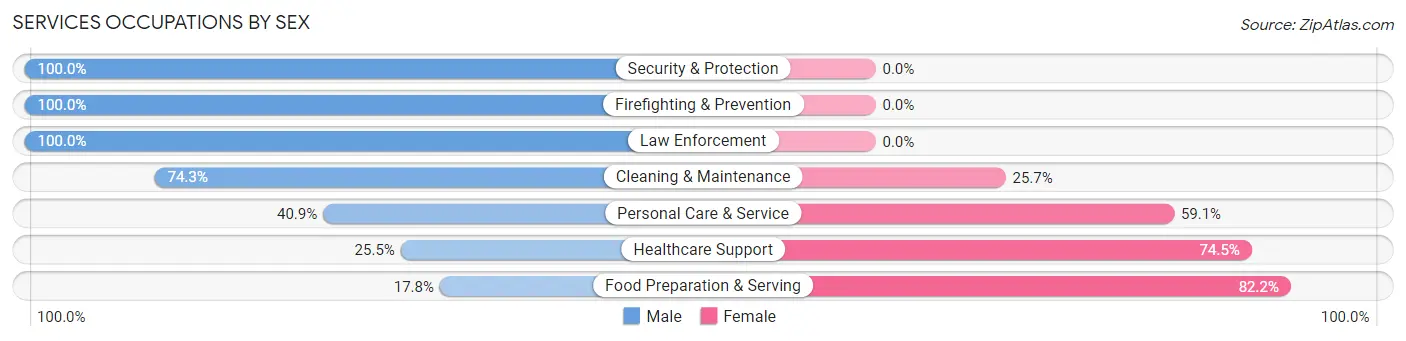
Services Occupations by Sex
Within the Services occupations in Cottleville, the most male-oriented occupations are Security & Protection (100.0%), Firefighting & Prevention (100.0%), and Law Enforcement (100.0%), while the most female-oriented occupations are Food Preparation & Serving (82.2%), Healthcare Support (74.5%), and Personal Care & Service (59.1%).
| Occupation | Male | Female |
| Healthcare Support | 24 (25.5%) | 70 (74.5%) |
| Security & Protection | 79 (100.0%) | 0 (0.0%) |
| Firefighting & Prevention | 51 (100.0%) | 0 (0.0%) |
| Law Enforcement | 28 (100.0%) | 0 (0.0%) |
| Food Preparation & Serving | 29 (17.8%) | 134 (82.2%) |
| Cleaning & Maintenance | 75 (74.3%) | 26 (25.7%) |
| Personal Care & Service | 18 (40.9%) | 26 (59.1%) |
| Total (Category) | 225 (46.8%) | 256 (53.2%) |
| Total (Overall) | 1,794 (51.5%) | 1,691 (48.5%) |
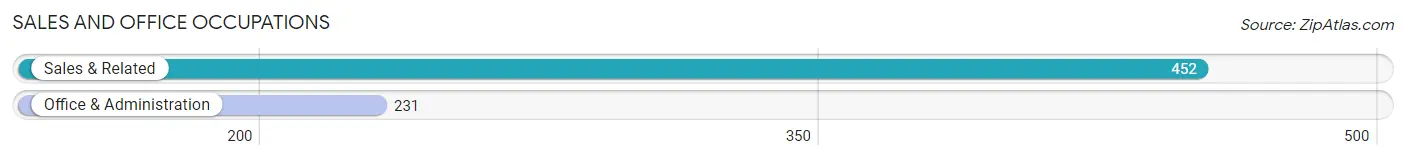
Sales and Office Occupations
The most common Sales and Office occupations in Cottleville are Sales & Related (452 | 13.0%), and Office & Administration (231 | 6.6%).
Sales and Office Occupations by Sex
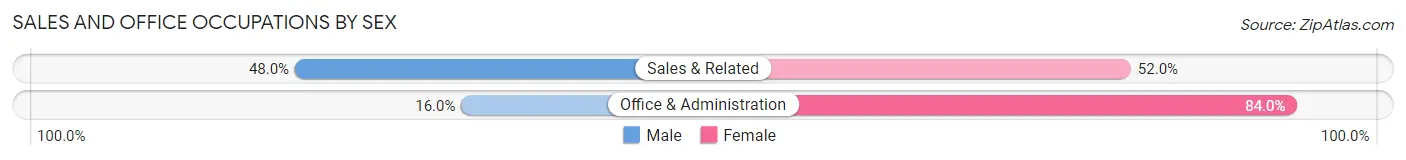
| Occupation | Male | Female |
| Sales & Related | 217 (48.0%) | 235 (52.0%) |
| Office & Administration | 37 (16.0%) | 194 (84.0%) |
| Total (Category) | 254 (37.2%) | 429 (62.8%) |
| Total (Overall) | 1,794 (51.5%) | 1,691 (48.5%) |
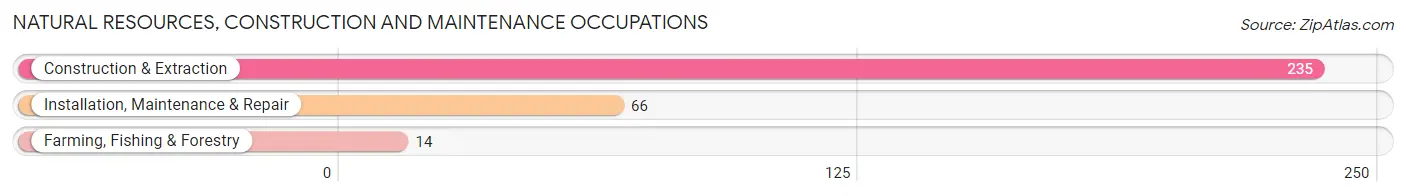
Natural Resources, Construction and Maintenance Occupations
The most common Natural Resources, Construction and Maintenance occupations in Cottleville are Construction & Extraction (235 | 6.7%), Installation, Maintenance & Repair (66 | 1.9%), and Farming, Fishing & Forestry (14 | 0.4%).
Natural Resources, Construction and Maintenance Occupations by Sex
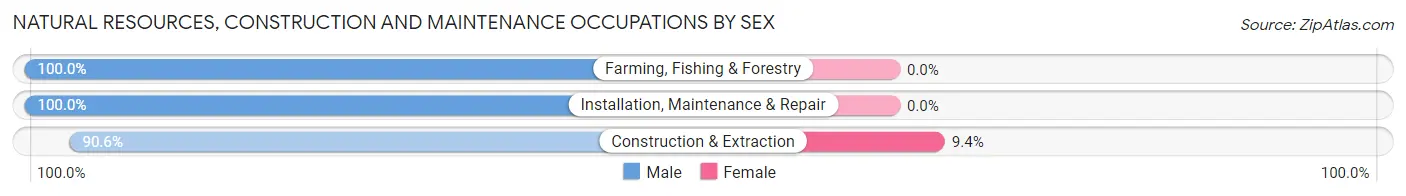
| Occupation | Male | Female |
| Farming, Fishing & Forestry | 14 (100.0%) | 0 (0.0%) |
| Construction & Extraction | 213 (90.6%) | 22 (9.4%) |
| Installation, Maintenance & Repair | 66 (100.0%) | 0 (0.0%) |
| Total (Category) | 293 (93.0%) | 22 (7.0%) |
| Total (Overall) | 1,794 (51.5%) | 1,691 (48.5%) |
Production, Transportation and Moving Occupations
The most common Production, Transportation and Moving occupations in Cottleville are Transportation (155 | 4.4%), Material Moving (96 | 2.8%), and Production (62 | 1.8%).
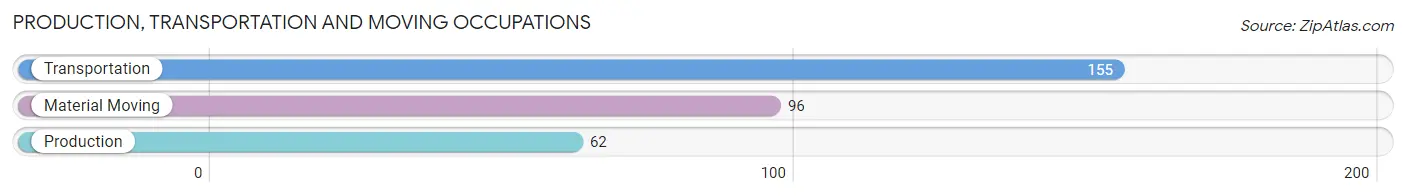
Production, Transportation and Moving Occupations by Sex
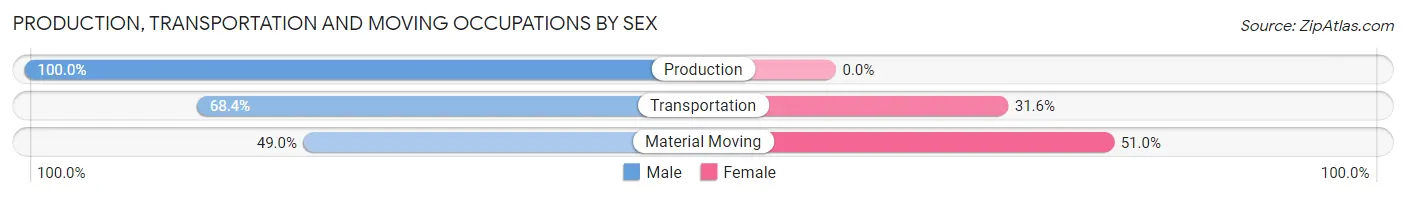
| Occupation | Male | Female |
| Production | 62 (100.0%) | 0 (0.0%) |
| Transportation | 106 (68.4%) | 49 (31.6%) |
| Material Moving | 47 (49.0%) | 49 (51.0%) |
| Total (Category) | 215 (68.7%) | 98 (31.3%) |
| Total (Overall) | 1,794 (51.5%) | 1,691 (48.5%) |
Employment Industries by Sex in Cottleville
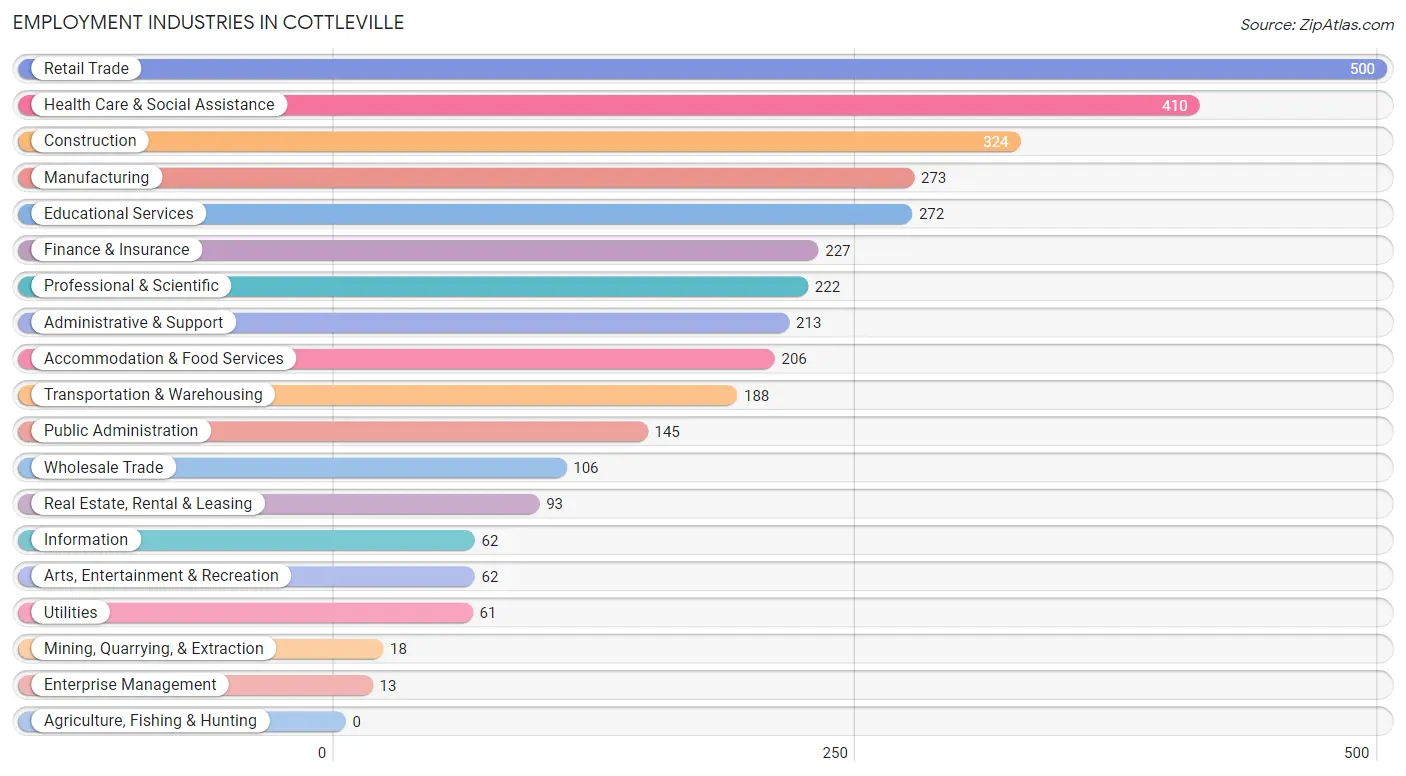
Employment Industries in Cottleville
The major employment industries in Cottleville include Retail Trade (500 | 14.3%), Health Care & Social Assistance (410 | 11.8%), Construction (324 | 9.3%), Manufacturing (273 | 7.8%), and Educational Services (272 | 7.8%).
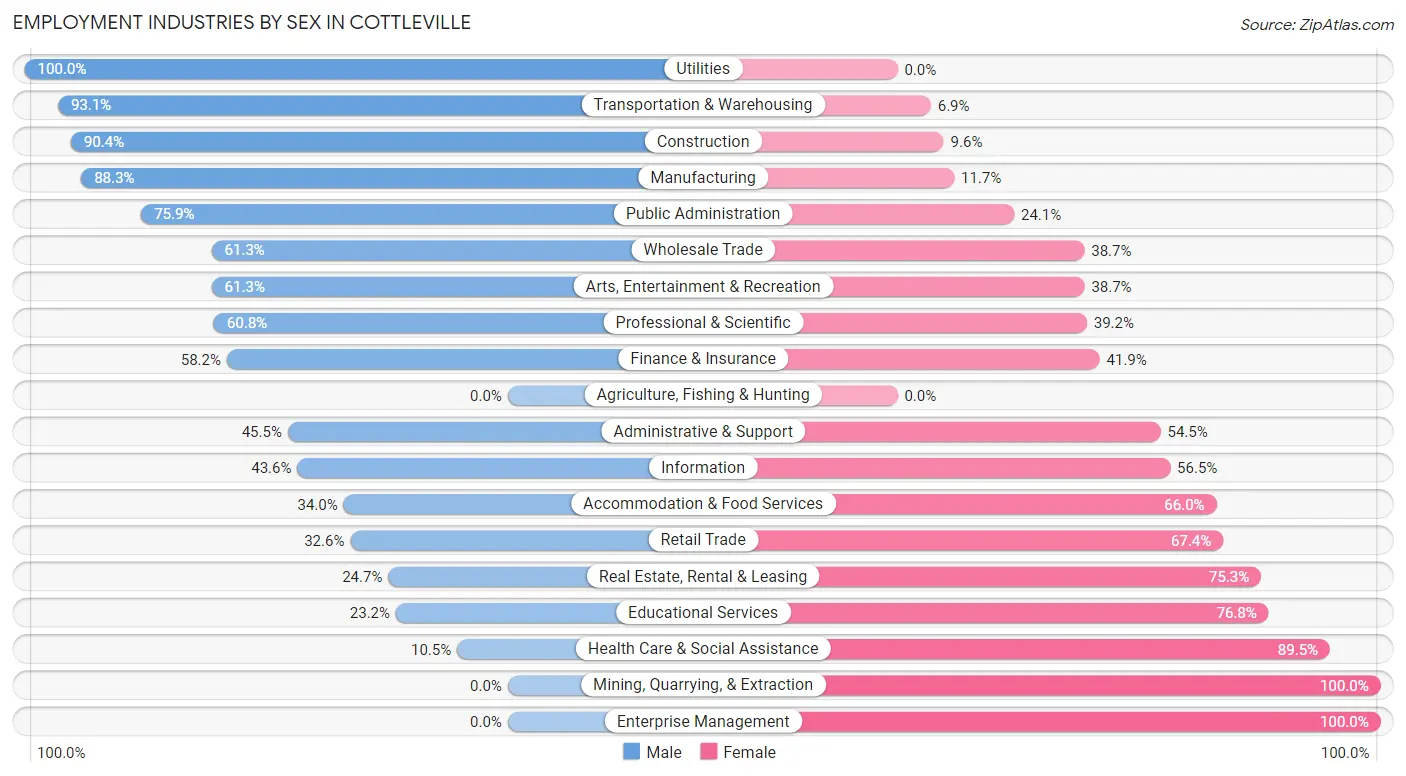
Employment Industries by Sex in Cottleville
The Cottleville industries that see more men than women are Utilities (100.0%), Transportation & Warehousing (93.1%), and Construction (90.4%), whereas the industries that tend to have a higher number of women are Mining, Quarrying, & Extraction (100.0%), Enterprise Management (100.0%), and Health Care & Social Assistance (89.5%).
| Industry | Male | Female |
| Agriculture, Fishing & Hunting | 0 (0.0%) | 0 (0.0%) |
| Mining, Quarrying, & Extraction | 0 (0.0%) | 18 (100.0%) |
| Construction | 293 (90.4%) | 31 (9.6%) |
| Manufacturing | 241 (88.3%) | 32 (11.7%) |
| Wholesale Trade | 65 (61.3%) | 41 (38.7%) |
| Retail Trade | 163 (32.6%) | 337 (67.4%) |
| Transportation & Warehousing | 175 (93.1%) | 13 (6.9%) |
| Utilities | 61 (100.0%) | 0 (0.0%) |
| Information | 27 (43.5%) | 35 (56.5%) |
| Finance & Insurance | 132 (58.2%) | 95 (41.8%) |
| Real Estate, Rental & Leasing | 23 (24.7%) | 70 (75.3%) |
| Professional & Scientific | 135 (60.8%) | 87 (39.2%) |
| Enterprise Management | 0 (0.0%) | 13 (100.0%) |
| Administrative & Support | 97 (45.5%) | 116 (54.5%) |
| Educational Services | 63 (23.2%) | 209 (76.8%) |
| Health Care & Social Assistance | 43 (10.5%) | 367 (89.5%) |
| Arts, Entertainment & Recreation | 38 (61.3%) | 24 (38.7%) |
| Accommodation & Food Services | 70 (34.0%) | 136 (66.0%) |
| Public Administration | 110 (75.9%) | 35 (24.1%) |
| Total | 1,794 (51.5%) | 1,691 (48.5%) |
Education in Cottleville
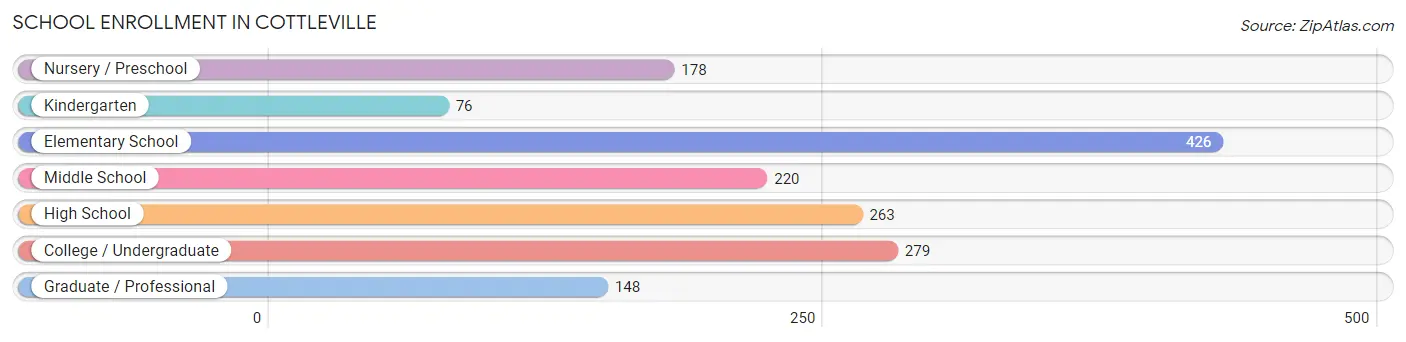
School Enrollment in Cottleville
The most common levels of schooling among the 1,590 students in Cottleville are elementary school (426 | 26.8%), college / undergraduate (279 | 17.5%), and high school (263 | 16.5%).
| School Level | # Students | % Students |
| Nursery / Preschool | 178 | 11.2% |
| Kindergarten | 76 | 4.8% |
| Elementary School | 426 | 26.8% |
| Middle School | 220 | 13.8% |
| High School | 263 | 16.5% |
| College / Undergraduate | 279 | 17.5% |
| Graduate / Professional | 148 | 9.3% |
| Total | 1,590 | 100.0% |
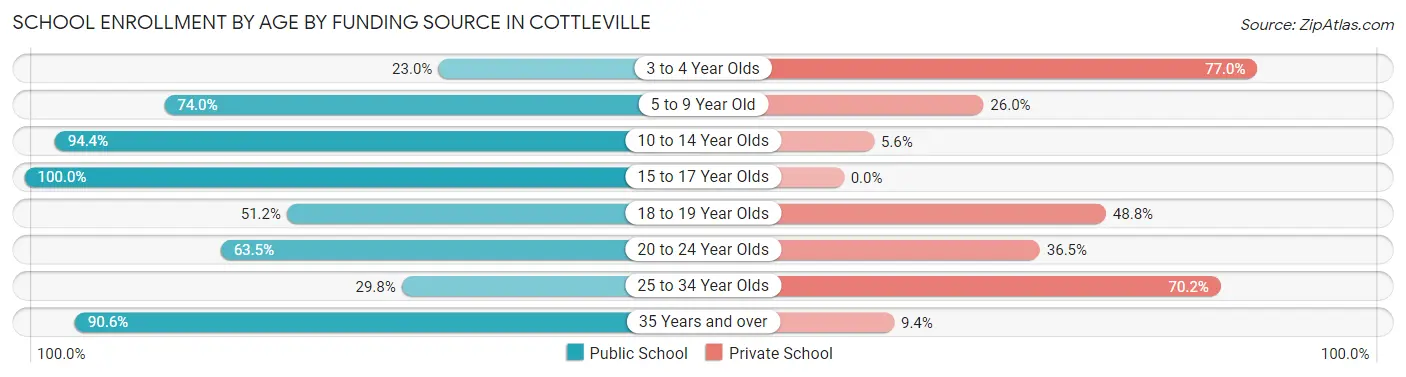
School Enrollment by Age by Funding Source in Cottleville
Out of a total of 1,590 students who are enrolled in schools in Cottleville, 398 (25.0%) attend a private institution, while the remaining 1,192 (75.0%) are enrolled in public schools. The age group of 3 to 4 year olds has the highest likelihood of being enrolled in private schools, with 57 (77.0% in the age bracket) enrolled. Conversely, the age group of 15 to 17 year olds has the lowest likelihood of being enrolled in a private school, with 176 (100.0% in the age bracket) attending a public institution.
| Age Bracket | Public School | Private School |
| 3 to 4 Year Olds | 17 (23.0%) | 57 (77.0%) |
| 5 to 9 Year Old | 429 (74.0%) | 151 (26.0%) |
| 10 to 14 Year Olds | 301 (94.4%) | 18 (5.6%) |
| 15 to 17 Year Olds | 176 (100.0%) | 0 (0.0%) |
| 18 to 19 Year Olds | 22 (51.2%) | 21 (48.8%) |
| 20 to 24 Year Olds | 132 (63.5%) | 76 (36.5%) |
| 25 to 34 Year Olds | 28 (29.8%) | 66 (70.2%) |
| 35 Years and over | 87 (90.6%) | 9 (9.4%) |
| Total | 1,192 (75.0%) | 398 (25.0%) |
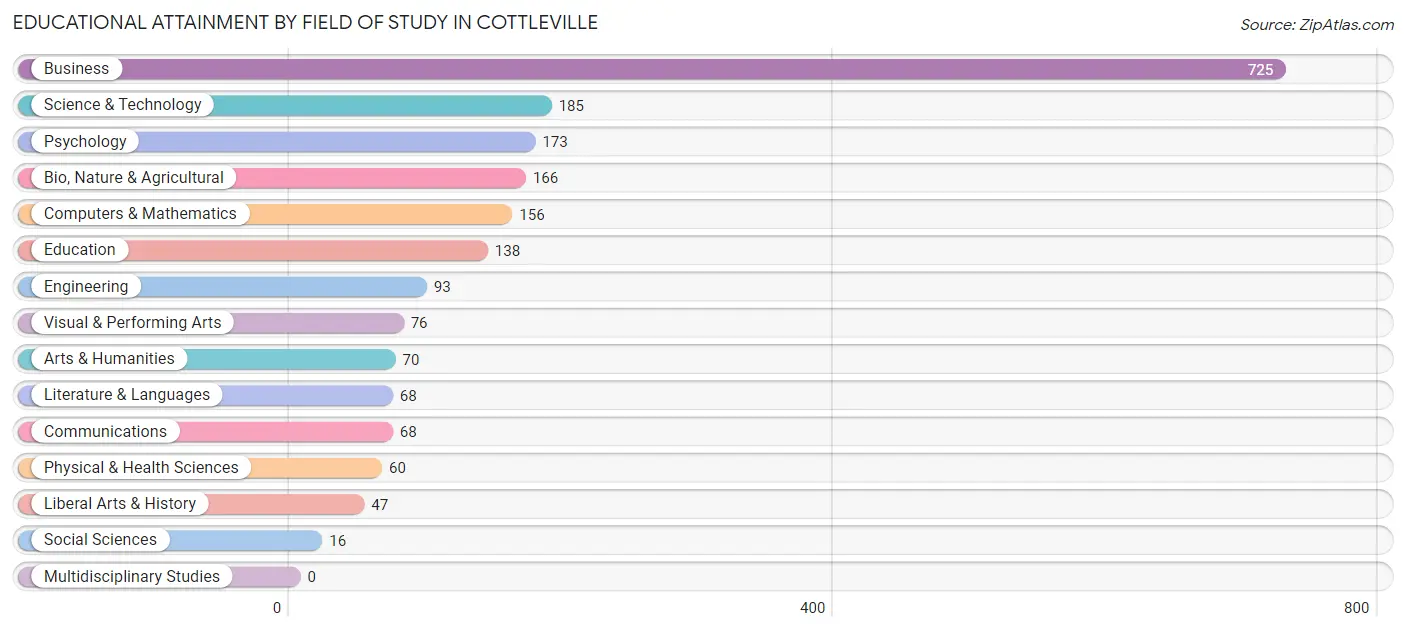
Educational Attainment by Field of Study in Cottleville
Business (725 | 35.5%), science & technology (185 | 9.1%), psychology (173 | 8.5%), bio, nature & agricultural (166 | 8.1%), and computers & mathematics (156 | 7.6%) are the most common fields of study among 2,041 individuals in Cottleville who have obtained a bachelor's degree or higher.
| Field of Study | # Graduates | % Graduates |
| Computers & Mathematics | 156 | 7.6% |
| Bio, Nature & Agricultural | 166 | 8.1% |
| Physical & Health Sciences | 60 | 2.9% |
| Psychology | 173 | 8.5% |
| Social Sciences | 16 | 0.8% |
| Engineering | 93 | 4.6% |
| Multidisciplinary Studies | 0 | 0.0% |
| Science & Technology | 185 | 9.1% |
| Business | 725 | 35.5% |
| Education | 138 | 6.8% |
| Literature & Languages | 68 | 3.3% |
| Liberal Arts & History | 47 | 2.3% |
| Visual & Performing Arts | 76 | 3.7% |
| Communications | 68 | 3.3% |
| Arts & Humanities | 70 | 3.4% |
| Total | 2,041 | 100.0% |
Transportation & Commute in Cottleville
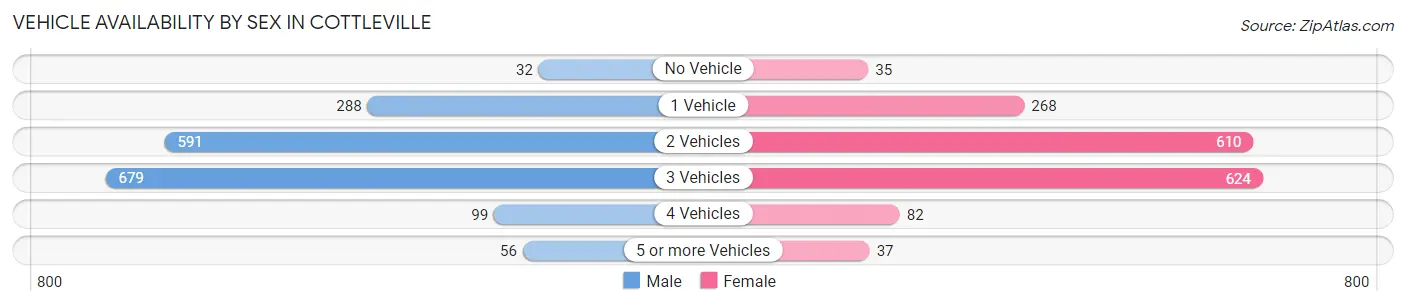
Vehicle Availability by Sex in Cottleville
The most prevalent vehicle ownership categories in Cottleville are males with 3 vehicles (679, accounting for 38.9%) and females with 3 vehicles (624, making up 41.0%).
| Vehicles Available | Male | Female |
| No Vehicle | 32 (1.8%) | 35 (2.1%) |
| 1 Vehicle | 288 (16.5%) | 268 (16.2%) |
| 2 Vehicles | 591 (33.9%) | 610 (36.8%) |
| 3 Vehicles | 679 (38.9%) | 624 (37.7%) |
| 4 Vehicles | 99 (5.7%) | 82 (5.0%) |
| 5 or more Vehicles | 56 (3.2%) | 37 (2.2%) |
| Total | 1,745 (100.0%) | 1,656 (100.0%) |
Commute Time in Cottleville
The most frequently occuring commute durations in Cottleville are 15 to 19 minutes (559 commuters, 19.0%), 30 to 34 minutes (501 commuters, 17.1%), and 20 to 24 minutes (467 commuters, 15.9%).
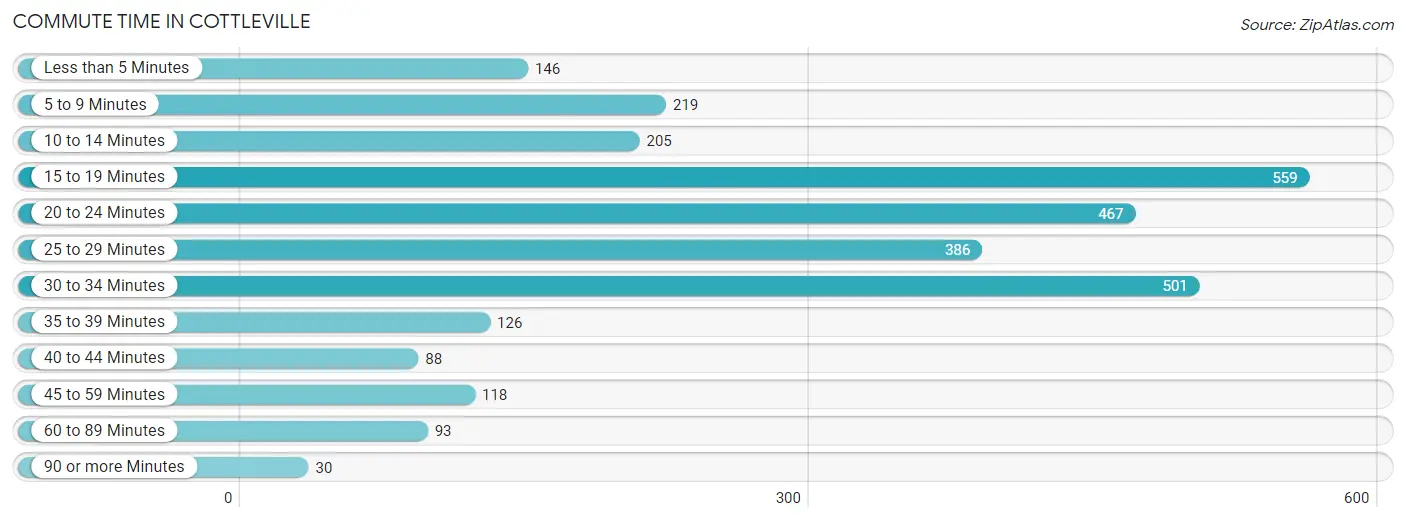
| Commute Time | # Commuters | % Commuters |
| Less than 5 Minutes | 146 | 5.0% |
| 5 to 9 Minutes | 219 | 7.4% |
| 10 to 14 Minutes | 205 | 7.0% |
| 15 to 19 Minutes | 559 | 19.0% |
| 20 to 24 Minutes | 467 | 15.9% |
| 25 to 29 Minutes | 386 | 13.1% |
| 30 to 34 Minutes | 501 | 17.1% |
| 35 to 39 Minutes | 126 | 4.3% |
| 40 to 44 Minutes | 88 | 3.0% |
| 45 to 59 Minutes | 118 | 4.0% |
| 60 to 89 Minutes | 93 | 3.2% |
| 90 or more Minutes | 30 | 1.0% |
Commute Time by Sex in Cottleville
The most common commute times in Cottleville are 30 to 34 minutes (331 commuters, 22.1%) for males and 15 to 19 minutes (327 commuters, 22.8%) for females.
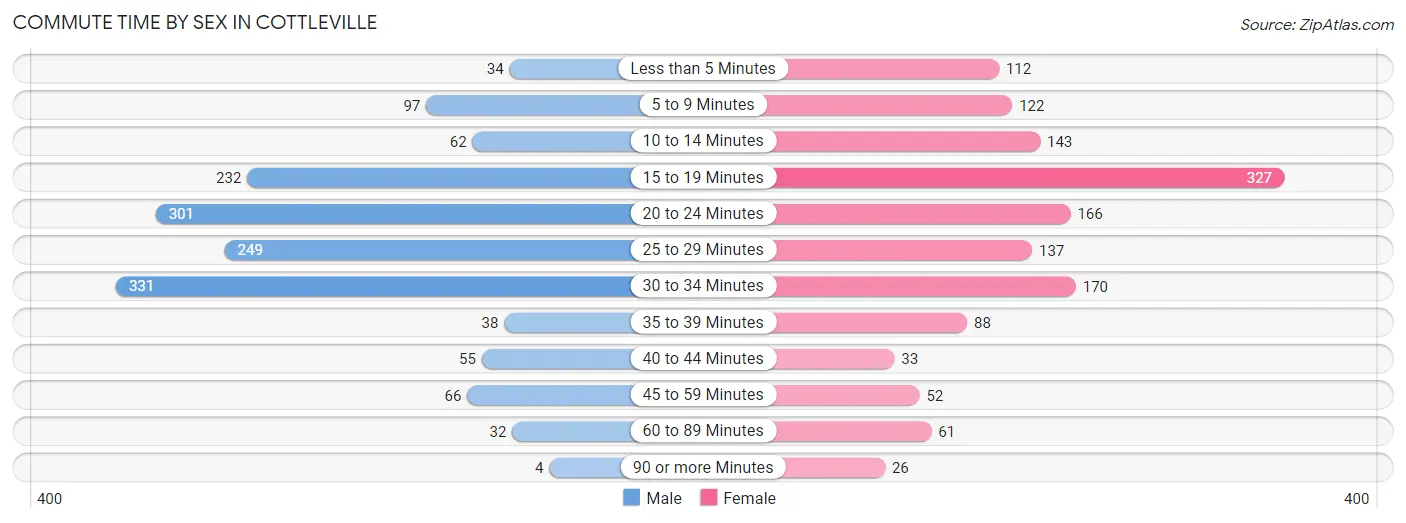
| Commute Time | Male | Female |
| Less than 5 Minutes | 34 (2.3%) | 112 (7.8%) |
| 5 to 9 Minutes | 97 (6.5%) | 122 (8.5%) |
| 10 to 14 Minutes | 62 (4.1%) | 143 (10.0%) |
| 15 to 19 Minutes | 232 (15.5%) | 327 (22.8%) |
| 20 to 24 Minutes | 301 (20.1%) | 166 (11.6%) |
| 25 to 29 Minutes | 249 (16.6%) | 137 (9.5%) |
| 30 to 34 Minutes | 331 (22.1%) | 170 (11.8%) |
| 35 to 39 Minutes | 38 (2.5%) | 88 (6.1%) |
| 40 to 44 Minutes | 55 (3.7%) | 33 (2.3%) |
| 45 to 59 Minutes | 66 (4.4%) | 52 (3.6%) |
| 60 to 89 Minutes | 32 (2.1%) | 61 (4.2%) |
| 90 or more Minutes | 4 (0.3%) | 26 (1.8%) |
Time of Departure to Work by Sex in Cottleville
The most frequent times of departure to work in Cottleville are 7:00 AM to 7:29 AM (307, 20.4%) for males and 4:00 PM to 11:59 PM (336, 23.4%) for females.
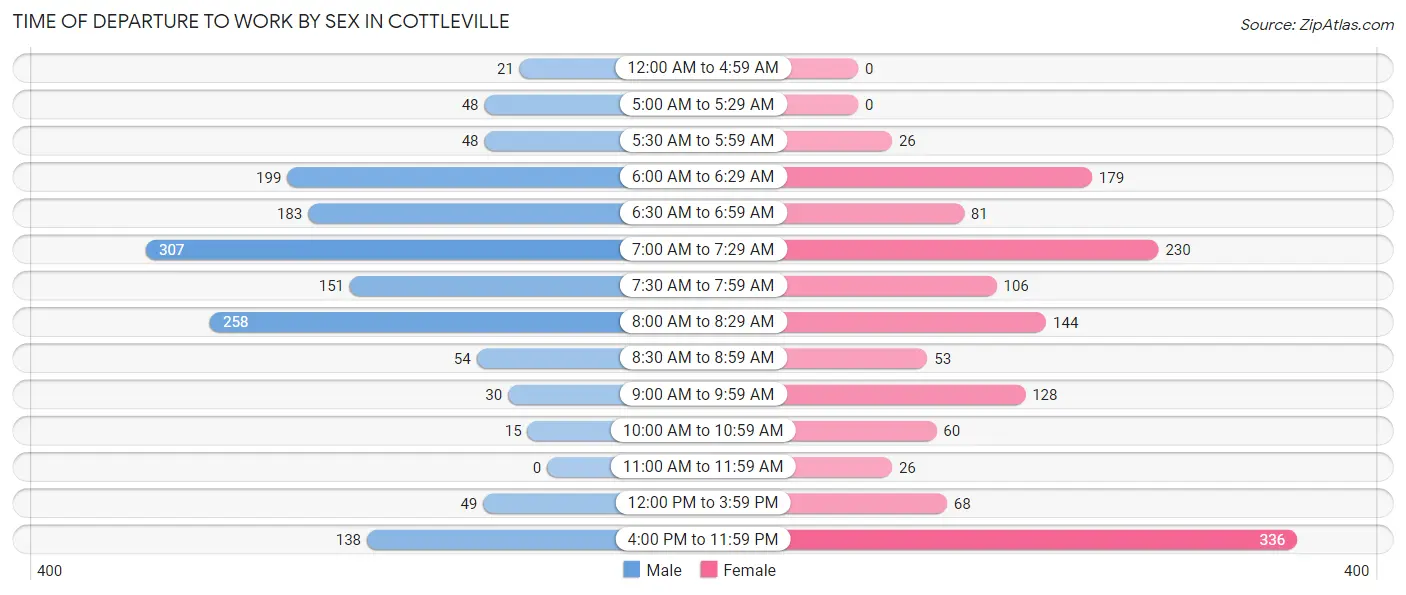
| Time of Departure | Male | Female |
| 12:00 AM to 4:59 AM | 21 (1.4%) | 0 (0.0%) |
| 5:00 AM to 5:29 AM | 48 (3.2%) | 0 (0.0%) |
| 5:30 AM to 5:59 AM | 48 (3.2%) | 26 (1.8%) |
| 6:00 AM to 6:29 AM | 199 (13.3%) | 179 (12.5%) |
| 6:30 AM to 6:59 AM | 183 (12.2%) | 81 (5.6%) |
| 7:00 AM to 7:29 AM | 307 (20.4%) | 230 (16.0%) |
| 7:30 AM to 7:59 AM | 151 (10.1%) | 106 (7.4%) |
| 8:00 AM to 8:29 AM | 258 (17.2%) | 144 (10.0%) |
| 8:30 AM to 8:59 AM | 54 (3.6%) | 53 (3.7%) |
| 9:00 AM to 9:59 AM | 30 (2.0%) | 128 (8.9%) |
| 10:00 AM to 10:59 AM | 15 (1.0%) | 60 (4.2%) |
| 11:00 AM to 11:59 AM | 0 (0.0%) | 26 (1.8%) |
| 12:00 PM to 3:59 PM | 49 (3.3%) | 68 (4.7%) |
| 4:00 PM to 11:59 PM | 138 (9.2%) | 336 (23.4%) |
| Total | 1,501 (100.0%) | 1,437 (100.0%) |
Housing Occupancy in Cottleville
Occupancy by Ownership in Cottleville
Of the total 1,997 dwellings in Cottleville, owner-occupied units account for 1,669 (83.6%), while renter-occupied units make up 328 (16.4%).
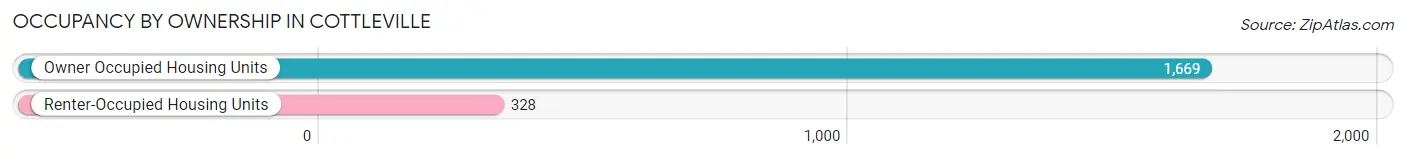
| Occupancy | # Housing Units | % Housing Units |
| Owner Occupied Housing Units | 1,669 | 83.6% |
| Renter-Occupied Housing Units | 328 | 16.4% |
| Total Occupied Housing Units | 1,997 | 100.0% |
Occupancy by Household Size in Cottleville
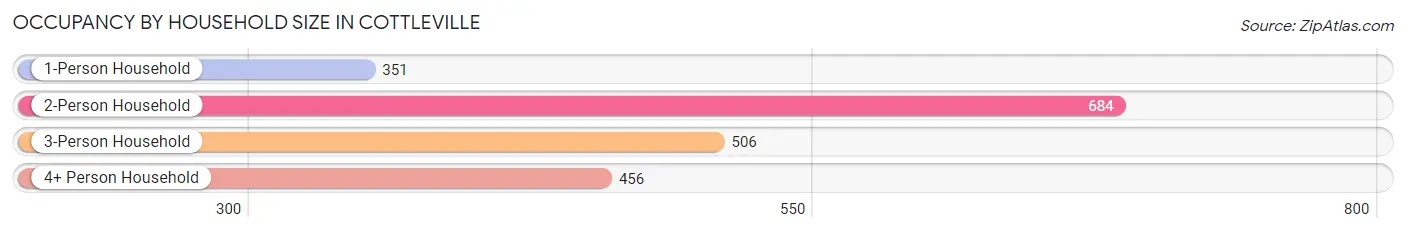
| Household Size | # Housing Units | % Housing Units |
| 1-Person Household | 351 | 17.6% |
| 2-Person Household | 684 | 34.3% |
| 3-Person Household | 506 | 25.3% |
| 4+ Person Household | 456 | 22.8% |
| Total Housing Units | 1,997 | 100.0% |
Occupancy by Ownership by Household Size in Cottleville
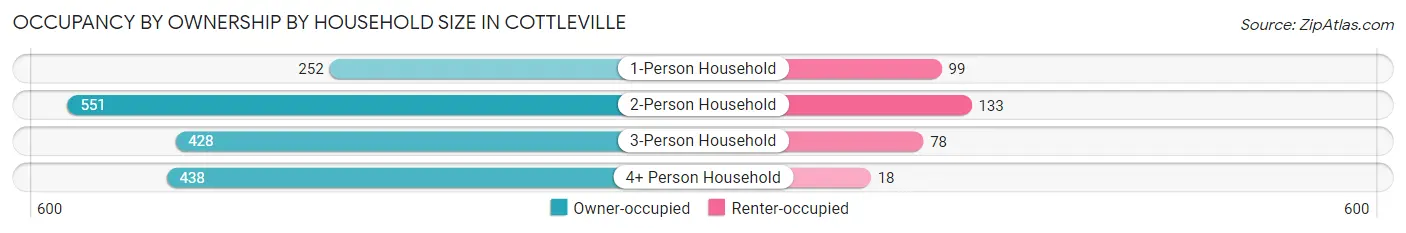
| Household Size | Owner-occupied | Renter-occupied |
| 1-Person Household | 252 (71.8%) | 99 (28.2%) |
| 2-Person Household | 551 (80.6%) | 133 (19.4%) |
| 3-Person Household | 428 (84.6%) | 78 (15.4%) |
| 4+ Person Household | 438 (96.1%) | 18 (4.0%) |
| Total Housing Units | 1,669 (83.6%) | 328 (16.4%) |
Occupancy by Educational Attainment in Cottleville
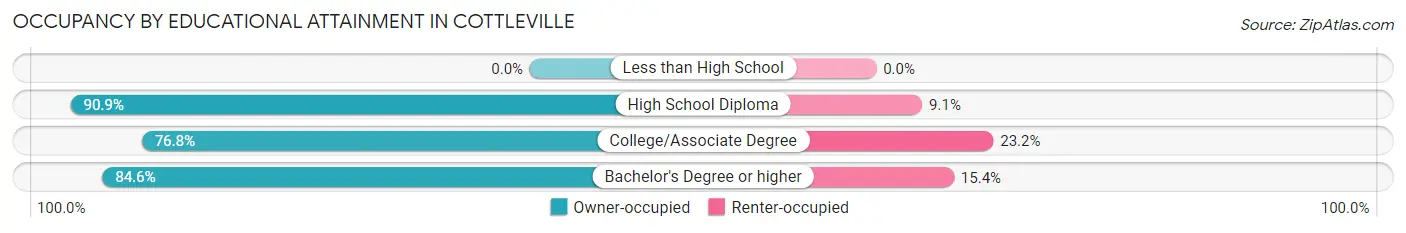
| Household Size | Owner-occupied | Renter-occupied |
| Less than High School | 0 (0.0%) | 0 (0.0%) |
| High School Diploma | 329 (90.9%) | 33 (9.1%) |
| College/Associate Degree | 423 (76.8%) | 128 (23.2%) |
| Bachelor's Degree or higher | 917 (84.6%) | 167 (15.4%) |
Occupancy by Age of Householder in Cottleville
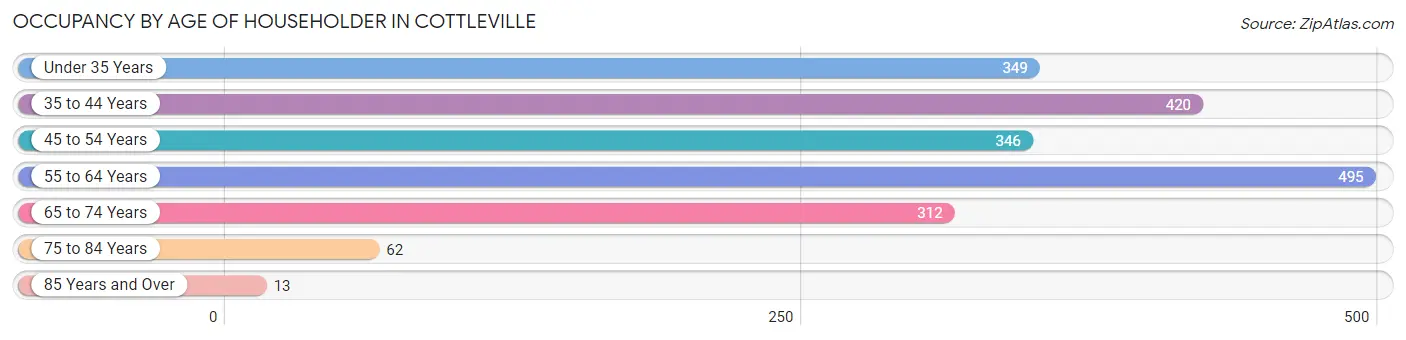
| Age Bracket | # Households | % Households |
| Under 35 Years | 349 | 17.5% |
| 35 to 44 Years | 420 | 21.0% |
| 45 to 54 Years | 346 | 17.3% |
| 55 to 64 Years | 495 | 24.8% |
| 65 to 74 Years | 312 | 15.6% |
| 75 to 84 Years | 62 | 3.1% |
| 85 Years and Over | 13 | 0.6% |
| Total | 1,997 | 100.0% |
Housing Finances in Cottleville
Median Income by Occupancy in Cottleville
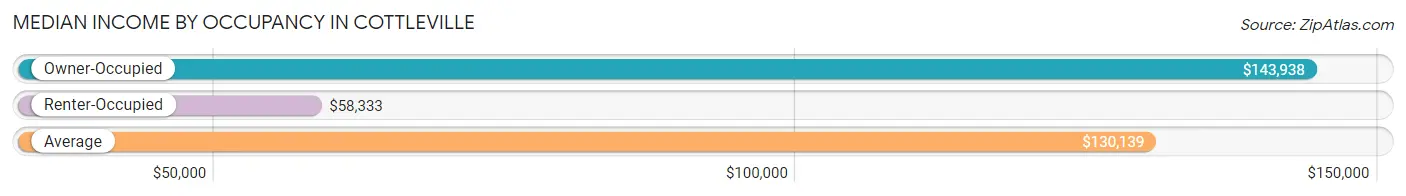
| Occupancy Type | # Households | Median Income |
| Owner-Occupied | 1,669 (83.6%) | $143,938 |
| Renter-Occupied | 328 (16.4%) | $58,333 |
| Average | 1,997 (100.0%) | $130,139 |
Occupancy by Householder Income Bracket in Cottleville
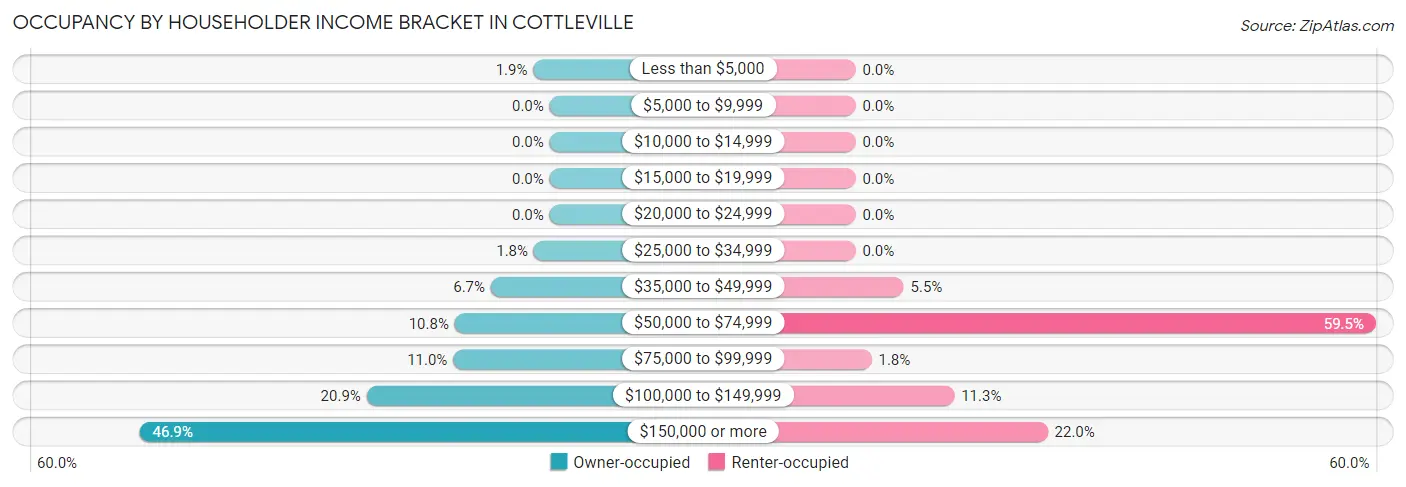
| Income Bracket | Owner-occupied | Renter-occupied |
| Less than $5,000 | 31 (1.9%) | 0 (0.0%) |
| $5,000 to $9,999 | 0 (0.0%) | 0 (0.0%) |
| $10,000 to $14,999 | 0 (0.0%) | 0 (0.0%) |
| $15,000 to $19,999 | 0 (0.0%) | 0 (0.0%) |
| $20,000 to $24,999 | 0 (0.0%) | 0 (0.0%) |
| $25,000 to $34,999 | 30 (1.8%) | 0 (0.0%) |
| $35,000 to $49,999 | 112 (6.7%) | 18 (5.5%) |
| $50,000 to $74,999 | 181 (10.8%) | 195 (59.5%) |
| $75,000 to $99,999 | 184 (11.0%) | 6 (1.8%) |
| $100,000 to $149,999 | 349 (20.9%) | 37 (11.3%) |
| $150,000 or more | 782 (46.9%) | 72 (22.0%) |
| Total | 1,669 (100.0%) | 328 (100.0%) |
Monthly Housing Cost Tiers in Cottleville
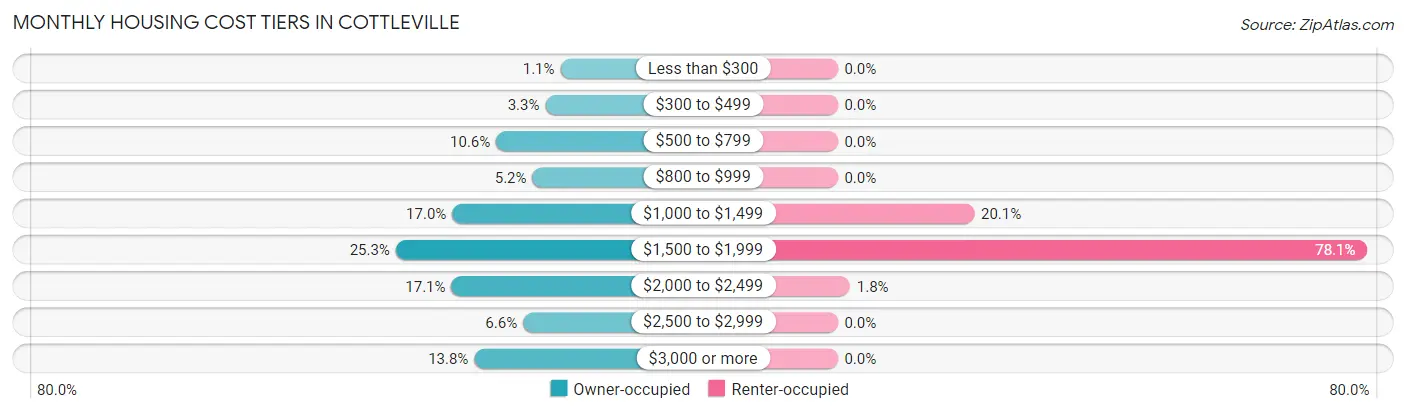
| Monthly Cost | Owner-occupied | Renter-occupied |
| Less than $300 | 18 (1.1%) | 0 (0.0%) |
| $300 to $499 | 55 (3.3%) | 0 (0.0%) |
| $500 to $799 | 176 (10.5%) | 0 (0.0%) |
| $800 to $999 | 87 (5.2%) | 0 (0.0%) |
| $1,000 to $1,499 | 284 (17.0%) | 66 (20.1%) |
| $1,500 to $1,999 | 423 (25.3%) | 256 (78.0%) |
| $2,000 to $2,499 | 286 (17.1%) | 6 (1.8%) |
| $2,500 to $2,999 | 110 (6.6%) | 0 (0.0%) |
| $3,000 or more | 230 (13.8%) | 0 (0.0%) |
| Total | 1,669 (100.0%) | 328 (100.0%) |
Physical Housing Characteristics in Cottleville
Housing Structures in Cottleville
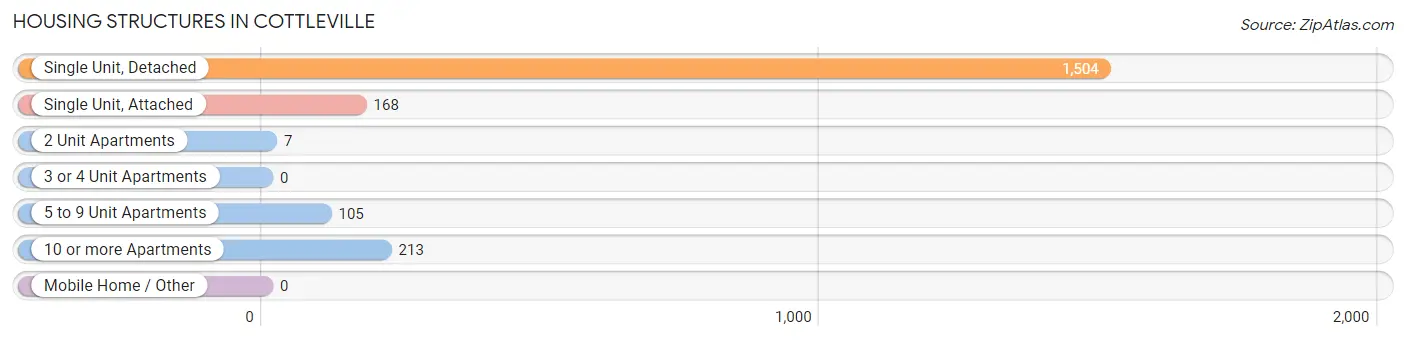
| Structure Type | # Housing Units | % Housing Units |
| Single Unit, Detached | 1,504 | 75.3% |
| Single Unit, Attached | 168 | 8.4% |
| 2 Unit Apartments | 7 | 0.4% |
| 3 or 4 Unit Apartments | 0 | 0.0% |
| 5 to 9 Unit Apartments | 105 | 5.3% |
| 10 or more Apartments | 213 | 10.7% |
| Mobile Home / Other | 0 | 0.0% |
| Total | 1,997 | 100.0% |
Housing Structures by Occupancy in Cottleville
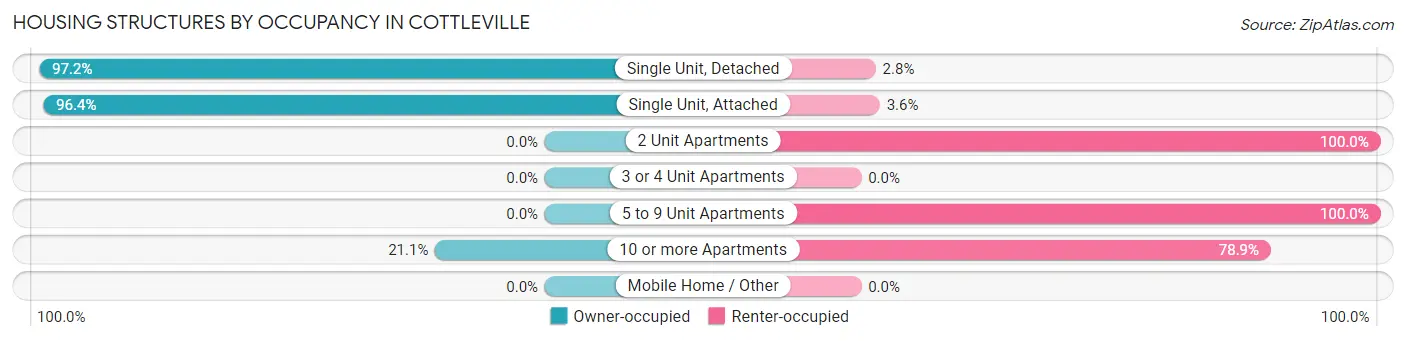
| Structure Type | Owner-occupied | Renter-occupied |
| Single Unit, Detached | 1,462 (97.2%) | 42 (2.8%) |
| Single Unit, Attached | 162 (96.4%) | 6 (3.6%) |
| 2 Unit Apartments | 0 (0.0%) | 7 (100.0%) |
| 3 or 4 Unit Apartments | 0 (0.0%) | 0 (0.0%) |
| 5 to 9 Unit Apartments | 0 (0.0%) | 105 (100.0%) |
| 10 or more Apartments | 45 (21.1%) | 168 (78.9%) |
| Mobile Home / Other | 0 (0.0%) | 0 (0.0%) |
| Total | 1,669 (83.6%) | 328 (16.4%) |
Housing Structures by Number of Rooms in Cottleville
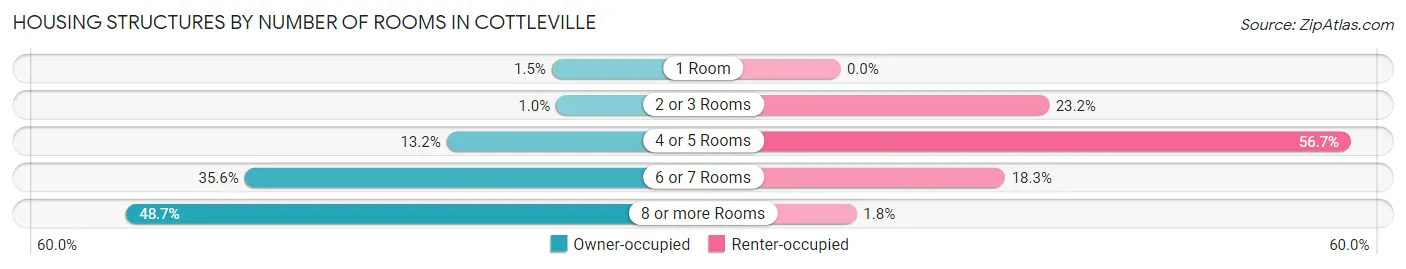
| Number of Rooms | Owner-occupied | Renter-occupied |
| 1 Room | 25 (1.5%) | 0 (0.0%) |
| 2 or 3 Rooms | 17 (1.0%) | 76 (23.2%) |
| 4 or 5 Rooms | 220 (13.2%) | 186 (56.7%) |
| 6 or 7 Rooms | 594 (35.6%) | 60 (18.3%) |
| 8 or more Rooms | 813 (48.7%) | 6 (1.8%) |
| Total | 1,669 (100.0%) | 328 (100.0%) |
Housing Structure by Heating Type in Cottleville
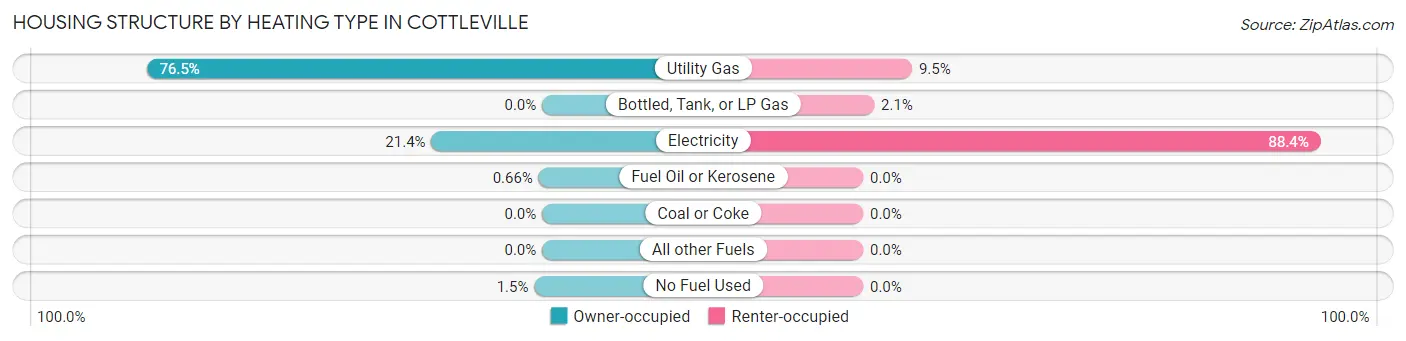
| Heating Type | Owner-occupied | Renter-occupied |
| Utility Gas | 1,276 (76.4%) | 31 (9.5%) |
| Bottled, Tank, or LP Gas | 0 (0.0%) | 7 (2.1%) |
| Electricity | 357 (21.4%) | 290 (88.4%) |
| Fuel Oil or Kerosene | 11 (0.7%) | 0 (0.0%) |
| Coal or Coke | 0 (0.0%) | 0 (0.0%) |
| All other Fuels | 0 (0.0%) | 0 (0.0%) |
| No Fuel Used | 25 (1.5%) | 0 (0.0%) |
| Total | 1,669 (100.0%) | 328 (100.0%) |
Household Vehicle Usage in Cottleville
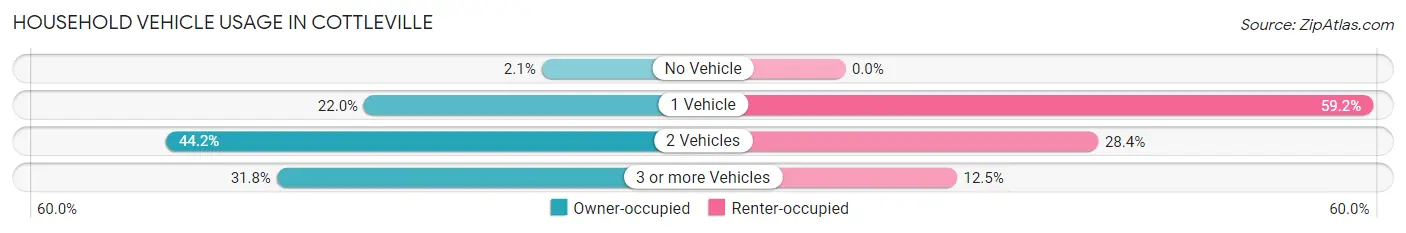
| Vehicles per Household | Owner-occupied | Renter-occupied |
| No Vehicle | 35 (2.1%) | 0 (0.0%) |
| 1 Vehicle | 367 (22.0%) | 194 (59.2%) |
| 2 Vehicles | 737 (44.2%) | 93 (28.3%) |
| 3 or more Vehicles | 530 (31.8%) | 41 (12.5%) |
| Total | 1,669 (100.0%) | 328 (100.0%) |
Real Estate & Mortgages in Cottleville
Real Estate and Mortgage Overview in Cottleville
| Characteristic | Without Mortgage | With Mortgage |
| Housing Units | 322 | 1,347 |
| Median Property Value | $367,900 | $382,800 |
| Median Household Income | $99,342 | $683 |
| Monthly Housing Costs | $672 | $230 |
| Real Estate Taxes | $4,288 | $4 |
Property Value by Mortgage Status in Cottleville
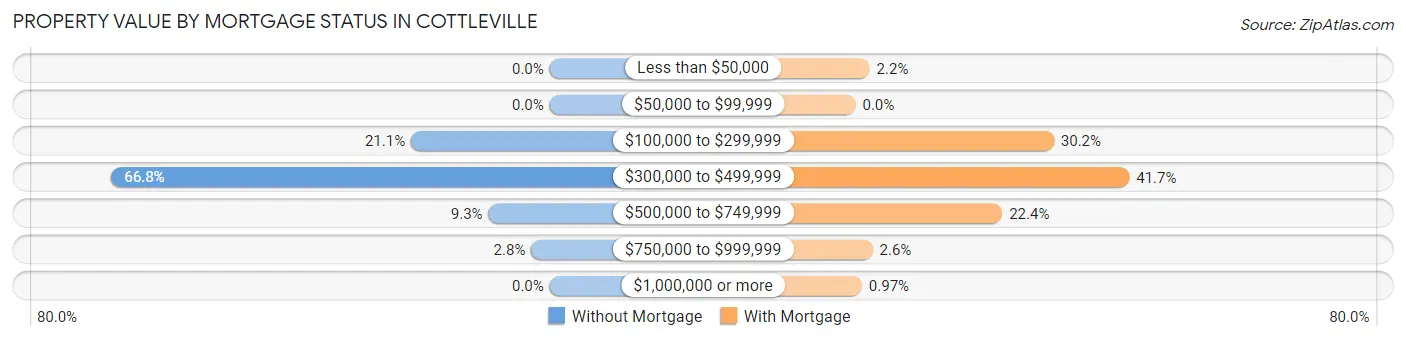
| Property Value | Without Mortgage | With Mortgage |
| Less than $50,000 | 0 (0.0%) | 29 (2.1%) |
| $50,000 to $99,999 | 0 (0.0%) | 0 (0.0%) |
| $100,000 to $299,999 | 68 (21.1%) | 407 (30.2%) |
| $300,000 to $499,999 | 215 (66.8%) | 562 (41.7%) |
| $500,000 to $749,999 | 30 (9.3%) | 301 (22.4%) |
| $750,000 to $999,999 | 9 (2.8%) | 35 (2.6%) |
| $1,000,000 or more | 0 (0.0%) | 13 (1.0%) |
| Total | 322 (100.0%) | 1,347 (100.0%) |
Household Income by Mortgage Status in Cottleville
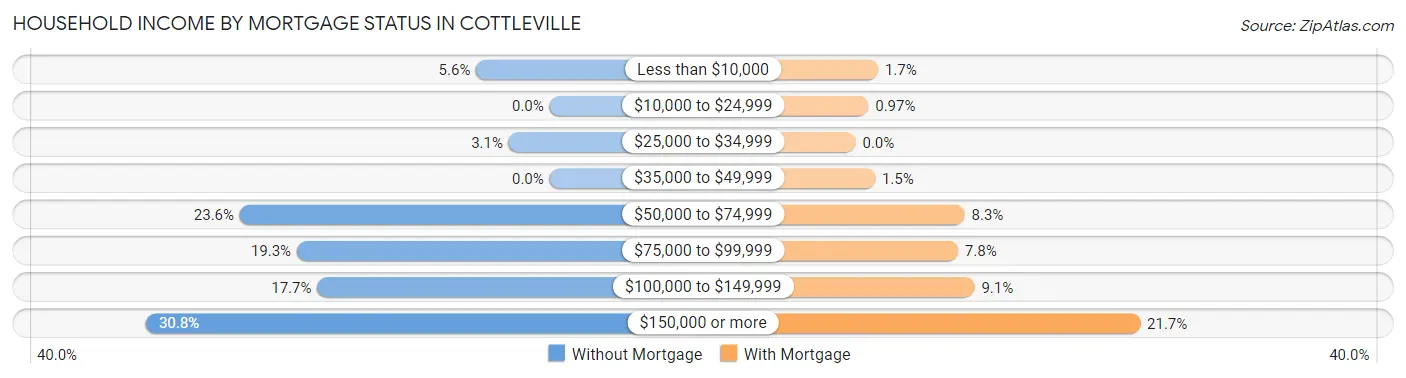
| Household Income | Without Mortgage | With Mortgage |
| Less than $10,000 | 18 (5.6%) | 23 (1.7%) |
| $10,000 to $24,999 | 0 (0.0%) | 13 (1.0%) |
| $25,000 to $34,999 | 10 (3.1%) | 0 (0.0%) |
| $35,000 to $49,999 | 0 (0.0%) | 20 (1.5%) |
| $50,000 to $74,999 | 76 (23.6%) | 112 (8.3%) |
| $75,000 to $99,999 | 62 (19.3%) | 105 (7.8%) |
| $100,000 to $149,999 | 57 (17.7%) | 122 (9.1%) |
| $150,000 or more | 99 (30.7%) | 292 (21.7%) |
| Total | 322 (100.0%) | 1,347 (100.0%) |
Property Value to Household Income Ratio in Cottleville
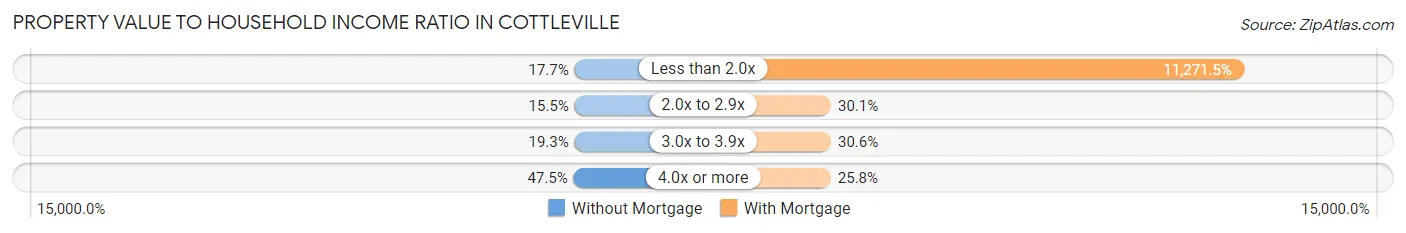
| Value-to-Income Ratio | Without Mortgage | With Mortgage |
| Less than 2.0x | 57 (17.7%) | 151,827 (11,271.5%) |
| 2.0x to 2.9x | 50 (15.5%) | 405 (30.1%) |
| 3.0x to 3.9x | 62 (19.3%) | 412 (30.6%) |
| 4.0x or more | 153 (47.5%) | 348 (25.8%) |
| Total | 322 (100.0%) | 1,347 (100.0%) |
Real Estate Taxes by Mortgage Status in Cottleville
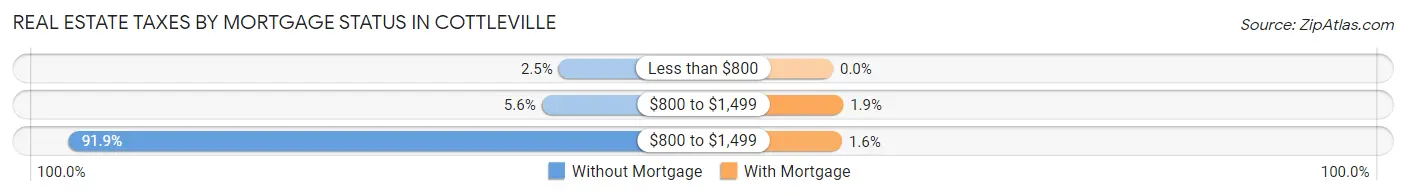
| Property Taxes | Without Mortgage | With Mortgage |
| Less than $800 | 8 (2.5%) | 0 (0.0%) |
| $800 to $1,499 | 18 (5.6%) | 25 (1.9%) |
| $800 to $1,499 | 296 (91.9%) | 22 (1.6%) |
| Total | 322 (100.0%) | 1,347 (100.0%) |
Health & Disability in Cottleville
Health Insurance Coverage by Age in Cottleville
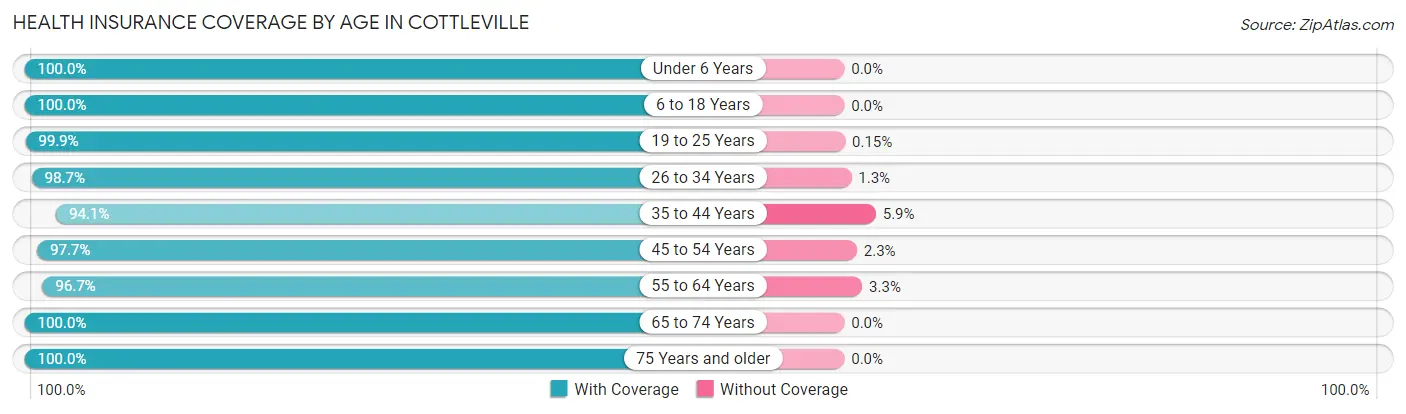
| Age Bracket | With Coverage | Without Coverage |
| Under 6 Years | 370 (100.0%) | 0 (0.0%) |
| 6 to 18 Years | 972 (100.0%) | 0 (0.0%) |
| 19 to 25 Years | 661 (99.9%) | 1 (0.2%) |
| 26 to 34 Years | 527 (98.7%) | 7 (1.3%) |
| 35 to 44 Years | 754 (94.1%) | 47 (5.9%) |
| 45 to 54 Years | 669 (97.7%) | 16 (2.3%) |
| 55 to 64 Years | 841 (96.7%) | 29 (3.3%) |
| 65 to 74 Years | 596 (100.0%) | 0 (0.0%) |
| 75 Years and older | 93 (100.0%) | 0 (0.0%) |
| Total | 5,483 (98.2%) | 100 (1.8%) |
Health Insurance Coverage by Citizenship Status in Cottleville
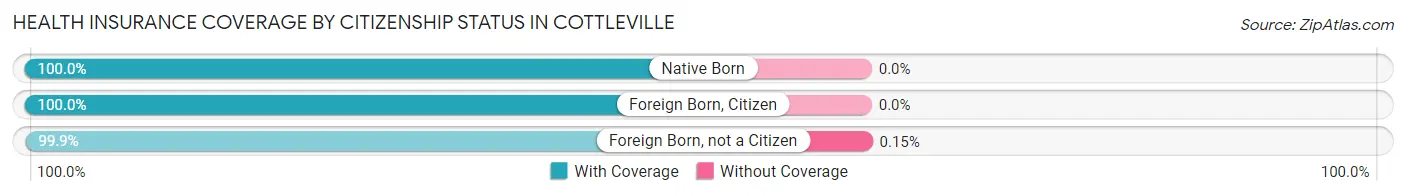
| Citizenship Status | With Coverage | Without Coverage |
| Native Born | 370 (100.0%) | 0 (0.0%) |
| Foreign Born, Citizen | 972 (100.0%) | 0 (0.0%) |
| Foreign Born, not a Citizen | 661 (99.9%) | 1 (0.2%) |
Health Insurance Coverage by Household Income in Cottleville
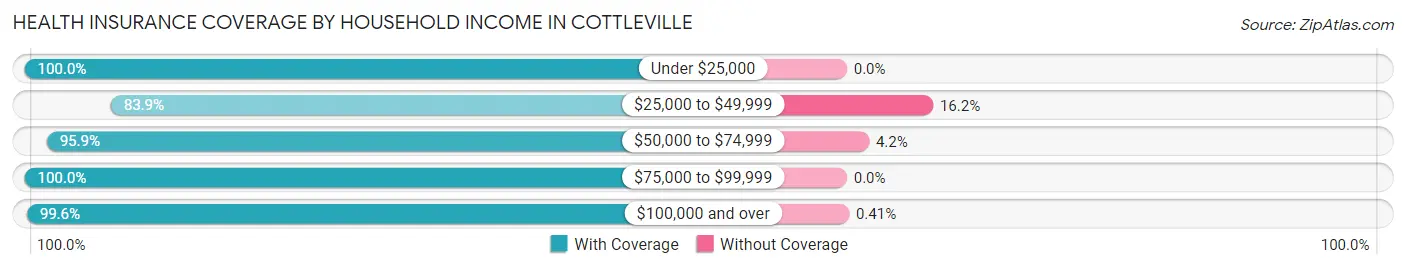
| Household Income | With Coverage | Without Coverage |
| Under $25,000 | 81 (100.0%) | 0 (0.0%) |
| $25,000 to $49,999 | 244 (83.9%) | 47 (16.2%) |
| $50,000 to $74,999 | 808 (95.9%) | 35 (4.2%) |
| $75,000 to $99,999 | 493 (100.0%) | 0 (0.0%) |
| $100,000 and over | 3,851 (99.6%) | 16 (0.4%) |
Public vs Private Health Insurance Coverage by Age in Cottleville
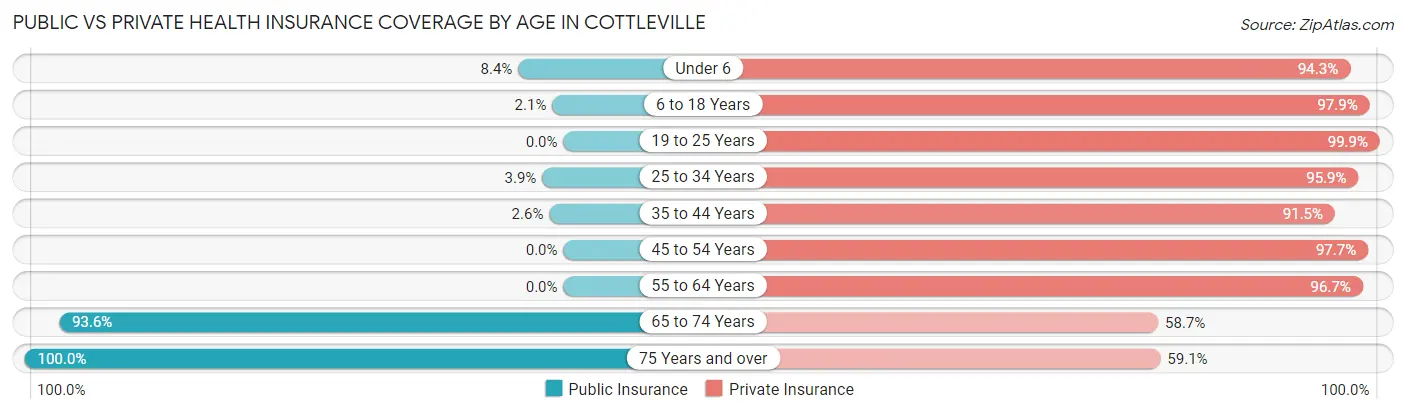
| Age Bracket | Public Insurance | Private Insurance |
| Under 6 | 31 (8.4%) | 349 (94.3%) |
| 6 to 18 Years | 20 (2.1%) | 952 (97.9%) |
| 19 to 25 Years | 0 (0.0%) | 661 (99.9%) |
| 25 to 34 Years | 21 (3.9%) | 512 (95.9%) |
| 35 to 44 Years | 21 (2.6%) | 733 (91.5%) |
| 45 to 54 Years | 0 (0.0%) | 669 (97.7%) |
| 55 to 64 Years | 0 (0.0%) | 841 (96.7%) |
| 65 to 74 Years | 558 (93.6%) | 350 (58.7%) |
| 75 Years and over | 93 (100.0%) | 55 (59.1%) |
| Total | 744 (13.3%) | 5,122 (91.7%) |
Disability Status by Sex by Age in Cottleville
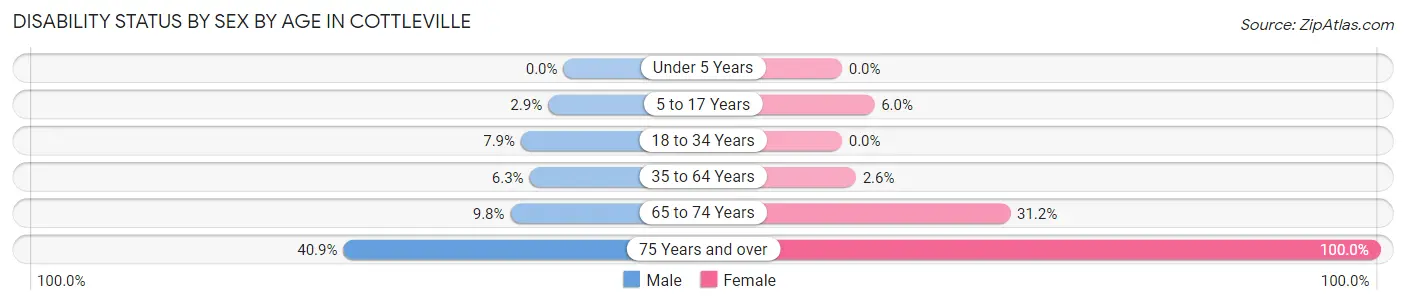
| Age Bracket | Male | Female |
| Under 5 Years | 0 (0.0%) | 0 (0.0%) |
| 5 to 17 Years | 16 (2.9%) | 32 (6.0%) |
| 18 to 34 Years | 50 (7.9%) | 0 (0.0%) |
| 35 to 64 Years | 73 (6.3%) | 31 (2.6%) |
| 65 to 74 Years | 29 (9.8%) | 94 (31.2%) |
| 75 Years and over | 29 (40.8%) | 22 (100.0%) |
Disability Class by Sex by Age in Cottleville
Disability Class: Hearing Difficulty
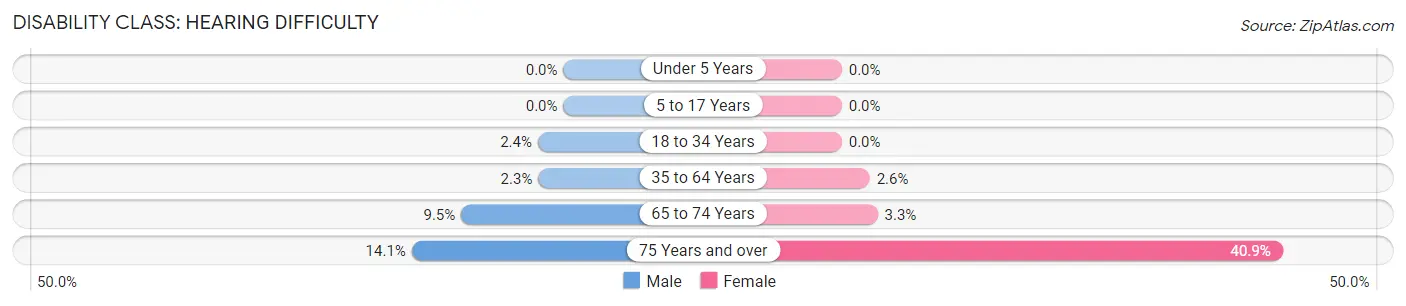
| Age Bracket | Male | Female |
| Under 5 Years | 0 (0.0%) | 0 (0.0%) |
| 5 to 17 Years | 0 (0.0%) | 0 (0.0%) |
| 18 to 34 Years | 15 (2.4%) | 0 (0.0%) |
| 35 to 64 Years | 27 (2.3%) | 31 (2.6%) |
| 65 to 74 Years | 28 (9.5%) | 10 (3.3%) |
| 75 Years and over | 10 (14.1%) | 9 (40.9%) |
Disability Class: Vision Difficulty
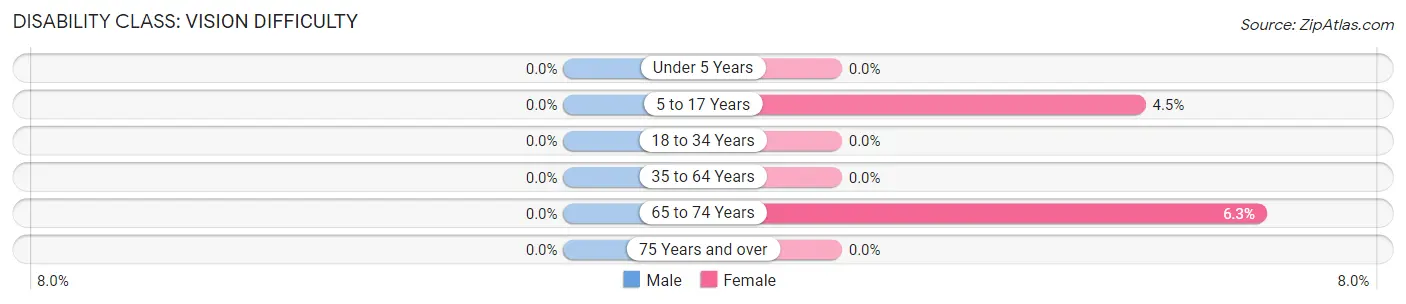
| Age Bracket | Male | Female |
| Under 5 Years | 0 (0.0%) | 0 (0.0%) |
| 5 to 17 Years | 0 (0.0%) | 24 (4.5%) |
| 18 to 34 Years | 0 (0.0%) | 0 (0.0%) |
| 35 to 64 Years | 0 (0.0%) | 0 (0.0%) |
| 65 to 74 Years | 0 (0.0%) | 19 (6.3%) |
| 75 Years and over | 0 (0.0%) | 0 (0.0%) |
Disability Class: Cognitive Difficulty
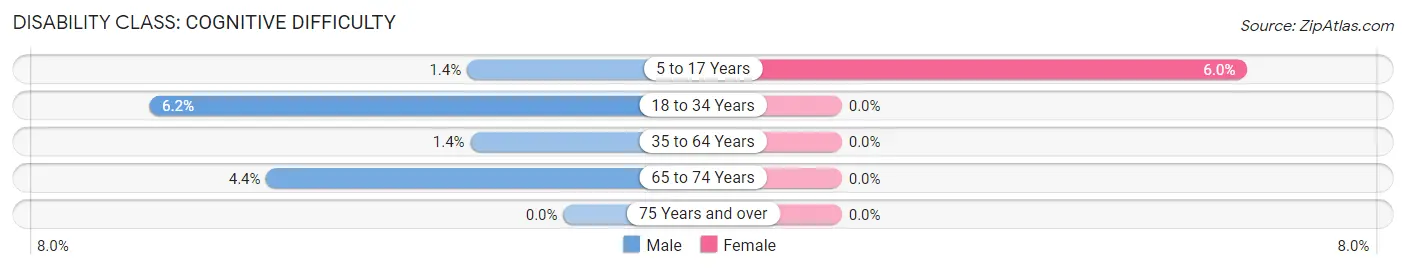
| Age Bracket | Male | Female |
| 5 to 17 Years | 8 (1.4%) | 32 (6.0%) |
| 18 to 34 Years | 39 (6.1%) | 0 (0.0%) |
| 35 to 64 Years | 16 (1.4%) | 0 (0.0%) |
| 65 to 74 Years | 13 (4.4%) | 0 (0.0%) |
| 75 Years and over | 0 (0.0%) | 0 (0.0%) |
Disability Class: Ambulatory Difficulty
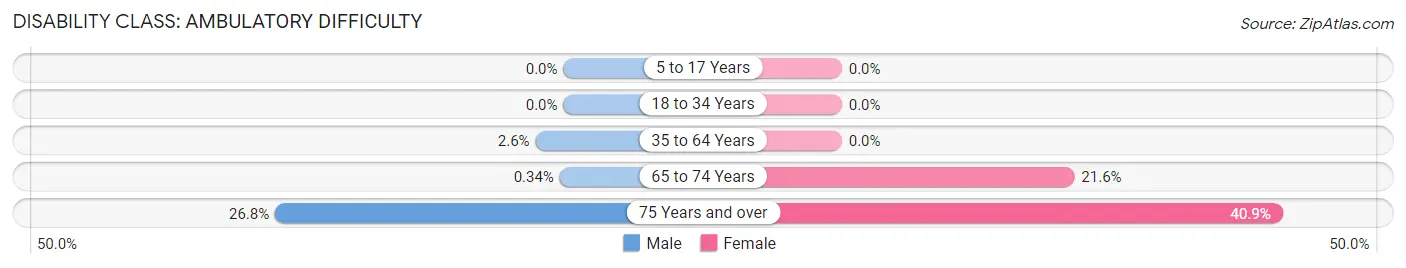
| Age Bracket | Male | Female |
| 5 to 17 Years | 0 (0.0%) | 0 (0.0%) |
| 18 to 34 Years | 0 (0.0%) | 0 (0.0%) |
| 35 to 64 Years | 30 (2.6%) | 0 (0.0%) |
| 65 to 74 Years | 1 (0.3%) | 65 (21.6%) |
| 75 Years and over | 19 (26.8%) | 9 (40.9%) |
Disability Class: Self-Care Difficulty
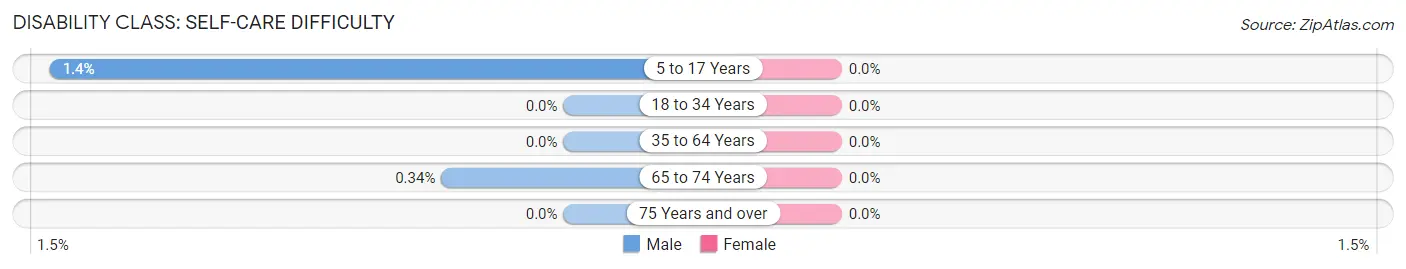
| Age Bracket | Male | Female |
| 5 to 17 Years | 8 (1.4%) | 0 (0.0%) |
| 18 to 34 Years | 0 (0.0%) | 0 (0.0%) |
| 35 to 64 Years | 0 (0.0%) | 0 (0.0%) |
| 65 to 74 Years | 1 (0.3%) | 0 (0.0%) |
| 75 Years and over | 0 (0.0%) | 0 (0.0%) |
Technology Access in Cottleville
Computing Device Access in Cottleville
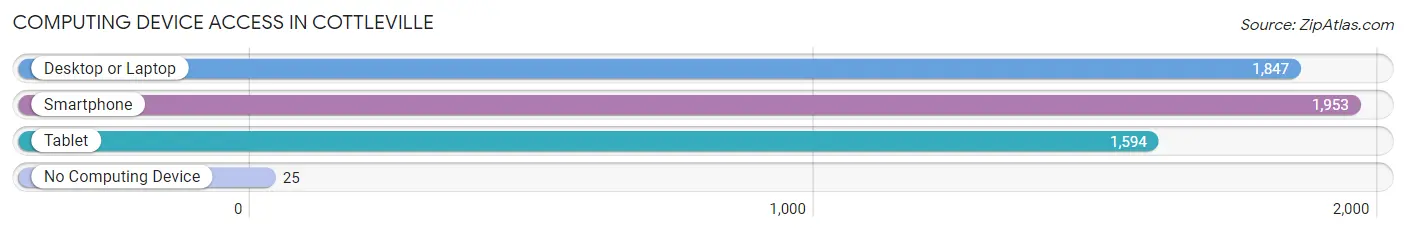
| Device Type | # Households | % Households |
| Desktop or Laptop | 1,847 | 92.5% |
| Smartphone | 1,953 | 97.8% |
| Tablet | 1,594 | 79.8% |
| No Computing Device | 25 | 1.3% |
| Total | 1,997 | 100.0% |
Internet Access in Cottleville
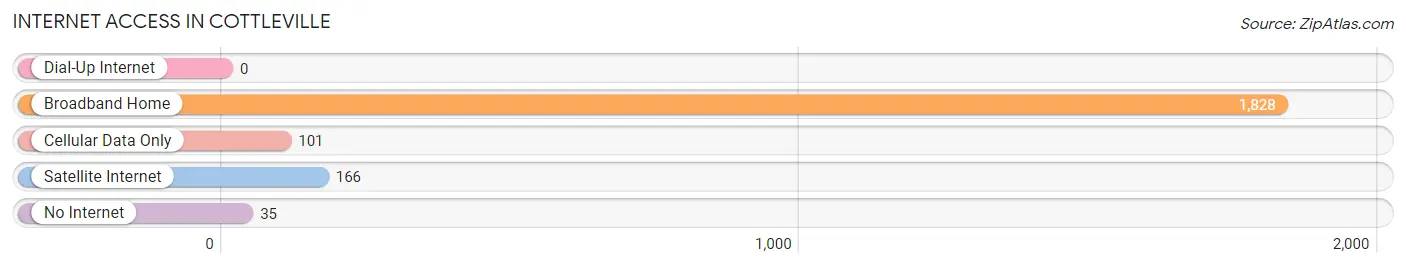
| Internet Type | # Households | % Households |
| Dial-Up Internet | 0 | 0.0% |
| Broadband Home | 1,828 | 91.5% |
| Cellular Data Only | 101 | 5.1% |
| Satellite Internet | 166 | 8.3% |
| No Internet | 35 | 1.8% |
| Total | 1,997 | 100.0% |
Cottleville Summary
Cottleville is a city located in St. Charles County, Missouri, United States. It is part of the St. Louis metropolitan area. The population was 4,844 at the 2010 census.
History
Cottleville was founded in 1837 by William Cottle, a settler from Kentucky. The town was originally known as Cottle's Station, and was a stop on the St. Louis and Iron Mountain Railroad. The town was officially incorporated in 1855.
In the late 19th century, Cottleville was a popular destination for wealthy St. Louisans looking to escape the city. The town was known for its resorts and spas, and was home to several large estates.
Geography
Cottleville is located at 38 47 25 North 90 37 17 West 38 790278 90 621389
According to the United States Census Bureau, the city has a total area of 2.2 square miles (5.7 km2), all of it land.
Economy
Cottleville is home to several businesses, including a number of restaurants, retail stores, and professional services. The city is also home to several industrial and manufacturing companies.
Demographics
As of the census of 2010, there were 4,844 people, 1,845 households, and 1,323 families residing in the city. The population density was 2,200.9 people per square mile (851.2/km2). There were 1,945 housing units at an average density of 877.3 per square mile (339.2/km2). The racial makeup of the city was 94.2% White, 1.2% African American, 0.3% Native American, 1.2% Asian, 0.1% Pacific Islander, 1.2% from other races, and 1.9% from two or more races. Hispanic or Latino of any race were 3.2% of the population.
There were 1,845 households, out of which 37.2% had children under the age of 18 living with them, 56.2% were married couples living together, 10.2% had a female householder with no husband present, and 29.2% were non-families. 24.2% of all households were made up of individuals, and 8.2% had someone living alone who was 65 years of age or older. The average household size was 2.62 and the average family size was 3.13.
In the city, the population was spread out, with 28.2% under the age of 18, 7.2% from 18 to 24, 33.2% from 25 to 44, 20.2% from 45 to 64, and 11.2% who were 65 years of age or older. The median age was 34 years. For every 100 females, there were 97.2 males. For every 100 females age 18 and over, there were 94.2 males.
The median income for a household in the city was $60,938, and the median income for a family was $68,958. Males had a median income of $45,938 versus $31,250 for females. The per capita income for the city was $25,938. About 3.2% of families and 4.2% of the population were below the poverty line, including 5.2% of those under age 18 and 4.2% of those age 65 or over.
Common Questions
What is the Total Population of Cottleville?
Total Population of Cottleville is 5,584.
What is the Total Male Population of Cottleville?
Total Male Population of Cottleville is 2,864.
What is the Total Female Population of Cottleville?
Total Female Population of Cottleville is 2,720.
What is the Ratio of Males per 100 Females in Cottleville?
There are 105.29 Males per 100 Females in Cottleville.
What is the Ratio of Females per 100 Males in Cottleville?
There are 94.97 Females per 100 Males in Cottleville.
What is the Median Population Age in Cottleville?
Median Population Age in Cottleville is 37.6 Years.
What is the Average Family Size in Cottleville
Average Family Size in Cottleville is 3.1 People.
What is the Average Household Size in Cottleville
Average Household Size in Cottleville is 2.8 People.
What is Per Capita Income in Cottleville?
Per Capita income in Cottleville is $62,224.
What is the Median Family Income in Cottleville?
Median Family Income in Cottleville is $148,551.
What is the Median Household income in Cottleville?
Median Household Income in Cottleville is $130,139.
What is Income or Wage Gap in Cottleville?
Income or Wage Gap in Cottleville is 36.4%.
Women in Cottleville earn 63.6 cents for every dollar earned by a man.
What is Inequality or Gini Index in Cottleville?
Inequality or Gini Index in Cottleville is 0.41.
How Large is the Labor Force in Cottleville?
There are 3,539 People in the Labor Forcein in Cottleville.
What is the Percentage of People in the Labor Force in Cottleville?
80.3% of People are in the Labor Force in Cottleville.
What is the Unemployment Rate in Cottleville?
Unemployment Rate in Cottleville is 1.6%.