Sappington, MO
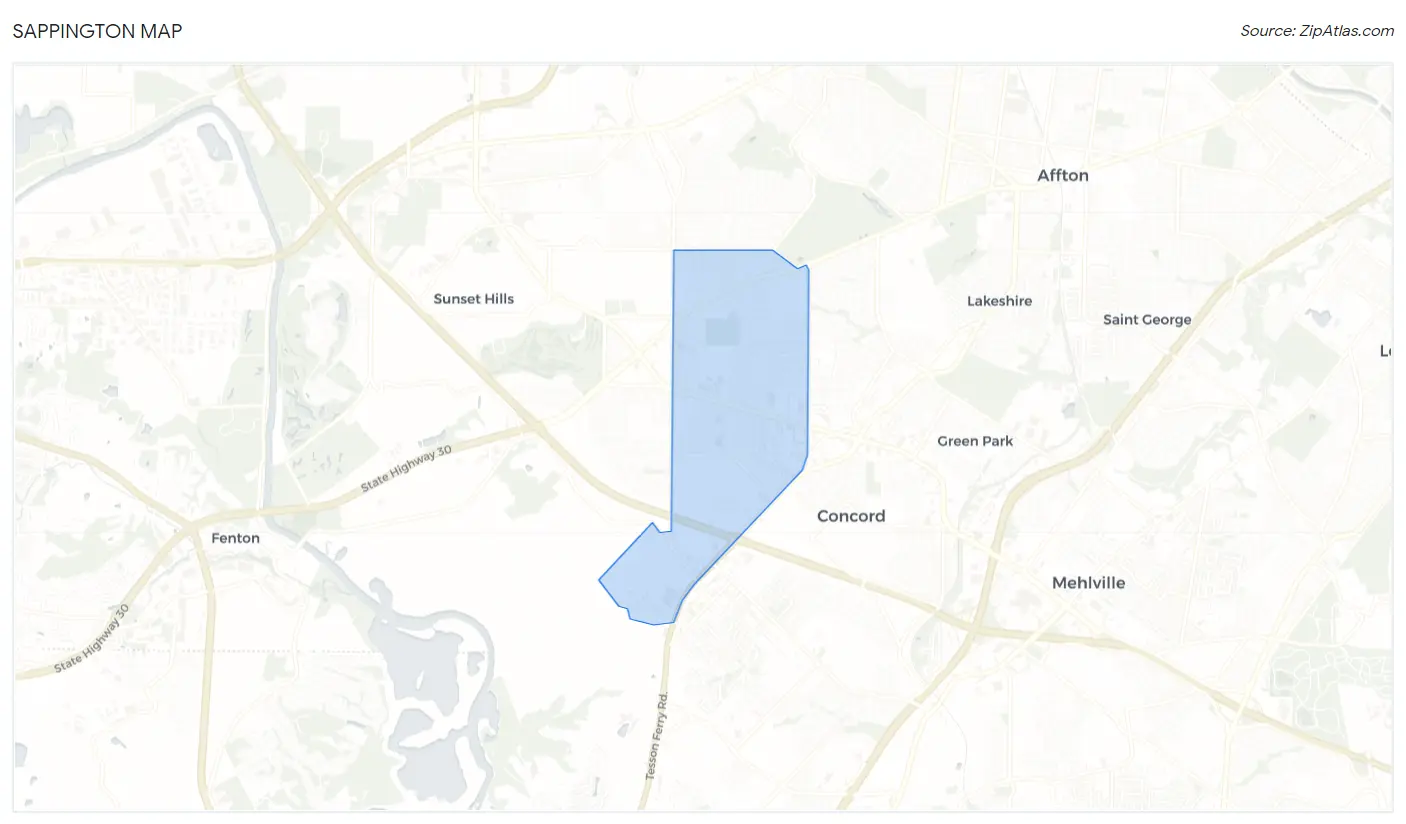
Sappington Map
Sappington Overview
7,039
TOTAL POPULATION
3,488
MALE POPULATION
3,551
FEMALE POPULATION
98.23
MALES / 100 FEMALES
101.81
FEMALES / 100 MALES
41.0
MEDIAN AGE
3.1
AVG FAMILY SIZE
2.3
AVG HOUSEHOLD SIZE
$43,063
PER CAPITA INCOME
$109,286
AVG FAMILY INCOME
$69,757
AVG HOUSEHOLD INCOME
28.6%
WAGE / INCOME GAP [ % ]
71.4¢/ $1
WAGE / INCOME GAP [ $ ]
0.44
INEQUALITY / GINI INDEX
3,563
LABOR FORCE [ PEOPLE ]
63.8%
PERCENT IN LABOR FORCE
5.2%
UNEMPLOYMENT RATE
Sappington Area Codes
Race in Sappington
The most populous races in Sappington are White / Caucasian (6,631 | 94.2%), Hispanic or Latino (256 | 3.6%), and Two or more Races (232 | 3.3%).
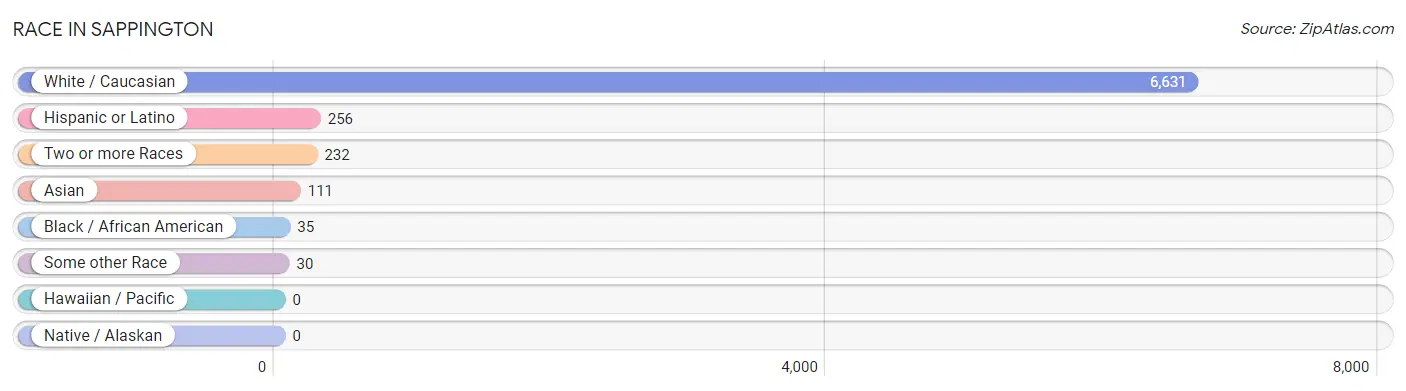
| Race | # Population | % Population |
| Asian | 111 | 1.6% |
| Black / African American | 35 | 0.5% |
| Hawaiian / Pacific | 0 | 0.0% |
| Hispanic or Latino | 256 | 3.6% |
| Native / Alaskan | 0 | 0.0% |
| White / Caucasian | 6,631 | 94.2% |
| Two or more Races | 232 | 3.3% |
| Some other Race | 30 | 0.4% |
| Total | 7,039 | 100.0% |
Ancestry in Sappington
The most populous ancestries reported in Sappington are German (2,345 | 33.3%), Irish (1,181 | 16.8%), English (654 | 9.3%), Italian (397 | 5.6%), and French (353 | 5.0%), together accounting for 70.0% of all Sappington residents.
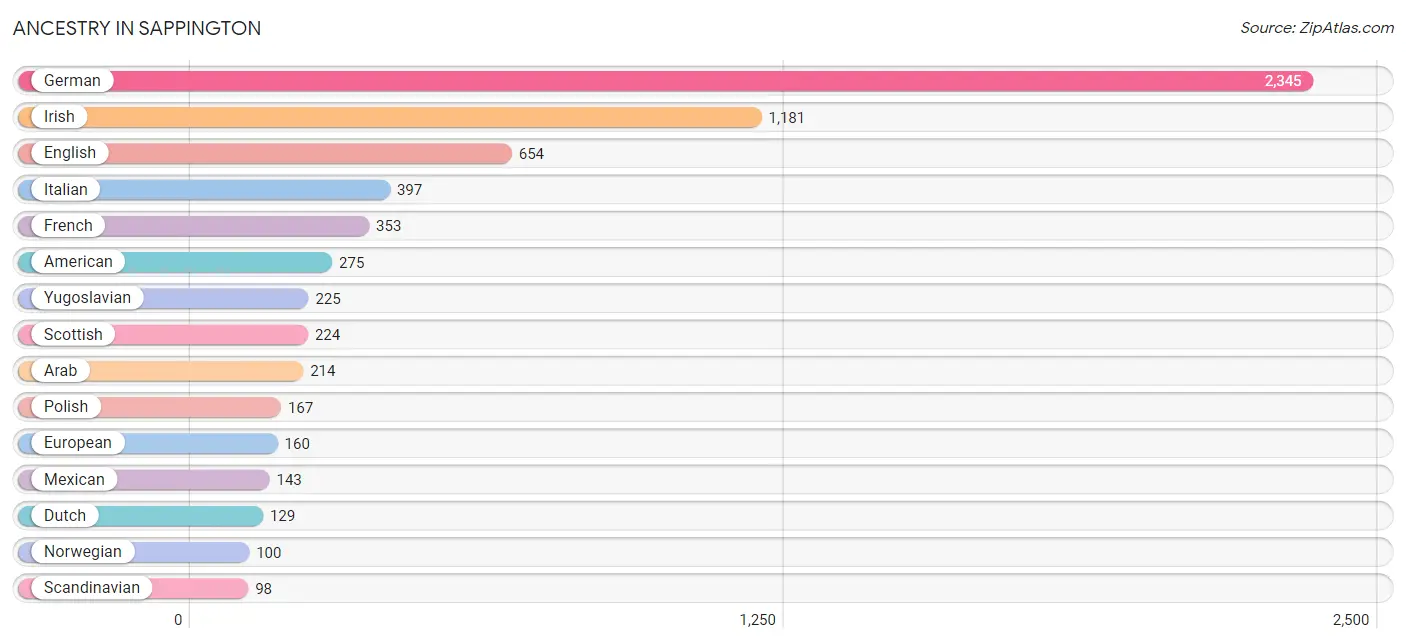
| Ancestry | # Population | % Population |
| Albanian | 24 | 0.3% |
| Alsatian | 10 | 0.1% |
| American | 275 | 3.9% |
| Arab | 214 | 3.0% |
| Argentinean | 33 | 0.5% |
| Austrian | 49 | 0.7% |
| Belgian | 80 | 1.1% |
| British | 11 | 0.2% |
| Canadian | 14 | 0.2% |
| Central American | 44 | 0.6% |
| Cherokee | 6 | 0.1% |
| Croatian | 37 | 0.5% |
| Czech | 71 | 1.0% |
| Czechoslovakian | 59 | 0.8% |
| Dutch | 129 | 1.8% |
| English | 654 | 9.3% |
| Ethiopian | 25 | 0.4% |
| European | 160 | 2.3% |
| Finnish | 11 | 0.2% |
| French | 353 | 5.0% |
| German | 2,345 | 33.3% |
| Greek | 24 | 0.3% |
| Guatemalan | 32 | 0.4% |
| Hungarian | 18 | 0.3% |
| Indian (Asian) | 17 | 0.2% |
| Irish | 1,181 | 16.8% |
| Italian | 397 | 5.6% |
| Jamaican | 9 | 0.1% |
| Jordanian | 16 | 0.2% |
| Lebanese | 56 | 0.8% |
| Luxembourger | 1 | 0.0% |
| Macedonian | 53 | 0.7% |
| Malaysian | 17 | 0.2% |
| Mexican | 143 | 2.0% |
| Nicaraguan | 12 | 0.2% |
| Northern European | 45 | 0.6% |
| Norwegian | 100 | 1.4% |
| Palestinian | 10 | 0.1% |
| Peruvian | 7 | 0.1% |
| Polish | 167 | 2.4% |
| Russian | 9 | 0.1% |
| Scandinavian | 98 | 1.4% |
| Scotch-Irish | 53 | 0.7% |
| Scottish | 224 | 3.2% |
| Slavic | 7 | 0.1% |
| South American | 40 | 0.6% |
| Spanish | 29 | 0.4% |
| Sri Lankan | 83 | 1.2% |
| Subsaharan African | 25 | 0.4% |
| Swedish | 63 | 0.9% |
| Swiss | 22 | 0.3% |
| Ukrainian | 37 | 0.5% |
| Yugoslavian | 225 | 3.2% | View All 53 Rows |
Immigrants in Sappington
The most numerous immigrant groups reported in Sappington came from Europe (233 | 3.3%), Eastern Europe (174 | 2.5%), Bosnia and Herzegovina (96 | 1.4%), Asia (94 | 1.3%), and Canada (90 | 1.3%), together accounting for 9.8% of all Sappington residents.
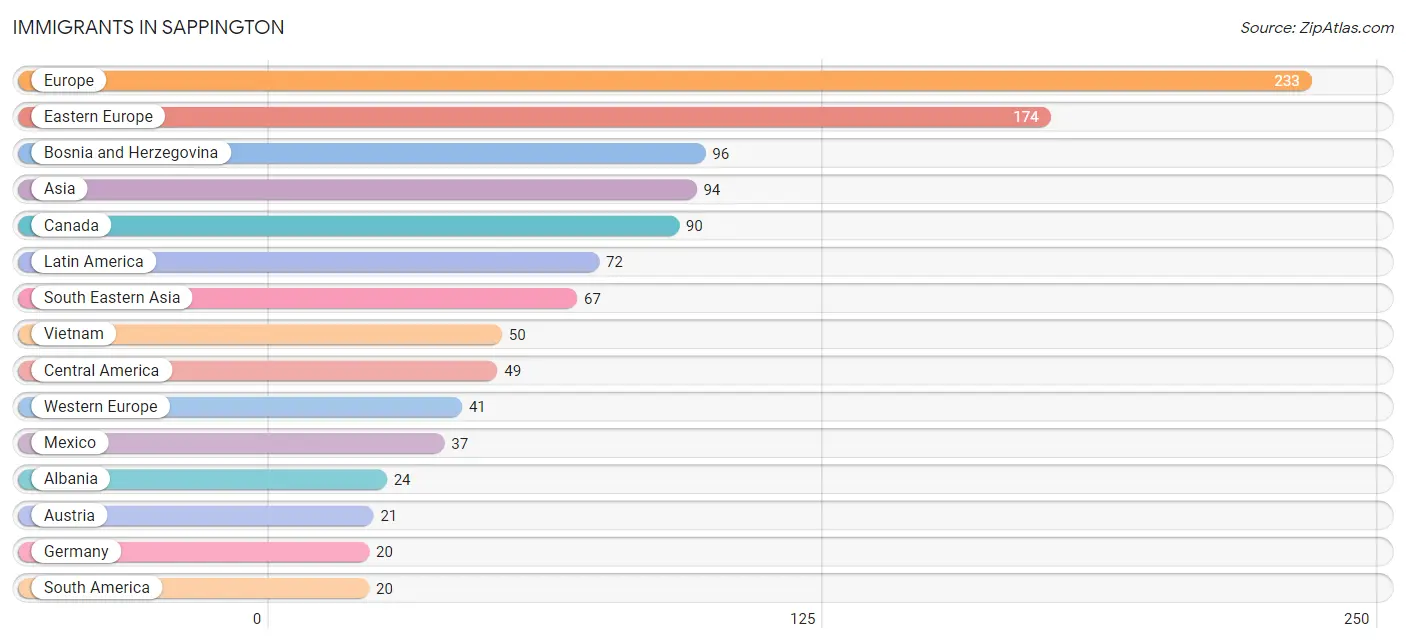
| Immigration Origin | # Population | % Population |
| Albania | 24 | 0.3% |
| Argentina | 13 | 0.2% |
| Asia | 94 | 1.3% |
| Austria | 21 | 0.3% |
| Bosnia and Herzegovina | 96 | 1.4% |
| Canada | 90 | 1.3% |
| Caribbean | 3 | 0.0% |
| Central America | 49 | 0.7% |
| China | 11 | 0.2% |
| Czechoslovakia | 15 | 0.2% |
| Eastern Asia | 11 | 0.2% |
| Eastern Europe | 174 | 2.5% |
| Europe | 233 | 3.3% |
| Germany | 20 | 0.3% |
| Hong Kong | 11 | 0.2% |
| Jamaica | 3 | 0.0% |
| Kuwait | 16 | 0.2% |
| Laos | 17 | 0.2% |
| Latin America | 72 | 1.0% |
| Mexico | 37 | 0.5% |
| Nicaragua | 12 | 0.2% |
| North Macedonia | 15 | 0.2% |
| Northern Europe | 18 | 0.3% |
| Peru | 7 | 0.1% |
| Russia | 9 | 0.1% |
| South America | 20 | 0.3% |
| South Eastern Asia | 67 | 0.9% |
| Vietnam | 50 | 0.7% |
| Western Asia | 16 | 0.2% |
| Western Europe | 41 | 0.6% | View All 30 Rows |
Sex and Age in Sappington
Sex and Age in Sappington
The most populous age groups in Sappington are 15 to 19 Years (374 | 10.7%) for men and 5 to 9 Years (326 | 9.2%) for women.
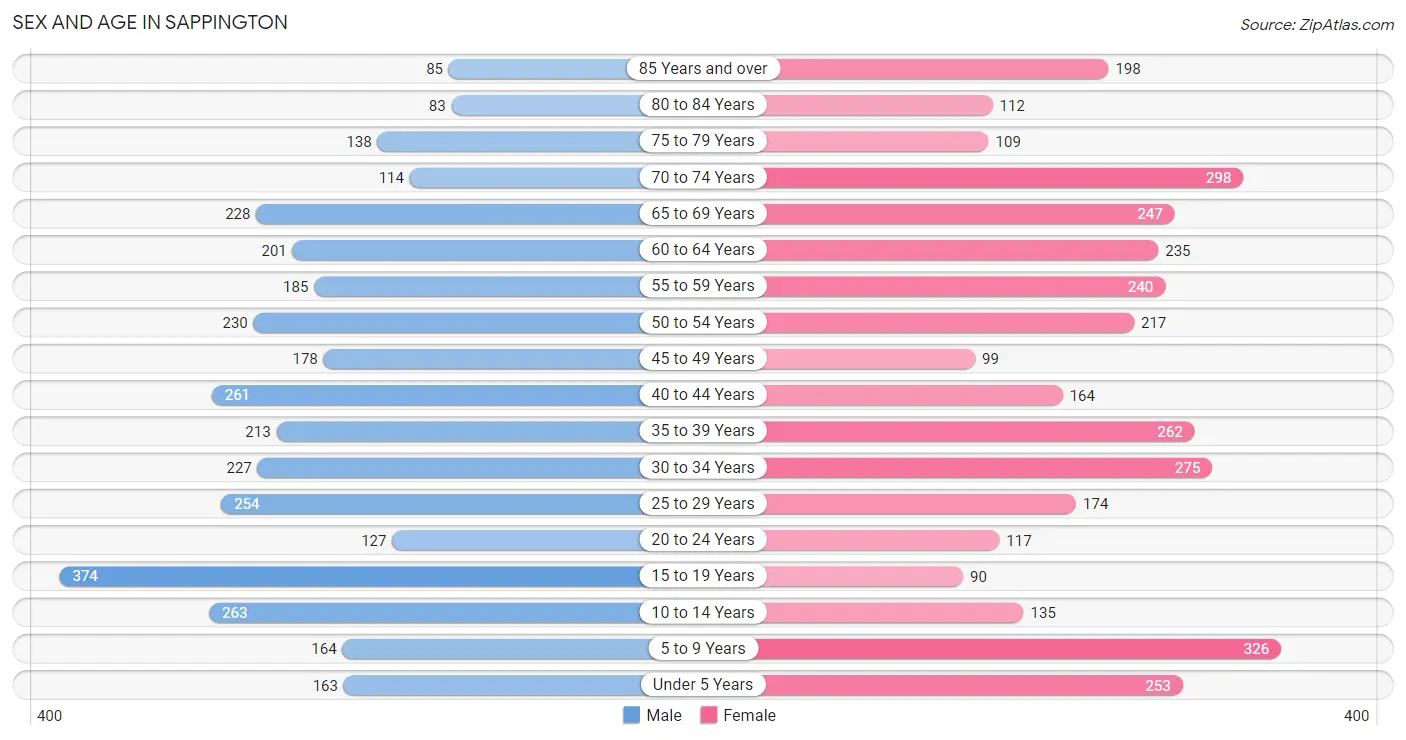
| Age Bracket | Male | Female |
| Under 5 Years | 163 (4.7%) | 253 (7.1%) |
| 5 to 9 Years | 164 (4.7%) | 326 (9.2%) |
| 10 to 14 Years | 263 (7.5%) | 135 (3.8%) |
| 15 to 19 Years | 374 (10.7%) | 90 (2.5%) |
| 20 to 24 Years | 127 (3.6%) | 117 (3.3%) |
| 25 to 29 Years | 254 (7.3%) | 174 (4.9%) |
| 30 to 34 Years | 227 (6.5%) | 275 (7.7%) |
| 35 to 39 Years | 213 (6.1%) | 262 (7.4%) |
| 40 to 44 Years | 261 (7.5%) | 164 (4.6%) |
| 45 to 49 Years | 178 (5.1%) | 99 (2.8%) |
| 50 to 54 Years | 230 (6.6%) | 217 (6.1%) |
| 55 to 59 Years | 185 (5.3%) | 240 (6.8%) |
| 60 to 64 Years | 201 (5.8%) | 235 (6.6%) |
| 65 to 69 Years | 228 (6.5%) | 247 (7.0%) |
| 70 to 74 Years | 114 (3.3%) | 298 (8.4%) |
| 75 to 79 Years | 138 (4.0%) | 109 (3.1%) |
| 80 to 84 Years | 83 (2.4%) | 112 (3.2%) |
| 85 Years and over | 85 (2.4%) | 198 (5.6%) |
| Total | 3,488 (100.0%) | 3,551 (100.0%) |
Families and Households in Sappington
Median Family Size in Sappington
The median family size in Sappington is 3.14 persons per family, with married-couple families (1,309 | 74.5%) accounting for the largest median family size of 3.24 persons per family. On the other hand, single male/father families (80 | 4.6%) represent the smallest median family size with 2.50 persons per family.
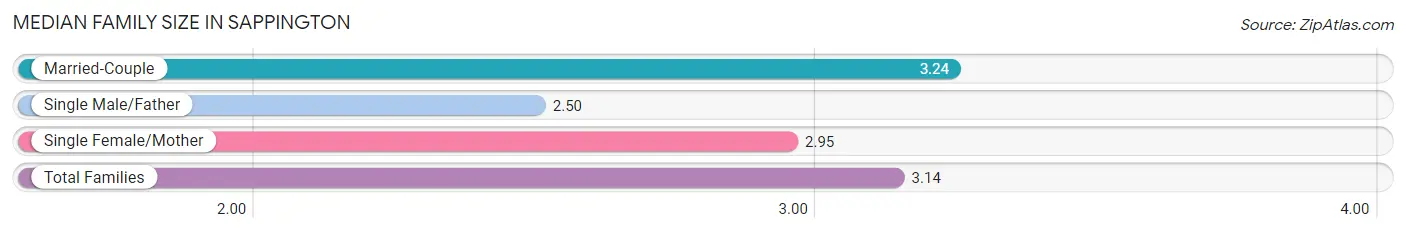
| Family Type | # Families | Family Size |
| Married-Couple | 1,309 (74.5%) | 3.24 |
| Single Male/Father | 80 (4.6%) | 2.50 |
| Single Female/Mother | 367 (20.9%) | 2.95 |
| Total Families | 1,756 (100.0%) | 3.14 |
Median Household Size in Sappington
The median household size in Sappington is 2.31 persons per household, with married-couple households (1,309 | 43.0%) accounting for the largest median household size of 3.27 persons per household. non-family households (1,286 | 42.3%) represent the smallest median household size with 1.10 persons per household.
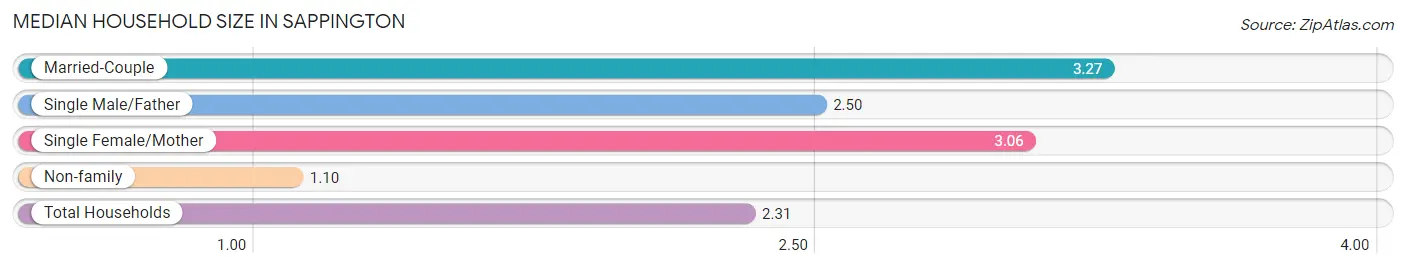
| Household Type | # Households | Household Size |
| Married-Couple | 1,309 (43.0%) | 3.27 |
| Single Male/Father | 80 (2.6%) | 2.50 |
| Single Female/Mother | 367 (12.1%) | 3.06 |
| Non-family | 1,286 (42.3%) | 1.10 |
| Total Households | 3,042 (100.0%) | 2.31 |
Household Size by Marriage Status in Sappington
Out of a total of 3,042 households in Sappington, 1,756 (57.7%) are family households, while 1,286 (42.3%) are nonfamily households. The most numerous type of family households are 2-person households, comprising 751, and the most common type of nonfamily households are 1-person households, comprising 1,170.
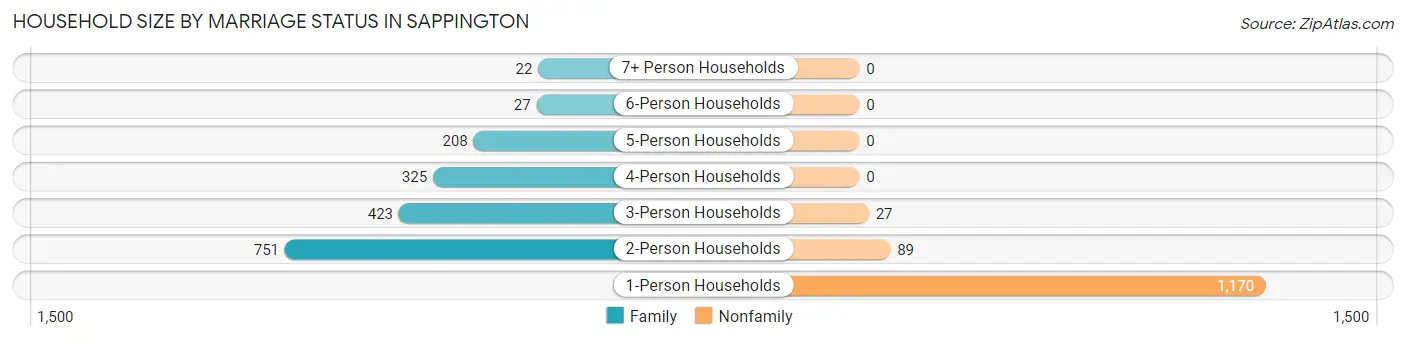
| Household Size | Family Households | Nonfamily Households |
| 1-Person Households | - | 1,170 (38.5%) |
| 2-Person Households | 751 (24.7%) | 89 (2.9%) |
| 3-Person Households | 423 (13.9%) | 27 (0.9%) |
| 4-Person Households | 325 (10.7%) | 0 (0.0%) |
| 5-Person Households | 208 (6.8%) | 0 (0.0%) |
| 6-Person Households | 27 (0.9%) | 0 (0.0%) |
| 7+ Person Households | 22 (0.7%) | 0 (0.0%) |
| Total | 1,756 (57.7%) | 1,286 (42.3%) |
Female Fertility in Sappington
Fertility by Age in Sappington
Average fertility rate in Sappington is 82.0 births per 1,000 women. Women in the age bracket of 20 to 34 years have the highest fertility rate with 134.0 births per 1,000 women. Women in the age bracket of 20 to 34 years acount for 75.2% of all women with births.
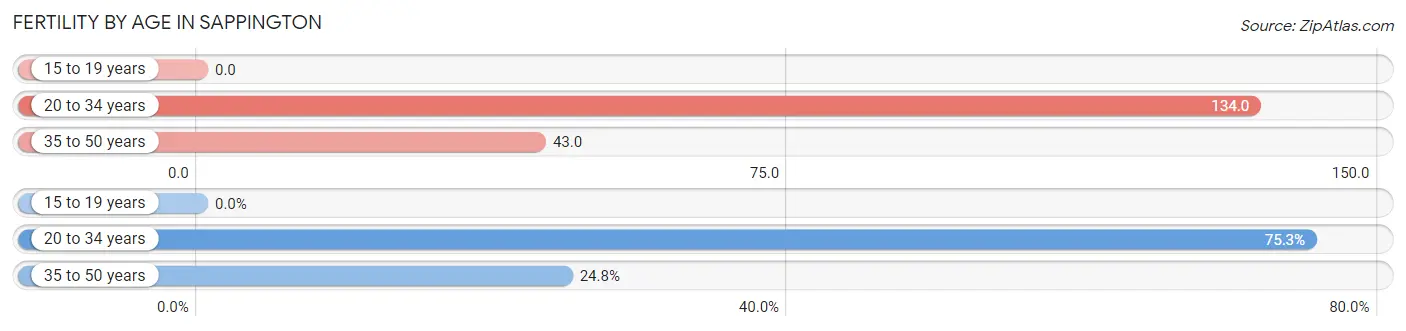
| Age Bracket | Women with Births | Births / 1,000 Women |
| 15 to 19 years | 0 (0.0%) | 0.0 |
| 20 to 34 years | 76 (75.2%) | 134.0 |
| 35 to 50 years | 25 (24.7%) | 43.0 |
| Total | 101 (100.0%) | 82.0 |
Fertility by Age by Marriage Status in Sappington
92.1% of women with births (101) in Sappington are married. The highest percentage of unmarried women with births falls into 35 to 50 years age bracket with 32.0% of them unmarried at the time of birth, while the lowest percentage of unmarried women with births belong to 20 to 34 years age bracket with 0.0% of them unmarried.
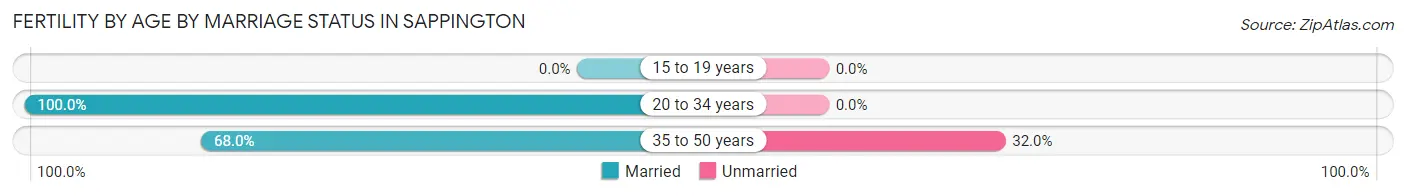
| Age Bracket | Married | Unmarried |
| 15 to 19 years | 0 (0.0%) | 0 (0.0%) |
| 20 to 34 years | 76 (100.0%) | 0 (0.0%) |
| 35 to 50 years | 17 (68.0%) | 8 (32.0%) |
| Total | 93 (92.1%) | 8 (7.9%) |
Fertility by Education in Sappington
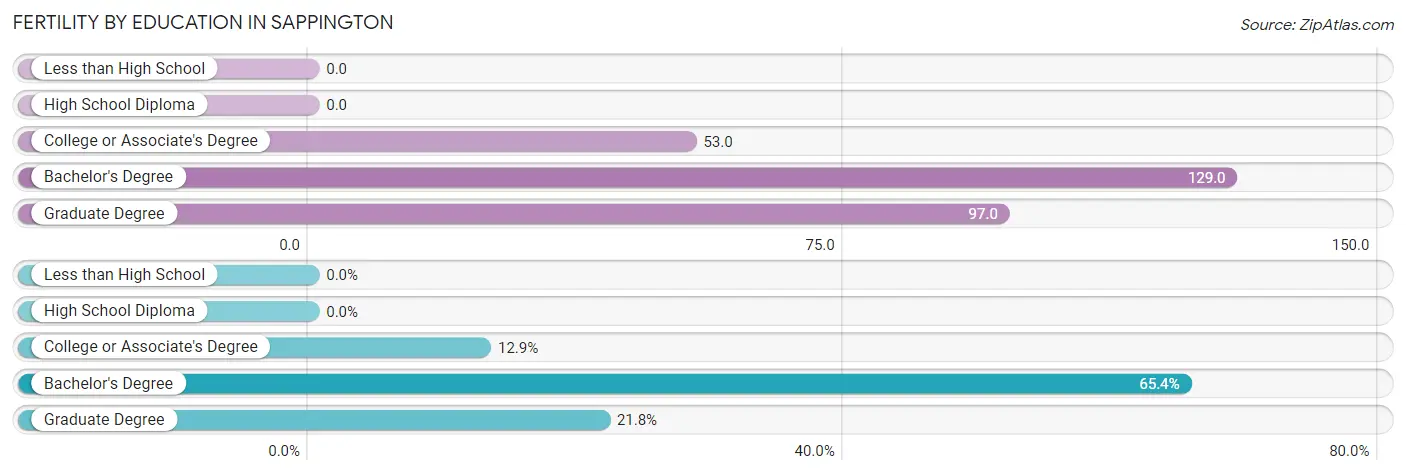
| Educational Attainment | Women with Births | Births / 1,000 Women |
| Less than High School | 0 (0.0%) | 0.0 |
| High School Diploma | 0 (0.0%) | 0.0 |
| College or Associate's Degree | 13 (12.9%) | 53.0 |
| Bachelor's Degree | 66 (65.3%) | 129.0 |
| Graduate Degree | 22 (21.8%) | 97.0 |
| Total | 101 (100.0%) | 82.0 |
Fertility by Education by Marriage Status in Sappington
7.9% of women with births in Sappington are unmarried. Women with the educational attainment of college or associate's degree are most likely to be married with 100.0% of them married at childbirth, while women with the educational attainment of bachelor's degree are least likely to be married with 12.1% of them unmarried at childbirth.
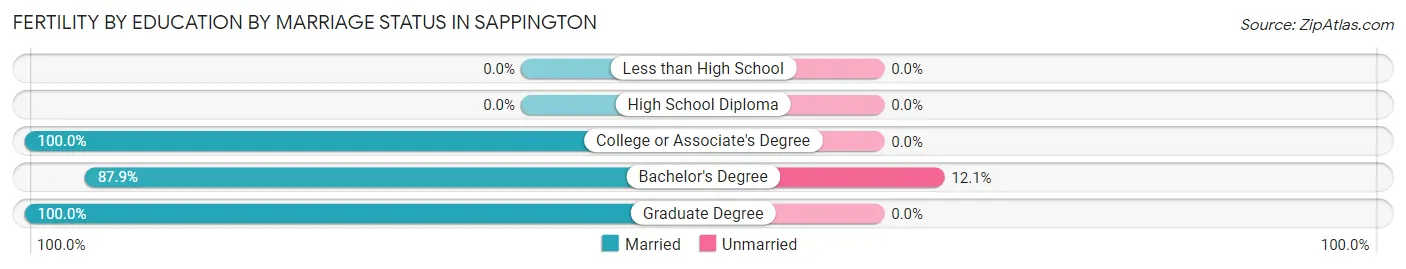
| Educational Attainment | Married | Unmarried |
| Less than High School | 0 (0.0%) | 0 (0.0%) |
| High School Diploma | 0 (0.0%) | 0 (0.0%) |
| College or Associate's Degree | 13 (100.0%) | 0 (0.0%) |
| Bachelor's Degree | 58 (87.9%) | 8 (12.1%) |
| Graduate Degree | 22 (100.0%) | 0 (0.0%) |
| Total | 93 (92.1%) | 8 (7.9%) |
Income in Sappington
Income Overview in Sappington
Per Capita Income in Sappington is $43,063, while median incomes of families and households are $109,286 and $69,757 respectively.
| Characteristic | Number | Measure |
| Per Capita Income | 7,039 | $43,063 |
| Median Family Income | 1,756 | $109,286 |
| Mean Family Income | 1,756 | $131,833 |
| Median Household Income | 3,042 | $69,757 |
| Mean Household Income | 3,042 | $98,821 |
| Income Deficit | 1,756 | $0 |
| Wage / Income Gap (%) | 7,039 | 28.58% |
| Wage / Income Gap ($) | 7,039 | 71.42¢ per $1 |
| Gini / Inequality Index | 7,039 | 0.44 |
Earnings by Sex in Sappington
Average Earnings in Sappington are $48,920, $55,712 for men and $39,789 for women, a difference of 28.6%.
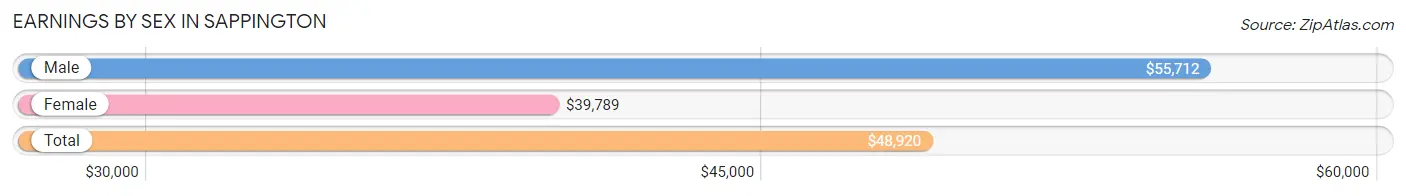
| Sex | Number | Average Earnings |
| Male | 1,881 (52.4%) | $55,712 |
| Female | 1,709 (47.6%) | $39,789 |
| Total | 3,590 (100.0%) | $48,920 |
Earnings by Sex by Income Bracket in Sappington
The most common earnings brackets in Sappington are $100,000+ for men (407 | 21.6%) and $30,000 to $34,999 for women (183 | 10.7%).
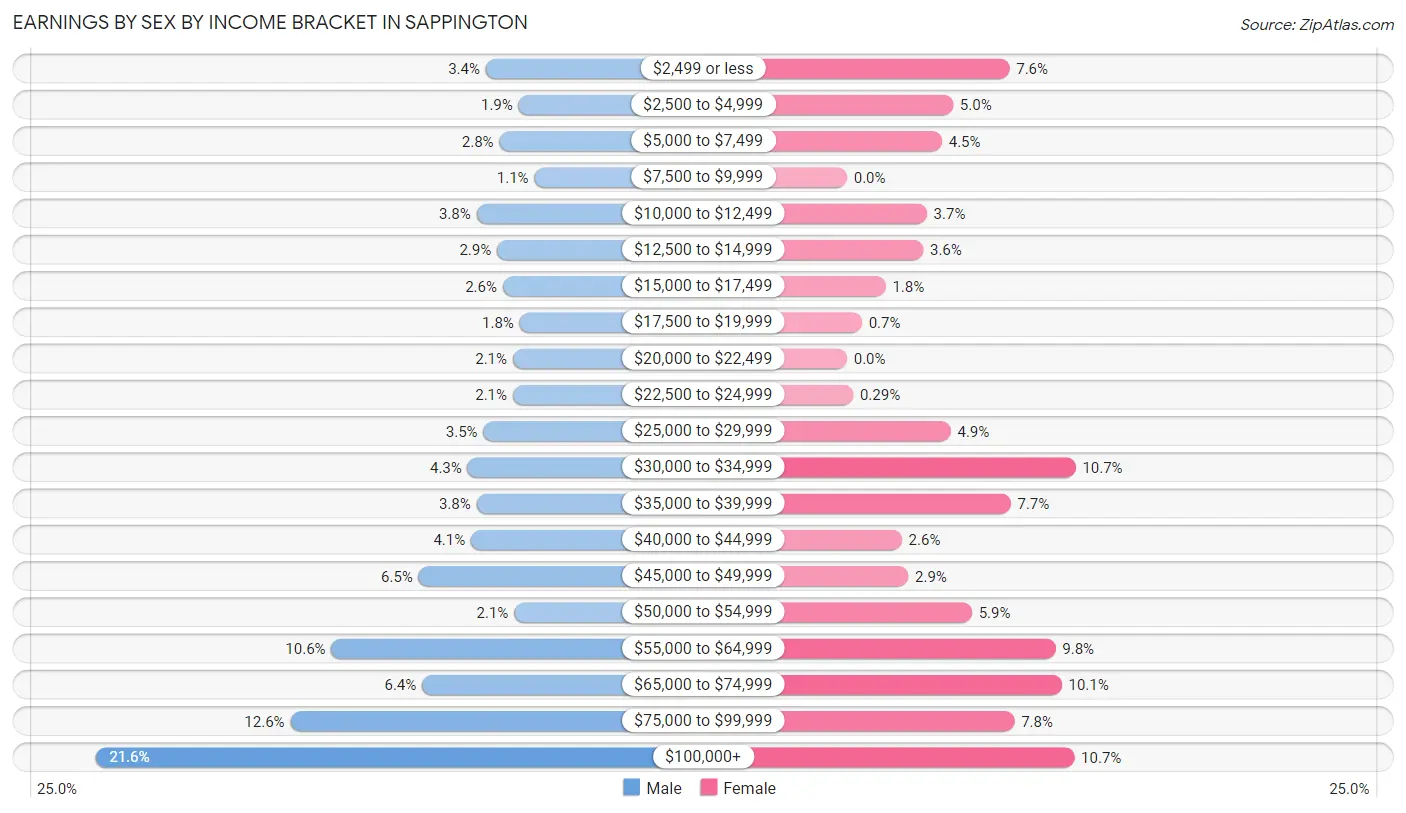
| Income | Male | Female |
| $2,499 or less | 64 (3.4%) | 130 (7.6%) |
| $2,500 to $4,999 | 35 (1.9%) | 85 (5.0%) |
| $5,000 to $7,499 | 52 (2.8%) | 76 (4.4%) |
| $7,500 to $9,999 | 21 (1.1%) | 0 (0.0%) |
| $10,000 to $12,499 | 72 (3.8%) | 64 (3.7%) |
| $12,500 to $14,999 | 54 (2.9%) | 61 (3.6%) |
| $15,000 to $17,499 | 49 (2.6%) | 31 (1.8%) |
| $17,500 to $19,999 | 34 (1.8%) | 12 (0.7%) |
| $20,000 to $22,499 | 40 (2.1%) | 0 (0.0%) |
| $22,500 to $24,999 | 40 (2.1%) | 5 (0.3%) |
| $25,000 to $29,999 | 66 (3.5%) | 83 (4.9%) |
| $30,000 to $34,999 | 80 (4.3%) | 183 (10.7%) |
| $35,000 to $39,999 | 72 (3.8%) | 131 (7.7%) |
| $40,000 to $44,999 | 77 (4.1%) | 44 (2.6%) |
| $45,000 to $49,999 | 123 (6.5%) | 49 (2.9%) |
| $50,000 to $54,999 | 39 (2.1%) | 100 (5.9%) |
| $55,000 to $64,999 | 200 (10.6%) | 167 (9.8%) |
| $65,000 to $74,999 | 120 (6.4%) | 172 (10.1%) |
| $75,000 to $99,999 | 236 (12.6%) | 134 (7.8%) |
| $100,000+ | 407 (21.6%) | 182 (10.6%) |
| Total | 1,881 (100.0%) | 1,709 (100.0%) |
Earnings by Sex by Educational Attainment in Sappington
Average earnings in Sappington are $58,442 for men and $47,727 for women, a difference of 18.3%. Men with an educational attainment of bachelor's degree enjoy the highest average annual earnings of $73,409, while those with college or associate's degree education earn the least with $35,742. Women with an educational attainment of graduate degree earn the most with the average annual earnings of $73,226, while those with less than high school education have the smallest earnings of $33,571.
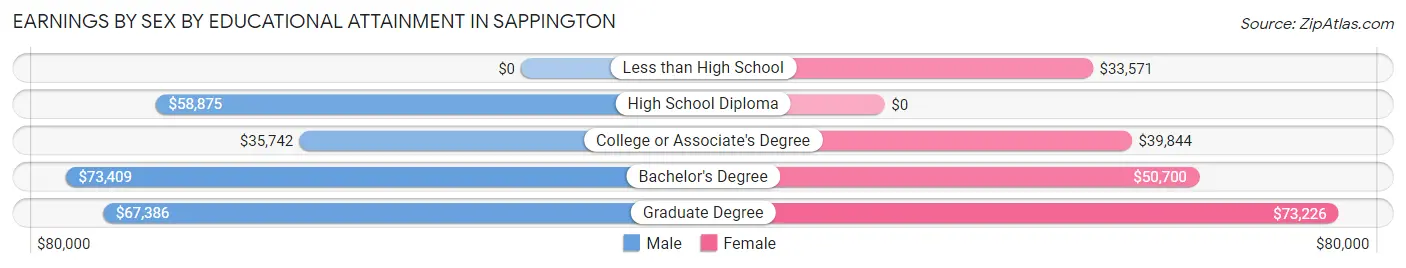
| Educational Attainment | Male Income | Female Income |
| Less than High School | - | - |
| High School Diploma | $58,875 | $0 |
| College or Associate's Degree | $35,742 | $39,844 |
| Bachelor's Degree | $73,409 | $50,700 |
| Graduate Degree | $67,386 | $73,226 |
| Total | $58,442 | $47,727 |
Family Income in Sappington
Family Income Brackets in Sappington
According to the Sappington family income data, there are 471 families falling into the $100,000 to $149,999 income range, which is the most common income bracket and makes up 26.8% of all families.
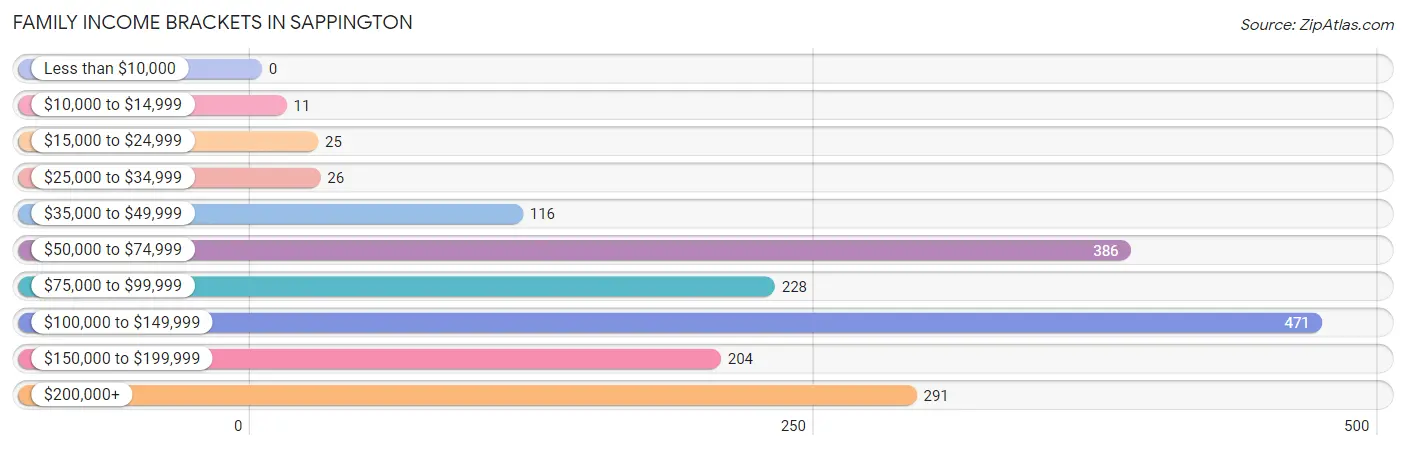
| Income Bracket | # Families | % Families |
| Less than $10,000 | 0 | 0.0% |
| $10,000 to $14,999 | 11 | 0.6% |
| $15,000 to $24,999 | 25 | 1.4% |
| $25,000 to $34,999 | 26 | 1.5% |
| $35,000 to $49,999 | 116 | 6.6% |
| $50,000 to $74,999 | 386 | 22.0% |
| $75,000 to $99,999 | 228 | 13.0% |
| $100,000 to $149,999 | 471 | 26.8% |
| $150,000 to $199,999 | 204 | 11.6% |
| $200,000+ | 291 | 16.6% |
Family Income by Famaliy Size in Sappington
5-person families (216 | 12.3%) account for the highest median family income in Sappington with $164,750 per family, while 2-person families (765 | 43.6%) have the highest median income of $44,414 per family member.
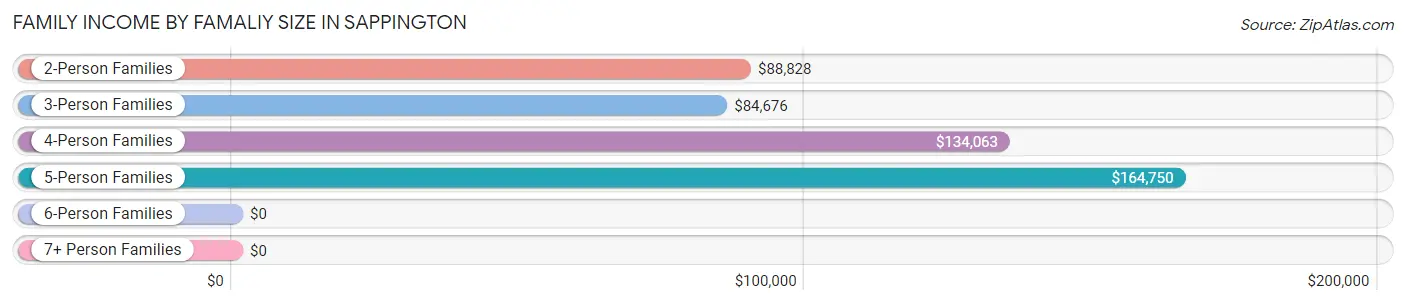
| Income Bracket | # Families | Median Income |
| 2-Person Families | 765 (43.6%) | $88,828 |
| 3-Person Families | 421 (24.0%) | $84,676 |
| 4-Person Families | 313 (17.8%) | $134,063 |
| 5-Person Families | 216 (12.3%) | $164,750 |
| 6-Person Families | 29 (1.7%) | $0 |
| 7+ Person Families | 12 (0.7%) | $0 |
| Total | 1,756 (100.0%) | $109,286 |
Family Income by Number of Earners in Sappington
The median family income in Sappington is $109,286, with families comprising 3+ earners (141) having the highest median family income of $245,096, while families with no earners (158) have the lowest median family income of $68,929, accounting for 8.0% and 9.0% of families, respectively.
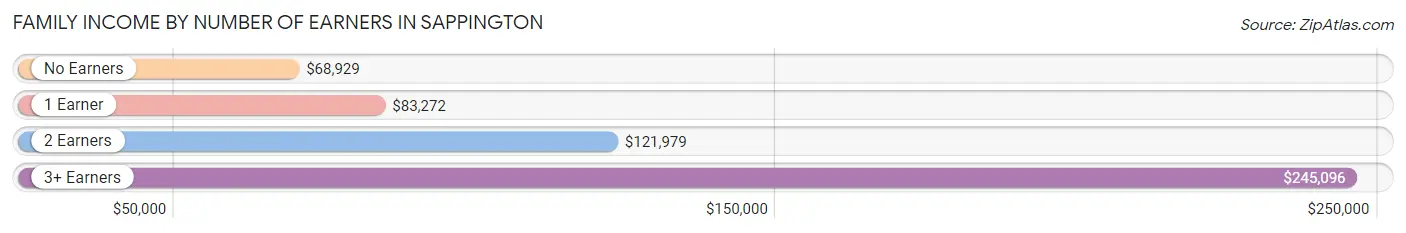
| Number of Earners | # Families | Median Income |
| No Earners | 158 (9.0%) | $68,929 |
| 1 Earner | 661 (37.6%) | $83,272 |
| 2 Earners | 796 (45.3%) | $121,979 |
| 3+ Earners | 141 (8.0%) | $245,096 |
| Total | 1,756 (100.0%) | $109,286 |
Household Income in Sappington
Household Income Brackets in Sappington
With 724 households falling in the category, the $50,000 to $74,999 income range is the most frequent in Sappington, accounting for 23.8% of all households. In contrast, only 46 households (1.5%) fall into the $10,000 to $14,999 income bracket, making it the least populous group.
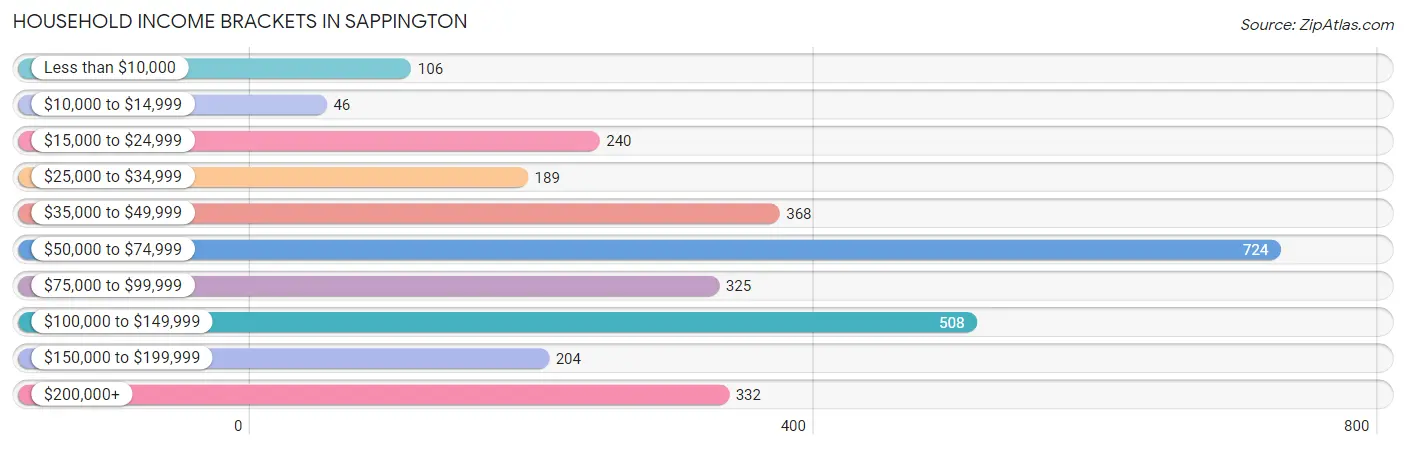
| Income Bracket | # Households | % Households |
| Less than $10,000 | 106 | 3.5% |
| $10,000 to $14,999 | 46 | 1.5% |
| $15,000 to $24,999 | 240 | 7.9% |
| $25,000 to $34,999 | 189 | 6.2% |
| $35,000 to $49,999 | 368 | 12.1% |
| $50,000 to $74,999 | 724 | 23.8% |
| $75,000 to $99,999 | 325 | 10.7% |
| $100,000 to $149,999 | 508 | 16.7% |
| $150,000 to $199,999 | 204 | 6.7% |
| $200,000+ | 332 | 10.9% |
Household Income by Householder Age in Sappington
The median household income in Sappington is $69,757, with the highest median household income of $96,964 found in the 45 to 64 years age bracket for the primary householder. A total of 894 households (29.4%) fall into this category. Meanwhile, the 15 to 24 years age bracket for the primary householder has the lowest median household income of $0, with 13 households (0.4%) in this group.
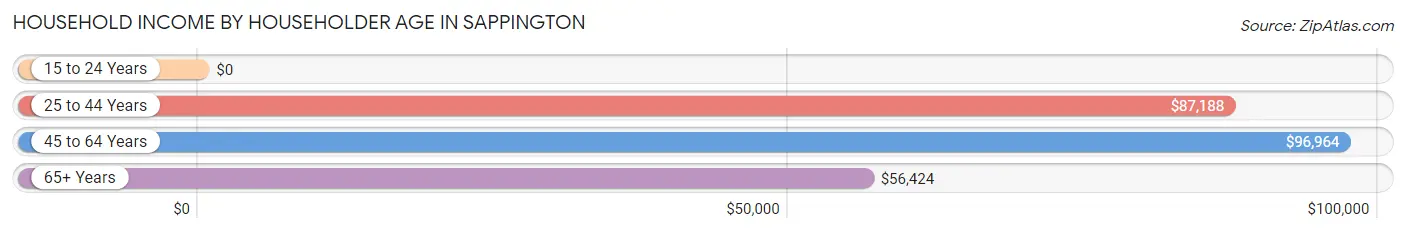
| Income Bracket | # Households | Median Income |
| 15 to 24 Years | 13 (0.4%) | $0 |
| 25 to 44 Years | 928 (30.5%) | $87,188 |
| 45 to 64 Years | 894 (29.4%) | $96,964 |
| 65+ Years | 1,207 (39.7%) | $56,424 |
| Total | 3,042 (100.0%) | $69,757 |
Poverty in Sappington
Income Below Poverty by Sex and Age in Sappington
With 3.2% poverty level for males and 6.1% for females among the residents of Sappington, 12 to 14 year old males and 75 year old and over females are the most vulnerable to poverty, with 18 males (15.1%) and 61 females (14.6%) in their respective age groups living below the poverty level.
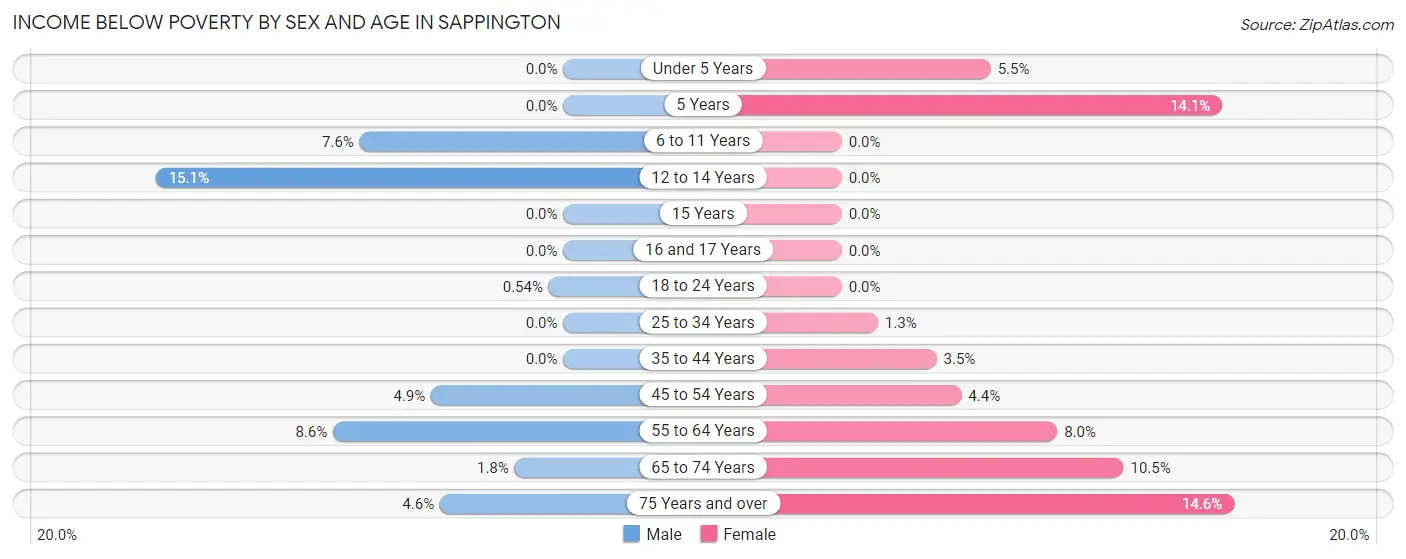
| Age Bracket | Male | Female |
| Under 5 Years | 0 (0.0%) | 14 (5.5%) |
| 5 Years | 0 (0.0%) | 12 (14.1%) |
| 6 to 11 Years | 18 (7.6%) | 0 (0.0%) |
| 12 to 14 Years | 18 (15.1%) | 0 (0.0%) |
| 15 Years | 0 (0.0%) | 0 (0.0%) |
| 16 and 17 Years | 0 (0.0%) | 0 (0.0%) |
| 18 to 24 Years | 1 (0.5%) | 0 (0.0%) |
| 25 to 34 Years | 0 (0.0%) | 6 (1.3%) |
| 35 to 44 Years | 0 (0.0%) | 15 (3.5%) |
| 45 to 54 Years | 20 (4.9%) | 14 (4.4%) |
| 55 to 64 Years | 33 (8.6%) | 38 (8.0%) |
| 65 to 74 Years | 6 (1.8%) | 57 (10.5%) |
| 75 Years and over | 14 (4.6%) | 61 (14.6%) |
| Total | 110 (3.2%) | 217 (6.1%) |
Income Above Poverty by Sex and Age in Sappington
According to the poverty statistics in Sappington, males aged under 5 years and females aged 6 to 11 years are the age groups that are most secure financially, with 100.0% of males and 100.0% of females in these age groups living above the poverty line.
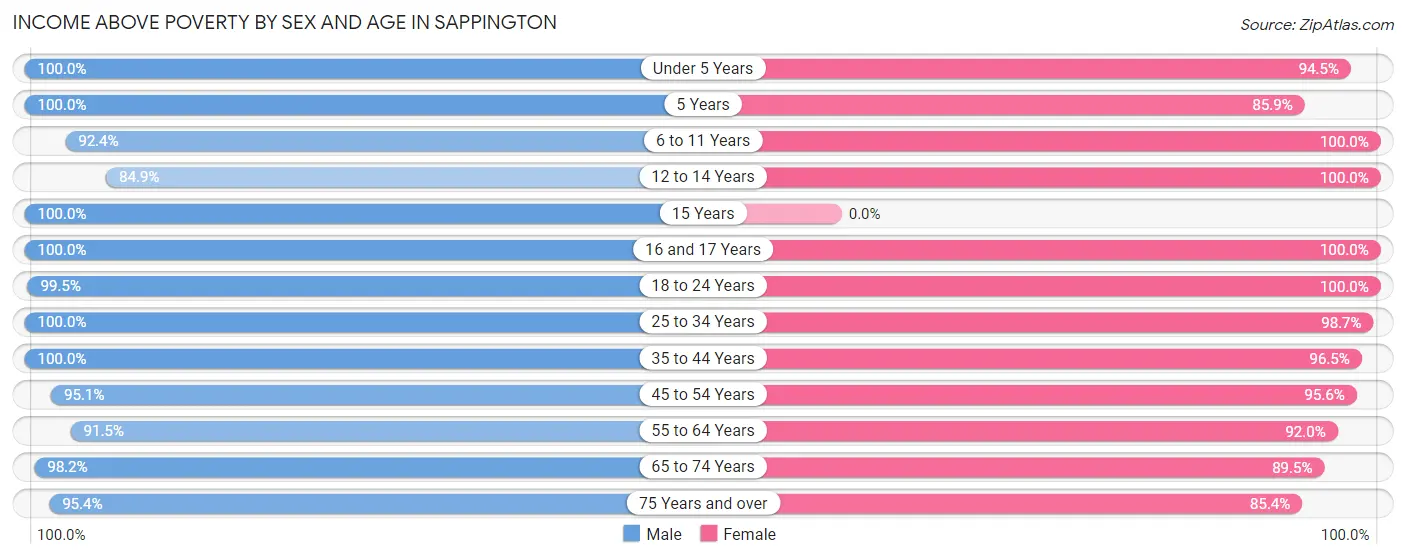
| Age Bracket | Male | Female |
| Under 5 Years | 163 (100.0%) | 239 (94.5%) |
| 5 Years | 34 (100.0%) | 73 (85.9%) |
| 6 to 11 Years | 220 (92.4%) | 331 (100.0%) |
| 12 to 14 Years | 101 (84.9%) | 45 (100.0%) |
| 15 Years | 151 (100.0%) | 0 (0.0%) |
| 16 and 17 Years | 166 (100.0%) | 38 (100.0%) |
| 18 to 24 Years | 183 (99.5%) | 169 (100.0%) |
| 25 to 34 Years | 478 (100.0%) | 443 (98.7%) |
| 35 to 44 Years | 473 (100.0%) | 411 (96.5%) |
| 45 to 54 Years | 387 (95.1%) | 301 (95.6%) |
| 55 to 64 Years | 353 (91.4%) | 437 (92.0%) |
| 65 to 74 Years | 326 (98.2%) | 488 (89.5%) |
| 75 Years and over | 292 (95.4%) | 358 (85.4%) |
| Total | 3,327 (96.8%) | 3,333 (93.9%) |
Income Below Poverty Among Married-Couple Families in Sappington
The poverty statistics for married-couple families in Sappington show that 1.5% or 20 of the total 1,309 families live below the poverty line. Families with 1 or 2 children have the highest poverty rate of 3.2%, comprising of 14 families. On the other hand, families with 3 or 4 children have the lowest poverty rate of 0.0%, which includes 0 families.
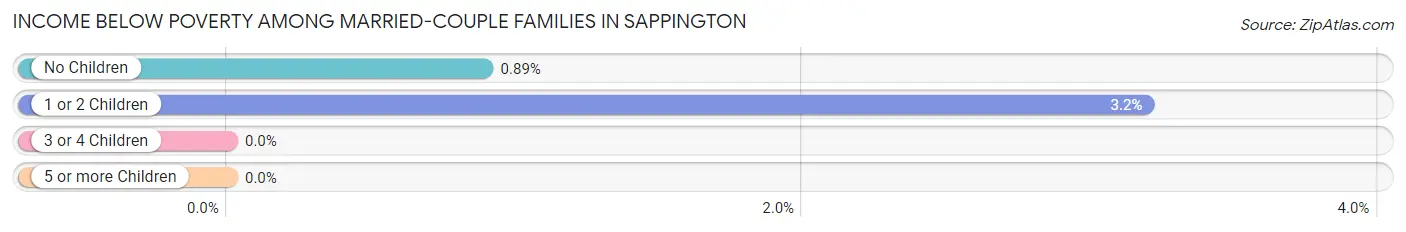
| Children | Above Poverty | Below Poverty |
| No Children | 669 (99.1%) | 6 (0.9%) |
| 1 or 2 Children | 425 (96.8%) | 14 (3.2%) |
| 3 or 4 Children | 195 (100.0%) | 0 (0.0%) |
| 5 or more Children | 0 (0.0%) | 0 (0.0%) |
| Total | 1,289 (98.5%) | 20 (1.5%) |
Income Below Poverty Among Single-Parent Households in Sappington
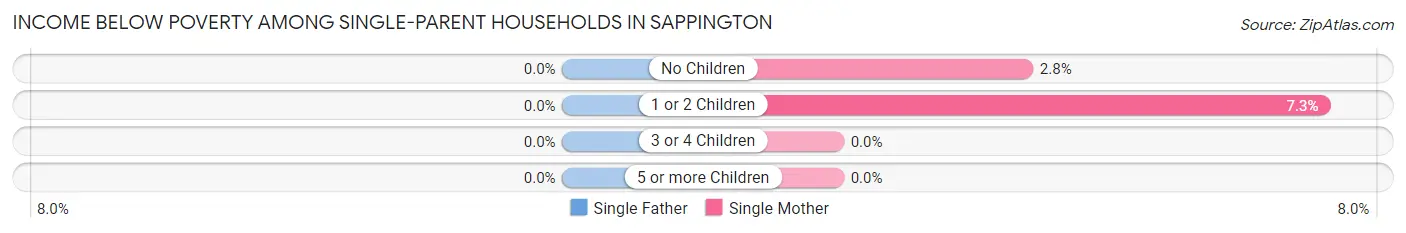
| Children | Single Father | Single Mother |
| No Children | 0 (0.0%) | 4 (2.8%) |
| 1 or 2 Children | 0 (0.0%) | 15 (7.2%) |
| 3 or 4 Children | 0 (0.0%) | 0 (0.0%) |
| 5 or more Children | 0 (0.0%) | 0 (0.0%) |
| Total | 0 (0.0%) | 19 (5.2%) |
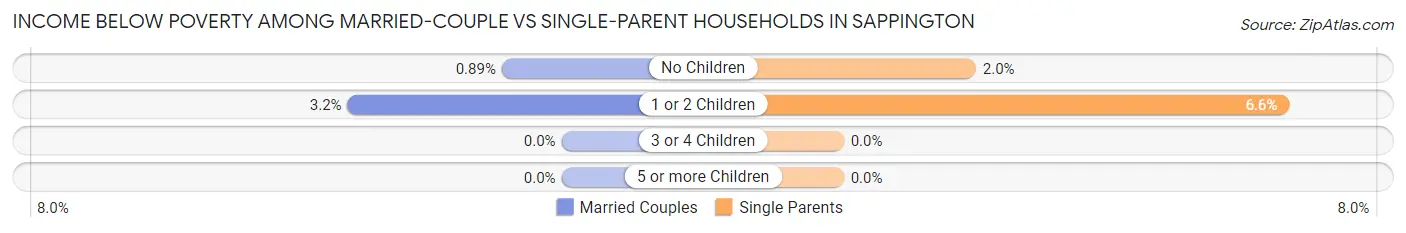
Income Below Poverty Among Married-Couple vs Single-Parent Households in Sappington
The poverty data for Sappington shows that 20 of the married-couple family households (1.5%) and 19 of the single-parent households (4.3%) are living below the poverty level. Within the married-couple family households, those with 1 or 2 children have the highest poverty rate, with 14 households (3.2%) falling below the poverty line. Among the single-parent households, those with 1 or 2 children have the highest poverty rate, with 15 household (6.6%) living below poverty.
| Children | Married-Couple Families | Single-Parent Households |
| No Children | 6 (0.9%) | 4 (2.0%) |
| 1 or 2 Children | 14 (3.2%) | 15 (6.6%) |
| 3 or 4 Children | 0 (0.0%) | 0 (0.0%) |
| 5 or more Children | 0 (0.0%) | 0 (0.0%) |
| Total | 20 (1.5%) | 19 (4.3%) |
Employment Characteristics in Sappington
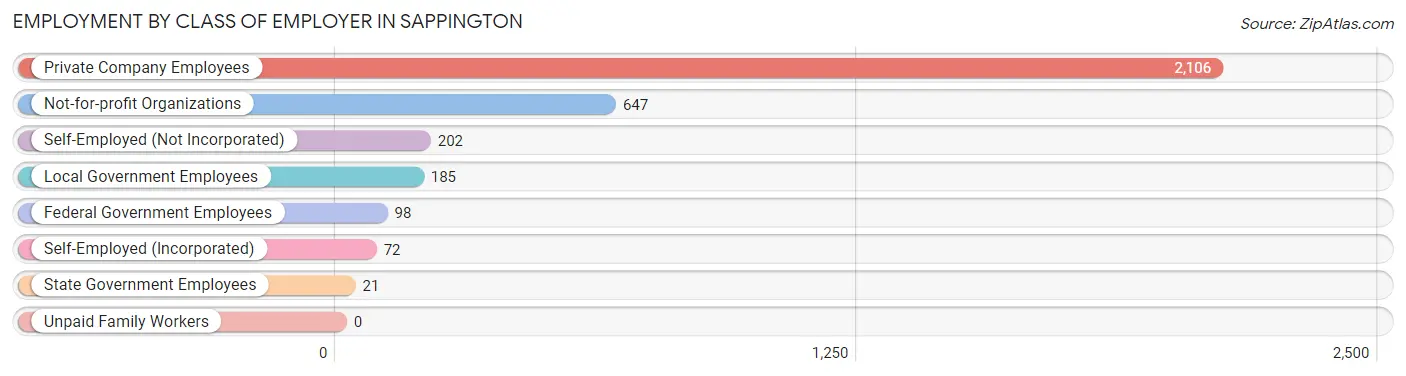
Employment by Class of Employer in Sappington
Among the 3,331 employed individuals in Sappington, private company employees (2,106 | 63.2%), not-for-profit organizations (647 | 19.4%), and self-employed (not incorporated) (202 | 6.1%) make up the most common classes of employment.
| Employer Class | # Employees | % Employees |
| Private Company Employees | 2,106 | 63.2% |
| Self-Employed (Incorporated) | 72 | 2.2% |
| Self-Employed (Not Incorporated) | 202 | 6.1% |
| Not-for-profit Organizations | 647 | 19.4% |
| Local Government Employees | 185 | 5.6% |
| State Government Employees | 21 | 0.6% |
| Federal Government Employees | 98 | 2.9% |
| Unpaid Family Workers | 0 | 0.0% |
| Total | 3,331 | 100.0% |
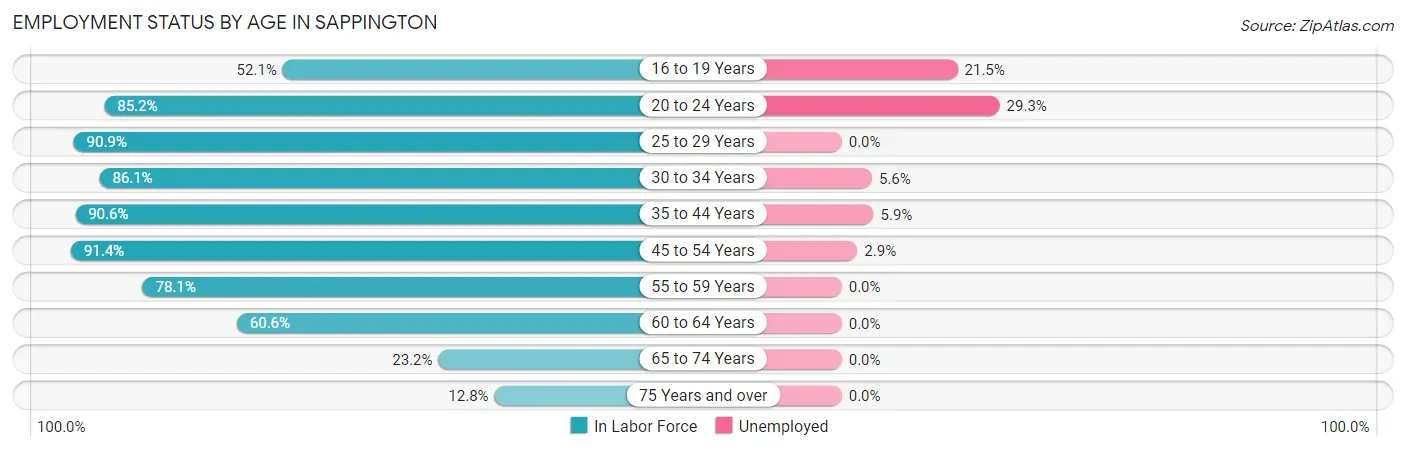
Employment Status by Age in Sappington
According to the labor force statistics for Sappington, out of the total population over 16 years of age (5,584), 63.8% or 3,563 individuals are in the labor force, with 5.2% or 185 of them unemployed. The age group with the highest labor force participation rate is 45 to 54 years, with 91.4% or 662 individuals in the labor force. Within the labor force, the 20 to 24 years age range has the highest percentage of unemployed individuals, with 29.3% or 61 of them being unemployed.
| Age Bracket | In Labor Force | Unemployed |
| 16 to 19 Years | 163 (52.1%) | 35 (21.5%) |
| 20 to 24 Years | 208 (85.2%) | 61 (29.3%) |
| 25 to 29 Years | 389 (90.9%) | 0 (0.0%) |
| 30 to 34 Years | 432 (86.1%) | 24 (5.6%) |
| 35 to 44 Years | 815 (90.6%) | 48 (5.9%) |
| 45 to 54 Years | 662 (91.4%) | 19 (2.9%) |
| 55 to 59 Years | 332 (78.1%) | 0 (0.0%) |
| 60 to 64 Years | 264 (60.6%) | 0 (0.0%) |
| 65 to 74 Years | 206 (23.2%) | 0 (0.0%) |
| 75 Years and over | 93 (12.8%) | 0 (0.0%) |
| Total | 3,563 (63.8%) | 185 (5.2%) |
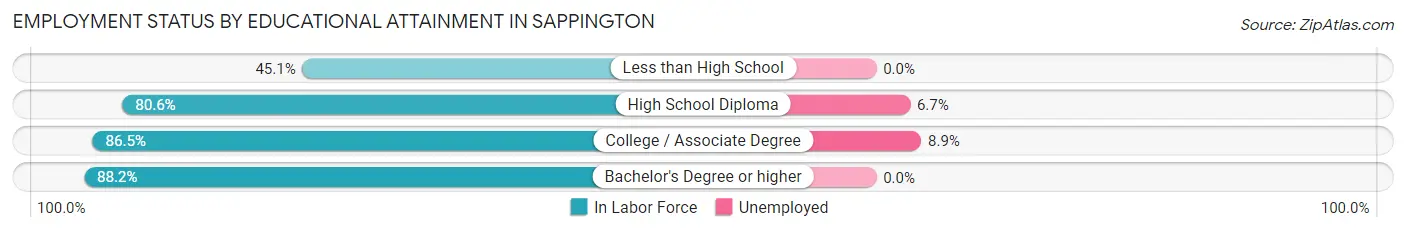
Employment Status by Educational Attainment in Sappington
According to labor force statistics for Sappington, 84.7% of individuals (2,893) out of the total population between 25 and 64 years of age (3,415) are in the labor force, with 3.1% or 90 of them being unemployed. The group with the highest labor force participation rate are those with the educational attainment of bachelor's degree or higher, with 88.2% or 1,696 individuals in the labor force. Within the labor force, individuals with college / associate degree education have the highest percentage of unemployment, with 8.9% or 61 of them being unemployed.
| Educational Attainment | In Labor Force | Unemployed |
| Less than High School | 65 (45.1%) | 0 (0.0%) |
| High School Diploma | 448 (80.6%) | 37 (6.7%) |
| College / Associate Degree | 685 (86.5%) | 70 (8.9%) |
| Bachelor's Degree or higher | 1,696 (88.2%) | 0 (0.0%) |
| Total | 2,893 (84.7%) | 106 (3.1%) |
Employment Occupations by Sex in Sappington
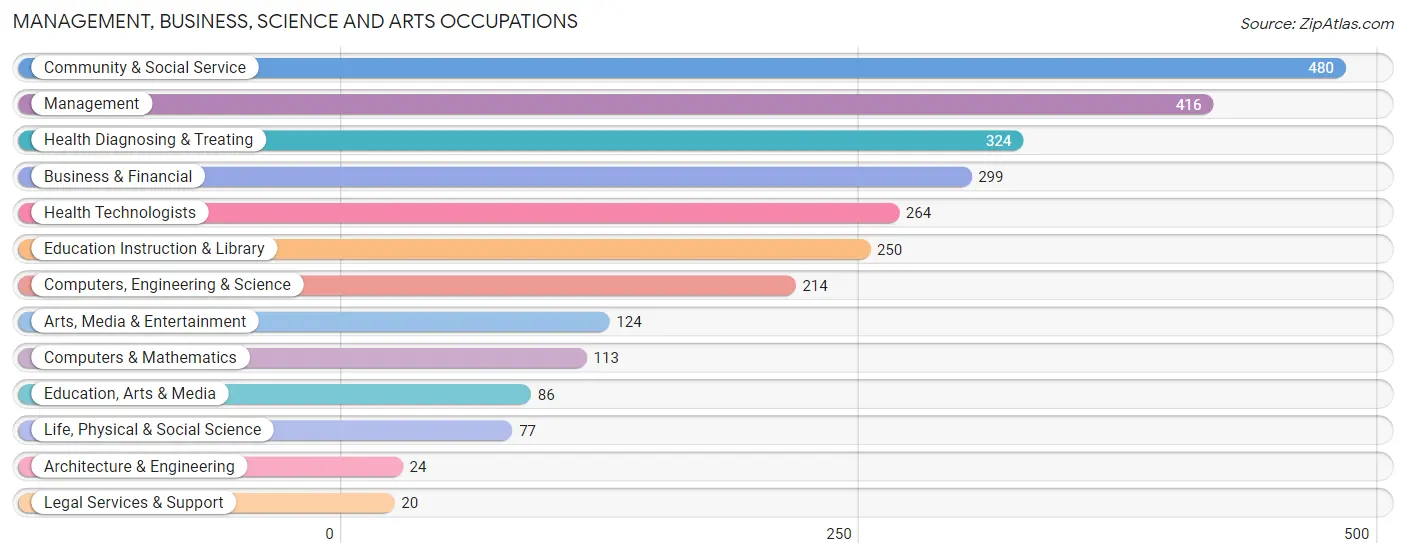
Management, Business, Science and Arts Occupations
The most common Management, Business, Science and Arts occupations in Sappington are Community & Social Service (480 | 14.2%), Management (416 | 12.3%), Health Diagnosing & Treating (324 | 9.6%), Business & Financial (299 | 8.8%), and Health Technologists (264 | 7.8%).
Management, Business, Science and Arts Occupations by Sex
Within the Management, Business, Science and Arts occupations in Sappington, the most male-oriented occupations are Architecture & Engineering (100.0%), Computers & Mathematics (90.3%), and Computers, Engineering & Science (79.0%), while the most female-oriented occupations are Education Instruction & Library (89.6%), Community & Social Service (79.0%), and Arts, Media & Entertainment (74.2%).
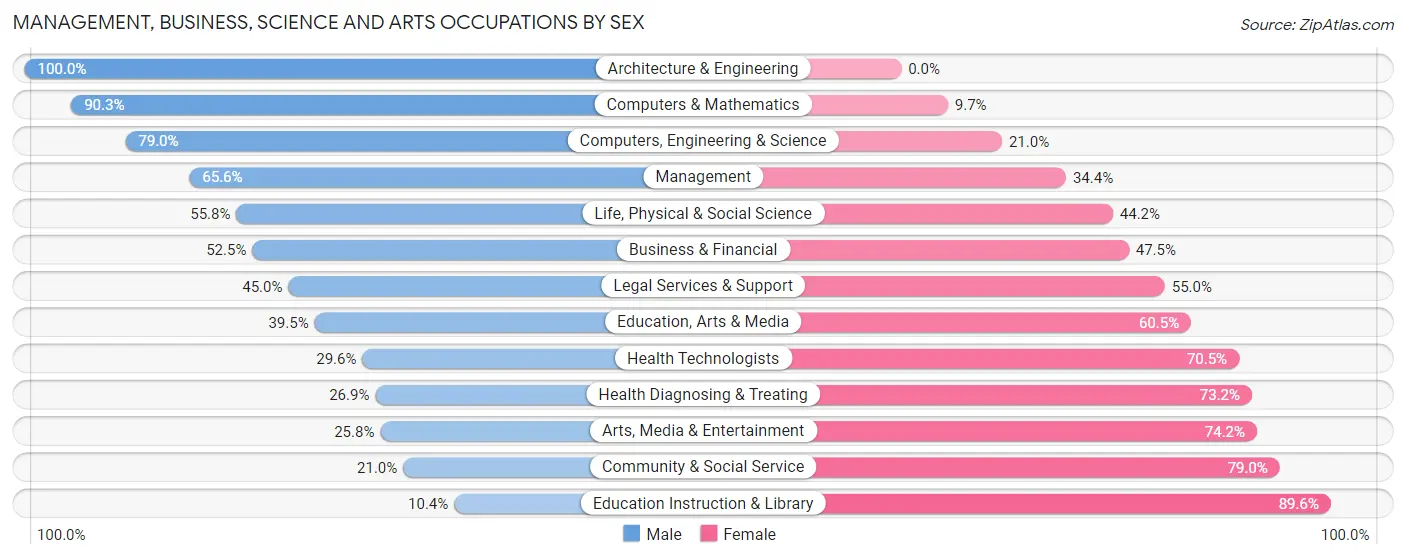
| Occupation | Male | Female |
| Management | 273 (65.6%) | 143 (34.4%) |
| Business & Financial | 157 (52.5%) | 142 (47.5%) |
| Computers, Engineering & Science | 169 (79.0%) | 45 (21.0%) |
| Computers & Mathematics | 102 (90.3%) | 11 (9.7%) |
| Architecture & Engineering | 24 (100.0%) | 0 (0.0%) |
| Life, Physical & Social Science | 43 (55.8%) | 34 (44.2%) |
| Community & Social Service | 101 (21.0%) | 379 (79.0%) |
| Education, Arts & Media | 34 (39.5%) | 52 (60.5%) |
| Legal Services & Support | 9 (45.0%) | 11 (55.0%) |
| Education Instruction & Library | 26 (10.4%) | 224 (89.6%) |
| Arts, Media & Entertainment | 32 (25.8%) | 92 (74.2%) |
| Health Diagnosing & Treating | 87 (26.9%) | 237 (73.2%) |
| Health Technologists | 78 (29.5%) | 186 (70.5%) |
| Total (Category) | 787 (45.4%) | 946 (54.6%) |
| Total (Overall) | 1,712 (50.7%) | 1,665 (49.3%) |
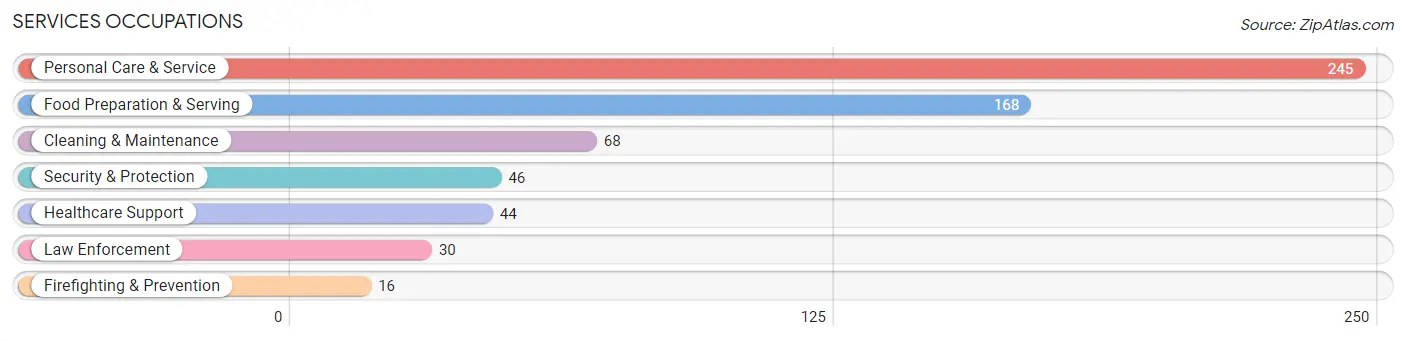
Services Occupations
The most common Services occupations in Sappington are Personal Care & Service (245 | 7.2%), Food Preparation & Serving (168 | 5.0%), Cleaning & Maintenance (68 | 2.0%), Security & Protection (46 | 1.4%), and Healthcare Support (44 | 1.3%).
Services Occupations by Sex
Within the Services occupations in Sappington, the most male-oriented occupations are Security & Protection (100.0%), Firefighting & Prevention (100.0%), and Law Enforcement (100.0%), while the most female-oriented occupations are Healthcare Support (100.0%), Personal Care & Service (84.9%), and Food Preparation & Serving (61.9%).
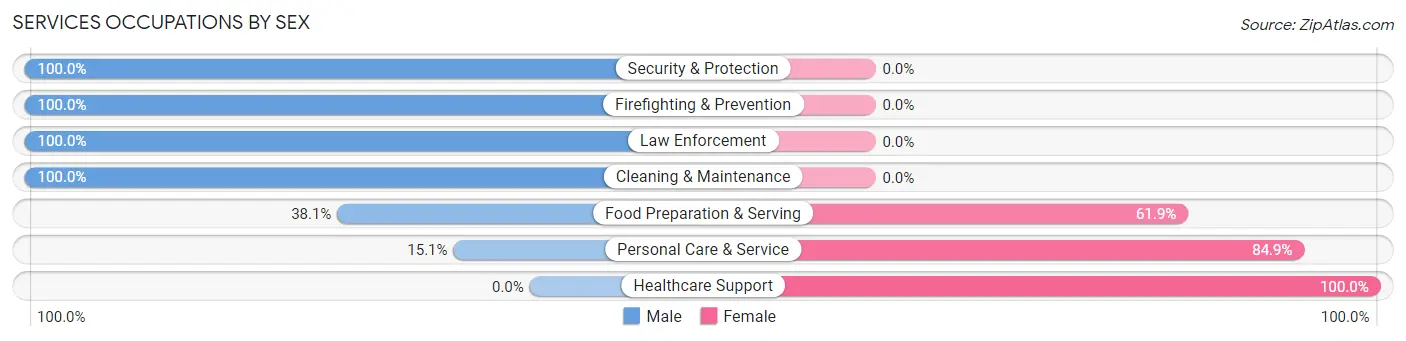
| Occupation | Male | Female |
| Healthcare Support | 0 (0.0%) | 44 (100.0%) |
| Security & Protection | 46 (100.0%) | 0 (0.0%) |
| Firefighting & Prevention | 16 (100.0%) | 0 (0.0%) |
| Law Enforcement | 30 (100.0%) | 0 (0.0%) |
| Food Preparation & Serving | 64 (38.1%) | 104 (61.9%) |
| Cleaning & Maintenance | 68 (100.0%) | 0 (0.0%) |
| Personal Care & Service | 37 (15.1%) | 208 (84.9%) |
| Total (Category) | 215 (37.7%) | 356 (62.4%) |
| Total (Overall) | 1,712 (50.7%) | 1,665 (49.3%) |
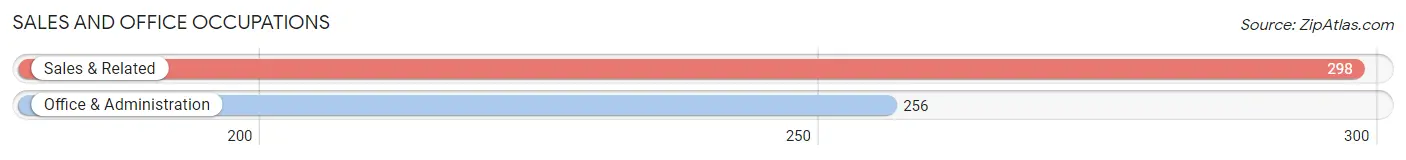
Sales and Office Occupations
The most common Sales and Office occupations in Sappington are Sales & Related (298 | 8.8%), and Office & Administration (256 | 7.6%).
Sales and Office Occupations by Sex
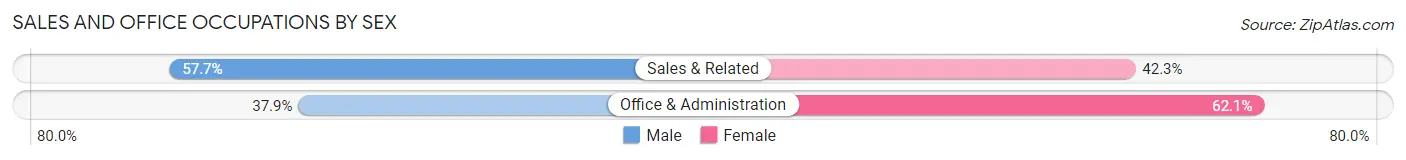
| Occupation | Male | Female |
| Sales & Related | 172 (57.7%) | 126 (42.3%) |
| Office & Administration | 97 (37.9%) | 159 (62.1%) |
| Total (Category) | 269 (48.6%) | 285 (51.4%) |
| Total (Overall) | 1,712 (50.7%) | 1,665 (49.3%) |
Natural Resources, Construction and Maintenance Occupations
The most common Natural Resources, Construction and Maintenance occupations in Sappington are Construction & Extraction (110 | 3.3%), Installation, Maintenance & Repair (30 | 0.9%), and Farming, Fishing & Forestry (11 | 0.3%).
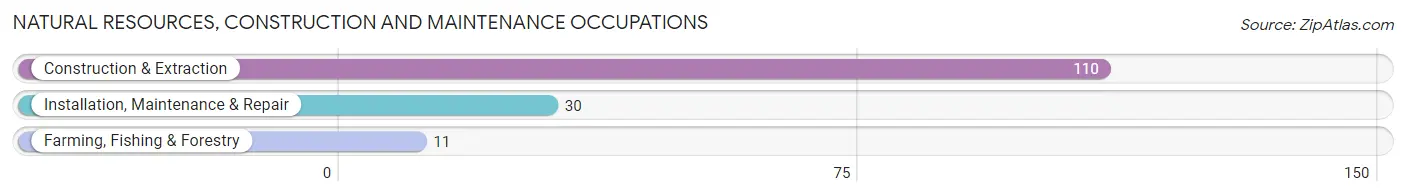
Natural Resources, Construction and Maintenance Occupations by Sex
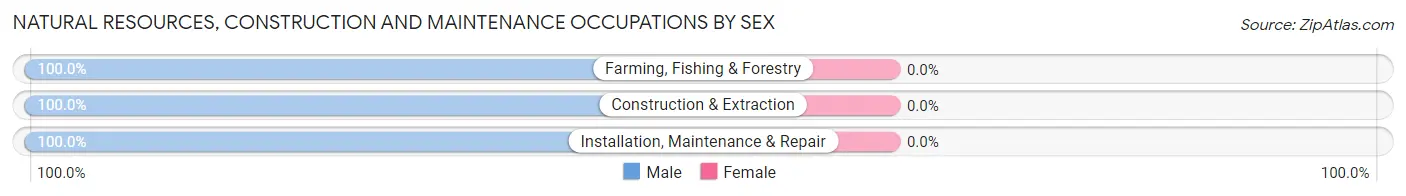
| Occupation | Male | Female |
| Farming, Fishing & Forestry | 11 (100.0%) | 0 (0.0%) |
| Construction & Extraction | 110 (100.0%) | 0 (0.0%) |
| Installation, Maintenance & Repair | 30 (100.0%) | 0 (0.0%) |
| Total (Category) | 151 (100.0%) | 0 (0.0%) |
| Total (Overall) | 1,712 (50.7%) | 1,665 (49.3%) |
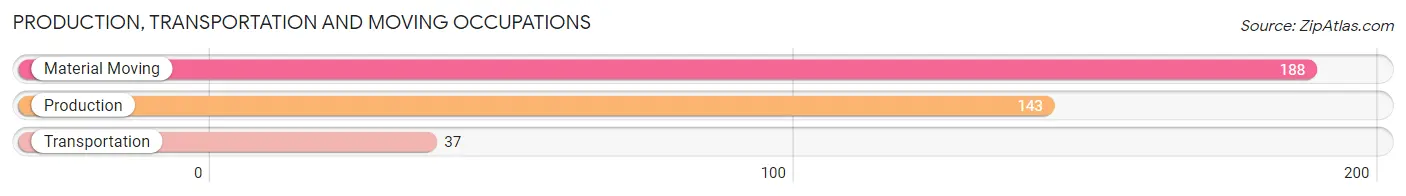
Production, Transportation and Moving Occupations
The most common Production, Transportation and Moving occupations in Sappington are Material Moving (188 | 5.6%), Production (143 | 4.2%), and Transportation (37 | 1.1%).
Production, Transportation and Moving Occupations by Sex
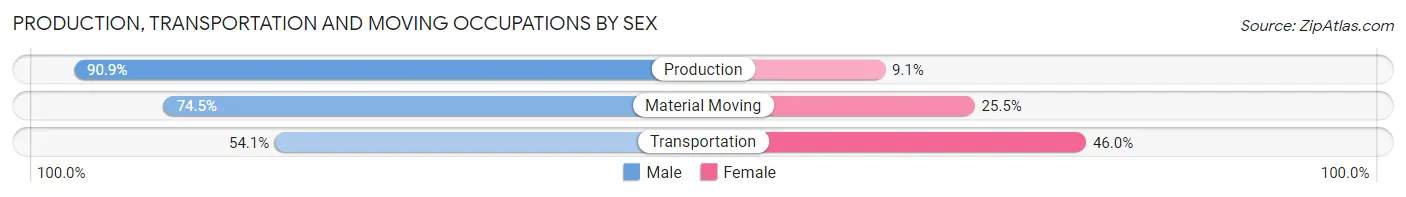
| Occupation | Male | Female |
| Production | 130 (90.9%) | 13 (9.1%) |
| Transportation | 20 (54.0%) | 17 (46.0%) |
| Material Moving | 140 (74.5%) | 48 (25.5%) |
| Total (Category) | 290 (78.8%) | 78 (21.2%) |
| Total (Overall) | 1,712 (50.7%) | 1,665 (49.3%) |
Employment Industries by Sex in Sappington
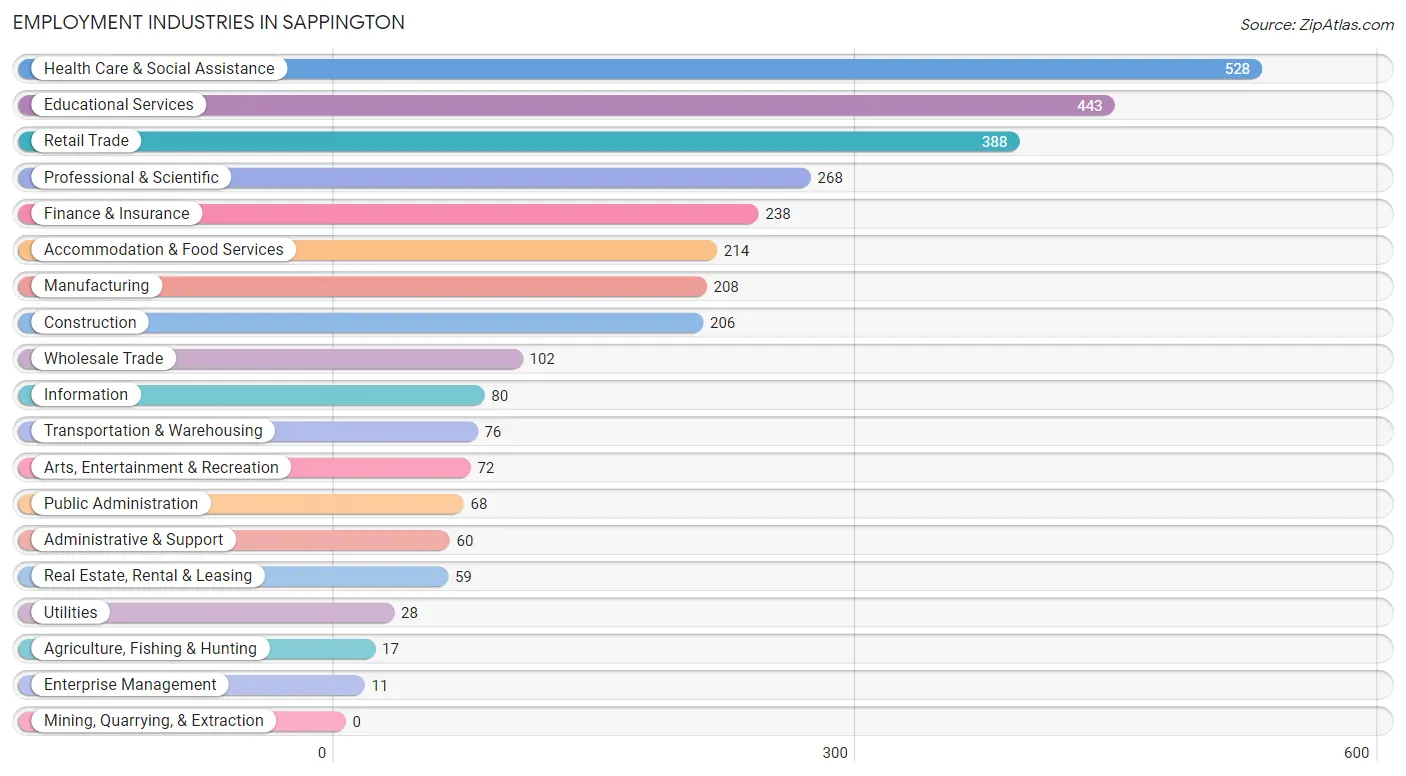
Employment Industries in Sappington
The major employment industries in Sappington include Health Care & Social Assistance (528 | 15.6%), Educational Services (443 | 13.1%), Retail Trade (388 | 11.5%), Professional & Scientific (268 | 7.9%), and Finance & Insurance (238 | 7.0%).
Employment Industries by Sex in Sappington
The Sappington industries that see more men than women are Agriculture, Fishing & Hunting (100.0%), Wholesale Trade (100.0%), and Manufacturing (91.3%), whereas the industries that tend to have a higher number of women are Enterprise Management (100.0%), Health Care & Social Assistance (75.6%), and Educational Services (72.7%).
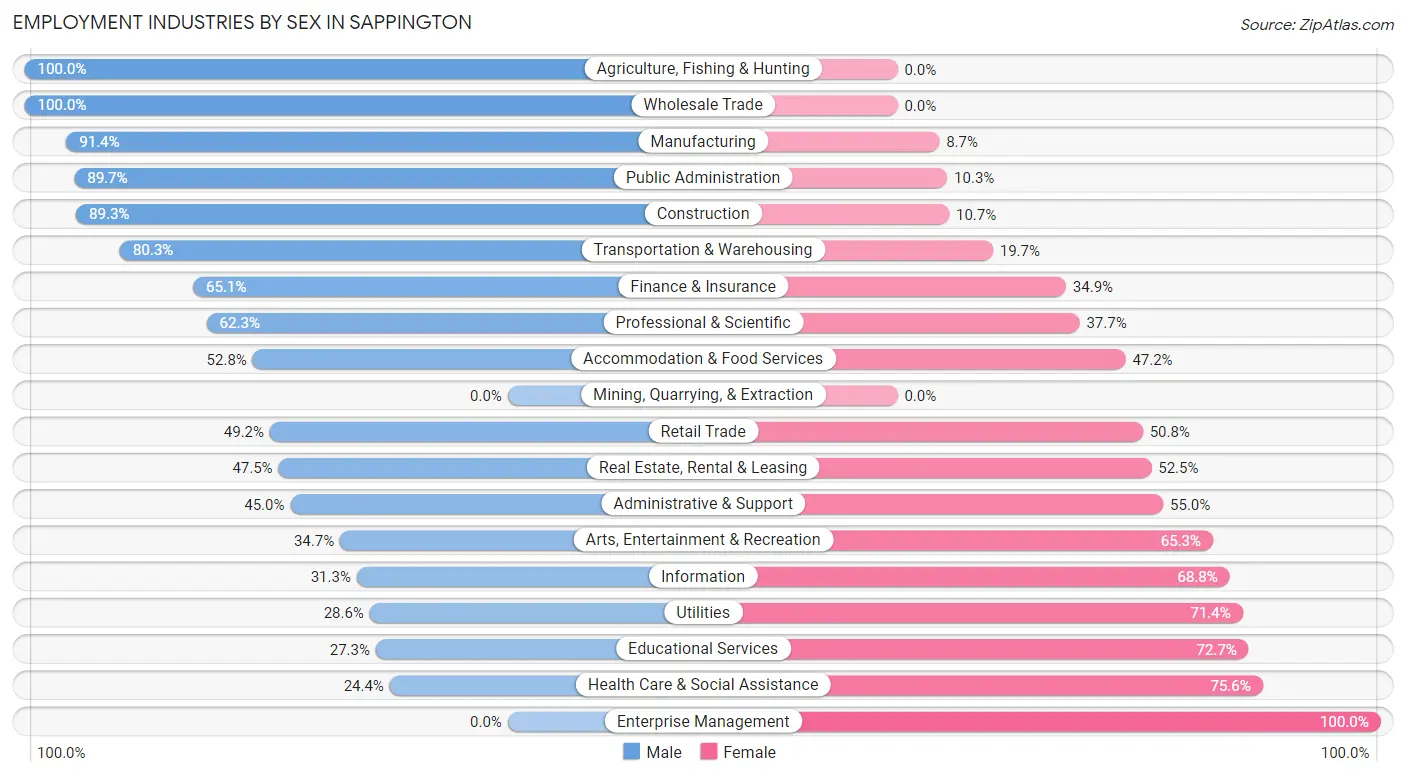
| Industry | Male | Female |
| Agriculture, Fishing & Hunting | 17 (100.0%) | 0 (0.0%) |
| Mining, Quarrying, & Extraction | 0 (0.0%) | 0 (0.0%) |
| Construction | 184 (89.3%) | 22 (10.7%) |
| Manufacturing | 190 (91.3%) | 18 (8.6%) |
| Wholesale Trade | 102 (100.0%) | 0 (0.0%) |
| Retail Trade | 191 (49.2%) | 197 (50.8%) |
| Transportation & Warehousing | 61 (80.3%) | 15 (19.7%) |
| Utilities | 8 (28.6%) | 20 (71.4%) |
| Information | 25 (31.2%) | 55 (68.8%) |
| Finance & Insurance | 155 (65.1%) | 83 (34.9%) |
| Real Estate, Rental & Leasing | 28 (47.5%) | 31 (52.5%) |
| Professional & Scientific | 167 (62.3%) | 101 (37.7%) |
| Enterprise Management | 0 (0.0%) | 11 (100.0%) |
| Administrative & Support | 27 (45.0%) | 33 (55.0%) |
| Educational Services | 121 (27.3%) | 322 (72.7%) |
| Health Care & Social Assistance | 129 (24.4%) | 399 (75.6%) |
| Arts, Entertainment & Recreation | 25 (34.7%) | 47 (65.3%) |
| Accommodation & Food Services | 113 (52.8%) | 101 (47.2%) |
| Public Administration | 61 (89.7%) | 7 (10.3%) |
| Total | 1,712 (50.7%) | 1,665 (49.3%) |
Education in Sappington
School Enrollment in Sappington
The most common levels of schooling among the 1,830 students in Sappington are elementary school (477 | 26.1%), high school (424 | 23.2%), and college / undergraduate (263 | 14.4%).
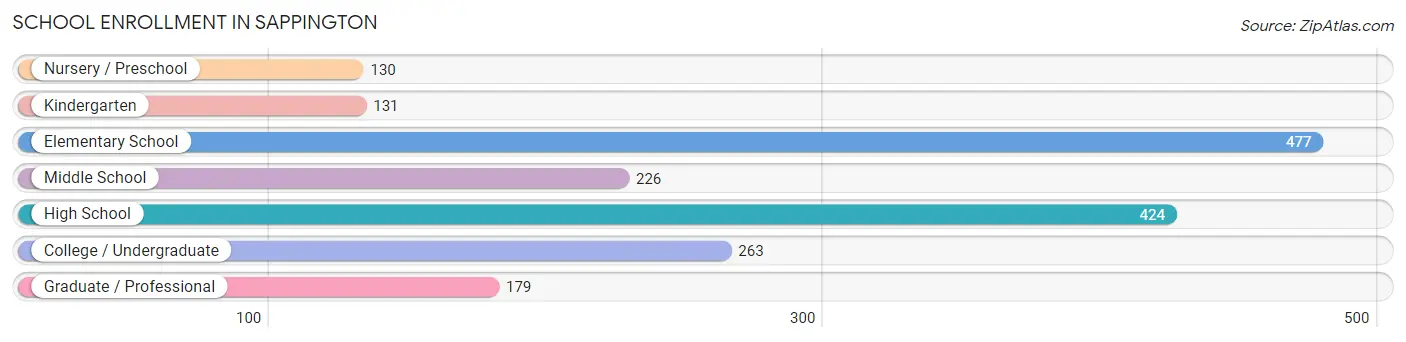
| School Level | # Students | % Students |
| Nursery / Preschool | 130 | 7.1% |
| Kindergarten | 131 | 7.2% |
| Elementary School | 477 | 26.1% |
| Middle School | 226 | 12.3% |
| High School | 424 | 23.2% |
| College / Undergraduate | 263 | 14.4% |
| Graduate / Professional | 179 | 9.8% |
| Total | 1,830 | 100.0% |
School Enrollment by Age by Funding Source in Sappington
Out of a total of 1,830 students who are enrolled in schools in Sappington, 315 (17.2%) attend a private institution, while the remaining 1,515 (82.8%) are enrolled in public schools. The age group of 3 to 4 year olds has the highest likelihood of being enrolled in private schools, with 68 (57.6% in the age bracket) enrolled. Conversely, the age group of 5 to 9 year old has the lowest likelihood of being enrolled in a private school, with 440 (92.2% in the age bracket) attending a public institution.
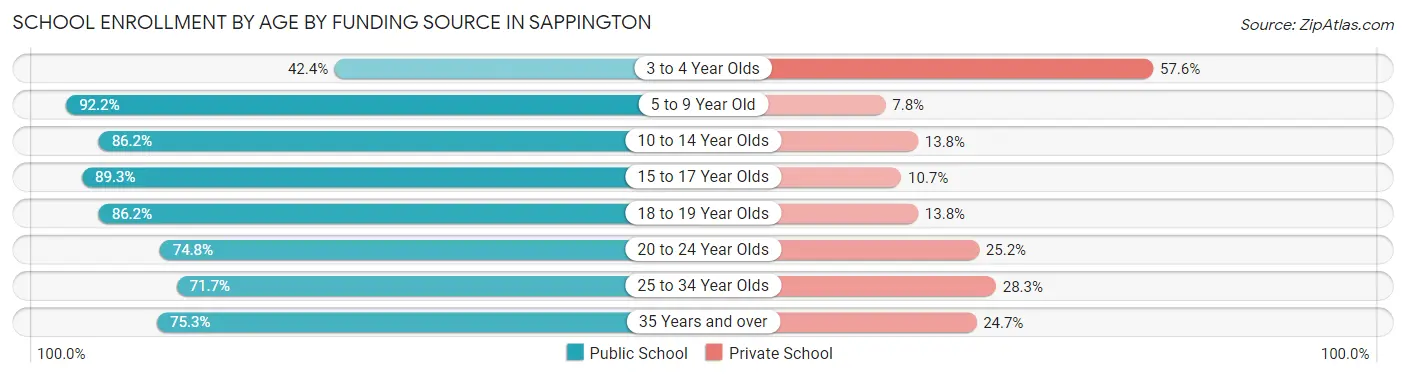
| Age Bracket | Public School | Private School |
| 3 to 4 Year Olds | 50 (42.4%) | 68 (57.6%) |
| 5 to 9 Year Old | 440 (92.2%) | 37 (7.8%) |
| 10 to 14 Year Olds | 343 (86.2%) | 55 (13.8%) |
| 15 to 17 Year Olds | 317 (89.3%) | 38 (10.7%) |
| 18 to 19 Year Olds | 81 (86.2%) | 13 (13.8%) |
| 20 to 24 Year Olds | 98 (74.8%) | 33 (25.2%) |
| 25 to 34 Year Olds | 129 (71.7%) | 51 (28.3%) |
| 35 Years and over | 58 (75.3%) | 19 (24.7%) |
| Total | 1,515 (82.8%) | 315 (17.2%) |
Educational Attainment by Field of Study in Sappington
Business (661 | 24.5%), education (479 | 17.7%), science & technology (406 | 15.0%), engineering (172 | 6.4%), and bio, nature & agricultural (139 | 5.1%) are the most common fields of study among 2,702 individuals in Sappington who have obtained a bachelor's degree or higher.
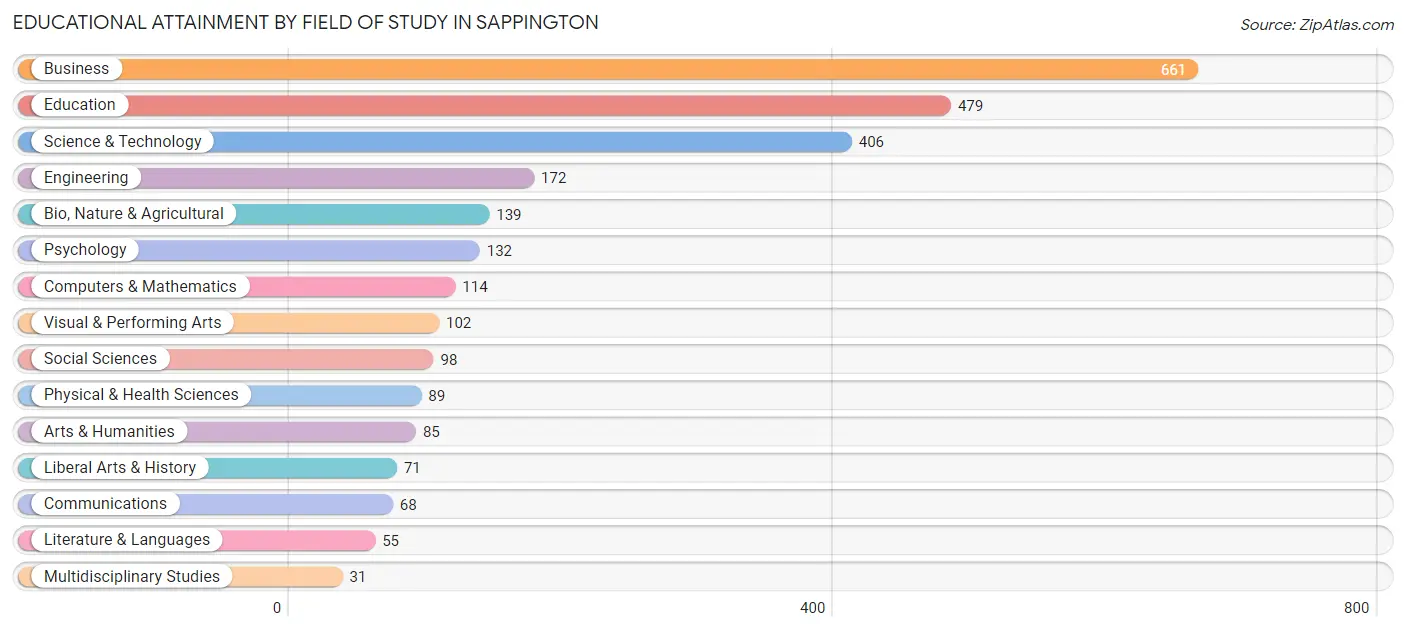
| Field of Study | # Graduates | % Graduates |
| Computers & Mathematics | 114 | 4.2% |
| Bio, Nature & Agricultural | 139 | 5.1% |
| Physical & Health Sciences | 89 | 3.3% |
| Psychology | 132 | 4.9% |
| Social Sciences | 98 | 3.6% |
| Engineering | 172 | 6.4% |
| Multidisciplinary Studies | 31 | 1.1% |
| Science & Technology | 406 | 15.0% |
| Business | 661 | 24.5% |
| Education | 479 | 17.7% |
| Literature & Languages | 55 | 2.0% |
| Liberal Arts & History | 71 | 2.6% |
| Visual & Performing Arts | 102 | 3.8% |
| Communications | 68 | 2.5% |
| Arts & Humanities | 85 | 3.2% |
| Total | 2,702 | 100.0% |
Transportation & Commute in Sappington
Vehicle Availability by Sex in Sappington
The most prevalent vehicle ownership categories in Sappington are males with 2 vehicles (833, accounting for 49.7%) and females with 2 vehicles (778, making up 50.4%).
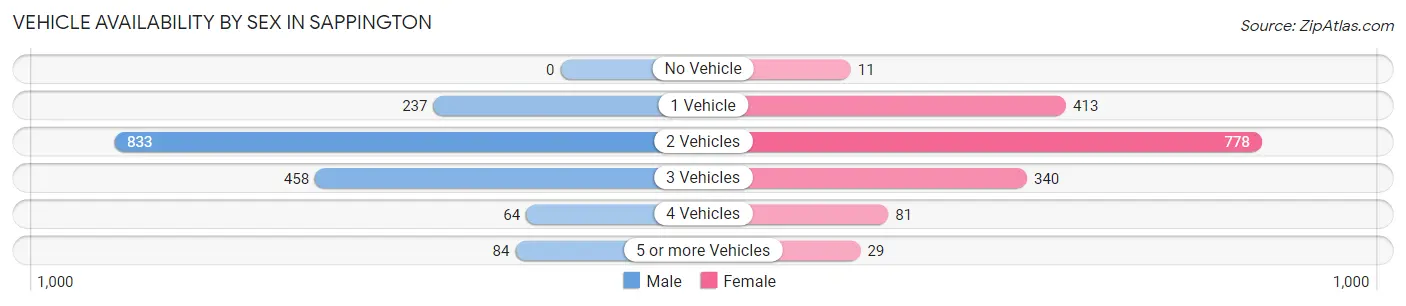
| Vehicles Available | Male | Female |
| No Vehicle | 0 (0.0%) | 11 (0.7%) |
| 1 Vehicle | 237 (14.1%) | 413 (25.0%) |
| 2 Vehicles | 833 (49.7%) | 778 (47.1%) |
| 3 Vehicles | 458 (27.3%) | 340 (20.6%) |
| 4 Vehicles | 64 (3.8%) | 81 (4.9%) |
| 5 or more Vehicles | 84 (5.0%) | 29 (1.8%) |
| Total | 1,676 (100.0%) | 1,652 (100.0%) |
Commute Time in Sappington
The most frequently occuring commute durations in Sappington are 30 to 34 minutes (655 commuters, 22.7%), 10 to 14 minutes (442 commuters, 15.3%), and 20 to 24 minutes (421 commuters, 14.6%).
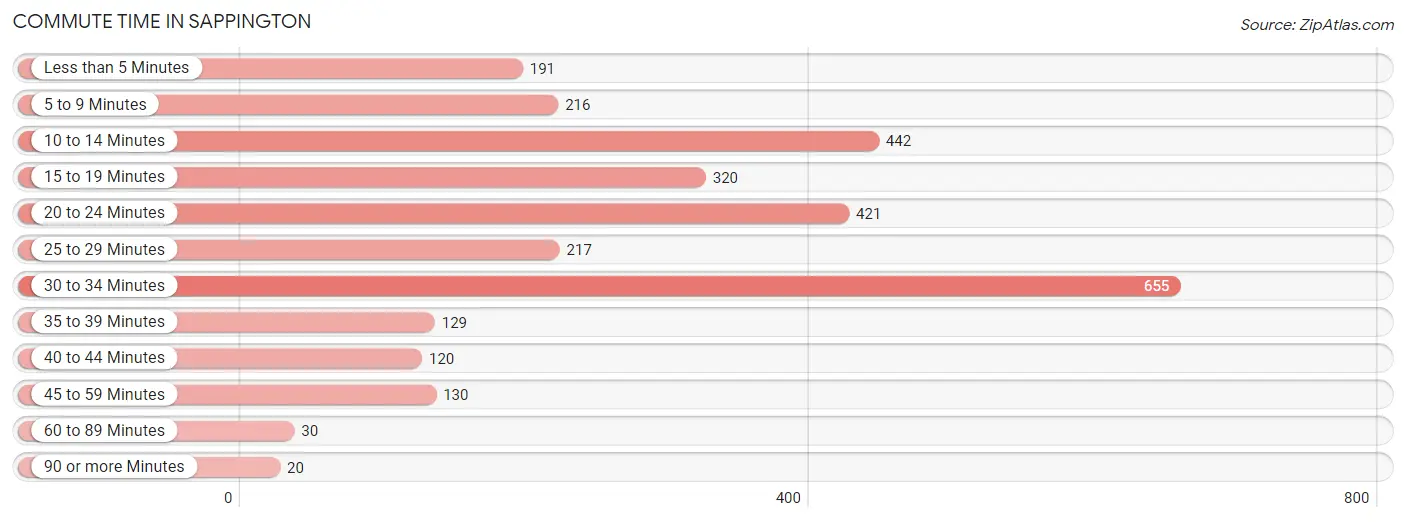
| Commute Time | # Commuters | % Commuters |
| Less than 5 Minutes | 191 | 6.6% |
| 5 to 9 Minutes | 216 | 7.5% |
| 10 to 14 Minutes | 442 | 15.3% |
| 15 to 19 Minutes | 320 | 11.1% |
| 20 to 24 Minutes | 421 | 14.6% |
| 25 to 29 Minutes | 217 | 7.5% |
| 30 to 34 Minutes | 655 | 22.7% |
| 35 to 39 Minutes | 129 | 4.5% |
| 40 to 44 Minutes | 120 | 4.2% |
| 45 to 59 Minutes | 130 | 4.5% |
| 60 to 89 Minutes | 30 | 1.0% |
| 90 or more Minutes | 20 | 0.7% |
Commute Time by Sex in Sappington
The most common commute times in Sappington are 30 to 34 minutes (450 commuters, 30.2%) for males and 20 to 24 minutes (269 commuters, 19.2%) for females.
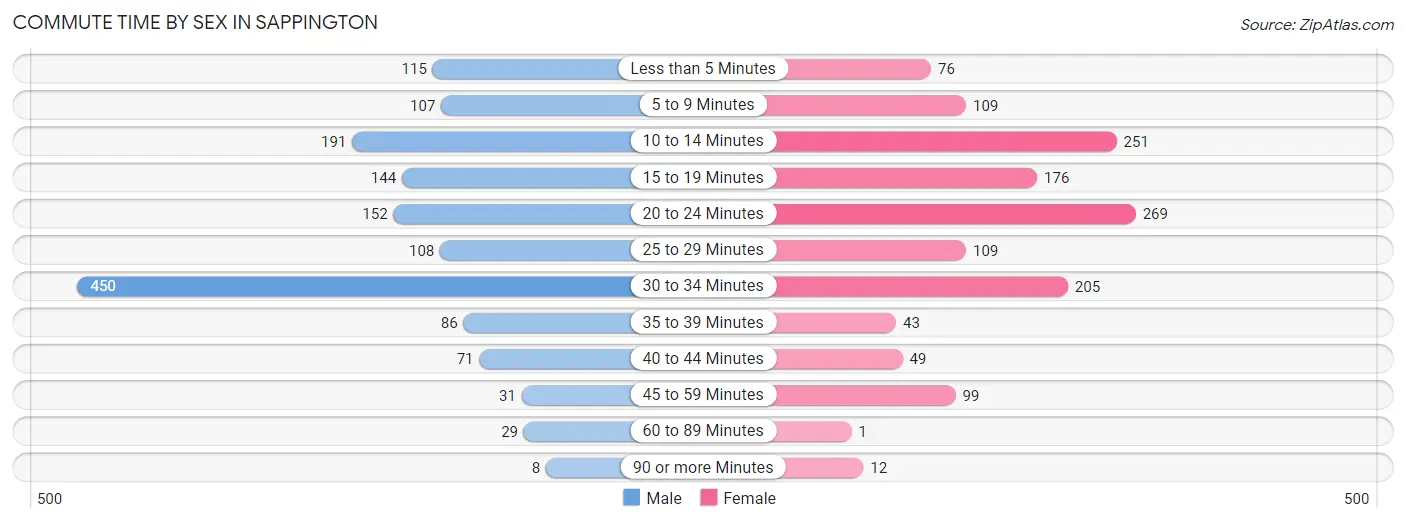
| Commute Time | Male | Female |
| Less than 5 Minutes | 115 (7.7%) | 76 (5.4%) |
| 5 to 9 Minutes | 107 (7.2%) | 109 (7.8%) |
| 10 to 14 Minutes | 191 (12.8%) | 251 (17.9%) |
| 15 to 19 Minutes | 144 (9.7%) | 176 (12.6%) |
| 20 to 24 Minutes | 152 (10.2%) | 269 (19.2%) |
| 25 to 29 Minutes | 108 (7.2%) | 109 (7.8%) |
| 30 to 34 Minutes | 450 (30.2%) | 205 (14.6%) |
| 35 to 39 Minutes | 86 (5.8%) | 43 (3.1%) |
| 40 to 44 Minutes | 71 (4.8%) | 49 (3.5%) |
| 45 to 59 Minutes | 31 (2.1%) | 99 (7.1%) |
| 60 to 89 Minutes | 29 (1.9%) | 1 (0.1%) |
| 90 or more Minutes | 8 (0.5%) | 12 (0.9%) |
Time of Departure to Work by Sex in Sappington
The most frequent times of departure to work in Sappington are 8:00 AM to 8:29 AM (336, 22.5%) for males and 7:00 AM to 7:29 AM (320, 22.9%) for females.
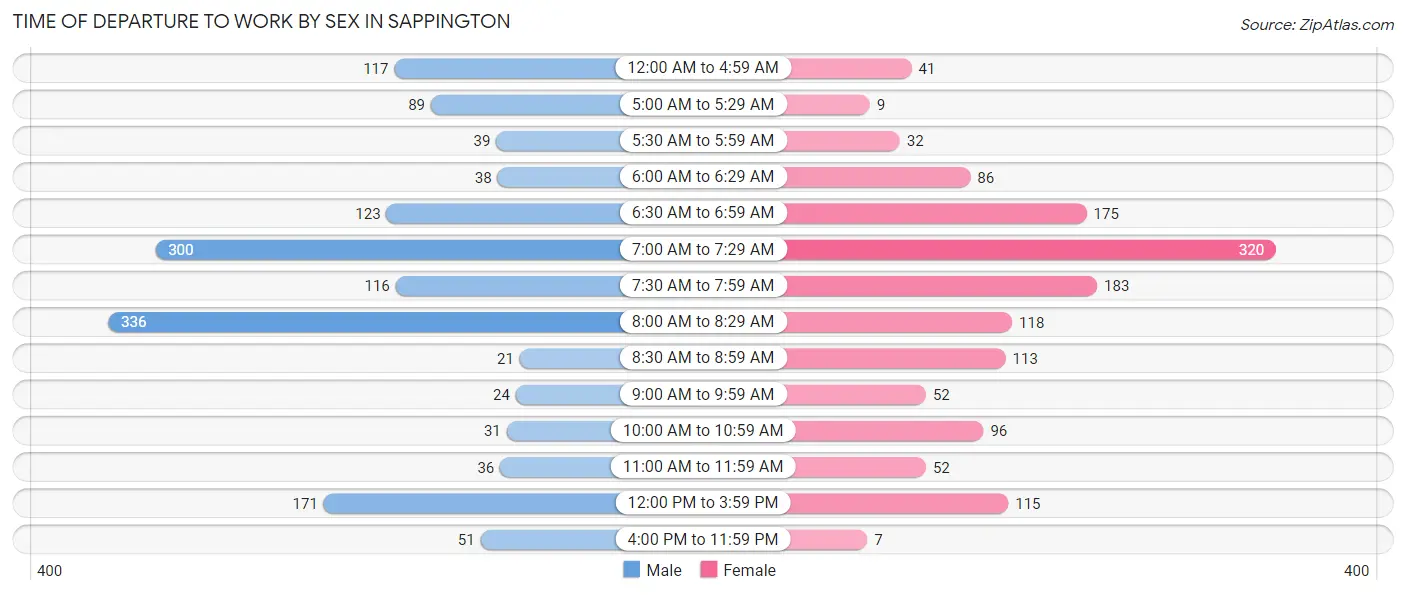
| Time of Departure | Male | Female |
| 12:00 AM to 4:59 AM | 117 (7.8%) | 41 (2.9%) |
| 5:00 AM to 5:29 AM | 89 (6.0%) | 9 (0.6%) |
| 5:30 AM to 5:59 AM | 39 (2.6%) | 32 (2.3%) |
| 6:00 AM to 6:29 AM | 38 (2.5%) | 86 (6.1%) |
| 6:30 AM to 6:59 AM | 123 (8.2%) | 175 (12.5%) |
| 7:00 AM to 7:29 AM | 300 (20.1%) | 320 (22.9%) |
| 7:30 AM to 7:59 AM | 116 (7.8%) | 183 (13.1%) |
| 8:00 AM to 8:29 AM | 336 (22.5%) | 118 (8.4%) |
| 8:30 AM to 8:59 AM | 21 (1.4%) | 113 (8.1%) |
| 9:00 AM to 9:59 AM | 24 (1.6%) | 52 (3.7%) |
| 10:00 AM to 10:59 AM | 31 (2.1%) | 96 (6.9%) |
| 11:00 AM to 11:59 AM | 36 (2.4%) | 52 (3.7%) |
| 12:00 PM to 3:59 PM | 171 (11.5%) | 115 (8.2%) |
| 4:00 PM to 11:59 PM | 51 (3.4%) | 7 (0.5%) |
| Total | 1,492 (100.0%) | 1,399 (100.0%) |
Housing Occupancy in Sappington
Occupancy by Ownership in Sappington
Of the total 3,042 dwellings in Sappington, owner-occupied units account for 2,159 (71.0%), while renter-occupied units make up 883 (29.0%).
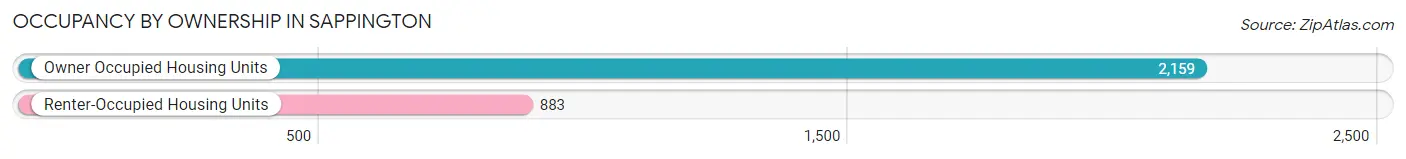
| Occupancy | # Housing Units | % Housing Units |
| Owner Occupied Housing Units | 2,159 | 71.0% |
| Renter-Occupied Housing Units | 883 | 29.0% |
| Total Occupied Housing Units | 3,042 | 100.0% |
Occupancy by Household Size in Sappington
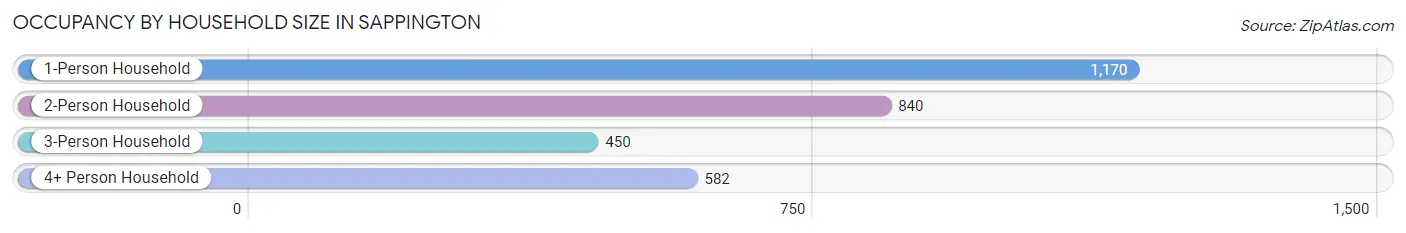
| Household Size | # Housing Units | % Housing Units |
| 1-Person Household | 1,170 | 38.5% |
| 2-Person Household | 840 | 27.6% |
| 3-Person Household | 450 | 14.8% |
| 4+ Person Household | 582 | 19.1% |
| Total Housing Units | 3,042 | 100.0% |
Occupancy by Ownership by Household Size in Sappington
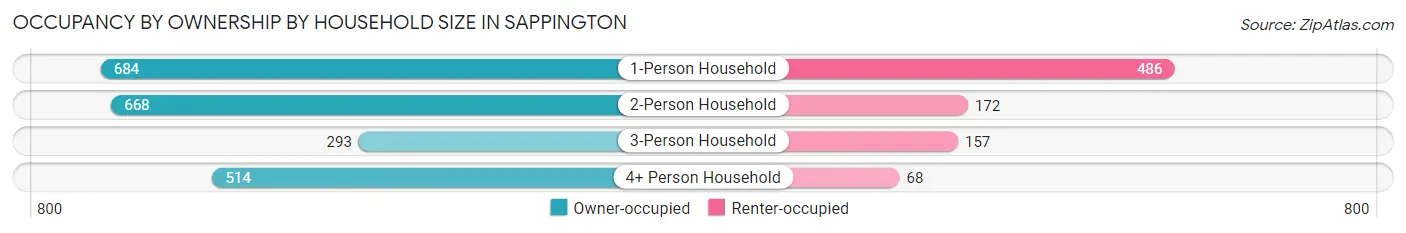
| Household Size | Owner-occupied | Renter-occupied |
| 1-Person Household | 684 (58.5%) | 486 (41.5%) |
| 2-Person Household | 668 (79.5%) | 172 (20.5%) |
| 3-Person Household | 293 (65.1%) | 157 (34.9%) |
| 4+ Person Household | 514 (88.3%) | 68 (11.7%) |
| Total Housing Units | 2,159 (71.0%) | 883 (29.0%) |
Occupancy by Educational Attainment in Sappington
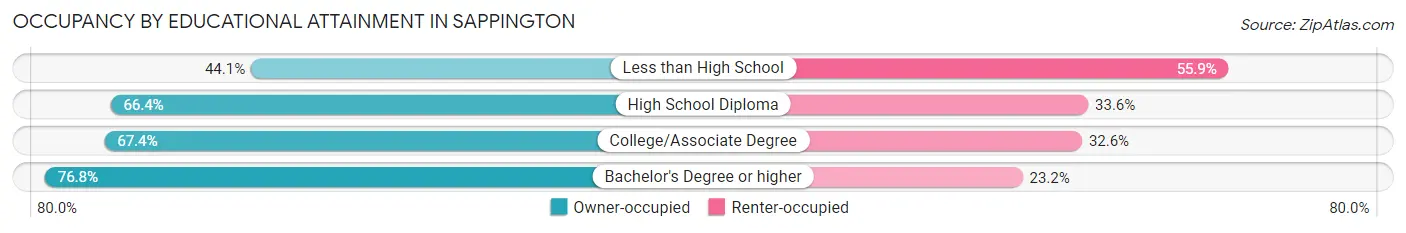
| Household Size | Owner-occupied | Renter-occupied |
| Less than High School | 56 (44.1%) | 71 (55.9%) |
| High School Diploma | 456 (66.4%) | 231 (33.6%) |
| College/Associate Degree | 456 (67.4%) | 221 (32.6%) |
| Bachelor's Degree or higher | 1,191 (76.8%) | 360 (23.2%) |
Occupancy by Age of Householder in Sappington
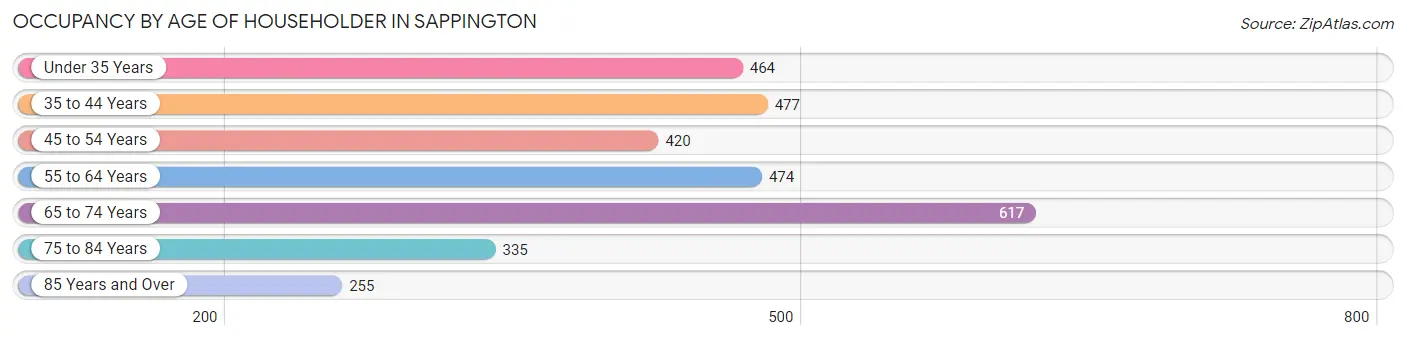
| Age Bracket | # Households | % Households |
| Under 35 Years | 464 | 15.2% |
| 35 to 44 Years | 477 | 15.7% |
| 45 to 54 Years | 420 | 13.8% |
| 55 to 64 Years | 474 | 15.6% |
| 65 to 74 Years | 617 | 20.3% |
| 75 to 84 Years | 335 | 11.0% |
| 85 Years and Over | 255 | 8.4% |
| Total | 3,042 | 100.0% |
Housing Finances in Sappington
Median Income by Occupancy in Sappington
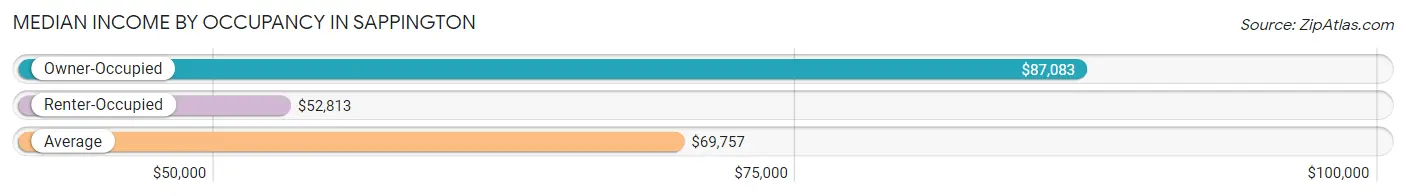
| Occupancy Type | # Households | Median Income |
| Owner-Occupied | 2,159 (71.0%) | $87,083 |
| Renter-Occupied | 883 (29.0%) | $52,813 |
| Average | 3,042 (100.0%) | $69,757 |
Occupancy by Householder Income Bracket in Sappington
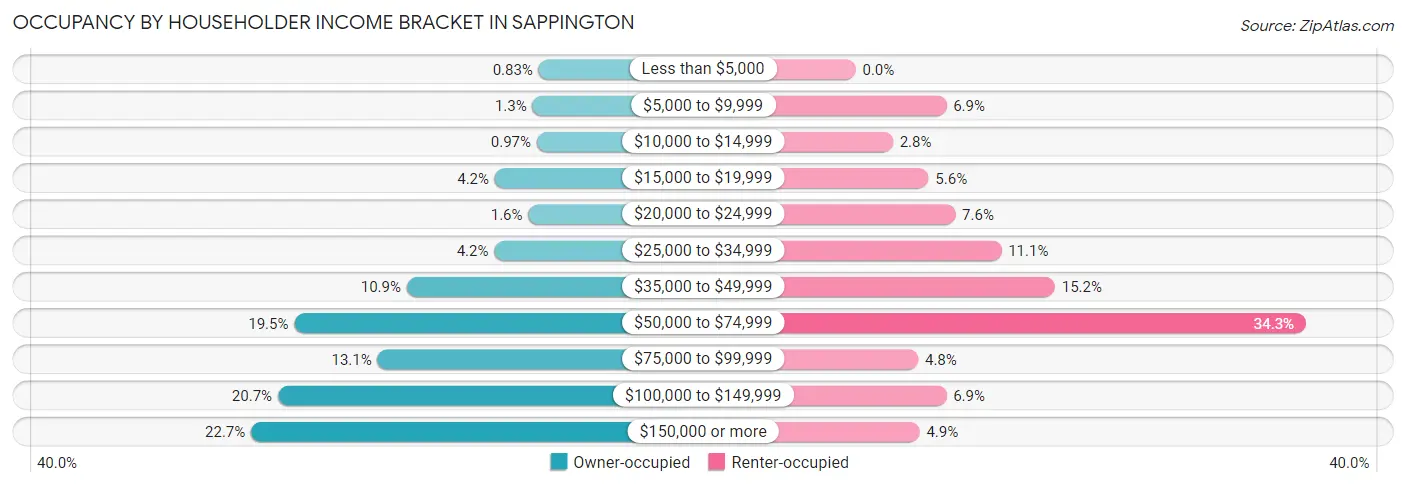
| Income Bracket | Owner-occupied | Renter-occupied |
| Less than $5,000 | 18 (0.8%) | 0 (0.0%) |
| $5,000 to $9,999 | 28 (1.3%) | 61 (6.9%) |
| $10,000 to $14,999 | 21 (1.0%) | 25 (2.8%) |
| $15,000 to $19,999 | 90 (4.2%) | 49 (5.6%) |
| $20,000 to $24,999 | 35 (1.6%) | 67 (7.6%) |
| $25,000 to $34,999 | 91 (4.2%) | 98 (11.1%) |
| $35,000 to $49,999 | 235 (10.9%) | 134 (15.2%) |
| $50,000 to $74,999 | 420 (19.5%) | 303 (34.3%) |
| $75,000 to $99,999 | 283 (13.1%) | 42 (4.8%) |
| $100,000 to $149,999 | 447 (20.7%) | 61 (6.9%) |
| $150,000 or more | 491 (22.7%) | 43 (4.9%) |
| Total | 2,159 (100.0%) | 883 (100.0%) |
Monthly Housing Cost Tiers in Sappington
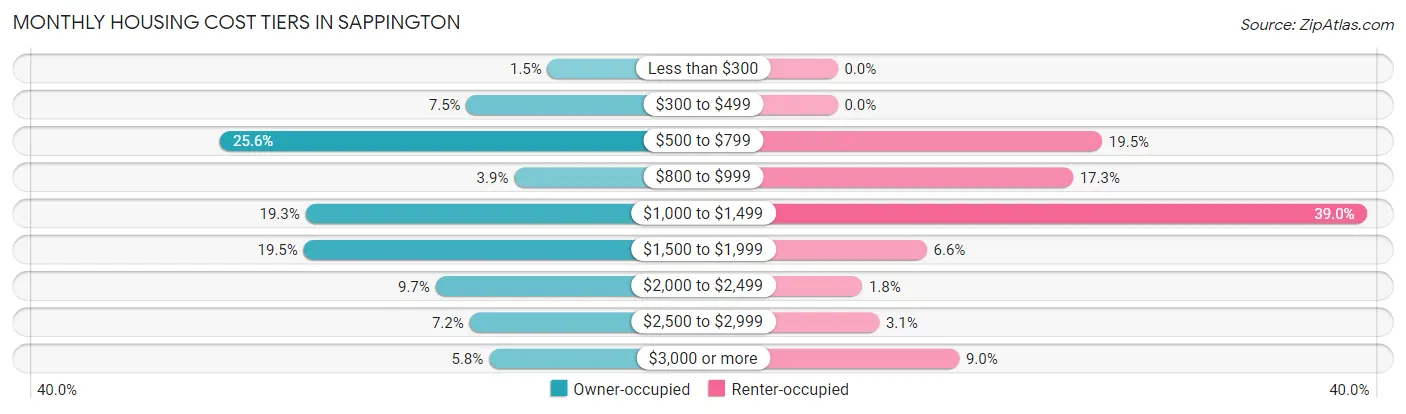
| Monthly Cost | Owner-occupied | Renter-occupied |
| Less than $300 | 32 (1.5%) | 0 (0.0%) |
| $300 to $499 | 161 (7.5%) | 0 (0.0%) |
| $500 to $799 | 553 (25.6%) | 172 (19.5%) |
| $800 to $999 | 85 (3.9%) | 153 (17.3%) |
| $1,000 to $1,499 | 417 (19.3%) | 344 (39.0%) |
| $1,500 to $1,999 | 420 (19.5%) | 58 (6.6%) |
| $2,000 to $2,499 | 210 (9.7%) | 16 (1.8%) |
| $2,500 to $2,999 | 156 (7.2%) | 27 (3.1%) |
| $3,000 or more | 125 (5.8%) | 79 (8.9%) |
| Total | 2,159 (100.0%) | 883 (100.0%) |
Physical Housing Characteristics in Sappington
Housing Structures in Sappington
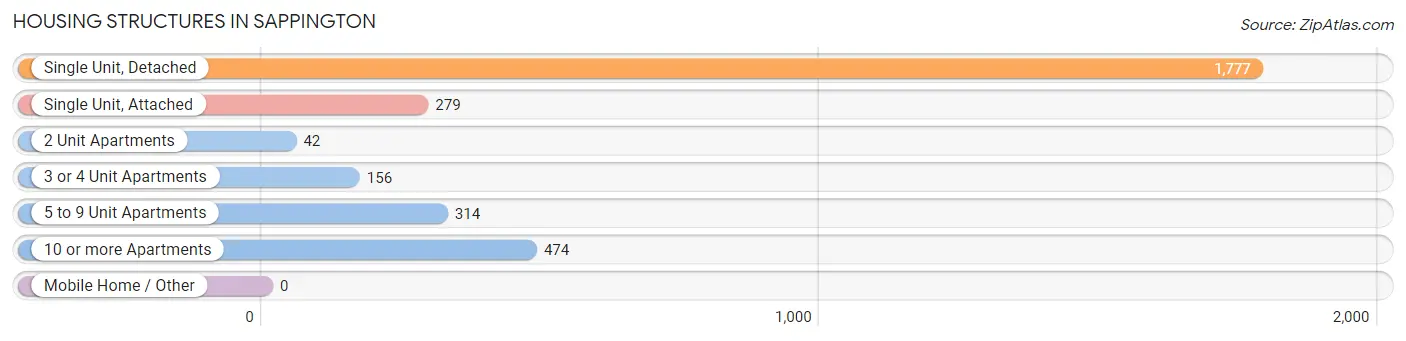
| Structure Type | # Housing Units | % Housing Units |
| Single Unit, Detached | 1,777 | 58.4% |
| Single Unit, Attached | 279 | 9.2% |
| 2 Unit Apartments | 42 | 1.4% |
| 3 or 4 Unit Apartments | 156 | 5.1% |
| 5 to 9 Unit Apartments | 314 | 10.3% |
| 10 or more Apartments | 474 | 15.6% |
| Mobile Home / Other | 0 | 0.0% |
| Total | 3,042 | 100.0% |
Housing Structures by Occupancy in Sappington
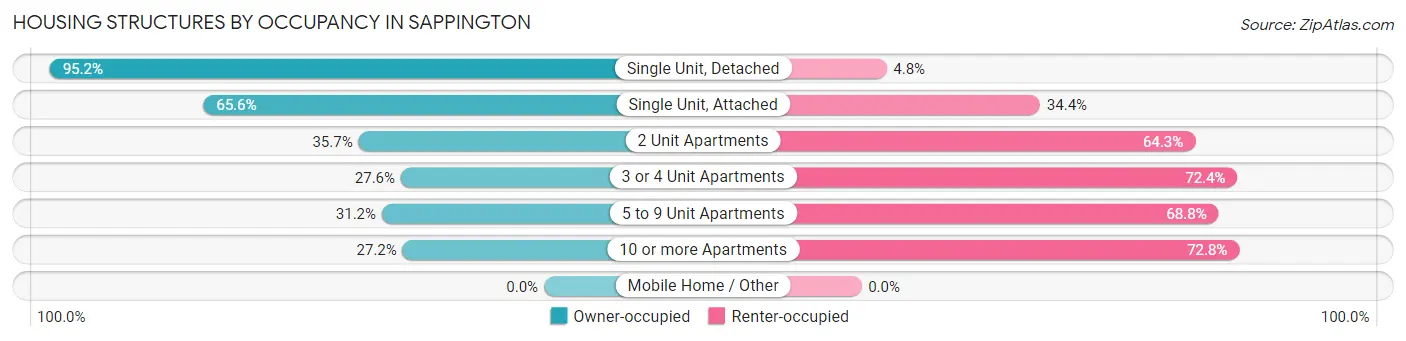
| Structure Type | Owner-occupied | Renter-occupied |
| Single Unit, Detached | 1,691 (95.2%) | 86 (4.8%) |
| Single Unit, Attached | 183 (65.6%) | 96 (34.4%) |
| 2 Unit Apartments | 15 (35.7%) | 27 (64.3%) |
| 3 or 4 Unit Apartments | 43 (27.6%) | 113 (72.4%) |
| 5 to 9 Unit Apartments | 98 (31.2%) | 216 (68.8%) |
| 10 or more Apartments | 129 (27.2%) | 345 (72.8%) |
| Mobile Home / Other | 0 (0.0%) | 0 (0.0%) |
| Total | 2,159 (71.0%) | 883 (29.0%) |
Housing Structures by Number of Rooms in Sappington
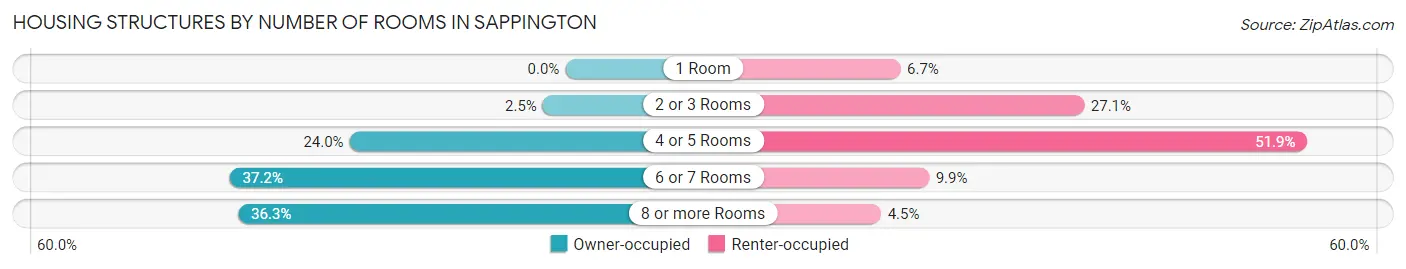
| Number of Rooms | Owner-occupied | Renter-occupied |
| 1 Room | 0 (0.0%) | 59 (6.7%) |
| 2 or 3 Rooms | 54 (2.5%) | 239 (27.1%) |
| 4 or 5 Rooms | 517 (23.9%) | 458 (51.9%) |
| 6 or 7 Rooms | 804 (37.2%) | 87 (9.9%) |
| 8 or more Rooms | 784 (36.3%) | 40 (4.5%) |
| Total | 2,159 (100.0%) | 883 (100.0%) |
Housing Structure by Heating Type in Sappington
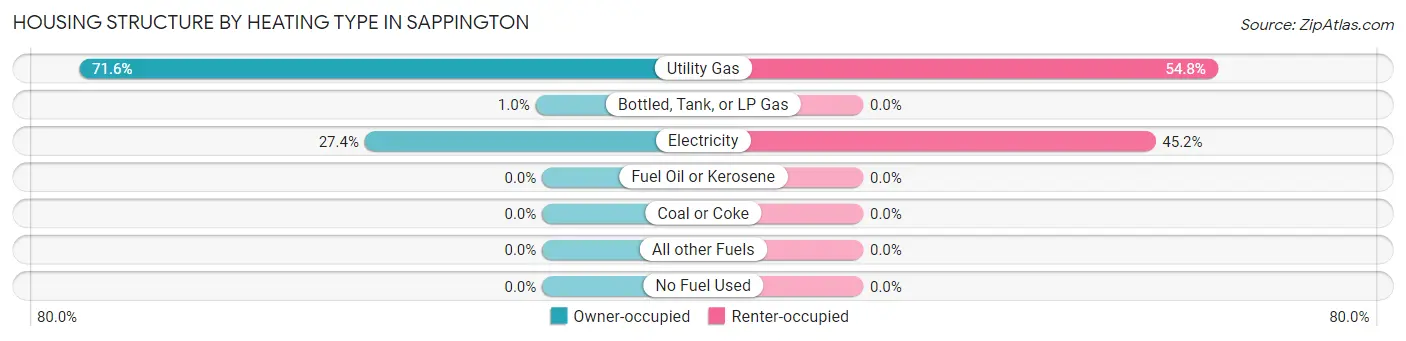
| Heating Type | Owner-occupied | Renter-occupied |
| Utility Gas | 1,545 (71.6%) | 484 (54.8%) |
| Bottled, Tank, or LP Gas | 22 (1.0%) | 0 (0.0%) |
| Electricity | 592 (27.4%) | 399 (45.2%) |
| Fuel Oil or Kerosene | 0 (0.0%) | 0 (0.0%) |
| Coal or Coke | 0 (0.0%) | 0 (0.0%) |
| All other Fuels | 0 (0.0%) | 0 (0.0%) |
| No Fuel Used | 0 (0.0%) | 0 (0.0%) |
| Total | 2,159 (100.0%) | 883 (100.0%) |
Household Vehicle Usage in Sappington
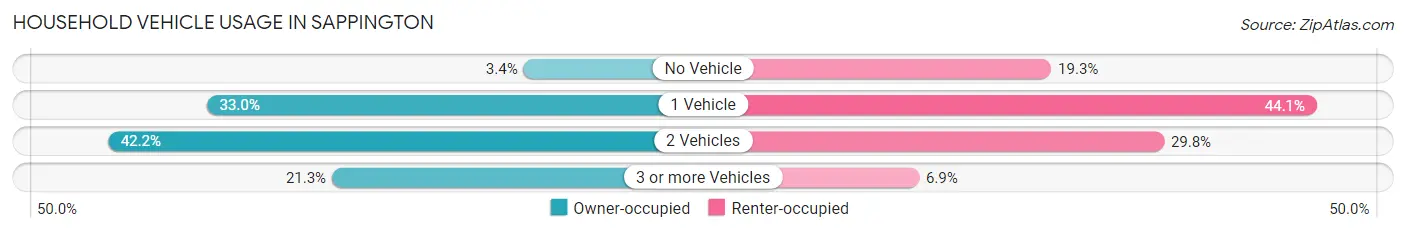
| Vehicles per Household | Owner-occupied | Renter-occupied |
| No Vehicle | 74 (3.4%) | 170 (19.3%) |
| 1 Vehicle | 713 (33.0%) | 389 (44.1%) |
| 2 Vehicles | 912 (42.2%) | 263 (29.8%) |
| 3 or more Vehicles | 460 (21.3%) | 61 (6.9%) |
| Total | 2,159 (100.0%) | 883 (100.0%) |
Real Estate & Mortgages in Sappington
Real Estate and Mortgage Overview in Sappington
| Characteristic | Without Mortgage | With Mortgage |
| Housing Units | 756 | 1,403 |
| Median Property Value | $258,800 | $267,500 |
| Median Household Income | $61,750 | $399 |
| Monthly Housing Costs | $586 | $125 |
| Real Estate Taxes | $2,887 | $0 |
Property Value by Mortgage Status in Sappington
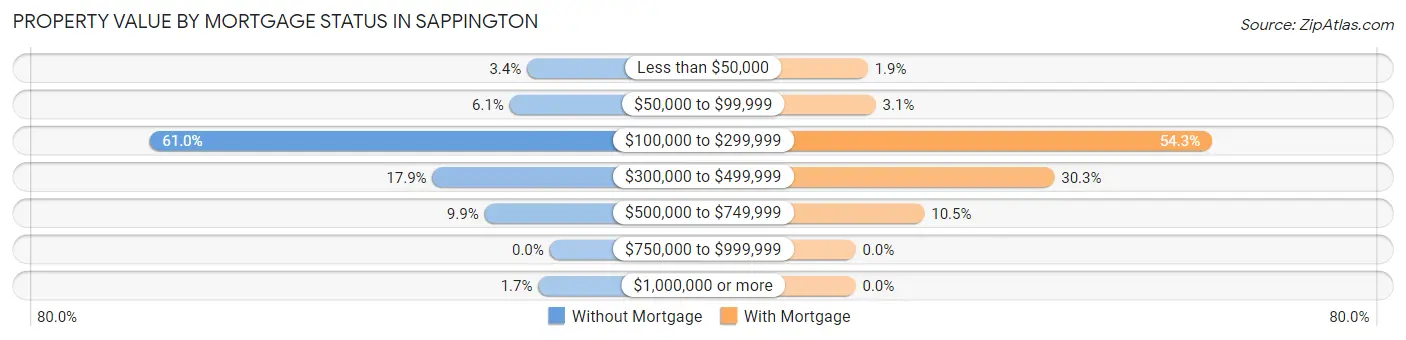
| Property Value | Without Mortgage | With Mortgage |
| Less than $50,000 | 26 (3.4%) | 26 (1.8%) |
| $50,000 to $99,999 | 46 (6.1%) | 43 (3.1%) |
| $100,000 to $299,999 | 461 (61.0%) | 762 (54.3%) |
| $300,000 to $499,999 | 135 (17.9%) | 425 (30.3%) |
| $500,000 to $749,999 | 75 (9.9%) | 147 (10.5%) |
| $750,000 to $999,999 | 0 (0.0%) | 0 (0.0%) |
| $1,000,000 or more | 13 (1.7%) | 0 (0.0%) |
| Total | 756 (100.0%) | 1,403 (100.0%) |
Household Income by Mortgage Status in Sappington
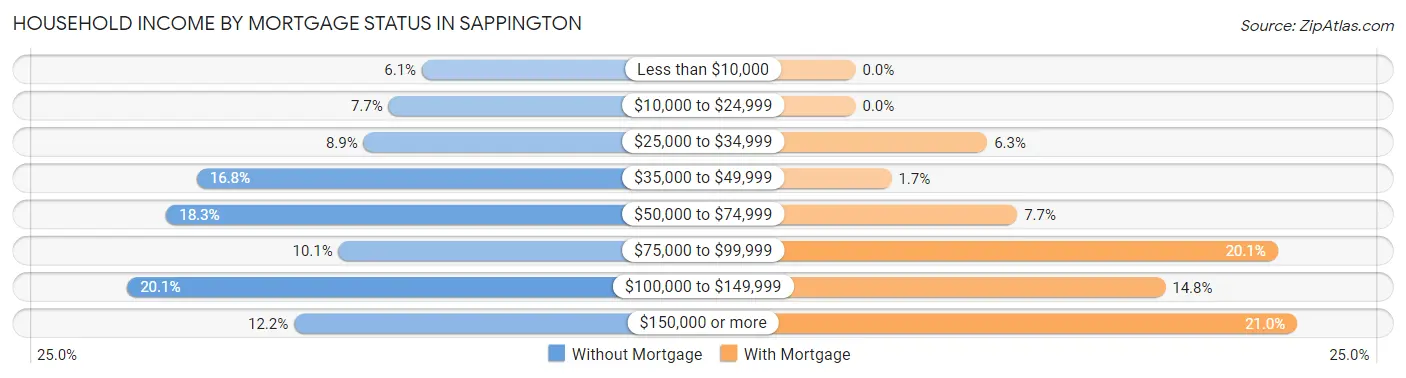
| Household Income | Without Mortgage | With Mortgage |
| Less than $10,000 | 46 (6.1%) | 0 (0.0%) |
| $10,000 to $24,999 | 58 (7.7%) | 0 (0.0%) |
| $25,000 to $34,999 | 67 (8.9%) | 88 (6.3%) |
| $35,000 to $49,999 | 127 (16.8%) | 24 (1.7%) |
| $50,000 to $74,999 | 138 (18.2%) | 108 (7.7%) |
| $75,000 to $99,999 | 76 (10.1%) | 282 (20.1%) |
| $100,000 to $149,999 | 152 (20.1%) | 207 (14.7%) |
| $150,000 or more | 92 (12.2%) | 295 (21.0%) |
| Total | 756 (100.0%) | 1,403 (100.0%) |
Property Value to Household Income Ratio in Sappington
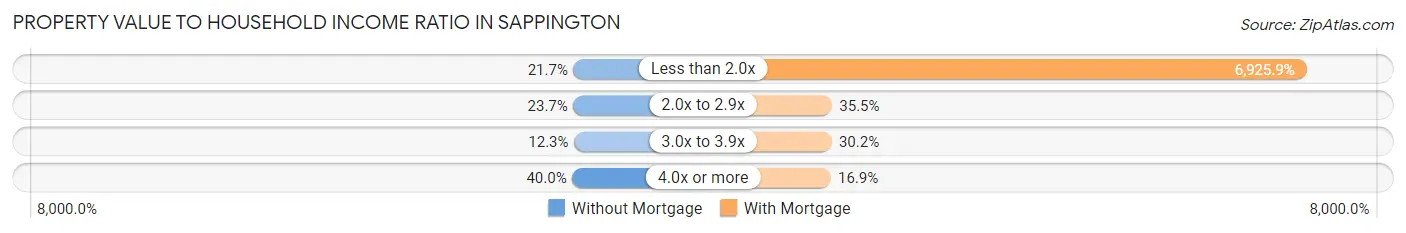
| Value-to-Income Ratio | Without Mortgage | With Mortgage |
| Less than 2.0x | 164 (21.7%) | 97,171 (6,925.9%) |
| 2.0x to 2.9x | 179 (23.7%) | 498 (35.5%) |
| 3.0x to 3.9x | 93 (12.3%) | 424 (30.2%) |
| 4.0x or more | 302 (40.0%) | 237 (16.9%) |
| Total | 756 (100.0%) | 1,403 (100.0%) |
Real Estate Taxes by Mortgage Status in Sappington
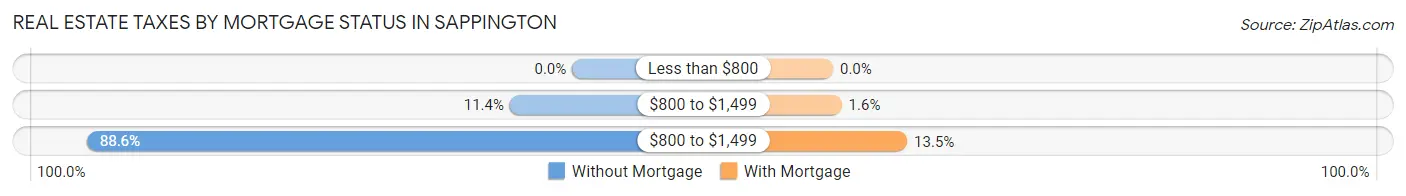
| Property Taxes | Without Mortgage | With Mortgage |
| Less than $800 | 0 (0.0%) | 0 (0.0%) |
| $800 to $1,499 | 86 (11.4%) | 22 (1.6%) |
| $800 to $1,499 | 670 (88.6%) | 190 (13.5%) |
| Total | 756 (100.0%) | 1,403 (100.0%) |
Health & Disability in Sappington
Health Insurance Coverage by Age in Sappington
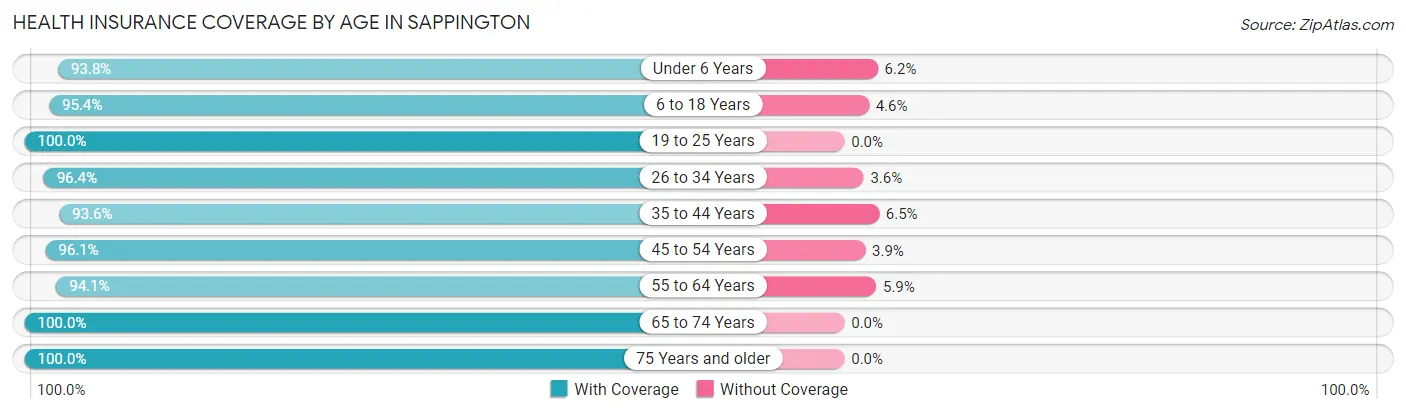
| Age Bracket | With Coverage | Without Coverage |
| Under 6 Years | 513 (93.8%) | 34 (6.2%) |
| 6 to 18 Years | 1,130 (95.4%) | 54 (4.6%) |
| 19 to 25 Years | 453 (100.0%) | 0 (0.0%) |
| 26 to 34 Years | 728 (96.4%) | 27 (3.6%) |
| 35 to 44 Years | 841 (93.5%) | 58 (6.5%) |
| 45 to 54 Years | 694 (96.1%) | 28 (3.9%) |
| 55 to 64 Years | 810 (94.1%) | 51 (5.9%) |
| 65 to 74 Years | 877 (100.0%) | 0 (0.0%) |
| 75 Years and older | 725 (100.0%) | 0 (0.0%) |
| Total | 6,771 (96.4%) | 252 (3.6%) |
Health Insurance Coverage by Citizenship Status in Sappington
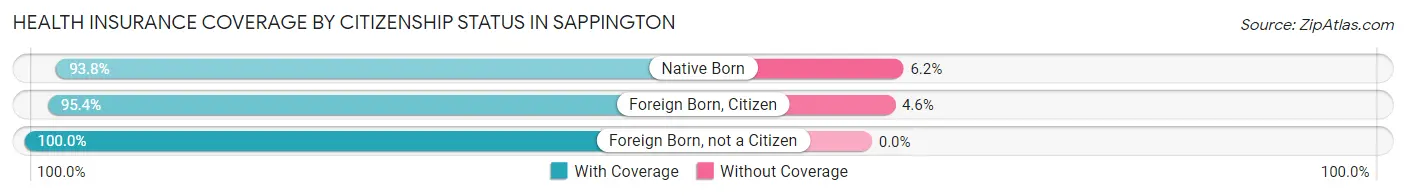
| Citizenship Status | With Coverage | Without Coverage |
| Native Born | 513 (93.8%) | 34 (6.2%) |
| Foreign Born, Citizen | 1,130 (95.4%) | 54 (4.6%) |
| Foreign Born, not a Citizen | 453 (100.0%) | 0 (0.0%) |
Health Insurance Coverage by Household Income in Sappington
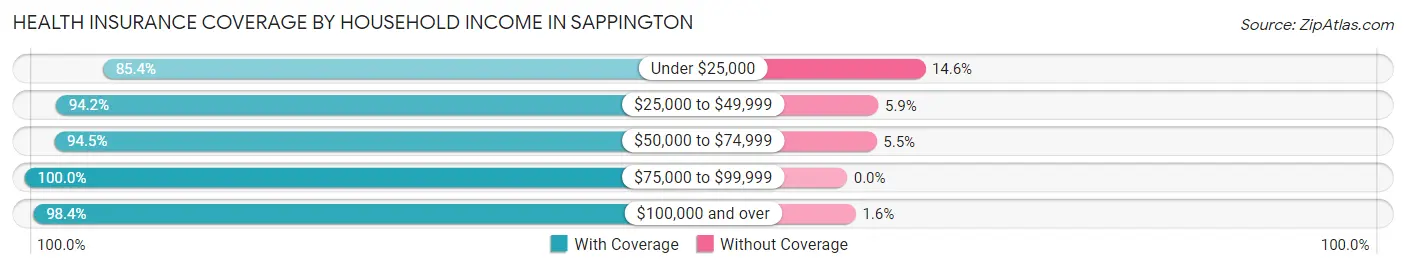
| Household Income | With Coverage | Without Coverage |
| Under $25,000 | 408 (85.4%) | 70 (14.6%) |
| $25,000 to $49,999 | 788 (94.2%) | 49 (5.9%) |
| $50,000 to $74,999 | 1,278 (94.5%) | 75 (5.5%) |
| $75,000 to $99,999 | 843 (100.0%) | 0 (0.0%) |
| $100,000 and over | 3,451 (98.4%) | 57 (1.6%) |
Public vs Private Health Insurance Coverage by Age in Sappington
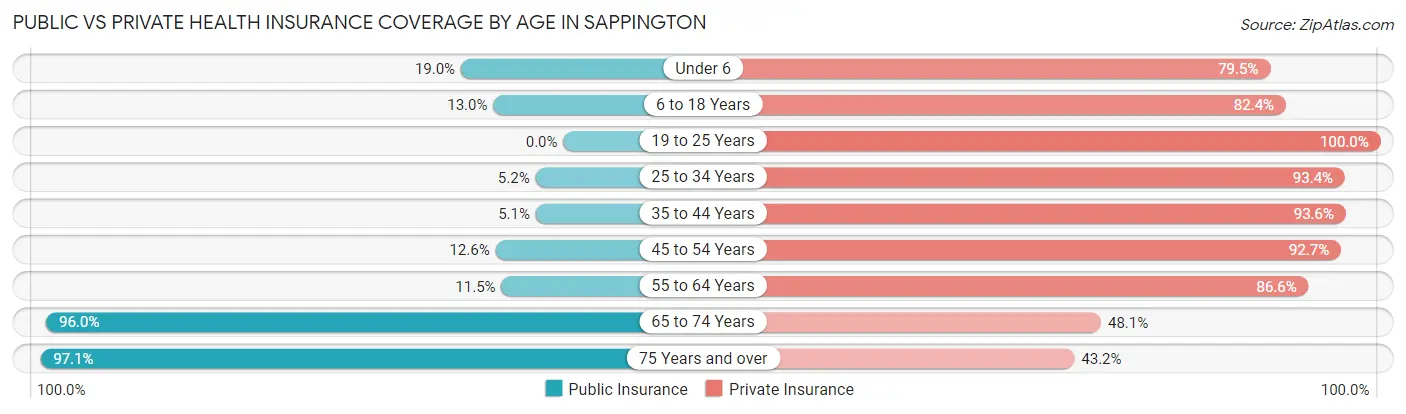
| Age Bracket | Public Insurance | Private Insurance |
| Under 6 | 104 (19.0%) | 435 (79.5%) |
| 6 to 18 Years | 154 (13.0%) | 976 (82.4%) |
| 19 to 25 Years | 0 (0.0%) | 453 (100.0%) |
| 25 to 34 Years | 39 (5.2%) | 705 (93.4%) |
| 35 to 44 Years | 46 (5.1%) | 841 (93.5%) |
| 45 to 54 Years | 91 (12.6%) | 669 (92.7%) |
| 55 to 64 Years | 99 (11.5%) | 746 (86.6%) |
| 65 to 74 Years | 842 (96.0%) | 422 (48.1%) |
| 75 Years and over | 704 (97.1%) | 313 (43.2%) |
| Total | 2,079 (29.6%) | 5,560 (79.2%) |
Disability Status by Sex by Age in Sappington
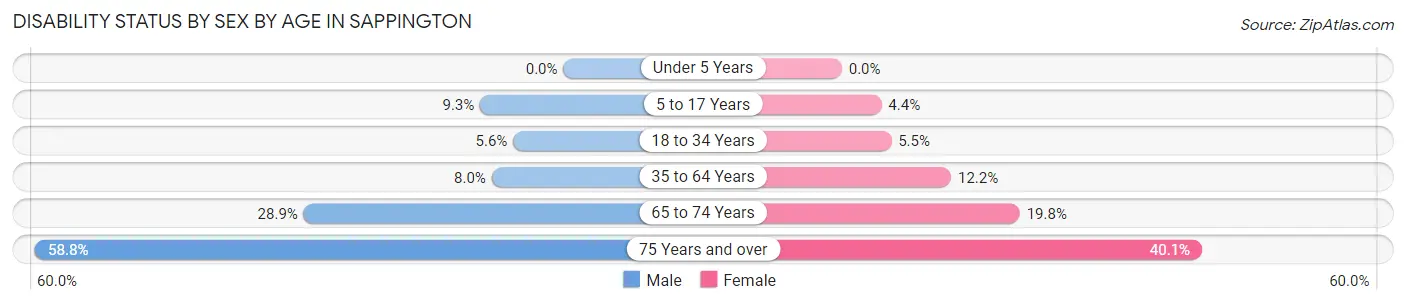
| Age Bracket | Male | Female |
| Under 5 Years | 0 (0.0%) | 0 (0.0%) |
| 5 to 17 Years | 69 (9.3%) | 22 (4.4%) |
| 18 to 34 Years | 37 (5.6%) | 34 (5.5%) |
| 35 to 64 Years | 101 (8.0%) | 148 (12.2%) |
| 65 to 74 Years | 96 (28.9%) | 108 (19.8%) |
| 75 Years and over | 180 (58.8%) | 168 (40.1%) |
Disability Class by Sex by Age in Sappington
Disability Class: Hearing Difficulty
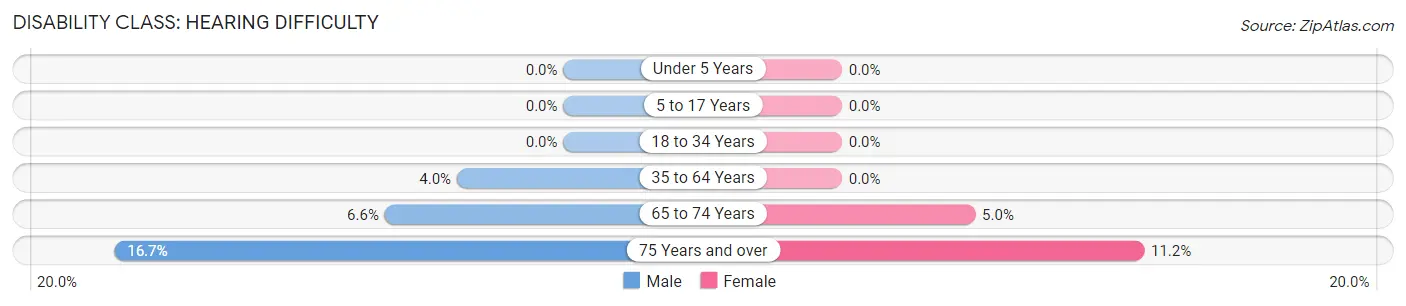
| Age Bracket | Male | Female |
| Under 5 Years | 0 (0.0%) | 0 (0.0%) |
| 5 to 17 Years | 0 (0.0%) | 0 (0.0%) |
| 18 to 34 Years | 0 (0.0%) | 0 (0.0%) |
| 35 to 64 Years | 50 (4.0%) | 0 (0.0%) |
| 65 to 74 Years | 22 (6.6%) | 27 (5.0%) |
| 75 Years and over | 51 (16.7%) | 47 (11.2%) |
Disability Class: Vision Difficulty
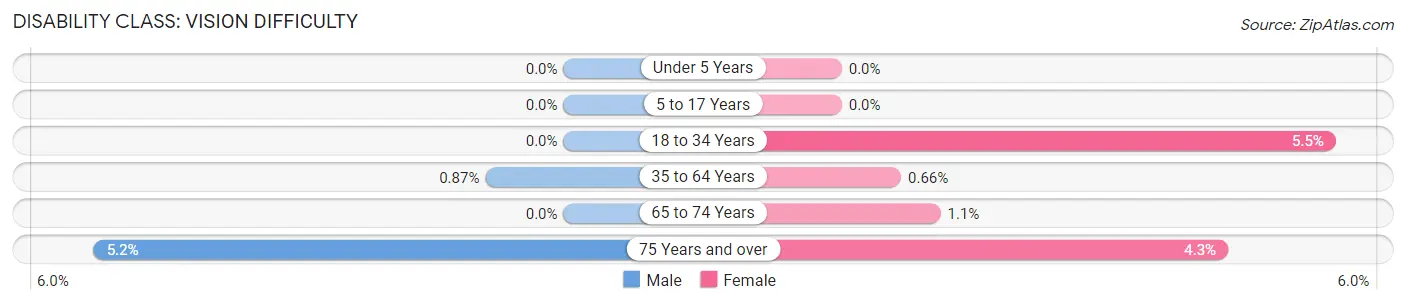
| Age Bracket | Male | Female |
| Under 5 Years | 0 (0.0%) | 0 (0.0%) |
| 5 to 17 Years | 0 (0.0%) | 0 (0.0%) |
| 18 to 34 Years | 0 (0.0%) | 34 (5.5%) |
| 35 to 64 Years | 11 (0.9%) | 8 (0.7%) |
| 65 to 74 Years | 0 (0.0%) | 6 (1.1%) |
| 75 Years and over | 16 (5.2%) | 18 (4.3%) |
Disability Class: Cognitive Difficulty
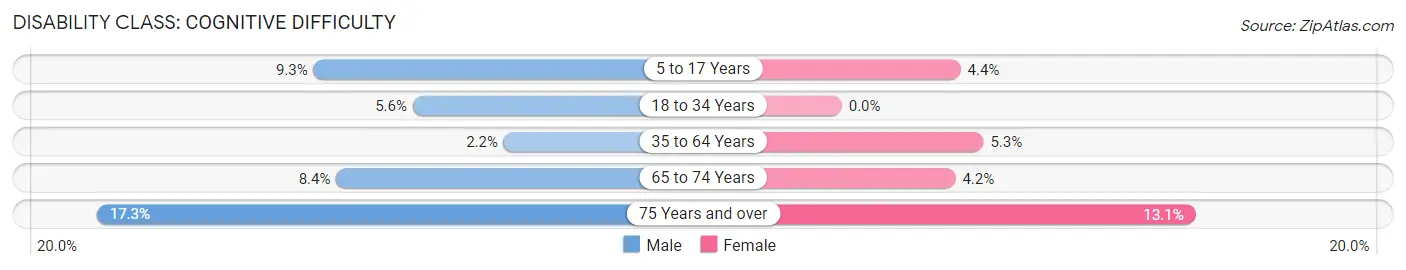
| Age Bracket | Male | Female |
| 5 to 17 Years | 69 (9.3%) | 22 (4.4%) |
| 18 to 34 Years | 37 (5.6%) | 0 (0.0%) |
| 35 to 64 Years | 28 (2.2%) | 64 (5.3%) |
| 65 to 74 Years | 28 (8.4%) | 23 (4.2%) |
| 75 Years and over | 53 (17.3%) | 55 (13.1%) |
Disability Class: Ambulatory Difficulty
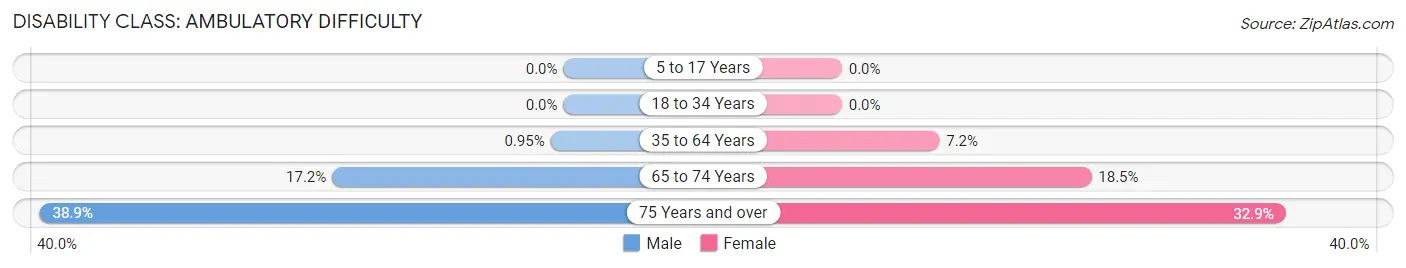
| Age Bracket | Male | Female |
| 5 to 17 Years | 0 (0.0%) | 0 (0.0%) |
| 18 to 34 Years | 0 (0.0%) | 0 (0.0%) |
| 35 to 64 Years | 12 (0.9%) | 88 (7.2%) |
| 65 to 74 Years | 57 (17.2%) | 101 (18.5%) |
| 75 Years and over | 119 (38.9%) | 138 (32.9%) |
Disability Class: Self-Care Difficulty
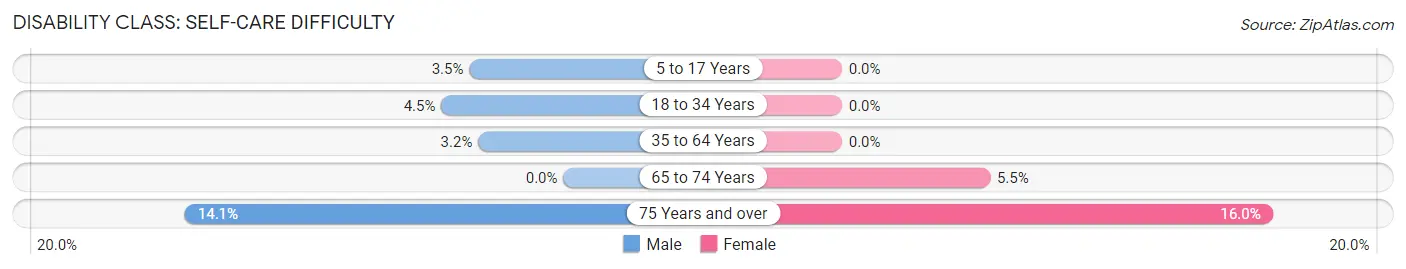
| Age Bracket | Male | Female |
| 5 to 17 Years | 26 (3.5%) | 0 (0.0%) |
| 18 to 34 Years | 30 (4.5%) | 0 (0.0%) |
| 35 to 64 Years | 40 (3.2%) | 0 (0.0%) |
| 65 to 74 Years | 0 (0.0%) | 30 (5.5%) |
| 75 Years and over | 43 (14.1%) | 67 (16.0%) |
Technology Access in Sappington
Computing Device Access in Sappington
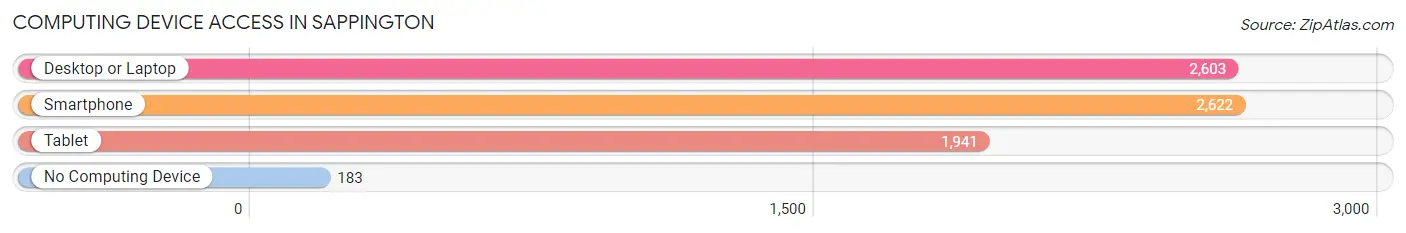
| Device Type | # Households | % Households |
| Desktop or Laptop | 2,603 | 85.6% |
| Smartphone | 2,622 | 86.2% |
| Tablet | 1,941 | 63.8% |
| No Computing Device | 183 | 6.0% |
| Total | 3,042 | 100.0% |
Internet Access in Sappington
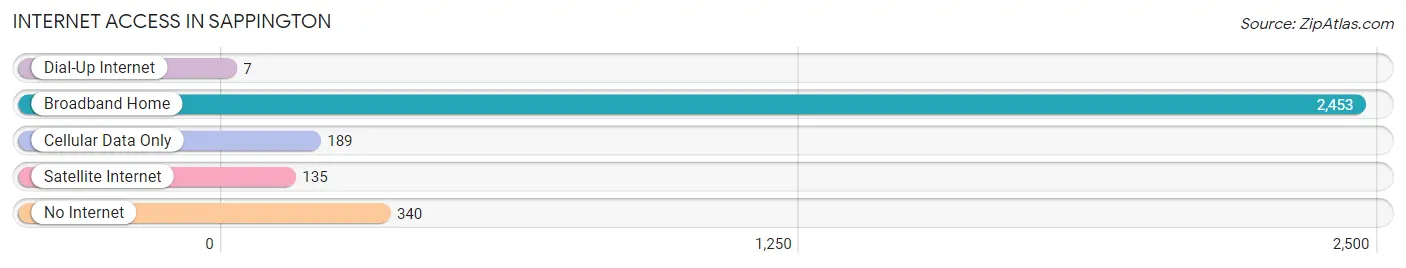
| Internet Type | # Households | % Households |
| Dial-Up Internet | 7 | 0.2% |
| Broadband Home | 2,453 | 80.6% |
| Cellular Data Only | 189 | 6.2% |
| Satellite Internet | 135 | 4.4% |
| No Internet | 340 | 11.2% |
| Total | 3,042 | 100.0% |
Sappington Summary
Sappington is a small unincorporated community located in St. Louis County, Missouri. It is situated in the southwestern corner of the county, just south of the city of St. Louis. The community is named after the Sappington family, who were early settlers in the area.
History
The Sappington family first settled in the area in the early 1800s. The family was originally from Virginia and had moved to Missouri in search of better opportunities. The family established a farm and built a log cabin in the area. The Sappington family was one of the first settlers in the area and the community was named after them.
The area was largely rural until the late 19th century when the city of St. Louis began to expand. The Sappington family sold their land to developers and the area began to be developed. The community was incorporated in 1891 and the first post office was established in 1892.
Geography
Sappington is located in the southwestern corner of St. Louis County, just south of the city of St. Louis. It is bordered by the cities of Crestwood and Sunset Hills to the north, Kirkwood to the east, and Affton to the south. The community is situated on the Meramec River and is part of the Meramec Valley.
The area is mostly flat with some rolling hills. The soil is mostly clay and loam, with some sand and gravel. The climate is humid continental, with hot summers and cold winters.
Economy
Sappington is primarily a residential community, with most of its residents commuting to nearby cities for work. The community does have some small businesses, including a few restaurants, a grocery store, and a few other retail stores.
The community is also home to a few industrial businesses, including a manufacturing plant and a recycling center. The manufacturing plant produces plastic products, while the recycling center processes paper, cardboard, and other materials.
Demographics
As of the 2010 census, the population of Sappington was 4,845. The racial makeup of the community was 87.3% White, 8.2% African American, 0.7% Asian, 0.3% Native American, and 3.5% from other races. The median household income was $50,945, and the median family income was $60,945.
The community is served by the Lindbergh School District. The district has three elementary schools, one middle school, and one high school. The community also has a few private schools, including a Catholic school and a Lutheran school.
Conclusion
Sappington is a small unincorporated community located in St. Louis County, Missouri. It is situated in the southwestern corner of the county, just south of the city of St. Louis. The community is named after the Sappington family, who were early settlers in the area. The area is mostly residential, with some small businesses and industrial businesses. The population of Sappington was 4,845 as of the 2010 census, and the median household income was $50,945. The community is served by the Lindbergh School District, as well as a few private schools.
Common Questions
What is the Total Population of Sappington?
Total Population of Sappington is 7,039.
What is the Total Male Population of Sappington?
Total Male Population of Sappington is 3,488.
What is the Total Female Population of Sappington?
Total Female Population of Sappington is 3,551.
What is the Ratio of Males per 100 Females in Sappington?
There are 98.23 Males per 100 Females in Sappington.
What is the Ratio of Females per 100 Males in Sappington?
There are 101.81 Females per 100 Males in Sappington.
What is the Median Population Age in Sappington?
Median Population Age in Sappington is 41.0 Years.
What is the Average Family Size in Sappington
Average Family Size in Sappington is 3.1 People.
What is the Average Household Size in Sappington
Average Household Size in Sappington is 2.3 People.
What is Per Capita Income in Sappington?
Per Capita income in Sappington is $43,063.
What is the Median Family Income in Sappington?
Median Family Income in Sappington is $109,286.
What is the Median Household income in Sappington?
Median Household Income in Sappington is $69,757.
What is Income or Wage Gap in Sappington?
Income or Wage Gap in Sappington is 28.6%.
Women in Sappington earn 71.4 cents for every dollar earned by a man.
What is Inequality or Gini Index in Sappington?
Inequality or Gini Index in Sappington is 0.44.
How Large is the Labor Force in Sappington?
There are 3,563 People in the Labor Forcein in Sappington.
What is the Percentage of People in the Labor Force in Sappington?
63.8% of People are in the Labor Force in Sappington.
What is the Unemployment Rate in Sappington?
Unemployment Rate in Sappington is 5.2%.