Cities with the Highest Percentage of Ethiopian Population in Missouri
RELATED REPORTS & OPTIONS
Ethiopian
Missouri
Compare Cities
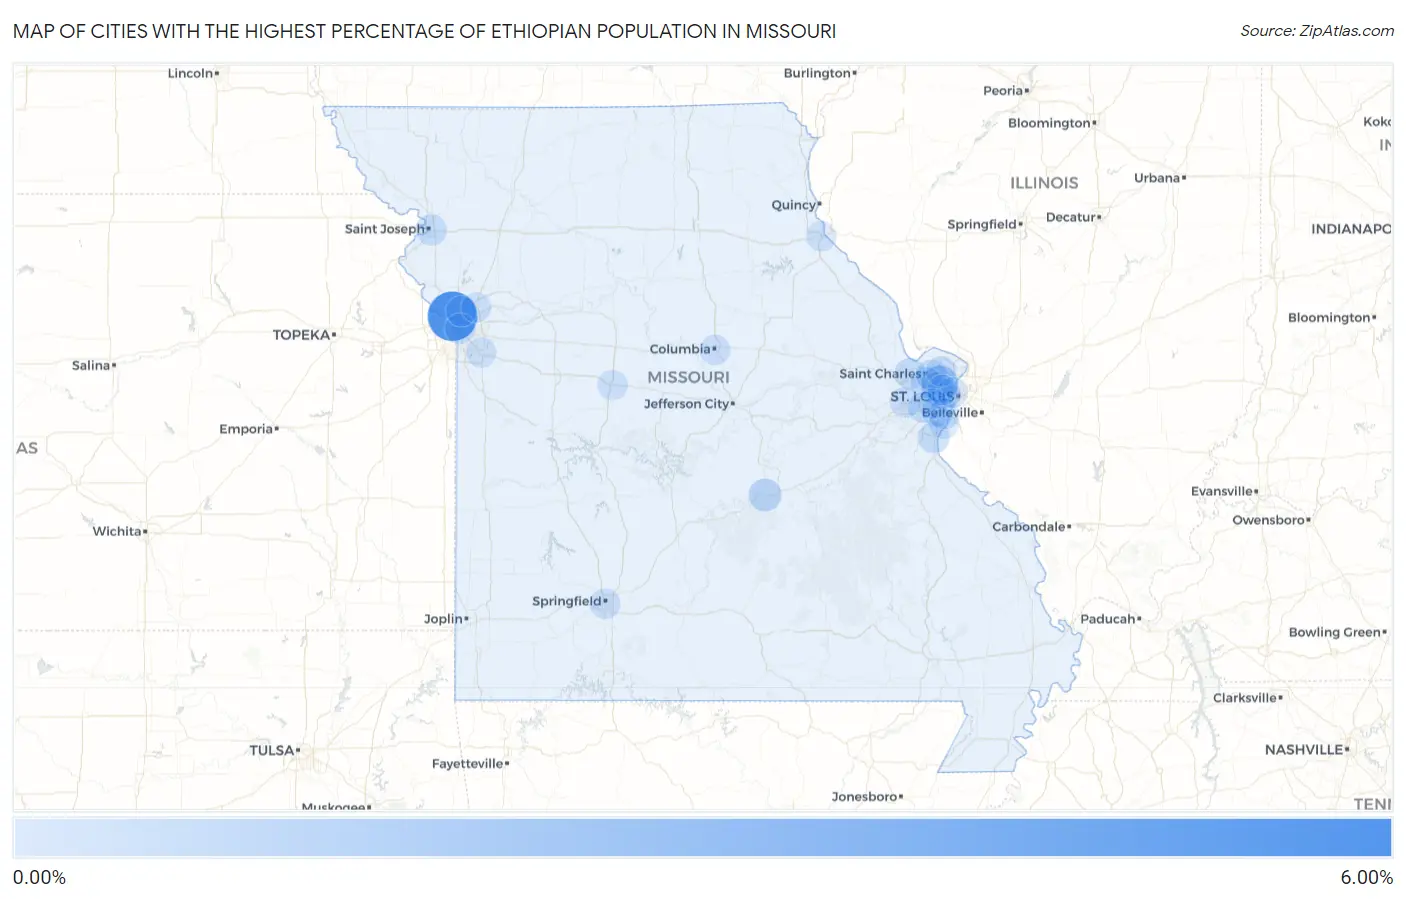
Map of Cities with the Highest Percentage of Ethiopian Population in Missouri
0.00%
6.00%
Cities with the Highest Percentage of Ethiopian Population in Missouri
| City | Ethiopian | vs State | vs National | |
| 1. | Riverside | 5.78% | 0.051%(+5.72)#1 | 0.11%(+5.67)#18 |
| 2. | St John | 1.78% | 0.051%(+1.73)#2 | 0.11%(+1.67)#123 |
| 3. | Olivette | 0.91% | 0.051%(+0.862)#3 | 0.11%(+0.806)#259 |
| 4. | Doolittle | 0.75% | 0.051%(+0.696)#4 | 0.11%(+0.640)#304 |
| 5. | Barnhart | 0.36% | 0.051%(+0.313)#5 | 0.11%(+0.257)#496 |
| 6. | Sappington | 0.36% | 0.051%(+0.304)#6 | 0.11%(+0.248)#510 |
| 7. | St Peters | 0.33% | 0.051%(+0.280)#7 | 0.11%(+0.224)#537 |
| 8. | St Joseph | 0.31% | 0.051%(+0.257)#8 | 0.11%(+0.202)#560 |
| 9. | Clayton | 0.29% | 0.051%(+0.239)#9 | 0.11%(+0.183)#585 |
| 10. | Maryland Heights | 0.27% | 0.051%(+0.216)#10 | 0.11%(+0.160)#616 |
| 11. | Valley Park | 0.26% | 0.051%(+0.211)#11 | 0.11%(+0.156)#622 |
| 12. | Bridgeton | 0.20% | 0.051%(+0.150)#12 | 0.11%(+0.094)#727 |
| 13. | Mehlville | 0.18% | 0.051%(+0.124)#13 | 0.11%(+0.068)#780 |
| 14. | St Louis | 0.17% | 0.051%(+0.122)#14 | 0.11%(+0.066)#788 |
| 15. | Florissant | 0.14% | 0.051%(+0.090)#15 | 0.11%(+0.035)#864 |
| 16. | Kansas City | 0.12% | 0.051%(+0.072)#16 | 0.11%(+0.016)#924 |
| 17. | Springfield | 0.10% | 0.051%(+0.050)#17 | 0.11%(-0.006)#995 |
| 18. | Columbia | 0.096% | 0.051%(+0.045)#18 | 0.11%(-0.011)#1,011 |
| 19. | University City | 0.086% | 0.051%(+0.035)#19 | 0.11%(-0.021)#1,054 |
| 20. | Gladstone | 0.082% | 0.051%(+0.030)#20 | 0.11%(-0.026)#1,073 |
| 21. | Wildwood | 0.077% | 0.051%(+0.025)#21 | 0.11%(-0.031)#1,096 |
| 22. | Lee S Summit | 0.049% | 0.051%(-0.002)#22 | 0.11%(-0.058)#1,231 |
| 23. | Sedalia | 0.032% | 0.051%(-0.019)#23 | 0.11%(-0.075)#1,345 |
| 24. | Kirkwood | 0.031% | 0.051%(-0.021)#24 | 0.11%(-0.077)#1,362 |
| 25. | Oakville | 0.025% | 0.051%(-0.026)#25 | 0.11%(-0.082)#1,405 |
| 26. | Hannibal | 0.018% | 0.051%(-0.034)#26 | 0.11%(-0.090)#1,470 |
| 27. | Liberty | 0.013% | 0.051%(-0.038)#27 | 0.11%(-0.094)#1,525 |
Common Questions
What are the Top 10 Cities with the Highest Percentage of Ethiopian Population in Missouri?
Top 10 Cities with the Highest Percentage of Ethiopian Population in Missouri are:
#1
5.78%
#2
1.78%
#3
0.91%
#4
0.75%
#5
0.36%
#6
0.36%
#7
0.33%
#8
0.31%
#9
0.29%
#10
0.27%
What city has the Highest Percentage of Ethiopian Population in Missouri?
Riverside has the Highest Percentage of Ethiopian Population in Missouri with 5.78%.
What is the Percentage of Ethiopian Population in the State of Missouri?
Percentage of Ethiopian Population in Missouri is 0.051%.
What is the Percentage of Ethiopian Population in the United States?
Percentage of Ethiopian Population in the United States is 0.11%.