Indian Point, MO
Indian Point Map
Indian Point Overview
447
TOTAL POPULATION
223
MALE POPULATION
224
FEMALE POPULATION
99.55
MALES / 100 FEMALES
100.45
FEMALES / 100 MALES
60.9
MEDIAN AGE
2.6
AVG FAMILY SIZE
2.2
AVG HOUSEHOLD SIZE
$35,232
PER CAPITA INCOME
$81,932
AVG FAMILY INCOME
$75,625
AVG HOUSEHOLD INCOME
54.2%
WAGE / INCOME GAP [ % ]
45.8¢/ $1
WAGE / INCOME GAP [ $ ]
0.36
INEQUALITY / GINI INDEX
187
LABOR FORCE [ PEOPLE ]
47.5%
PERCENT IN LABOR FORCE
8.0%
UNEMPLOYMENT RATE
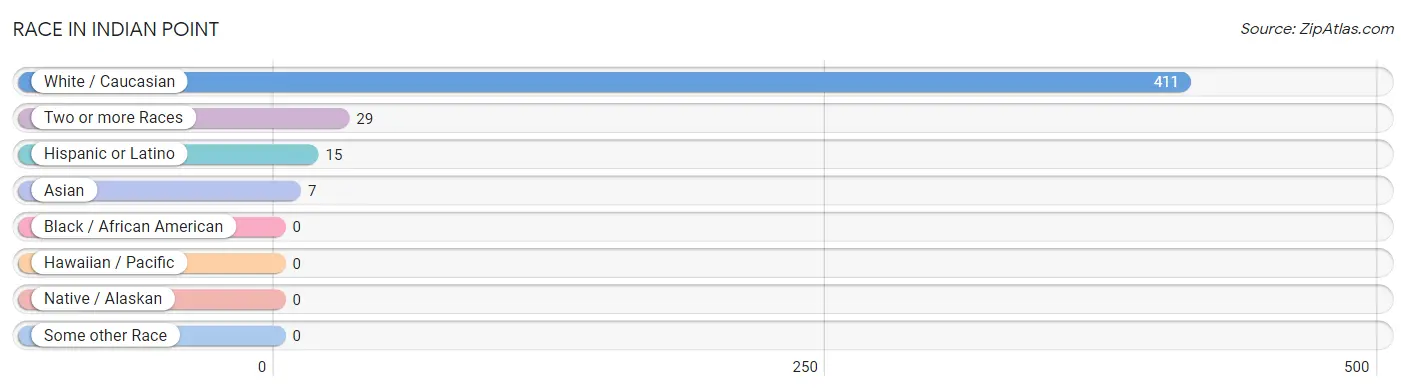
Race in Indian Point
The most populous races in Indian Point are White / Caucasian (411 | 91.9%), Two or more Races (29 | 6.5%), and Hispanic or Latino (15 | 3.4%).
| Race | # Population | % Population |
| Asian | 7 | 1.6% |
| Black / African American | 0 | 0.0% |
| Hawaiian / Pacific | 0 | 0.0% |
| Hispanic or Latino | 15 | 3.4% |
| Native / Alaskan | 0 | 0.0% |
| White / Caucasian | 411 | 91.9% |
| Two or more Races | 29 | 6.5% |
| Some other Race | 0 | 0.0% |
| Total | 447 | 100.0% |
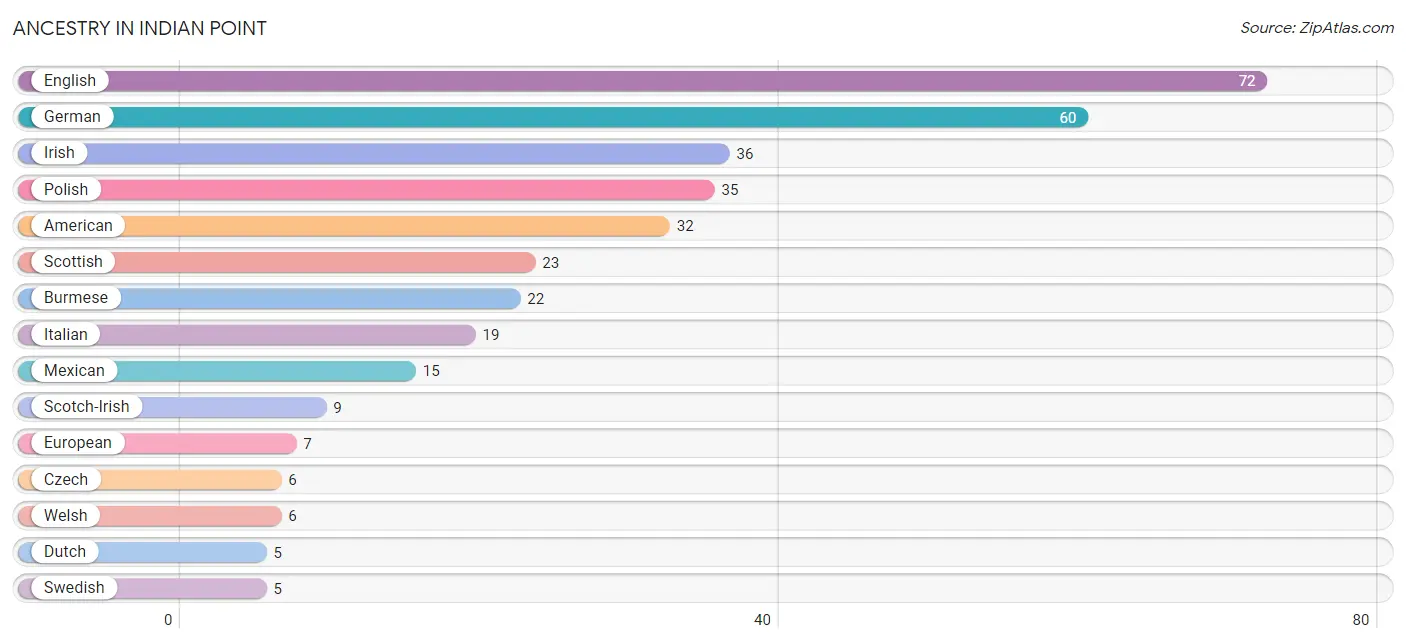
Ancestry in Indian Point
The most populous ancestries reported in Indian Point are English (72 | 16.1%), German (60 | 13.4%), Irish (36 | 8.1%), Polish (35 | 7.8%), and American (32 | 7.2%), together accounting for 52.6% of all Indian Point residents.
| Ancestry | # Population | % Population |
| American | 32 | 7.2% |
| Bhutanese | 2 | 0.4% |
| Burmese | 22 | 4.9% |
| Canadian | 3 | 0.7% |
| Croatian | 2 | 0.4% |
| Czech | 6 | 1.3% |
| Dutch | 5 | 1.1% |
| English | 72 | 16.1% |
| European | 7 | 1.6% |
| French | 4 | 0.9% |
| French Canadian | 2 | 0.4% |
| German | 60 | 13.4% |
| Irish | 36 | 8.1% |
| Italian | 19 | 4.3% |
| Mexican | 15 | 3.4% |
| Norwegian | 4 | 0.9% |
| Polish | 35 | 7.8% |
| Scotch-Irish | 9 | 2.0% |
| Scottish | 23 | 5.1% |
| Swedish | 5 | 1.1% |
| Swiss | 3 | 0.7% |
| Welsh | 6 | 1.3% | View All 22 Rows |
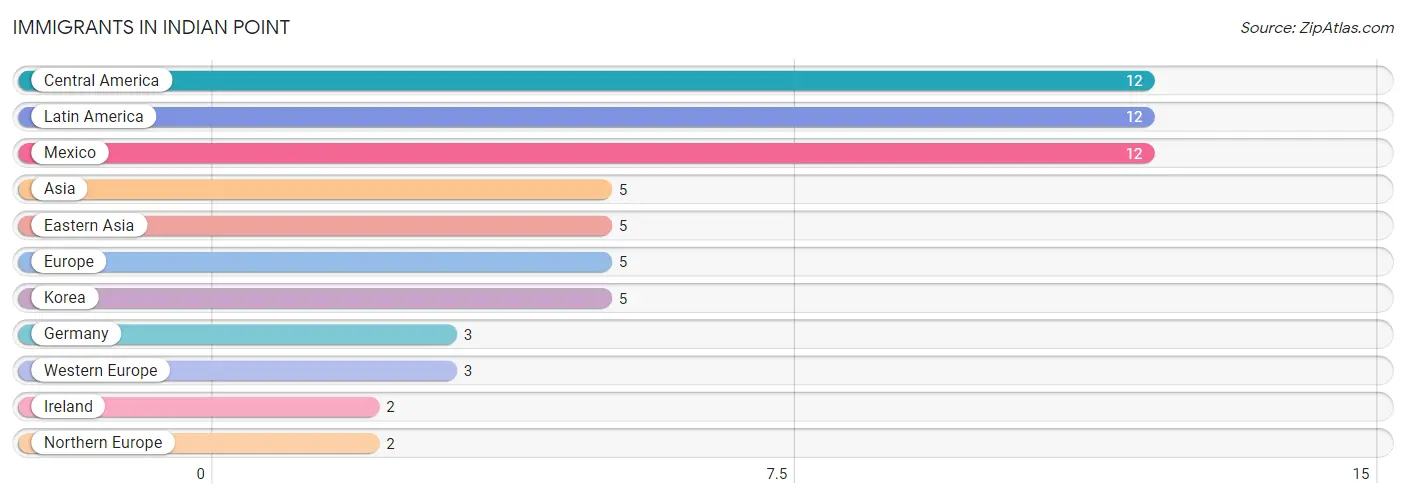
Immigrants in Indian Point
The most numerous immigrant groups reported in Indian Point came from Central America (12 | 2.7%), Latin America (12 | 2.7%), Mexico (12 | 2.7%), Asia (5 | 1.1%), and Eastern Asia (5 | 1.1%), together accounting for 10.3% of all Indian Point residents.
| Immigration Origin | # Population | % Population |
| Asia | 5 | 1.1% |
| Central America | 12 | 2.7% |
| Eastern Asia | 5 | 1.1% |
| Europe | 5 | 1.1% |
| Germany | 3 | 0.7% |
| Ireland | 2 | 0.4% |
| Korea | 5 | 1.1% |
| Latin America | 12 | 2.7% |
| Mexico | 12 | 2.7% |
| Northern Europe | 2 | 0.4% |
| Western Europe | 3 | 0.7% | View All 11 Rows |
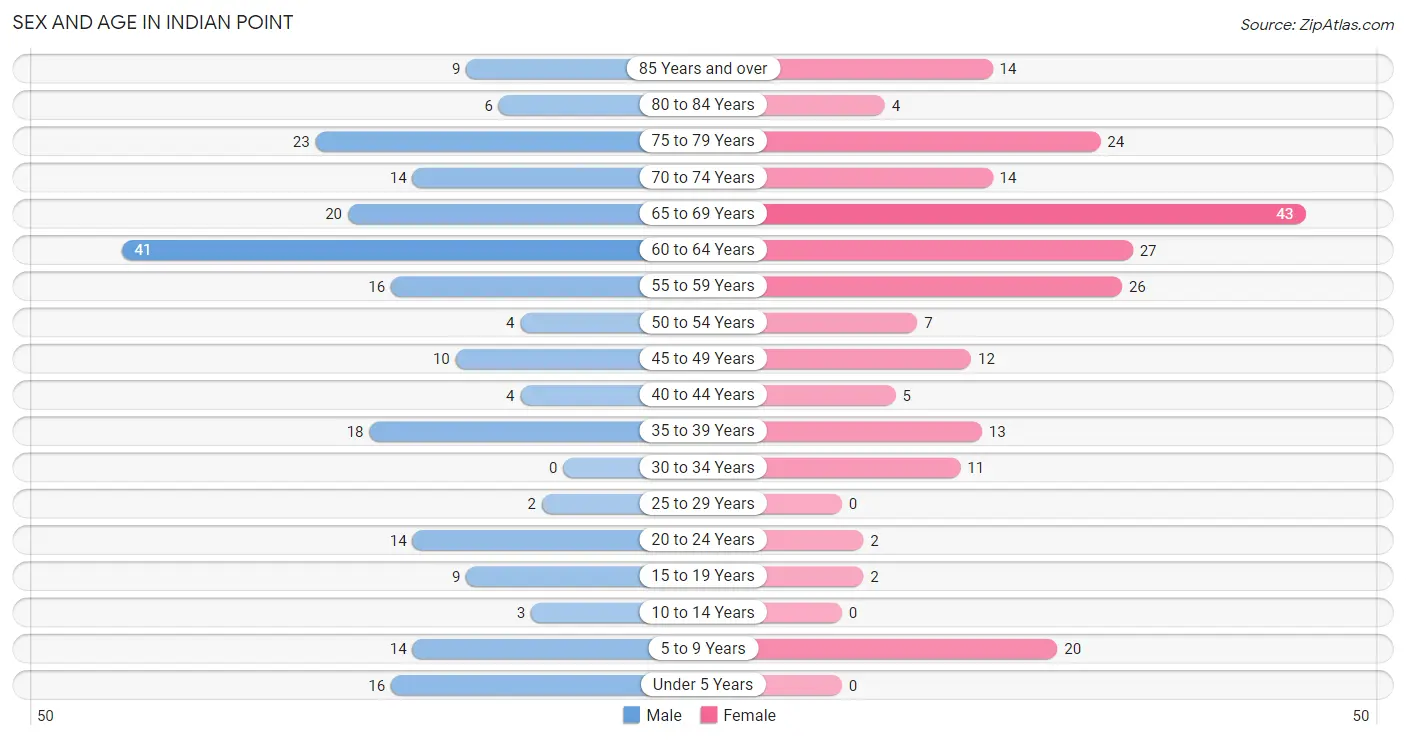
Sex and Age in Indian Point
Sex and Age in Indian Point
The most populous age groups in Indian Point are 60 to 64 Years (41 | 18.4%) for men and 65 to 69 Years (43 | 19.2%) for women.
| Age Bracket | Male | Female |
| Under 5 Years | 16 (7.2%) | 0 (0.0%) |
| 5 to 9 Years | 14 (6.3%) | 20 (8.9%) |
| 10 to 14 Years | 3 (1.3%) | 0 (0.0%) |
| 15 to 19 Years | 9 (4.0%) | 2 (0.9%) |
| 20 to 24 Years | 14 (6.3%) | 2 (0.9%) |
| 25 to 29 Years | 2 (0.9%) | 0 (0.0%) |
| 30 to 34 Years | 0 (0.0%) | 11 (4.9%) |
| 35 to 39 Years | 18 (8.1%) | 13 (5.8%) |
| 40 to 44 Years | 4 (1.8%) | 5 (2.2%) |
| 45 to 49 Years | 10 (4.5%) | 12 (5.4%) |
| 50 to 54 Years | 4 (1.8%) | 7 (3.1%) |
| 55 to 59 Years | 16 (7.2%) | 26 (11.6%) |
| 60 to 64 Years | 41 (18.4%) | 27 (12.0%) |
| 65 to 69 Years | 20 (9.0%) | 43 (19.2%) |
| 70 to 74 Years | 14 (6.3%) | 14 (6.2%) |
| 75 to 79 Years | 23 (10.3%) | 24 (10.7%) |
| 80 to 84 Years | 6 (2.7%) | 4 (1.8%) |
| 85 Years and over | 9 (4.0%) | 14 (6.2%) |
| Total | 223 (100.0%) | 224 (100.0%) |
Families and Households in Indian Point
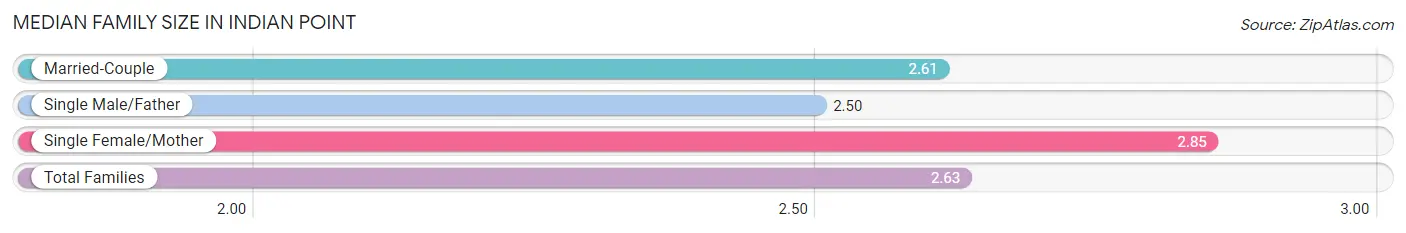
Median Family Size in Indian Point
The median family size in Indian Point is 2.63 persons per family, with single female/mother families (13 | 9.2%) accounting for the largest median family size of 2.85 persons per family. On the other hand, single male/father families (2 | 1.4%) represent the smallest median family size with 2.50 persons per family.
| Family Type | # Families | Family Size |
| Married-Couple | 126 (89.4%) | 2.61 |
| Single Male/Father | 2 (1.4%) | 2.50 |
| Single Female/Mother | 13 (9.2%) | 2.85 |
| Total Families | 141 (100.0%) | 2.63 |
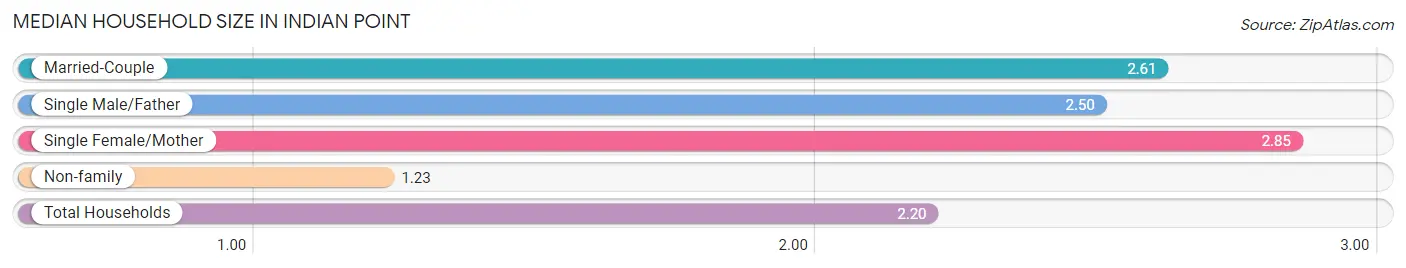
Median Household Size in Indian Point
The median household size in Indian Point is 2.20 persons per household, with single female/mother households (13 | 6.4%) accounting for the largest median household size of 2.85 persons per household. non-family households (62 | 30.5%) represent the smallest median household size with 1.23 persons per household.
| Household Type | # Households | Household Size |
| Married-Couple | 126 (62.1%) | 2.61 |
| Single Male/Father | 2 (1.0%) | 2.50 |
| Single Female/Mother | 13 (6.4%) | 2.85 |
| Non-family | 62 (30.5%) | 1.23 |
| Total Households | 203 (100.0%) | 2.20 |
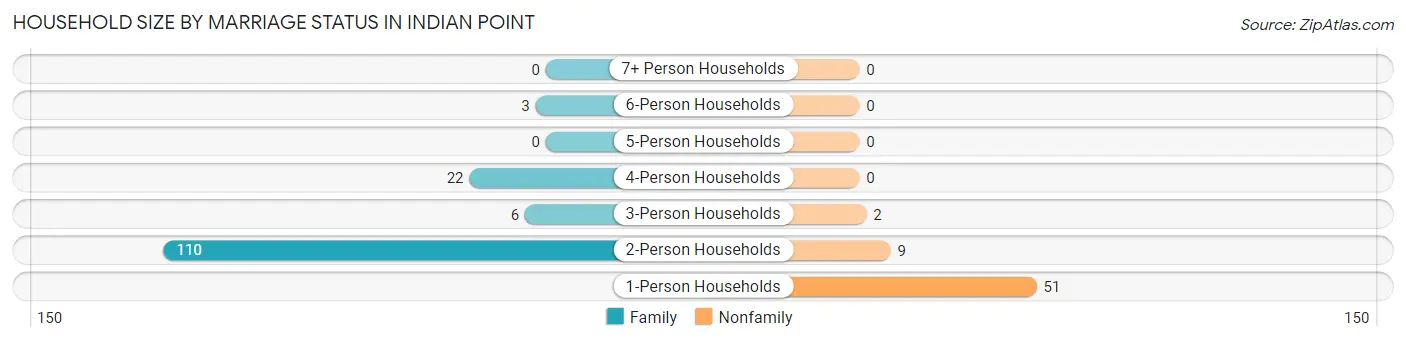
Household Size by Marriage Status in Indian Point
Out of a total of 203 households in Indian Point, 141 (69.5%) are family households, while 62 (30.5%) are nonfamily households. The most numerous type of family households are 2-person households, comprising 110, and the most common type of nonfamily households are 1-person households, comprising 51.
| Household Size | Family Households | Nonfamily Households |
| 1-Person Households | - | 51 (25.1%) |
| 2-Person Households | 110 (54.2%) | 9 (4.4%) |
| 3-Person Households | 6 (3.0%) | 2 (1.0%) |
| 4-Person Households | 22 (10.8%) | 0 (0.0%) |
| 5-Person Households | 0 (0.0%) | 0 (0.0%) |
| 6-Person Households | 3 (1.5%) | 0 (0.0%) |
| 7+ Person Households | 0 (0.0%) | 0 (0.0%) |
| Total | 141 (69.5%) | 62 (30.5%) |
Female Fertility in Indian Point
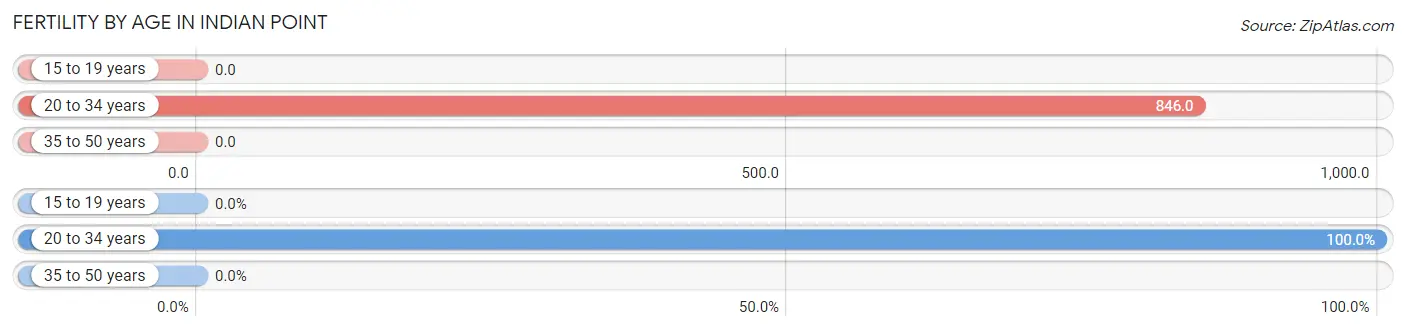
Fertility by Age in Indian Point
Average fertility rate in Indian Point is 244.0 births per 1,000 women. Women in the age bracket of 20 to 34 years have the highest fertility rate with 846.0 births per 1,000 women. Women in the age bracket of 20 to 34 years acount for 100.0% of all women with births.
| Age Bracket | Women with Births | Births / 1,000 Women |
| 15 to 19 years | 0 (0.0%) | 0.0 |
| 20 to 34 years | 11 (100.0%) | 846.0 |
| 35 to 50 years | 0 (0.0%) | 0.0 |
| Total | 11 (100.0%) | 244.0 |
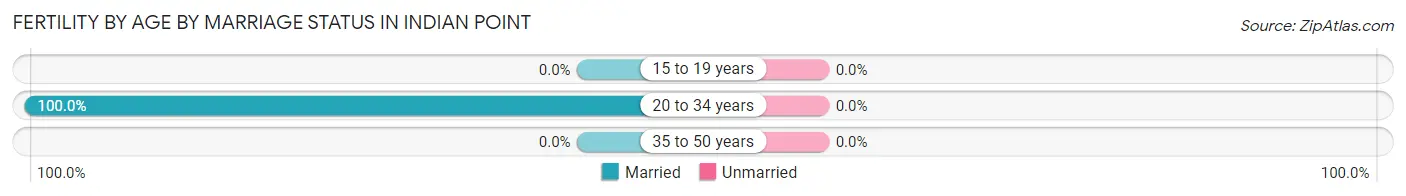
Fertility by Age by Marriage Status in Indian Point
| Age Bracket | Married | Unmarried |
| 15 to 19 years | 0 (0.0%) | 0 (0.0%) |
| 20 to 34 years | 11 (100.0%) | 0 (0.0%) |
| 35 to 50 years | 0 (0.0%) | 0 (0.0%) |
| Total | 11 (100.0%) | 0 (0.0%) |
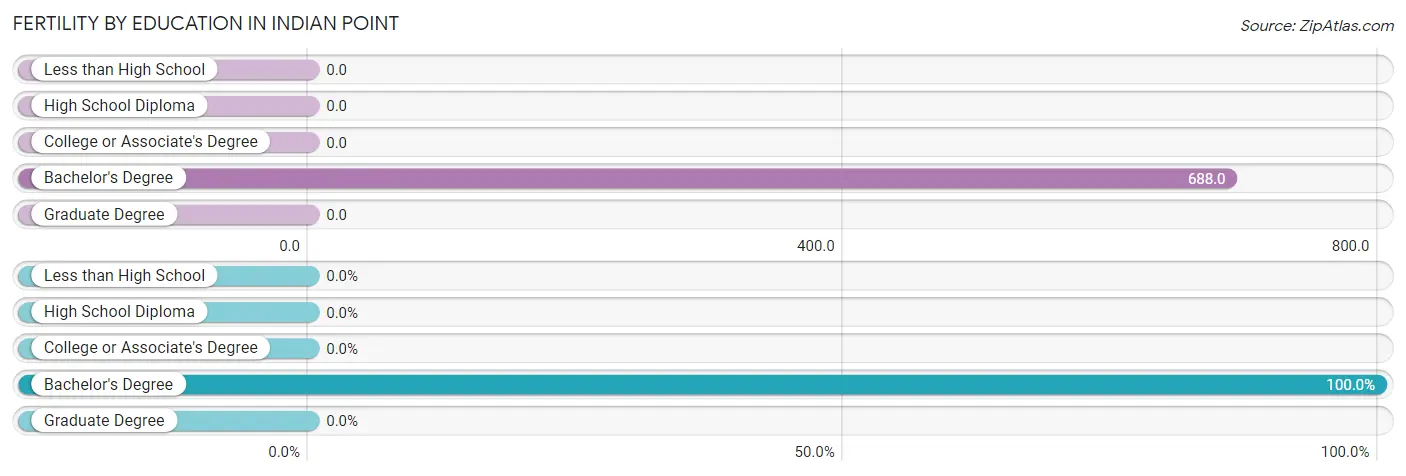
Fertility by Education in Indian Point
| Educational Attainment | Women with Births | Births / 1,000 Women |
| Less than High School | 0 (0.0%) | 0.0 |
| High School Diploma | 0 (0.0%) | 0.0 |
| College or Associate's Degree | 0 (0.0%) | 0.0 |
| Bachelor's Degree | 11 (100.0%) | 688.0 |
| Graduate Degree | 0 (0.0%) | 0.0 |
| Total | 11 (100.0%) | 244.0 |
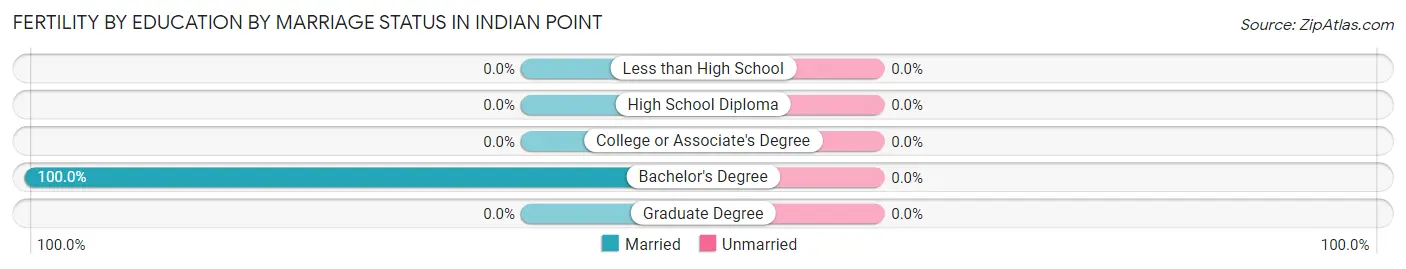
Fertility by Education by Marriage Status in Indian Point
| Educational Attainment | Married | Unmarried |
| Less than High School | 0 (0.0%) | 0 (0.0%) |
| High School Diploma | 0 (0.0%) | 0 (0.0%) |
| College or Associate's Degree | 0 (0.0%) | 0 (0.0%) |
| Bachelor's Degree | 11 (100.0%) | 0 (0.0%) |
| Graduate Degree | 0 (0.0%) | 0 (0.0%) |
| Total | 11 (100.0%) | 0 (0.0%) |
Income in Indian Point
Income Overview in Indian Point
Per Capita Income in Indian Point is $35,232, while median incomes of families and households are $81,932 and $75,625 respectively.
| Characteristic | Number | Measure |
| Per Capita Income | 447 | $35,232 |
| Median Family Income | 141 | $81,932 |
| Mean Family Income | 141 | $92,773 |
| Median Household Income | 203 | $75,625 |
| Mean Household Income | 203 | $75,638 |
| Income Deficit | 141 | $0 |
| Wage / Income Gap (%) | 447 | 54.22% |
| Wage / Income Gap ($) | 447 | 45.78¢ per $1 |
| Gini / Inequality Index | 447 | 0.36 |
Earnings by Sex in Indian Point
Average Earnings in Indian Point are $35,357, $53,365 for men and $24,432 for women, a difference of 54.2%.
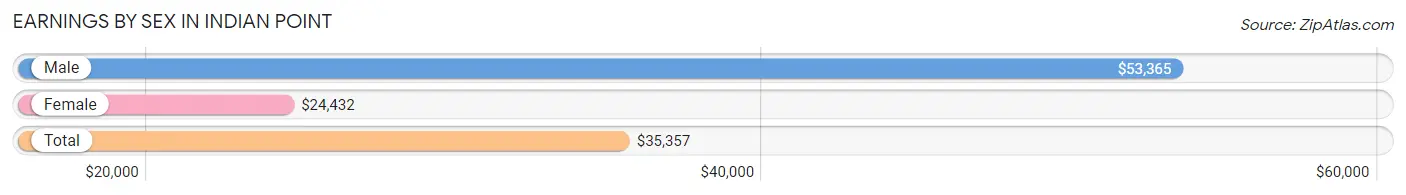
| Sex | Number | Average Earnings |
| Male | 117 (53.2%) | $53,365 |
| Female | 103 (46.8%) | $24,432 |
| Total | 220 (100.0%) | $35,357 |
Earnings by Sex by Income Bracket in Indian Point
The most common earnings brackets in Indian Point are $75,000 to $99,999 for men (25 | 21.4%) and $35,000 to $39,999 for women (14 | 13.6%).
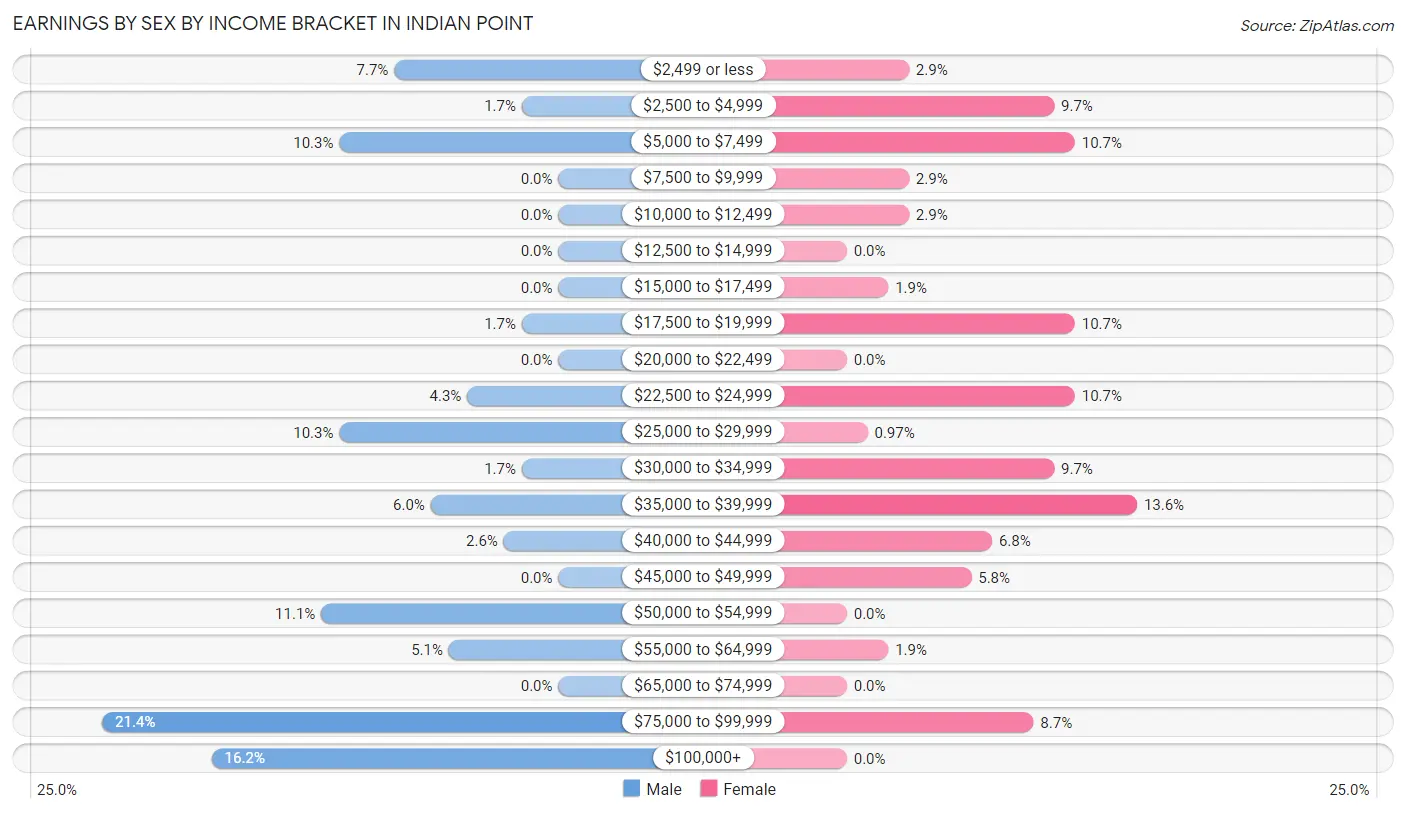
| Income | Male | Female |
| $2,499 or less | 9 (7.7%) | 3 (2.9%) |
| $2,500 to $4,999 | 2 (1.7%) | 10 (9.7%) |
| $5,000 to $7,499 | 12 (10.3%) | 11 (10.7%) |
| $7,500 to $9,999 | 0 (0.0%) | 3 (2.9%) |
| $10,000 to $12,499 | 0 (0.0%) | 3 (2.9%) |
| $12,500 to $14,999 | 0 (0.0%) | 0 (0.0%) |
| $15,000 to $17,499 | 0 (0.0%) | 2 (1.9%) |
| $17,500 to $19,999 | 2 (1.7%) | 11 (10.7%) |
| $20,000 to $22,499 | 0 (0.0%) | 0 (0.0%) |
| $22,500 to $24,999 | 5 (4.3%) | 11 (10.7%) |
| $25,000 to $29,999 | 12 (10.3%) | 1 (1.0%) |
| $30,000 to $34,999 | 2 (1.7%) | 10 (9.7%) |
| $35,000 to $39,999 | 7 (6.0%) | 14 (13.6%) |
| $40,000 to $44,999 | 3 (2.6%) | 7 (6.8%) |
| $45,000 to $49,999 | 0 (0.0%) | 6 (5.8%) |
| $50,000 to $54,999 | 13 (11.1%) | 0 (0.0%) |
| $55,000 to $64,999 | 6 (5.1%) | 2 (1.9%) |
| $65,000 to $74,999 | 0 (0.0%) | 0 (0.0%) |
| $75,000 to $99,999 | 25 (21.4%) | 9 (8.7%) |
| $100,000+ | 19 (16.2%) | 0 (0.0%) |
| Total | 117 (100.0%) | 103 (100.0%) |
Earnings by Sex by Educational Attainment in Indian Point
Average earnings in Indian Point are $54,615 for men and $24,861 for women, a difference of 54.5%. Men with an educational attainment of bachelor's degree enjoy the highest average annual earnings of $91,250, while those with college or associate's degree education earn the least with $53,281. Women with an educational attainment of college or associate's degree earn the most with the average annual earnings of $30,833, while those with high school diploma education have the smallest earnings of $30,625.
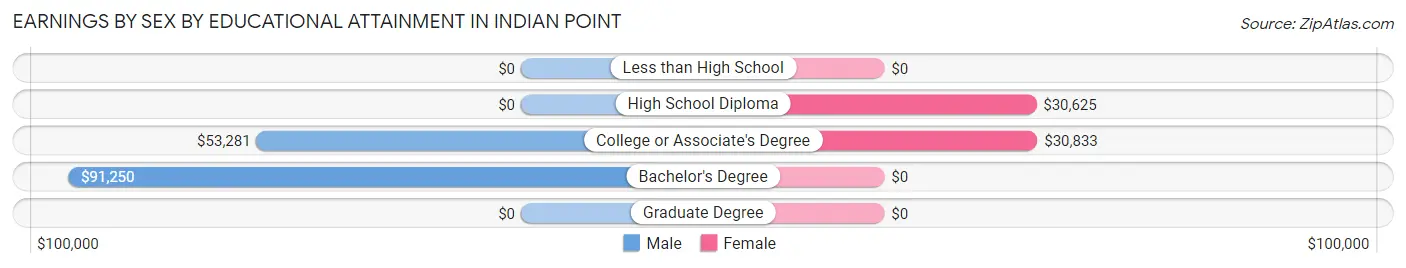
| Educational Attainment | Male Income | Female Income |
| Less than High School | - | - |
| High School Diploma | - | - |
| College or Associate's Degree | $53,281 | $30,833 |
| Bachelor's Degree | $91,250 | $0 |
| Graduate Degree | - | - |
| Total | $54,615 | $24,861 |
Family Income in Indian Point
Family Income Brackets in Indian Point
According to the Indian Point family income data, there are 42 families falling into the $75,000 to $99,999 income range, which is the most common income bracket and makes up 29.8% of all families.
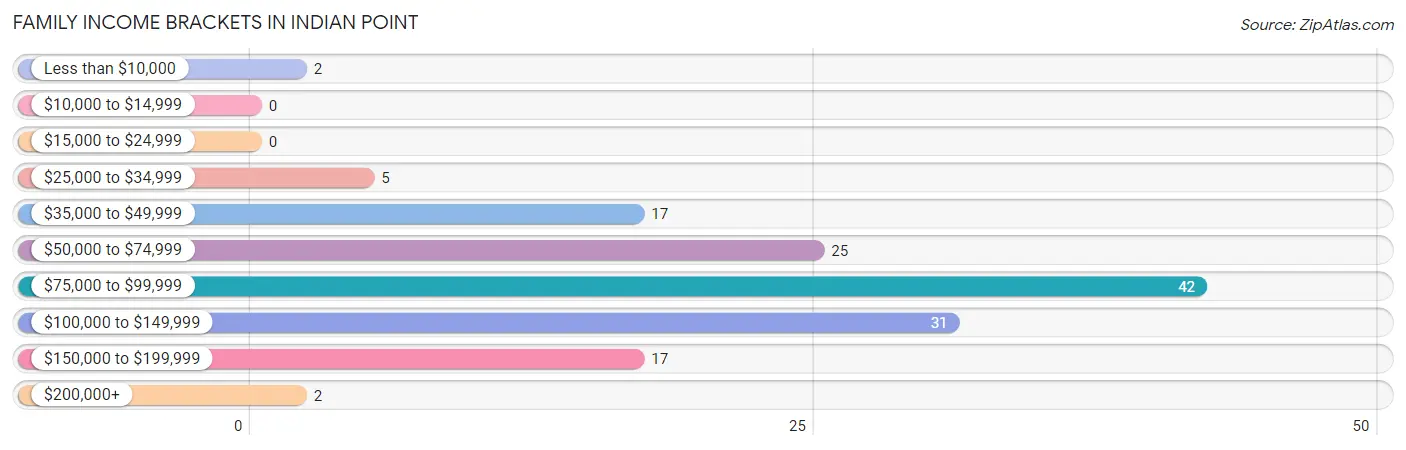
| Income Bracket | # Families | % Families |
| Less than $10,000 | 2 | 1.4% |
| $10,000 to $14,999 | 0 | 0.0% |
| $15,000 to $24,999 | 0 | 0.0% |
| $25,000 to $34,999 | 5 | 3.5% |
| $35,000 to $49,999 | 17 | 12.1% |
| $50,000 to $74,999 | 25 | 17.7% |
| $75,000 to $99,999 | 42 | 29.8% |
| $100,000 to $149,999 | 31 | 22.0% |
| $150,000 to $199,999 | 17 | 12.1% |
| $200,000+ | 2 | 1.4% |
Family Income by Famaliy Size in Indian Point
4-person families (22 | 15.6%) account for the highest median family income in Indian Point with $84,545 per family, while 2-person families (110 | 78.0%) have the highest median income of $40,000 per family member.
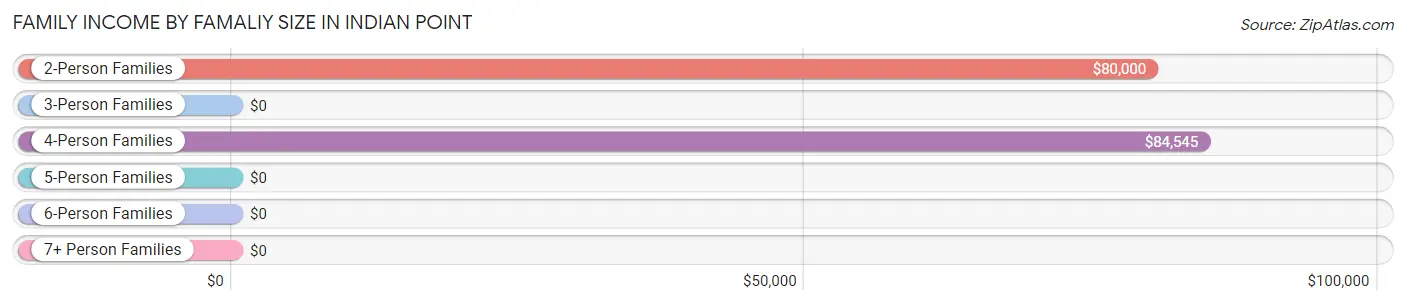
| Income Bracket | # Families | Median Income |
| 2-Person Families | 110 (78.0%) | $80,000 |
| 3-Person Families | 6 (4.3%) | $0 |
| 4-Person Families | 22 (15.6%) | $84,545 |
| 5-Person Families | 0 (0.0%) | $0 |
| 6-Person Families | 3 (2.1%) | $0 |
| 7+ Person Families | 0 (0.0%) | $0 |
| Total | 141 (100.0%) | $81,932 |
Family Income by Number of Earners in Indian Point
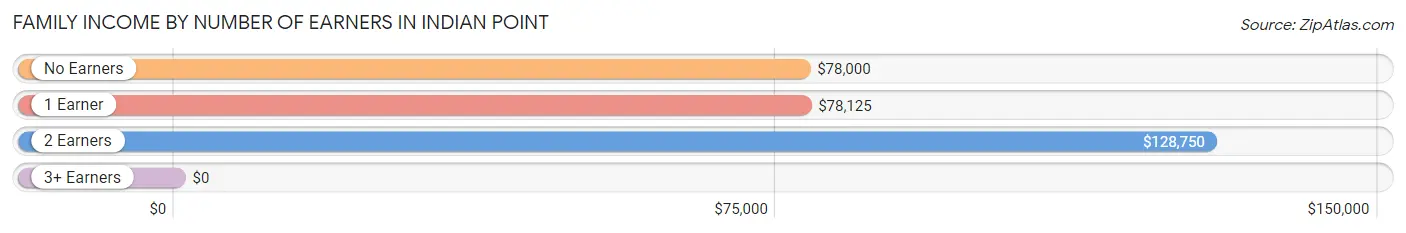
| Number of Earners | # Families | Median Income |
| No Earners | 46 (32.6%) | $78,000 |
| 1 Earner | 41 (29.1%) | $78,125 |
| 2 Earners | 48 (34.0%) | $128,750 |
| 3+ Earners | 6 (4.3%) | $0 |
| Total | 141 (100.0%) | $81,932 |
Household Income in Indian Point
Household Income Brackets in Indian Point
With 47 households falling in the category, the $75,000 to $99,999 income range is the most frequent in Indian Point, accounting for 23.2% of all households. In contrast, only 2 households (1.0%) fall into the $200,000+ income bracket, making it the least populous group.
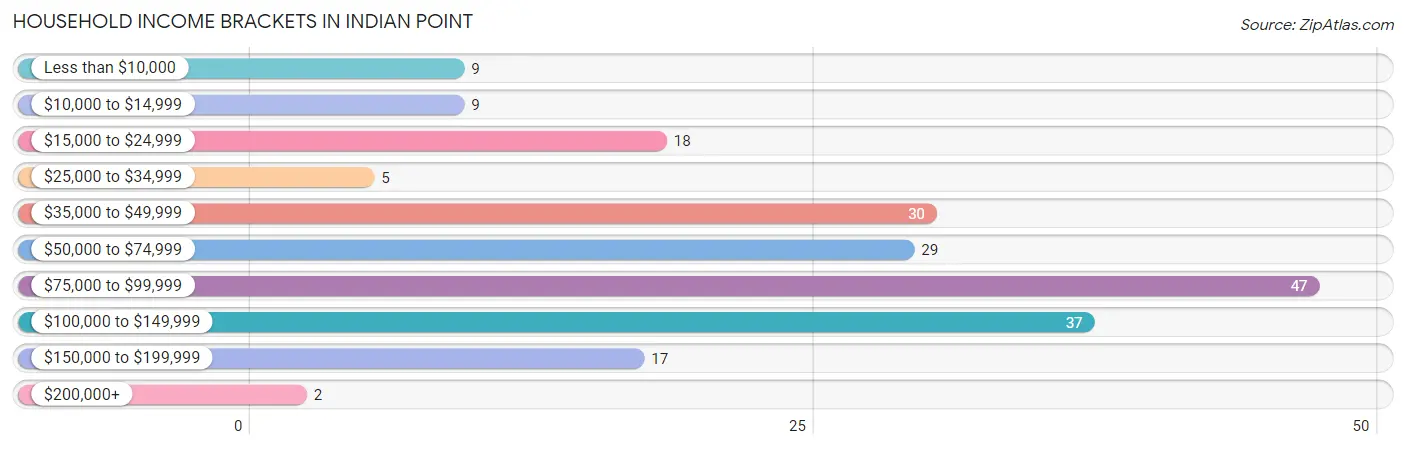
| Income Bracket | # Households | % Households |
| Less than $10,000 | 9 | 4.4% |
| $10,000 to $14,999 | 9 | 4.4% |
| $15,000 to $24,999 | 18 | 8.9% |
| $25,000 to $34,999 | 5 | 2.5% |
| $35,000 to $49,999 | 30 | 14.8% |
| $50,000 to $74,999 | 29 | 14.3% |
| $75,000 to $99,999 | 47 | 23.2% |
| $100,000 to $149,999 | 37 | 18.2% |
| $150,000 to $199,999 | 17 | 8.4% |
| $200,000+ | 2 | 1.0% |
Household Income by Householder Age in Indian Point
The median household income in Indian Point is $75,625, with the highest median household income of $97,917 found in the 45 to 64 years age bracket for the primary householder. A total of 77 households (37.9%) fall into this category. Meanwhile, the 15 to 24 years age bracket for the primary householder has the lowest median household income of $0, with 2 households (1.0%) in this group.
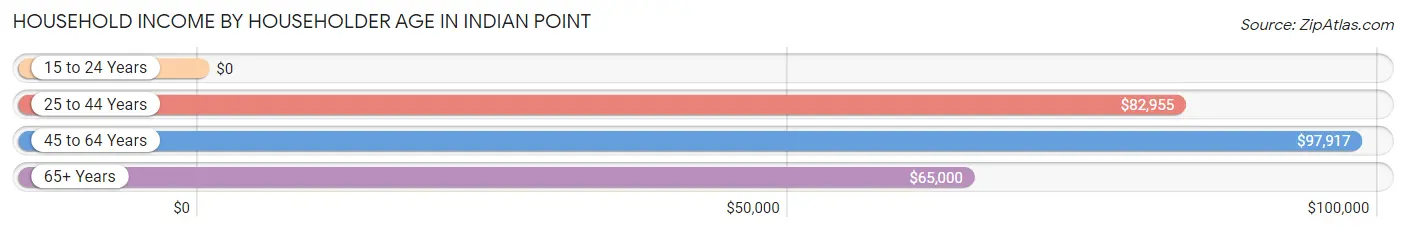
| Income Bracket | # Households | Median Income |
| 15 to 24 Years | 2 (1.0%) | $0 |
| 25 to 44 Years | 32 (15.8%) | $82,955 |
| 45 to 64 Years | 77 (37.9%) | $97,917 |
| 65+ Years | 92 (45.3%) | $65,000 |
| Total | 203 (100.0%) | $75,625 |
Poverty in Indian Point
Income Below Poverty by Sex and Age in Indian Point
With 6.3% poverty level for males and 5.4% for females among the residents of Indian Point, 45 to 54 year old males and 55 to 64 year old females are the most vulnerable to poverty, with 4 males (28.6%) and 6 females (11.3%) in their respective age groups living below the poverty level.
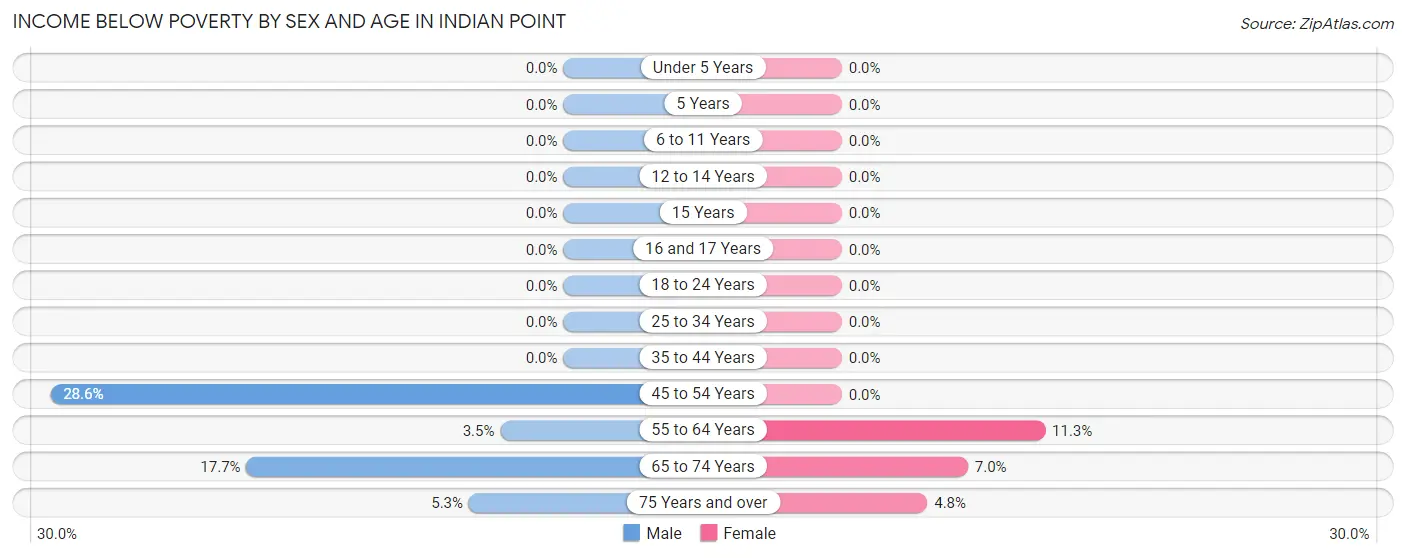
| Age Bracket | Male | Female |
| Under 5 Years | 0 (0.0%) | 0 (0.0%) |
| 5 Years | 0 (0.0%) | 0 (0.0%) |
| 6 to 11 Years | 0 (0.0%) | 0 (0.0%) |
| 12 to 14 Years | 0 (0.0%) | 0 (0.0%) |
| 15 Years | 0 (0.0%) | 0 (0.0%) |
| 16 and 17 Years | 0 (0.0%) | 0 (0.0%) |
| 18 to 24 Years | 0 (0.0%) | 0 (0.0%) |
| 25 to 34 Years | 0 (0.0%) | 0 (0.0%) |
| 35 to 44 Years | 0 (0.0%) | 0 (0.0%) |
| 45 to 54 Years | 4 (28.6%) | 0 (0.0%) |
| 55 to 64 Years | 2 (3.5%) | 6 (11.3%) |
| 65 to 74 Years | 6 (17.6%) | 4 (7.0%) |
| 75 Years and over | 2 (5.3%) | 2 (4.8%) |
| Total | 14 (6.3%) | 12 (5.4%) |
Income Above Poverty by Sex and Age in Indian Point
According to the poverty statistics in Indian Point, males aged under 5 years and females aged 5 years are the age groups that are most secure financially, with 100.0% of males and 100.0% of females in these age groups living above the poverty line.
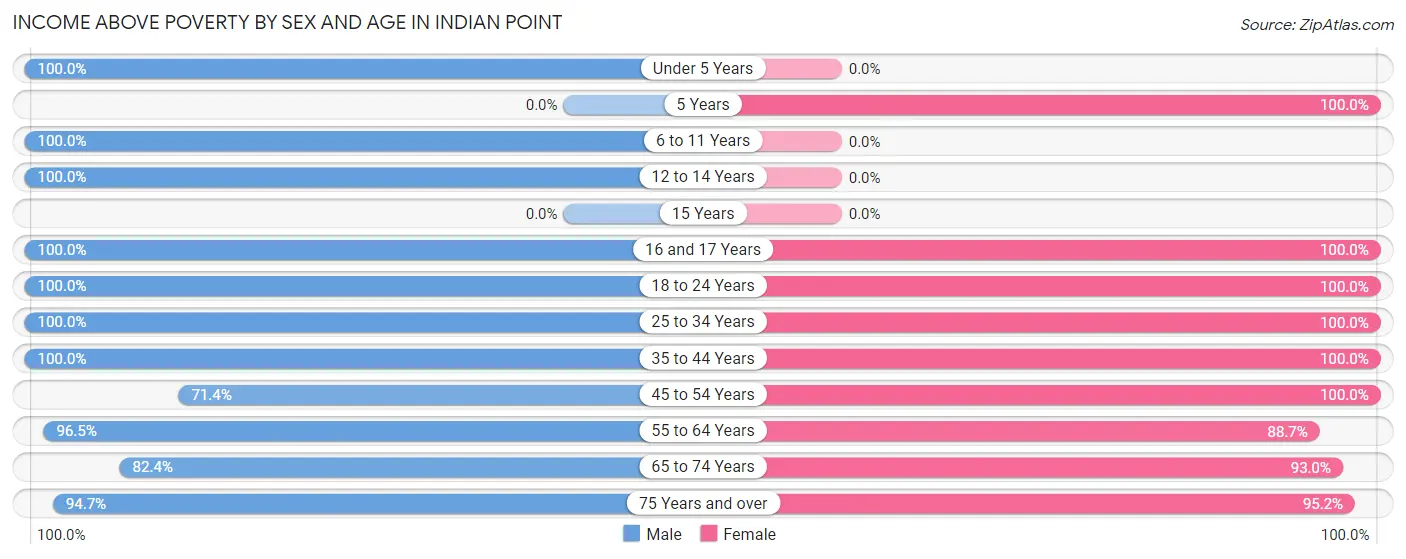
| Age Bracket | Male | Female |
| Under 5 Years | 16 (100.0%) | 0 (0.0%) |
| 5 Years | 0 (0.0%) | 20 (100.0%) |
| 6 to 11 Years | 14 (100.0%) | 0 (0.0%) |
| 12 to 14 Years | 3 (100.0%) | 0 (0.0%) |
| 15 Years | 0 (0.0%) | 0 (0.0%) |
| 16 and 17 Years | 4 (100.0%) | 2 (100.0%) |
| 18 to 24 Years | 19 (100.0%) | 2 (100.0%) |
| 25 to 34 Years | 2 (100.0%) | 11 (100.0%) |
| 35 to 44 Years | 22 (100.0%) | 18 (100.0%) |
| 45 to 54 Years | 10 (71.4%) | 19 (100.0%) |
| 55 to 64 Years | 55 (96.5%) | 47 (88.7%) |
| 65 to 74 Years | 28 (82.4%) | 53 (93.0%) |
| 75 Years and over | 36 (94.7%) | 40 (95.2%) |
| Total | 209 (93.7%) | 212 (94.6%) |
Income Below Poverty Among Married-Couple Families in Indian Point
The poverty statistics for married-couple families in Indian Point show that 1.6% or 2 of the total 126 families live below the poverty line. Families with no children have the highest poverty rate of 2.0%, comprising of 2 families. On the other hand, families with 1 or 2 children have the lowest poverty rate of 0.0%, which includes 0 families.
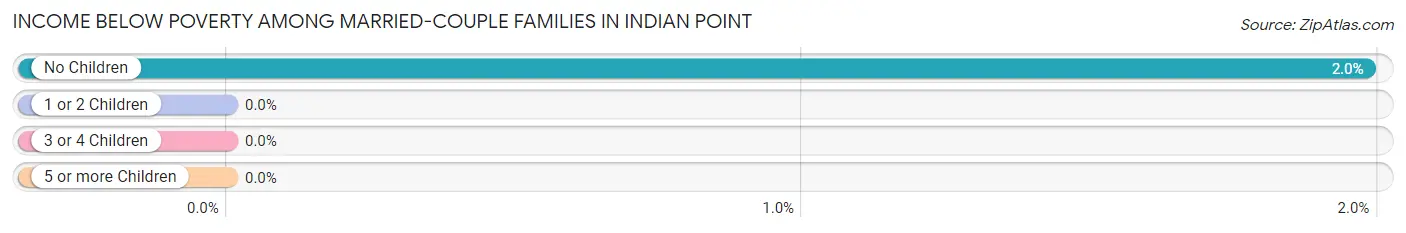
| Children | Above Poverty | Below Poverty |
| No Children | 99 (98.0%) | 2 (2.0%) |
| 1 or 2 Children | 22 (100.0%) | 0 (0.0%) |
| 3 or 4 Children | 3 (100.0%) | 0 (0.0%) |
| 5 or more Children | 0 (0.0%) | 0 (0.0%) |
| Total | 124 (98.4%) | 2 (1.6%) |
Income Below Poverty Among Single-Parent Households in Indian Point
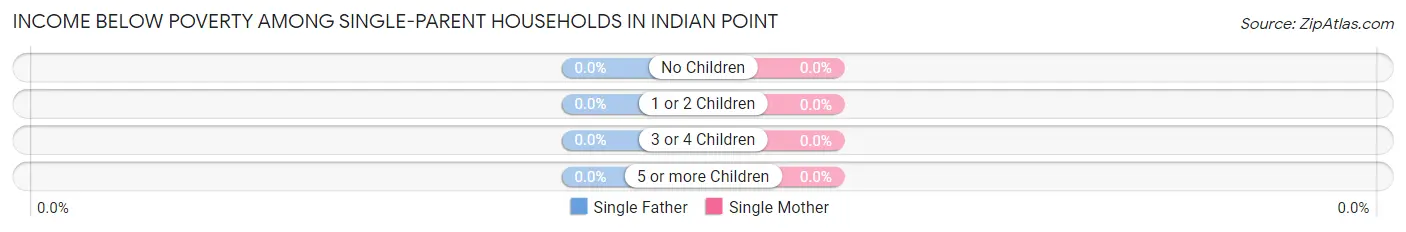
| Children | Single Father | Single Mother |
| No Children | 0 (0.0%) | 0 (0.0%) |
| 1 or 2 Children | 0 (0.0%) | 0 (0.0%) |
| 3 or 4 Children | 0 (0.0%) | 0 (0.0%) |
| 5 or more Children | 0 (0.0%) | 0 (0.0%) |
| Total | 0 (0.0%) | 0 (0.0%) |
Income Below Poverty Among Married-Couple vs Single-Parent Households in Indian Point
| Children | Married-Couple Families | Single-Parent Households |
| No Children | 2 (2.0%) | 0 (0.0%) |
| 1 or 2 Children | 0 (0.0%) | 0 (0.0%) |
| 3 or 4 Children | 0 (0.0%) | 0 (0.0%) |
| 5 or more Children | 0 (0.0%) | 0 (0.0%) |
| Total | 2 (1.6%) | 0 (0.0%) |
Employment Characteristics in Indian Point
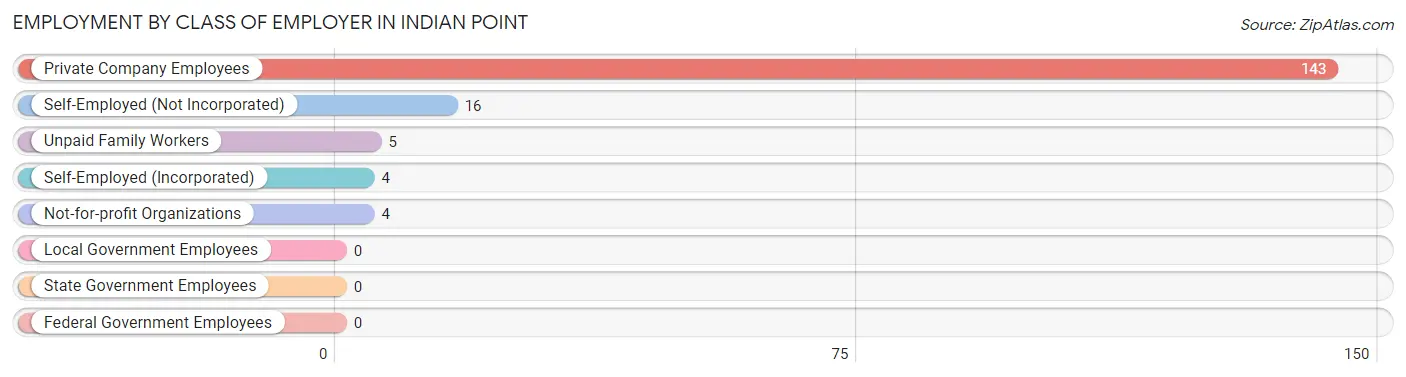
Employment by Class of Employer in Indian Point
Among the 172 employed individuals in Indian Point, private company employees (143 | 83.1%), self-employed (not incorporated) (16 | 9.3%), and unpaid family workers (5 | 2.9%) make up the most common classes of employment.
| Employer Class | # Employees | % Employees |
| Private Company Employees | 143 | 83.1% |
| Self-Employed (Incorporated) | 4 | 2.3% |
| Self-Employed (Not Incorporated) | 16 | 9.3% |
| Not-for-profit Organizations | 4 | 2.3% |
| Local Government Employees | 0 | 0.0% |
| State Government Employees | 0 | 0.0% |
| Federal Government Employees | 0 | 0.0% |
| Unpaid Family Workers | 5 | 2.9% |
| Total | 172 | 100.0% |
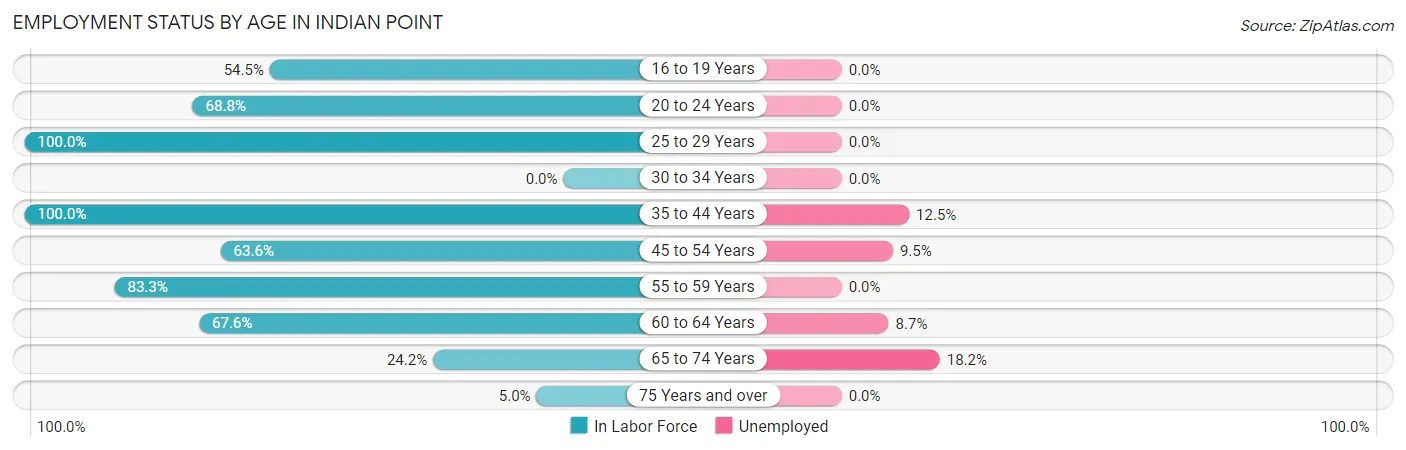
Employment Status by Age in Indian Point
According to the labor force statistics for Indian Point, out of the total population over 16 years of age (394), 47.5% or 187 individuals are in the labor force, with 8.0% or 15 of them unemployed. The age group with the highest labor force participation rate is 25 to 29 years, with 100.0% or 2 individuals in the labor force. Within the labor force, the 65 to 74 years age range has the highest percentage of unemployed individuals, with 18.2% or 4 of them being unemployed.
| Age Bracket | In Labor Force | Unemployed |
| 16 to 19 Years | 6 (54.5%) | 0 (0.0%) |
| 20 to 24 Years | 11 (68.8%) | 0 (0.0%) |
| 25 to 29 Years | 2 (100.0%) | 0 (0.0%) |
| 30 to 34 Years | 0 (0.0%) | 0 (0.0%) |
| 35 to 44 Years | 40 (100.0%) | 5 (12.5%) |
| 45 to 54 Years | 21 (63.6%) | 2 (9.5%) |
| 55 to 59 Years | 35 (83.3%) | 0 (0.0%) |
| 60 to 64 Years | 46 (67.6%) | 4 (8.7%) |
| 65 to 74 Years | 22 (24.2%) | 4 (18.2%) |
| 75 Years and over | 4 (5.0%) | 0 (0.0%) |
| Total | 187 (47.5%) | 15 (8.0%) |
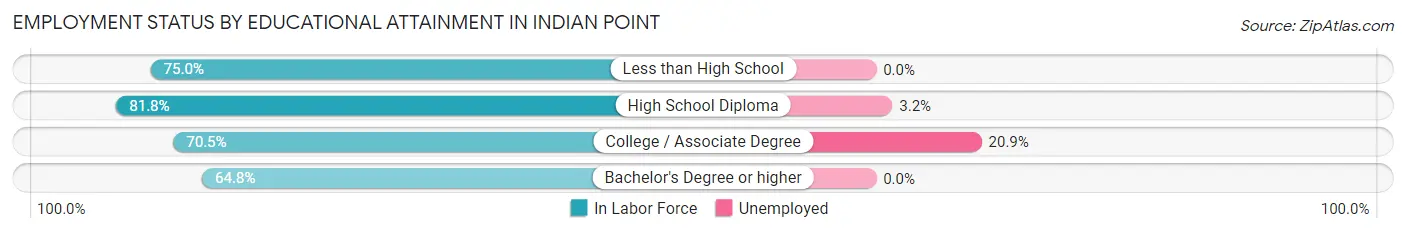
Employment Status by Educational Attainment in Indian Point
According to labor force statistics for Indian Point, 73.5% of individuals (144) out of the total population between 25 and 64 years of age (196) are in the labor force, with 7.6% or 11 of them being unemployed. The group with the highest labor force participation rate are those with the educational attainment of high school diploma, with 81.8% or 63 individuals in the labor force. Within the labor force, individuals with college / associate degree education have the highest percentage of unemployment, with 20.9% or 9 of them being unemployed.
| Educational Attainment | In Labor Force | Unemployed |
| Less than High School | 3 (75.0%) | 0 (0.0%) |
| High School Diploma | 63 (81.8%) | 2 (3.2%) |
| College / Associate Degree | 43 (70.5%) | 13 (20.9%) |
| Bachelor's Degree or higher | 35 (64.8%) | 0 (0.0%) |
| Total | 144 (73.5%) | 15 (7.6%) |
Employment Occupations by Sex in Indian Point
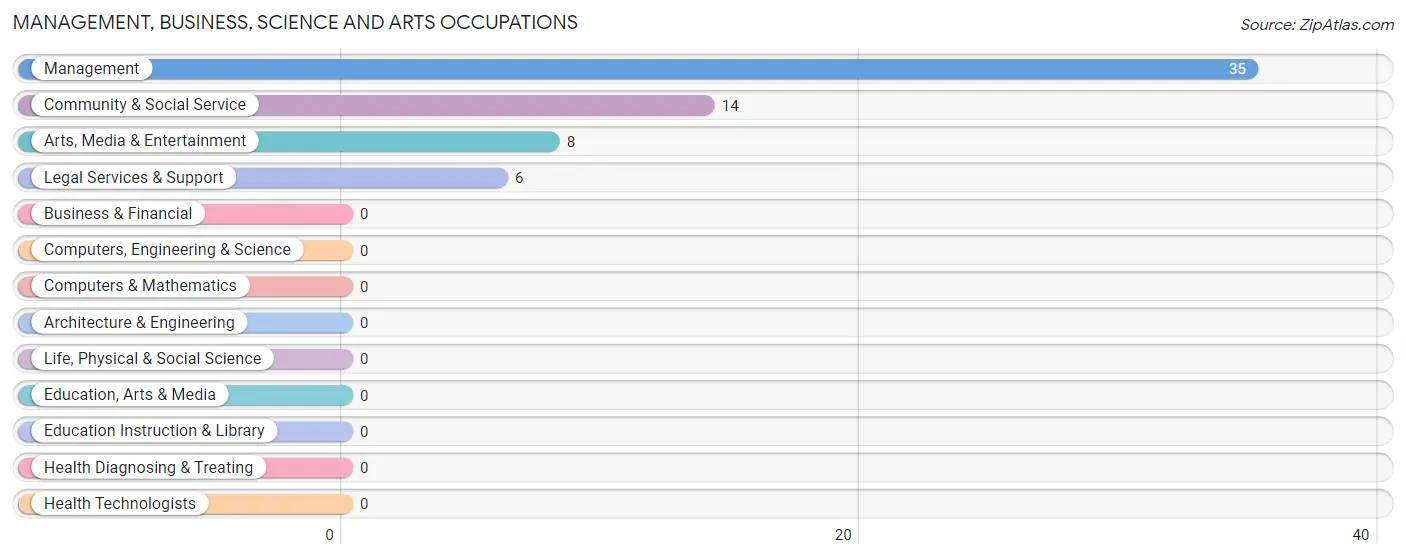
Management, Business, Science and Arts Occupations
The most common Management, Business, Science and Arts occupations in Indian Point are Management (35 | 20.3%), Community & Social Service (14 | 8.1%), Arts, Media & Entertainment (8 | 4.6%), and Legal Services & Support (6 | 3.5%).
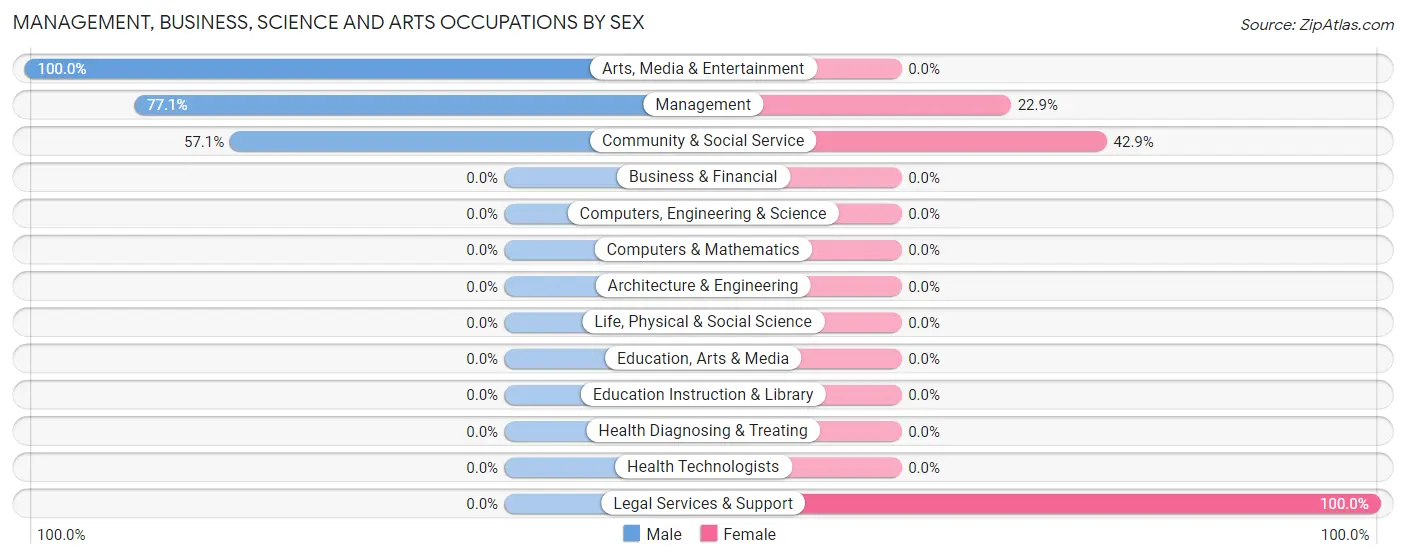
Management, Business, Science and Arts Occupations by Sex
Within the Management, Business, Science and Arts occupations in Indian Point, the most male-oriented occupations are Arts, Media & Entertainment (100.0%), Management (77.1%), and Community & Social Service (57.1%), while the most female-oriented occupations are Legal Services & Support (100.0%), Community & Social Service (42.9%), and Management (22.9%).
| Occupation | Male | Female |
| Management | 27 (77.1%) | 8 (22.9%) |
| Business & Financial | 0 (0.0%) | 0 (0.0%) |
| Computers, Engineering & Science | 0 (0.0%) | 0 (0.0%) |
| Computers & Mathematics | 0 (0.0%) | 0 (0.0%) |
| Architecture & Engineering | 0 (0.0%) | 0 (0.0%) |
| Life, Physical & Social Science | 0 (0.0%) | 0 (0.0%) |
| Community & Social Service | 8 (57.1%) | 6 (42.9%) |
| Education, Arts & Media | 0 (0.0%) | 0 (0.0%) |
| Legal Services & Support | 0 (0.0%) | 6 (100.0%) |
| Education Instruction & Library | 0 (0.0%) | 0 (0.0%) |
| Arts, Media & Entertainment | 8 (100.0%) | 0 (0.0%) |
| Health Diagnosing & Treating | 0 (0.0%) | 0 (0.0%) |
| Health Technologists | 0 (0.0%) | 0 (0.0%) |
| Total (Category) | 35 (71.4%) | 14 (28.6%) |
| Total (Overall) | 103 (59.9%) | 69 (40.1%) |
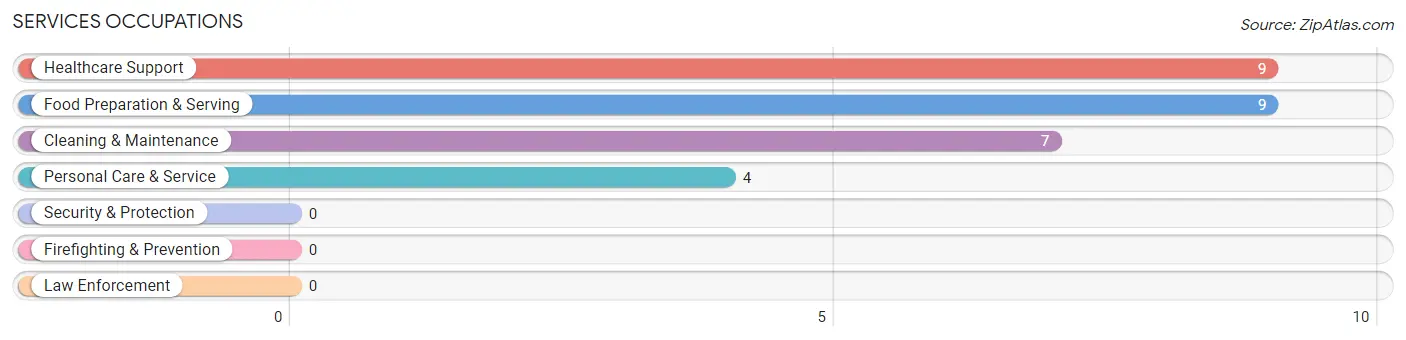
Services Occupations
The most common Services occupations in Indian Point are Healthcare Support (9 | 5.2%), Food Preparation & Serving (9 | 5.2%), Cleaning & Maintenance (7 | 4.1%), and Personal Care & Service (4 | 2.3%).
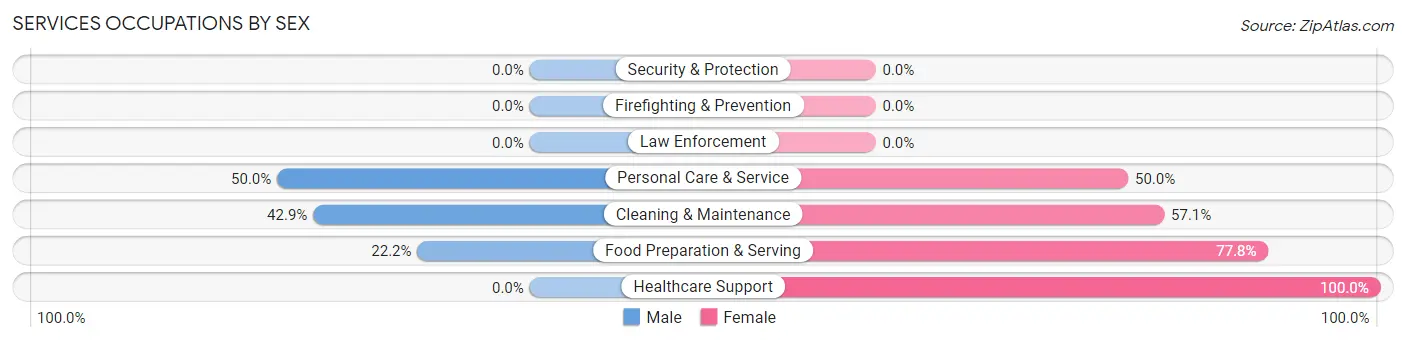
Services Occupations by Sex
Within the Services occupations in Indian Point, the most male-oriented occupations are Personal Care & Service (50.0%), Cleaning & Maintenance (42.9%), and Food Preparation & Serving (22.2%), while the most female-oriented occupations are Healthcare Support (100.0%), Food Preparation & Serving (77.8%), and Cleaning & Maintenance (57.1%).
| Occupation | Male | Female |
| Healthcare Support | 0 (0.0%) | 9 (100.0%) |
| Security & Protection | 0 (0.0%) | 0 (0.0%) |
| Firefighting & Prevention | 0 (0.0%) | 0 (0.0%) |
| Law Enforcement | 0 (0.0%) | 0 (0.0%) |
| Food Preparation & Serving | 2 (22.2%) | 7 (77.8%) |
| Cleaning & Maintenance | 3 (42.9%) | 4 (57.1%) |
| Personal Care & Service | 2 (50.0%) | 2 (50.0%) |
| Total (Category) | 7 (24.1%) | 22 (75.9%) |
| Total (Overall) | 103 (59.9%) | 69 (40.1%) |
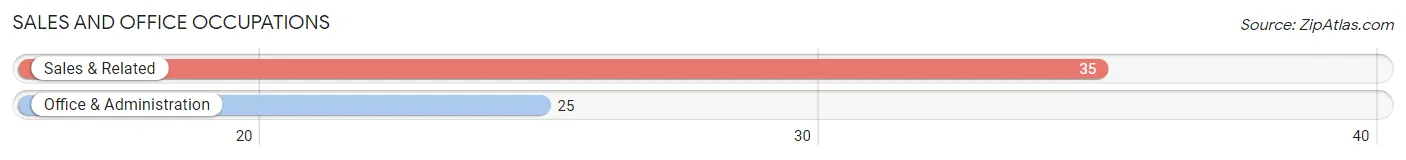
Sales and Office Occupations
The most common Sales and Office occupations in Indian Point are Sales & Related (35 | 20.3%), and Office & Administration (25 | 14.5%).
Sales and Office Occupations by Sex
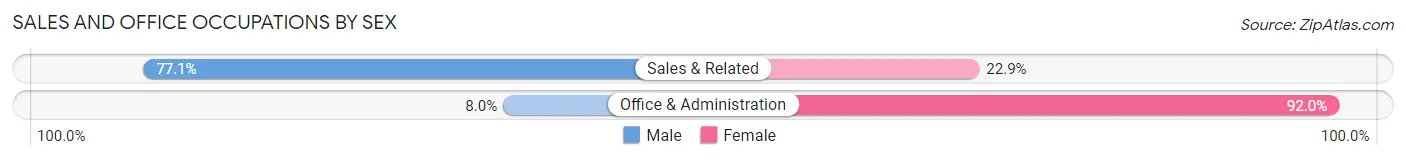
| Occupation | Male | Female |
| Sales & Related | 27 (77.1%) | 8 (22.9%) |
| Office & Administration | 2 (8.0%) | 23 (92.0%) |
| Total (Category) | 29 (48.3%) | 31 (51.7%) |
| Total (Overall) | 103 (59.9%) | 69 (40.1%) |
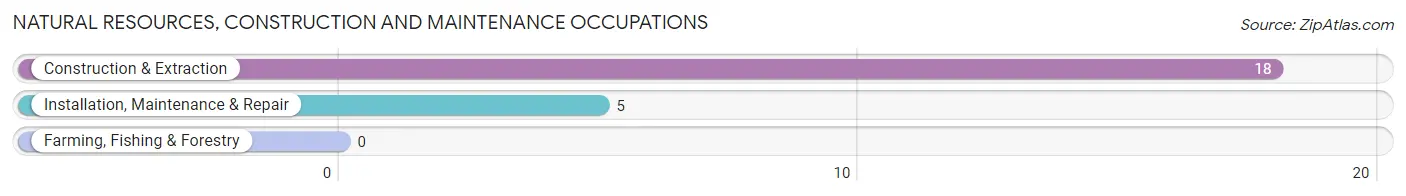
Natural Resources, Construction and Maintenance Occupations
The most common Natural Resources, Construction and Maintenance occupations in Indian Point are Construction & Extraction (18 | 10.5%), and Installation, Maintenance & Repair (5 | 2.9%).
Natural Resources, Construction and Maintenance Occupations by Sex
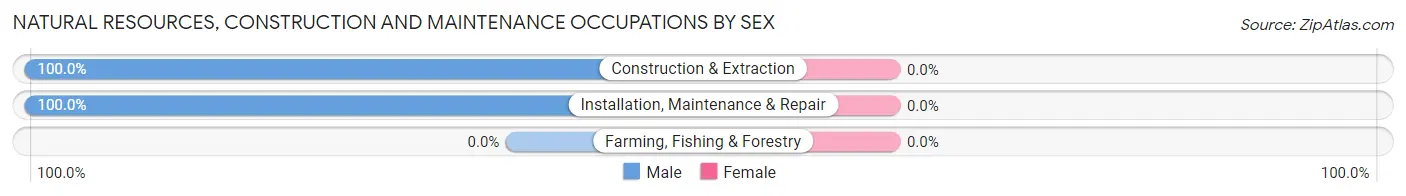
| Occupation | Male | Female |
| Farming, Fishing & Forestry | 0 (0.0%) | 0 (0.0%) |
| Construction & Extraction | 18 (100.0%) | 0 (0.0%) |
| Installation, Maintenance & Repair | 5 (100.0%) | 0 (0.0%) |
| Total (Category) | 23 (100.0%) | 0 (0.0%) |
| Total (Overall) | 103 (59.9%) | 69 (40.1%) |
Production, Transportation and Moving Occupations
The most common Production, Transportation and Moving occupations in Indian Point are Production (5 | 2.9%), Transportation (4 | 2.3%), and Material Moving (2 | 1.2%).
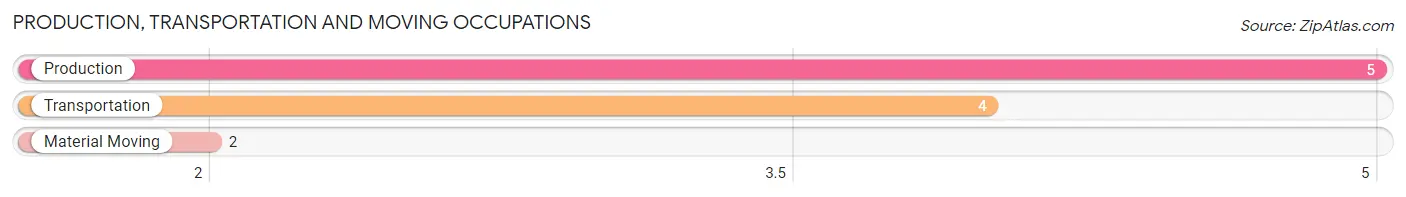
Production, Transportation and Moving Occupations by Sex
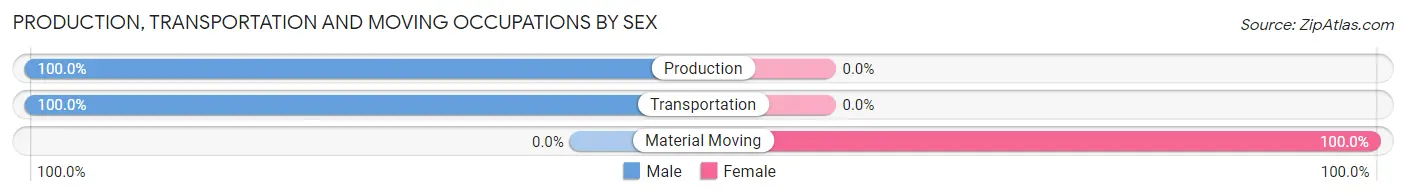
| Occupation | Male | Female |
| Production | 5 (100.0%) | 0 (0.0%) |
| Transportation | 4 (100.0%) | 0 (0.0%) |
| Material Moving | 0 (0.0%) | 2 (100.0%) |
| Total (Category) | 9 (81.8%) | 2 (18.2%) |
| Total (Overall) | 103 (59.9%) | 69 (40.1%) |
Employment Industries by Sex in Indian Point
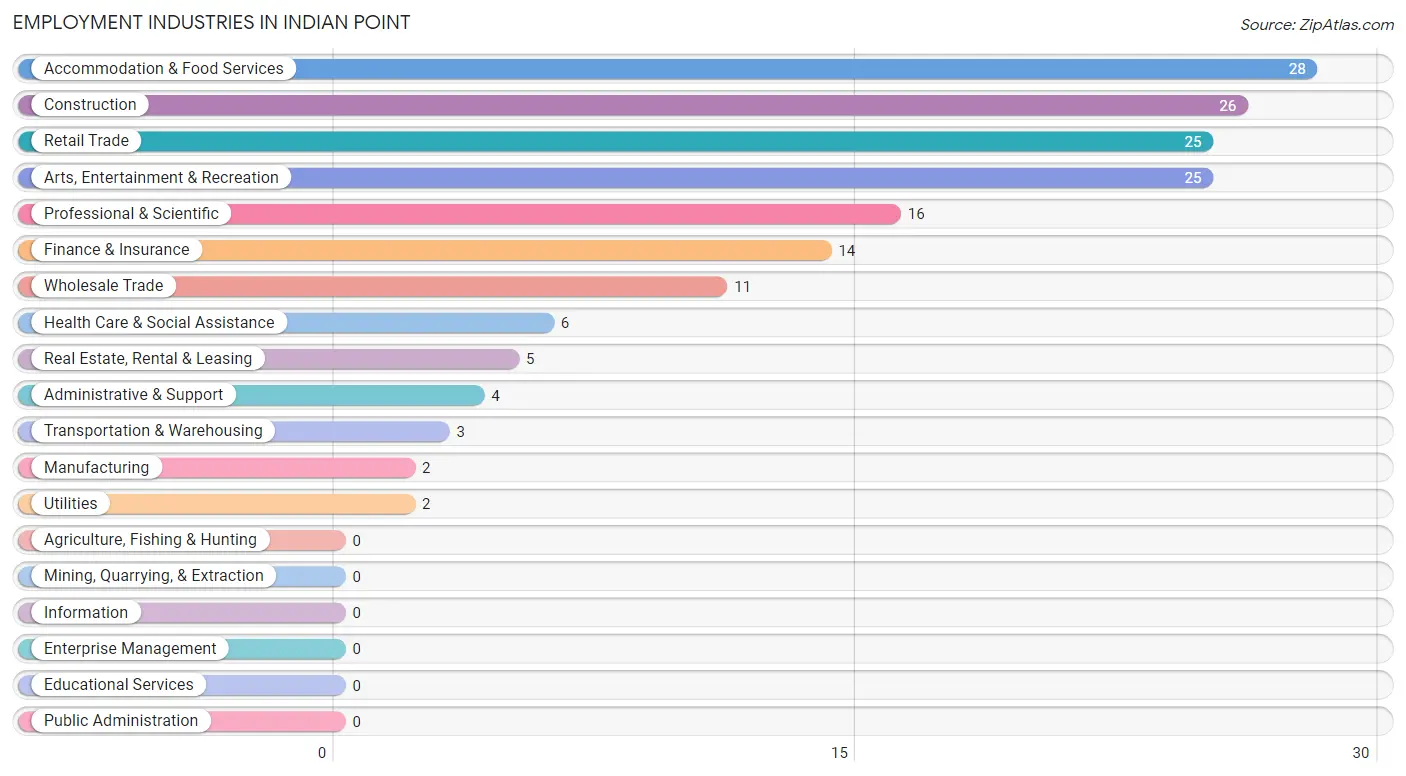
Employment Industries in Indian Point
The major employment industries in Indian Point include Accommodation & Food Services (28 | 16.3%), Construction (26 | 15.1%), Retail Trade (25 | 14.5%), Arts, Entertainment & Recreation (25 | 14.5%), and Professional & Scientific (16 | 9.3%).
Employment Industries by Sex in Indian Point
The Indian Point industries that see more men than women are Construction (100.0%), Manufacturing (100.0%), and Wholesale Trade (100.0%), whereas the industries that tend to have a higher number of women are Transportation & Warehousing (100.0%), Utilities (100.0%), and Finance & Insurance (100.0%).
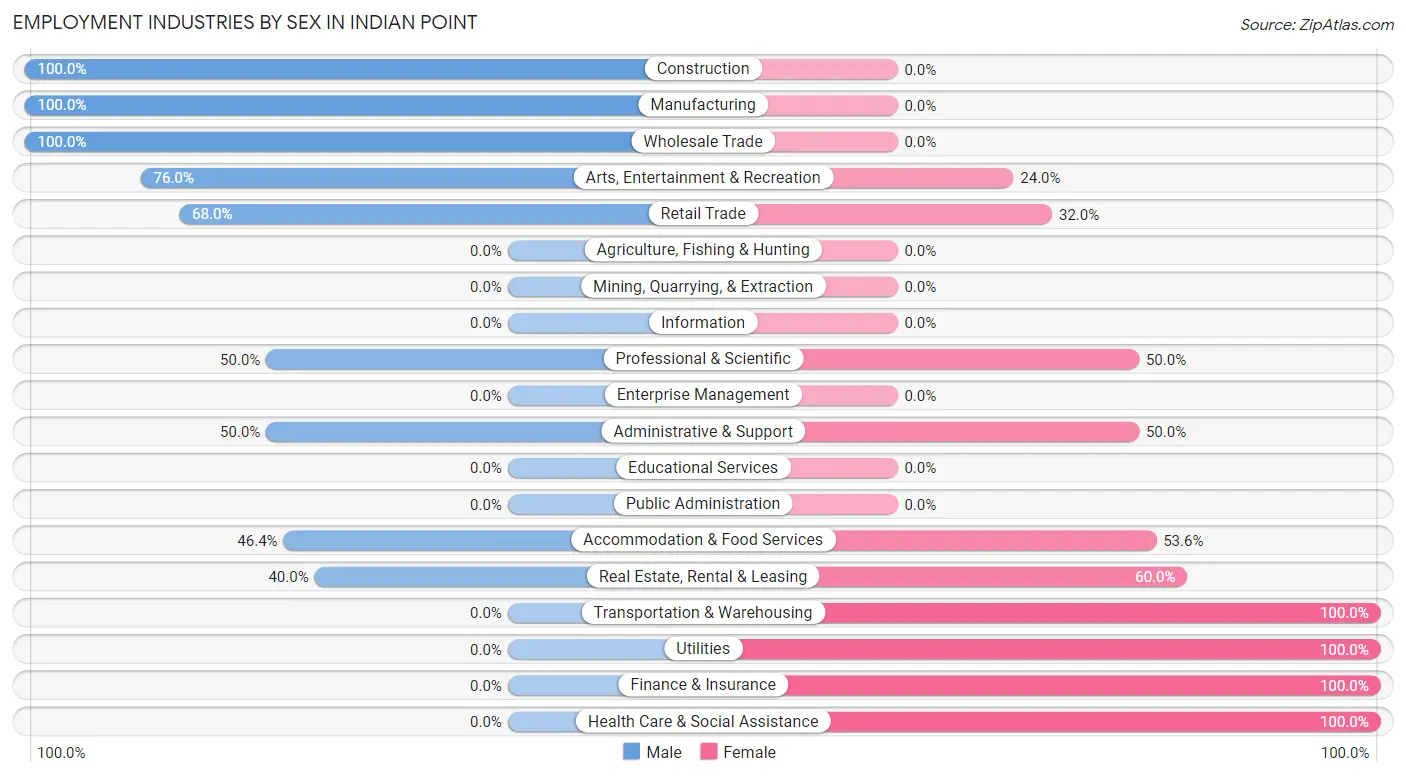
| Industry | Male | Female |
| Agriculture, Fishing & Hunting | 0 (0.0%) | 0 (0.0%) |
| Mining, Quarrying, & Extraction | 0 (0.0%) | 0 (0.0%) |
| Construction | 26 (100.0%) | 0 (0.0%) |
| Manufacturing | 2 (100.0%) | 0 (0.0%) |
| Wholesale Trade | 11 (100.0%) | 0 (0.0%) |
| Retail Trade | 17 (68.0%) | 8 (32.0%) |
| Transportation & Warehousing | 0 (0.0%) | 3 (100.0%) |
| Utilities | 0 (0.0%) | 2 (100.0%) |
| Information | 0 (0.0%) | 0 (0.0%) |
| Finance & Insurance | 0 (0.0%) | 14 (100.0%) |
| Real Estate, Rental & Leasing | 2 (40.0%) | 3 (60.0%) |
| Professional & Scientific | 8 (50.0%) | 8 (50.0%) |
| Enterprise Management | 0 (0.0%) | 0 (0.0%) |
| Administrative & Support | 2 (50.0%) | 2 (50.0%) |
| Educational Services | 0 (0.0%) | 0 (0.0%) |
| Health Care & Social Assistance | 0 (0.0%) | 6 (100.0%) |
| Arts, Entertainment & Recreation | 19 (76.0%) | 6 (24.0%) |
| Accommodation & Food Services | 13 (46.4%) | 15 (53.6%) |
| Public Administration | 0 (0.0%) | 0 (0.0%) |
| Total | 103 (59.9%) | 69 (40.1%) |
Education in Indian Point
School Enrollment in Indian Point
The most common levels of schooling among the 57 students in Indian Point are nursery / preschool (15 | 26.3%), elementary school (14 | 24.6%), and college / undergraduate (10 | 17.5%).
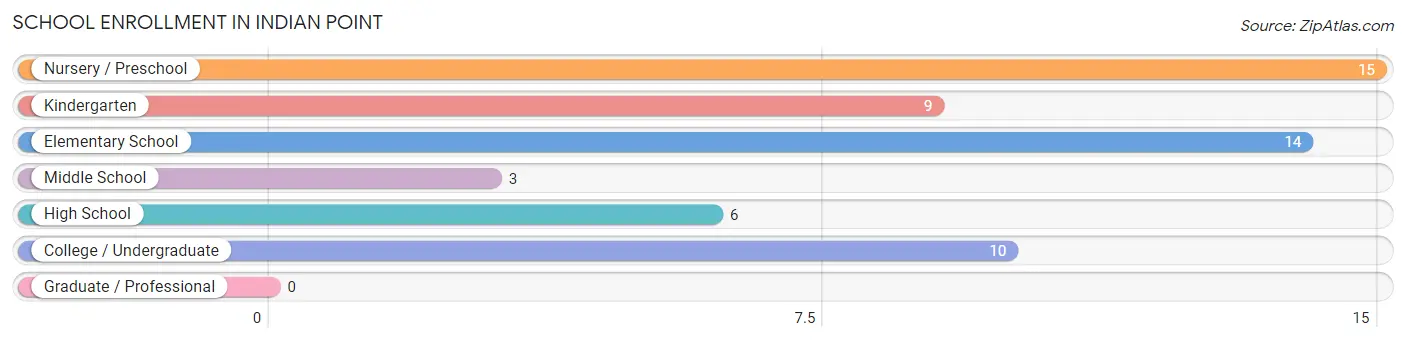
| School Level | # Students | % Students |
| Nursery / Preschool | 15 | 26.3% |
| Kindergarten | 9 | 15.8% |
| Elementary School | 14 | 24.6% |
| Middle School | 3 | 5.3% |
| High School | 6 | 10.5% |
| College / Undergraduate | 10 | 17.5% |
| Graduate / Professional | 0 | 0.0% |
| Total | 57 | 100.0% |
School Enrollment by Age by Funding Source in Indian Point
Out of a total of 57 students who are enrolled in schools in Indian Point, 13 (22.8%) attend a private institution, while the remaining 44 (77.2%) are enrolled in public schools. The age group of 3 to 4 year olds has the highest likelihood of being enrolled in private schools, with 4 (100.0% in the age bracket) enrolled. Conversely, the age group of 15 to 17 year olds has the lowest likelihood of being enrolled in a private school, with 6 (100.0% in the age bracket) attending a public institution.
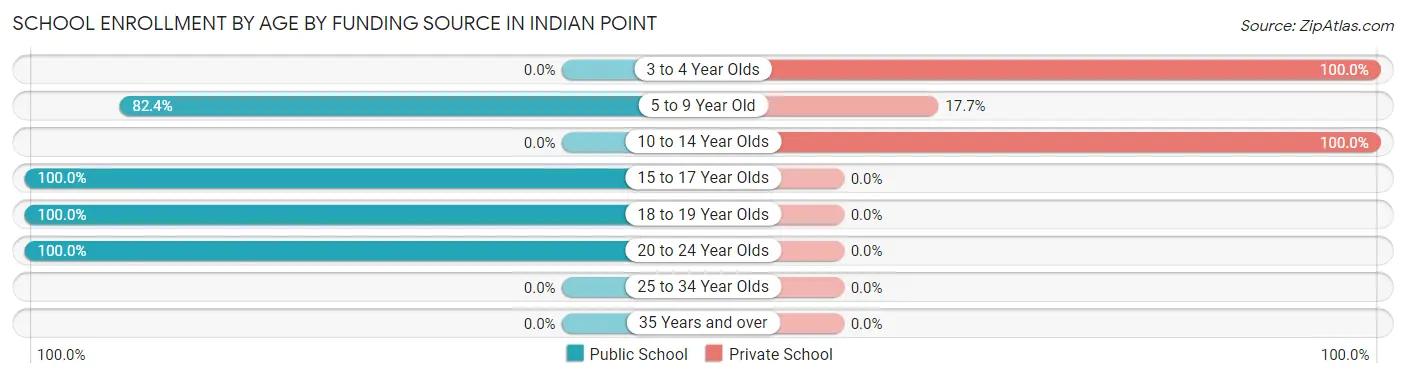
| Age Bracket | Public School | Private School |
| 3 to 4 Year Olds | 0 (0.0%) | 4 (100.0%) |
| 5 to 9 Year Old | 28 (82.4%) | 6 (17.6%) |
| 10 to 14 Year Olds | 0 (0.0%) | 3 (100.0%) |
| 15 to 17 Year Olds | 6 (100.0%) | 0 (0.0%) |
| 18 to 19 Year Olds | 5 (100.0%) | 0 (0.0%) |
| 20 to 24 Year Olds | 5 (100.0%) | 0 (0.0%) |
| 25 to 34 Year Olds | 0 (0.0%) | 0 (0.0%) |
| 35 Years and over | 0 (0.0%) | 0 (0.0%) |
| Total | 44 (77.2%) | 13 (22.8%) |
Educational Attainment by Field of Study in Indian Point
Business (39 | 30.0%), education (30 | 23.1%), bio, nature & agricultural (26 | 20.0%), science & technology (11 | 8.5%), and engineering (9 | 6.9%) are the most common fields of study among 130 individuals in Indian Point who have obtained a bachelor's degree or higher.
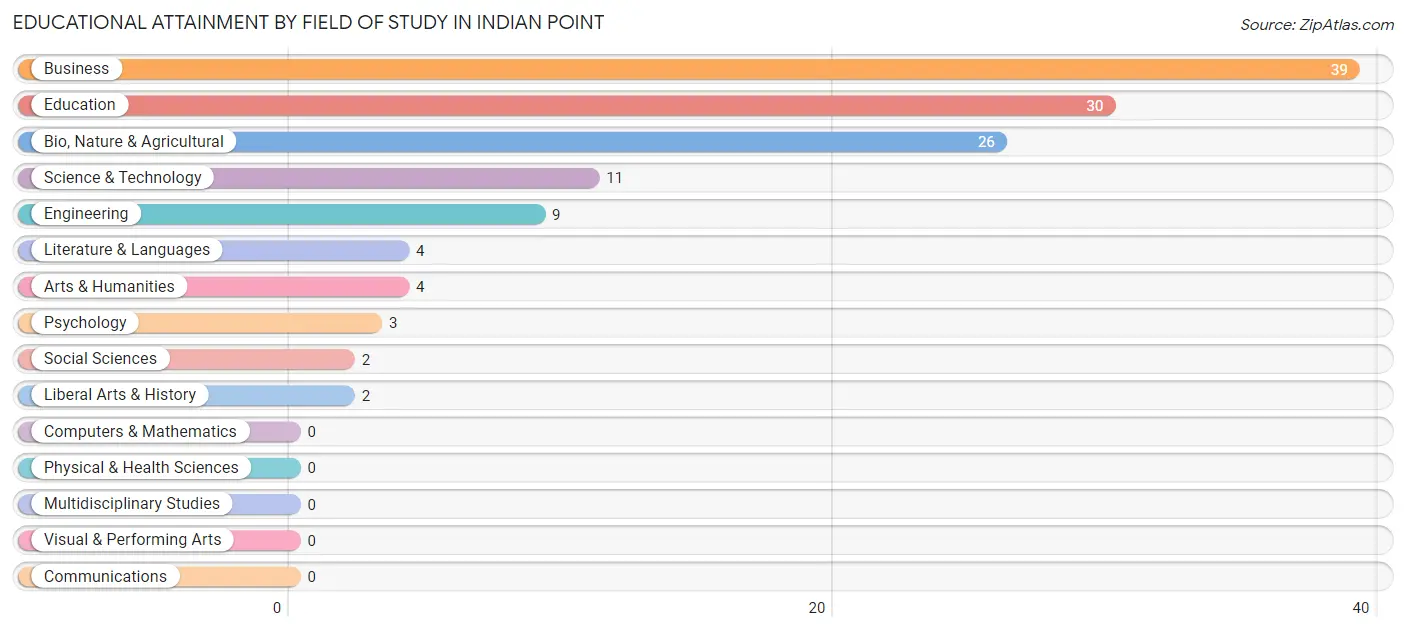
| Field of Study | # Graduates | % Graduates |
| Computers & Mathematics | 0 | 0.0% |
| Bio, Nature & Agricultural | 26 | 20.0% |
| Physical & Health Sciences | 0 | 0.0% |
| Psychology | 3 | 2.3% |
| Social Sciences | 2 | 1.5% |
| Engineering | 9 | 6.9% |
| Multidisciplinary Studies | 0 | 0.0% |
| Science & Technology | 11 | 8.5% |
| Business | 39 | 30.0% |
| Education | 30 | 23.1% |
| Literature & Languages | 4 | 3.1% |
| Liberal Arts & History | 2 | 1.5% |
| Visual & Performing Arts | 0 | 0.0% |
| Communications | 0 | 0.0% |
| Arts & Humanities | 4 | 3.1% |
| Total | 130 | 100.0% |
Transportation & Commute in Indian Point
Vehicle Availability by Sex in Indian Point
The most prevalent vehicle ownership categories in Indian Point are males with 2 vehicles (51, accounting for 49.5%) and females with 2 vehicles (32, making up 73.9%).
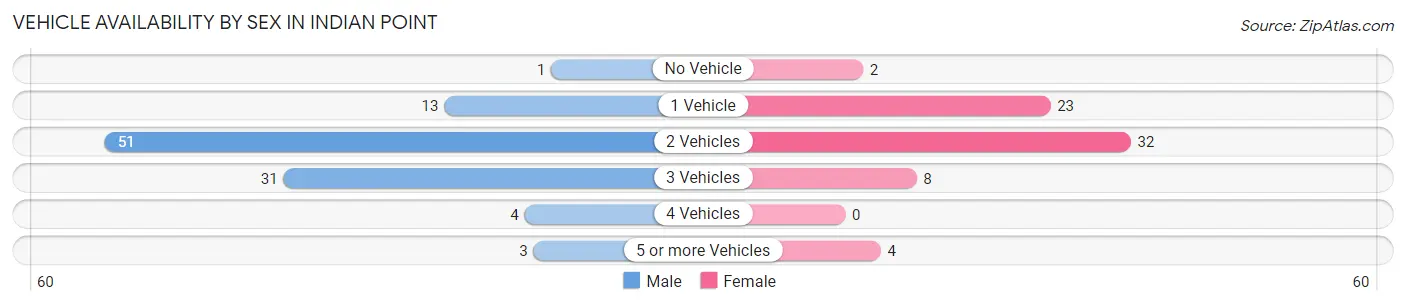
| Vehicles Available | Male | Female |
| No Vehicle | 1 (1.0%) | 2 (2.9%) |
| 1 Vehicle | 13 (12.6%) | 23 (33.3%) |
| 2 Vehicles | 51 (49.5%) | 32 (46.4%) |
| 3 Vehicles | 31 (30.1%) | 8 (11.6%) |
| 4 Vehicles | 4 (3.9%) | 0 (0.0%) |
| 5 or more Vehicles | 3 (2.9%) | 4 (5.8%) |
| Total | 103 (100.0%) | 69 (100.0%) |
Commute Time in Indian Point
The most frequently occuring commute durations in Indian Point are 15 to 19 minutes (31 commuters, 19.5%), 5 to 9 minutes (25 commuters, 15.7%), and 20 to 24 minutes (23 commuters, 14.5%).
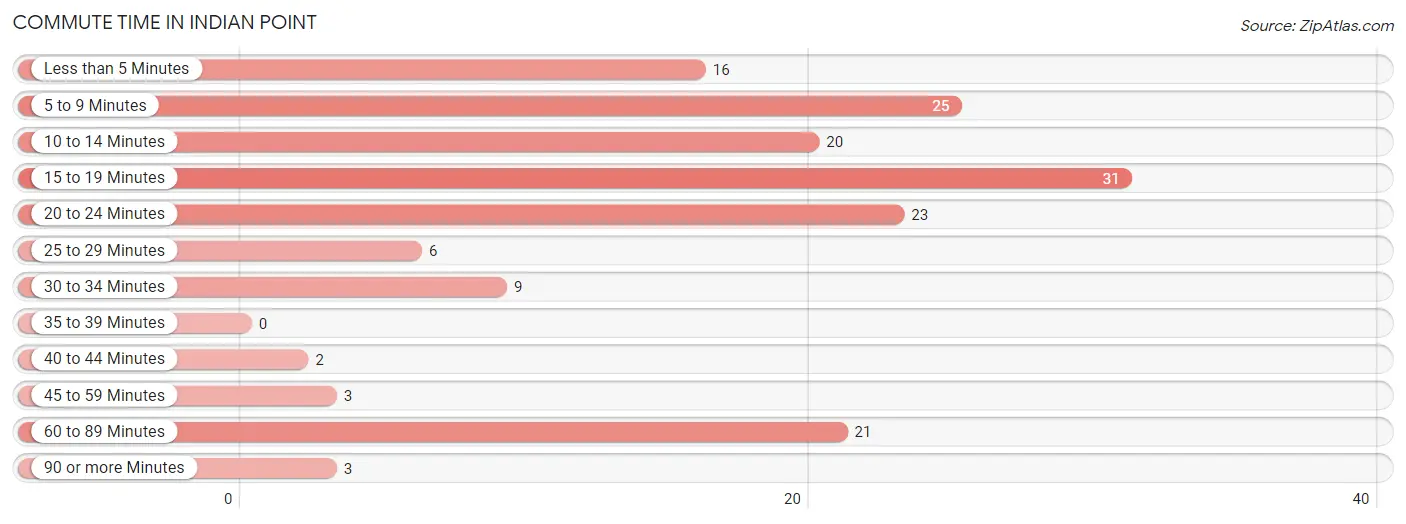
| Commute Time | # Commuters | % Commuters |
| Less than 5 Minutes | 16 | 10.1% |
| 5 to 9 Minutes | 25 | 15.7% |
| 10 to 14 Minutes | 20 | 12.6% |
| 15 to 19 Minutes | 31 | 19.5% |
| 20 to 24 Minutes | 23 | 14.5% |
| 25 to 29 Minutes | 6 | 3.8% |
| 30 to 34 Minutes | 9 | 5.7% |
| 35 to 39 Minutes | 0 | 0.0% |
| 40 to 44 Minutes | 2 | 1.3% |
| 45 to 59 Minutes | 3 | 1.9% |
| 60 to 89 Minutes | 21 | 13.2% |
| 90 or more Minutes | 3 | 1.9% |
Commute Time by Sex in Indian Point
The most common commute times in Indian Point are 15 to 19 minutes (28 commuters, 27.7%) for males and 20 to 24 minutes (17 commuters, 29.3%) for females.
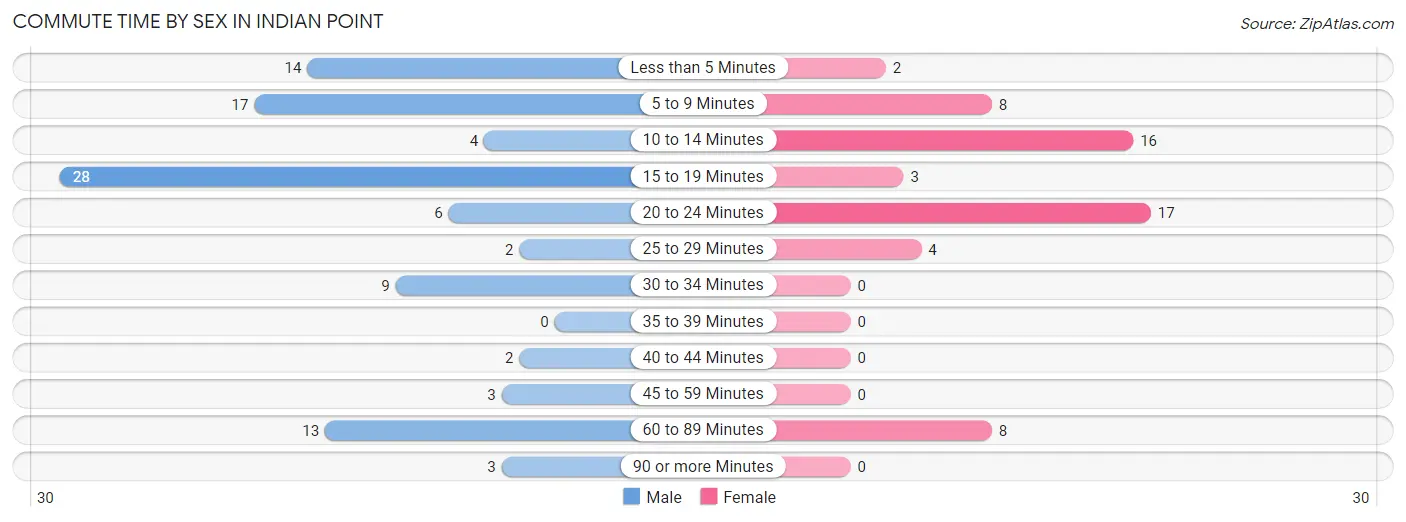
| Commute Time | Male | Female |
| Less than 5 Minutes | 14 (13.9%) | 2 (3.5%) |
| 5 to 9 Minutes | 17 (16.8%) | 8 (13.8%) |
| 10 to 14 Minutes | 4 (4.0%) | 16 (27.6%) |
| 15 to 19 Minutes | 28 (27.7%) | 3 (5.2%) |
| 20 to 24 Minutes | 6 (5.9%) | 17 (29.3%) |
| 25 to 29 Minutes | 2 (2.0%) | 4 (6.9%) |
| 30 to 34 Minutes | 9 (8.9%) | 0 (0.0%) |
| 35 to 39 Minutes | 0 (0.0%) | 0 (0.0%) |
| 40 to 44 Minutes | 2 (2.0%) | 0 (0.0%) |
| 45 to 59 Minutes | 3 (3.0%) | 0 (0.0%) |
| 60 to 89 Minutes | 13 (12.9%) | 8 (13.8%) |
| 90 or more Minutes | 3 (3.0%) | 0 (0.0%) |
Time of Departure to Work by Sex in Indian Point
The most frequent times of departure to work in Indian Point are 5:30 AM to 5:59 AM (18, 17.8%) for males and 6:00 AM to 6:29 AM (20, 34.5%) for females.
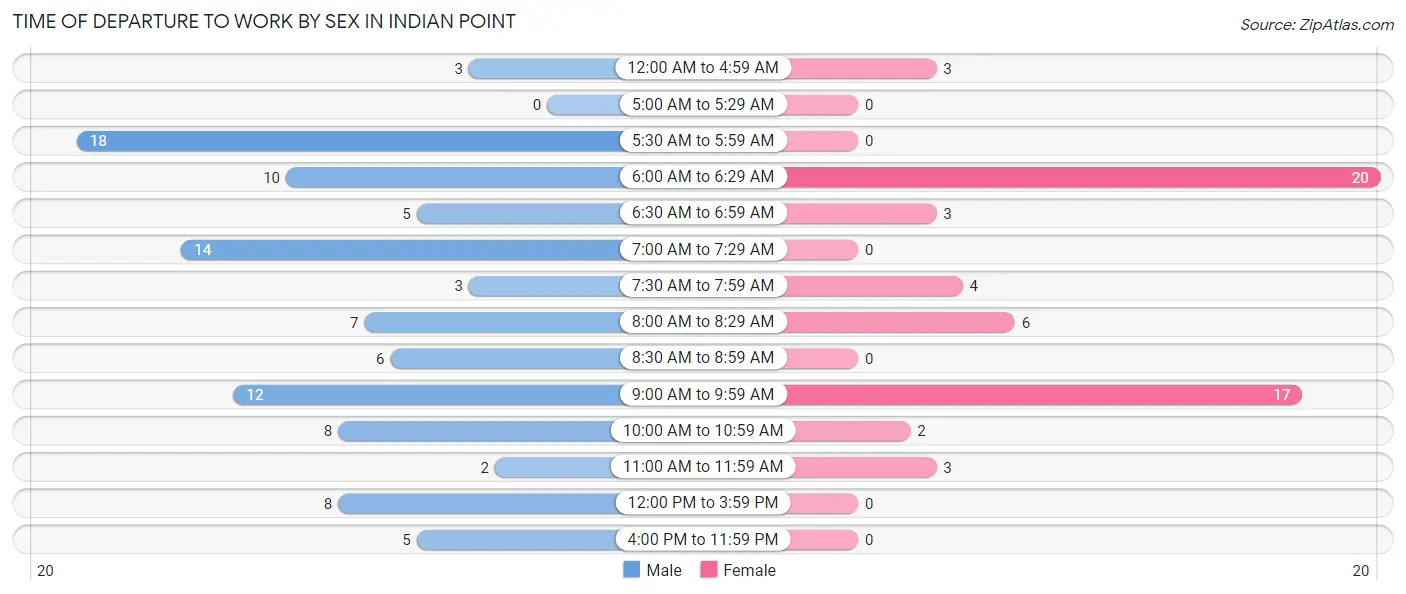
| Time of Departure | Male | Female |
| 12:00 AM to 4:59 AM | 3 (3.0%) | 3 (5.2%) |
| 5:00 AM to 5:29 AM | 0 (0.0%) | 0 (0.0%) |
| 5:30 AM to 5:59 AM | 18 (17.8%) | 0 (0.0%) |
| 6:00 AM to 6:29 AM | 10 (9.9%) | 20 (34.5%) |
| 6:30 AM to 6:59 AM | 5 (5.0%) | 3 (5.2%) |
| 7:00 AM to 7:29 AM | 14 (13.9%) | 0 (0.0%) |
| 7:30 AM to 7:59 AM | 3 (3.0%) | 4 (6.9%) |
| 8:00 AM to 8:29 AM | 7 (6.9%) | 6 (10.3%) |
| 8:30 AM to 8:59 AM | 6 (5.9%) | 0 (0.0%) |
| 9:00 AM to 9:59 AM | 12 (11.9%) | 17 (29.3%) |
| 10:00 AM to 10:59 AM | 8 (7.9%) | 2 (3.5%) |
| 11:00 AM to 11:59 AM | 2 (2.0%) | 3 (5.2%) |
| 12:00 PM to 3:59 PM | 8 (7.9%) | 0 (0.0%) |
| 4:00 PM to 11:59 PM | 5 (5.0%) | 0 (0.0%) |
| Total | 101 (100.0%) | 58 (100.0%) |
Housing Occupancy in Indian Point
Occupancy by Ownership in Indian Point
Of the total 203 dwellings in Indian Point, owner-occupied units account for 169 (83.3%), while renter-occupied units make up 34 (16.8%).
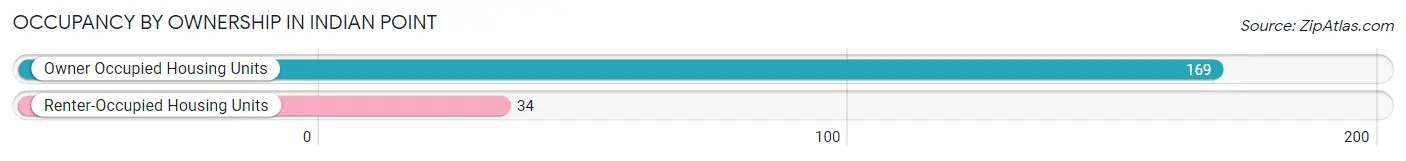
| Occupancy | # Housing Units | % Housing Units |
| Owner Occupied Housing Units | 169 | 83.3% |
| Renter-Occupied Housing Units | 34 | 16.8% |
| Total Occupied Housing Units | 203 | 100.0% |
Occupancy by Household Size in Indian Point
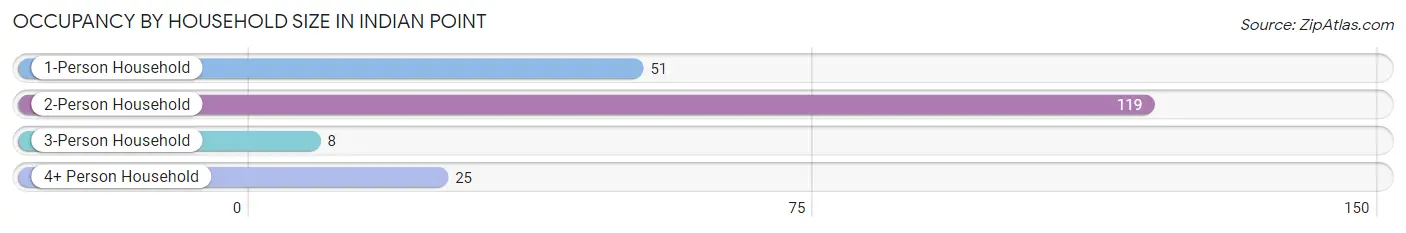
| Household Size | # Housing Units | % Housing Units |
| 1-Person Household | 51 | 25.1% |
| 2-Person Household | 119 | 58.6% |
| 3-Person Household | 8 | 3.9% |
| 4+ Person Household | 25 | 12.3% |
| Total Housing Units | 203 | 100.0% |
Occupancy by Ownership by Household Size in Indian Point
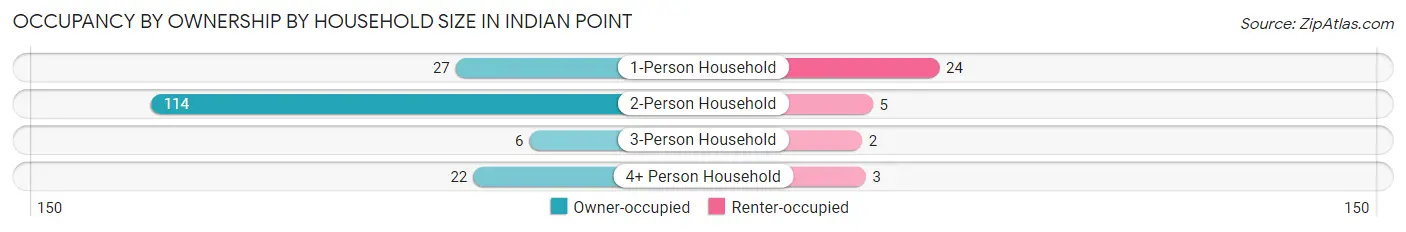
| Household Size | Owner-occupied | Renter-occupied |
| 1-Person Household | 27 (52.9%) | 24 (47.1%) |
| 2-Person Household | 114 (95.8%) | 5 (4.2%) |
| 3-Person Household | 6 (75.0%) | 2 (25.0%) |
| 4+ Person Household | 22 (88.0%) | 3 (12.0%) |
| Total Housing Units | 169 (83.3%) | 34 (16.8%) |
Occupancy by Educational Attainment in Indian Point
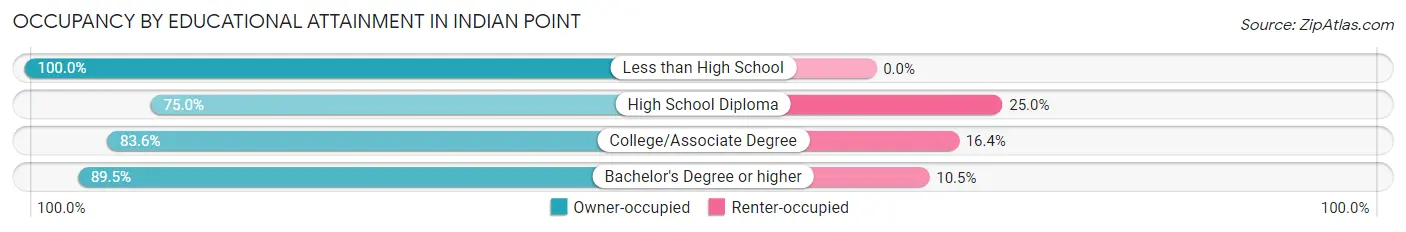
| Household Size | Owner-occupied | Renter-occupied |
| Less than High School | 4 (100.0%) | 0 (0.0%) |
| High School Diploma | 51 (75.0%) | 17 (25.0%) |
| College/Associate Degree | 46 (83.6%) | 9 (16.4%) |
| Bachelor's Degree or higher | 68 (89.5%) | 8 (10.5%) |
Occupancy by Age of Householder in Indian Point
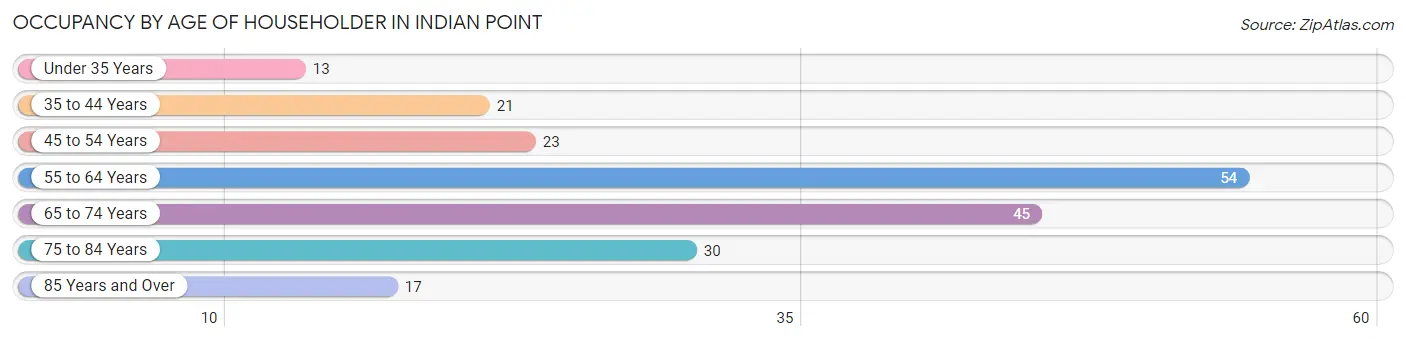
| Age Bracket | # Households | % Households |
| Under 35 Years | 13 | 6.4% |
| 35 to 44 Years | 21 | 10.3% |
| 45 to 54 Years | 23 | 11.3% |
| 55 to 64 Years | 54 | 26.6% |
| 65 to 74 Years | 45 | 22.2% |
| 75 to 84 Years | 30 | 14.8% |
| 85 Years and Over | 17 | 8.4% |
| Total | 203 | 100.0% |
Housing Finances in Indian Point
Median Income by Occupancy in Indian Point
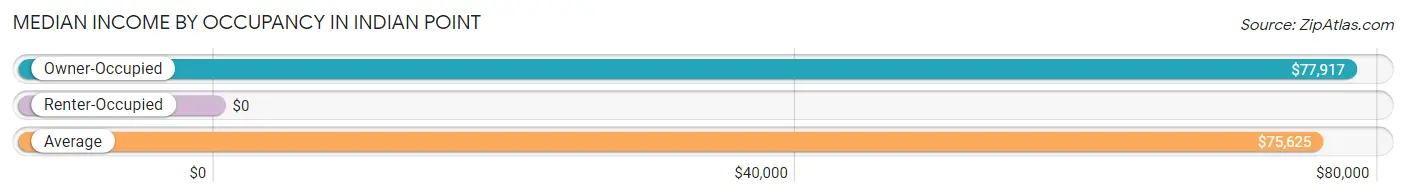
| Occupancy Type | # Households | Median Income |
| Owner-Occupied | 169 (83.3%) | $77,917 |
| Renter-Occupied | 34 (16.8%) | $0 |
| Average | 203 (100.0%) | $75,625 |
Occupancy by Householder Income Bracket in Indian Point
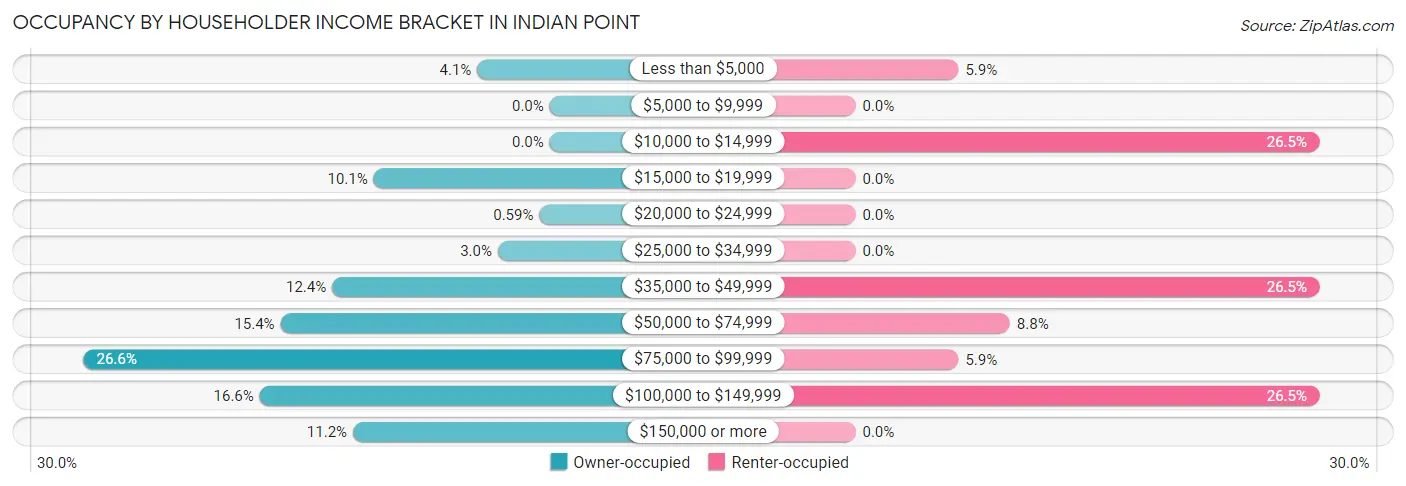
| Income Bracket | Owner-occupied | Renter-occupied |
| Less than $5,000 | 7 (4.1%) | 2 (5.9%) |
| $5,000 to $9,999 | 0 (0.0%) | 0 (0.0%) |
| $10,000 to $14,999 | 0 (0.0%) | 9 (26.5%) |
| $15,000 to $19,999 | 17 (10.1%) | 0 (0.0%) |
| $20,000 to $24,999 | 1 (0.6%) | 0 (0.0%) |
| $25,000 to $34,999 | 5 (3.0%) | 0 (0.0%) |
| $35,000 to $49,999 | 21 (12.4%) | 9 (26.5%) |
| $50,000 to $74,999 | 26 (15.4%) | 3 (8.8%) |
| $75,000 to $99,999 | 45 (26.6%) | 2 (5.9%) |
| $100,000 to $149,999 | 28 (16.6%) | 9 (26.5%) |
| $150,000 or more | 19 (11.2%) | 0 (0.0%) |
| Total | 169 (100.0%) | 34 (100.0%) |
Monthly Housing Cost Tiers in Indian Point
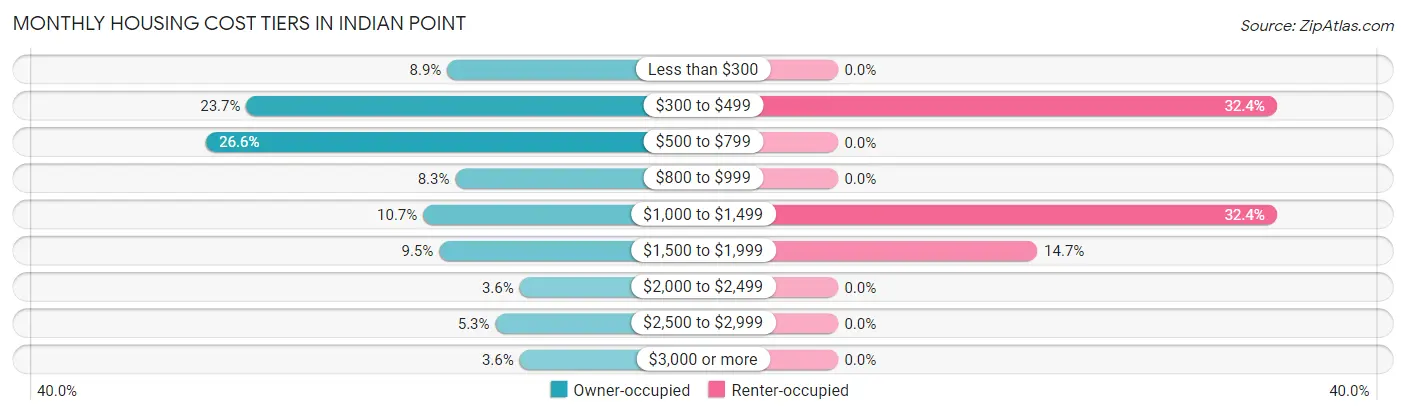
| Monthly Cost | Owner-occupied | Renter-occupied |
| Less than $300 | 15 (8.9%) | 0 (0.0%) |
| $300 to $499 | 40 (23.7%) | 11 (32.4%) |
| $500 to $799 | 45 (26.6%) | 0 (0.0%) |
| $800 to $999 | 14 (8.3%) | 0 (0.0%) |
| $1,000 to $1,499 | 18 (10.6%) | 11 (32.4%) |
| $1,500 to $1,999 | 16 (9.5%) | 5 (14.7%) |
| $2,000 to $2,499 | 6 (3.5%) | 0 (0.0%) |
| $2,500 to $2,999 | 9 (5.3%) | 0 (0.0%) |
| $3,000 or more | 6 (3.5%) | 0 (0.0%) |
| Total | 169 (100.0%) | 34 (100.0%) |
Physical Housing Characteristics in Indian Point
Housing Structures in Indian Point
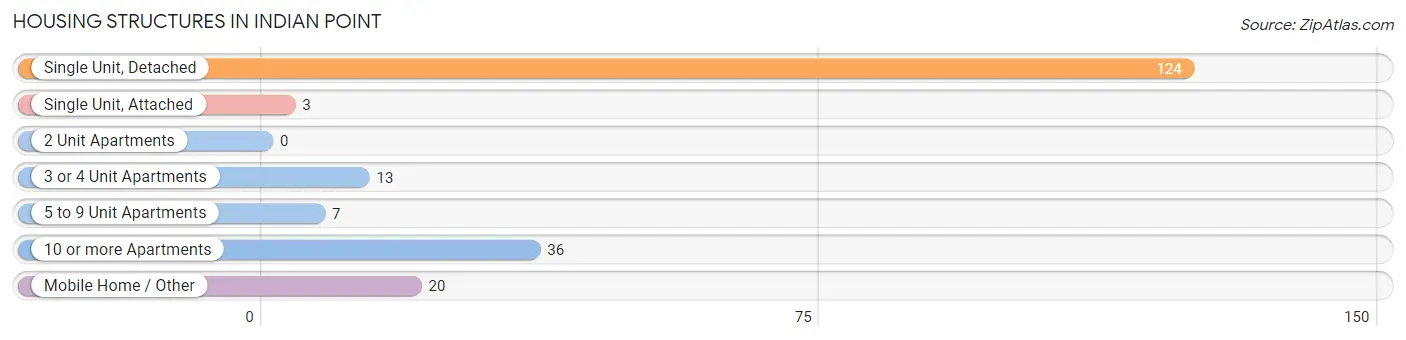
| Structure Type | # Housing Units | % Housing Units |
| Single Unit, Detached | 124 | 61.1% |
| Single Unit, Attached | 3 | 1.5% |
| 2 Unit Apartments | 0 | 0.0% |
| 3 or 4 Unit Apartments | 13 | 6.4% |
| 5 to 9 Unit Apartments | 7 | 3.5% |
| 10 or more Apartments | 36 | 17.7% |
| Mobile Home / Other | 20 | 9.9% |
| Total | 203 | 100.0% |
Housing Structures by Occupancy in Indian Point
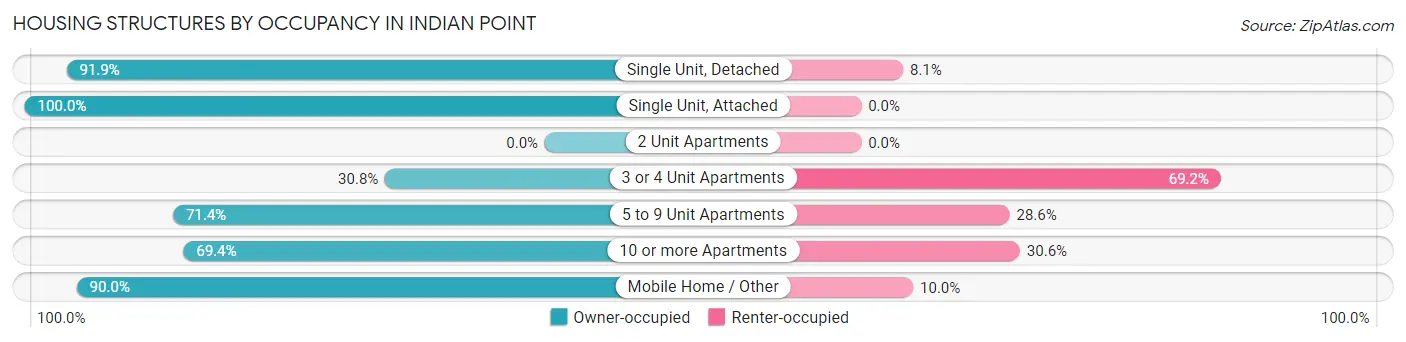
| Structure Type | Owner-occupied | Renter-occupied |
| Single Unit, Detached | 114 (91.9%) | 10 (8.1%) |
| Single Unit, Attached | 3 (100.0%) | 0 (0.0%) |
| 2 Unit Apartments | 0 (0.0%) | 0 (0.0%) |
| 3 or 4 Unit Apartments | 4 (30.8%) | 9 (69.2%) |
| 5 to 9 Unit Apartments | 5 (71.4%) | 2 (28.6%) |
| 10 or more Apartments | 25 (69.4%) | 11 (30.6%) |
| Mobile Home / Other | 18 (90.0%) | 2 (10.0%) |
| Total | 169 (83.3%) | 34 (16.8%) |
Housing Structures by Number of Rooms in Indian Point
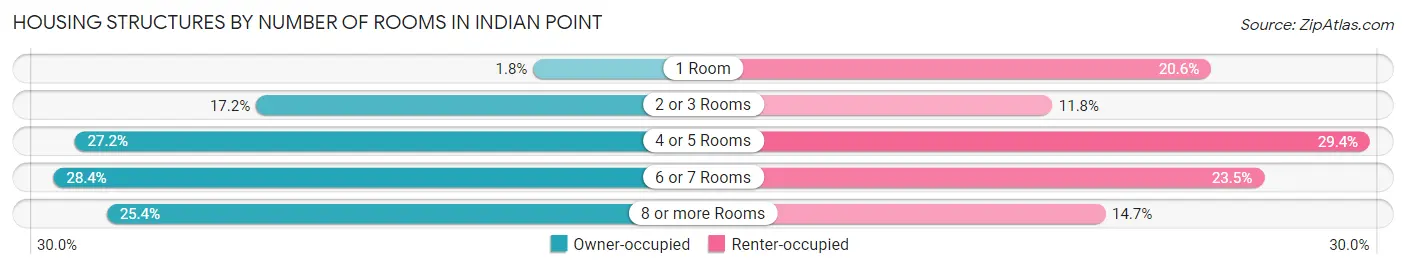
| Number of Rooms | Owner-occupied | Renter-occupied |
| 1 Room | 3 (1.8%) | 7 (20.6%) |
| 2 or 3 Rooms | 29 (17.2%) | 4 (11.8%) |
| 4 or 5 Rooms | 46 (27.2%) | 10 (29.4%) |
| 6 or 7 Rooms | 48 (28.4%) | 8 (23.5%) |
| 8 or more Rooms | 43 (25.4%) | 5 (14.7%) |
| Total | 169 (100.0%) | 34 (100.0%) |
Housing Structure by Heating Type in Indian Point
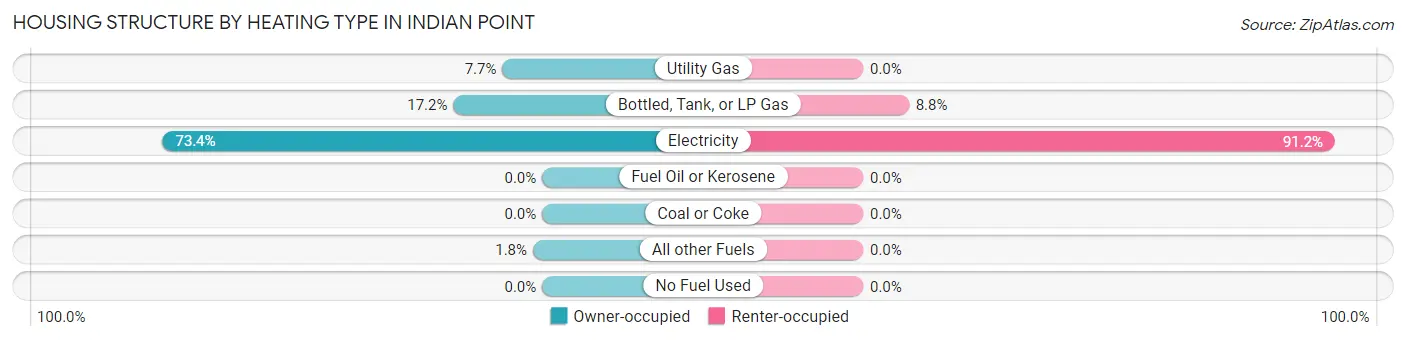
| Heating Type | Owner-occupied | Renter-occupied |
| Utility Gas | 13 (7.7%) | 0 (0.0%) |
| Bottled, Tank, or LP Gas | 29 (17.2%) | 3 (8.8%) |
| Electricity | 124 (73.4%) | 31 (91.2%) |
| Fuel Oil or Kerosene | 0 (0.0%) | 0 (0.0%) |
| Coal or Coke | 0 (0.0%) | 0 (0.0%) |
| All other Fuels | 3 (1.8%) | 0 (0.0%) |
| No Fuel Used | 0 (0.0%) | 0 (0.0%) |
| Total | 169 (100.0%) | 34 (100.0%) |
Household Vehicle Usage in Indian Point
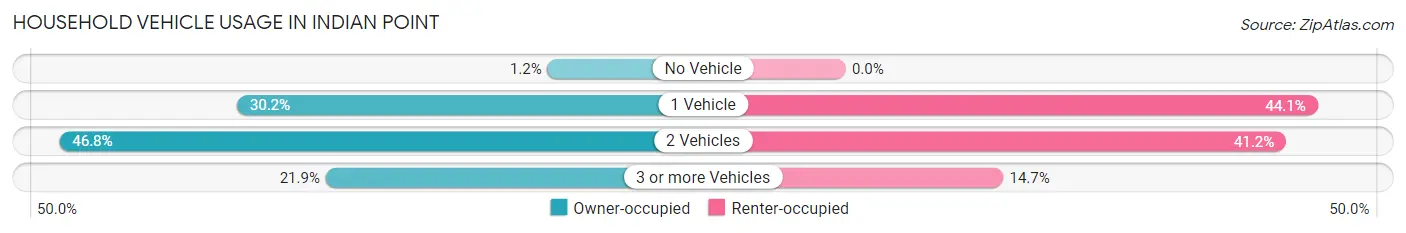
| Vehicles per Household | Owner-occupied | Renter-occupied |
| No Vehicle | 2 (1.2%) | 0 (0.0%) |
| 1 Vehicle | 51 (30.2%) | 15 (44.1%) |
| 2 Vehicles | 79 (46.8%) | 14 (41.2%) |
| 3 or more Vehicles | 37 (21.9%) | 5 (14.7%) |
| Total | 169 (100.0%) | 34 (100.0%) |
Real Estate & Mortgages in Indian Point
Real Estate and Mortgage Overview in Indian Point
| Characteristic | Without Mortgage | With Mortgage |
| Housing Units | 99 | 70 |
| Median Property Value | $227,900 | $300,000 |
| Median Household Income | $67,083 | $15 |
| Monthly Housing Costs | $488 | $6 |
| Real Estate Taxes | $910 | $0 |
Property Value by Mortgage Status in Indian Point
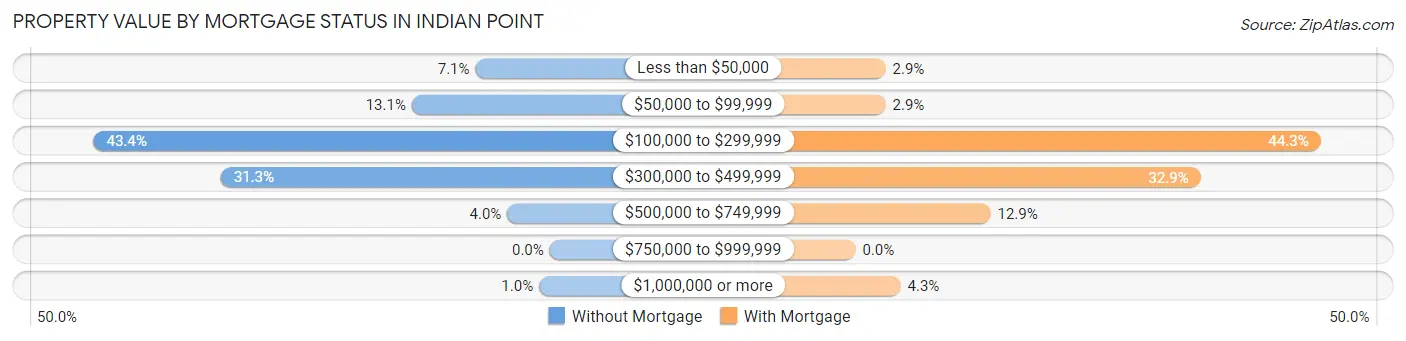
| Property Value | Without Mortgage | With Mortgage |
| Less than $50,000 | 7 (7.1%) | 2 (2.9%) |
| $50,000 to $99,999 | 13 (13.1%) | 2 (2.9%) |
| $100,000 to $299,999 | 43 (43.4%) | 31 (44.3%) |
| $300,000 to $499,999 | 31 (31.3%) | 23 (32.9%) |
| $500,000 to $749,999 | 4 (4.0%) | 9 (12.9%) |
| $750,000 to $999,999 | 0 (0.0%) | 0 (0.0%) |
| $1,000,000 or more | 1 (1.0%) | 3 (4.3%) |
| Total | 99 (100.0%) | 70 (100.0%) |
Household Income by Mortgage Status in Indian Point
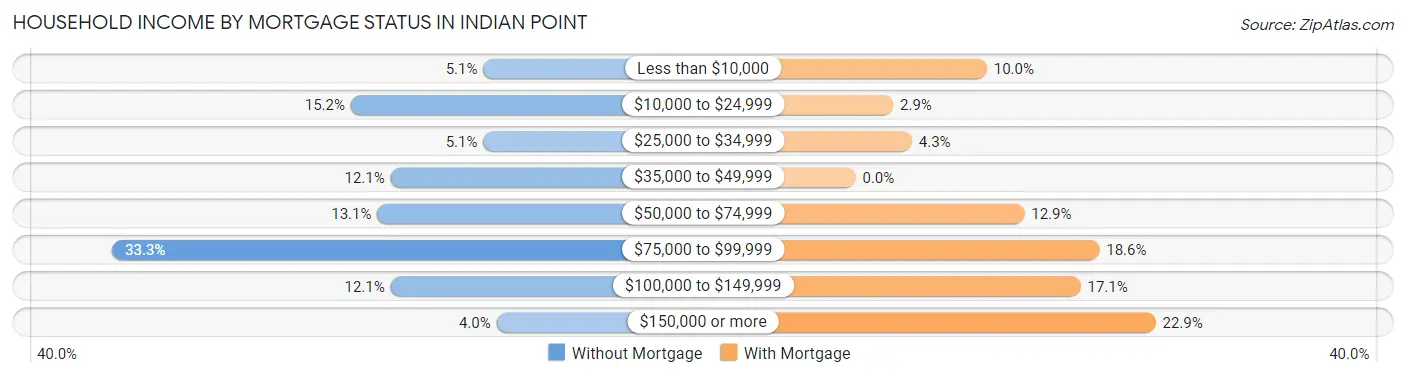
| Household Income | Without Mortgage | With Mortgage |
| Less than $10,000 | 5 (5.1%) | 7 (10.0%) |
| $10,000 to $24,999 | 15 (15.1%) | 2 (2.9%) |
| $25,000 to $34,999 | 5 (5.1%) | 3 (4.3%) |
| $35,000 to $49,999 | 12 (12.1%) | 0 (0.0%) |
| $50,000 to $74,999 | 13 (13.1%) | 9 (12.9%) |
| $75,000 to $99,999 | 33 (33.3%) | 13 (18.6%) |
| $100,000 to $149,999 | 12 (12.1%) | 12 (17.1%) |
| $150,000 or more | 4 (4.0%) | 16 (22.9%) |
| Total | 99 (100.0%) | 70 (100.0%) |
Property Value to Household Income Ratio in Indian Point
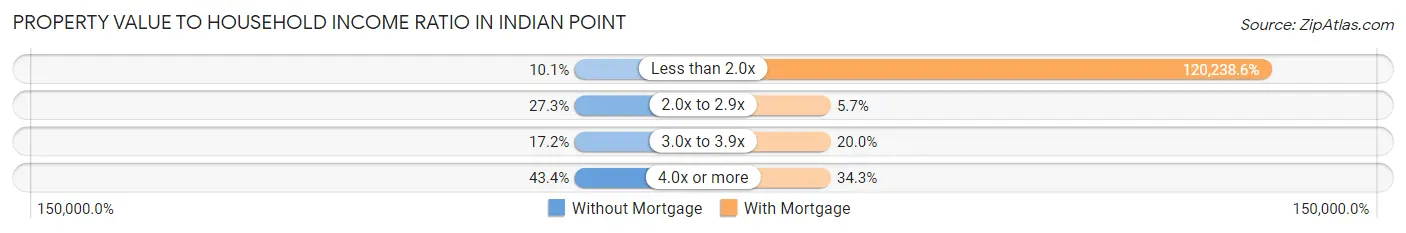
| Value-to-Income Ratio | Without Mortgage | With Mortgage |
| Less than 2.0x | 10 (10.1%) | 84,167 (120,238.6%) |
| 2.0x to 2.9x | 27 (27.3%) | 4 (5.7%) |
| 3.0x to 3.9x | 17 (17.2%) | 14 (20.0%) |
| 4.0x or more | 43 (43.4%) | 24 (34.3%) |
| Total | 99 (100.0%) | 70 (100.0%) |
Real Estate Taxes by Mortgage Status in Indian Point
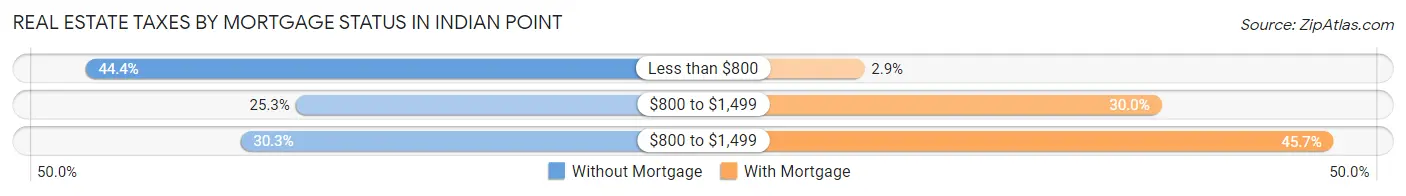
| Property Taxes | Without Mortgage | With Mortgage |
| Less than $800 | 44 (44.4%) | 2 (2.9%) |
| $800 to $1,499 | 25 (25.3%) | 21 (30.0%) |
| $800 to $1,499 | 30 (30.3%) | 32 (45.7%) |
| Total | 99 (100.0%) | 70 (100.0%) |
Health & Disability in Indian Point
Health Insurance Coverage by Age in Indian Point
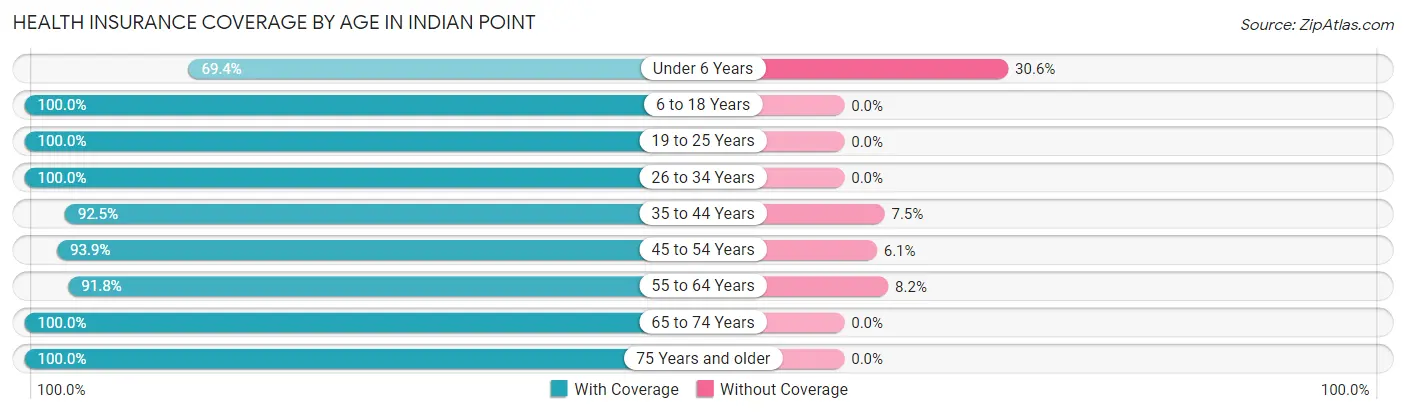
| Age Bracket | With Coverage | Without Coverage |
| Under 6 Years | 25 (69.4%) | 11 (30.6%) |
| 6 to 18 Years | 28 (100.0%) | 0 (0.0%) |
| 19 to 25 Years | 16 (100.0%) | 0 (0.0%) |
| 26 to 34 Years | 13 (100.0%) | 0 (0.0%) |
| 35 to 44 Years | 37 (92.5%) | 3 (7.5%) |
| 45 to 54 Years | 31 (93.9%) | 2 (6.1%) |
| 55 to 64 Years | 101 (91.8%) | 9 (8.2%) |
| 65 to 74 Years | 91 (100.0%) | 0 (0.0%) |
| 75 Years and older | 80 (100.0%) | 0 (0.0%) |
| Total | 422 (94.4%) | 25 (5.6%) |
Health Insurance Coverage by Citizenship Status in Indian Point
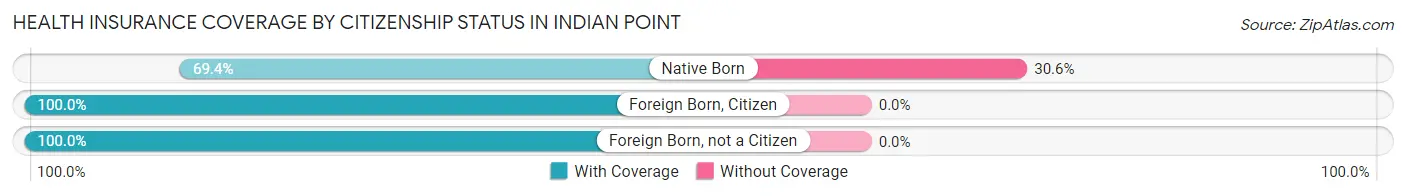
| Citizenship Status | With Coverage | Without Coverage |
| Native Born | 25 (69.4%) | 11 (30.6%) |
| Foreign Born, Citizen | 28 (100.0%) | 0 (0.0%) |
| Foreign Born, not a Citizen | 16 (100.0%) | 0 (0.0%) |
Health Insurance Coverage by Household Income in Indian Point
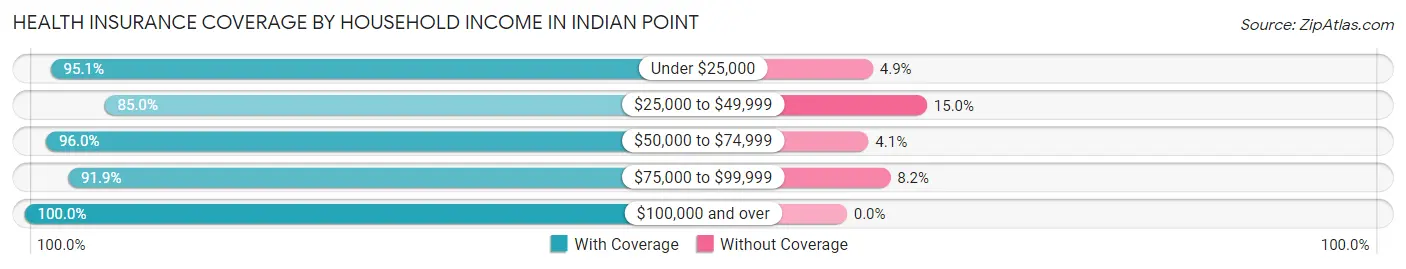
| Household Income | With Coverage | Without Coverage |
| Under $25,000 | 39 (95.1%) | 2 (4.9%) |
| $25,000 to $49,999 | 51 (85.0%) | 9 (15.0%) |
| $50,000 to $74,999 | 71 (96.0%) | 3 (4.1%) |
| $75,000 to $99,999 | 124 (91.8%) | 11 (8.2%) |
| $100,000 and over | 137 (100.0%) | 0 (0.0%) |
Public vs Private Health Insurance Coverage by Age in Indian Point
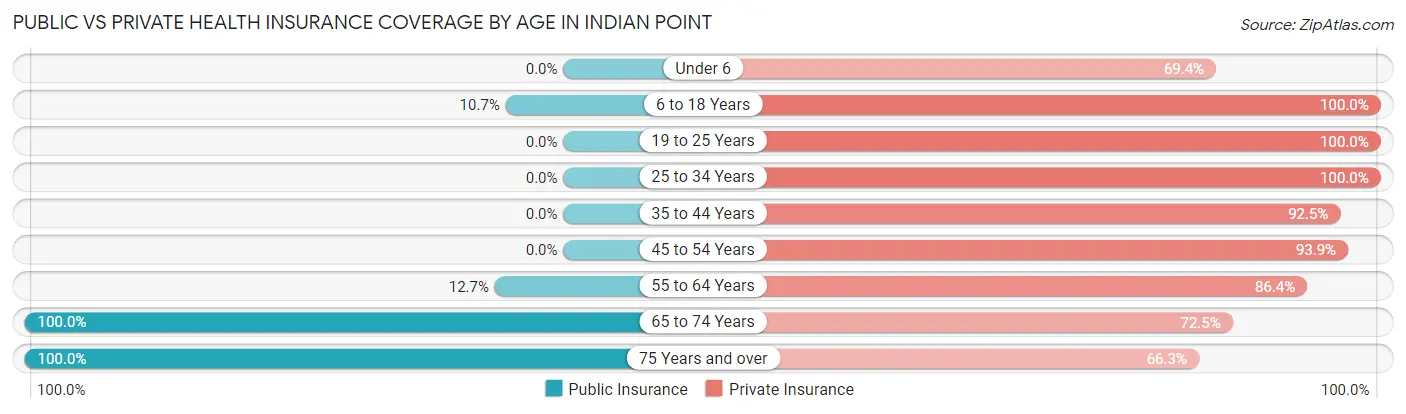
| Age Bracket | Public Insurance | Private Insurance |
| Under 6 | 0 (0.0%) | 25 (69.4%) |
| 6 to 18 Years | 3 (10.7%) | 28 (100.0%) |
| 19 to 25 Years | 0 (0.0%) | 16 (100.0%) |
| 25 to 34 Years | 0 (0.0%) | 13 (100.0%) |
| 35 to 44 Years | 0 (0.0%) | 37 (92.5%) |
| 45 to 54 Years | 0 (0.0%) | 31 (93.9%) |
| 55 to 64 Years | 14 (12.7%) | 95 (86.4%) |
| 65 to 74 Years | 91 (100.0%) | 66 (72.5%) |
| 75 Years and over | 80 (100.0%) | 53 (66.2%) |
| Total | 188 (42.1%) | 364 (81.4%) |
Disability Status by Sex by Age in Indian Point
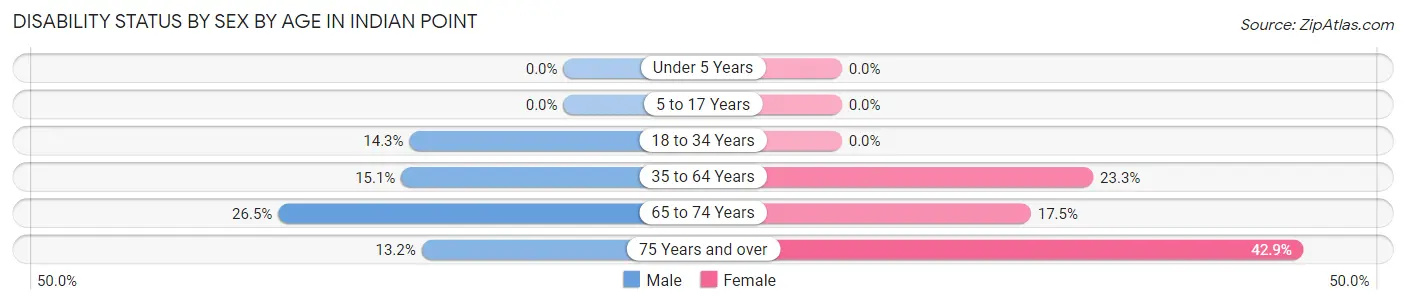
| Age Bracket | Male | Female |
| Under 5 Years | 0 (0.0%) | 0 (0.0%) |
| 5 to 17 Years | 0 (0.0%) | 0 (0.0%) |
| 18 to 34 Years | 3 (14.3%) | 0 (0.0%) |
| 35 to 64 Years | 14 (15.0%) | 21 (23.3%) |
| 65 to 74 Years | 9 (26.5%) | 10 (17.5%) |
| 75 Years and over | 5 (13.2%) | 18 (42.9%) |
Disability Class by Sex by Age in Indian Point
Disability Class: Hearing Difficulty
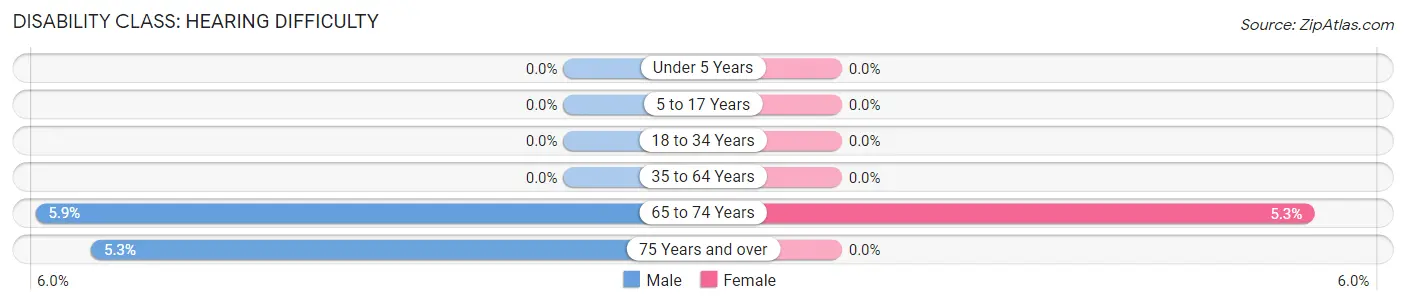
| Age Bracket | Male | Female |
| Under 5 Years | 0 (0.0%) | 0 (0.0%) |
| 5 to 17 Years | 0 (0.0%) | 0 (0.0%) |
| 18 to 34 Years | 0 (0.0%) | 0 (0.0%) |
| 35 to 64 Years | 0 (0.0%) | 0 (0.0%) |
| 65 to 74 Years | 2 (5.9%) | 3 (5.3%) |
| 75 Years and over | 2 (5.3%) | 0 (0.0%) |
Disability Class: Vision Difficulty
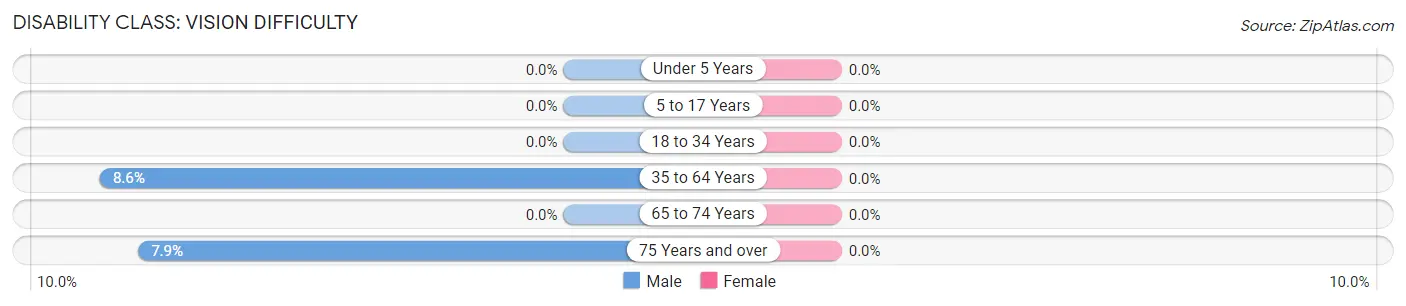
| Age Bracket | Male | Female |
| Under 5 Years | 0 (0.0%) | 0 (0.0%) |
| 5 to 17 Years | 0 (0.0%) | 0 (0.0%) |
| 18 to 34 Years | 0 (0.0%) | 0 (0.0%) |
| 35 to 64 Years | 8 (8.6%) | 0 (0.0%) |
| 65 to 74 Years | 0 (0.0%) | 0 (0.0%) |
| 75 Years and over | 3 (7.9%) | 0 (0.0%) |
Disability Class: Cognitive Difficulty
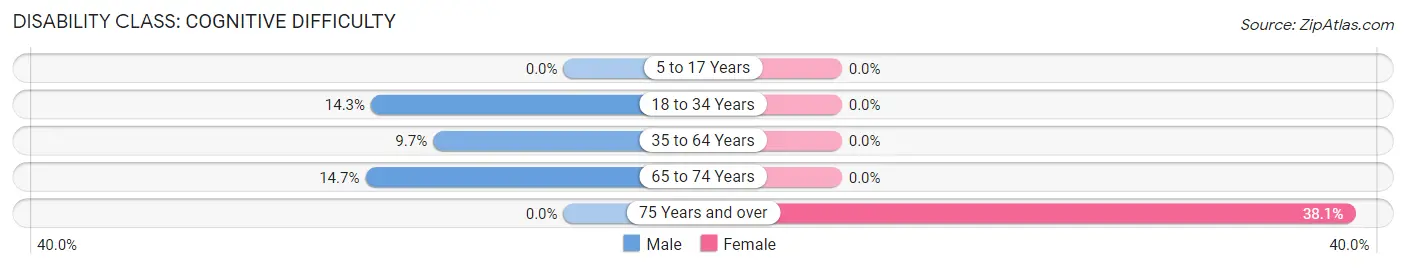
| Age Bracket | Male | Female |
| 5 to 17 Years | 0 (0.0%) | 0 (0.0%) |
| 18 to 34 Years | 3 (14.3%) | 0 (0.0%) |
| 35 to 64 Years | 9 (9.7%) | 0 (0.0%) |
| 65 to 74 Years | 5 (14.7%) | 0 (0.0%) |
| 75 Years and over | 0 (0.0%) | 16 (38.1%) |
Disability Class: Ambulatory Difficulty
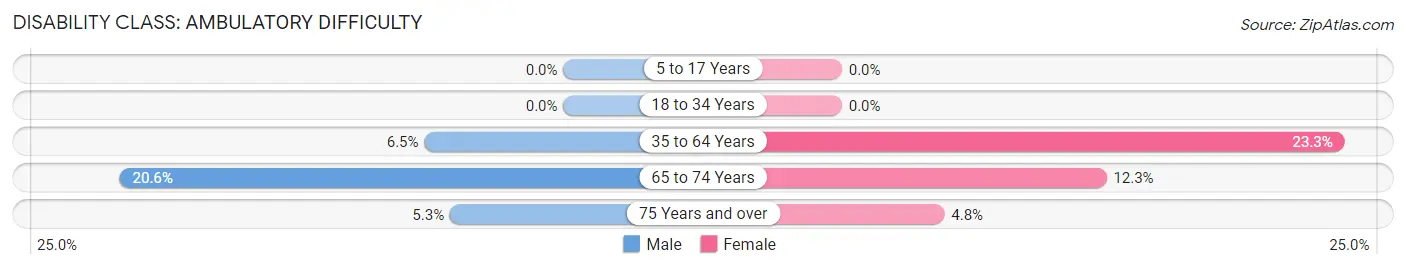
| Age Bracket | Male | Female |
| 5 to 17 Years | 0 (0.0%) | 0 (0.0%) |
| 18 to 34 Years | 0 (0.0%) | 0 (0.0%) |
| 35 to 64 Years | 6 (6.5%) | 21 (23.3%) |
| 65 to 74 Years | 7 (20.6%) | 7 (12.3%) |
| 75 Years and over | 2 (5.3%) | 2 (4.8%) |
Disability Class: Self-Care Difficulty
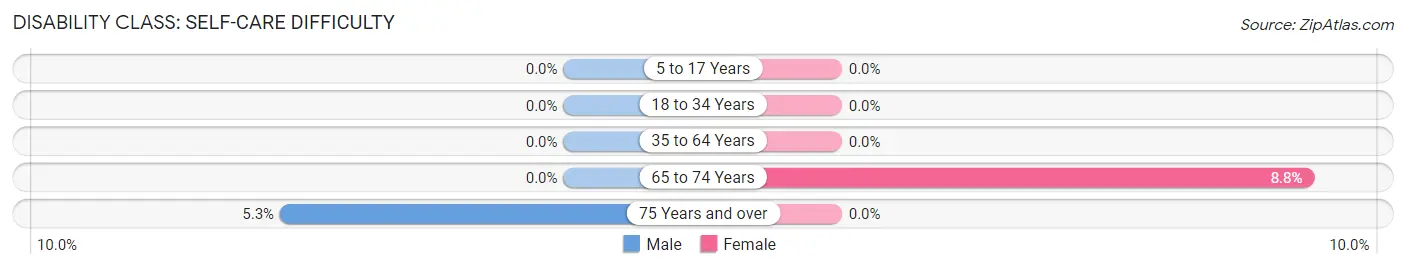
| Age Bracket | Male | Female |
| 5 to 17 Years | 0 (0.0%) | 0 (0.0%) |
| 18 to 34 Years | 0 (0.0%) | 0 (0.0%) |
| 35 to 64 Years | 0 (0.0%) | 0 (0.0%) |
| 65 to 74 Years | 0 (0.0%) | 5 (8.8%) |
| 75 Years and over | 2 (5.3%) | 0 (0.0%) |
Technology Access in Indian Point
Computing Device Access in Indian Point
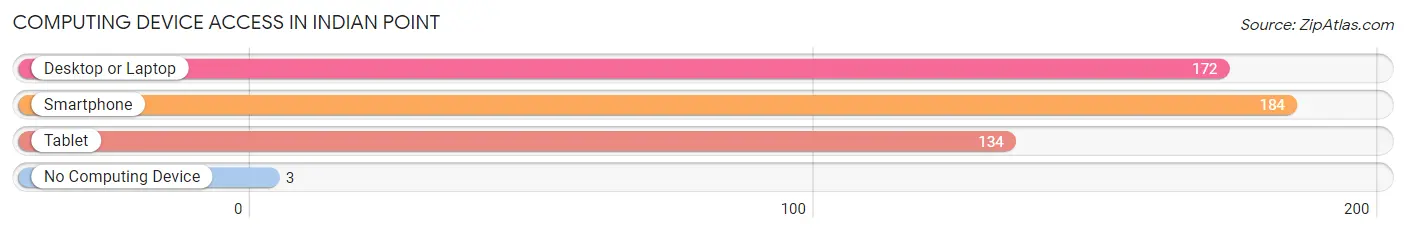
| Device Type | # Households | % Households |
| Desktop or Laptop | 172 | 84.7% |
| Smartphone | 184 | 90.6% |
| Tablet | 134 | 66.0% |
| No Computing Device | 3 | 1.5% |
| Total | 203 | 100.0% |
Internet Access in Indian Point
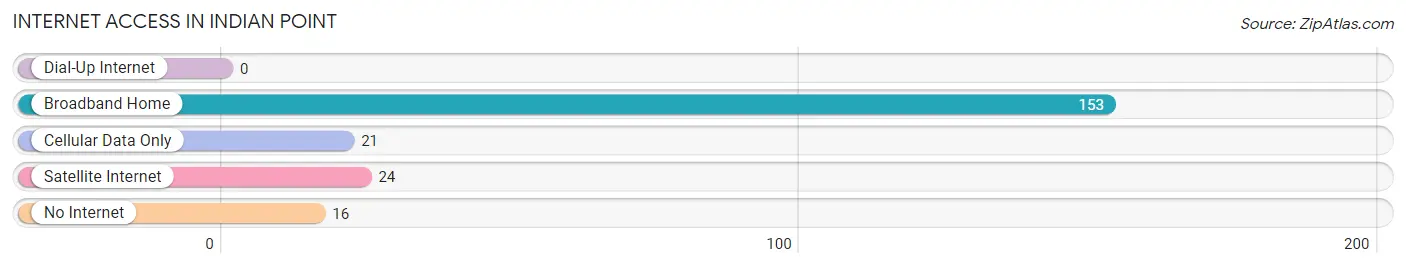
| Internet Type | # Households | % Households |
| Dial-Up Internet | 0 | 0.0% |
| Broadband Home | 153 | 75.4% |
| Cellular Data Only | 21 | 10.3% |
| Satellite Internet | 24 | 11.8% |
| No Internet | 16 | 7.9% |
| Total | 203 | 100.0% |
Indian Point Summary
Introduction
Indian Point is a small unincorporated community located in Stone County, Missouri. It is situated on the banks of Table Rock Lake, a reservoir created by the damming of the White River. Indian Point is a popular destination for tourists and locals alike, offering a variety of recreational activities, including fishing, boating, swimming, and camping. The area is also home to a variety of wildlife, including bald eagles, ospreys, and white-tailed deer.
History
The area now known as Indian Point was originally inhabited by the Osage Indians. The Osage were a nomadic tribe that moved throughout the region, hunting and gathering food. In the early 1800s, the Osage were forced to cede their land to the United States government, and the area was opened up to white settlers.
The first settlers to the area were the families of William and Mary Ann Smith and William and Sarah Smith. The Smiths were farmers and ranchers, and they established a homestead in the area in 1845. The Smiths named the area Indian Point, as it was located on a point of land jutting out into Table Rock Lake.
In the late 1800s, the area began to attract more settlers, and the population of Indian Point began to grow. The town was officially incorporated in 1891, and the first post office was established in 1892.
Geography
Indian Point is located in Stone County, Missouri, on the banks of Table Rock Lake. The lake is a reservoir created by the damming of the White River. The lake covers an area of approximately 43,000 acres, and is a popular destination for fishing, boating, swimming, and camping.
The area around Indian Point is mostly rural, with rolling hills and forests. The nearest major city is Branson, which is located approximately 25 miles to the south.
Economy
The economy of Indian Point is largely based on tourism. The area is a popular destination for fishing, boating, swimming, and camping. There are several marinas and boat ramps located in the area, as well as a variety of restaurants and lodging options.
The area is also home to several businesses, including a grocery store, a hardware store, and a gas station. There are also several small farms in the area, which produce a variety of crops, including corn, soybeans, and hay.
Demographics
As of the 2010 census, the population of Indian Point was 1,093. The population is predominantly white (97.3%), with a small percentage of African Americans (1.2%) and Native Americans (0.7%). The median household income is $37,500, and the median age is 44.
Conclusion
Indian Point is a small unincorporated community located in Stone County, Missouri. It is situated on the banks of Table Rock Lake, a reservoir created by the damming of the White River. The area is a popular destination for tourists and locals alike, offering a variety of recreational activities, including fishing, boating, swimming, and camping. The economy of Indian Point is largely based on tourism, and the population is predominantly white.
Common Questions
What is the Total Population of Indian Point?
Total Population of Indian Point is 447.
What is the Total Male Population of Indian Point?
Total Male Population of Indian Point is 223.
What is the Total Female Population of Indian Point?
Total Female Population of Indian Point is 224.
What is the Ratio of Males per 100 Females in Indian Point?
There are 99.55 Males per 100 Females in Indian Point.
What is the Ratio of Females per 100 Males in Indian Point?
There are 100.45 Females per 100 Males in Indian Point.
What is the Median Population Age in Indian Point?
Median Population Age in Indian Point is 60.9 Years.
What is the Average Family Size in Indian Point
Average Family Size in Indian Point is 2.6 People.
What is the Average Household Size in Indian Point
Average Household Size in Indian Point is 2.2 People.
What is Per Capita Income in Indian Point?
Per Capita income in Indian Point is $35,232.
What is the Median Family Income in Indian Point?
Median Family Income in Indian Point is $81,932.
What is the Median Household income in Indian Point?
Median Household Income in Indian Point is $75,625.
What is Income or Wage Gap in Indian Point?
Income or Wage Gap in Indian Point is 54.2%.
Women in Indian Point earn 45.8 cents for every dollar earned by a man.
What is Inequality or Gini Index in Indian Point?
Inequality or Gini Index in Indian Point is 0.36.
How Large is the Labor Force in Indian Point?
There are 187 People in the Labor Forcein in Indian Point.
What is the Percentage of People in the Labor Force in Indian Point?
47.5% of People are in the Labor Force in Indian Point.
What is the Unemployment Rate in Indian Point?
Unemployment Rate in Indian Point is 8.0%.