Cities with the Highest Percentage of Bhutanese Population in Missouri
RELATED REPORTS & OPTIONS
Bhutanese
Missouri
Compare Cities
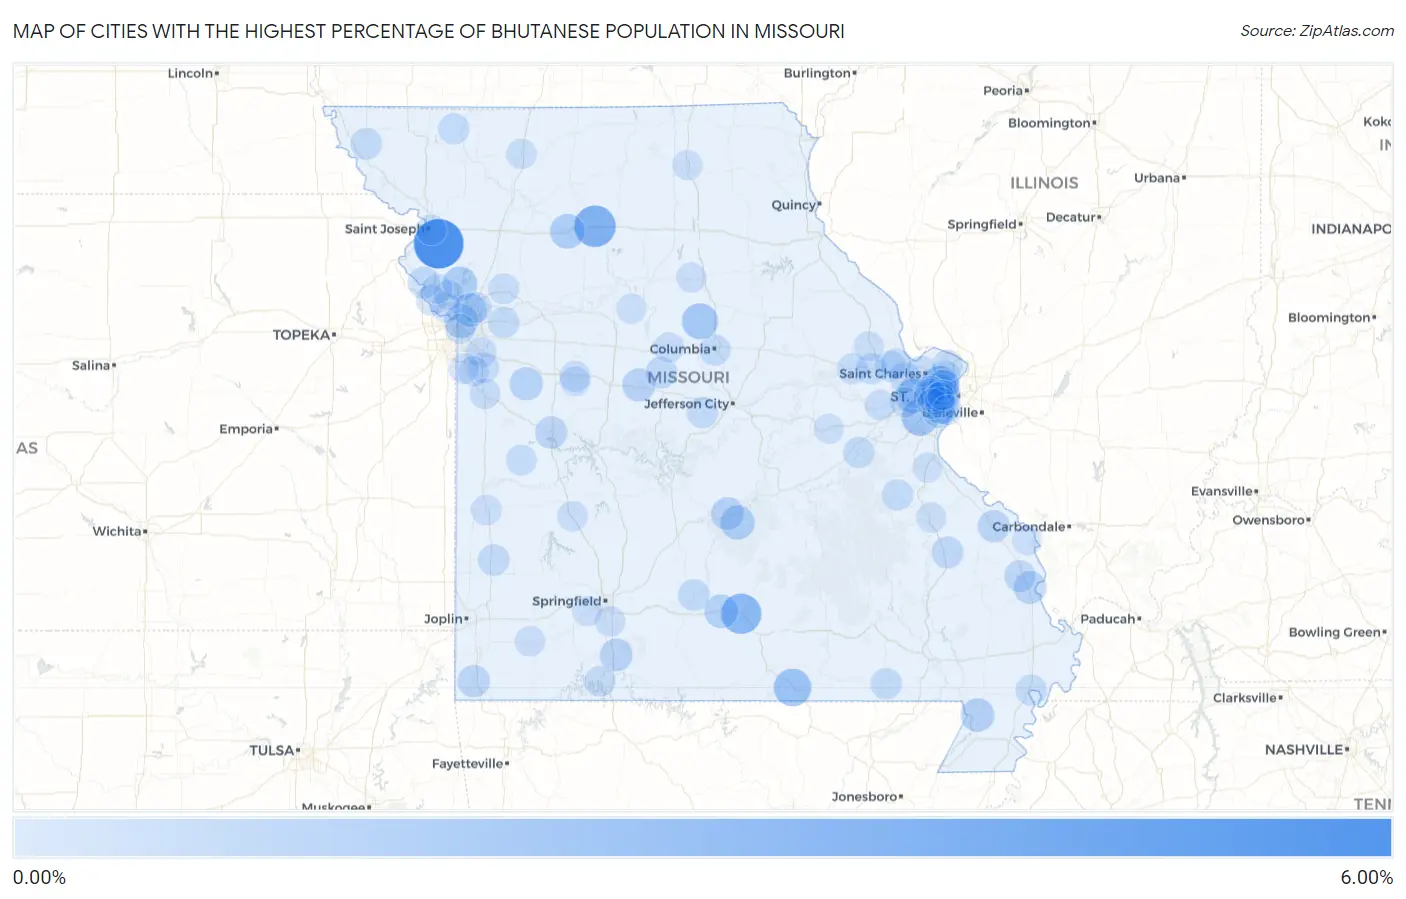
Map of Cities with the Highest Percentage of Bhutanese Population in Missouri
0.00%
6.00%
Cities with the Highest Percentage of Bhutanese Population in Missouri
| City | Bhutanese | vs State | vs National | |
| 1. | Agency | 5.81% | 0.17%(+5.64)#1 | 0.49%(+5.32)#239 |
| 2. | Wheeling | 3.45% | 0.17%(+3.28)#2 | 0.49%(+2.96)#394 |
| 3. | Cabool | 3.07% | 0.17%(+2.89)#3 | 0.49%(+2.58)#443 |
| 4. | Sycamore Hills | 2.42% | 0.17%(+2.24)#4 | 0.49%(+1.93)#598 |
| 5. | Koshkonong | 2.30% | 0.17%(+2.13)#5 | 0.49%(+1.81)#637 |
| 6. | Parkdale | 2.02% | 0.17%(+1.84)#6 | 0.49%(+1.53)#764 |
| 7. | Harrisburg | 1.86% | 0.17%(+1.68)#7 | 0.49%(+1.37)#835 |
| 8. | Utica | 1.49% | 0.17%(+1.31)#8 | 0.49%(+0.998)#1,131 |
| 9. | Smithville | 1.44% | 0.17%(+1.27)#9 | 0.49%(+0.953)#1,168 |
| 10. | Clarkson Valley | 1.38% | 0.17%(+1.21)#10 | 0.49%(+0.893)#1,220 |
| 11. | Fort Leonard Wood | 1.36% | 0.17%(+1.19)#11 | 0.49%(+0.877)#1,234 |
| 12. | Clayton | 1.29% | 0.17%(+1.12)#12 | 0.49%(+0.802)#1,312 |
| 13. | North Kansas City | 1.27% | 0.17%(+1.10)#13 | 0.49%(+0.786)#1,335 |
| 14. | Mountain Grove | 1.27% | 0.17%(+1.09)#14 | 0.49%(+0.780)#1,340 |
| 15. | Holcomb | 1.18% | 0.17%(+1.00)#15 | 0.49%(+0.691)#1,436 |
| 16. | Pleasant Valley | 1.16% | 0.17%(+0.991)#16 | 0.49%(+0.677)#1,454 |
| 17. | Holden | 1.09% | 0.17%(+0.914)#17 | 0.49%(+0.599)#1,541 |
| 18. | Otterville | 1.02% | 0.17%(+0.847)#18 | 0.49%(+0.533)#1,646 |
| 19. | Cape Girardeau | 0.99% | 0.17%(+0.817)#19 | 0.49%(+0.503)#1,703 |
| 20. | Waynesville | 0.99% | 0.17%(+0.813)#20 | 0.49%(+0.499)#1,712 |
| 21. | Saddlebrooke | 0.96% | 0.17%(+0.782)#21 | 0.49%(+0.468)#1,768 |
| 22. | Affton | 0.93% | 0.17%(+0.755)#22 | 0.49%(+0.441)#1,819 |
| 23. | Grantwood Village | 0.87% | 0.17%(+0.693)#23 | 0.49%(+0.378)#1,979 |
| 24. | Ladue | 0.84% | 0.17%(+0.666)#24 | 0.49%(+0.352)#2,038 |
| 25. | Clinton | 0.83% | 0.17%(+0.658)#25 | 0.49%(+0.343)#2,052 |
| 26. | Anderson | 0.82% | 0.17%(+0.647)#26 | 0.49%(+0.332)#2,080 |
| 27. | Perryville | 0.78% | 0.17%(+0.612)#27 | 0.49%(+0.297)#2,172 |
| 28. | Cobalt | 0.74% | 0.17%(+0.570)#28 | 0.49%(+0.256)#2,270 |
| 29. | Weston | 0.69% | 0.17%(+0.515)#29 | 0.49%(+0.201)#2,405 |
| 30. | Bunceton | 0.67% | 0.17%(+0.498)#30 | 0.49%(+0.184)#2,443 |
| 31. | Jackson | 0.67% | 0.17%(+0.496)#31 | 0.49%(+0.182)#2,448 |
| 32. | Warson Woods | 0.66% | 0.17%(+0.491)#32 | 0.49%(+0.177)#2,462 |
| 33. | Rock Hill | 0.66% | 0.17%(+0.482)#33 | 0.49%(+0.168)#2,490 |
| 34. | Fairfax | 0.62% | 0.17%(+0.446)#34 | 0.49%(+0.132)#2,621 |
| 35. | Hartville | 0.61% | 0.17%(+0.440)#35 | 0.49%(+0.126)#2,641 |
| 36. | Lamar | 0.60% | 0.17%(+0.432)#36 | 0.49%(+0.117)#2,659 |
| 37. | Russellville | 0.57% | 0.17%(+0.398)#37 | 0.49%(+0.083)#2,772 |
| 38. | Doniphan | 0.56% | 0.17%(+0.388)#38 | 0.49%(+0.074)#2,831 |
| 39. | Columbia | 0.54% | 0.17%(+0.365)#39 | 0.49%(+0.051)#2,921 |
| 40. | Foristell | 0.53% | 0.17%(+0.360)#40 | 0.49%(+0.046)#2,941 |
| 41. | Miramiguoa Park | 0.53% | 0.17%(+0.356)#41 | 0.49%(+0.042)#2,959 |
| 42. | Mineral Point | 0.51% | 0.17%(+0.334)#42 | 0.49%(+0.020)#3,043 |
| 43. | New Madrid | 0.51% | 0.17%(+0.334)#43 | 0.49%(+0.020)#3,048 |
| 44. | Parnell | 0.50% | 0.17%(+0.327)#44 | 0.49%(+0.013)#3,081 |
| 45. | Chesterfield | 0.50% | 0.17%(+0.322)#45 | 0.49%(+0.008)#3,102 |
| 46. | Concord | 0.49% | 0.17%(+0.321)#46 | 0.49%(+0.007)#3,107 |
| 47. | Cottleville | 0.48% | 0.17%(+0.310)#47 | 0.49%(-0.004)#3,170 |
| 48. | Buckner | 0.48% | 0.17%(+0.303)#48 | 0.49%(-0.011)#3,199 |
| 49. | Liberty | 0.47% | 0.17%(+0.292)#49 | 0.49%(-0.022)#3,245 |
| 50. | Calverton Park | 0.46% | 0.17%(+0.290)#50 | 0.49%(-0.024)#3,256 |
| 51. | Olivette | 0.46% | 0.17%(+0.289)#51 | 0.49%(-0.025)#3,265 |
| 52. | Indian Point | 0.45% | 0.17%(+0.274)#52 | 0.49%(-0.040)#3,345 |
| 53. | Crystal Lakes | 0.44% | 0.17%(+0.265)#53 | 0.49%(-0.049)#3,386 |
| 54. | Crystal Lake Park | 0.43% | 0.17%(+0.262)#54 | 0.49%(-0.053)#3,407 |
| 55. | Truesdale | 0.43% | 0.17%(+0.259)#55 | 0.49%(-0.056)#3,425 |
| 56. | Knob Noster | 0.43% | 0.17%(+0.256)#56 | 0.49%(-0.058)#3,441 |
| 57. | University City | 0.43% | 0.17%(+0.254)#57 | 0.49%(-0.060)#3,450 |
| 58. | Farley | 0.42% | 0.17%(+0.245)#58 | 0.49%(-0.069)#3,487 |
| 59. | Charlack | 0.41% | 0.17%(+0.241)#59 | 0.49%(-0.074)#3,506 |
| 60. | Josephville | 0.41% | 0.17%(+0.239)#60 | 0.49%(-0.075)#3,517 |
| 61. | St Charles | 0.41% | 0.17%(+0.238)#61 | 0.49%(-0.076)#3,520 |
| 62. | Lake Winnebago | 0.40% | 0.17%(+0.223)#62 | 0.49%(-0.092)#3,616 |
| 63. | Old Jamestown | 0.39% | 0.17%(+0.219)#63 | 0.49%(-0.095)#3,630 |
| 64. | St Paul | 0.38% | 0.17%(+0.208)#64 | 0.49%(-0.106)#3,697 |
| 65. | Harrisonville | 0.38% | 0.17%(+0.206)#65 | 0.49%(-0.108)#3,705 |
| 66. | Appleton City | 0.38% | 0.17%(+0.203)#66 | 0.49%(-0.112)#3,726 |
| 67. | St Joseph | 0.37% | 0.17%(+0.199)#67 | 0.49%(-0.115)#3,740 |
| 68. | Bel Nor | 0.37% | 0.17%(+0.197)#68 | 0.49%(-0.117)#3,751 |
| 69. | Nevada | 0.37% | 0.17%(+0.196)#69 | 0.49%(-0.118)#3,757 |
| 70. | Lee S Summit | 0.35% | 0.17%(+0.182)#70 | 0.49%(-0.133)#3,857 |
| 71. | Augusta | 0.34% | 0.17%(+0.172)#71 | 0.49%(-0.143)#3,930 |
| 72. | Wildwood | 0.34% | 0.17%(+0.170)#72 | 0.49%(-0.144)#3,940 |
| 73. | Creve Coeur | 0.34% | 0.17%(+0.169)#73 | 0.49%(-0.145)#3,943 |
| 74. | Raymore | 0.33% | 0.17%(+0.158)#74 | 0.49%(-0.156)#4,022 |
| 75. | Weatherby Lake | 0.33% | 0.17%(+0.157)#75 | 0.49%(-0.157)#4,031 |
| 76. | Belton | 0.33% | 0.17%(+0.153)#76 | 0.49%(-0.162)#4,056 |
| 77. | Westwood | 0.32% | 0.17%(+0.150)#77 | 0.49%(-0.164)#4,070 |
| 78. | Humansville | 0.32% | 0.17%(+0.145)#78 | 0.49%(-0.169)#4,100 |
| 79. | Brentwood | 0.32% | 0.17%(+0.145)#79 | 0.49%(-0.169)#4,102 |
| 80. | Ferrelview | 0.31% | 0.17%(+0.142)#80 | 0.49%(-0.173)#4,125 |
| 81. | Fremont Hills | 0.31% | 0.17%(+0.141)#81 | 0.49%(-0.173)#4,130 |
| 82. | Monett | 0.30% | 0.17%(+0.128)#82 | 0.49%(-0.186)#4,227 |
| 83. | Bethany | 0.29% | 0.17%(+0.116)#83 | 0.49%(-0.198)#4,313 |
| 84. | Huntsville | 0.29% | 0.17%(+0.113)#84 | 0.49%(-0.201)#4,334 |
| 85. | Boonville | 0.28% | 0.17%(+0.112)#85 | 0.49%(-0.203)#4,338 |
| 86. | Farmington | 0.28% | 0.17%(+0.107)#86 | 0.49%(-0.208)#4,372 |
| 87. | Troy | 0.27% | 0.17%(+0.097)#87 | 0.49%(-0.218)#4,439 |
| 88. | Kirkwood | 0.27% | 0.17%(+0.096)#88 | 0.49%(-0.218)#4,445 |
| 89. | Webster Groves | 0.27% | 0.17%(+0.095)#89 | 0.49%(-0.219)#4,450 |
| 90. | Kirksville | 0.26% | 0.17%(+0.089)#90 | 0.49%(-0.225)#4,499 |
| 91. | Richmond Heights | 0.26% | 0.17%(+0.088)#91 | 0.49%(-0.226)#4,506 |
| 92. | Altenburg | 0.26% | 0.17%(+0.085)#92 | 0.49%(-0.229)#4,528 |
| 93. | Kansas City | 0.26% | 0.17%(+0.083)#93 | 0.49%(-0.231)#4,544 |
| 94. | Olympian Village | 0.25% | 0.17%(+0.082)#94 | 0.49%(-0.233)#4,558 |
| 95. | Slater | 0.25% | 0.17%(+0.078)#95 | 0.49%(-0.236)#4,589 |
| 96. | Platte City | 0.25% | 0.17%(+0.078)#96 | 0.49%(-0.237)#4,592 |
| 97. | Gerald | 0.25% | 0.17%(+0.077)#97 | 0.49%(-0.237)#4,596 |
| 98. | Whiteman Afb | 0.24% | 0.17%(+0.070)#98 | 0.49%(-0.245)#4,666 |
| 99. | Lemay | 0.23% | 0.17%(+0.061)#99 | 0.49%(-0.253)#4,740 |
| 100. | Republic | 0.23% | 0.17%(+0.061)#100 | 0.49%(-0.254)#4,748 |
Common Questions
What are the Top 10 Cities with the Highest Percentage of Bhutanese Population in Missouri?
Top 10 Cities with the Highest Percentage of Bhutanese Population in Missouri are:
#1
5.81%
#2
3.45%
#3
3.07%
#4
2.42%
#5
2.30%
#6
2.02%
#7
1.86%
#8
1.49%
#9
1.44%
#10
1.38%
What city has the Highest Percentage of Bhutanese Population in Missouri?
Agency has the Highest Percentage of Bhutanese Population in Missouri with 5.81%.
What is the Percentage of Bhutanese Population in the State of Missouri?
Percentage of Bhutanese Population in Missouri is 0.17%.
What is the Percentage of Bhutanese Population in the United States?
Percentage of Bhutanese Population in the United States is 0.49%.