Battlefield, MO
Battlefield Map
Battlefield Overview
6,046
TOTAL POPULATION
2,899
MALE POPULATION
3,147
FEMALE POPULATION
92.12
MALES / 100 FEMALES
108.55
FEMALES / 100 MALES
40.7
MEDIAN AGE
2.7
AVG FAMILY SIZE
2.4
AVG HOUSEHOLD SIZE
$37,735
PER CAPITA INCOME
$91,322
AVG FAMILY INCOME
$82,302
AVG HOUSEHOLD INCOME
19.2%
WAGE / INCOME GAP [ % ]
80.8¢/ $1
WAGE / INCOME GAP [ $ ]
0.36
INEQUALITY / GINI INDEX
3,424
LABOR FORCE [ PEOPLE ]
70.2%
PERCENT IN LABOR FORCE
3.3%
UNEMPLOYMENT RATE
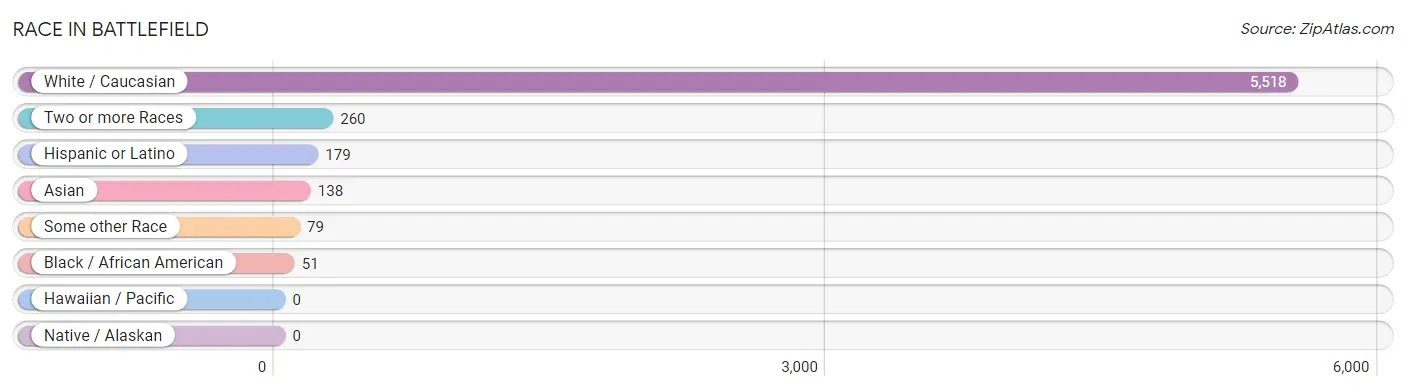
Race in Battlefield
The most populous races in Battlefield are White / Caucasian (5,518 | 91.3%), Two or more Races (260 | 4.3%), and Hispanic or Latino (179 | 3.0%).
| Race | # Population | % Population |
| Asian | 138 | 2.3% |
| Black / African American | 51 | 0.8% |
| Hawaiian / Pacific | 0 | 0.0% |
| Hispanic or Latino | 179 | 3.0% |
| Native / Alaskan | 0 | 0.0% |
| White / Caucasian | 5,518 | 91.3% |
| Two or more Races | 260 | 4.3% |
| Some other Race | 79 | 1.3% |
| Total | 6,046 | 100.0% |
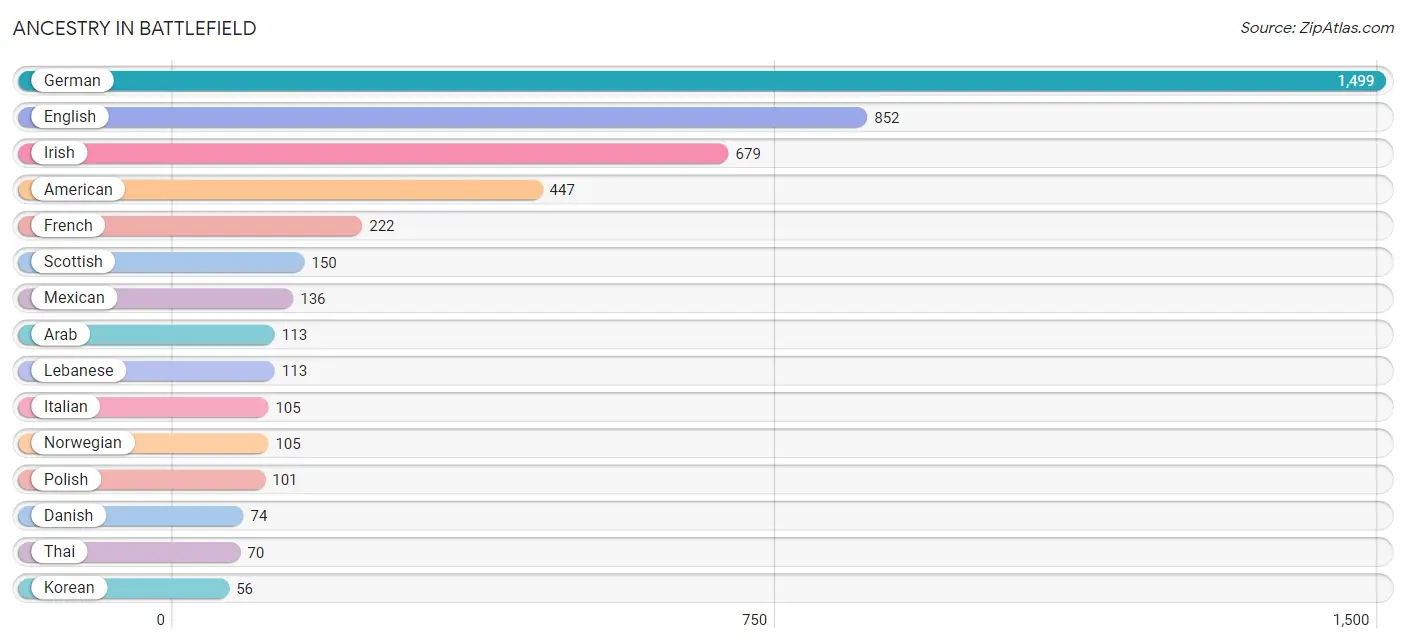
Ancestry in Battlefield
The most populous ancestries reported in Battlefield are German (1,499 | 24.8%), English (852 | 14.1%), Irish (679 | 11.2%), American (447 | 7.4%), and French (222 | 3.7%), together accounting for 61.2% of all Battlefield residents.
| Ancestry | # Population | % Population |
| American | 447 | 7.4% |
| Arab | 113 | 1.9% |
| Austrian | 37 | 0.6% |
| British | 44 | 0.7% |
| Central American | 26 | 0.4% |
| Cherokee | 50 | 0.8% |
| Colombian | 8 | 0.1% |
| Costa Rican | 26 | 0.4% |
| Danish | 74 | 1.2% |
| Dutch | 53 | 0.9% |
| Eastern European | 15 | 0.3% |
| Ecuadorian | 9 | 0.2% |
| English | 852 | 14.1% |
| European | 55 | 0.9% |
| French | 222 | 3.7% |
| German | 1,499 | 24.8% |
| Greek | 7 | 0.1% |
| Hungarian | 36 | 0.6% |
| Irish | 679 | 11.2% |
| Italian | 105 | 1.7% |
| Japanese | 30 | 0.5% |
| Korean | 56 | 0.9% |
| Lebanese | 113 | 1.9% |
| Mexican | 136 | 2.2% |
| Norwegian | 105 | 1.7% |
| Polish | 101 | 1.7% |
| Scotch-Irish | 52 | 0.9% |
| Scottish | 150 | 2.5% |
| Slavic | 10 | 0.2% |
| Slovak | 26 | 0.4% |
| South American | 17 | 0.3% |
| Swedish | 46 | 0.8% |
| Thai | 70 | 1.2% |
| Ukrainian | 39 | 0.6% |
| Welsh | 23 | 0.4% | View All 35 Rows |
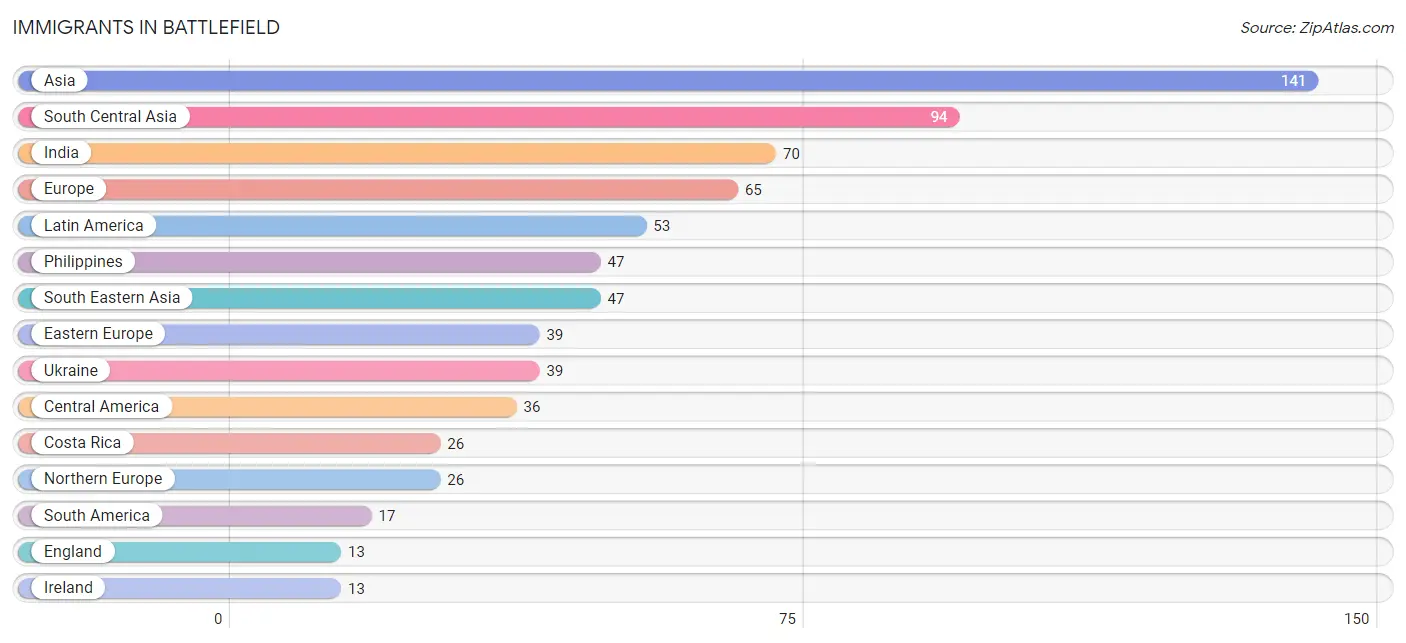
Immigrants in Battlefield
The most numerous immigrant groups reported in Battlefield came from Asia (141 | 2.3%), South Central Asia (94 | 1.5%), India (70 | 1.2%), Europe (65 | 1.1%), and Latin America (53 | 0.9%), together accounting for 7.0% of all Battlefield residents.
| Immigration Origin | # Population | % Population |
| Asia | 141 | 2.3% |
| Central America | 36 | 0.6% |
| Colombia | 8 | 0.1% |
| Costa Rica | 26 | 0.4% |
| Eastern Europe | 39 | 0.6% |
| Ecuador | 9 | 0.2% |
| England | 13 | 0.2% |
| Europe | 65 | 1.1% |
| India | 70 | 1.2% |
| Ireland | 13 | 0.2% |
| Latin America | 53 | 0.9% |
| Mexico | 10 | 0.2% |
| Northern Europe | 26 | 0.4% |
| Philippines | 47 | 0.8% |
| South America | 17 | 0.3% |
| South Central Asia | 94 | 1.5% |
| South Eastern Asia | 47 | 0.8% |
| Ukraine | 39 | 0.6% | View All 18 Rows |
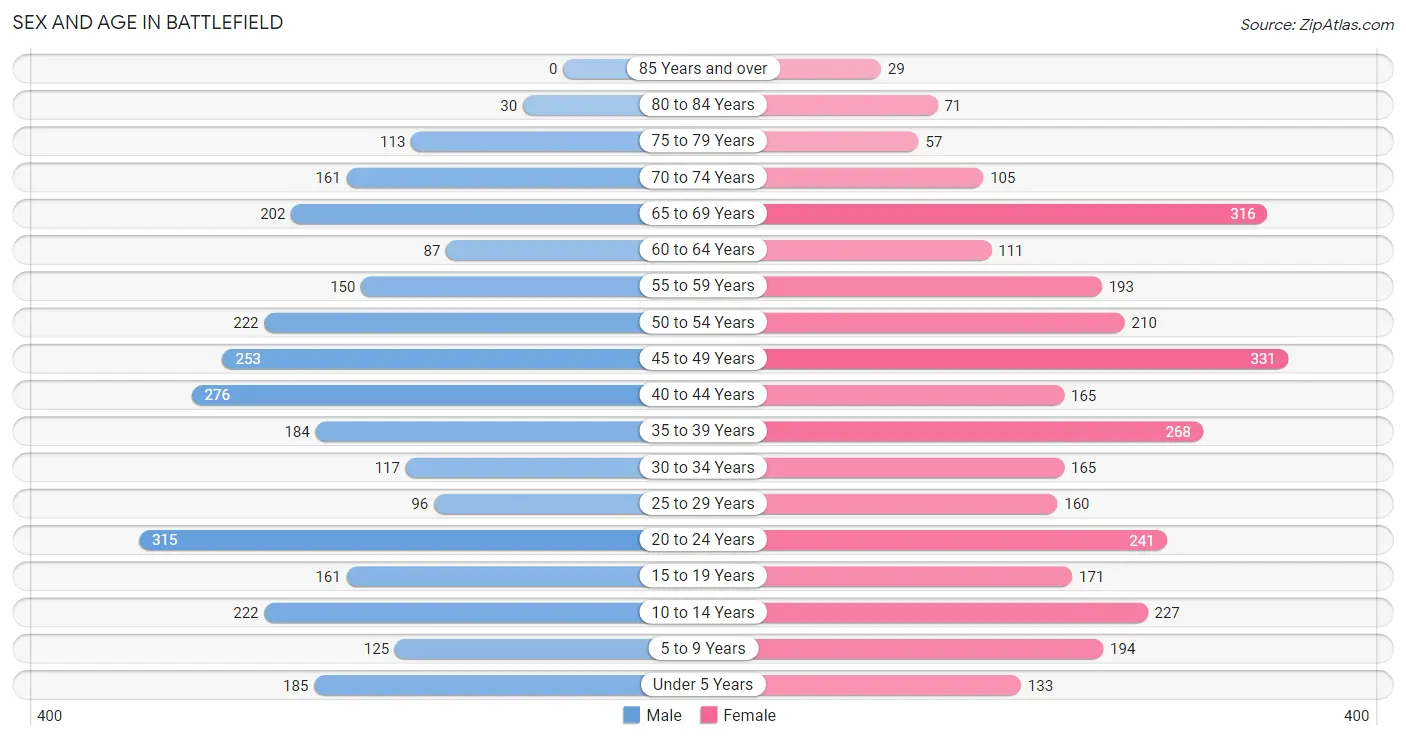
Sex and Age in Battlefield
Sex and Age in Battlefield
The most populous age groups in Battlefield are 20 to 24 Years (315 | 10.9%) for men and 45 to 49 Years (331 | 10.5%) for women.
| Age Bracket | Male | Female |
| Under 5 Years | 185 (6.4%) | 133 (4.2%) |
| 5 to 9 Years | 125 (4.3%) | 194 (6.2%) |
| 10 to 14 Years | 222 (7.7%) | 227 (7.2%) |
| 15 to 19 Years | 161 (5.6%) | 171 (5.4%) |
| 20 to 24 Years | 315 (10.9%) | 241 (7.7%) |
| 25 to 29 Years | 96 (3.3%) | 160 (5.1%) |
| 30 to 34 Years | 117 (4.0%) | 165 (5.2%) |
| 35 to 39 Years | 184 (6.4%) | 268 (8.5%) |
| 40 to 44 Years | 276 (9.5%) | 165 (5.2%) |
| 45 to 49 Years | 253 (8.7%) | 331 (10.5%) |
| 50 to 54 Years | 222 (7.7%) | 210 (6.7%) |
| 55 to 59 Years | 150 (5.2%) | 193 (6.1%) |
| 60 to 64 Years | 87 (3.0%) | 111 (3.5%) |
| 65 to 69 Years | 202 (7.0%) | 316 (10.0%) |
| 70 to 74 Years | 161 (5.6%) | 105 (3.3%) |
| 75 to 79 Years | 113 (3.9%) | 57 (1.8%) |
| 80 to 84 Years | 30 (1.0%) | 71 (2.3%) |
| 85 Years and over | 0 (0.0%) | 29 (0.9%) |
| Total | 2,899 (100.0%) | 3,147 (100.0%) |
Families and Households in Battlefield
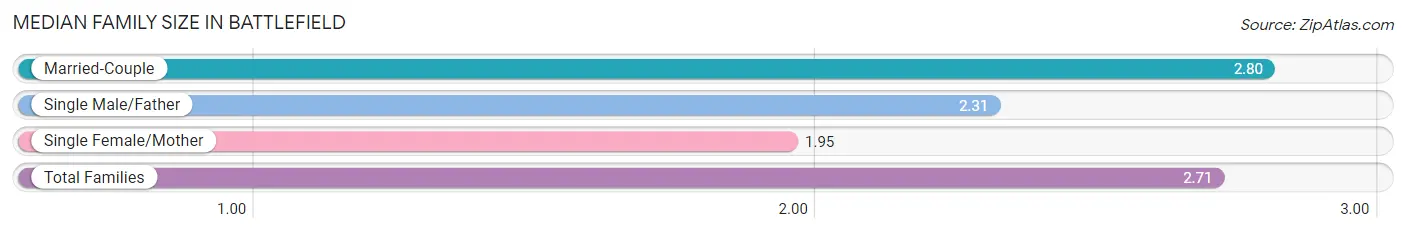
Median Family Size in Battlefield
The median family size in Battlefield is 2.71 persons per family, with married-couple families (1,660 | 87.1%) accounting for the largest median family size of 2.8 persons per family. On the other hand, single female/mother families (130 | 6.8%) represent the smallest median family size with 1.95 persons per family.
| Family Type | # Families | Family Size |
| Married-Couple | 1,660 (87.1%) | 2.80 |
| Single Male/Father | 117 (6.1%) | 2.31 |
| Single Female/Mother | 130 (6.8%) | 1.95 |
| Total Families | 1,907 (100.0%) | 2.71 |
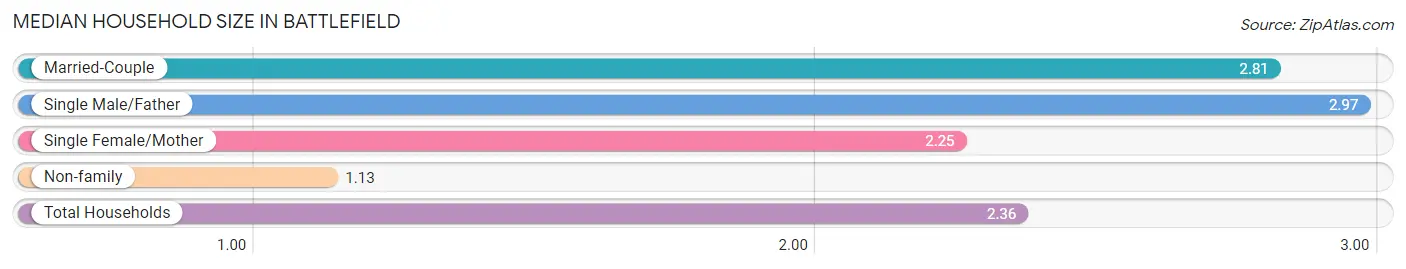
Median Household Size in Battlefield
The median household size in Battlefield is 2.36 persons per household, with single male/father households (117 | 4.6%) accounting for the largest median household size of 2.97 persons per household. non-family households (659 | 25.7%) represent the smallest median household size with 1.13 persons per household.
| Household Type | # Households | Household Size |
| Married-Couple | 1,660 (64.7%) | 2.81 |
| Single Male/Father | 117 (4.6%) | 2.97 |
| Single Female/Mother | 130 (5.1%) | 2.25 |
| Non-family | 659 (25.7%) | 1.13 |
| Total Households | 2,566 (100.0%) | 2.36 |
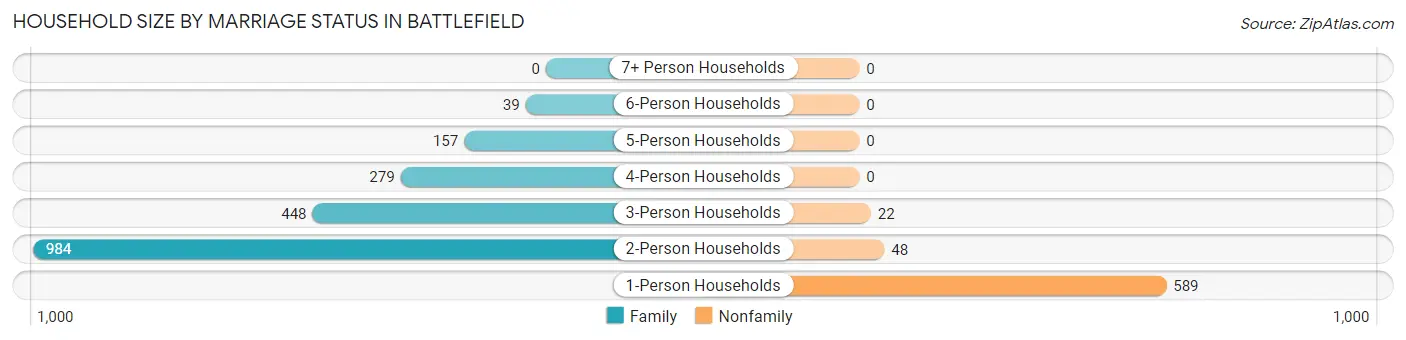
Household Size by Marriage Status in Battlefield
Out of a total of 2,566 households in Battlefield, 1,907 (74.3%) are family households, while 659 (25.7%) are nonfamily households. The most numerous type of family households are 2-person households, comprising 984, and the most common type of nonfamily households are 1-person households, comprising 589.
| Household Size | Family Households | Nonfamily Households |
| 1-Person Households | - | 589 (23.0%) |
| 2-Person Households | 984 (38.4%) | 48 (1.9%) |
| 3-Person Households | 448 (17.5%) | 22 (0.9%) |
| 4-Person Households | 279 (10.9%) | 0 (0.0%) |
| 5-Person Households | 157 (6.1%) | 0 (0.0%) |
| 6-Person Households | 39 (1.5%) | 0 (0.0%) |
| 7+ Person Households | 0 (0.0%) | 0 (0.0%) |
| Total | 1,907 (74.3%) | 659 (25.7%) |
Female Fertility in Battlefield
Fertility by Age in Battlefield
Average fertility rate in Battlefield is 43.0 births per 1,000 women. Women in the age bracket of 20 to 34 years have the highest fertility rate with 97.0 births per 1,000 women. Women in the age bracket of 20 to 34 years acount for 84.6% of all women with births.
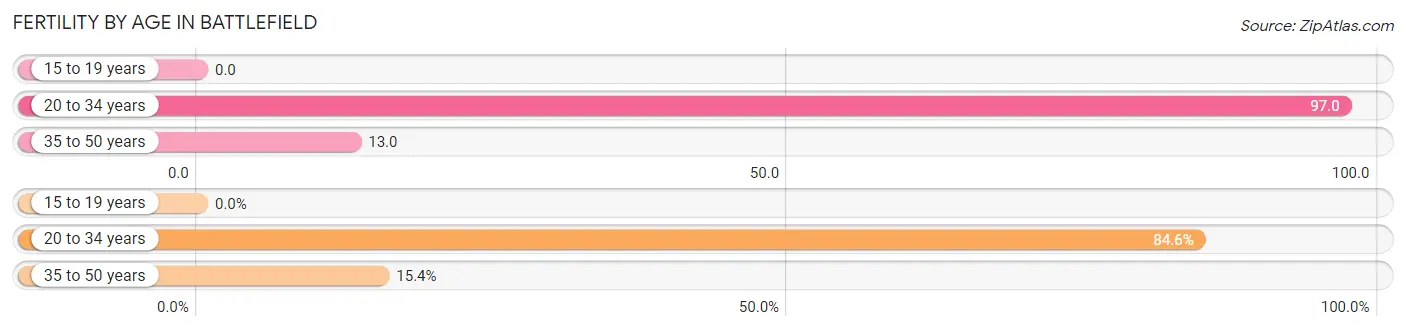
| Age Bracket | Women with Births | Births / 1,000 Women |
| 15 to 19 years | 0 (0.0%) | 0.0 |
| 20 to 34 years | 55 (84.6%) | 97.0 |
| 35 to 50 years | 10 (15.4%) | 13.0 |
| Total | 65 (100.0%) | 43.0 |
Fertility by Age by Marriage Status in Battlefield
83.1% of women with births (65) in Battlefield are married. The highest percentage of unmarried women with births falls into 20 to 34 years age bracket with 20.0% of them unmarried at the time of birth, while the lowest percentage of unmarried women with births belong to 35 to 50 years age bracket with 0.0% of them unmarried.
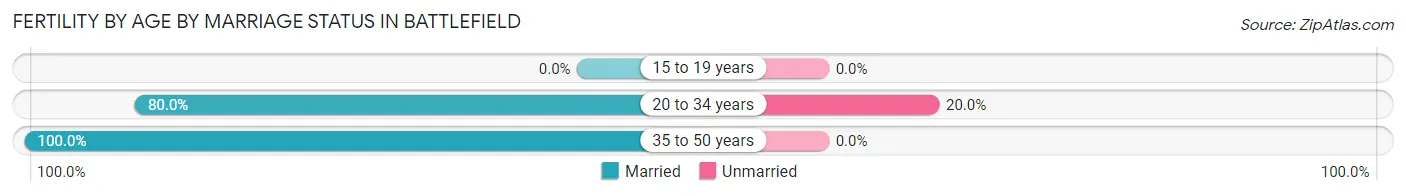
| Age Bracket | Married | Unmarried |
| 15 to 19 years | 0 (0.0%) | 0 (0.0%) |
| 20 to 34 years | 44 (80.0%) | 11 (20.0%) |
| 35 to 50 years | 10 (100.0%) | 0 (0.0%) |
| Total | 54 (83.1%) | 11 (16.9%) |
Fertility by Education in Battlefield
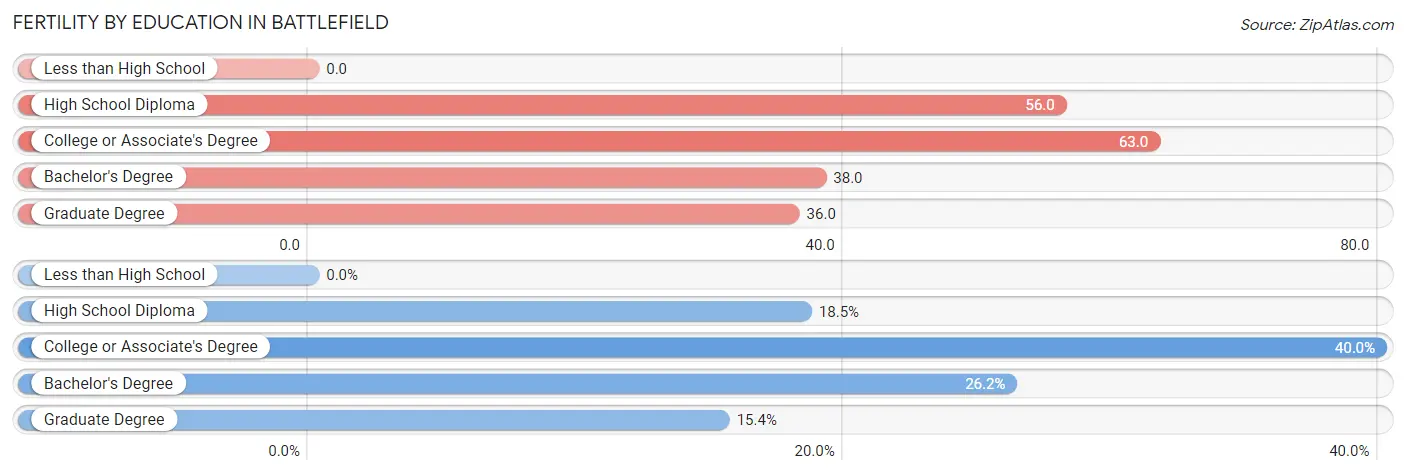
| Educational Attainment | Women with Births | Births / 1,000 Women |
| Less than High School | 0 (0.0%) | 0.0 |
| High School Diploma | 12 (18.5%) | 56.0 |
| College or Associate's Degree | 26 (40.0%) | 63.0 |
| Bachelor's Degree | 17 (26.2%) | 38.0 |
| Graduate Degree | 10 (15.4%) | 36.0 |
| Total | 65 (100.0%) | 43.0 |
Fertility by Education by Marriage Status in Battlefield
16.9% of women with births in Battlefield are unmarried. Women with the educational attainment of high school diploma are most likely to be married with 100.0% of them married at childbirth, while women with the educational attainment of college or associate's degree are least likely to be married with 42.3% of them unmarried at childbirth.
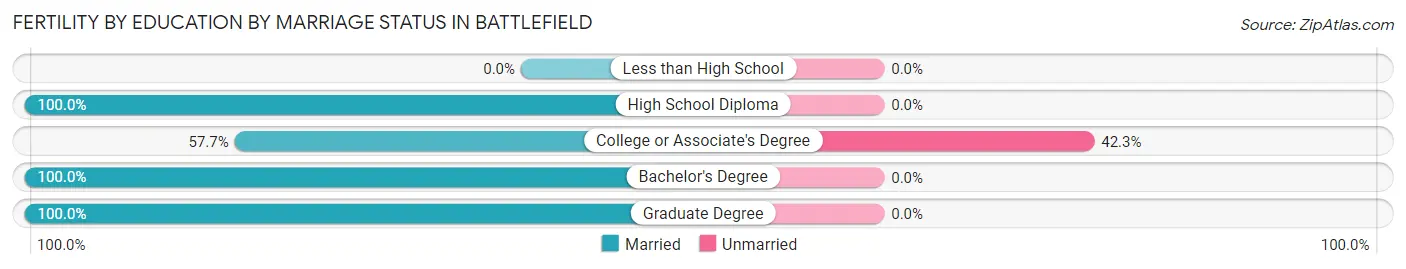
| Educational Attainment | Married | Unmarried |
| Less than High School | 0 (0.0%) | 0 (0.0%) |
| High School Diploma | 12 (100.0%) | 0 (0.0%) |
| College or Associate's Degree | 15 (57.7%) | 11 (42.3%) |
| Bachelor's Degree | 17 (100.0%) | 0 (0.0%) |
| Graduate Degree | 10 (100.0%) | 0 (0.0%) |
| Total | 54 (83.1%) | 11 (16.9%) |
Income in Battlefield
Income Overview in Battlefield
Per Capita Income in Battlefield is $37,735, while median incomes of families and households are $91,322 and $82,302 respectively.
| Characteristic | Number | Measure |
| Per Capita Income | 6,046 | $37,735 |
| Median Family Income | 1,907 | $91,322 |
| Mean Family Income | 1,907 | $105,446 |
| Median Household Income | 2,566 | $82,302 |
| Mean Household Income | 2,566 | $92,257 |
| Income Deficit | 1,907 | $0 |
| Wage / Income Gap (%) | 6,046 | 19.22% |
| Wage / Income Gap ($) | 6,046 | 80.78¢ per $1 |
| Gini / Inequality Index | 6,046 | 0.36 |
Earnings by Sex in Battlefield
Average Earnings in Battlefield are $46,382, $50,771 for men and $41,013 for women, a difference of 19.2%.
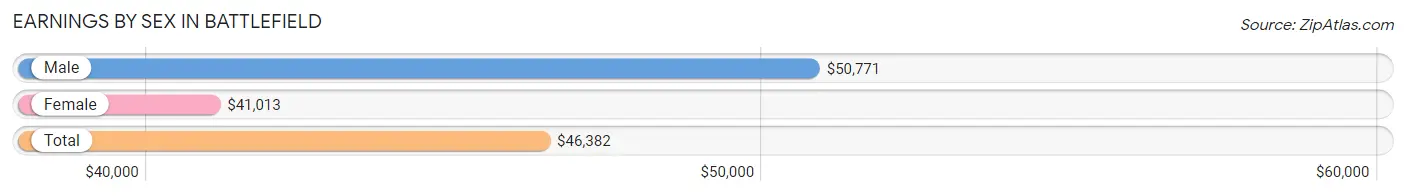
| Sex | Number | Average Earnings |
| Male | 1,678 (46.6%) | $50,771 |
| Female | 1,927 (53.4%) | $41,013 |
| Total | 3,605 (100.0%) | $46,382 |
Earnings by Sex by Income Bracket in Battlefield
The most common earnings brackets in Battlefield are $100,000+ for men (382 | 22.8%) and $65,000 to $74,999 for women (371 | 19.3%).
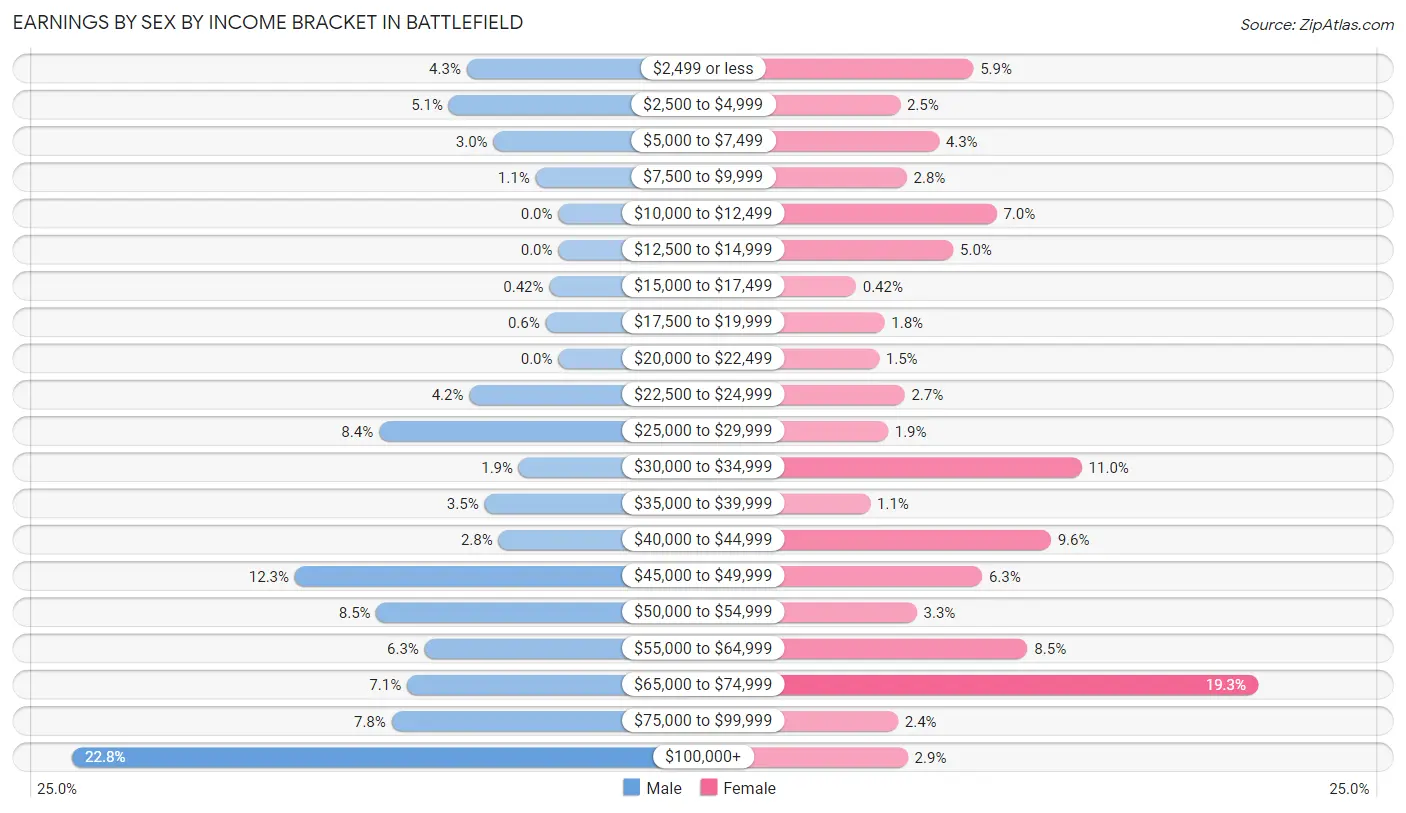
| Income | Male | Female |
| $2,499 or less | 72 (4.3%) | 114 (5.9%) |
| $2,500 to $4,999 | 86 (5.1%) | 48 (2.5%) |
| $5,000 to $7,499 | 51 (3.0%) | 83 (4.3%) |
| $7,500 to $9,999 | 18 (1.1%) | 54 (2.8%) |
| $10,000 to $12,499 | 0 (0.0%) | 135 (7.0%) |
| $12,500 to $14,999 | 0 (0.0%) | 96 (5.0%) |
| $15,000 to $17,499 | 7 (0.4%) | 8 (0.4%) |
| $17,500 to $19,999 | 10 (0.6%) | 34 (1.8%) |
| $20,000 to $22,499 | 0 (0.0%) | 29 (1.5%) |
| $22,500 to $24,999 | 70 (4.2%) | 52 (2.7%) |
| $25,000 to $29,999 | 141 (8.4%) | 37 (1.9%) |
| $30,000 to $34,999 | 31 (1.8%) | 212 (11.0%) |
| $35,000 to $39,999 | 58 (3.5%) | 21 (1.1%) |
| $40,000 to $44,999 | 47 (2.8%) | 184 (9.6%) |
| $45,000 to $49,999 | 207 (12.3%) | 122 (6.3%) |
| $50,000 to $54,999 | 143 (8.5%) | 63 (3.3%) |
| $55,000 to $64,999 | 105 (6.3%) | 163 (8.5%) |
| $65,000 to $74,999 | 119 (7.1%) | 371 (19.3%) |
| $75,000 to $99,999 | 131 (7.8%) | 46 (2.4%) |
| $100,000+ | 382 (22.8%) | 55 (2.9%) |
| Total | 1,678 (100.0%) | 1,927 (100.0%) |
Earnings by Sex by Educational Attainment in Battlefield
Average earnings in Battlefield are $60,192 for men and $45,759 for women, a difference of 24.0%. Men with an educational attainment of graduate degree enjoy the highest average annual earnings of $71,809, while those with high school diploma education earn the least with $47,344. Women with an educational attainment of graduate degree earn the most with the average annual earnings of $67,928, while those with high school diploma education have the smallest earnings of $13,359.
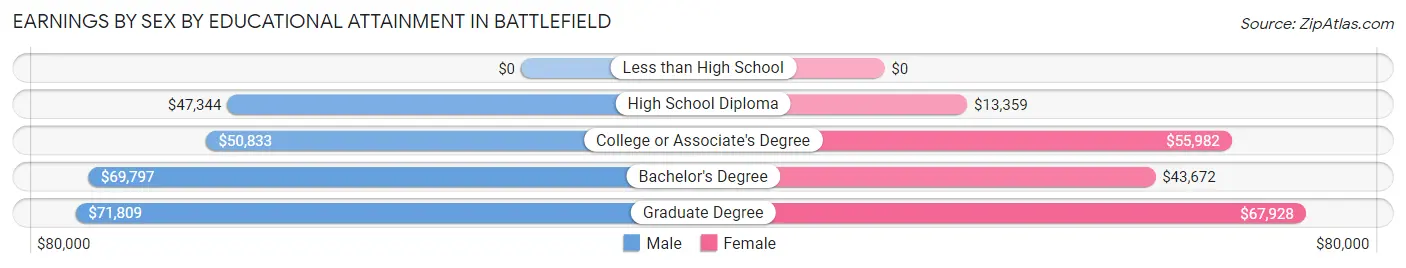
| Educational Attainment | Male Income | Female Income |
| Less than High School | - | - |
| High School Diploma | $47,344 | $13,359 |
| College or Associate's Degree | $50,833 | $55,982 |
| Bachelor's Degree | $69,797 | $43,672 |
| Graduate Degree | $71,809 | $67,928 |
| Total | $60,192 | $45,759 |
Family Income in Battlefield
Family Income Brackets in Battlefield
According to the Battlefield family income data, there are 519 families falling into the $100,000 to $149,999 income range, which is the most common income bracket and makes up 27.2% of all families.
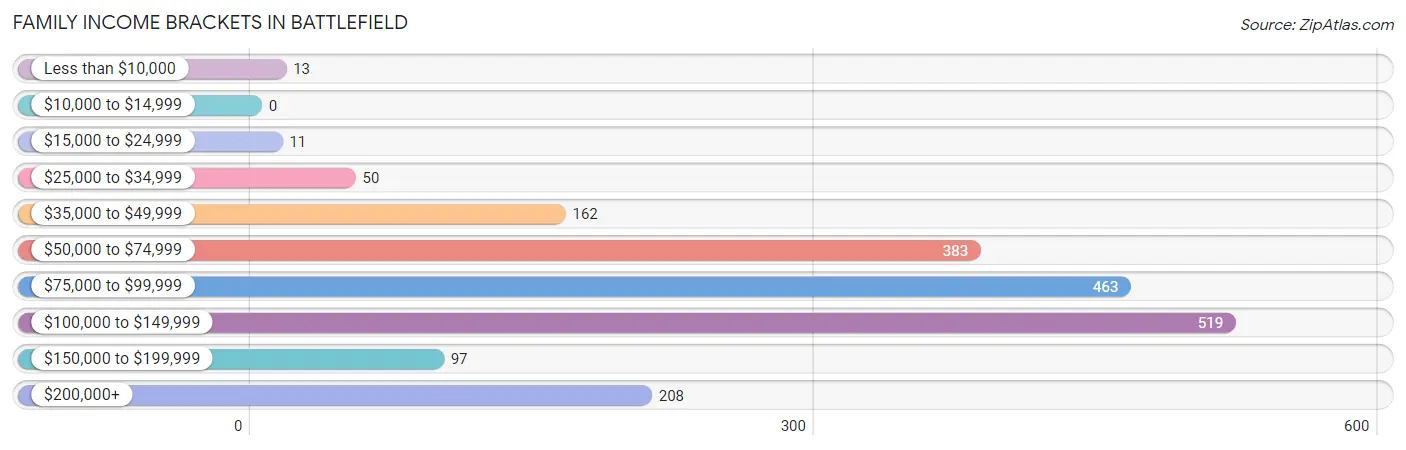
| Income Bracket | # Families | % Families |
| Less than $10,000 | 13 | 0.7% |
| $10,000 to $14,999 | 0 | 0.0% |
| $15,000 to $24,999 | 11 | 0.6% |
| $25,000 to $34,999 | 50 | 2.6% |
| $35,000 to $49,999 | 162 | 8.5% |
| $50,000 to $74,999 | 383 | 20.1% |
| $75,000 to $99,999 | 463 | 24.3% |
| $100,000 to $149,999 | 519 | 27.2% |
| $150,000 to $199,999 | 97 | 5.1% |
| $200,000+ | 208 | 10.9% |
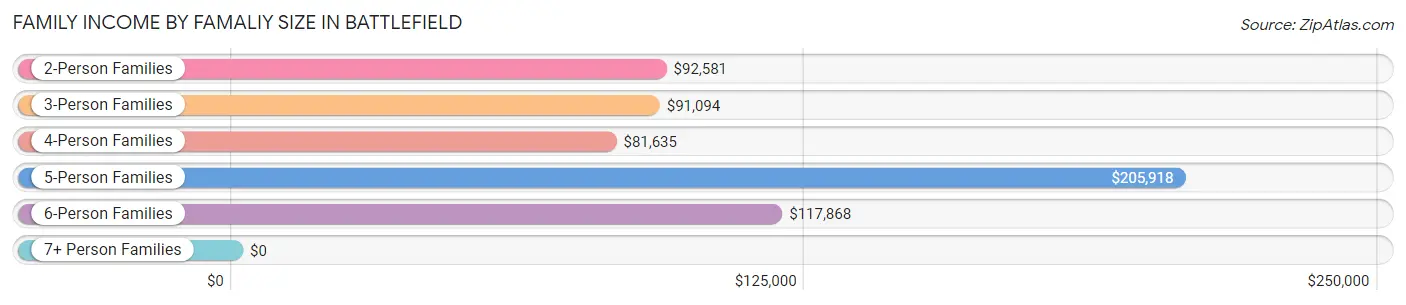
Family Income by Famaliy Size in Battlefield
5-person families (153 | 8.0%) account for the highest median family income in Battlefield with $205,918 per family, while 2-person families (1,062 | 55.7%) have the highest median income of $46,290 per family member.
| Income Bracket | # Families | Median Income |
| 2-Person Families | 1,062 (55.7%) | $92,581 |
| 3-Person Families | 426 (22.3%) | $91,094 |
| 4-Person Families | 227 (11.9%) | $81,635 |
| 5-Person Families | 153 (8.0%) | $205,918 |
| 6-Person Families | 39 (2.1%) | $117,868 |
| 7+ Person Families | 0 (0.0%) | $0 |
| Total | 1,907 (100.0%) | $91,322 |
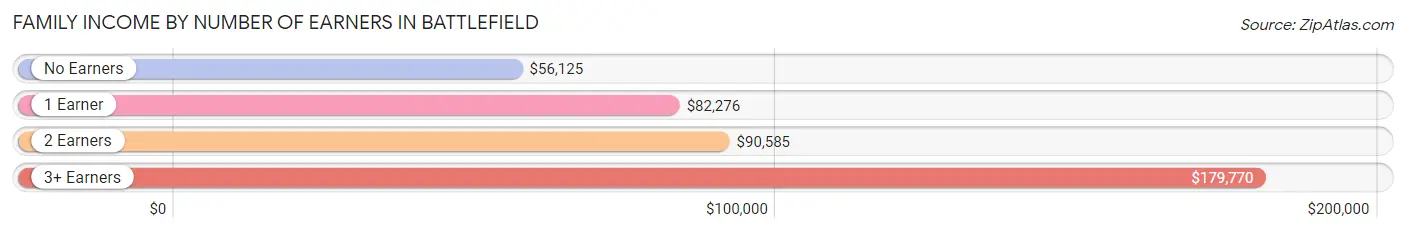
Family Income by Number of Earners in Battlefield
The median family income in Battlefield is $91,322, with families comprising 3+ earners (187) having the highest median family income of $179,770, while families with no earners (231) have the lowest median family income of $56,125, accounting for 9.8% and 12.1% of families, respectively.
| Number of Earners | # Families | Median Income |
| No Earners | 231 (12.1%) | $56,125 |
| 1 Earner | 571 (29.9%) | $82,276 |
| 2 Earners | 918 (48.1%) | $90,585 |
| 3+ Earners | 187 (9.8%) | $179,770 |
| Total | 1,907 (100.0%) | $91,322 |
Household Income in Battlefield
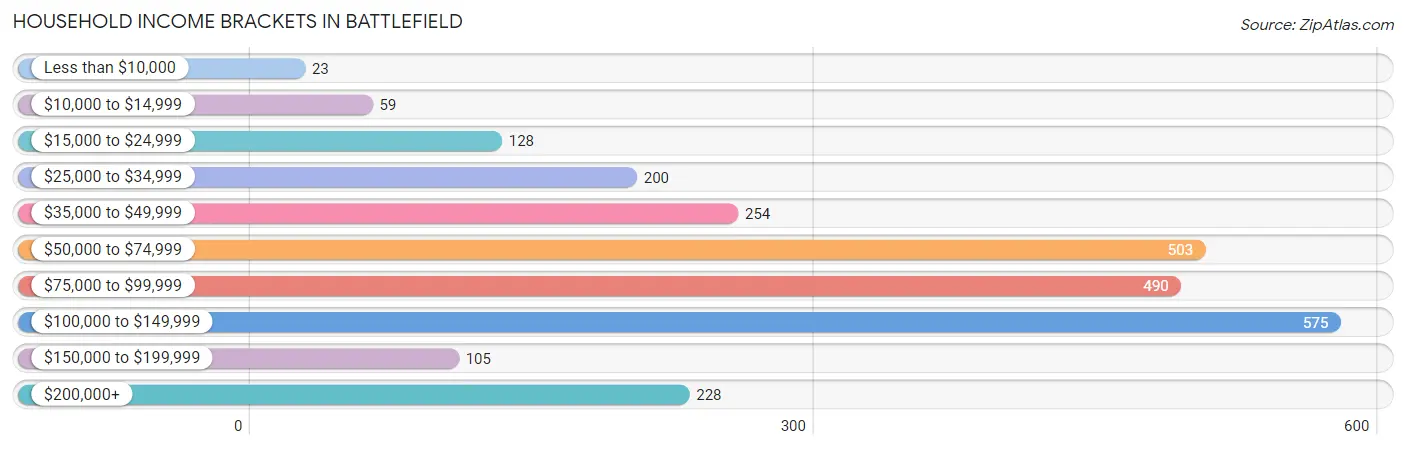
Household Income Brackets in Battlefield
With 575 households falling in the category, the $100,000 to $149,999 income range is the most frequent in Battlefield, accounting for 22.4% of all households. In contrast, only 23 households (0.9%) fall into the less than $10,000 income bracket, making it the least populous group.
| Income Bracket | # Households | % Households |
| Less than $10,000 | 23 | 0.9% |
| $10,000 to $14,999 | 59 | 2.3% |
| $15,000 to $24,999 | 128 | 5.0% |
| $25,000 to $34,999 | 200 | 7.8% |
| $35,000 to $49,999 | 254 | 9.9% |
| $50,000 to $74,999 | 503 | 19.6% |
| $75,000 to $99,999 | 490 | 19.1% |
| $100,000 to $149,999 | 575 | 22.4% |
| $150,000 to $199,999 | 105 | 4.1% |
| $200,000+ | 228 | 8.9% |
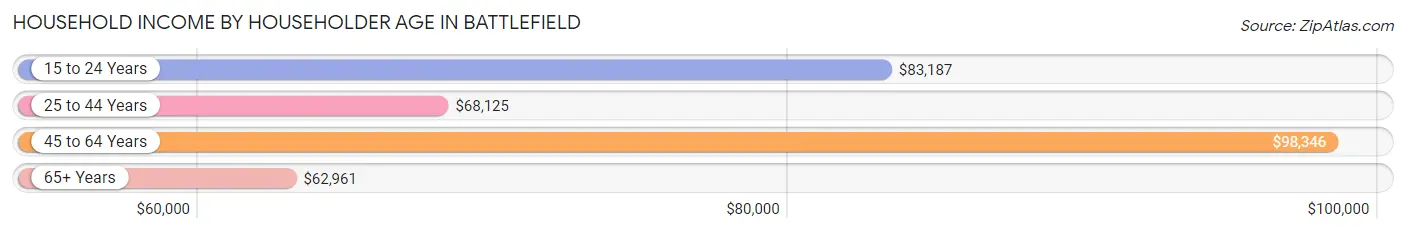
Household Income by Householder Age in Battlefield
The median household income in Battlefield is $82,302, with the highest median household income of $98,346 found in the 45 to 64 years age bracket for the primary householder. A total of 961 households (37.4%) fall into this category. Meanwhile, the 65+ years age bracket for the primary householder has the lowest median household income of $62,961, with 639 households (24.9%) in this group.
| Income Bracket | # Households | Median Income |
| 15 to 24 Years | 180 (7.0%) | $83,187 |
| 25 to 44 Years | 786 (30.6%) | $68,125 |
| 45 to 64 Years | 961 (37.4%) | $98,346 |
| 65+ Years | 639 (24.9%) | $62,961 |
| Total | 2,566 (100.0%) | $82,302 |
Poverty in Battlefield
Income Below Poverty by Sex and Age in Battlefield
With 2.9% poverty level for males and 5.4% for females among the residents of Battlefield, 6 to 11 year old males and 35 to 44 year old females are the most vulnerable to poverty, with 13 males (9.3%) and 72 females (16.6%) in their respective age groups living below the poverty level.
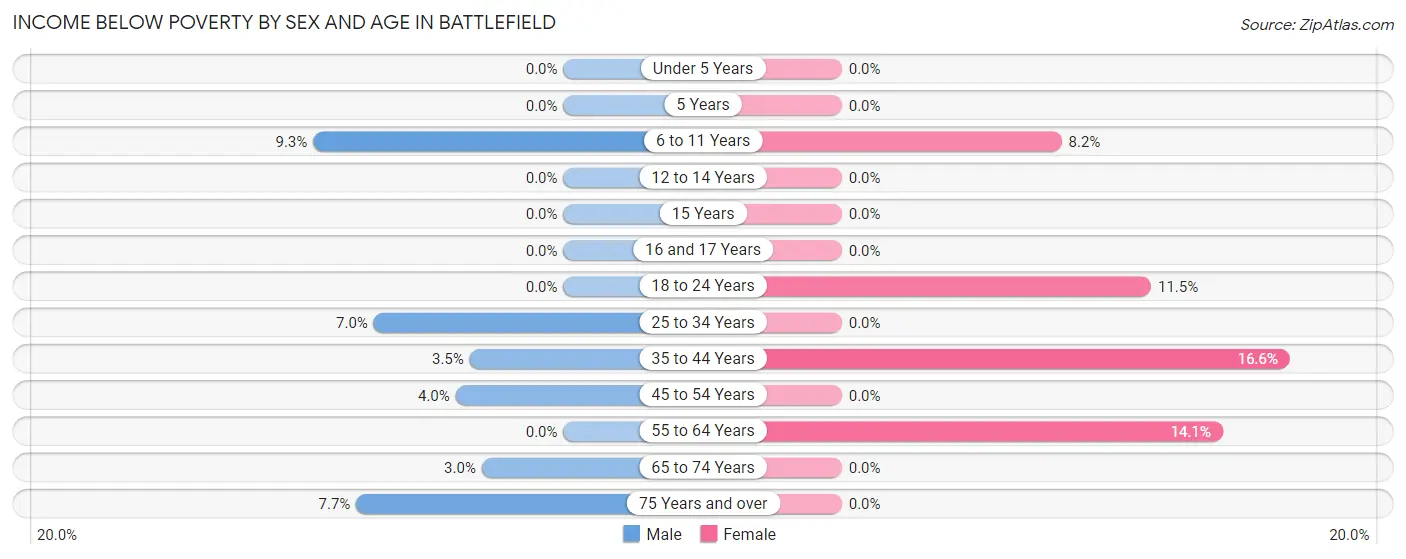
| Age Bracket | Male | Female |
| Under 5 Years | 0 (0.0%) | 0 (0.0%) |
| 5 Years | 0 (0.0%) | 0 (0.0%) |
| 6 to 11 Years | 13 (9.3%) | 24 (8.2%) |
| 12 to 14 Years | 0 (0.0%) | 0 (0.0%) |
| 15 Years | 0 (0.0%) | 0 (0.0%) |
| 16 and 17 Years | 0 (0.0%) | 0 (0.0%) |
| 18 to 24 Years | 0 (0.0%) | 31 (11.5%) |
| 25 to 34 Years | 15 (7.0%) | 0 (0.0%) |
| 35 to 44 Years | 16 (3.5%) | 72 (16.6%) |
| 45 to 54 Years | 19 (4.0%) | 0 (0.0%) |
| 55 to 64 Years | 0 (0.0%) | 43 (14.1%) |
| 65 to 74 Years | 11 (3.0%) | 0 (0.0%) |
| 75 Years and over | 11 (7.7%) | 0 (0.0%) |
| Total | 85 (2.9%) | 170 (5.4%) |
Income Above Poverty by Sex and Age in Battlefield
According to the poverty statistics in Battlefield, males aged under 5 years and females aged under 5 years are the age groups that are most secure financially, with 100.0% of males and 100.0% of females in these age groups living above the poverty line.
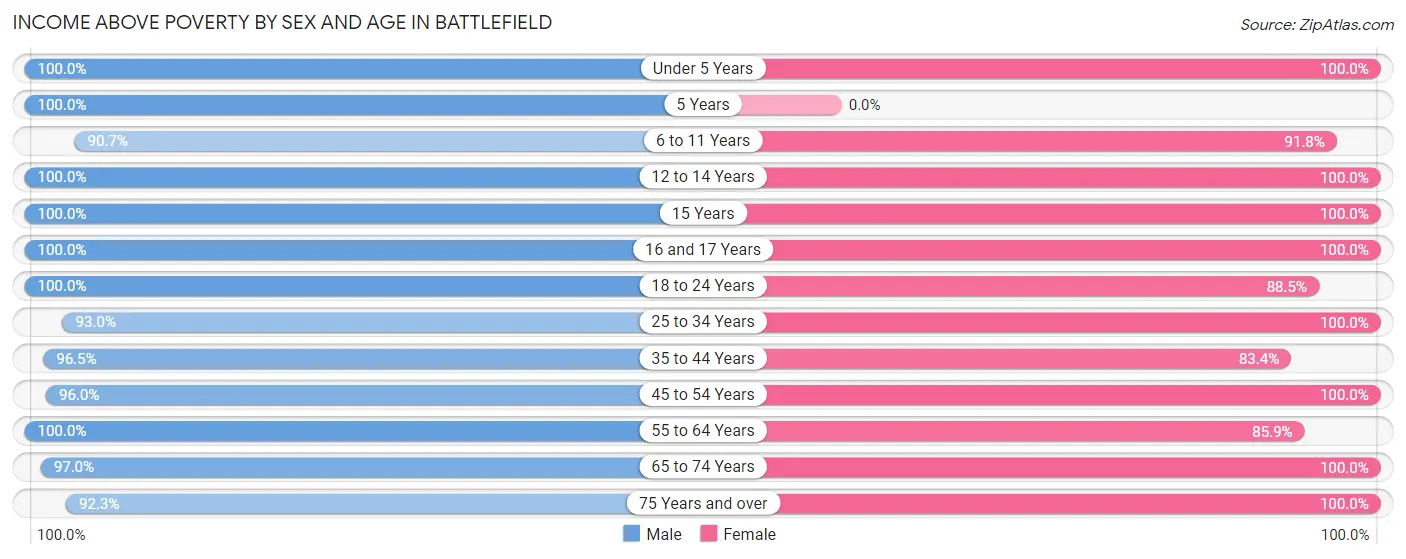
| Age Bracket | Male | Female |
| Under 5 Years | 185 (100.0%) | 133 (100.0%) |
| 5 Years | 48 (100.0%) | 0 (0.0%) |
| 6 to 11 Years | 127 (90.7%) | 270 (91.8%) |
| 12 to 14 Years | 143 (100.0%) | 127 (100.0%) |
| 15 Years | 41 (100.0%) | 42 (100.0%) |
| 16 and 17 Years | 100 (100.0%) | 100 (100.0%) |
| 18 to 24 Years | 335 (100.0%) | 239 (88.5%) |
| 25 to 34 Years | 198 (93.0%) | 325 (100.0%) |
| 35 to 44 Years | 444 (96.5%) | 361 (83.4%) |
| 45 to 54 Years | 456 (96.0%) | 541 (100.0%) |
| 55 to 64 Years | 237 (100.0%) | 261 (85.9%) |
| 65 to 74 Years | 352 (97.0%) | 421 (100.0%) |
| 75 Years and over | 132 (92.3%) | 157 (100.0%) |
| Total | 2,798 (97.1%) | 2,977 (94.6%) |
Income Below Poverty Among Married-Couple Families in Battlefield
The poverty statistics for married-couple families in Battlefield show that 1.3% or 22 of the total 1,660 families live below the poverty line. Families with 1 or 2 children have the highest poverty rate of 2.1%, comprising of 10 families. On the other hand, families with 3 or 4 children have the lowest poverty rate of 0.0%, which includes 0 families.
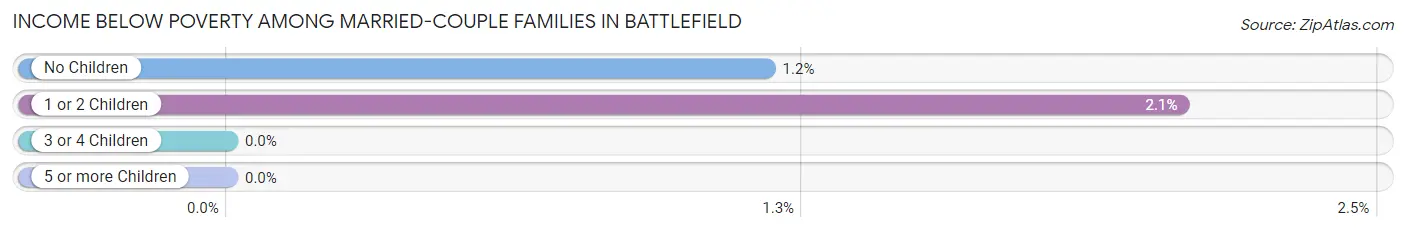
| Children | Above Poverty | Below Poverty |
| No Children | 1,016 (98.8%) | 12 (1.2%) |
| 1 or 2 Children | 472 (97.9%) | 10 (2.1%) |
| 3 or 4 Children | 150 (100.0%) | 0 (0.0%) |
| 5 or more Children | 0 (0.0%) | 0 (0.0%) |
| Total | 1,638 (98.7%) | 22 (1.3%) |
Income Below Poverty Among Single-Parent Households in Battlefield
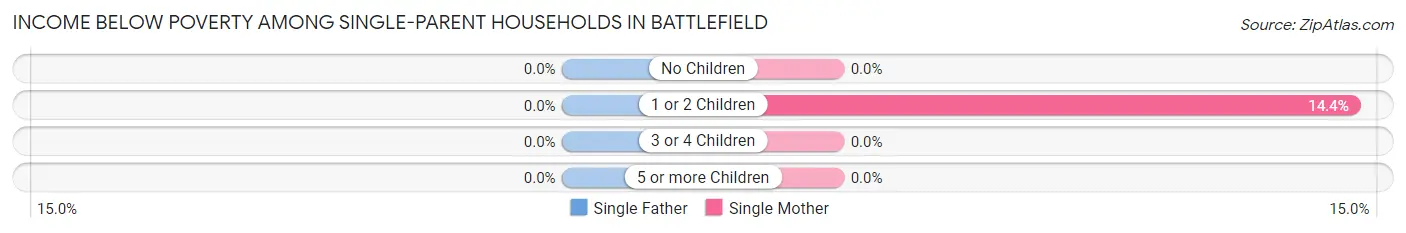
| Children | Single Father | Single Mother |
| No Children | 0 (0.0%) | 0 (0.0%) |
| 1 or 2 Children | 0 (0.0%) | 13 (14.4%) |
| 3 or 4 Children | 0 (0.0%) | 0 (0.0%) |
| 5 or more Children | 0 (0.0%) | 0 (0.0%) |
| Total | 0 (0.0%) | 13 (10.0%) |
Income Below Poverty Among Married-Couple vs Single-Parent Households in Battlefield
The poverty data for Battlefield shows that 22 of the married-couple family households (1.3%) and 13 of the single-parent households (5.3%) are living below the poverty level. Within the married-couple family households, those with 1 or 2 children have the highest poverty rate, with 10 households (2.1%) falling below the poverty line. Among the single-parent households, those with 1 or 2 children have the highest poverty rate, with 13 household (7.9%) living below poverty.
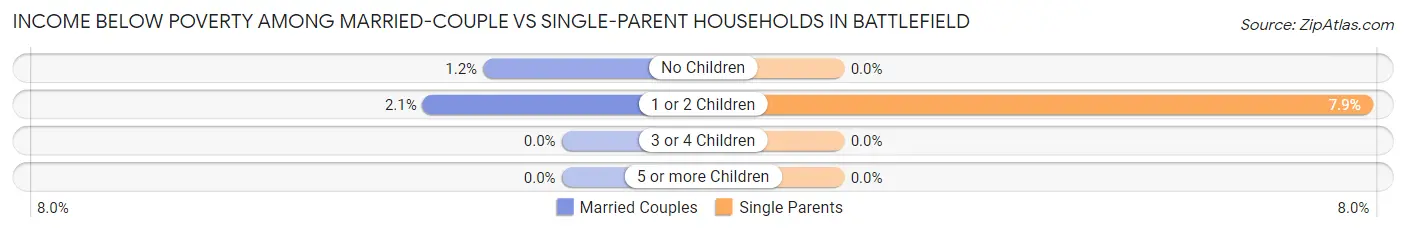
| Children | Married-Couple Families | Single-Parent Households |
| No Children | 12 (1.2%) | 0 (0.0%) |
| 1 or 2 Children | 10 (2.1%) | 13 (7.9%) |
| 3 or 4 Children | 0 (0.0%) | 0 (0.0%) |
| 5 or more Children | 0 (0.0%) | 0 (0.0%) |
| Total | 22 (1.3%) | 13 (5.3%) |
Employment Characteristics in Battlefield
Employment by Class of Employer in Battlefield
Among the 3,292 employed individuals in Battlefield, private company employees (2,026 | 61.5%), local government employees (428 | 13.0%), and not-for-profit organizations (409 | 12.4%) make up the most common classes of employment.
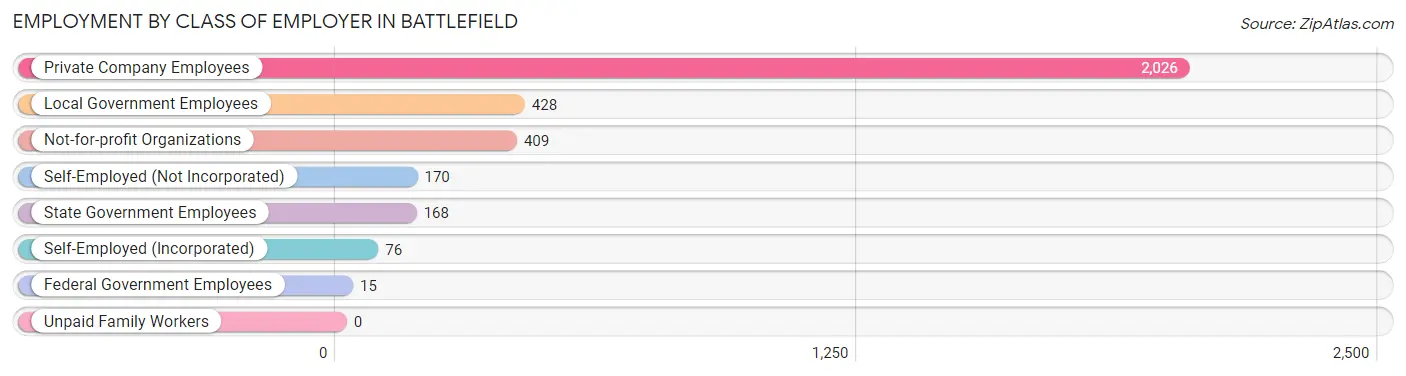
| Employer Class | # Employees | % Employees |
| Private Company Employees | 2,026 | 61.5% |
| Self-Employed (Incorporated) | 76 | 2.3% |
| Self-Employed (Not Incorporated) | 170 | 5.2% |
| Not-for-profit Organizations | 409 | 12.4% |
| Local Government Employees | 428 | 13.0% |
| State Government Employees | 168 | 5.1% |
| Federal Government Employees | 15 | 0.5% |
| Unpaid Family Workers | 0 | 0.0% |
| Total | 3,292 | 100.0% |
Employment Status by Age in Battlefield
According to the labor force statistics for Battlefield, out of the total population over 16 years of age (4,877), 70.2% or 3,424 individuals are in the labor force, with 3.3% or 113 of them unemployed. The age group with the highest labor force participation rate is 30 to 34 years, with 100.0% or 282 individuals in the labor force. Within the labor force, the 16 to 19 years age range has the highest percentage of unemployed individuals, with 18.9% or 27 of them being unemployed.
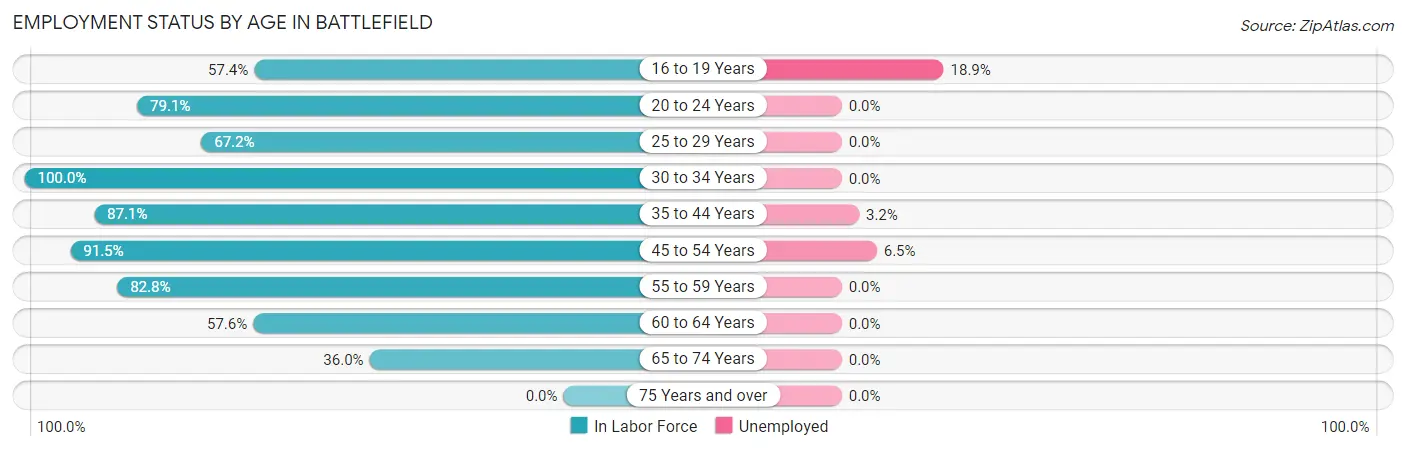
| Age Bracket | In Labor Force | Unemployed |
| 16 to 19 Years | 143 (57.4%) | 27 (18.9%) |
| 20 to 24 Years | 440 (79.1%) | 0 (0.0%) |
| 25 to 29 Years | 172 (67.2%) | 0 (0.0%) |
| 30 to 34 Years | 282 (100.0%) | 0 (0.0%) |
| 35 to 44 Years | 778 (87.1%) | 25 (3.2%) |
| 45 to 54 Years | 930 (91.5%) | 60 (6.5%) |
| 55 to 59 Years | 284 (82.8%) | 0 (0.0%) |
| 60 to 64 Years | 114 (57.6%) | 0 (0.0%) |
| 65 to 74 Years | 282 (36.0%) | 0 (0.0%) |
| 75 Years and over | 0 (0.0%) | 0 (0.0%) |
| Total | 3,424 (70.2%) | 113 (3.3%) |
Employment Status by Educational Attainment in Battlefield
According to labor force statistics for Battlefield, 85.7% of individuals (2,561) out of the total population between 25 and 64 years of age (2,988) are in the labor force, with 3.3% or 85 of them being unemployed. The group with the highest labor force participation rate are those with the educational attainment of bachelor's degree or higher, with 89.6% or 1,219 individuals in the labor force. Within the labor force, individuals with college / associate degree education have the highest percentage of unemployment, with 8.8% or 60 of them being unemployed.
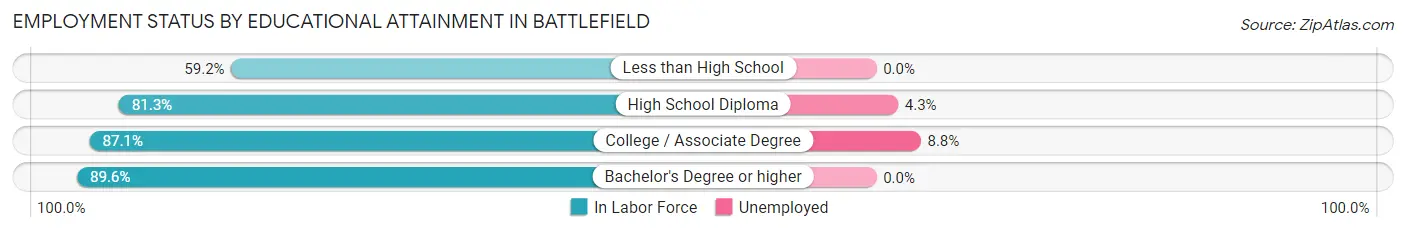
| Educational Attainment | In Labor Force | Unemployed |
| Less than High School | 74 (59.2%) | 0 (0.0%) |
| High School Diploma | 583 (81.3%) | 31 (4.3%) |
| College / Associate Degree | 684 (87.1%) | 69 (8.8%) |
| Bachelor's Degree or higher | 1,219 (89.6%) | 0 (0.0%) |
| Total | 2,561 (85.7%) | 99 (3.3%) |
Employment Occupations by Sex in Battlefield
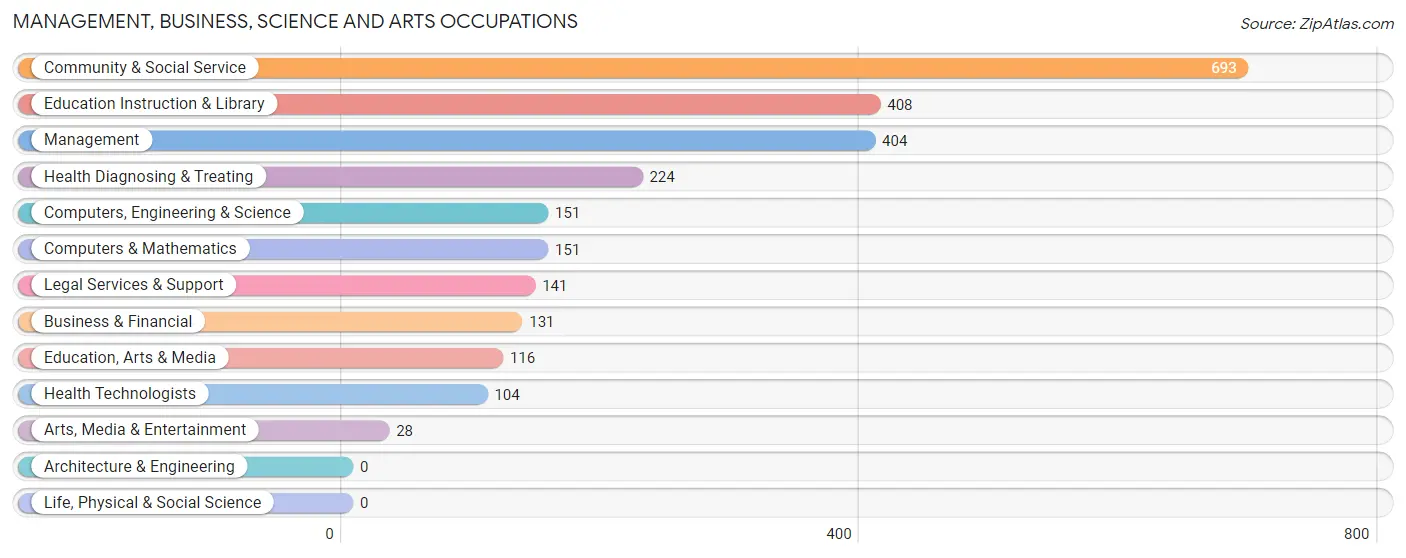
Management, Business, Science and Arts Occupations
The most common Management, Business, Science and Arts occupations in Battlefield are Community & Social Service (693 | 20.9%), Education Instruction & Library (408 | 12.3%), Management (404 | 12.2%), Health Diagnosing & Treating (224 | 6.8%), and Computers, Engineering & Science (151 | 4.6%).
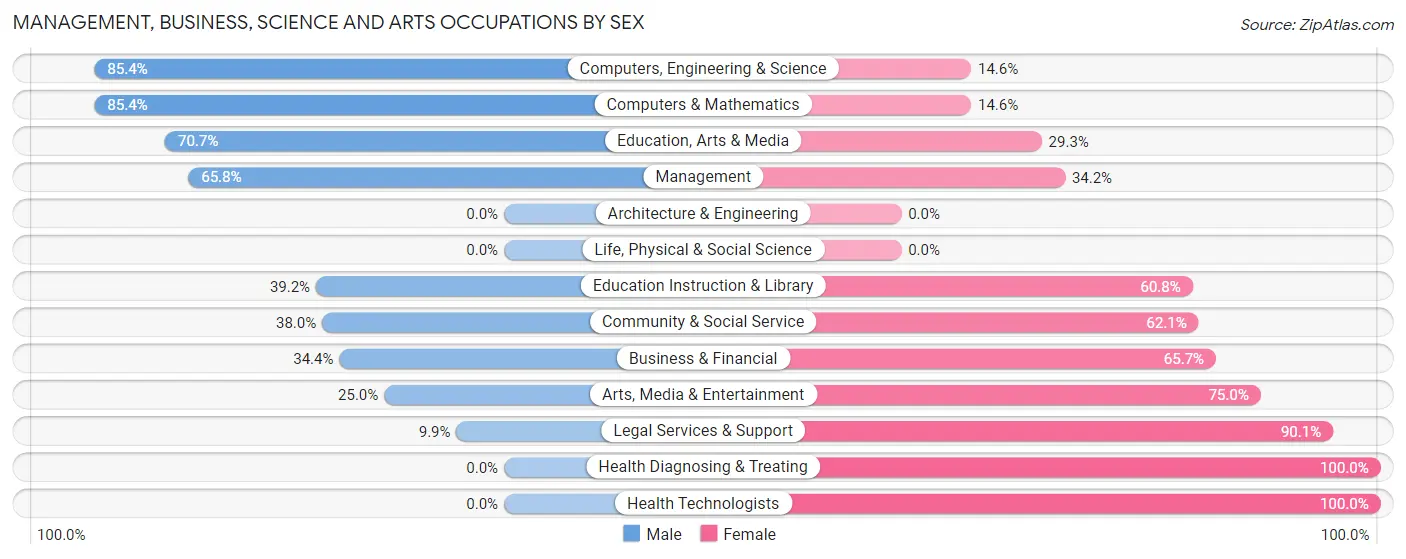
Management, Business, Science and Arts Occupations by Sex
Within the Management, Business, Science and Arts occupations in Battlefield, the most male-oriented occupations are Computers, Engineering & Science (85.4%), Computers & Mathematics (85.4%), and Education, Arts & Media (70.7%), while the most female-oriented occupations are Health Diagnosing & Treating (100.0%), Health Technologists (100.0%), and Legal Services & Support (90.1%).
| Occupation | Male | Female |
| Management | 266 (65.8%) | 138 (34.2%) |
| Business & Financial | 45 (34.4%) | 86 (65.6%) |
| Computers, Engineering & Science | 129 (85.4%) | 22 (14.6%) |
| Computers & Mathematics | 129 (85.4%) | 22 (14.6%) |
| Architecture & Engineering | 0 (0.0%) | 0 (0.0%) |
| Life, Physical & Social Science | 0 (0.0%) | 0 (0.0%) |
| Community & Social Service | 263 (38.0%) | 430 (62.1%) |
| Education, Arts & Media | 82 (70.7%) | 34 (29.3%) |
| Legal Services & Support | 14 (9.9%) | 127 (90.1%) |
| Education Instruction & Library | 160 (39.2%) | 248 (60.8%) |
| Arts, Media & Entertainment | 7 (25.0%) | 21 (75.0%) |
| Health Diagnosing & Treating | 0 (0.0%) | 224 (100.0%) |
| Health Technologists | 0 (0.0%) | 104 (100.0%) |
| Total (Category) | 703 (43.9%) | 900 (56.1%) |
| Total (Overall) | 1,537 (46.4%) | 1,776 (53.6%) |
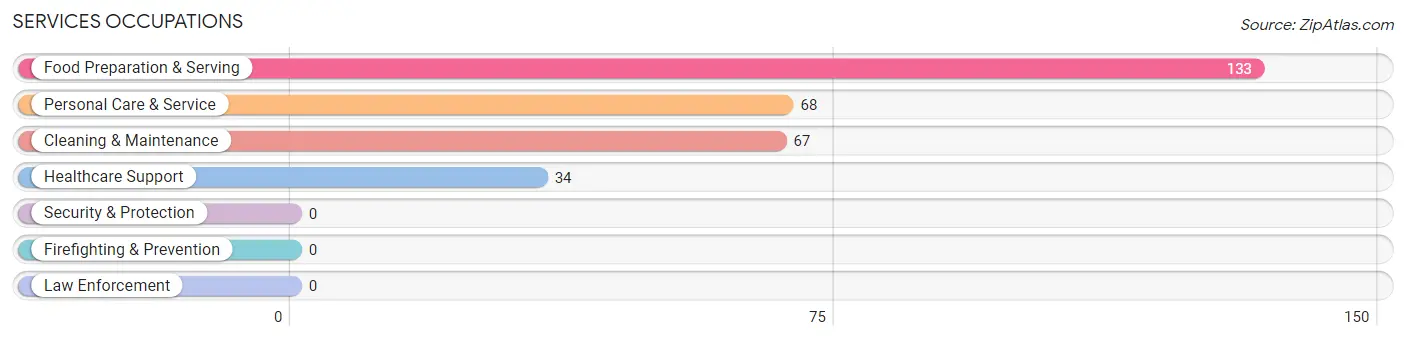
Services Occupations
The most common Services occupations in Battlefield are Food Preparation & Serving (133 | 4.0%), Personal Care & Service (68 | 2.1%), Cleaning & Maintenance (67 | 2.0%), and Healthcare Support (34 | 1.0%).
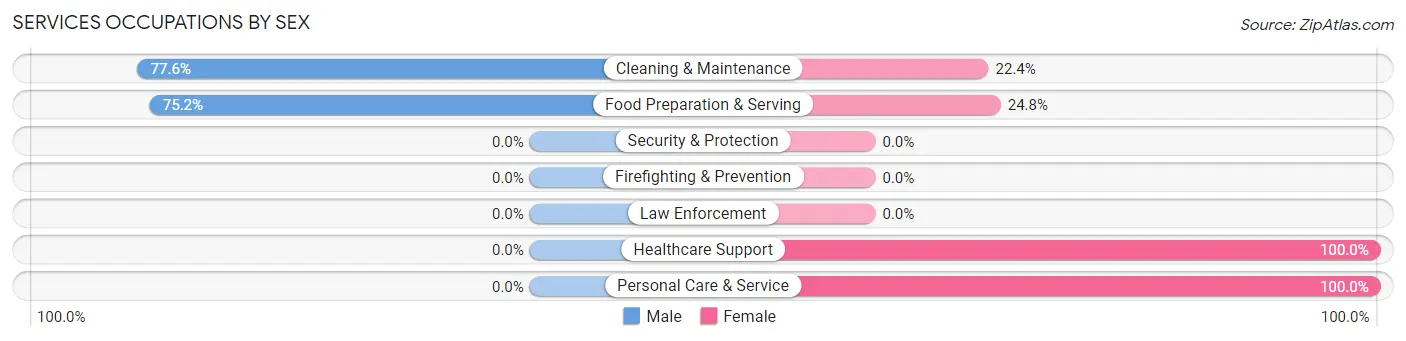
Services Occupations by Sex
Within the Services occupations in Battlefield, the most male-oriented occupations are Cleaning & Maintenance (77.6%), and Food Preparation & Serving (75.2%), while the most female-oriented occupations are Healthcare Support (100.0%), Personal Care & Service (100.0%), and Food Preparation & Serving (24.8%).
| Occupation | Male | Female |
| Healthcare Support | 0 (0.0%) | 34 (100.0%) |
| Security & Protection | 0 (0.0%) | 0 (0.0%) |
| Firefighting & Prevention | 0 (0.0%) | 0 (0.0%) |
| Law Enforcement | 0 (0.0%) | 0 (0.0%) |
| Food Preparation & Serving | 100 (75.2%) | 33 (24.8%) |
| Cleaning & Maintenance | 52 (77.6%) | 15 (22.4%) |
| Personal Care & Service | 0 (0.0%) | 68 (100.0%) |
| Total (Category) | 152 (50.3%) | 150 (49.7%) |
| Total (Overall) | 1,537 (46.4%) | 1,776 (53.6%) |
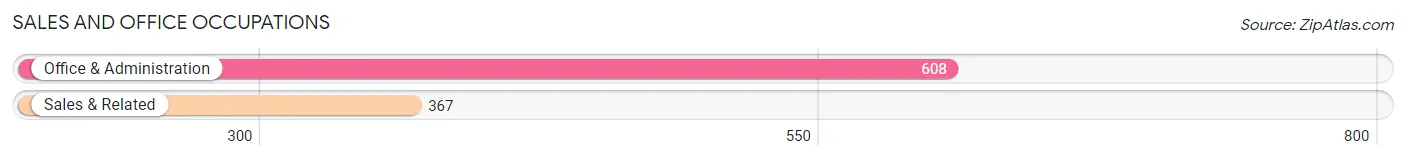
Sales and Office Occupations
The most common Sales and Office occupations in Battlefield are Office & Administration (608 | 18.3%), and Sales & Related (367 | 11.1%).
Sales and Office Occupations by Sex
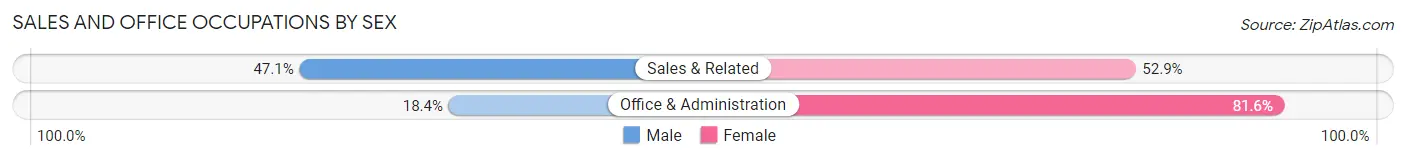
| Occupation | Male | Female |
| Sales & Related | 173 (47.1%) | 194 (52.9%) |
| Office & Administration | 112 (18.4%) | 496 (81.6%) |
| Total (Category) | 285 (29.2%) | 690 (70.8%) |
| Total (Overall) | 1,537 (46.4%) | 1,776 (53.6%) |
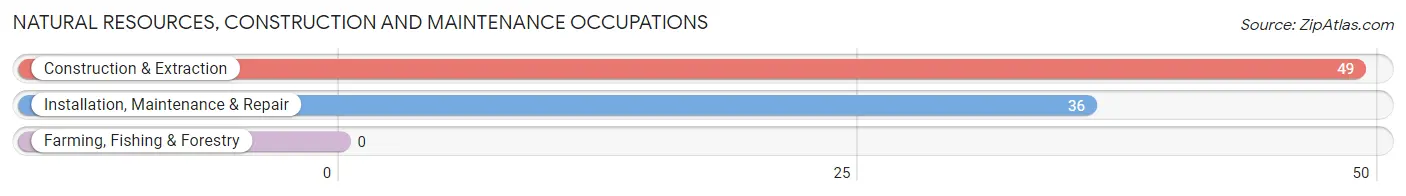
Natural Resources, Construction and Maintenance Occupations
The most common Natural Resources, Construction and Maintenance occupations in Battlefield are Construction & Extraction (49 | 1.5%), and Installation, Maintenance & Repair (36 | 1.1%).
Natural Resources, Construction and Maintenance Occupations by Sex
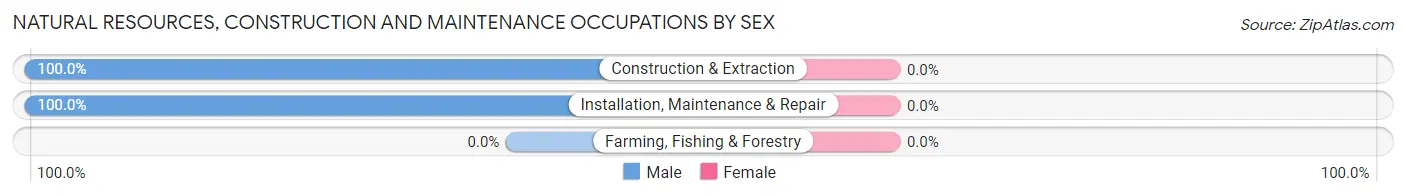
| Occupation | Male | Female |
| Farming, Fishing & Forestry | 0 (0.0%) | 0 (0.0%) |
| Construction & Extraction | 49 (100.0%) | 0 (0.0%) |
| Installation, Maintenance & Repair | 36 (100.0%) | 0 (0.0%) |
| Total (Category) | 85 (100.0%) | 0 (0.0%) |
| Total (Overall) | 1,537 (46.4%) | 1,776 (53.6%) |
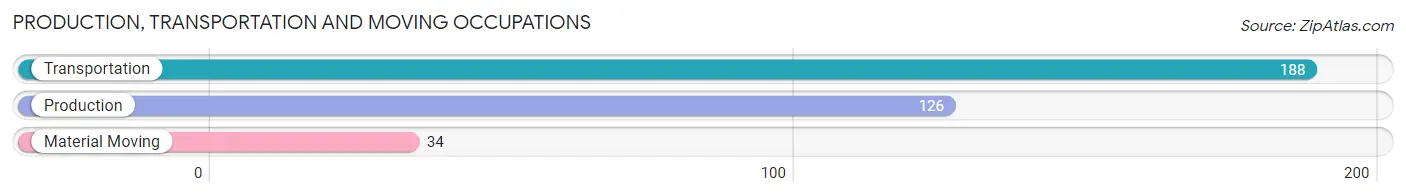
Production, Transportation and Moving Occupations
The most common Production, Transportation and Moving occupations in Battlefield are Transportation (188 | 5.7%), Production (126 | 3.8%), and Material Moving (34 | 1.0%).
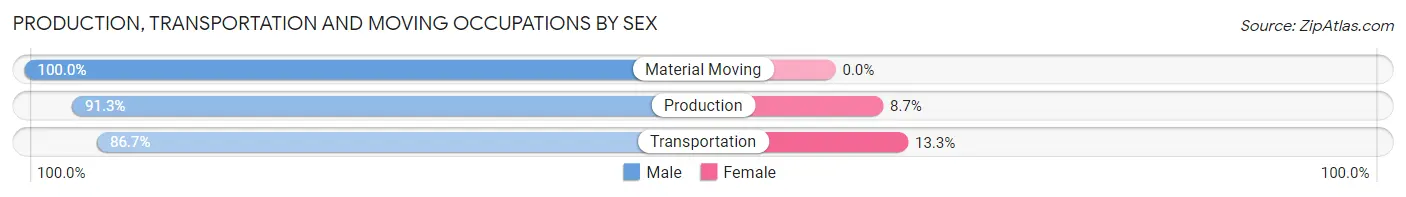
Production, Transportation and Moving Occupations by Sex
| Occupation | Male | Female |
| Production | 115 (91.3%) | 11 (8.7%) |
| Transportation | 163 (86.7%) | 25 (13.3%) |
| Material Moving | 34 (100.0%) | 0 (0.0%) |
| Total (Category) | 312 (89.7%) | 36 (10.3%) |
| Total (Overall) | 1,537 (46.4%) | 1,776 (53.6%) |
Employment Industries by Sex in Battlefield
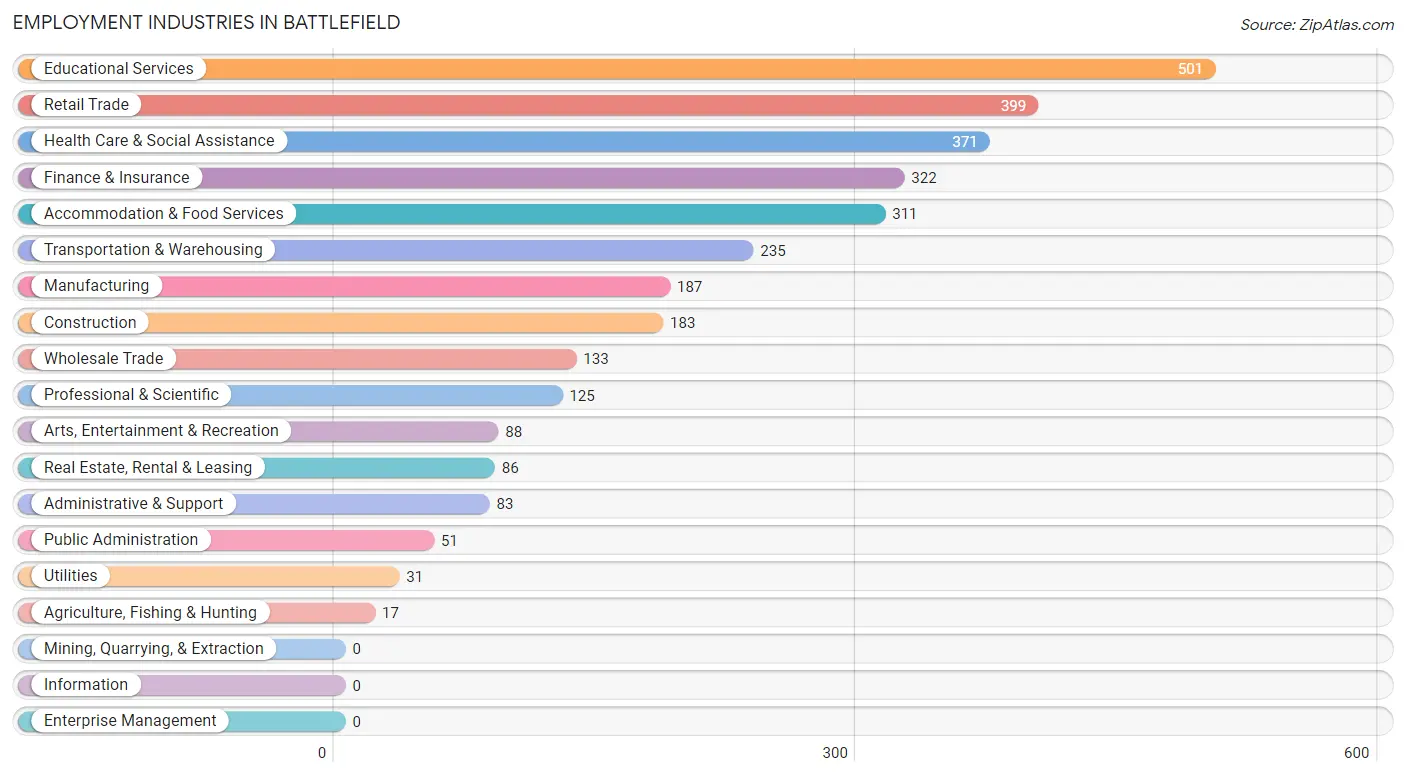
Employment Industries in Battlefield
The major employment industries in Battlefield include Educational Services (501 | 15.1%), Retail Trade (399 | 12.0%), Health Care & Social Assistance (371 | 11.2%), Finance & Insurance (322 | 9.7%), and Accommodation & Food Services (311 | 9.4%).
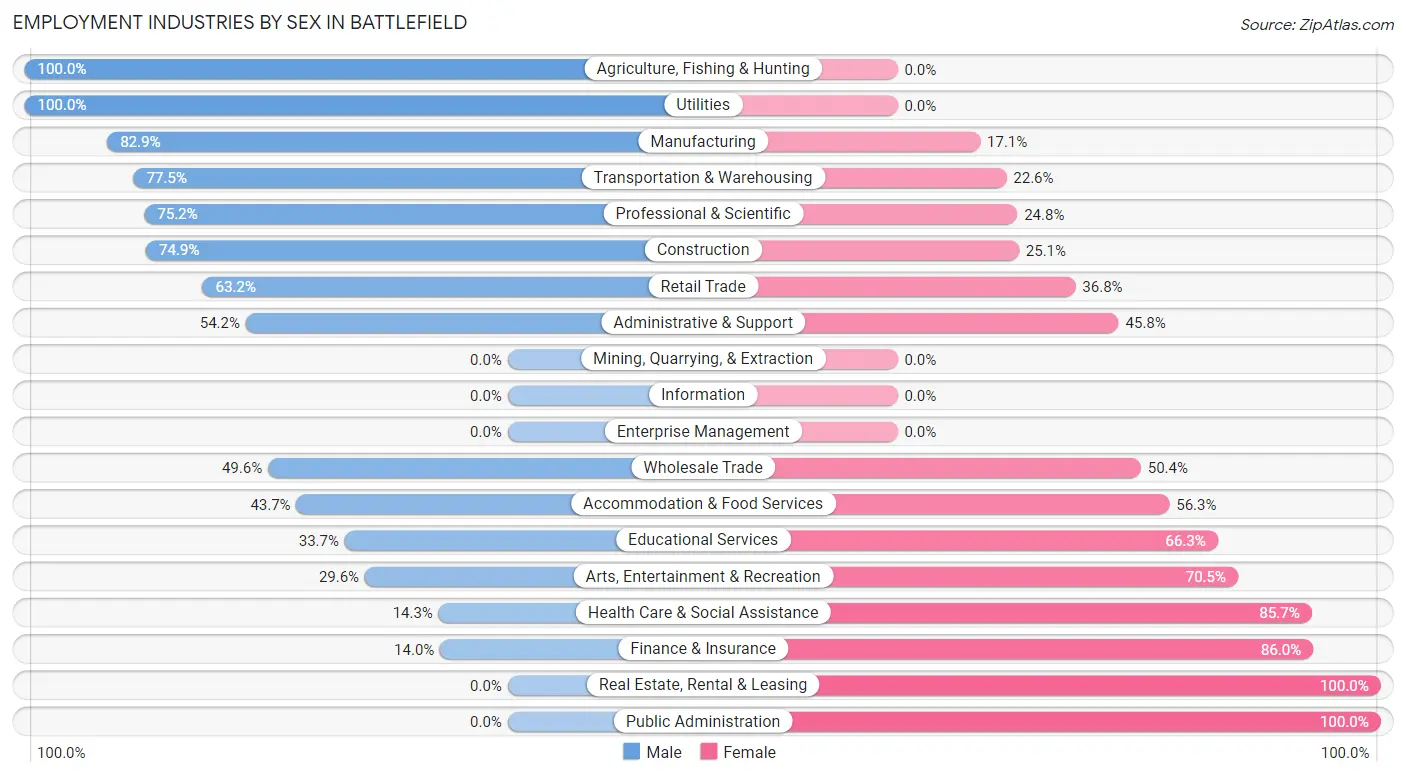
Employment Industries by Sex in Battlefield
The Battlefield industries that see more men than women are Agriculture, Fishing & Hunting (100.0%), Utilities (100.0%), and Manufacturing (82.9%), whereas the industries that tend to have a higher number of women are Real Estate, Rental & Leasing (100.0%), Public Administration (100.0%), and Finance & Insurance (86.0%).
| Industry | Male | Female |
| Agriculture, Fishing & Hunting | 17 (100.0%) | 0 (0.0%) |
| Mining, Quarrying, & Extraction | 0 (0.0%) | 0 (0.0%) |
| Construction | 137 (74.9%) | 46 (25.1%) |
| Manufacturing | 155 (82.9%) | 32 (17.1%) |
| Wholesale Trade | 66 (49.6%) | 67 (50.4%) |
| Retail Trade | 252 (63.2%) | 147 (36.8%) |
| Transportation & Warehousing | 182 (77.4%) | 53 (22.6%) |
| Utilities | 31 (100.0%) | 0 (0.0%) |
| Information | 0 (0.0%) | 0 (0.0%) |
| Finance & Insurance | 45 (14.0%) | 277 (86.0%) |
| Real Estate, Rental & Leasing | 0 (0.0%) | 86 (100.0%) |
| Professional & Scientific | 94 (75.2%) | 31 (24.8%) |
| Enterprise Management | 0 (0.0%) | 0 (0.0%) |
| Administrative & Support | 45 (54.2%) | 38 (45.8%) |
| Educational Services | 169 (33.7%) | 332 (66.3%) |
| Health Care & Social Assistance | 53 (14.3%) | 318 (85.7%) |
| Arts, Entertainment & Recreation | 26 (29.5%) | 62 (70.5%) |
| Accommodation & Food Services | 136 (43.7%) | 175 (56.3%) |
| Public Administration | 0 (0.0%) | 51 (100.0%) |
| Total | 1,537 (46.4%) | 1,776 (53.6%) |
Education in Battlefield
School Enrollment in Battlefield
The most common levels of schooling among the 1,484 students in Battlefield are middle school (389 | 26.2%), high school (331 | 22.3%), and college / undergraduate (269 | 18.1%).
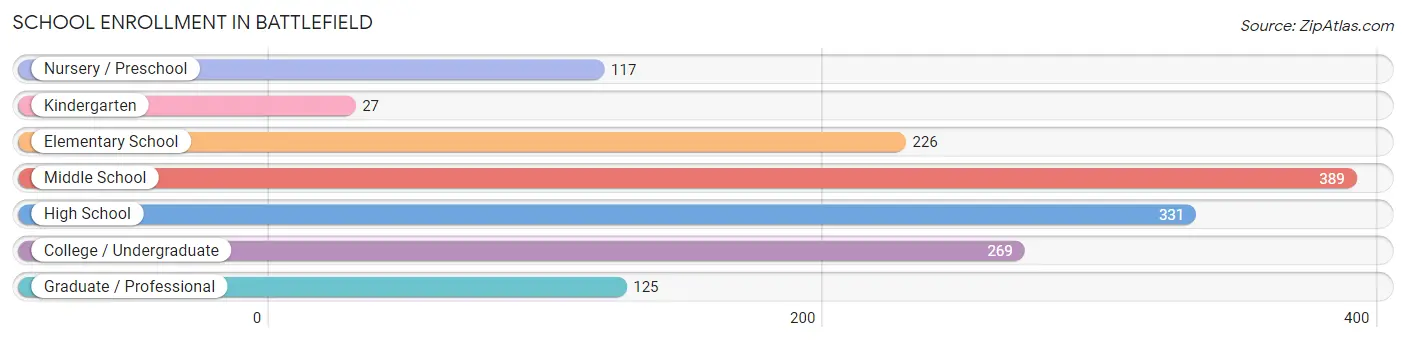
| School Level | # Students | % Students |
| Nursery / Preschool | 117 | 7.9% |
| Kindergarten | 27 | 1.8% |
| Elementary School | 226 | 15.2% |
| Middle School | 389 | 26.2% |
| High School | 331 | 22.3% |
| College / Undergraduate | 269 | 18.1% |
| Graduate / Professional | 125 | 8.4% |
| Total | 1,484 | 100.0% |
School Enrollment by Age by Funding Source in Battlefield
Out of a total of 1,484 students who are enrolled in schools in Battlefield, 131 (8.8%) attend a private institution, while the remaining 1,353 (91.2%) are enrolled in public schools. The age group of 35 years and over has the highest likelihood of being enrolled in private schools, with 63 (69.2% in the age bracket) enrolled. Conversely, the age group of 5 to 9 year old has the lowest likelihood of being enrolled in a private school, with 235 (100.0% in the age bracket) attending a public institution.
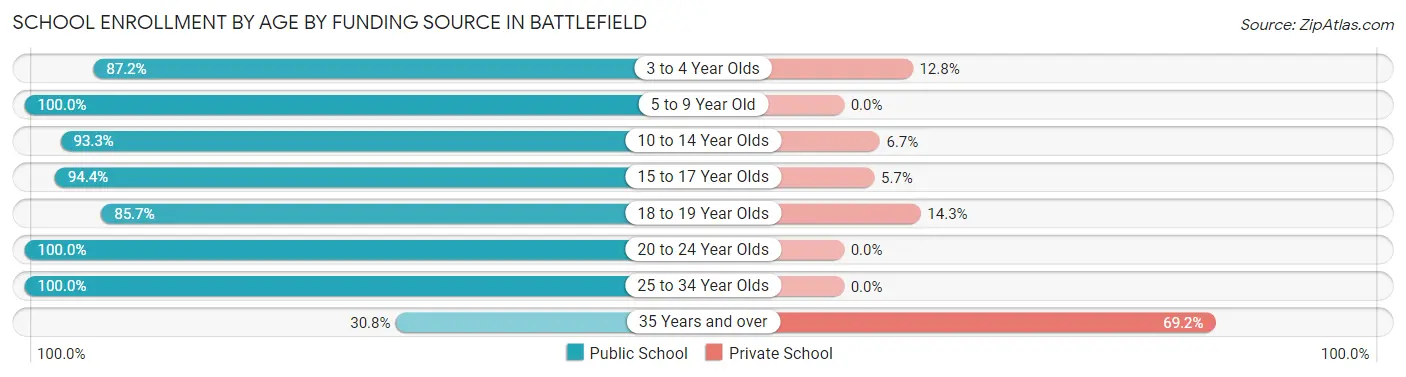
| Age Bracket | Public School | Private School |
| 3 to 4 Year Olds | 102 (87.2%) | 15 (12.8%) |
| 5 to 9 Year Old | 235 (100.0%) | 0 (0.0%) |
| 10 to 14 Year Olds | 419 (93.3%) | 30 (6.7%) |
| 15 to 17 Year Olds | 267 (94.4%) | 16 (5.7%) |
| 18 to 19 Year Olds | 42 (85.7%) | 7 (14.3%) |
| 20 to 24 Year Olds | 187 (100.0%) | 0 (0.0%) |
| 25 to 34 Year Olds | 73 (100.0%) | 0 (0.0%) |
| 35 Years and over | 28 (30.8%) | 63 (69.2%) |
| Total | 1,353 (91.2%) | 131 (8.8%) |
Educational Attainment by Field of Study in Battlefield
Business (464 | 26.3%), education (380 | 21.6%), science & technology (167 | 9.5%), arts & humanities (151 | 8.6%), and social sciences (148 | 8.4%) are the most common fields of study among 1,762 individuals in Battlefield who have obtained a bachelor's degree or higher.
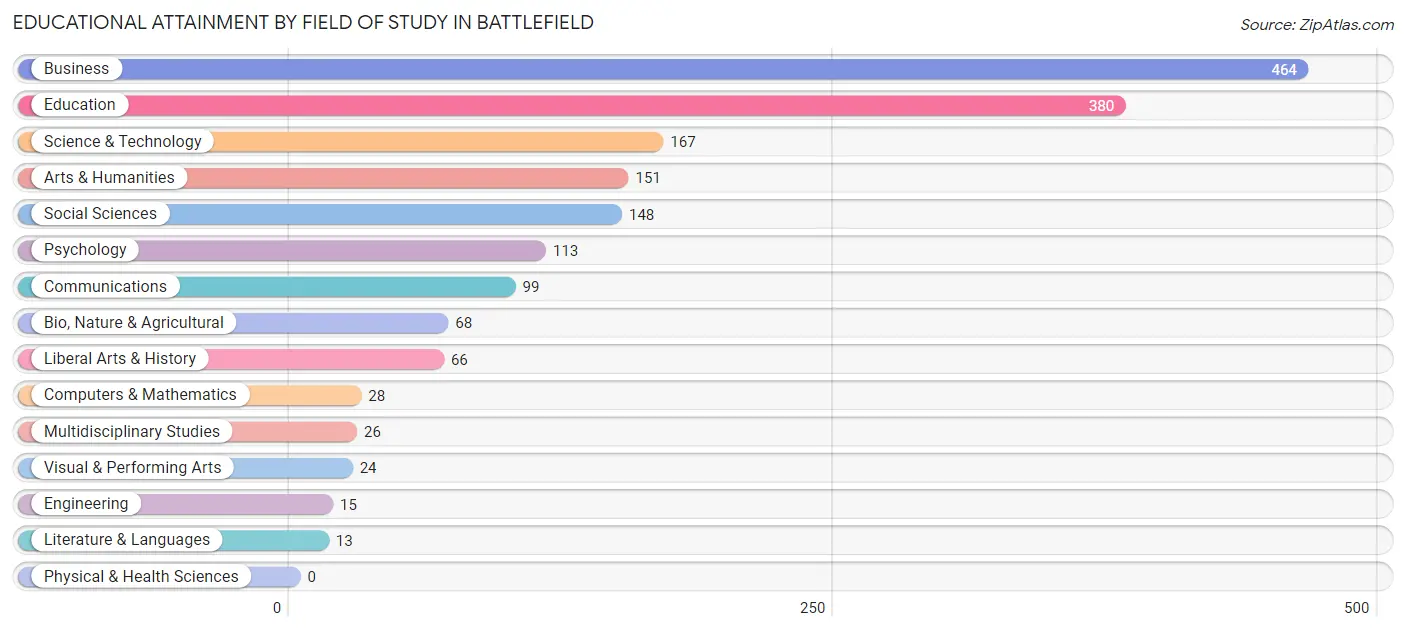
| Field of Study | # Graduates | % Graduates |
| Computers & Mathematics | 28 | 1.6% |
| Bio, Nature & Agricultural | 68 | 3.9% |
| Physical & Health Sciences | 0 | 0.0% |
| Psychology | 113 | 6.4% |
| Social Sciences | 148 | 8.4% |
| Engineering | 15 | 0.9% |
| Multidisciplinary Studies | 26 | 1.5% |
| Science & Technology | 167 | 9.5% |
| Business | 464 | 26.3% |
| Education | 380 | 21.6% |
| Literature & Languages | 13 | 0.7% |
| Liberal Arts & History | 66 | 3.7% |
| Visual & Performing Arts | 24 | 1.4% |
| Communications | 99 | 5.6% |
| Arts & Humanities | 151 | 8.6% |
| Total | 1,762 | 100.0% |
Transportation & Commute in Battlefield
Vehicle Availability by Sex in Battlefield
The most prevalent vehicle ownership categories in Battlefield are males with 2 vehicles (603, accounting for 39.2%) and females with 2 vehicles (813, making up 34.4%).
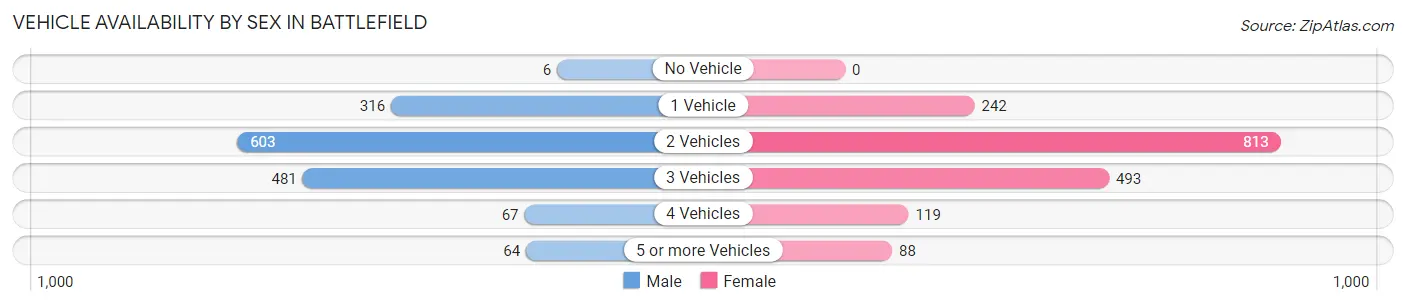
| Vehicles Available | Male | Female |
| No Vehicle | 6 (0.4%) | 0 (0.0%) |
| 1 Vehicle | 316 (20.6%) | 242 (13.8%) |
| 2 Vehicles | 603 (39.2%) | 813 (46.3%) |
| 3 Vehicles | 481 (31.3%) | 493 (28.1%) |
| 4 Vehicles | 67 (4.4%) | 119 (6.8%) |
| 5 or more Vehicles | 64 (4.2%) | 88 (5.0%) |
| Total | 1,537 (100.0%) | 1,755 (100.0%) |
Commute Time in Battlefield
The most frequently occuring commute durations in Battlefield are 20 to 24 minutes (752 commuters, 26.1%), 15 to 19 minutes (622 commuters, 21.6%), and 30 to 34 minutes (352 commuters, 12.2%).
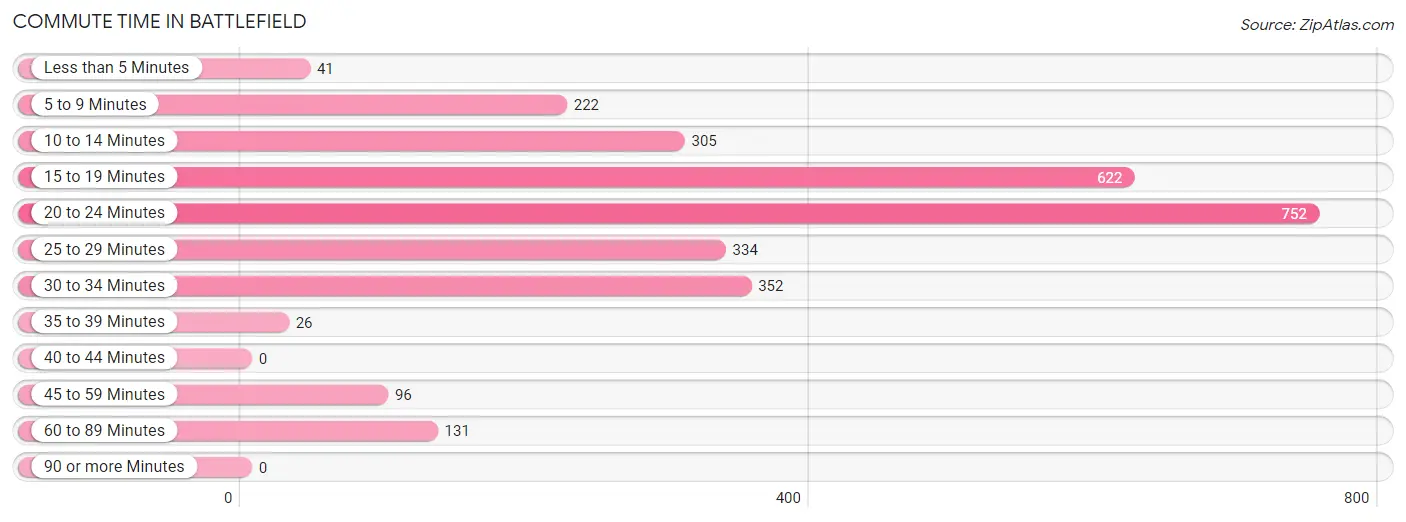
| Commute Time | # Commuters | % Commuters |
| Less than 5 Minutes | 41 | 1.4% |
| 5 to 9 Minutes | 222 | 7.7% |
| 10 to 14 Minutes | 305 | 10.6% |
| 15 to 19 Minutes | 622 | 21.6% |
| 20 to 24 Minutes | 752 | 26.1% |
| 25 to 29 Minutes | 334 | 11.6% |
| 30 to 34 Minutes | 352 | 12.2% |
| 35 to 39 Minutes | 26 | 0.9% |
| 40 to 44 Minutes | 0 | 0.0% |
| 45 to 59 Minutes | 96 | 3.3% |
| 60 to 89 Minutes | 131 | 4.5% |
| 90 or more Minutes | 0 | 0.0% |
Commute Time by Sex in Battlefield
The most common commute times in Battlefield are 20 to 24 minutes (342 commuters, 23.7%) for males and 20 to 24 minutes (410 commuters, 28.5%) for females.
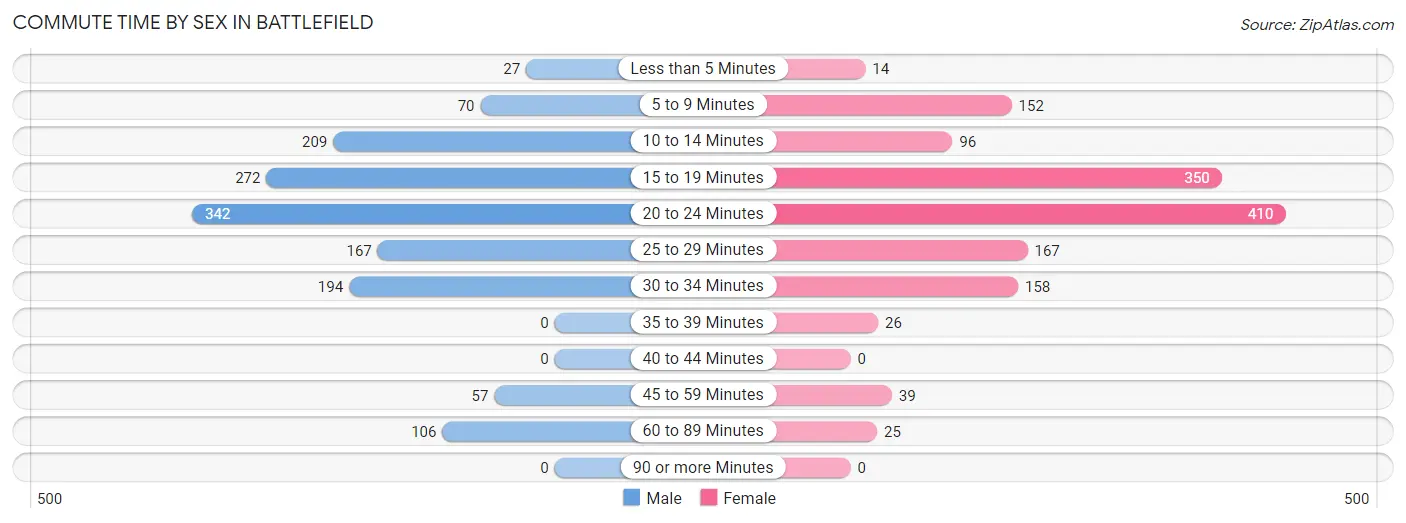
| Commute Time | Male | Female |
| Less than 5 Minutes | 27 (1.9%) | 14 (1.0%) |
| 5 to 9 Minutes | 70 (4.9%) | 152 (10.6%) |
| 10 to 14 Minutes | 209 (14.5%) | 96 (6.7%) |
| 15 to 19 Minutes | 272 (18.8%) | 350 (24.4%) |
| 20 to 24 Minutes | 342 (23.7%) | 410 (28.5%) |
| 25 to 29 Minutes | 167 (11.6%) | 167 (11.6%) |
| 30 to 34 Minutes | 194 (13.4%) | 158 (11.0%) |
| 35 to 39 Minutes | 0 (0.0%) | 26 (1.8%) |
| 40 to 44 Minutes | 0 (0.0%) | 0 (0.0%) |
| 45 to 59 Minutes | 57 (4.0%) | 39 (2.7%) |
| 60 to 89 Minutes | 106 (7.3%) | 25 (1.7%) |
| 90 or more Minutes | 0 (0.0%) | 0 (0.0%) |
Time of Departure to Work by Sex in Battlefield
The most frequent times of departure to work in Battlefield are 6:00 AM to 6:29 AM (238, 16.5%) for males and 7:30 AM to 7:59 AM (554, 38.6%) for females.
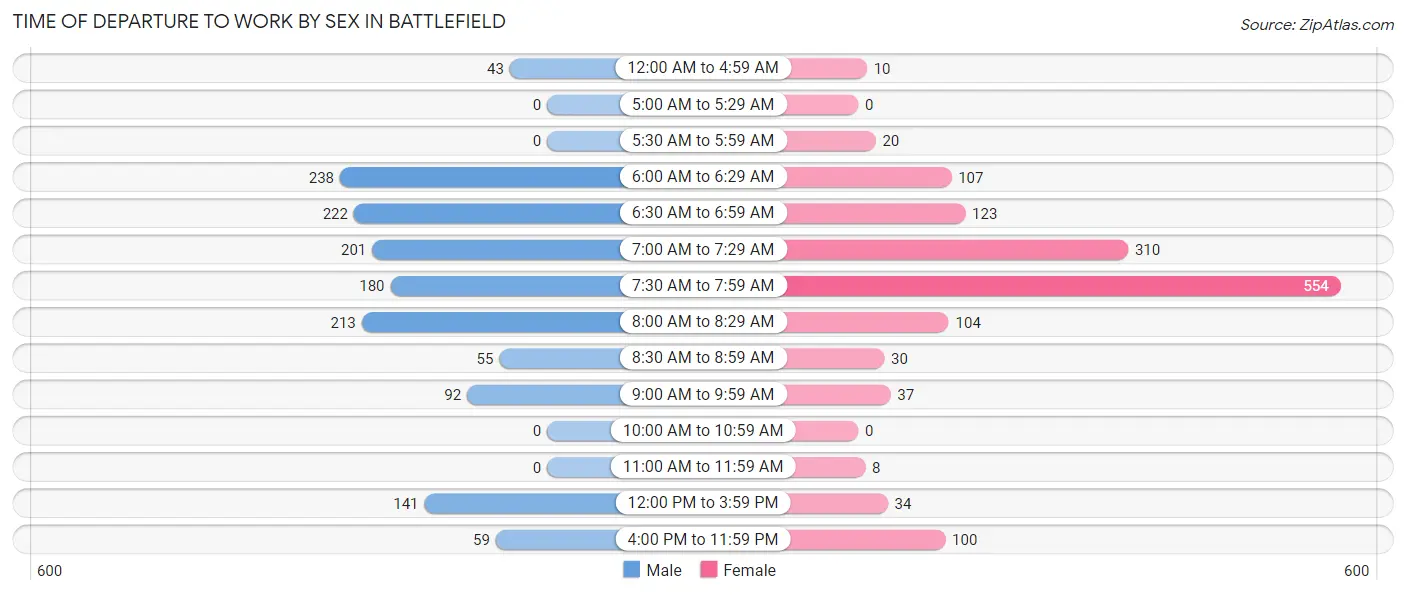
| Time of Departure | Male | Female |
| 12:00 AM to 4:59 AM | 43 (3.0%) | 10 (0.7%) |
| 5:00 AM to 5:29 AM | 0 (0.0%) | 0 (0.0%) |
| 5:30 AM to 5:59 AM | 0 (0.0%) | 20 (1.4%) |
| 6:00 AM to 6:29 AM | 238 (16.5%) | 107 (7.4%) |
| 6:30 AM to 6:59 AM | 222 (15.4%) | 123 (8.6%) |
| 7:00 AM to 7:29 AM | 201 (13.9%) | 310 (21.6%) |
| 7:30 AM to 7:59 AM | 180 (12.5%) | 554 (38.6%) |
| 8:00 AM to 8:29 AM | 213 (14.7%) | 104 (7.2%) |
| 8:30 AM to 8:59 AM | 55 (3.8%) | 30 (2.1%) |
| 9:00 AM to 9:59 AM | 92 (6.4%) | 37 (2.6%) |
| 10:00 AM to 10:59 AM | 0 (0.0%) | 0 (0.0%) |
| 11:00 AM to 11:59 AM | 0 (0.0%) | 8 (0.6%) |
| 12:00 PM to 3:59 PM | 141 (9.8%) | 34 (2.4%) |
| 4:00 PM to 11:59 PM | 59 (4.1%) | 100 (7.0%) |
| Total | 1,444 (100.0%) | 1,437 (100.0%) |
Housing Occupancy in Battlefield
Occupancy by Ownership in Battlefield
Of the total 2,566 dwellings in Battlefield, owner-occupied units account for 2,159 (84.1%), while renter-occupied units make up 407 (15.9%).
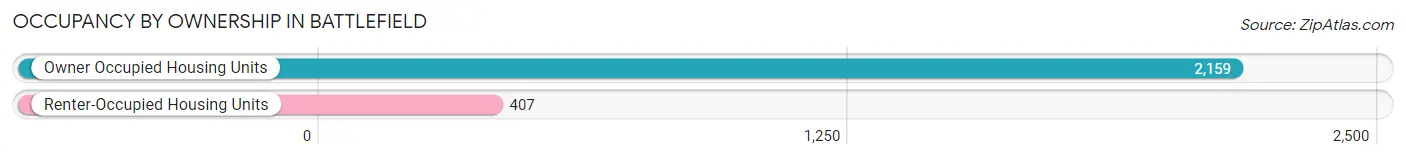
| Occupancy | # Housing Units | % Housing Units |
| Owner Occupied Housing Units | 2,159 | 84.1% |
| Renter-Occupied Housing Units | 407 | 15.9% |
| Total Occupied Housing Units | 2,566 | 100.0% |
Occupancy by Household Size in Battlefield
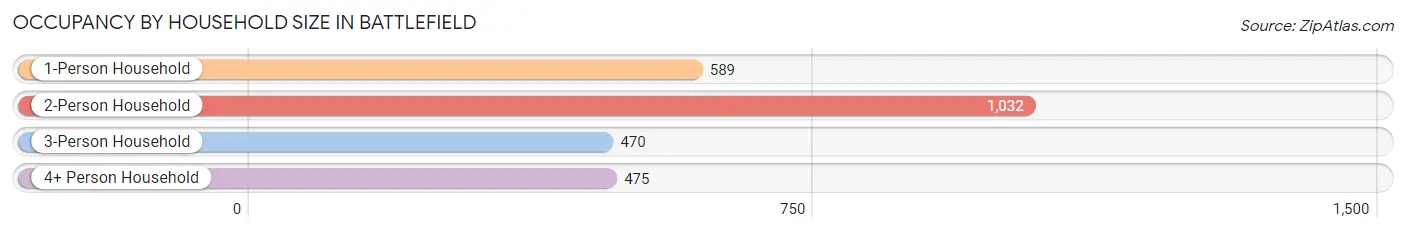
| Household Size | # Housing Units | % Housing Units |
| 1-Person Household | 589 | 23.0% |
| 2-Person Household | 1,032 | 40.2% |
| 3-Person Household | 470 | 18.3% |
| 4+ Person Household | 475 | 18.5% |
| Total Housing Units | 2,566 | 100.0% |
Occupancy by Ownership by Household Size in Battlefield
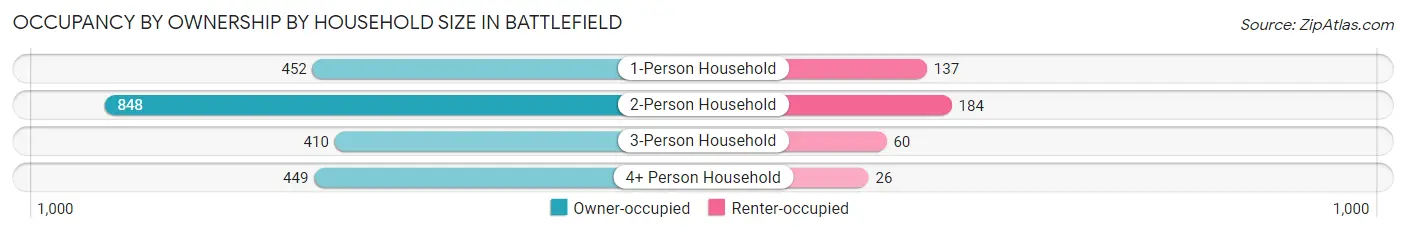
| Household Size | Owner-occupied | Renter-occupied |
| 1-Person Household | 452 (76.7%) | 137 (23.3%) |
| 2-Person Household | 848 (82.2%) | 184 (17.8%) |
| 3-Person Household | 410 (87.2%) | 60 (12.8%) |
| 4+ Person Household | 449 (94.5%) | 26 (5.5%) |
| Total Housing Units | 2,159 (84.1%) | 407 (15.9%) |
Occupancy by Educational Attainment in Battlefield
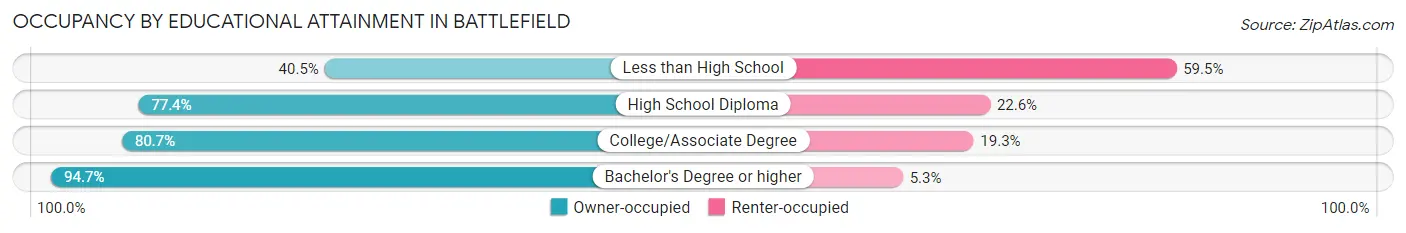
| Household Size | Owner-occupied | Renter-occupied |
| Less than High School | 32 (40.5%) | 47 (59.5%) |
| High School Diploma | 453 (77.4%) | 132 (22.6%) |
| College/Associate Degree | 737 (80.7%) | 176 (19.3%) |
| Bachelor's Degree or higher | 937 (94.7%) | 52 (5.3%) |
Occupancy by Age of Householder in Battlefield
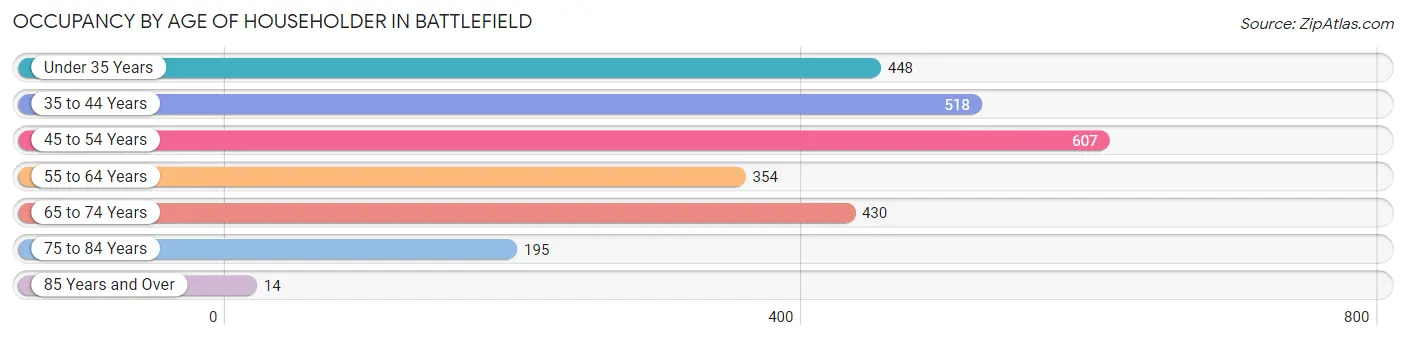
| Age Bracket | # Households | % Households |
| Under 35 Years | 448 | 17.5% |
| 35 to 44 Years | 518 | 20.2% |
| 45 to 54 Years | 607 | 23.7% |
| 55 to 64 Years | 354 | 13.8% |
| 65 to 74 Years | 430 | 16.8% |
| 75 to 84 Years | 195 | 7.6% |
| 85 Years and Over | 14 | 0.5% |
| Total | 2,566 | 100.0% |
Housing Finances in Battlefield
Median Income by Occupancy in Battlefield
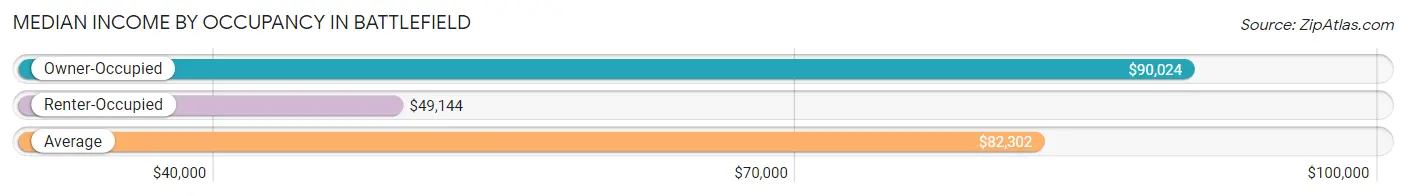
| Occupancy Type | # Households | Median Income |
| Owner-Occupied | 2,159 (84.1%) | $90,024 |
| Renter-Occupied | 407 (15.9%) | $49,144 |
| Average | 2,566 (100.0%) | $82,302 |
Occupancy by Householder Income Bracket in Battlefield
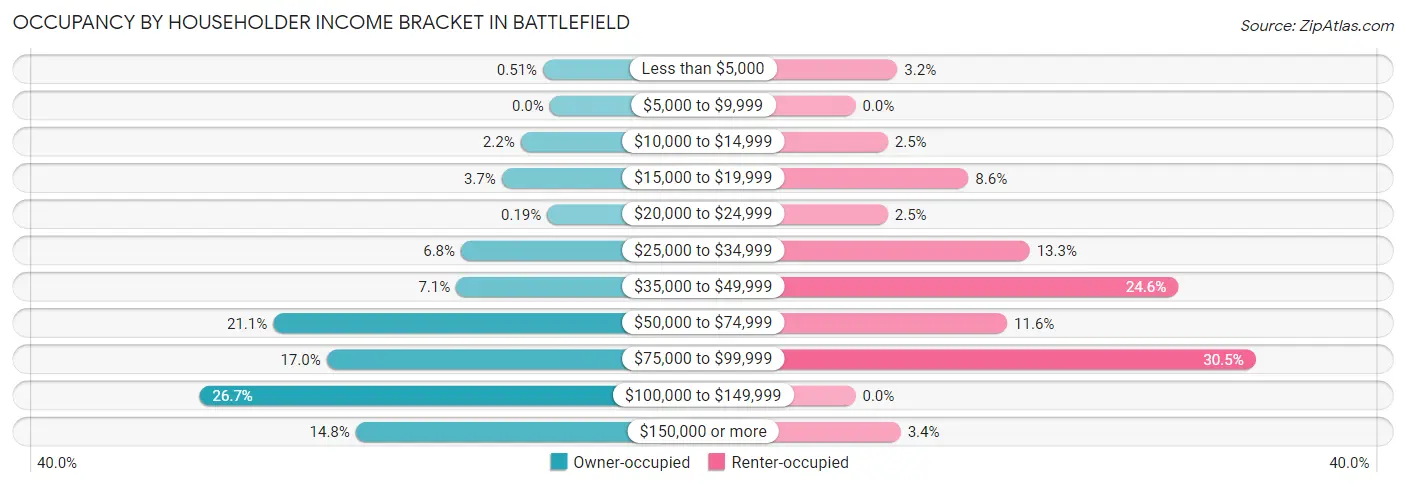
| Income Bracket | Owner-occupied | Renter-occupied |
| Less than $5,000 | 11 (0.5%) | 13 (3.2%) |
| $5,000 to $9,999 | 0 (0.0%) | 0 (0.0%) |
| $10,000 to $14,999 | 48 (2.2%) | 10 (2.5%) |
| $15,000 to $19,999 | 79 (3.7%) | 35 (8.6%) |
| $20,000 to $24,999 | 4 (0.2%) | 10 (2.5%) |
| $25,000 to $34,999 | 146 (6.8%) | 54 (13.3%) |
| $35,000 to $49,999 | 154 (7.1%) | 100 (24.6%) |
| $50,000 to $74,999 | 455 (21.1%) | 47 (11.6%) |
| $75,000 to $99,999 | 367 (17.0%) | 124 (30.5%) |
| $100,000 to $149,999 | 576 (26.7%) | 0 (0.0%) |
| $150,000 or more | 319 (14.8%) | 14 (3.4%) |
| Total | 2,159 (100.0%) | 407 (100.0%) |
Monthly Housing Cost Tiers in Battlefield
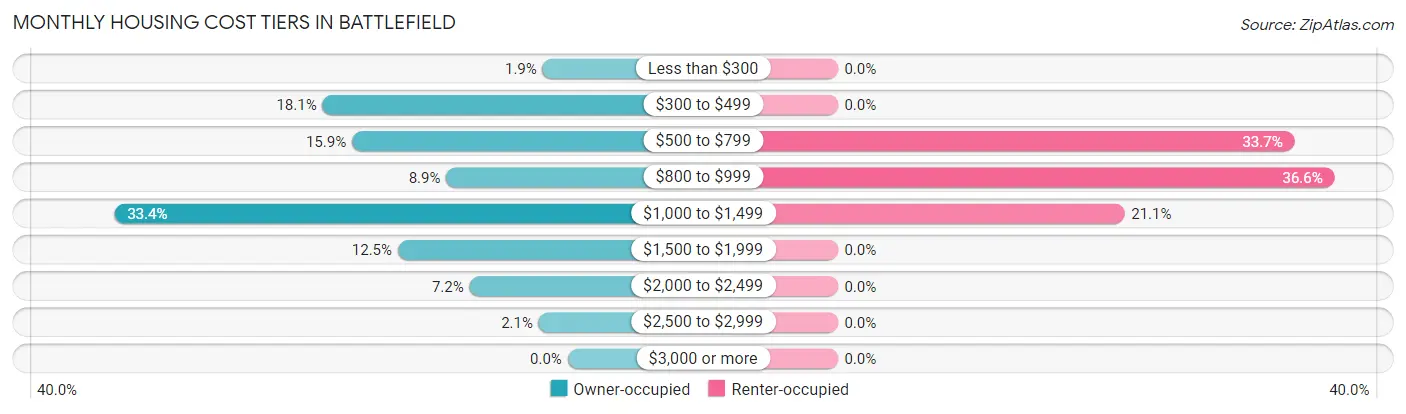
| Monthly Cost | Owner-occupied | Renter-occupied |
| Less than $300 | 40 (1.8%) | 0 (0.0%) |
| $300 to $499 | 390 (18.1%) | 0 (0.0%) |
| $500 to $799 | 343 (15.9%) | 137 (33.7%) |
| $800 to $999 | 193 (8.9%) | 149 (36.6%) |
| $1,000 to $1,499 | 721 (33.4%) | 86 (21.1%) |
| $1,500 to $1,999 | 270 (12.5%) | 0 (0.0%) |
| $2,000 to $2,499 | 156 (7.2%) | 0 (0.0%) |
| $2,500 to $2,999 | 46 (2.1%) | 0 (0.0%) |
| $3,000 or more | 0 (0.0%) | 0 (0.0%) |
| Total | 2,159 (100.0%) | 407 (100.0%) |
Physical Housing Characteristics in Battlefield
Housing Structures in Battlefield
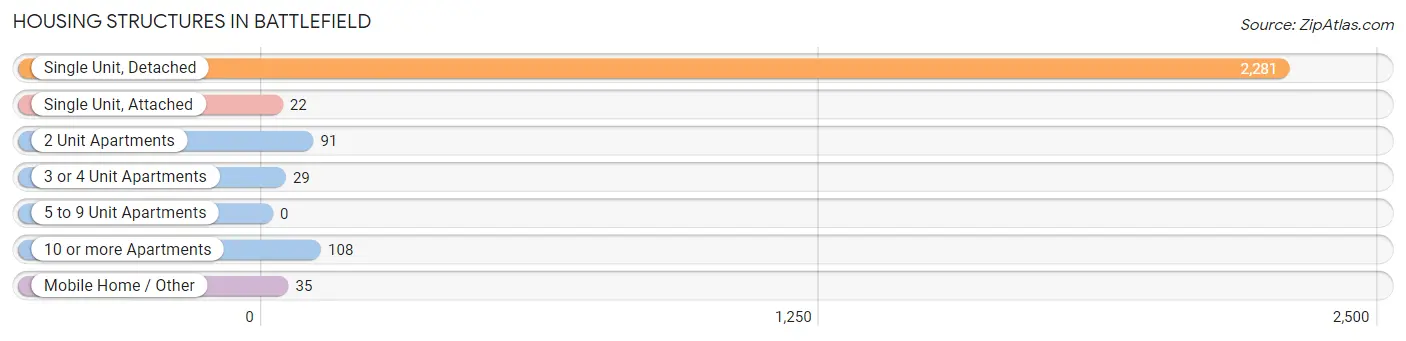
| Structure Type | # Housing Units | % Housing Units |
| Single Unit, Detached | 2,281 | 88.9% |
| Single Unit, Attached | 22 | 0.9% |
| 2 Unit Apartments | 91 | 3.5% |
| 3 or 4 Unit Apartments | 29 | 1.1% |
| 5 to 9 Unit Apartments | 0 | 0.0% |
| 10 or more Apartments | 108 | 4.2% |
| Mobile Home / Other | 35 | 1.4% |
| Total | 2,566 | 100.0% |
Housing Structures by Occupancy in Battlefield
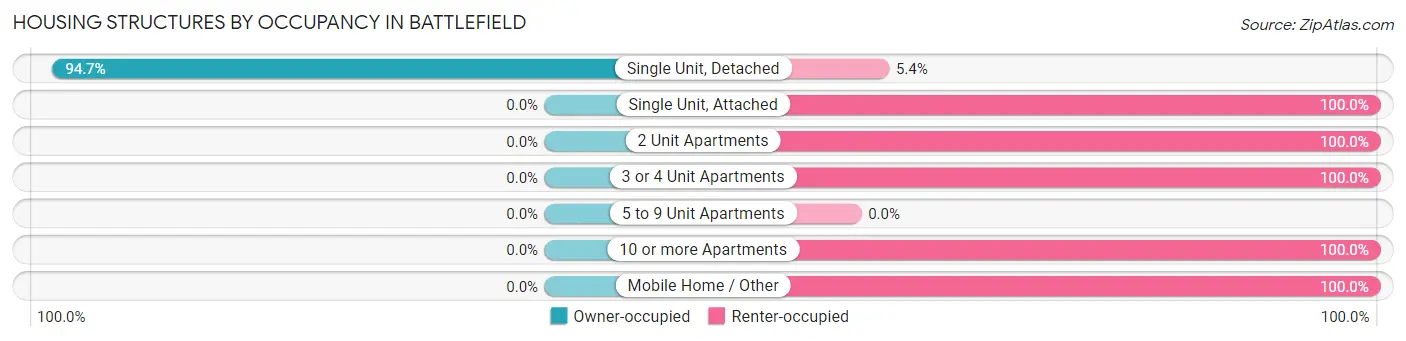
| Structure Type | Owner-occupied | Renter-occupied |
| Single Unit, Detached | 2,159 (94.7%) | 122 (5.3%) |
| Single Unit, Attached | 0 (0.0%) | 22 (100.0%) |
| 2 Unit Apartments | 0 (0.0%) | 91 (100.0%) |
| 3 or 4 Unit Apartments | 0 (0.0%) | 29 (100.0%) |
| 5 to 9 Unit Apartments | 0 (0.0%) | 0 (0.0%) |
| 10 or more Apartments | 0 (0.0%) | 108 (100.0%) |
| Mobile Home / Other | 0 (0.0%) | 35 (100.0%) |
| Total | 2,159 (84.1%) | 407 (15.9%) |
Housing Structures by Number of Rooms in Battlefield
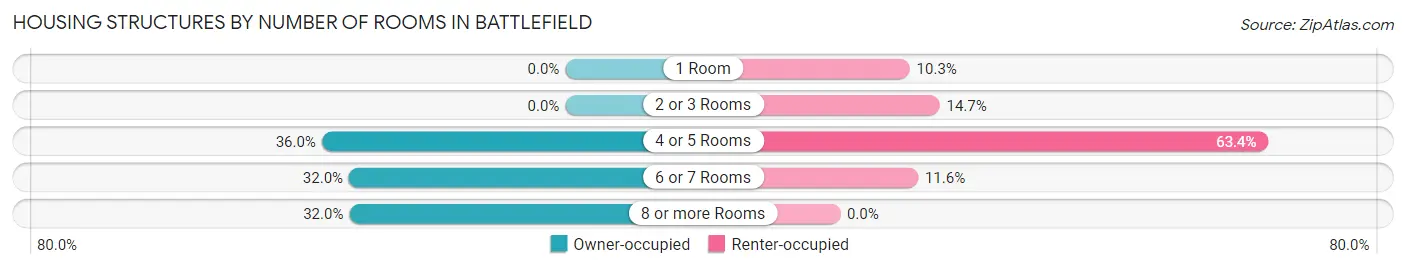
| Number of Rooms | Owner-occupied | Renter-occupied |
| 1 Room | 0 (0.0%) | 42 (10.3%) |
| 2 or 3 Rooms | 0 (0.0%) | 60 (14.7%) |
| 4 or 5 Rooms | 778 (36.0%) | 258 (63.4%) |
| 6 or 7 Rooms | 691 (32.0%) | 47 (11.6%) |
| 8 or more Rooms | 690 (32.0%) | 0 (0.0%) |
| Total | 2,159 (100.0%) | 407 (100.0%) |
Housing Structure by Heating Type in Battlefield
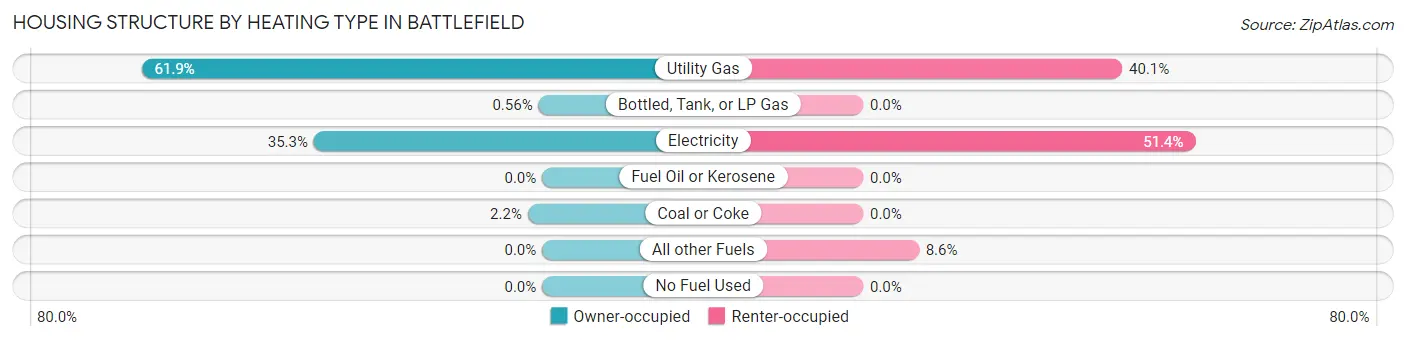
| Heating Type | Owner-occupied | Renter-occupied |
| Utility Gas | 1,337 (61.9%) | 163 (40.1%) |
| Bottled, Tank, or LP Gas | 12 (0.6%) | 0 (0.0%) |
| Electricity | 762 (35.3%) | 209 (51.3%) |
| Fuel Oil or Kerosene | 0 (0.0%) | 0 (0.0%) |
| Coal or Coke | 48 (2.2%) | 0 (0.0%) |
| All other Fuels | 0 (0.0%) | 35 (8.6%) |
| No Fuel Used | 0 (0.0%) | 0 (0.0%) |
| Total | 2,159 (100.0%) | 407 (100.0%) |
Household Vehicle Usage in Battlefield
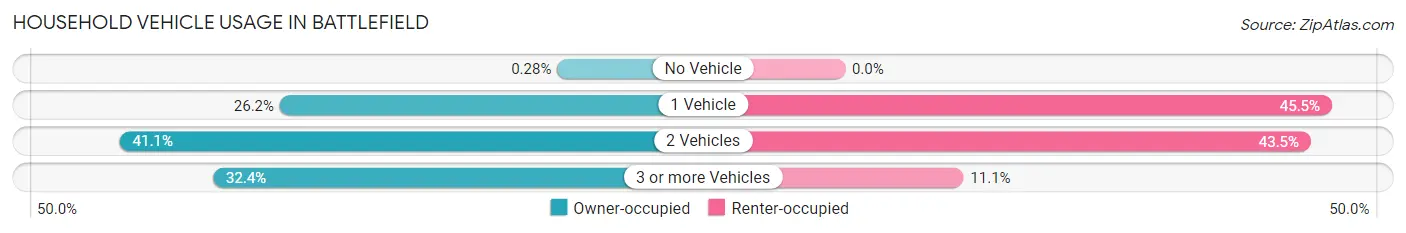
| Vehicles per Household | Owner-occupied | Renter-occupied |
| No Vehicle | 6 (0.3%) | 0 (0.0%) |
| 1 Vehicle | 565 (26.2%) | 185 (45.5%) |
| 2 Vehicles | 888 (41.1%) | 177 (43.5%) |
| 3 or more Vehicles | 700 (32.4%) | 45 (11.1%) |
| Total | 2,159 (100.0%) | 407 (100.0%) |
Real Estate & Mortgages in Battlefield
Real Estate and Mortgage Overview in Battlefield
| Characteristic | Without Mortgage | With Mortgage |
| Housing Units | 700 | 1,459 |
| Median Property Value | $187,100 | $192,500 |
| Median Household Income | $66,944 | $250 |
| Monthly Housing Costs | $479 | $0 |
| Real Estate Taxes | $1,654 | $0 |
Property Value by Mortgage Status in Battlefield
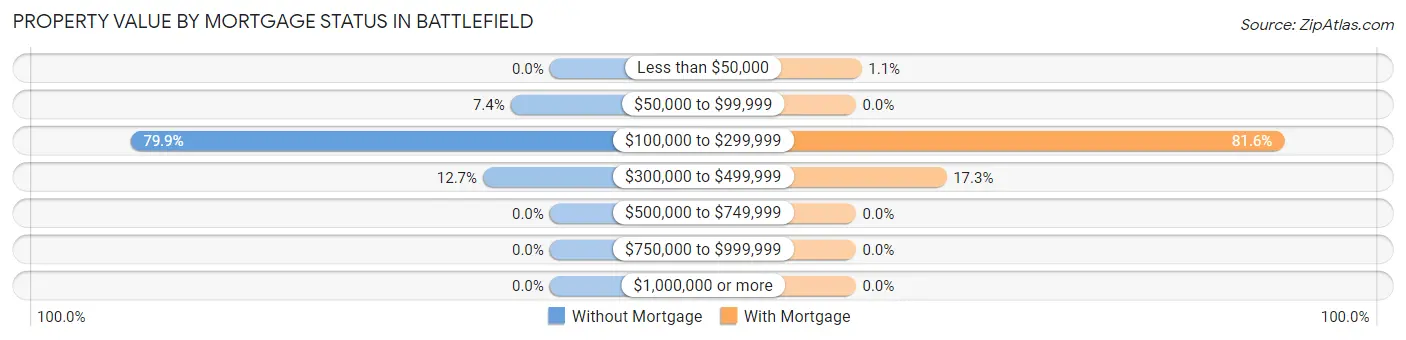
| Property Value | Without Mortgage | With Mortgage |
| Less than $50,000 | 0 (0.0%) | 16 (1.1%) |
| $50,000 to $99,999 | 52 (7.4%) | 0 (0.0%) |
| $100,000 to $299,999 | 559 (79.9%) | 1,191 (81.6%) |
| $300,000 to $499,999 | 89 (12.7%) | 252 (17.3%) |
| $500,000 to $749,999 | 0 (0.0%) | 0 (0.0%) |
| $750,000 to $999,999 | 0 (0.0%) | 0 (0.0%) |
| $1,000,000 or more | 0 (0.0%) | 0 (0.0%) |
| Total | 700 (100.0%) | 1,459 (100.0%) |
Household Income by Mortgage Status in Battlefield
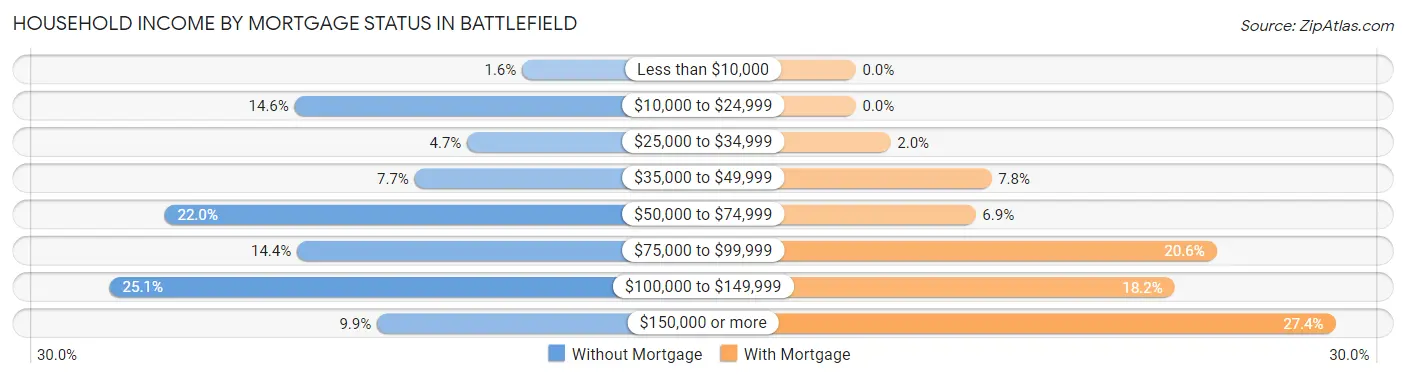
| Household Income | Without Mortgage | With Mortgage |
| Less than $10,000 | 11 (1.6%) | 0 (0.0%) |
| $10,000 to $24,999 | 102 (14.6%) | 0 (0.0%) |
| $25,000 to $34,999 | 33 (4.7%) | 29 (2.0%) |
| $35,000 to $49,999 | 54 (7.7%) | 113 (7.7%) |
| $50,000 to $74,999 | 154 (22.0%) | 100 (6.9%) |
| $75,000 to $99,999 | 101 (14.4%) | 301 (20.6%) |
| $100,000 to $149,999 | 176 (25.1%) | 266 (18.2%) |
| $150,000 or more | 69 (9.9%) | 400 (27.4%) |
| Total | 700 (100.0%) | 1,459 (100.0%) |
Property Value to Household Income Ratio in Battlefield
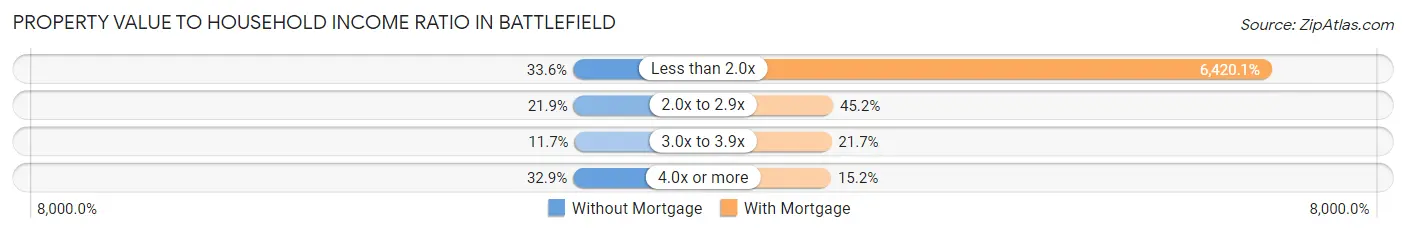
| Value-to-Income Ratio | Without Mortgage | With Mortgage |
| Less than 2.0x | 235 (33.6%) | 93,669 (6,420.1%) |
| 2.0x to 2.9x | 153 (21.9%) | 660 (45.2%) |
| 3.0x to 3.9x | 82 (11.7%) | 316 (21.7%) |
| 4.0x or more | 230 (32.9%) | 221 (15.1%) |
| Total | 700 (100.0%) | 1,459 (100.0%) |
Real Estate Taxes by Mortgage Status in Battlefield
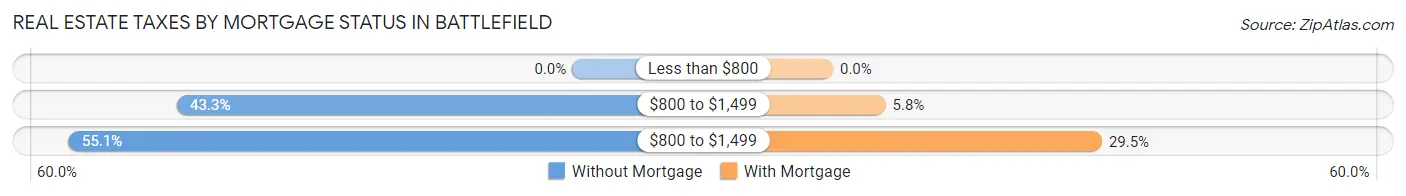
| Property Taxes | Without Mortgage | With Mortgage |
| Less than $800 | 0 (0.0%) | 0 (0.0%) |
| $800 to $1,499 | 303 (43.3%) | 84 (5.8%) |
| $800 to $1,499 | 386 (55.1%) | 430 (29.5%) |
| Total | 700 (100.0%) | 1,459 (100.0%) |
Health & Disability in Battlefield
Health Insurance Coverage by Age in Battlefield
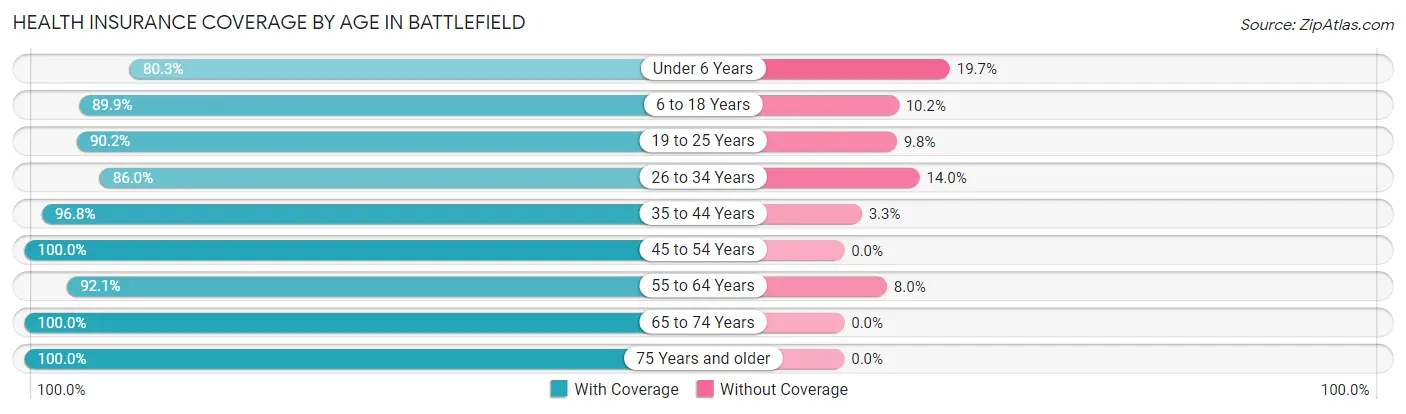
| Age Bracket | With Coverage | Without Coverage |
| Under 6 Years | 294 (80.3%) | 72 (19.7%) |
| 6 to 18 Years | 912 (89.8%) | 103 (10.2%) |
| 19 to 25 Years | 545 (90.2%) | 59 (9.8%) |
| 26 to 34 Years | 453 (86.0%) | 74 (14.0%) |
| 35 to 44 Years | 864 (96.8%) | 29 (3.3%) |
| 45 to 54 Years | 1,016 (100.0%) | 0 (0.0%) |
| 55 to 64 Years | 498 (92.0%) | 43 (8.0%) |
| 65 to 74 Years | 784 (100.0%) | 0 (0.0%) |
| 75 Years and older | 300 (100.0%) | 0 (0.0%) |
| Total | 5,666 (93.7%) | 380 (6.3%) |
Health Insurance Coverage by Citizenship Status in Battlefield
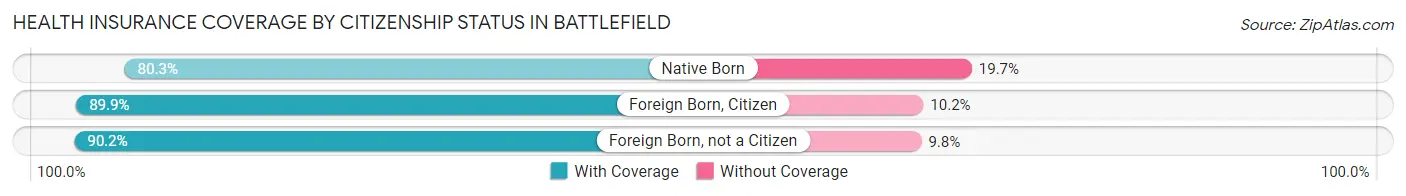
| Citizenship Status | With Coverage | Without Coverage |
| Native Born | 294 (80.3%) | 72 (19.7%) |
| Foreign Born, Citizen | 912 (89.8%) | 103 (10.2%) |
| Foreign Born, not a Citizen | 545 (90.2%) | 59 (9.8%) |
Health Insurance Coverage by Household Income in Battlefield
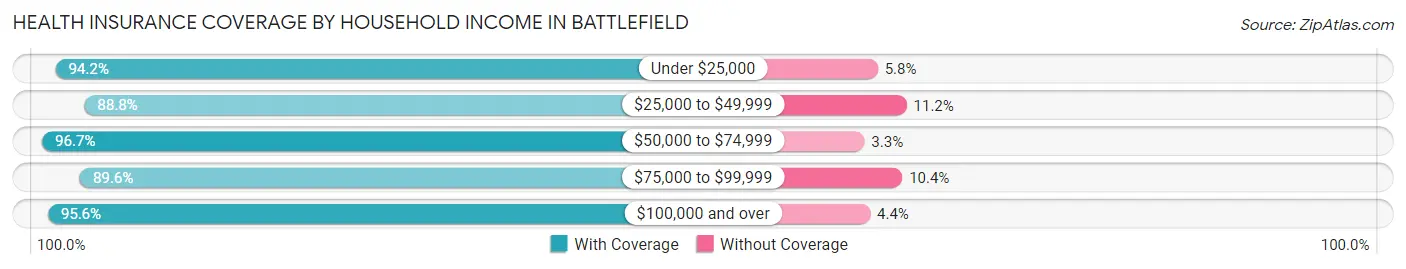
| Household Income | With Coverage | Without Coverage |
| Under $25,000 | 244 (94.2%) | 15 (5.8%) |
| $25,000 to $49,999 | 681 (88.8%) | 86 (11.2%) |
| $50,000 to $74,999 | 1,230 (96.7%) | 42 (3.3%) |
| $75,000 to $99,999 | 1,096 (89.6%) | 127 (10.4%) |
| $100,000 and over | 2,415 (95.6%) | 110 (4.4%) |
Public vs Private Health Insurance Coverage by Age in Battlefield
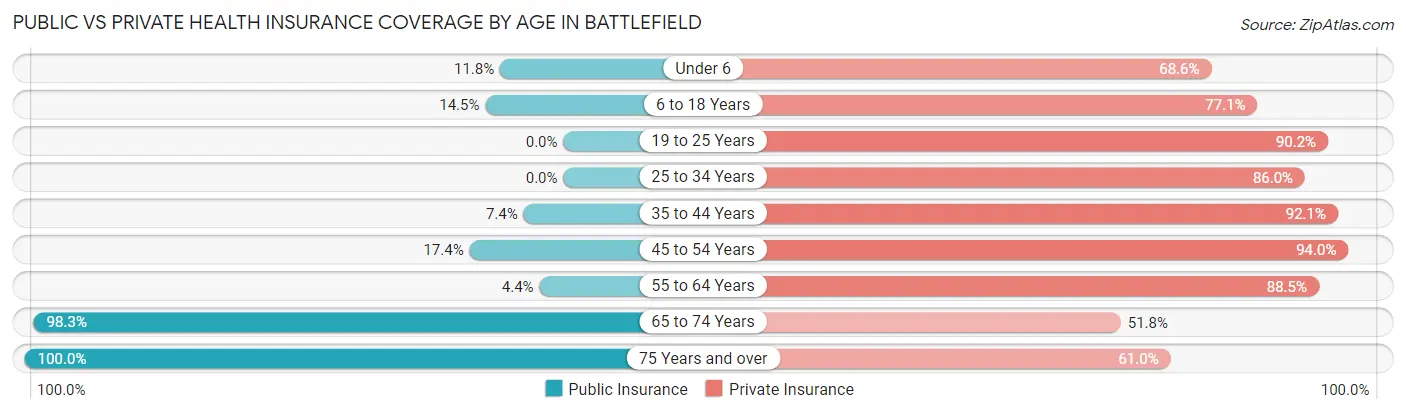
| Age Bracket | Public Insurance | Private Insurance |
| Under 6 | 43 (11.7%) | 251 (68.6%) |
| 6 to 18 Years | 147 (14.5%) | 783 (77.1%) |
| 19 to 25 Years | 0 (0.0%) | 545 (90.2%) |
| 25 to 34 Years | 0 (0.0%) | 453 (86.0%) |
| 35 to 44 Years | 66 (7.4%) | 822 (92.0%) |
| 45 to 54 Years | 177 (17.4%) | 955 (94.0%) |
| 55 to 64 Years | 24 (4.4%) | 479 (88.5%) |
| 65 to 74 Years | 771 (98.3%) | 406 (51.8%) |
| 75 Years and over | 300 (100.0%) | 183 (61.0%) |
| Total | 1,528 (25.3%) | 4,877 (80.7%) |
Disability Status by Sex by Age in Battlefield
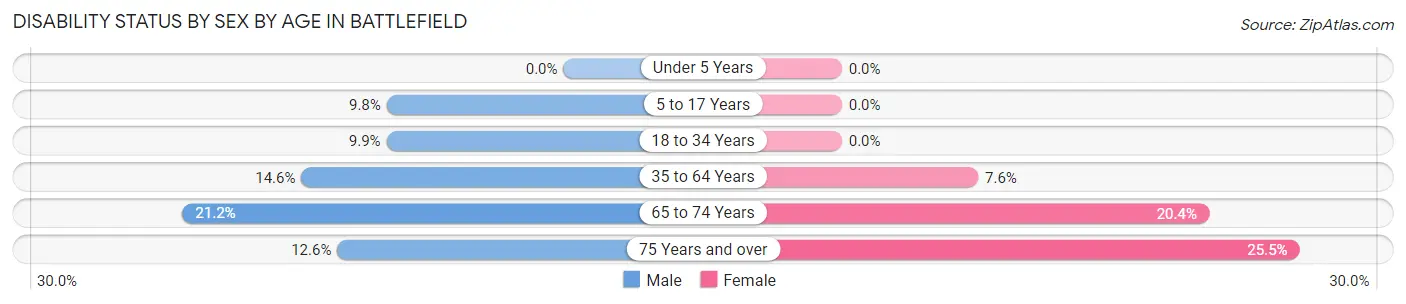
| Age Bracket | Male | Female |
| Under 5 Years | 0 (0.0%) | 0 (0.0%) |
| 5 to 17 Years | 48 (9.8%) | 0 (0.0%) |
| 18 to 34 Years | 54 (9.9%) | 0 (0.0%) |
| 35 to 64 Years | 171 (14.6%) | 97 (7.6%) |
| 65 to 74 Years | 77 (21.2%) | 86 (20.4%) |
| 75 Years and over | 18 (12.6%) | 40 (25.5%) |
Disability Class by Sex by Age in Battlefield
Disability Class: Hearing Difficulty
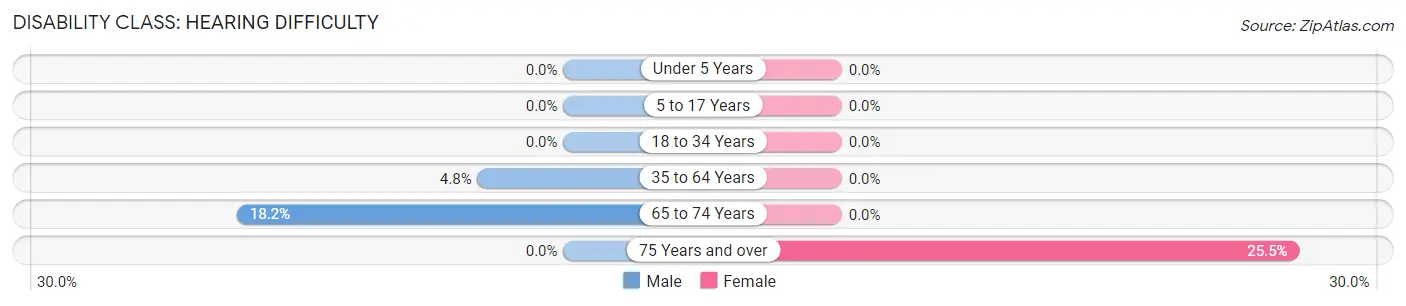
| Age Bracket | Male | Female |
| Under 5 Years | 0 (0.0%) | 0 (0.0%) |
| 5 to 17 Years | 0 (0.0%) | 0 (0.0%) |
| 18 to 34 Years | 0 (0.0%) | 0 (0.0%) |
| 35 to 64 Years | 56 (4.8%) | 0 (0.0%) |
| 65 to 74 Years | 66 (18.2%) | 0 (0.0%) |
| 75 Years and over | 0 (0.0%) | 40 (25.5%) |
Disability Class: Vision Difficulty
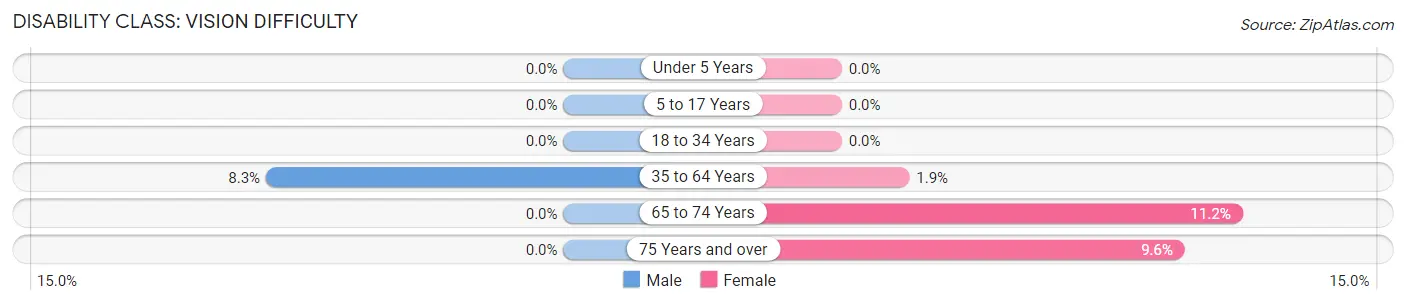
| Age Bracket | Male | Female |
| Under 5 Years | 0 (0.0%) | 0 (0.0%) |
| 5 to 17 Years | 0 (0.0%) | 0 (0.0%) |
| 18 to 34 Years | 0 (0.0%) | 0 (0.0%) |
| 35 to 64 Years | 97 (8.3%) | 24 (1.9%) |
| 65 to 74 Years | 0 (0.0%) | 47 (11.2%) |
| 75 Years and over | 0 (0.0%) | 15 (9.6%) |
Disability Class: Cognitive Difficulty
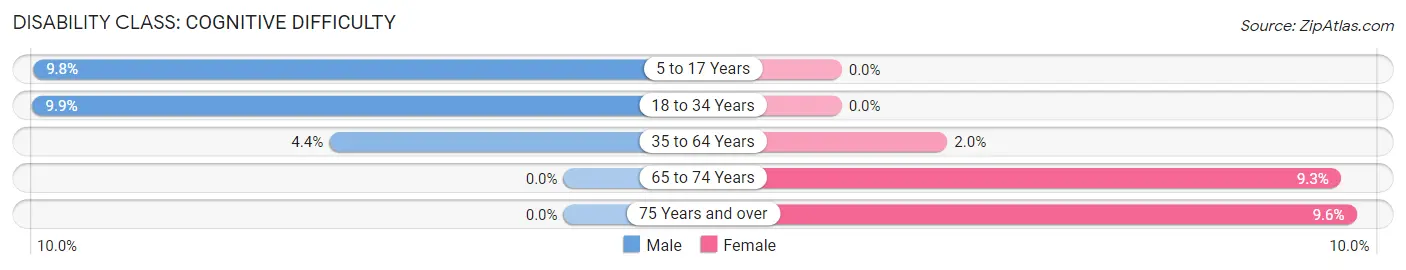
| Age Bracket | Male | Female |
| 5 to 17 Years | 48 (9.8%) | 0 (0.0%) |
| 18 to 34 Years | 54 (9.9%) | 0 (0.0%) |
| 35 to 64 Years | 51 (4.3%) | 25 (2.0%) |
| 65 to 74 Years | 0 (0.0%) | 39 (9.3%) |
| 75 Years and over | 0 (0.0%) | 15 (9.6%) |
Disability Class: Ambulatory Difficulty
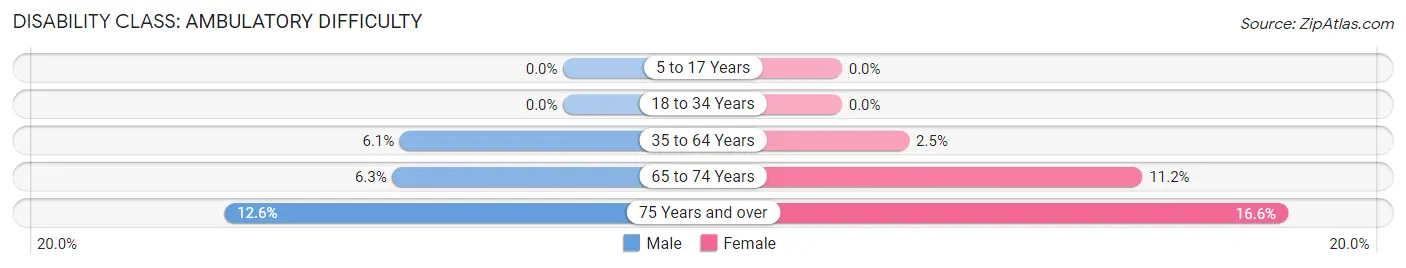
| Age Bracket | Male | Female |
| 5 to 17 Years | 0 (0.0%) | 0 (0.0%) |
| 18 to 34 Years | 0 (0.0%) | 0 (0.0%) |
| 35 to 64 Years | 71 (6.1%) | 32 (2.5%) |
| 65 to 74 Years | 23 (6.3%) | 47 (11.2%) |
| 75 Years and over | 18 (12.6%) | 26 (16.6%) |
Disability Class: Self-Care Difficulty
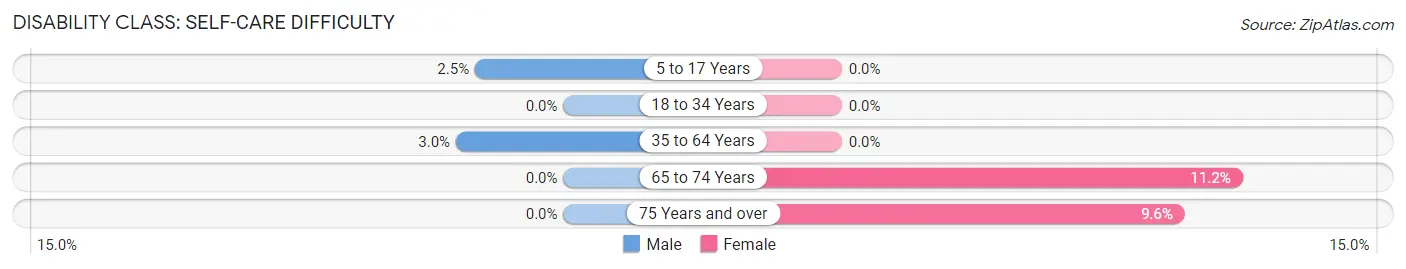
| Age Bracket | Male | Female |
| 5 to 17 Years | 12 (2.5%) | 0 (0.0%) |
| 18 to 34 Years | 0 (0.0%) | 0 (0.0%) |
| 35 to 64 Years | 35 (3.0%) | 0 (0.0%) |
| 65 to 74 Years | 0 (0.0%) | 47 (11.2%) |
| 75 Years and over | 0 (0.0%) | 15 (9.6%) |
Technology Access in Battlefield
Computing Device Access in Battlefield
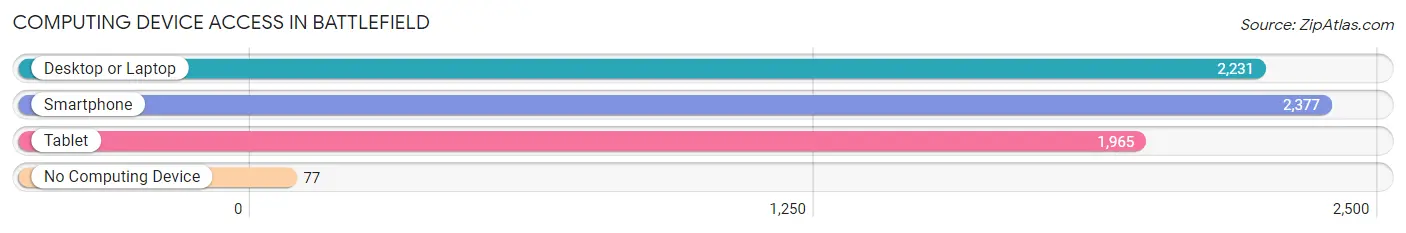
| Device Type | # Households | % Households |
| Desktop or Laptop | 2,231 | 86.9% |
| Smartphone | 2,377 | 92.6% |
| Tablet | 1,965 | 76.6% |
| No Computing Device | 77 | 3.0% |
| Total | 2,566 | 100.0% |
Internet Access in Battlefield
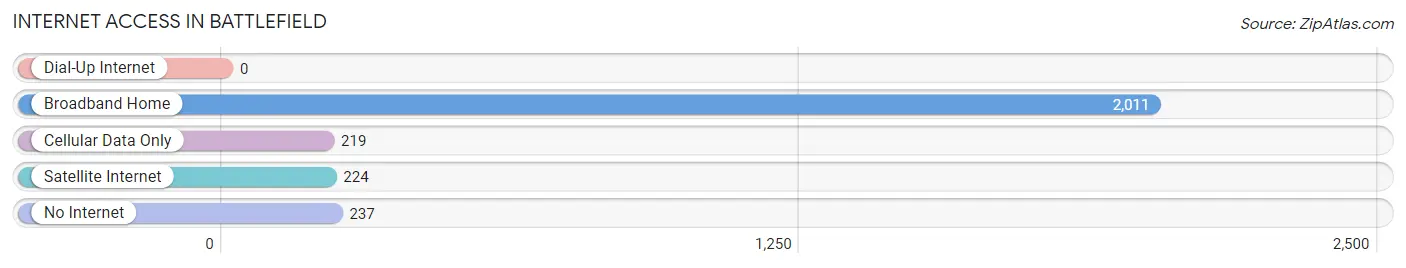
| Internet Type | # Households | % Households |
| Dial-Up Internet | 0 | 0.0% |
| Broadband Home | 2,011 | 78.4% |
| Cellular Data Only | 219 | 8.5% |
| Satellite Internet | 224 | 8.7% |
| No Internet | 237 | 9.2% |
| Total | 2,566 | 100.0% |
Battlefield Summary
Battlefield, Missouri is a small city located in Greene County, Missouri. It is situated in the southwestern part of the state, about 20 miles north of Springfield. The city was founded in 1864 and was named after the nearby Civil War battlefield. As of the 2010 census, the population of Battlefield was 1,945.
Geography
Battlefield is located at 37°14'25" North, 93°17'45" West (37.240278, -93.295833). It is situated in the Ozark Plateau region of Missouri, and is surrounded by rolling hills and wooded areas. The city is located in the Springfield Plateau, which is part of the larger Ozark Mountains. The city is located at an elevation of 1,068 feet above sea level.
The city is located in the James River watershed, and is bordered by the James River to the east. The city is also located near the Finley River, which flows through the city. The city is located in the Central Standard Time Zone.
Demographics
As of the 2010 census, the population of Battlefield was 1,945. The racial makeup of the city was 95.2% White, 0.7% African American, 0.3% Native American, 0.7% Asian, 0.1% Pacific Islander, 1.2% from other races, and 1.8% from two or more races. Hispanic or Latino of any race were 3.2% of the population.
The median age in Battlefield was 37.7 years. About 24.2% of the population was under the age of 18, 8.2% was between 18 and 24, 28.2% was between 25 and 44, 24.2% was between 45 and 64, and 15.2% was 65 years of age or older. The gender makeup of the city was 48.2% male and 51.8% female.
Economy
The economy of Battlefield is largely based on agriculture and manufacturing. The city is home to several large farms, which produce a variety of crops, including corn, soybeans, wheat, and hay. The city is also home to several manufacturing companies, which produce a variety of products, including furniture, automotive parts, and medical supplies.
The city is also home to several retail stores, restaurants, and other businesses. The city is served by the Greene County Public Library, which provides access to books, magazines, and other materials.
The median household income in Battlefield was $45,938 in 2018. The median home value was $133,400 in 2018. The unemployment rate in Battlefield was 3.2% in 2018.
Conclusion
Battlefield, Missouri is a small city located in Greene County, Missouri. It is situated in the southwestern part of the state, about 20 miles north of Springfield. The city was founded in 1864 and was named after the nearby Civil War battlefield. As of the 2010 census, the population of Battlefield was 1,945. The city is located in the Ozark Plateau region of Missouri, and is surrounded by rolling hills and wooded areas. The economy of Battlefield is largely based on agriculture and manufacturing. The median household income in Battlefield was $45,938 in 2018. The median home value was $133,400 in 2018. The unemployment rate in Battlefield was 3.2% in 2018.
Common Questions
What is the Total Population of Battlefield?
Total Population of Battlefield is 6,046.
What is the Total Male Population of Battlefield?
Total Male Population of Battlefield is 2,899.
What is the Total Female Population of Battlefield?
Total Female Population of Battlefield is 3,147.
What is the Ratio of Males per 100 Females in Battlefield?
There are 92.12 Males per 100 Females in Battlefield.
What is the Ratio of Females per 100 Males in Battlefield?
There are 108.55 Females per 100 Males in Battlefield.
What is the Median Population Age in Battlefield?
Median Population Age in Battlefield is 40.7 Years.
What is the Average Family Size in Battlefield
Average Family Size in Battlefield is 2.7 People.
What is the Average Household Size in Battlefield
Average Household Size in Battlefield is 2.4 People.
What is Per Capita Income in Battlefield?
Per Capita income in Battlefield is $37,735.
What is the Median Family Income in Battlefield?
Median Family Income in Battlefield is $91,322.
What is the Median Household income in Battlefield?
Median Household Income in Battlefield is $82,302.
What is Income or Wage Gap in Battlefield?
Income or Wage Gap in Battlefield is 19.2%.
Women in Battlefield earn 80.8 cents for every dollar earned by a man.
What is Inequality or Gini Index in Battlefield?
Inequality or Gini Index in Battlefield is 0.36.
How Large is the Labor Force in Battlefield?
There are 3,424 People in the Labor Forcein in Battlefield.
What is the Percentage of People in the Labor Force in Battlefield?
70.2% of People are in the Labor Force in Battlefield.
What is the Unemployment Rate in Battlefield?
Unemployment Rate in Battlefield is 3.3%.