Cities with the Highest Percentage of British Population in Kansas
RELATED REPORTS & OPTIONS
British
Kansas
Compare Cities
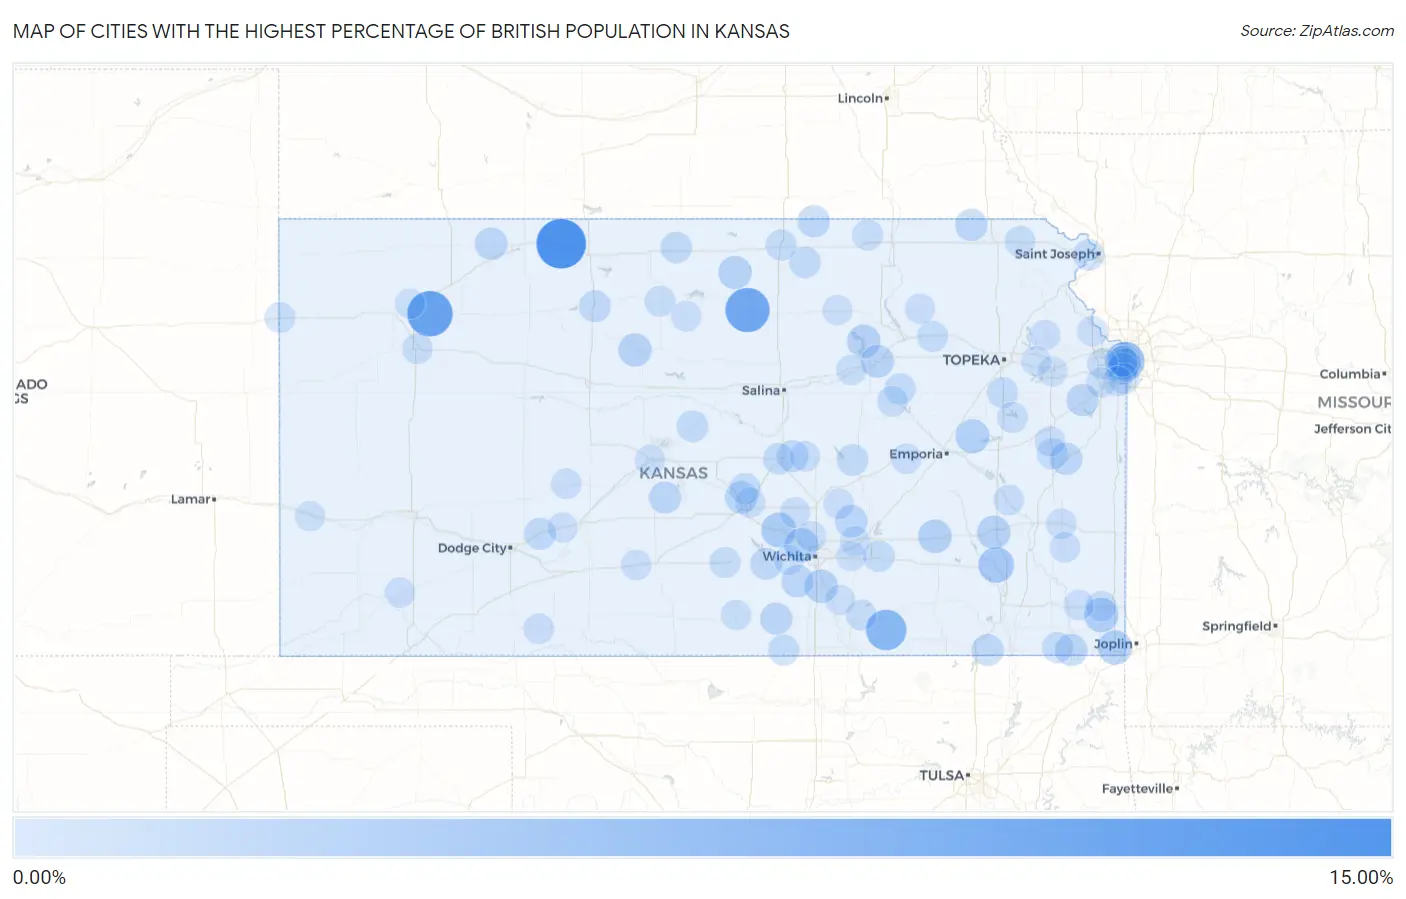
Map of Cities with the Highest Percentage of British Population in Kansas
0.00%
15.00%
Cities with the Highest Percentage of British Population in Kansas
| City | British | vs State | vs National | |
| 1. | Prairie View | 13.70% | 0.59%(+13.1)#1 | 0.53%(+13.2)#73 |
| 2. | Menlo | 10.81% | 0.59%(+10.2)#2 | 0.53%(+10.3)#107 |
| 3. | Simpson | 10.00% | 0.59%(+9.41)#3 | 0.53%(+9.47)#126 |
| 4. | Radley | 8.93% | 0.59%(+8.34)#4 | 0.53%(+8.40)#152 |
| 5. | Dexter | 7.49% | 0.59%(+6.90)#5 | 0.53%(+6.96)#197 |
| 6. | Westwood Hills | 6.53% | 0.59%(+5.95)#6 | 0.53%(+6.00)#236 |
| 7. | Benedict | 4.29% | 0.59%(+3.70)#7 | 0.53%(+3.76)#441 |
| 8. | Mount Hope | 3.79% | 0.59%(+3.20)#8 | 0.53%(+3.26)#525 |
| 9. | Scammon | 3.48% | 0.59%(+2.89)#9 | 0.53%(+2.95)#607 |
| 10. | Lowell | 3.45% | 0.59%(+2.86)#10 | 0.53%(+2.92)#619 |
| 11. | Maize | 3.28% | 0.59%(+2.69)#11 | 0.53%(+2.75)#665 |
| 12. | Reading | 3.18% | 0.59%(+2.60)#12 | 0.53%(+2.65)#688 |
| 13. | Eureka | 3.04% | 0.59%(+2.45)#13 | 0.53%(+2.51)#741 |
| 14. | Yates Center | 2.96% | 0.59%(+2.37)#14 | 0.53%(+2.43)#771 |
| 15. | Milford | 2.85% | 0.59%(+2.26)#15 | 0.53%(+2.32)#816 |
| 16. | Mulvane | 2.83% | 0.59%(+2.25)#16 | 0.53%(+2.30)#825 |
| 17. | Paradise | 2.78% | 0.59%(+2.19)#17 | 0.53%(+2.25)#849 |
| 18. | Randall | 2.74% | 0.59%(+2.15)#18 | 0.53%(+2.21)#868 |
| 19. | Grandview Plaza | 2.51% | 0.59%(+1.93)#19 | 0.53%(+1.98)#990 |
| 20. | Norcatur | 2.35% | 0.59%(+1.77)#20 | 0.53%(+1.82)#1,108 |
| 21. | Westwood | 2.30% | 0.59%(+1.71)#21 | 0.53%(+1.77)#1,144 |
| 22. | Potwin | 2.28% | 0.59%(+1.69)#22 | 0.53%(+1.75)#1,163 |
| 23. | Willowbrook | 2.27% | 0.59%(+1.69)#23 | 0.53%(+1.74)#1,167 |
| 24. | Bern | 2.19% | 0.59%(+1.60)#24 | 0.53%(+1.66)#1,226 |
| 25. | Greeley | 2.14% | 0.59%(+1.55)#25 | 0.53%(+1.61)#1,271 |
| 26. | Milan | 2.13% | 0.59%(+1.54)#26 | 0.53%(+1.60)#1,278 |
| 27. | Edgerton | 2.06% | 0.59%(+1.47)#27 | 0.53%(+1.53)#1,355 |
| 28. | Chetopa | 2.05% | 0.59%(+1.47)#28 | 0.53%(+1.52)#1,361 |
| 29. | Clearwater | 2.04% | 0.59%(+1.46)#29 | 0.53%(+1.51)#1,381 |
| 30. | Mahaska | 2.04% | 0.59%(+1.45)#30 | 0.53%(+1.51)#1,384 |
| 31. | Hudson | 2.00% | 0.59%(+1.41)#31 | 0.53%(+1.47)#1,430 |
| 32. | Tyro | 1.97% | 0.59%(+1.38)#32 | 0.53%(+1.44)#1,461 |
| 33. | Cheney | 1.93% | 0.59%(+1.35)#33 | 0.53%(+1.40)#1,506 |
| 34. | Spearville | 1.88% | 0.59%(+1.30)#34 | 0.53%(+1.36)#1,556 |
| 35. | Galva | 1.87% | 0.59%(+1.28)#35 | 0.53%(+1.34)#1,582 |
| 36. | Stockton | 1.79% | 0.59%(+1.20)#36 | 0.53%(+1.26)#1,693 |
| 37. | Marion | 1.74% | 0.59%(+1.16)#37 | 0.53%(+1.21)#1,752 |
| 38. | Lebanon | 1.72% | 0.59%(+1.14)#38 | 0.53%(+1.19)#1,785 |
| 39. | Agenda | 1.69% | 0.59%(+1.11)#39 | 0.53%(+1.17)#1,826 |
| 40. | Holyrood | 1.68% | 0.59%(+1.10)#40 | 0.53%(+1.15)#1,852 |
| 41. | Prairie Village | 1.62% | 0.59%(+1.03)#41 | 0.53%(+1.09)#1,974 |
| 42. | Richmond | 1.56% | 0.59%(+0.970)#42 | 0.53%(+1.03)#2,089 |
| 43. | Mcpherson | 1.55% | 0.59%(+0.968)#43 | 0.53%(+1.03)#2,094 |
| 44. | The Highlands | 1.55% | 0.59%(+0.964)#44 | 0.53%(+1.02)#2,106 |
| 45. | Leon | 1.54% | 0.59%(+0.955)#45 | 0.53%(+1.01)#2,131 |
| 46. | Wathena | 1.53% | 0.59%(+0.948)#46 | 0.53%(+1.00)#2,154 |
| 47. | Dwight | 1.49% | 0.59%(+0.906)#47 | 0.53%(+0.963)#2,243 |
| 48. | Bartlett | 1.45% | 0.59%(+0.863)#48 | 0.53%(+0.919)#2,341 |
| 49. | Belleville | 1.43% | 0.59%(+0.845)#49 | 0.53%(+0.901)#2,384 |
| 50. | Wamego | 1.41% | 0.59%(+0.822)#50 | 0.53%(+0.878)#2,454 |
| 51. | Caldwell | 1.39% | 0.59%(+0.804)#51 | 0.53%(+0.860)#2,510 |
| 52. | Carbondale | 1.36% | 0.59%(+0.775)#52 | 0.53%(+0.831)#2,585 |
| 53. | Mission Hills | 1.35% | 0.59%(+0.759)#53 | 0.53%(+0.816)#2,624 |
| 54. | Kingman | 1.34% | 0.59%(+0.757)#54 | 0.53%(+0.814)#2,632 |
| 55. | Osborne | 1.32% | 0.59%(+0.736)#55 | 0.53%(+0.793)#2,686 |
| 56. | Leawood | 1.31% | 0.59%(+0.725)#56 | 0.53%(+0.781)#2,716 |
| 57. | Hanover | 1.30% | 0.59%(+0.714)#57 | 0.53%(+0.771)#2,746 |
| 58. | Winfield | 1.25% | 0.59%(+0.667)#58 | 0.53%(+0.724)#2,884 |
| 59. | Shawnee | 1.25% | 0.59%(+0.665)#59 | 0.53%(+0.722)#2,888 |
| 60. | Vassar | 1.25% | 0.59%(+0.661)#60 | 0.53%(+0.717)#2,900 |
| 61. | Hiawatha | 1.20% | 0.59%(+0.615)#61 | 0.53%(+0.672)#3,057 |
| 62. | Parkerville | 1.19% | 0.59%(+0.604)#62 | 0.53%(+0.661)#3,098 |
| 63. | Oakley | 1.16% | 0.59%(+0.577)#63 | 0.53%(+0.634)#3,183 |
| 64. | Kanorado | 1.15% | 0.59%(+0.563)#64 | 0.53%(+0.620)#3,234 |
| 65. | Cherokee | 1.14% | 0.59%(+0.551)#65 | 0.53%(+0.608)#3,285 |
| 66. | Leroy | 1.13% | 0.59%(+0.541)#66 | 0.53%(+0.598)#3,323 |
| 67. | Ashland | 1.12% | 0.59%(+0.536)#67 | 0.53%(+0.592)#3,348 |
| 68. | Halstead | 1.11% | 0.59%(+0.528)#68 | 0.53%(+0.585)#3,378 |
| 69. | Burdett | 1.11% | 0.59%(+0.525)#69 | 0.53%(+0.581)#3,389 |
| 70. | Cullison | 1.11% | 0.59%(+0.525)#70 | 0.53%(+0.581)#3,390 |
| 71. | Elbing | 1.11% | 0.59%(+0.520)#71 | 0.53%(+0.577)#3,406 |
| 72. | Oskaloosa | 1.05% | 0.59%(+0.468)#72 | 0.53%(+0.525)#3,648 |
| 73. | Tipton | 1.05% | 0.59%(+0.466)#73 | 0.53%(+0.523)#3,661 |
| 74. | Lansing | 1.04% | 0.59%(+0.453)#74 | 0.53%(+0.510)#3,721 |
| 75. | Roeland Park | 1.04% | 0.59%(+0.450)#75 | 0.53%(+0.507)#3,736 |
| 76. | Satanta | 1.03% | 0.59%(+0.446)#76 | 0.53%(+0.502)#3,761 |
| 77. | Moran | 1.03% | 0.59%(+0.444)#77 | 0.53%(+0.501)#3,772 |
| 78. | Cottonwood Falls | 1.01% | 0.59%(+0.427)#78 | 0.53%(+0.484)#3,861 |
| 79. | Canton | 1.01% | 0.59%(+0.424)#79 | 0.53%(+0.480)#3,878 |
| 80. | Mccune | 1.01% | 0.59%(+0.424)#80 | 0.53%(+0.480)#3,881 |
| 81. | Great Bend | 1.00% | 0.59%(+0.412)#81 | 0.53%(+0.468)#3,929 |
| 82. | Harper | 0.97% | 0.59%(+0.383)#82 | 0.53%(+0.440)#4,057 |
| 83. | Chapman | 0.96% | 0.59%(+0.378)#83 | 0.53%(+0.435)#4,079 |
| 84. | Princeton | 0.96% | 0.59%(+0.375)#84 | 0.53%(+0.432)#4,092 |
| 85. | Savonburg | 0.96% | 0.59%(+0.375)#85 | 0.53%(+0.432)#4,093 |
| 86. | Valley Center | 0.95% | 0.59%(+0.360)#86 | 0.53%(+0.417)#4,174 |
| 87. | Westmoreland | 0.94% | 0.59%(+0.350)#87 | 0.53%(+0.406)#4,232 |
| 88. | Udall | 0.91% | 0.59%(+0.328)#88 | 0.53%(+0.385)#4,350 |
| 89. | Goddard | 0.90% | 0.59%(+0.312)#89 | 0.53%(+0.369)#4,437 |
| 90. | Offerle | 0.90% | 0.59%(+0.310)#90 | 0.53%(+0.367)#4,449 |
| 91. | Hutchinson | 0.89% | 0.59%(+0.301)#91 | 0.53%(+0.358)#4,507 |
| 92. | Gem | 0.88% | 0.59%(+0.298)#92 | 0.53%(+0.355)#4,523 |
| 93. | Overland Park | 0.88% | 0.59%(+0.290)#93 | 0.53%(+0.347)#4,588 |
| 94. | Syracuse | 0.86% | 0.59%(+0.274)#94 | 0.53%(+0.331)#4,690 |
| 95. | Olathe | 0.86% | 0.59%(+0.270)#95 | 0.53%(+0.327)#4,720 |
| 96. | Clay Center | 0.84% | 0.59%(+0.256)#96 | 0.53%(+0.313)#4,817 |
| 97. | Towanda | 0.84% | 0.59%(+0.250)#97 | 0.53%(+0.307)#4,859 |
| 98. | Lawrence | 0.81% | 0.59%(+0.227)#98 | 0.53%(+0.284)#5,026 |
| 99. | Augusta | 0.81% | 0.59%(+0.224)#99 | 0.53%(+0.281)#5,052 |
| 100. | Lecompton | 0.81% | 0.59%(+0.224)#100 | 0.53%(+0.280)#5,055 |
Common Questions
What are the Top 10 Cities with the Highest Percentage of British Population in Kansas?
Top 10 Cities with the Highest Percentage of British Population in Kansas are:
#1
13.70%
#2
10.81%
#3
10.00%
#4
7.49%
#5
6.53%
#6
4.29%
#7
3.79%
#8
3.48%
#9
3.45%
#10
3.28%
What city has the Highest Percentage of British Population in Kansas?
Prairie View has the Highest Percentage of British Population in Kansas with 13.70%.
What is the Percentage of British Population in the State of Kansas?
Percentage of British Population in Kansas is 0.59%.
What is the Percentage of British Population in the United States?
Percentage of British Population in the United States is 0.53%.