Tullahoma, TN
Tullahoma Map
Tullahoma Overview
21,107
TOTAL POPULATION
10,204
MALE POPULATION
10,903
FEMALE POPULATION
93.59
MALES / 100 FEMALES
106.85
FEMALES / 100 MALES
40.2
MEDIAN AGE
3.0
AVG FAMILY SIZE
2.4
AVG HOUSEHOLD SIZE
$32,431
PER CAPITA INCOME
$71,515
AVG FAMILY INCOME
$56,771
AVG HOUSEHOLD INCOME
36.7%
WAGE / INCOME GAP [ % ]
63.3¢/ $1
WAGE / INCOME GAP [ $ ]
$9,923
FAMILY INCOME DEFICIT
0.45
INEQUALITY / GINI INDEX
9,997
LABOR FORCE [ PEOPLE ]
59.9%
PERCENT IN LABOR FORCE
4.1%
UNEMPLOYMENT RATE
Tullahoma Zip Codes
Tullahoma Area Codes
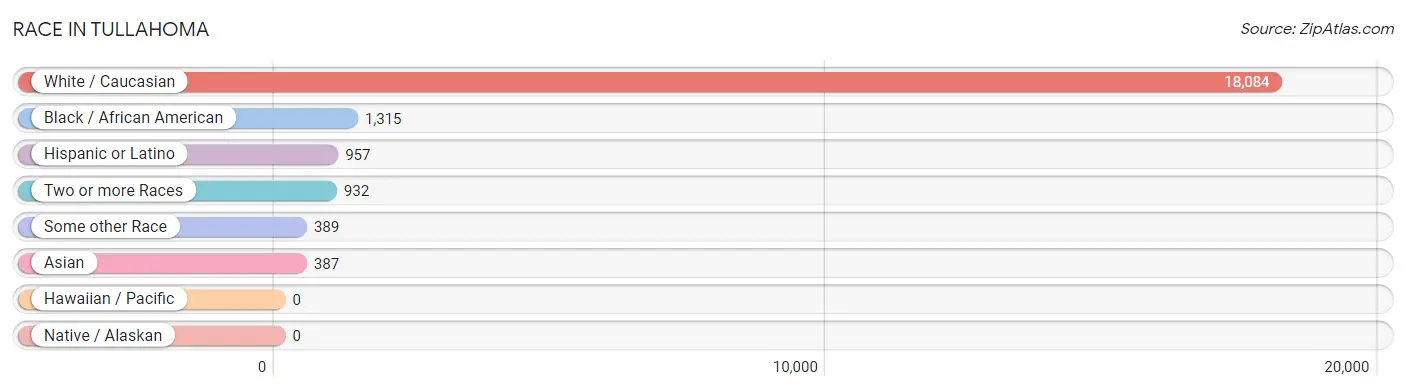
Race in Tullahoma
The most populous races in Tullahoma are White / Caucasian (18,084 | 85.7%), Black / African American (1,315 | 6.2%), and Hispanic or Latino (957 | 4.5%).
| Race | # Population | % Population |
| Asian | 387 | 1.8% |
| Black / African American | 1,315 | 6.2% |
| Hawaiian / Pacific | 0 | 0.0% |
| Hispanic or Latino | 957 | 4.5% |
| Native / Alaskan | 0 | 0.0% |
| White / Caucasian | 18,084 | 85.7% |
| Two or more Races | 932 | 4.4% |
| Some other Race | 389 | 1.8% |
| Total | 21,107 | 100.0% |
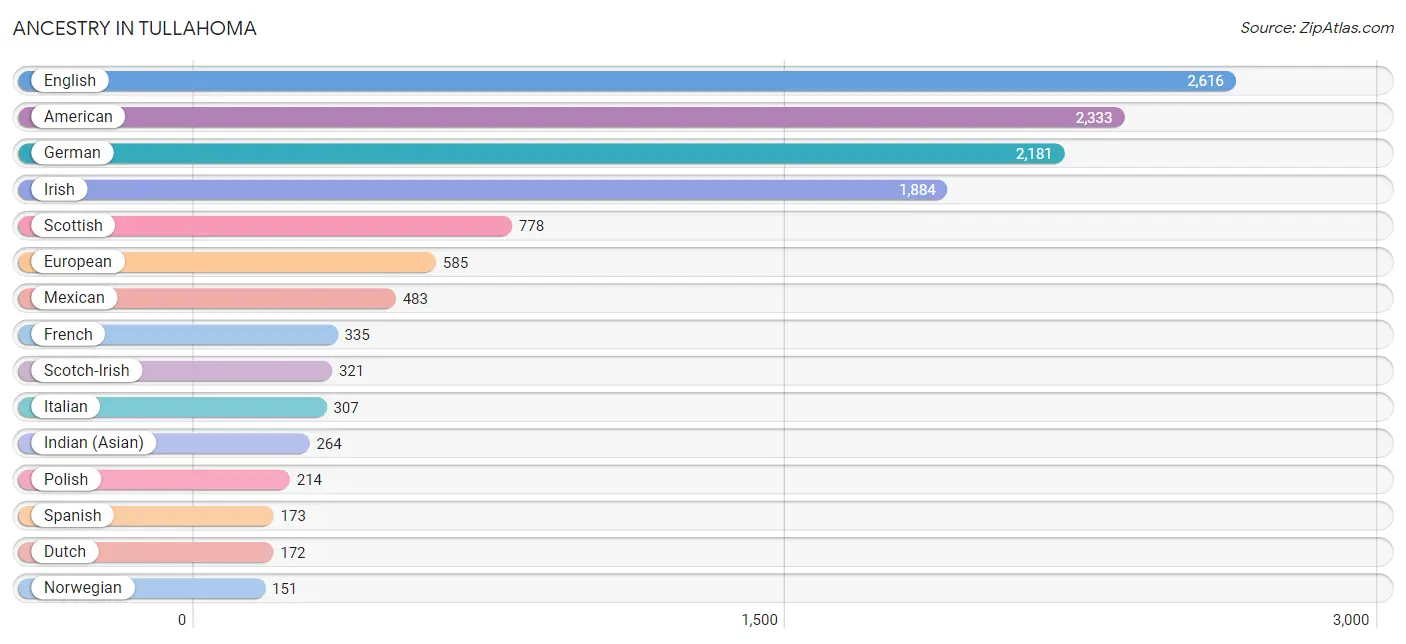
Ancestry in Tullahoma
The most populous ancestries reported in Tullahoma are English (2,616 | 12.4%), American (2,333 | 11.1%), German (2,181 | 10.3%), Irish (1,884 | 8.9%), and Scottish (778 | 3.7%), together accounting for 46.4% of all Tullahoma residents.
| Ancestry | # Population | % Population |
| African | 51 | 0.2% |
| American | 2,333 | 11.1% |
| Belgian | 29 | 0.1% |
| Bhutanese | 20 | 0.1% |
| British | 129 | 0.6% |
| Canadian | 90 | 0.4% |
| Central American | 17 | 0.1% |
| Central American Indian | 5 | 0.0% |
| Cherokee | 48 | 0.2% |
| Choctaw | 12 | 0.1% |
| Croatian | 54 | 0.3% |
| Cuban | 135 | 0.6% |
| Czech | 41 | 0.2% |
| Czechoslovakian | 15 | 0.1% |
| Dutch | 172 | 0.8% |
| Eastern European | 41 | 0.2% |
| English | 2,616 | 12.4% |
| Ethiopian | 20 | 0.1% |
| European | 585 | 2.8% |
| French | 335 | 1.6% |
| French Canadian | 46 | 0.2% |
| German | 2,181 | 10.3% |
| Honduran | 17 | 0.1% |
| Hungarian | 14 | 0.1% |
| Icelander | 9 | 0.0% |
| Indian (Asian) | 264 | 1.3% |
| Irish | 1,884 | 8.9% |
| Italian | 307 | 1.5% |
| Jamaican | 33 | 0.2% |
| Korean | 76 | 0.4% |
| Mexican | 483 | 2.3% |
| Mexican American Indian | 17 | 0.1% |
| Native Hawaiian | 30 | 0.1% |
| Northern European | 9 | 0.0% |
| Norwegian | 151 | 0.7% |
| Polish | 214 | 1.0% |
| Portuguese | 51 | 0.2% |
| Puerto Rican | 92 | 0.4% |
| Russian | 51 | 0.2% |
| Samoan | 13 | 0.1% |
| Scandinavian | 77 | 0.4% |
| Scotch-Irish | 321 | 1.5% |
| Scottish | 778 | 3.7% |
| Serbian | 54 | 0.3% |
| Slovak | 13 | 0.1% |
| South American | 31 | 0.2% |
| Spaniard | 5 | 0.0% |
| Spanish | 173 | 0.8% |
| Sri Lankan | 79 | 0.4% |
| Subsaharan African | 71 | 0.3% |
| Swedish | 15 | 0.1% |
| Swiss | 31 | 0.2% |
| Thai | 9 | 0.0% |
| Ukrainian | 108 | 0.5% |
| Venezuelan | 31 | 0.2% |
| Welsh | 130 | 0.6% |
| Yugoslavian | 74 | 0.4% | View All 57 Rows |
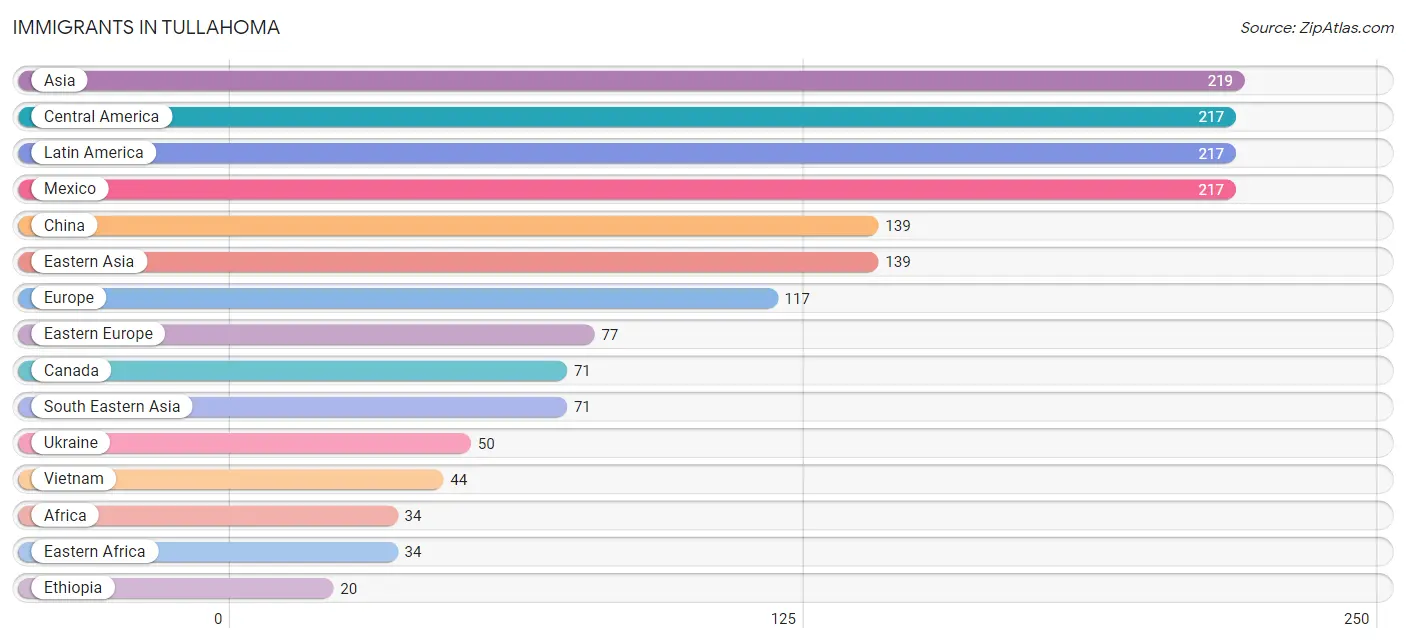
Immigrants in Tullahoma
The most numerous immigrant groups reported in Tullahoma came from Asia (219 | 1.0%), Central America (217 | 1.0%), Latin America (217 | 1.0%), Mexico (217 | 1.0%), and China (139 | 0.7%), together accounting for 4.8% of all Tullahoma residents.
| Immigration Origin | # Population | % Population |
| Africa | 34 | 0.2% |
| Asia | 219 | 1.0% |
| Canada | 71 | 0.3% |
| Central America | 217 | 1.0% |
| China | 139 | 0.7% |
| Eastern Africa | 34 | 0.2% |
| Eastern Asia | 139 | 0.7% |
| Eastern Europe | 77 | 0.4% |
| England | 4 | 0.0% |
| Ethiopia | 20 | 0.1% |
| Europe | 117 | 0.5% |
| Germany | 18 | 0.1% |
| India | 9 | 0.0% |
| Italy | 18 | 0.1% |
| Latin America | 217 | 1.0% |
| Mexico | 217 | 1.0% |
| Northern Europe | 4 | 0.0% |
| Philippines | 8 | 0.0% |
| Poland | 10 | 0.1% |
| Russia | 17 | 0.1% |
| South Central Asia | 9 | 0.0% |
| South Eastern Asia | 71 | 0.3% |
| Southern Europe | 18 | 0.1% |
| Thailand | 19 | 0.1% |
| Uganda | 14 | 0.1% |
| Ukraine | 50 | 0.2% |
| Vietnam | 44 | 0.2% |
| Western Europe | 18 | 0.1% | View All 28 Rows |
Sex and Age in Tullahoma
Sex and Age in Tullahoma
The most populous age groups in Tullahoma are 30 to 34 Years (877 | 8.6%) for men and Under 5 Years (968 | 8.9%) for women.
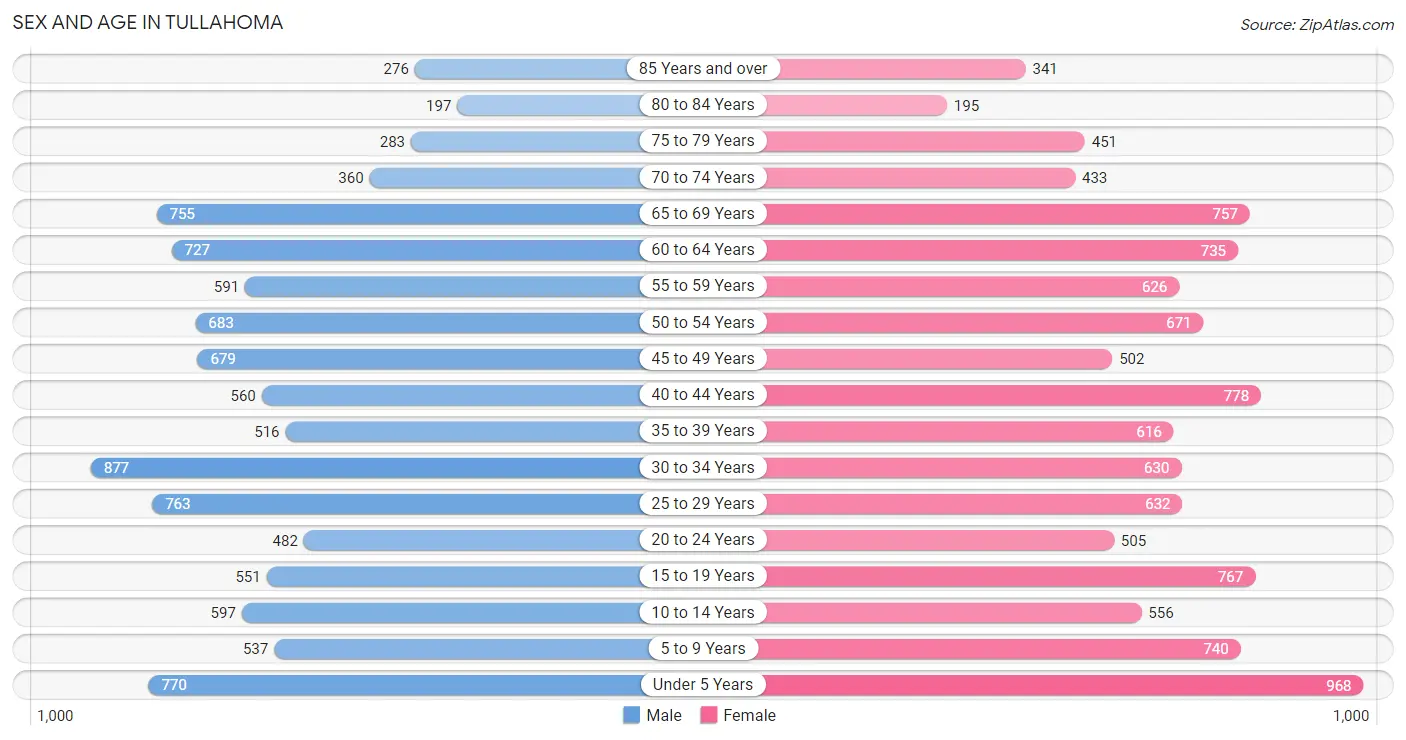
| Age Bracket | Male | Female |
| Under 5 Years | 770 (7.5%) | 968 (8.9%) |
| 5 to 9 Years | 537 (5.3%) | 740 (6.8%) |
| 10 to 14 Years | 597 (5.9%) | 556 (5.1%) |
| 15 to 19 Years | 551 (5.4%) | 767 (7.0%) |
| 20 to 24 Years | 482 (4.7%) | 505 (4.6%) |
| 25 to 29 Years | 763 (7.5%) | 632 (5.8%) |
| 30 to 34 Years | 877 (8.6%) | 630 (5.8%) |
| 35 to 39 Years | 516 (5.1%) | 616 (5.7%) |
| 40 to 44 Years | 560 (5.5%) | 778 (7.1%) |
| 45 to 49 Years | 679 (6.7%) | 502 (4.6%) |
| 50 to 54 Years | 683 (6.7%) | 671 (6.1%) |
| 55 to 59 Years | 591 (5.8%) | 626 (5.7%) |
| 60 to 64 Years | 727 (7.1%) | 735 (6.7%) |
| 65 to 69 Years | 755 (7.4%) | 757 (6.9%) |
| 70 to 74 Years | 360 (3.5%) | 433 (4.0%) |
| 75 to 79 Years | 283 (2.8%) | 451 (4.1%) |
| 80 to 84 Years | 197 (1.9%) | 195 (1.8%) |
| 85 Years and over | 276 (2.7%) | 341 (3.1%) |
| Total | 10,204 (100.0%) | 10,903 (100.0%) |
Families and Households in Tullahoma
Median Family Size in Tullahoma
The median family size in Tullahoma is 2.95 persons per family, with single female/mother families (975 | 17.2%) accounting for the largest median family size of 3.04 persons per family. On the other hand, single male/father families (643 | 11.4%) represent the smallest median family size with 2.67 persons per family.
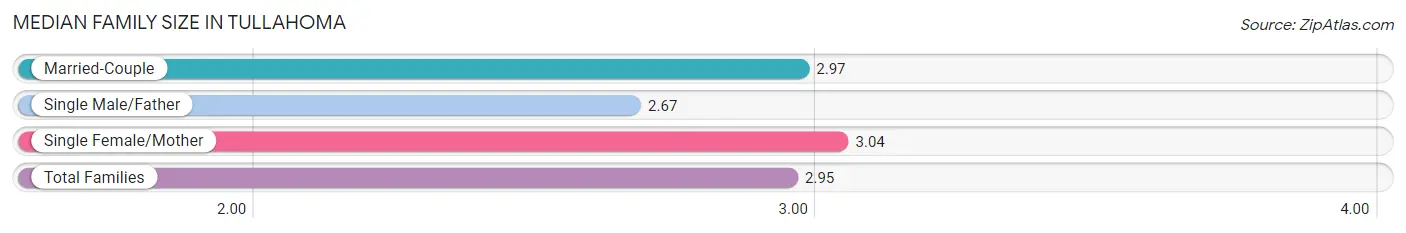
| Family Type | # Families | Family Size |
| Married-Couple | 4,047 (71.4%) | 2.97 |
| Single Male/Father | 643 (11.4%) | 2.67 |
| Single Female/Mother | 975 (17.2%) | 3.04 |
| Total Families | 5,665 (100.0%) | 2.95 |
Median Household Size in Tullahoma
The median household size in Tullahoma is 2.40 persons per household, with single female/mother households (975 | 11.2%) accounting for the largest median household size of 3.26 persons per household. non-family households (3,038 | 34.9%) represent the smallest median household size with 1.19 persons per household.
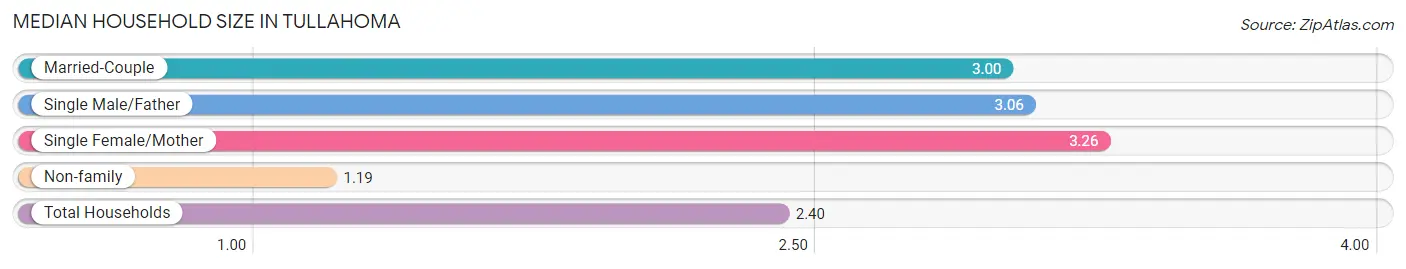
| Household Type | # Households | Household Size |
| Married-Couple | 4,047 (46.5%) | 3.00 |
| Single Male/Father | 643 (7.4%) | 3.06 |
| Single Female/Mother | 975 (11.2%) | 3.26 |
| Non-family | 3,038 (34.9%) | 1.19 |
| Total Households | 8,703 (100.0%) | 2.40 |
Household Size by Marriage Status in Tullahoma
Out of a total of 8,703 households in Tullahoma, 5,665 (65.1%) are family households, while 3,038 (34.9%) are nonfamily households. The most numerous type of family households are 2-person households, comprising 3,036, and the most common type of nonfamily households are 1-person households, comprising 2,625.
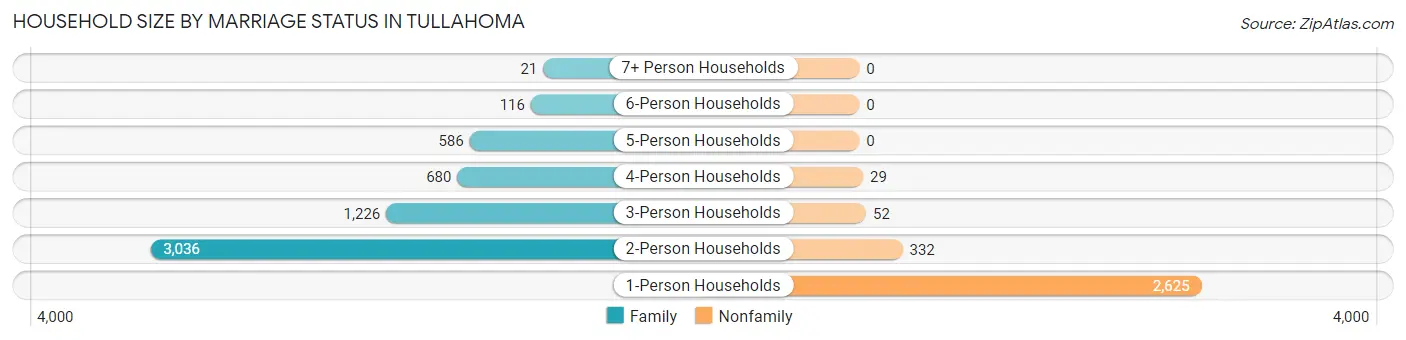
| Household Size | Family Households | Nonfamily Households |
| 1-Person Households | - | 2,625 (30.2%) |
| 2-Person Households | 3,036 (34.9%) | 332 (3.8%) |
| 3-Person Households | 1,226 (14.1%) | 52 (0.6%) |
| 4-Person Households | 680 (7.8%) | 29 (0.3%) |
| 5-Person Households | 586 (6.7%) | 0 (0.0%) |
| 6-Person Households | 116 (1.3%) | 0 (0.0%) |
| 7+ Person Households | 21 (0.2%) | 0 (0.0%) |
| Total | 5,665 (65.1%) | 3,038 (34.9%) |
Female Fertility in Tullahoma
Fertility by Age in Tullahoma
Average fertility rate in Tullahoma is 79.0 births per 1,000 women. Women in the age bracket of 20 to 34 years have the highest fertility rate with 179.0 births per 1,000 women. Women in the age bracket of 20 to 34 years acount for 88.8% of all women with births.
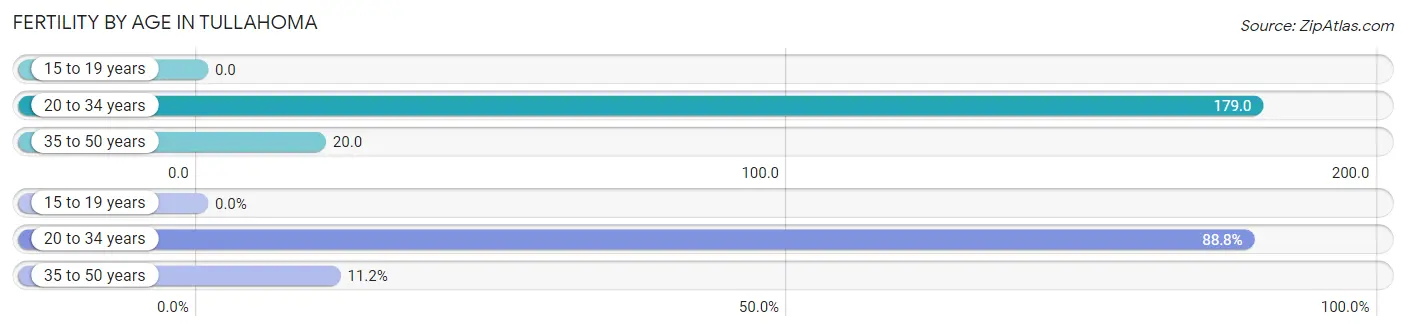
| Age Bracket | Women with Births | Births / 1,000 Women |
| 15 to 19 years | 0 (0.0%) | 0.0 |
| 20 to 34 years | 316 (88.8%) | 179.0 |
| 35 to 50 years | 40 (11.2%) | 20.0 |
| Total | 356 (100.0%) | 79.0 |
Fertility by Age by Marriage Status in Tullahoma
38.2% of women with births (356) in Tullahoma are married. The highest percentage of unmarried women with births falls into 20 to 34 years age bracket with 64.9% of them unmarried at the time of birth, while the lowest percentage of unmarried women with births belong to 35 to 50 years age bracket with 37.5% of them unmarried.
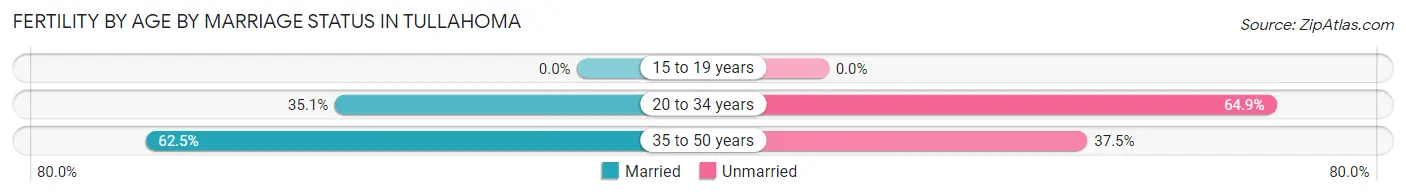
| Age Bracket | Married | Unmarried |
| 15 to 19 years | 0 (0.0%) | 0 (0.0%) |
| 20 to 34 years | 111 (35.1%) | 205 (64.9%) |
| 35 to 50 years | 25 (62.5%) | 15 (37.5%) |
| Total | 136 (38.2%) | 220 (61.8%) |
Fertility by Education in Tullahoma
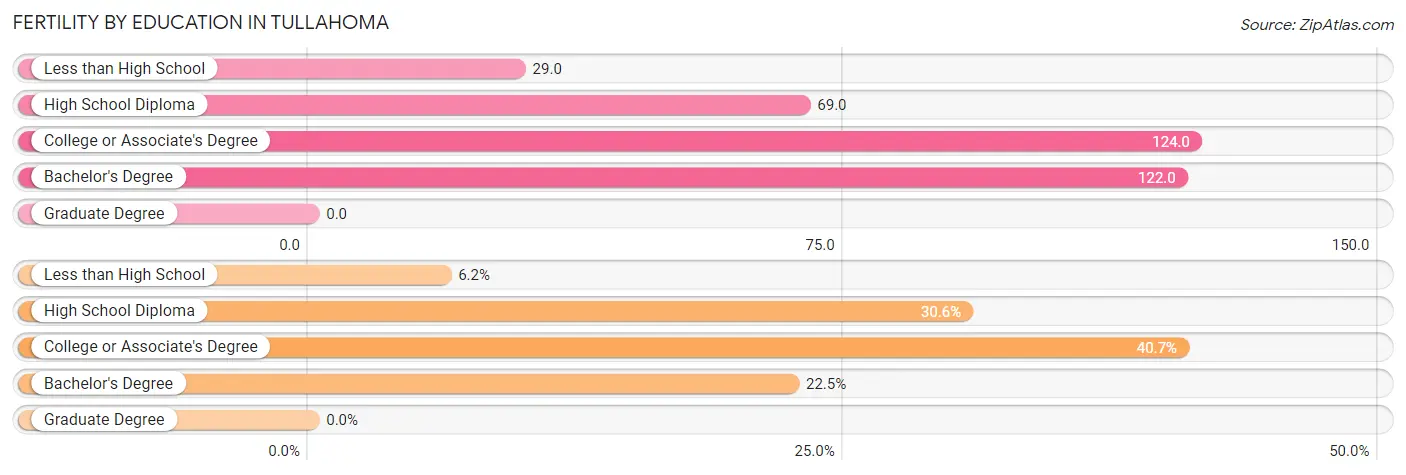
| Educational Attainment | Women with Births | Births / 1,000 Women |
| Less than High School | 22 (6.2%) | 29.0 |
| High School Diploma | 109 (30.6%) | 69.0 |
| College or Associate's Degree | 145 (40.7%) | 124.0 |
| Bachelor's Degree | 80 (22.5%) | 122.0 |
| Graduate Degree | 0 (0.0%) | 0.0 |
| Total | 356 (100.0%) | 79.0 |
Fertility by Education by Marriage Status in Tullahoma
61.8% of women with births in Tullahoma are unmarried. Women with the educational attainment of bachelor's degree are most likely to be married with 56.2% of them married at childbirth, while women with the educational attainment of less than high school are least likely to be married with 100.0% of them unmarried at childbirth.
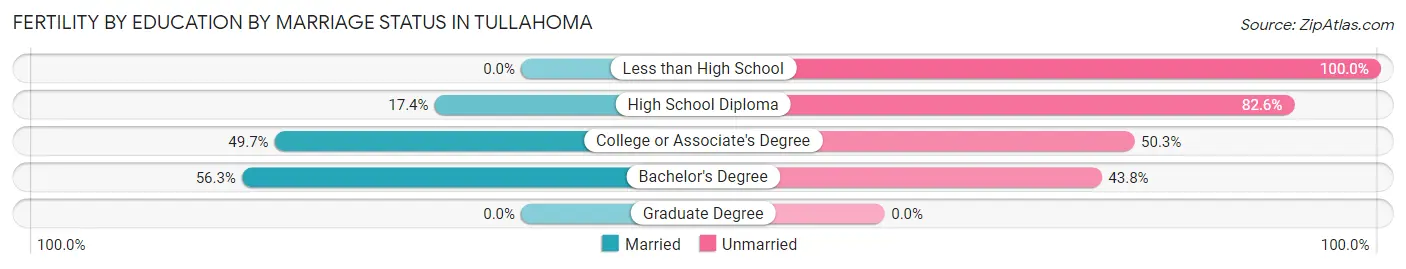
| Educational Attainment | Married | Unmarried |
| Less than High School | 0 (0.0%) | 22 (100.0%) |
| High School Diploma | 19 (17.4%) | 90 (82.6%) |
| College or Associate's Degree | 72 (49.7%) | 73 (50.3%) |
| Bachelor's Degree | 45 (56.2%) | 35 (43.8%) |
| Graduate Degree | 0 (0.0%) | 0 (0.0%) |
| Total | 136 (38.2%) | 220 (61.8%) |
Income in Tullahoma
Income Overview in Tullahoma
Per Capita Income in Tullahoma is $32,431, while median incomes of families and households are $71,515 and $56,771 respectively.
| Characteristic | Number | Measure |
| Per Capita Income | 21,107 | $32,431 |
| Median Family Income | 5,665 | $71,515 |
| Mean Family Income | 5,665 | $91,709 |
| Median Household Income | 8,703 | $56,771 |
| Mean Household Income | 8,703 | $76,439 |
| Income Deficit | 5,665 | $9,923 |
| Wage / Income Gap (%) | 21,107 | 36.68% |
| Wage / Income Gap ($) | 21,107 | 63.32¢ per $1 |
| Gini / Inequality Index | 21,107 | 0.45 |
Earnings by Sex in Tullahoma
Average Earnings in Tullahoma are $35,032, $44,462 for men and $28,153 for women, a difference of 36.7%.
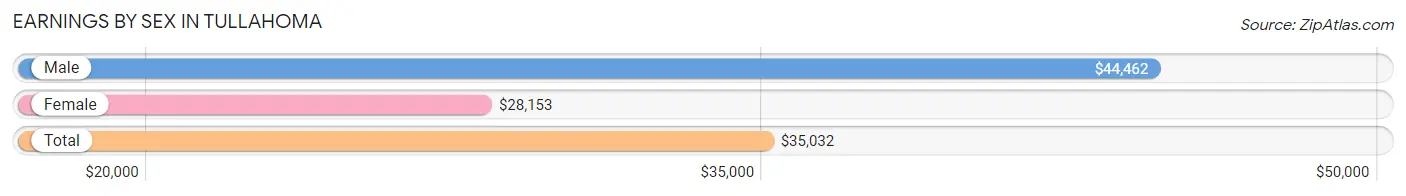
| Sex | Number | Average Earnings |
| Male | 5,628 (54.7%) | $44,462 |
| Female | 4,665 (45.3%) | $28,153 |
| Total | 10,293 (100.0%) | $35,032 |
Earnings by Sex by Income Bracket in Tullahoma
The most common earnings brackets in Tullahoma are $75,000 to $99,999 for men (750 | 13.3%) and $2,499 or less for women (481 | 10.3%).
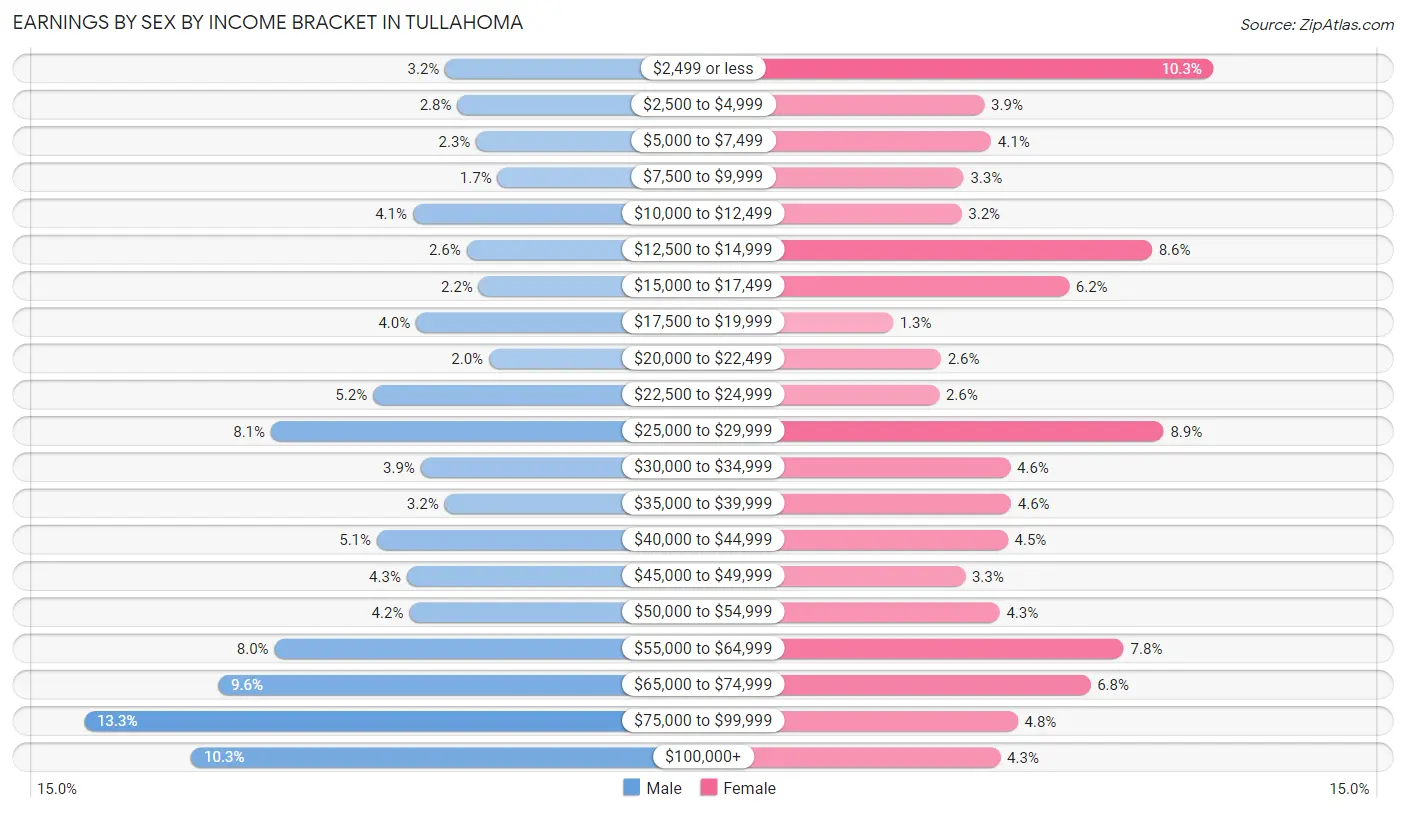
| Income | Male | Female |
| $2,499 or less | 179 (3.2%) | 481 (10.3%) |
| $2,500 to $4,999 | 160 (2.8%) | 180 (3.9%) |
| $5,000 to $7,499 | 130 (2.3%) | 189 (4.1%) |
| $7,500 to $9,999 | 96 (1.7%) | 153 (3.3%) |
| $10,000 to $12,499 | 230 (4.1%) | 150 (3.2%) |
| $12,500 to $14,999 | 145 (2.6%) | 400 (8.6%) |
| $15,000 to $17,499 | 126 (2.2%) | 291 (6.2%) |
| $17,500 to $19,999 | 225 (4.0%) | 60 (1.3%) |
| $20,000 to $22,499 | 110 (1.9%) | 123 (2.6%) |
| $22,500 to $24,999 | 293 (5.2%) | 121 (2.6%) |
| $25,000 to $29,999 | 455 (8.1%) | 415 (8.9%) |
| $30,000 to $34,999 | 218 (3.9%) | 214 (4.6%) |
| $35,000 to $39,999 | 180 (3.2%) | 215 (4.6%) |
| $40,000 to $44,999 | 287 (5.1%) | 211 (4.5%) |
| $45,000 to $49,999 | 240 (4.3%) | 155 (3.3%) |
| $50,000 to $54,999 | 236 (4.2%) | 200 (4.3%) |
| $55,000 to $64,999 | 449 (8.0%) | 363 (7.8%) |
| $65,000 to $74,999 | 538 (9.6%) | 319 (6.8%) |
| $75,000 to $99,999 | 750 (13.3%) | 224 (4.8%) |
| $100,000+ | 581 (10.3%) | 201 (4.3%) |
| Total | 5,628 (100.0%) | 4,665 (100.0%) |
Earnings by Sex by Educational Attainment in Tullahoma
Average earnings in Tullahoma are $49,780 for men and $31,563 for women, a difference of 36.6%. Men with an educational attainment of graduate degree enjoy the highest average annual earnings of $71,641, while those with less than high school education earn the least with $25,200. Women with an educational attainment of graduate degree earn the most with the average annual earnings of $57,476, while those with high school diploma education have the smallest earnings of $17,067.
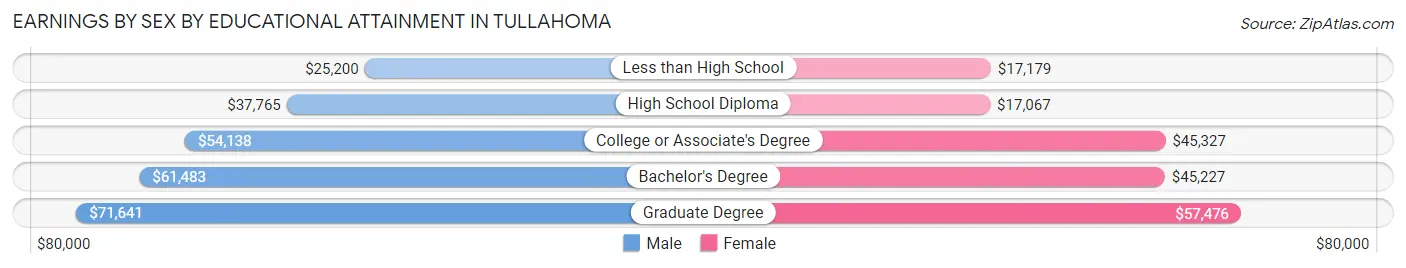
| Educational Attainment | Male Income | Female Income |
| Less than High School | $25,200 | $17,179 |
| High School Diploma | $37,765 | $17,067 |
| College or Associate's Degree | $54,138 | $45,327 |
| Bachelor's Degree | $61,483 | $45,227 |
| Graduate Degree | $71,641 | $57,476 |
| Total | $49,780 | $31,563 |
Family Income in Tullahoma
Family Income Brackets in Tullahoma
According to the Tullahoma family income data, there are 1,303 families falling into the $100,000 to $149,999 income range, which is the most common income bracket and makes up 23.0% of all families. Conversely, the less than $10,000 income bracket is the least frequent group with only 164 families (2.9%) belonging to this category.
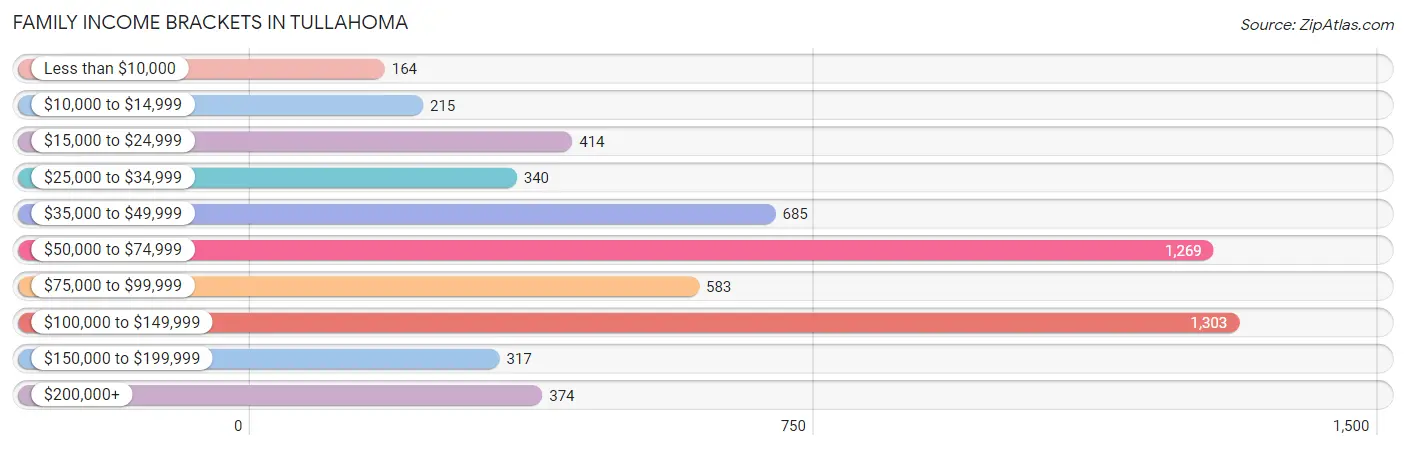
| Income Bracket | # Families | % Families |
| Less than $10,000 | 164 | 2.9% |
| $10,000 to $14,999 | 215 | 3.8% |
| $15,000 to $24,999 | 414 | 7.3% |
| $25,000 to $34,999 | 340 | 6.0% |
| $35,000 to $49,999 | 685 | 12.1% |
| $50,000 to $74,999 | 1,269 | 22.4% |
| $75,000 to $99,999 | 583 | 10.3% |
| $100,000 to $149,999 | 1,303 | 23.0% |
| $150,000 to $199,999 | 317 | 5.6% |
| $200,000+ | 374 | 6.6% |
Family Income by Famaliy Size in Tullahoma
5-person families (490 | 8.6%) account for the highest median family income in Tullahoma with $115,441 per family, while 2-person families (3,297 | 58.2%) have the highest median income of $32,462 per family member.
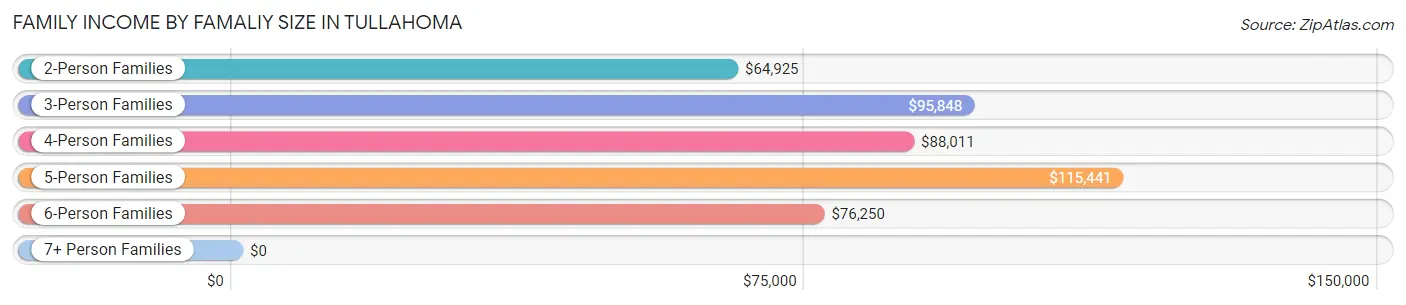
| Income Bracket | # Families | Median Income |
| 2-Person Families | 3,297 (58.2%) | $64,925 |
| 3-Person Families | 1,081 (19.1%) | $95,848 |
| 4-Person Families | 665 (11.7%) | $88,011 |
| 5-Person Families | 490 (8.6%) | $115,441 |
| 6-Person Families | 111 (2.0%) | $76,250 |
| 7+ Person Families | 21 (0.4%) | $0 |
| Total | 5,665 (100.0%) | $71,515 |
Family Income by Number of Earners in Tullahoma
The median family income in Tullahoma is $71,515, with families comprising 3+ earners (482) having the highest median family income of $119,271, while families with no earners (1,171) have the lowest median family income of $42,044, accounting for 8.5% and 20.7% of families, respectively.
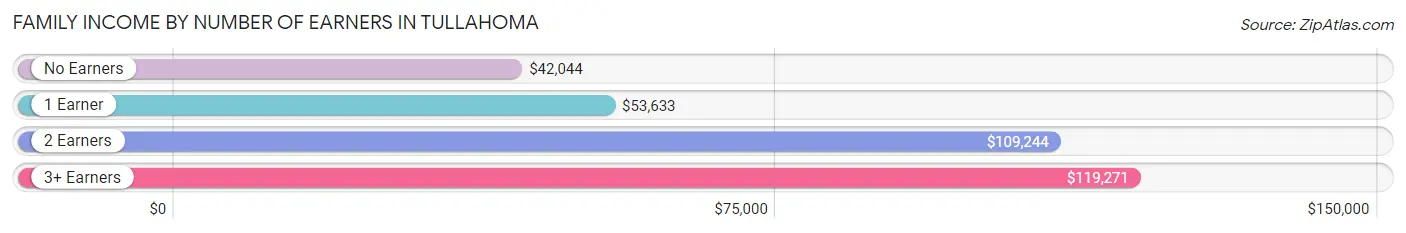
| Number of Earners | # Families | Median Income |
| No Earners | 1,171 (20.7%) | $42,044 |
| 1 Earner | 1,987 (35.1%) | $53,633 |
| 2 Earners | 2,025 (35.7%) | $109,244 |
| 3+ Earners | 482 (8.5%) | $119,271 |
| Total | 5,665 (100.0%) | $71,515 |
Household Income in Tullahoma
Household Income Brackets in Tullahoma
With 1,732 households falling in the category, the $50,000 to $74,999 income range is the most frequent in Tullahoma, accounting for 19.9% of all households. In contrast, only 374 households (4.3%) fall into the $200,000+ income bracket, making it the least populous group.
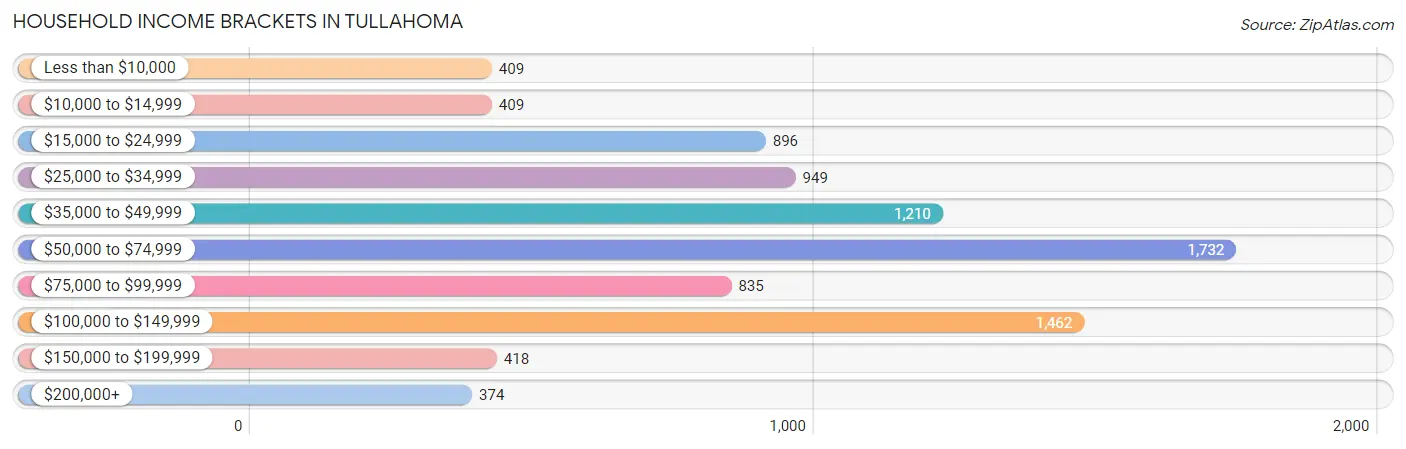
| Income Bracket | # Households | % Households |
| Less than $10,000 | 409 | 4.7% |
| $10,000 to $14,999 | 409 | 4.7% |
| $15,000 to $24,999 | 896 | 10.3% |
| $25,000 to $34,999 | 949 | 10.9% |
| $35,000 to $49,999 | 1,210 | 13.9% |
| $50,000 to $74,999 | 1,732 | 19.9% |
| $75,000 to $99,999 | 835 | 9.6% |
| $100,000 to $149,999 | 1,462 | 16.8% |
| $150,000 to $199,999 | 418 | 4.8% |
| $200,000+ | 374 | 4.3% |
Household Income by Householder Age in Tullahoma
The median household income in Tullahoma is $56,771, with the highest median household income of $73,750 found in the 25 to 44 years age bracket for the primary householder. A total of 2,627 households (30.2%) fall into this category. Meanwhile, the 15 to 24 years age bracket for the primary householder has the lowest median household income of $31,618, with 460 households (5.3%) in this group.
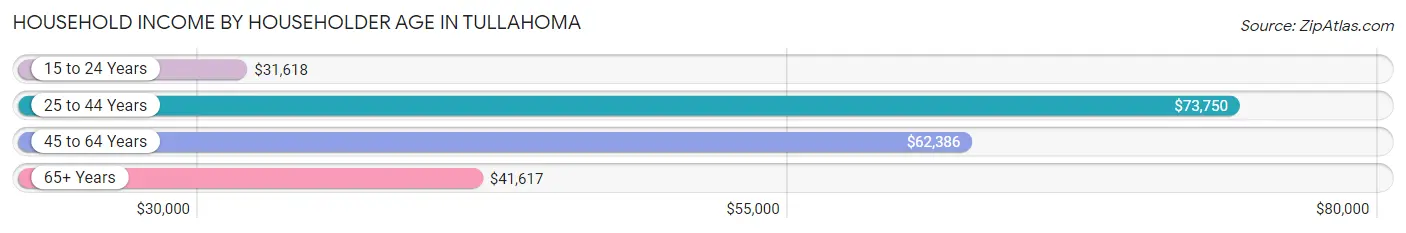
| Income Bracket | # Households | Median Income |
| 15 to 24 Years | 460 (5.3%) | $31,618 |
| 25 to 44 Years | 2,627 (30.2%) | $73,750 |
| 45 to 64 Years | 2,973 (34.2%) | $62,386 |
| 65+ Years | 2,643 (30.4%) | $41,617 |
| Total | 8,703 (100.0%) | $56,771 |
Poverty in Tullahoma
Income Below Poverty by Sex and Age in Tullahoma
With 16.5% poverty level for males and 19.4% for females among the residents of Tullahoma, 15 year old males and 6 to 11 year old females are the most vulnerable to poverty, with 25 males (40.3%) and 274 females (34.9%) in their respective age groups living below the poverty level.
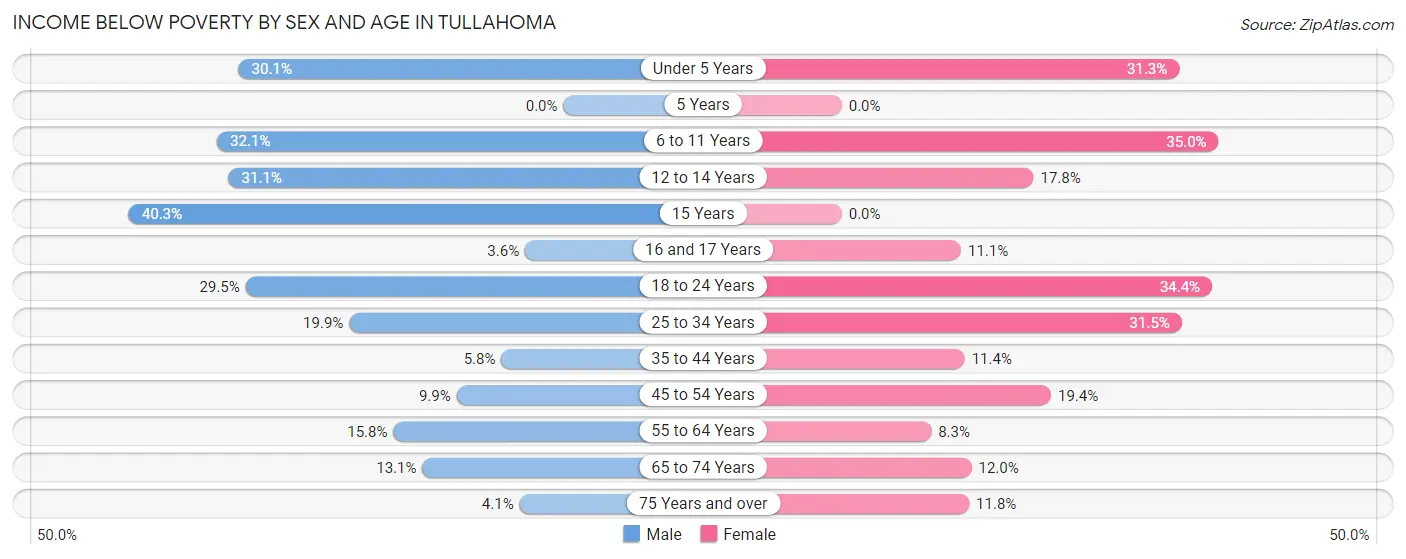
| Age Bracket | Male | Female |
| Under 5 Years | 232 (30.1%) | 303 (31.3%) |
| 5 Years | 0 (0.0%) | 0 (0.0%) |
| 6 to 11 Years | 241 (32.1%) | 274 (34.9%) |
| 12 to 14 Years | 73 (31.1%) | 63 (17.8%) |
| 15 Years | 25 (40.3%) | 0 (0.0%) |
| 16 and 17 Years | 12 (3.6%) | 33 (11.1%) |
| 18 to 24 Years | 187 (29.5%) | 270 (34.4%) |
| 25 to 34 Years | 326 (19.9%) | 398 (31.5%) |
| 35 to 44 Years | 62 (5.8%) | 159 (11.4%) |
| 45 to 54 Years | 135 (9.9%) | 227 (19.4%) |
| 55 to 64 Years | 208 (15.8%) | 113 (8.3%) |
| 65 to 74 Years | 145 (13.1%) | 142 (12.0%) |
| 75 Years and over | 30 (4.1%) | 104 (11.8%) |
| Total | 1,676 (16.5%) | 2,086 (19.4%) |
Income Above Poverty by Sex and Age in Tullahoma
According to the poverty statistics in Tullahoma, males aged 5 years and females aged 5 years are the age groups that are most secure financially, with 100.0% of males and 100.0% of females in these age groups living above the poverty line.
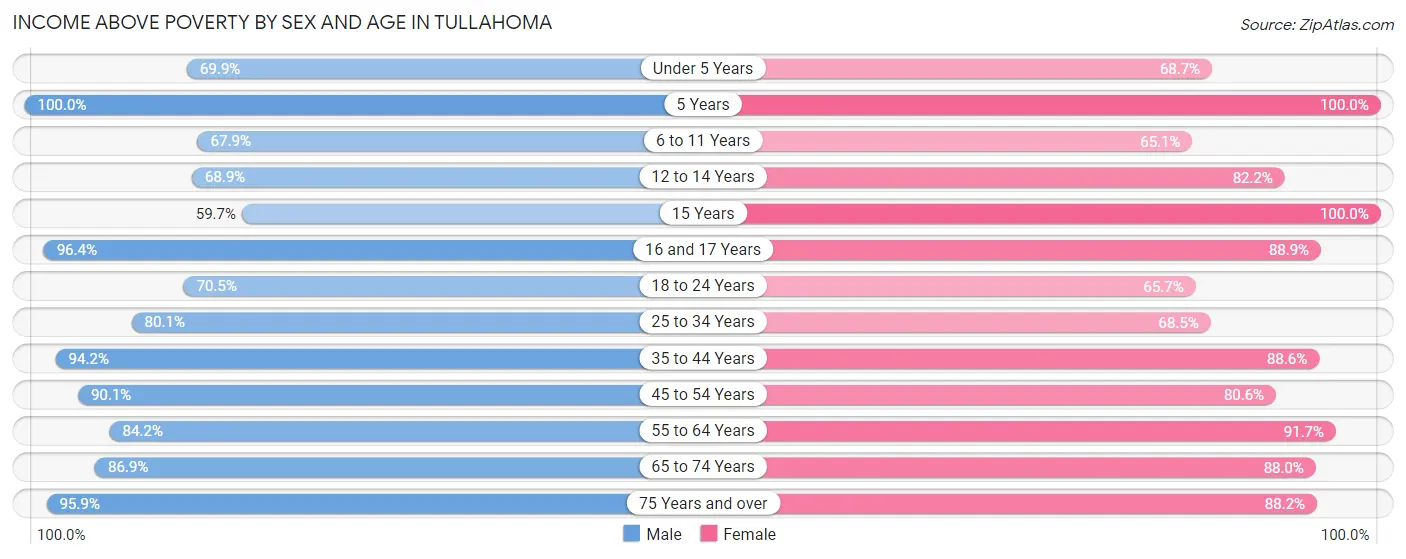
| Age Bracket | Male | Female |
| Under 5 Years | 538 (69.9%) | 665 (68.7%) |
| 5 Years | 107 (100.0%) | 158 (100.0%) |
| 6 to 11 Years | 509 (67.9%) | 510 (65.0%) |
| 12 to 14 Years | 162 (68.9%) | 291 (82.2%) |
| 15 Years | 37 (59.7%) | 188 (100.0%) |
| 16 and 17 Years | 325 (96.4%) | 265 (88.9%) |
| 18 to 24 Years | 447 (70.5%) | 516 (65.6%) |
| 25 to 34 Years | 1,314 (80.1%) | 864 (68.5%) |
| 35 to 44 Years | 1,014 (94.2%) | 1,235 (88.6%) |
| 45 to 54 Years | 1,227 (90.1%) | 942 (80.6%) |
| 55 to 64 Years | 1,110 (84.2%) | 1,248 (91.7%) |
| 65 to 74 Years | 963 (86.9%) | 1,037 (88.0%) |
| 75 Years and over | 708 (95.9%) | 776 (88.2%) |
| Total | 8,461 (83.5%) | 8,695 (80.6%) |
Income Below Poverty Among Married-Couple Families in Tullahoma
The poverty statistics for married-couple families in Tullahoma show that 5.4% or 218 of the total 4,047 families live below the poverty line. Families with 3 or 4 children have the highest poverty rate of 15.9%, comprising of 66 families. On the other hand, families with 5 or more children have the lowest poverty rate of 0.0%, which includes 0 families.
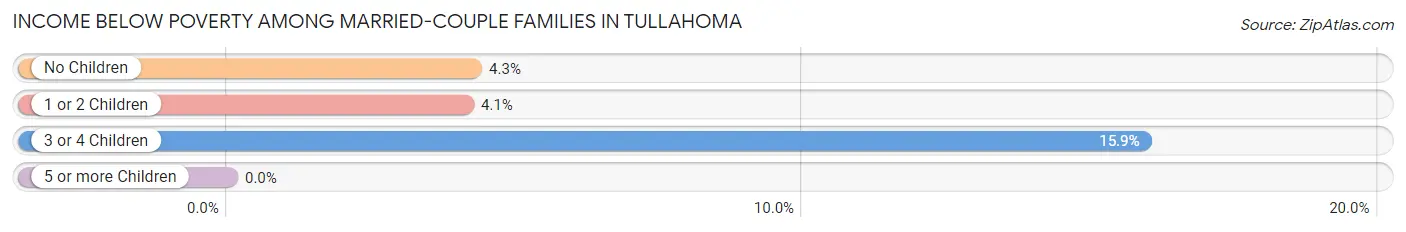
| Children | Above Poverty | Below Poverty |
| No Children | 2,432 (95.8%) | 108 (4.3%) |
| 1 or 2 Children | 1,027 (95.9%) | 44 (4.1%) |
| 3 or 4 Children | 349 (84.1%) | 66 (15.9%) |
| 5 or more Children | 21 (100.0%) | 0 (0.0%) |
| Total | 3,829 (94.6%) | 218 (5.4%) |
Income Below Poverty Among Single-Parent Households in Tullahoma
According to the poverty data in Tullahoma, 24.4% or 157 single-father households and 39.4% or 384 single-mother households are living below the poverty line. Among single-father households, those with 3 or 4 children have the highest poverty rate, with 60 households (70.6%) experiencing poverty. Likewise, among single-mother households, those with 3 or 4 children have the highest poverty rate, with 39 households (67.2%) falling below the poverty line.
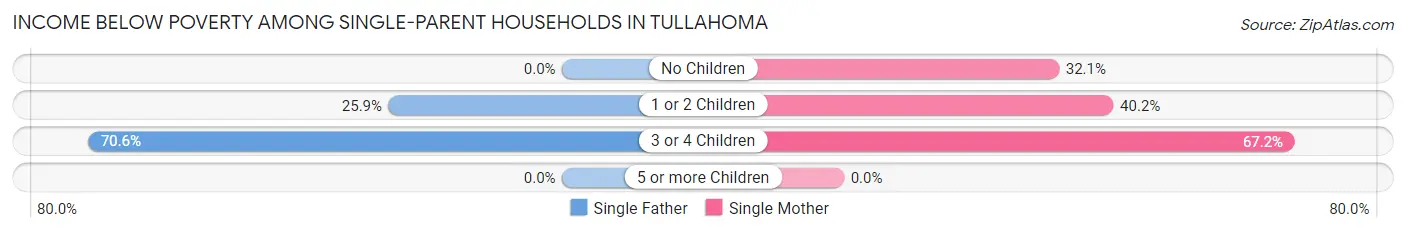
| Children | Single Father | Single Mother |
| No Children | 0 (0.0%) | 92 (32.1%) |
| 1 or 2 Children | 97 (25.9%) | 253 (40.2%) |
| 3 or 4 Children | 60 (70.6%) | 39 (67.2%) |
| 5 or more Children | 0 (0.0%) | 0 (0.0%) |
| Total | 157 (24.4%) | 384 (39.4%) |
Income Below Poverty Among Married-Couple vs Single-Parent Households in Tullahoma
The poverty data for Tullahoma shows that 218 of the married-couple family households (5.4%) and 541 of the single-parent households (33.4%) are living below the poverty level. Within the married-couple family households, those with 3 or 4 children have the highest poverty rate, with 66 households (15.9%) falling below the poverty line. Among the single-parent households, those with 3 or 4 children have the highest poverty rate, with 99 household (69.2%) living below poverty.
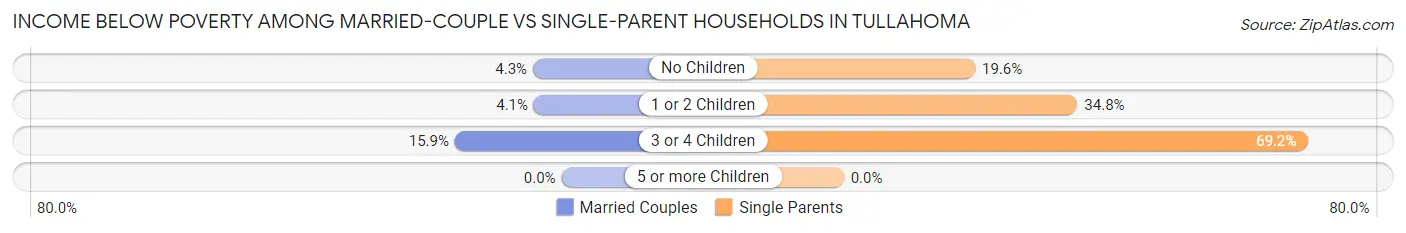
| Children | Married-Couple Families | Single-Parent Households |
| No Children | 108 (4.3%) | 92 (19.6%) |
| 1 or 2 Children | 44 (4.1%) | 350 (34.8%) |
| 3 or 4 Children | 66 (15.9%) | 99 (69.2%) |
| 5 or more Children | 0 (0.0%) | 0 (0.0%) |
| Total | 218 (5.4%) | 541 (33.4%) |
Employment Characteristics in Tullahoma
Employment by Class of Employer in Tullahoma
Among the 9,247 employed individuals in Tullahoma, private company employees (6,901 | 74.6%), local government employees (643 | 7.0%), and self-employed (not incorporated) (577 | 6.2%) make up the most common classes of employment.
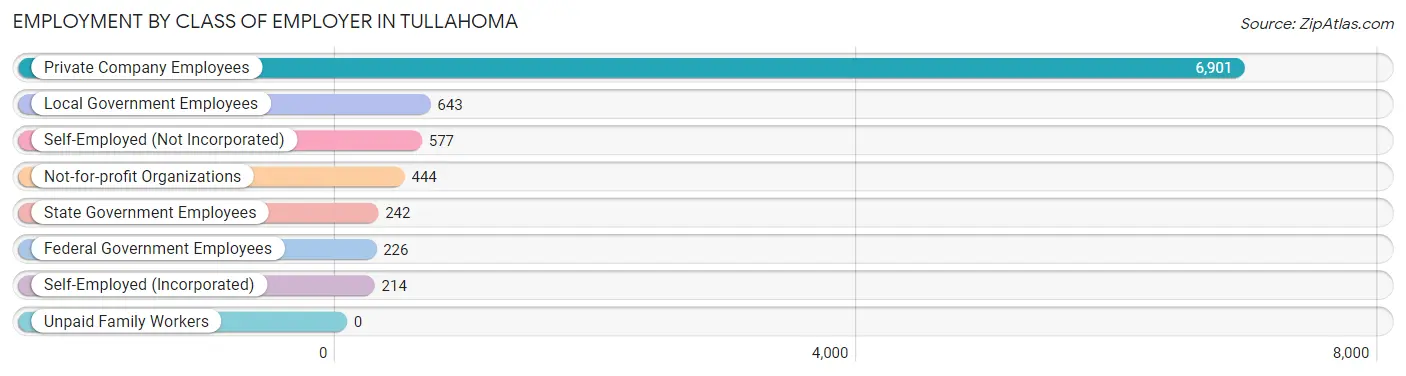
| Employer Class | # Employees | % Employees |
| Private Company Employees | 6,901 | 74.6% |
| Self-Employed (Incorporated) | 214 | 2.3% |
| Self-Employed (Not Incorporated) | 577 | 6.2% |
| Not-for-profit Organizations | 444 | 4.8% |
| Local Government Employees | 643 | 7.0% |
| State Government Employees | 242 | 2.6% |
| Federal Government Employees | 226 | 2.4% |
| Unpaid Family Workers | 0 | 0.0% |
| Total | 9,247 | 100.0% |
Employment Status by Age in Tullahoma
According to the labor force statistics for Tullahoma, out of the total population over 16 years of age (16,689), 59.9% or 9,997 individuals are in the labor force, with 4.1% or 410 of them unemployed. The age group with the highest labor force participation rate is 30 to 34 years, with 87.9% or 1,325 individuals in the labor force. Within the labor force, the 16 to 19 years age range has the highest percentage of unemployed individuals, with 16.5% or 91 of them being unemployed.
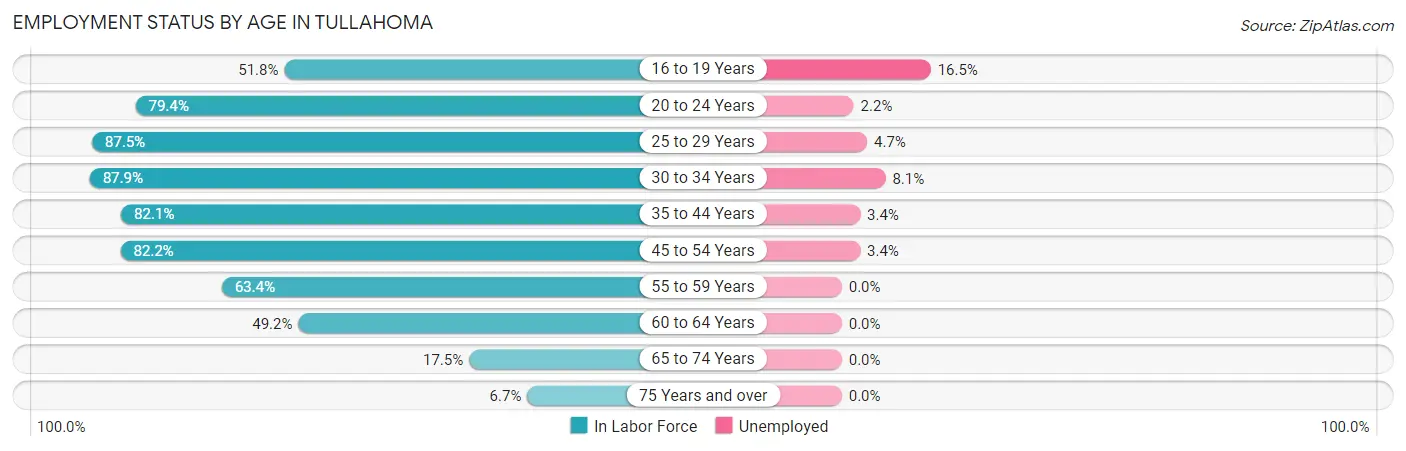
| Age Bracket | In Labor Force | Unemployed |
| 16 to 19 Years | 553 (51.8%) | 91 (16.5%) |
| 20 to 24 Years | 784 (79.4%) | 17 (2.2%) |
| 25 to 29 Years | 1,221 (87.5%) | 57 (4.7%) |
| 30 to 34 Years | 1,325 (87.9%) | 107 (8.1%) |
| 35 to 44 Years | 2,028 (82.1%) | 69 (3.4%) |
| 45 to 54 Years | 2,084 (82.2%) | 71 (3.4%) |
| 55 to 59 Years | 772 (63.4%) | 0 (0.0%) |
| 60 to 64 Years | 719 (49.2%) | 0 (0.0%) |
| 65 to 74 Years | 403 (17.5%) | 0 (0.0%) |
| 75 Years and over | 117 (6.7%) | 0 (0.0%) |
| Total | 9,997 (59.9%) | 410 (4.1%) |
Employment Status by Educational Attainment in Tullahoma
According to labor force statistics for Tullahoma, 77.0% of individuals (8,151) out of the total population between 25 and 64 years of age (10,586) are in the labor force, with 3.7% or 302 of them being unemployed. The group with the highest labor force participation rate are those with the educational attainment of bachelor's degree or higher, with 84.7% or 2,309 individuals in the labor force. Within the labor force, individuals with high school diploma education have the highest percentage of unemployment, with 5.6% or 148 of them being unemployed.
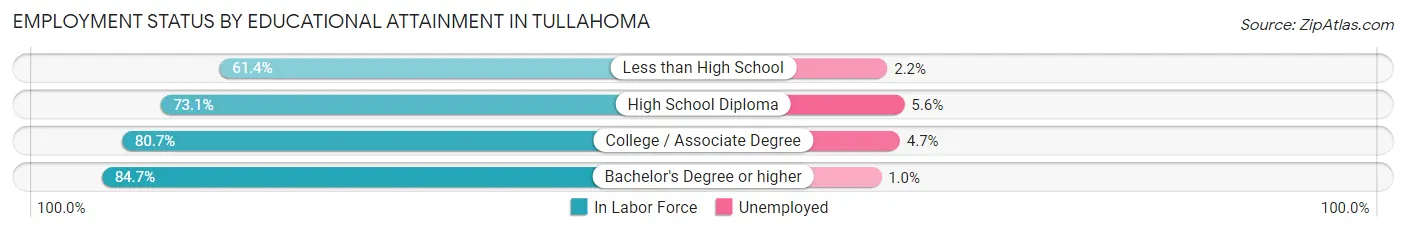
| Educational Attainment | In Labor Force | Unemployed |
| Less than High School | 733 (61.4%) | 26 (2.2%) |
| High School Diploma | 2,644 (73.1%) | 203 (5.6%) |
| College / Associate Degree | 2,461 (80.7%) | 143 (4.7%) |
| Bachelor's Degree or higher | 2,309 (84.7%) | 27 (1.0%) |
| Total | 8,151 (77.0%) | 392 (3.7%) |
Employment Occupations by Sex in Tullahoma
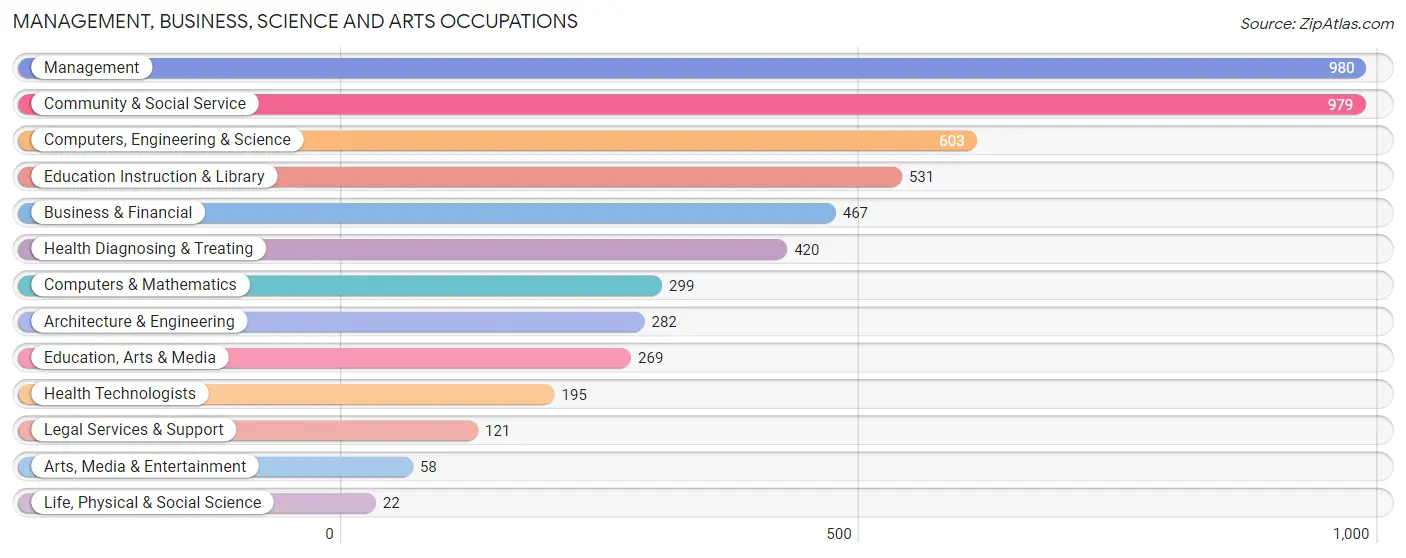
Management, Business, Science and Arts Occupations
The most common Management, Business, Science and Arts occupations in Tullahoma are Management (980 | 10.2%), Community & Social Service (979 | 10.2%), Computers, Engineering & Science (603 | 6.3%), Education Instruction & Library (531 | 5.5%), and Business & Financial (467 | 4.9%).
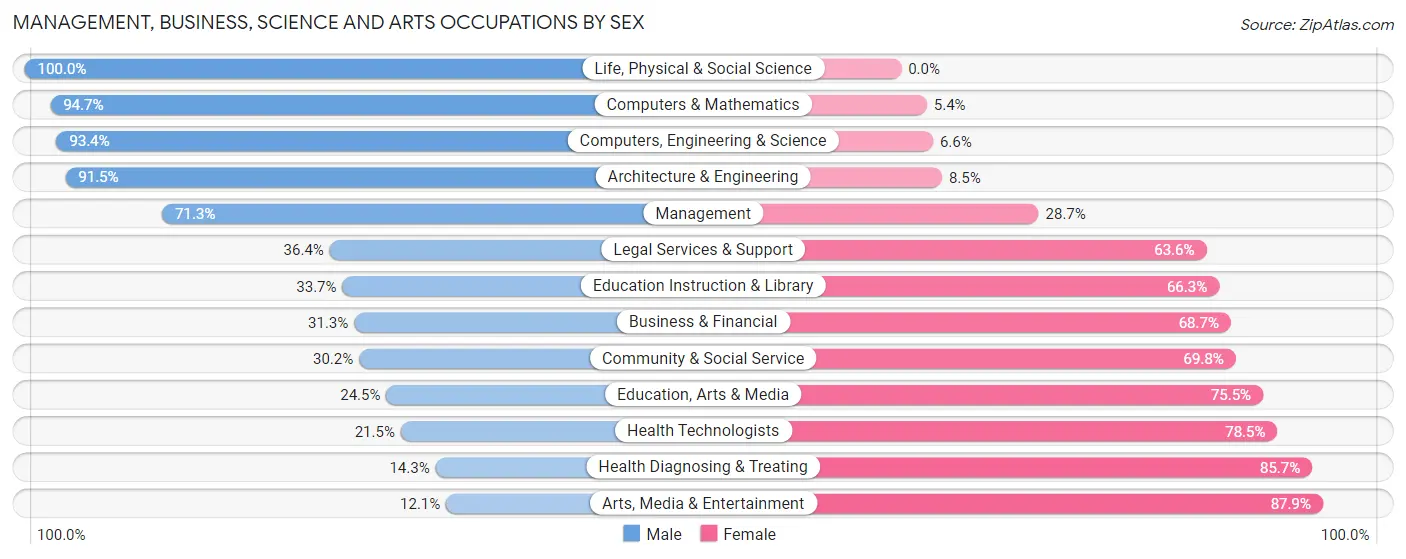
Management, Business, Science and Arts Occupations by Sex
Within the Management, Business, Science and Arts occupations in Tullahoma, the most male-oriented occupations are Life, Physical & Social Science (100.0%), Computers & Mathematics (94.7%), and Computers, Engineering & Science (93.4%), while the most female-oriented occupations are Arts, Media & Entertainment (87.9%), Health Diagnosing & Treating (85.7%), and Health Technologists (78.5%).
| Occupation | Male | Female |
| Management | 699 (71.3%) | 281 (28.7%) |
| Business & Financial | 146 (31.3%) | 321 (68.7%) |
| Computers, Engineering & Science | 563 (93.4%) | 40 (6.6%) |
| Computers & Mathematics | 283 (94.7%) | 16 (5.3%) |
| Architecture & Engineering | 258 (91.5%) | 24 (8.5%) |
| Life, Physical & Social Science | 22 (100.0%) | 0 (0.0%) |
| Community & Social Service | 296 (30.2%) | 683 (69.8%) |
| Education, Arts & Media | 66 (24.5%) | 203 (75.5%) |
| Legal Services & Support | 44 (36.4%) | 77 (63.6%) |
| Education Instruction & Library | 179 (33.7%) | 352 (66.3%) |
| Arts, Media & Entertainment | 7 (12.1%) | 51 (87.9%) |
| Health Diagnosing & Treating | 60 (14.3%) | 360 (85.7%) |
| Health Technologists | 42 (21.5%) | 153 (78.5%) |
| Total (Category) | 1,764 (51.1%) | 1,685 (48.8%) |
| Total (Overall) | 5,364 (55.9%) | 4,229 (44.1%) |
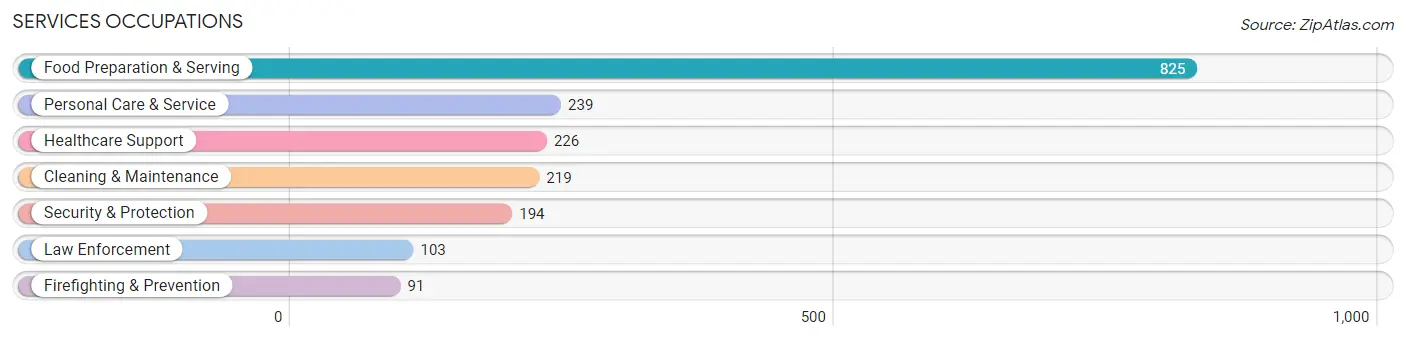
Services Occupations
The most common Services occupations in Tullahoma are Food Preparation & Serving (825 | 8.6%), Personal Care & Service (239 | 2.5%), Healthcare Support (226 | 2.4%), Cleaning & Maintenance (219 | 2.3%), and Security & Protection (194 | 2.0%).
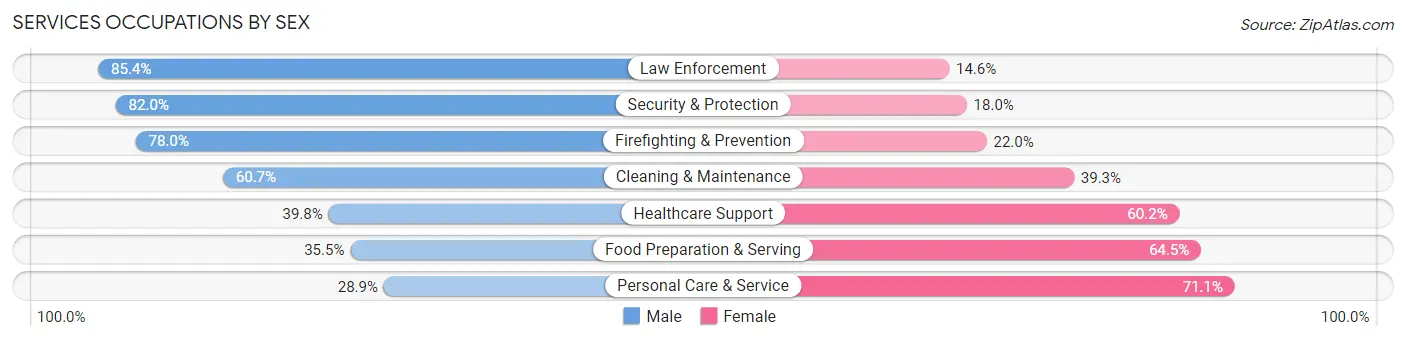
Services Occupations by Sex
Within the Services occupations in Tullahoma, the most male-oriented occupations are Law Enforcement (85.4%), Security & Protection (82.0%), and Firefighting & Prevention (78.0%), while the most female-oriented occupations are Personal Care & Service (71.1%), Food Preparation & Serving (64.5%), and Healthcare Support (60.2%).
| Occupation | Male | Female |
| Healthcare Support | 90 (39.8%) | 136 (60.2%) |
| Security & Protection | 159 (82.0%) | 35 (18.0%) |
| Firefighting & Prevention | 71 (78.0%) | 20 (22.0%) |
| Law Enforcement | 88 (85.4%) | 15 (14.6%) |
| Food Preparation & Serving | 293 (35.5%) | 532 (64.5%) |
| Cleaning & Maintenance | 133 (60.7%) | 86 (39.3%) |
| Personal Care & Service | 69 (28.9%) | 170 (71.1%) |
| Total (Category) | 744 (43.7%) | 959 (56.3%) |
| Total (Overall) | 5,364 (55.9%) | 4,229 (44.1%) |
Sales and Office Occupations
The most common Sales and Office occupations in Tullahoma are Sales & Related (908 | 9.5%), and Office & Administration (696 | 7.3%).

Sales and Office Occupations by Sex
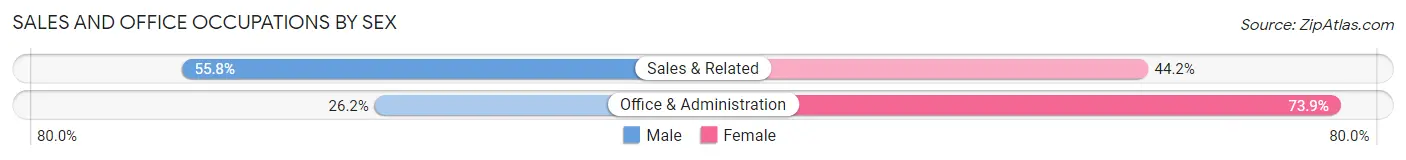
| Occupation | Male | Female |
| Sales & Related | 507 (55.8%) | 401 (44.2%) |
| Office & Administration | 182 (26.2%) | 514 (73.9%) |
| Total (Category) | 689 (43.0%) | 915 (57.0%) |
| Total (Overall) | 5,364 (55.9%) | 4,229 (44.1%) |
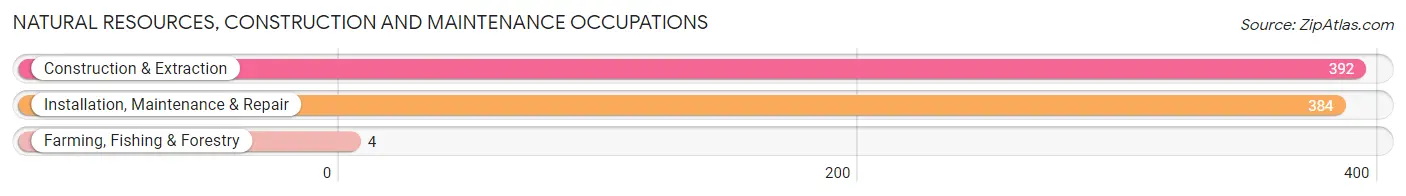
Natural Resources, Construction and Maintenance Occupations
The most common Natural Resources, Construction and Maintenance occupations in Tullahoma are Construction & Extraction (392 | 4.1%), Installation, Maintenance & Repair (384 | 4.0%), and Farming, Fishing & Forestry (4 | 0.0%).
Natural Resources, Construction and Maintenance Occupations by Sex
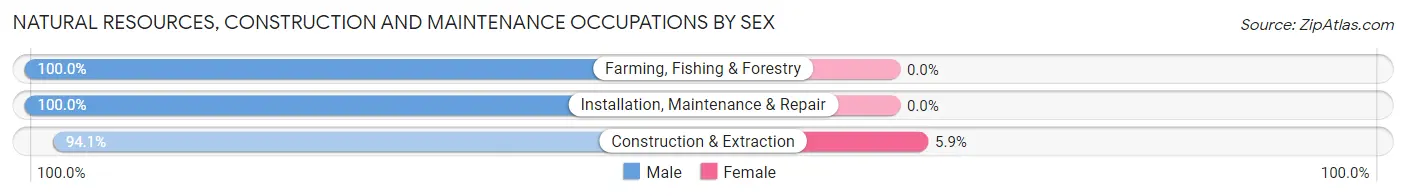
| Occupation | Male | Female |
| Farming, Fishing & Forestry | 4 (100.0%) | 0 (0.0%) |
| Construction & Extraction | 369 (94.1%) | 23 (5.9%) |
| Installation, Maintenance & Repair | 384 (100.0%) | 0 (0.0%) |
| Total (Category) | 757 (97.1%) | 23 (2.9%) |
| Total (Overall) | 5,364 (55.9%) | 4,229 (44.1%) |
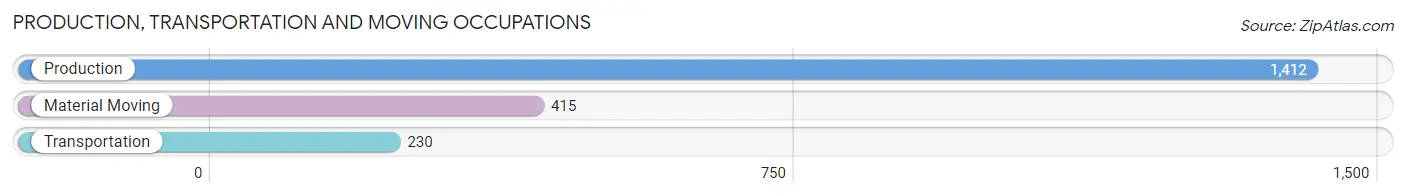
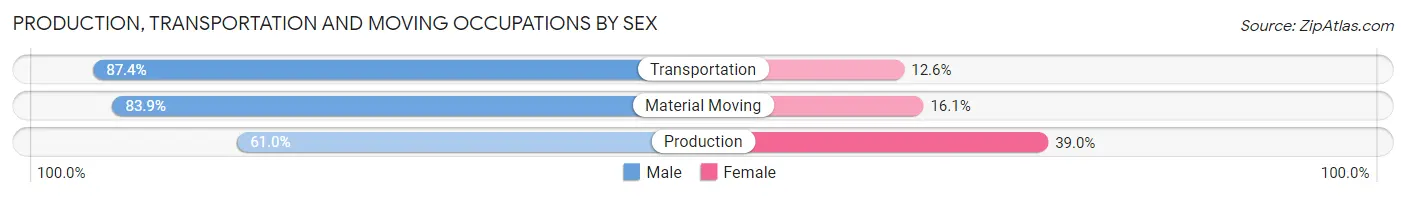
Production, Transportation and Moving Occupations
The most common Production, Transportation and Moving occupations in Tullahoma are Production (1,412 | 14.7%), Material Moving (415 | 4.3%), and Transportation (230 | 2.4%).
Production, Transportation and Moving Occupations by Sex
| Occupation | Male | Female |
| Production | 861 (61.0%) | 551 (39.0%) |
| Transportation | 201 (87.4%) | 29 (12.6%) |
| Material Moving | 348 (83.9%) | 67 (16.1%) |
| Total (Category) | 1,410 (68.5%) | 647 (31.5%) |
| Total (Overall) | 5,364 (55.9%) | 4,229 (44.1%) |
Employment Industries by Sex in Tullahoma
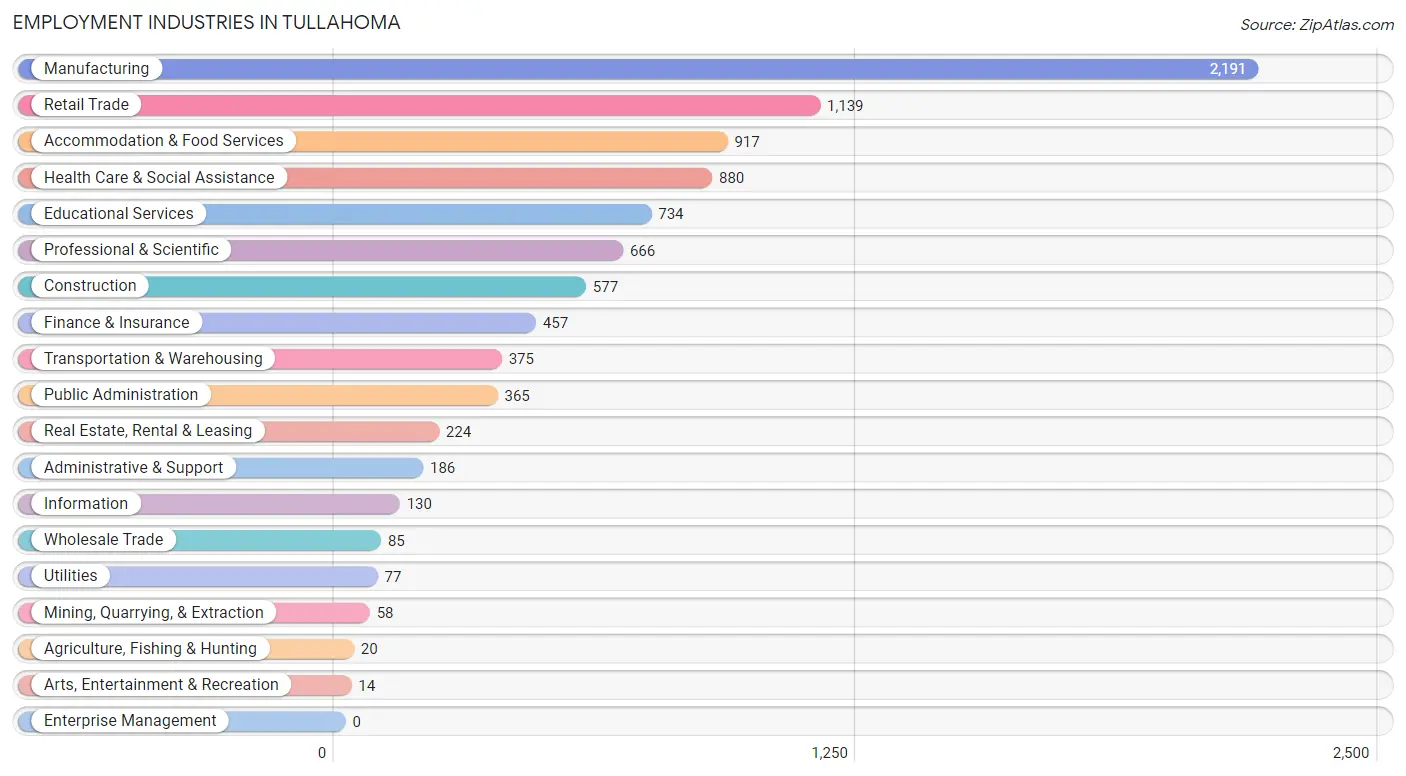
Employment Industries in Tullahoma
The major employment industries in Tullahoma include Manufacturing (2,191 | 22.8%), Retail Trade (1,139 | 11.9%), Accommodation & Food Services (917 | 9.6%), Health Care & Social Assistance (880 | 9.2%), and Educational Services (734 | 7.6%).
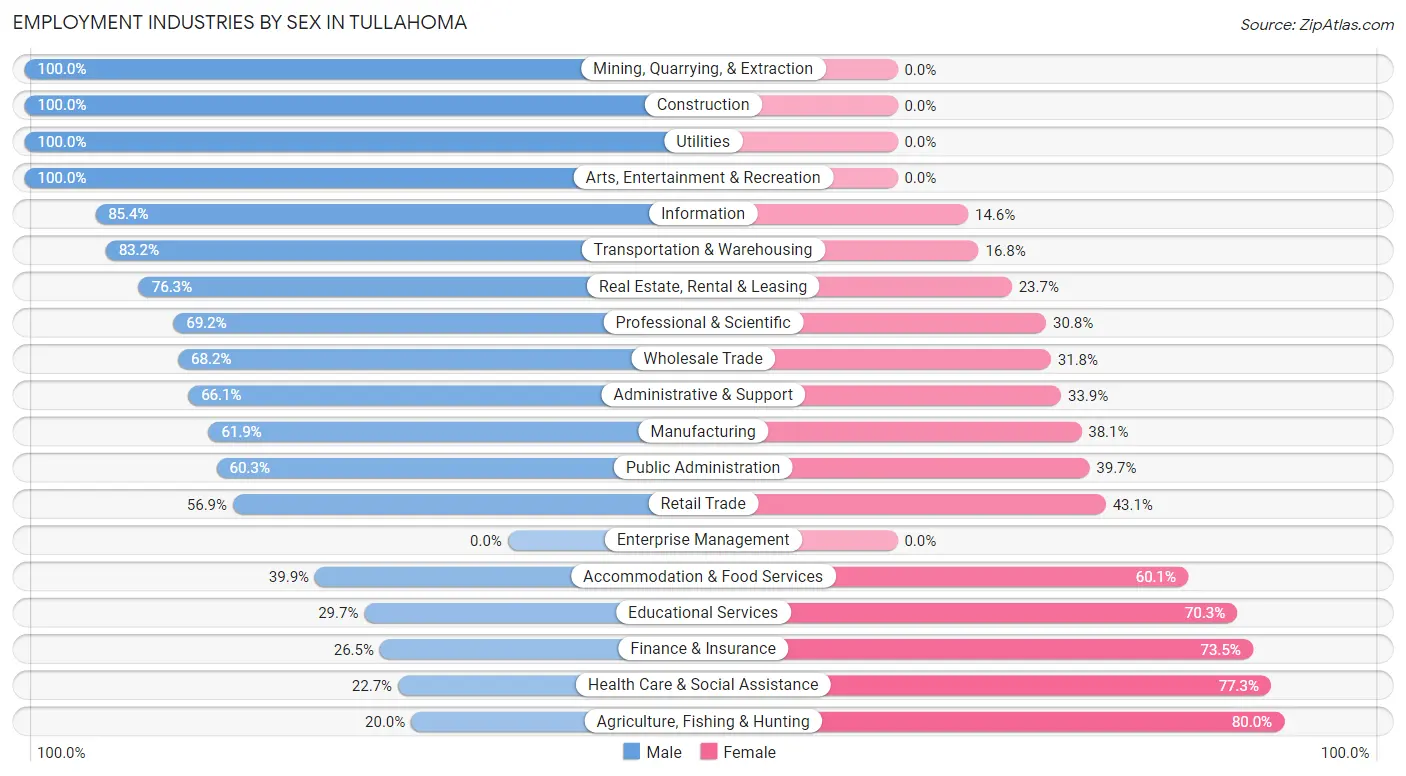
Employment Industries by Sex in Tullahoma
The Tullahoma industries that see more men than women are Mining, Quarrying, & Extraction (100.0%), Construction (100.0%), and Utilities (100.0%), whereas the industries that tend to have a higher number of women are Agriculture, Fishing & Hunting (80.0%), Health Care & Social Assistance (77.3%), and Finance & Insurance (73.5%).
| Industry | Male | Female |
| Agriculture, Fishing & Hunting | 4 (20.0%) | 16 (80.0%) |
| Mining, Quarrying, & Extraction | 58 (100.0%) | 0 (0.0%) |
| Construction | 577 (100.0%) | 0 (0.0%) |
| Manufacturing | 1,357 (61.9%) | 834 (38.1%) |
| Wholesale Trade | 58 (68.2%) | 27 (31.8%) |
| Retail Trade | 648 (56.9%) | 491 (43.1%) |
| Transportation & Warehousing | 312 (83.2%) | 63 (16.8%) |
| Utilities | 77 (100.0%) | 0 (0.0%) |
| Information | 111 (85.4%) | 19 (14.6%) |
| Finance & Insurance | 121 (26.5%) | 336 (73.5%) |
| Real Estate, Rental & Leasing | 171 (76.3%) | 53 (23.7%) |
| Professional & Scientific | 461 (69.2%) | 205 (30.8%) |
| Enterprise Management | 0 (0.0%) | 0 (0.0%) |
| Administrative & Support | 123 (66.1%) | 63 (33.9%) |
| Educational Services | 218 (29.7%) | 516 (70.3%) |
| Health Care & Social Assistance | 200 (22.7%) | 680 (77.3%) |
| Arts, Entertainment & Recreation | 14 (100.0%) | 0 (0.0%) |
| Accommodation & Food Services | 366 (39.9%) | 551 (60.1%) |
| Public Administration | 220 (60.3%) | 145 (39.7%) |
| Total | 5,364 (55.9%) | 4,229 (44.1%) |
Education in Tullahoma
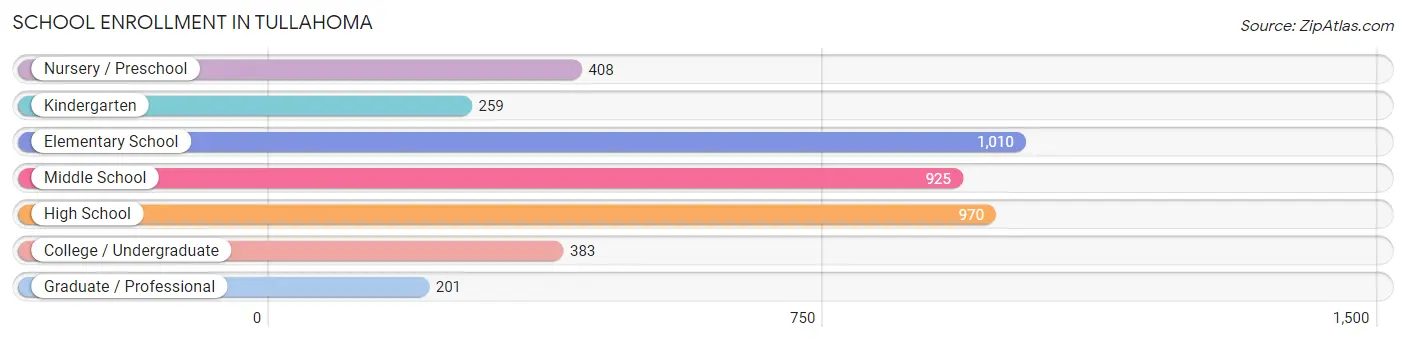
School Enrollment in Tullahoma
The most common levels of schooling among the 4,156 students in Tullahoma are elementary school (1,010 | 24.3%), high school (970 | 23.3%), and middle school (925 | 22.3%).
| School Level | # Students | % Students |
| Nursery / Preschool | 408 | 9.8% |
| Kindergarten | 259 | 6.2% |
| Elementary School | 1,010 | 24.3% |
| Middle School | 925 | 22.3% |
| High School | 970 | 23.3% |
| College / Undergraduate | 383 | 9.2% |
| Graduate / Professional | 201 | 4.8% |
| Total | 4,156 | 100.0% |
School Enrollment by Age by Funding Source in Tullahoma
Out of a total of 4,156 students who are enrolled in schools in Tullahoma, 262 (6.3%) attend a private institution, while the remaining 3,894 (93.7%) are enrolled in public schools. The age group of 35 years and over has the highest likelihood of being enrolled in private schools, with 36 (31.0% in the age bracket) enrolled. Conversely, the age group of 18 to 19 year olds has the lowest likelihood of being enrolled in a private school, with 158 (100.0% in the age bracket) attending a public institution.
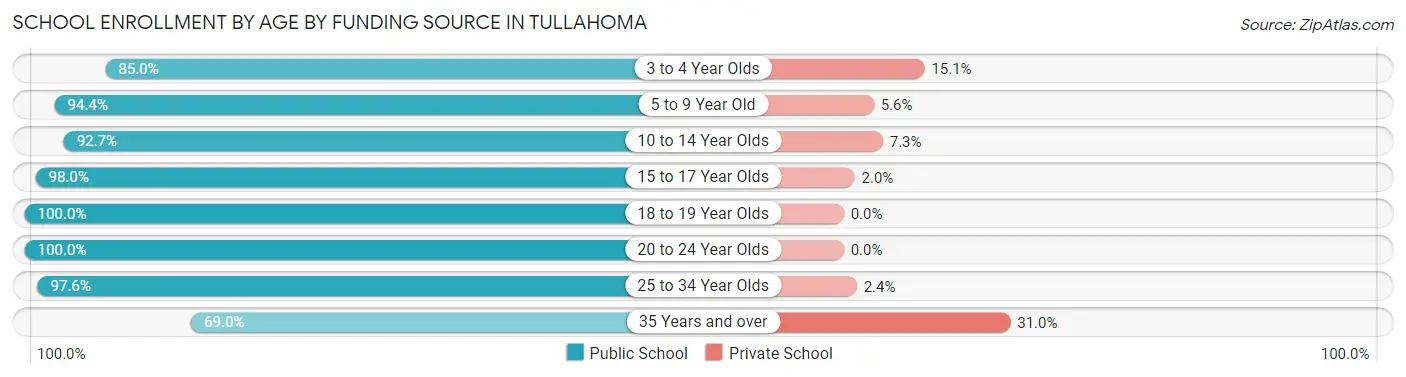
| Age Bracket | Public School | Private School |
| 3 to 4 Year Olds | 316 (85.0%) | 56 (15.0%) |
| 5 to 9 Year Old | 1,065 (94.4%) | 63 (5.6%) |
| 10 to 14 Year Olds | 1,069 (92.7%) | 84 (7.3%) |
| 15 to 17 Year Olds | 864 (98.0%) | 18 (2.0%) |
| 18 to 19 Year Olds | 158 (100.0%) | 0 (0.0%) |
| 20 to 24 Year Olds | 100 (100.0%) | 0 (0.0%) |
| 25 to 34 Year Olds | 241 (97.6%) | 6 (2.4%) |
| 35 Years and over | 80 (69.0%) | 36 (31.0%) |
| Total | 3,894 (93.7%) | 262 (6.3%) |
Educational Attainment by Field of Study in Tullahoma
Business (826 | 18.9%), education (649 | 14.9%), engineering (484 | 11.1%), social sciences (354 | 8.1%), and liberal arts & history (344 | 7.9%) are the most common fields of study among 4,362 individuals in Tullahoma who have obtained a bachelor's degree or higher.
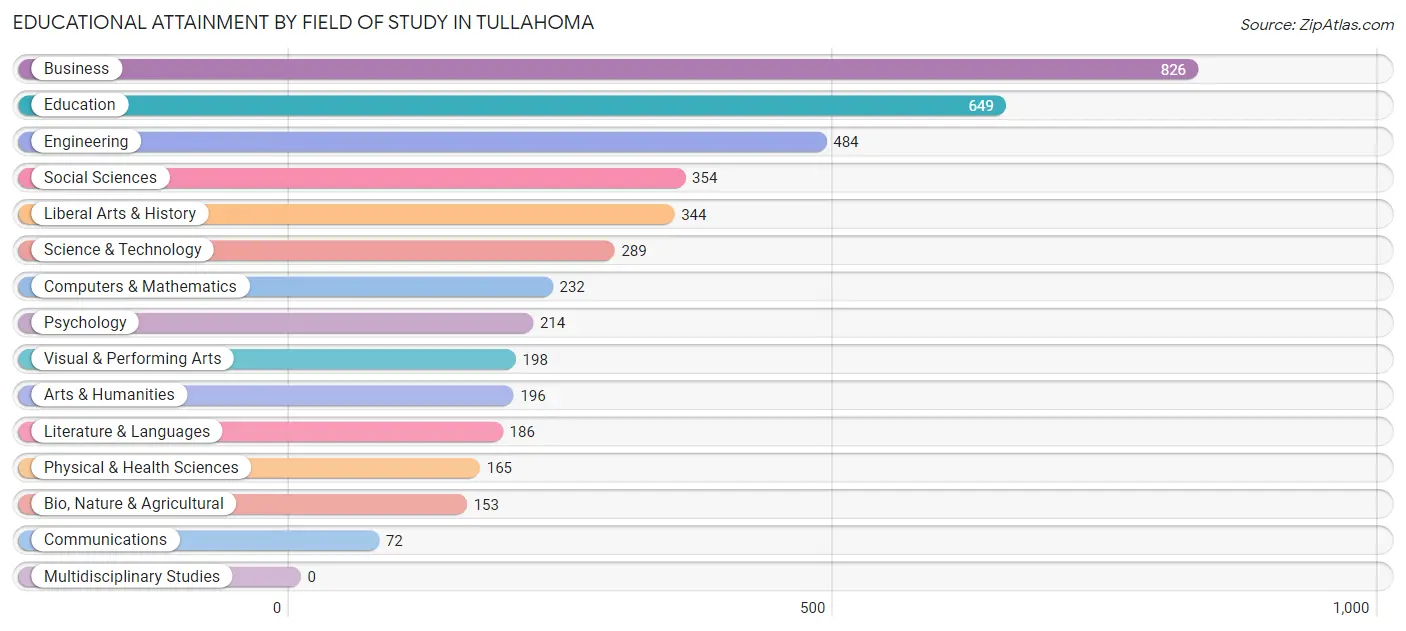
| Field of Study | # Graduates | % Graduates |
| Computers & Mathematics | 232 | 5.3% |
| Bio, Nature & Agricultural | 153 | 3.5% |
| Physical & Health Sciences | 165 | 3.8% |
| Psychology | 214 | 4.9% |
| Social Sciences | 354 | 8.1% |
| Engineering | 484 | 11.1% |
| Multidisciplinary Studies | 0 | 0.0% |
| Science & Technology | 289 | 6.6% |
| Business | 826 | 18.9% |
| Education | 649 | 14.9% |
| Literature & Languages | 186 | 4.3% |
| Liberal Arts & History | 344 | 7.9% |
| Visual & Performing Arts | 198 | 4.5% |
| Communications | 72 | 1.7% |
| Arts & Humanities | 196 | 4.5% |
| Total | 4,362 | 100.0% |
Transportation & Commute in Tullahoma
Vehicle Availability by Sex in Tullahoma
The most prevalent vehicle ownership categories in Tullahoma are males with 2 vehicles (2,477, accounting for 47.8%) and females with 2 vehicles (2,059, making up 61.4%).
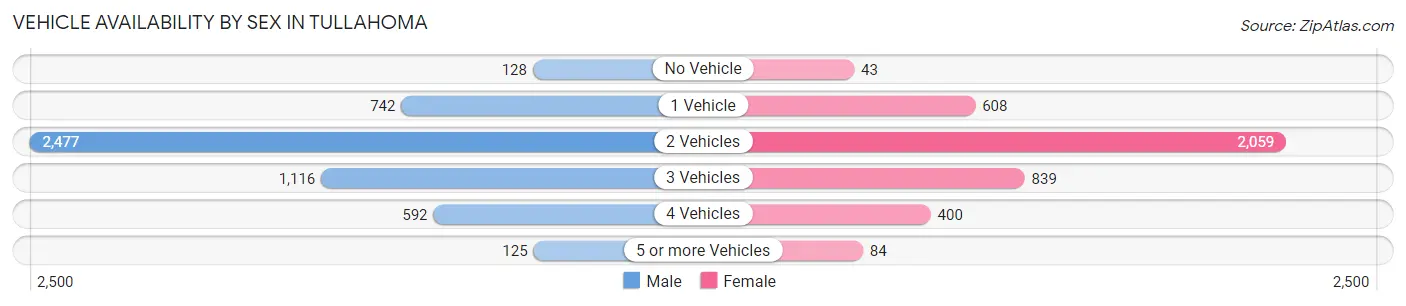
| Vehicles Available | Male | Female |
| No Vehicle | 128 (2.5%) | 43 (1.1%) |
| 1 Vehicle | 742 (14.3%) | 608 (15.1%) |
| 2 Vehicles | 2,477 (47.8%) | 2,059 (51.0%) |
| 3 Vehicles | 1,116 (21.5%) | 839 (20.8%) |
| 4 Vehicles | 592 (11.4%) | 400 (9.9%) |
| 5 or more Vehicles | 125 (2.4%) | 84 (2.1%) |
| Total | 5,180 (100.0%) | 4,033 (100.0%) |
Commute Time in Tullahoma
The most frequently occuring commute durations in Tullahoma are 5 to 9 minutes (1,817 commuters, 21.0%), 10 to 14 minutes (1,587 commuters, 18.3%), and 20 to 24 minutes (1,145 commuters, 13.2%).
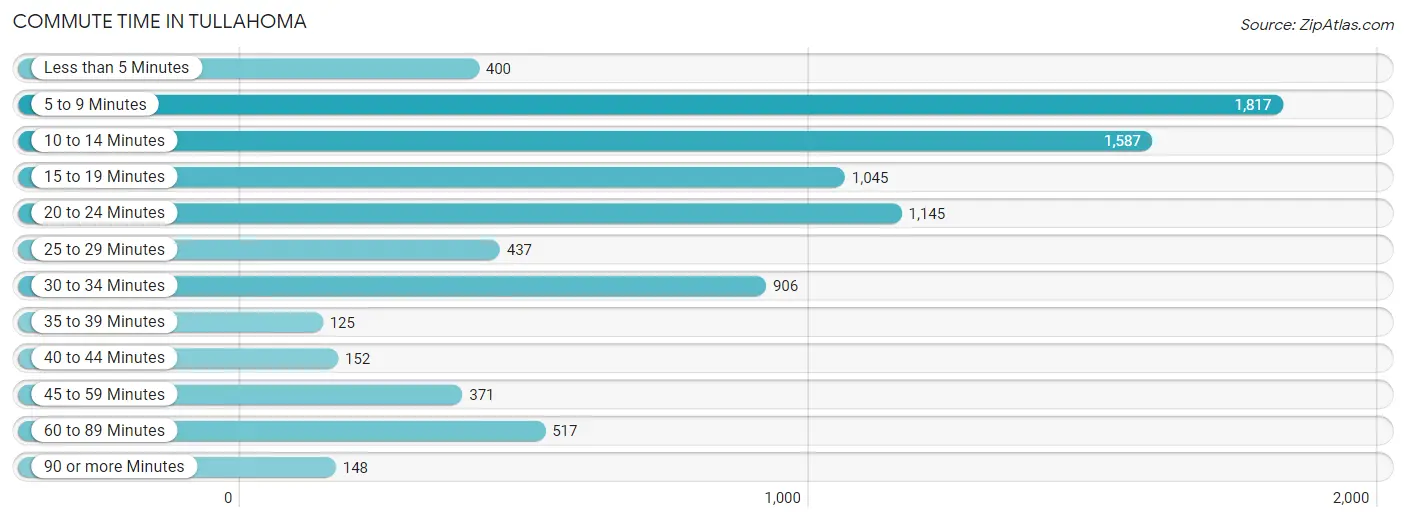
| Commute Time | # Commuters | % Commuters |
| Less than 5 Minutes | 400 | 4.6% |
| 5 to 9 Minutes | 1,817 | 21.0% |
| 10 to 14 Minutes | 1,587 | 18.3% |
| 15 to 19 Minutes | 1,045 | 12.1% |
| 20 to 24 Minutes | 1,145 | 13.2% |
| 25 to 29 Minutes | 437 | 5.1% |
| 30 to 34 Minutes | 906 | 10.5% |
| 35 to 39 Minutes | 125 | 1.5% |
| 40 to 44 Minutes | 152 | 1.8% |
| 45 to 59 Minutes | 371 | 4.3% |
| 60 to 89 Minutes | 517 | 6.0% |
| 90 or more Minutes | 148 | 1.7% |
Commute Time by Sex in Tullahoma
The most common commute times in Tullahoma are 10 to 14 minutes (984 commuters, 19.8%) for males and 5 to 9 minutes (935 commuters, 25.5%) for females.
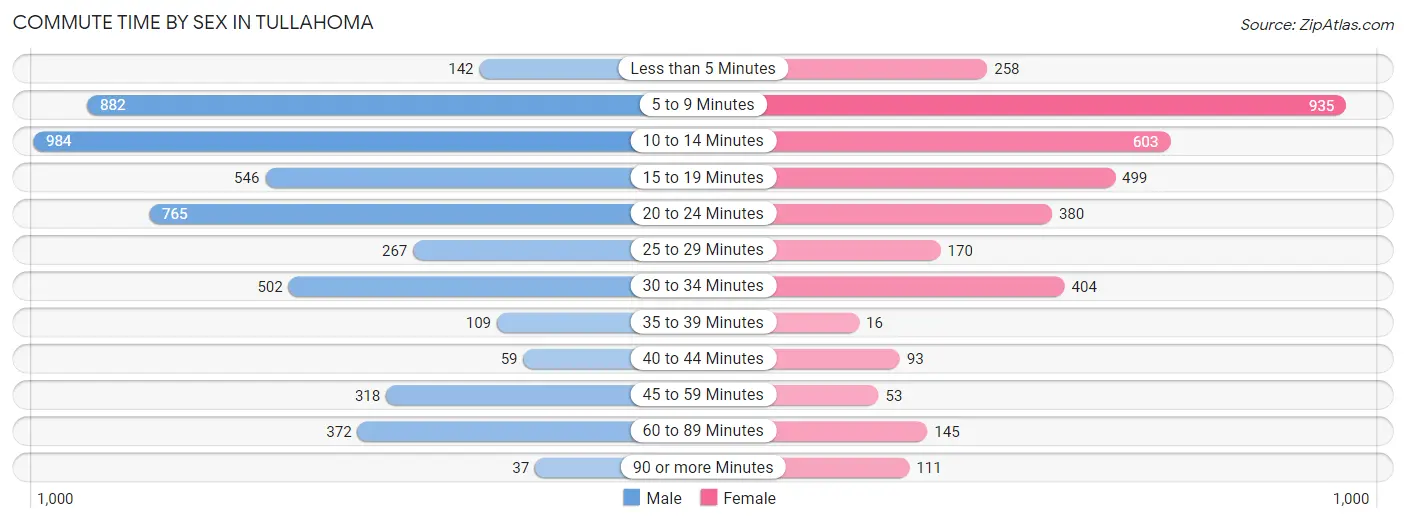
| Commute Time | Male | Female |
| Less than 5 Minutes | 142 (2.9%) | 258 (7.0%) |
| 5 to 9 Minutes | 882 (17.7%) | 935 (25.5%) |
| 10 to 14 Minutes | 984 (19.8%) | 603 (16.4%) |
| 15 to 19 Minutes | 546 (11.0%) | 499 (13.6%) |
| 20 to 24 Minutes | 765 (15.3%) | 380 (10.4%) |
| 25 to 29 Minutes | 267 (5.4%) | 170 (4.6%) |
| 30 to 34 Minutes | 502 (10.1%) | 404 (11.0%) |
| 35 to 39 Minutes | 109 (2.2%) | 16 (0.4%) |
| 40 to 44 Minutes | 59 (1.2%) | 93 (2.5%) |
| 45 to 59 Minutes | 318 (6.4%) | 53 (1.5%) |
| 60 to 89 Minutes | 372 (7.5%) | 145 (4.0%) |
| 90 or more Minutes | 37 (0.7%) | 111 (3.0%) |
Time of Departure to Work by Sex in Tullahoma
The most frequent times of departure to work in Tullahoma are 7:30 AM to 7:59 AM (748, 15.0%) for males and 7:30 AM to 7:59 AM (711, 19.4%) for females.
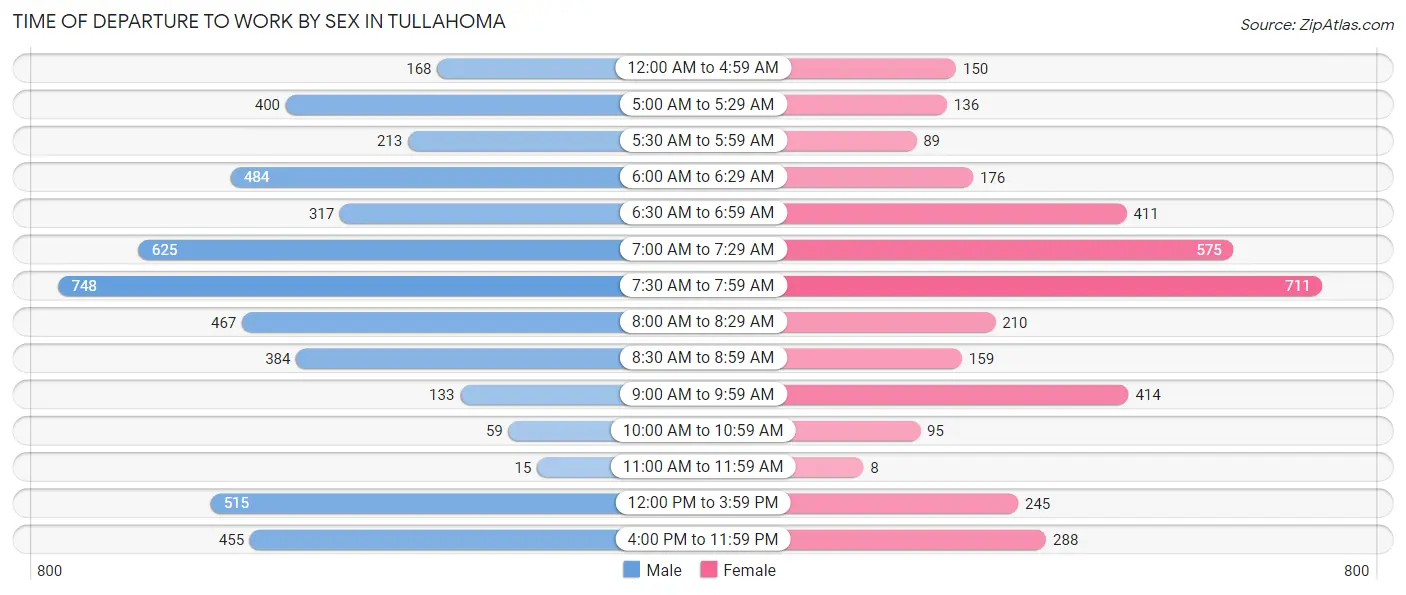
| Time of Departure | Male | Female |
| 12:00 AM to 4:59 AM | 168 (3.4%) | 150 (4.1%) |
| 5:00 AM to 5:29 AM | 400 (8.0%) | 136 (3.7%) |
| 5:30 AM to 5:59 AM | 213 (4.3%) | 89 (2.4%) |
| 6:00 AM to 6:29 AM | 484 (9.7%) | 176 (4.8%) |
| 6:30 AM to 6:59 AM | 317 (6.4%) | 411 (11.2%) |
| 7:00 AM to 7:29 AM | 625 (12.5%) | 575 (15.7%) |
| 7:30 AM to 7:59 AM | 748 (15.0%) | 711 (19.4%) |
| 8:00 AM to 8:29 AM | 467 (9.4%) | 210 (5.7%) |
| 8:30 AM to 8:59 AM | 384 (7.7%) | 159 (4.3%) |
| 9:00 AM to 9:59 AM | 133 (2.7%) | 414 (11.3%) |
| 10:00 AM to 10:59 AM | 59 (1.2%) | 95 (2.6%) |
| 11:00 AM to 11:59 AM | 15 (0.3%) | 8 (0.2%) |
| 12:00 PM to 3:59 PM | 515 (10.3%) | 245 (6.7%) |
| 4:00 PM to 11:59 PM | 455 (9.1%) | 288 (7.9%) |
| Total | 4,983 (100.0%) | 3,667 (100.0%) |
Housing Occupancy in Tullahoma
Occupancy by Ownership in Tullahoma
Of the total 8,703 dwellings in Tullahoma, owner-occupied units account for 5,523 (63.5%), while renter-occupied units make up 3,180 (36.5%).
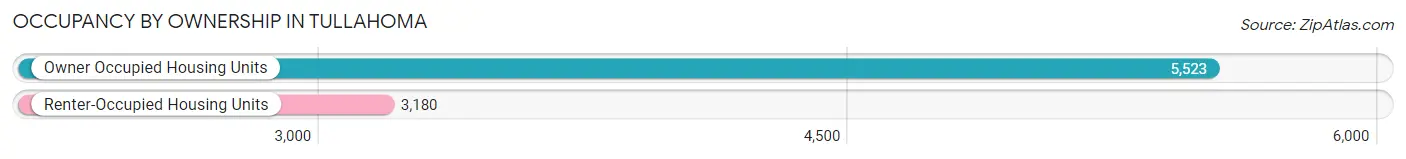
| Occupancy | # Housing Units | % Housing Units |
| Owner Occupied Housing Units | 5,523 | 63.5% |
| Renter-Occupied Housing Units | 3,180 | 36.5% |
| Total Occupied Housing Units | 8,703 | 100.0% |
Occupancy by Household Size in Tullahoma
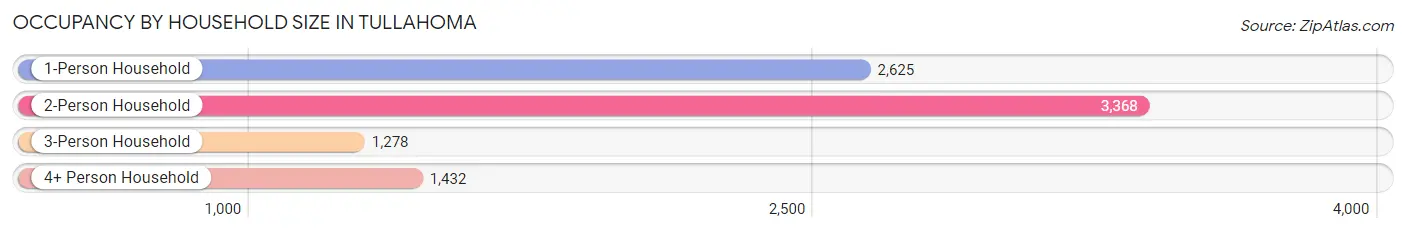
| Household Size | # Housing Units | % Housing Units |
| 1-Person Household | 2,625 | 30.2% |
| 2-Person Household | 3,368 | 38.7% |
| 3-Person Household | 1,278 | 14.7% |
| 4+ Person Household | 1,432 | 16.5% |
| Total Housing Units | 8,703 | 100.0% |
Occupancy by Ownership by Household Size in Tullahoma
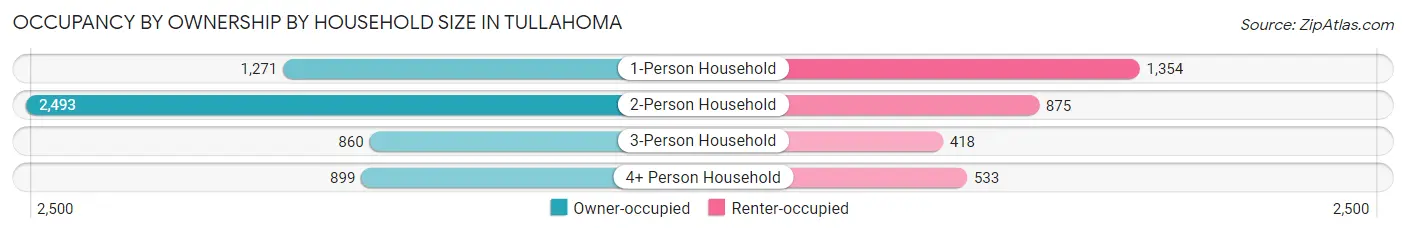
| Household Size | Owner-occupied | Renter-occupied |
| 1-Person Household | 1,271 (48.4%) | 1,354 (51.6%) |
| 2-Person Household | 2,493 (74.0%) | 875 (26.0%) |
| 3-Person Household | 860 (67.3%) | 418 (32.7%) |
| 4+ Person Household | 899 (62.8%) | 533 (37.2%) |
| Total Housing Units | 5,523 (63.5%) | 3,180 (36.5%) |
Occupancy by Educational Attainment in Tullahoma
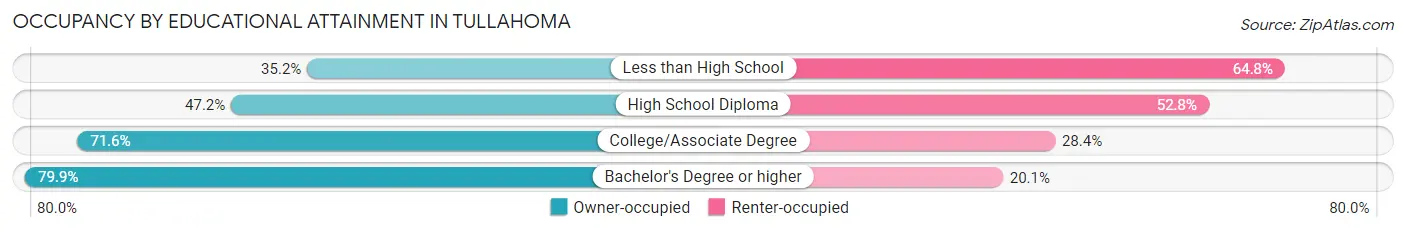
| Household Size | Owner-occupied | Renter-occupied |
| Less than High School | 311 (35.2%) | 573 (64.8%) |
| High School Diploma | 1,174 (47.2%) | 1,311 (52.8%) |
| College/Associate Degree | 1,945 (71.6%) | 770 (28.4%) |
| Bachelor's Degree or higher | 2,093 (79.9%) | 526 (20.1%) |
Occupancy by Age of Householder in Tullahoma
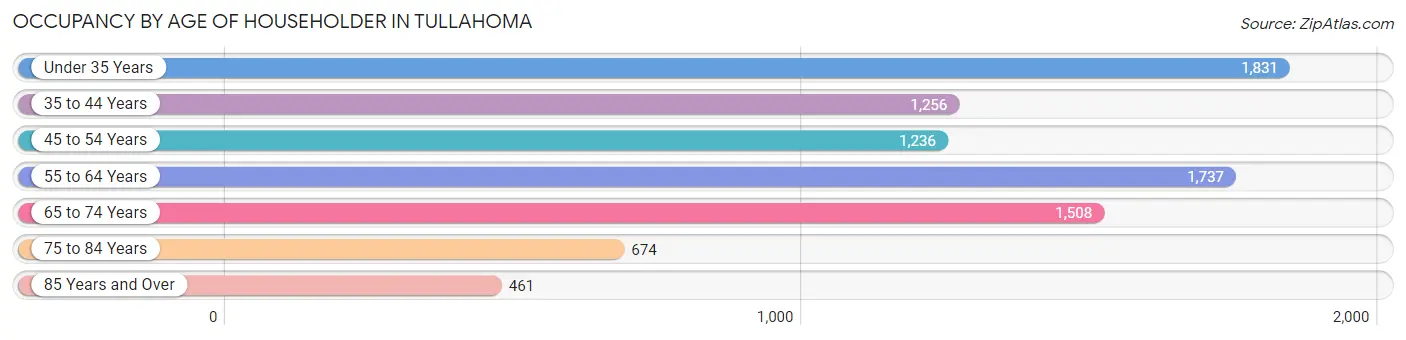
| Age Bracket | # Households | % Households |
| Under 35 Years | 1,831 | 21.0% |
| 35 to 44 Years | 1,256 | 14.4% |
| 45 to 54 Years | 1,236 | 14.2% |
| 55 to 64 Years | 1,737 | 20.0% |
| 65 to 74 Years | 1,508 | 17.3% |
| 75 to 84 Years | 674 | 7.7% |
| 85 Years and Over | 461 | 5.3% |
| Total | 8,703 | 100.0% |
Housing Finances in Tullahoma
Median Income by Occupancy in Tullahoma
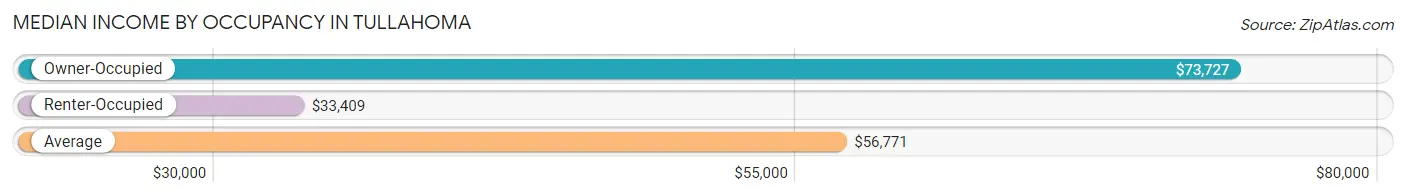
| Occupancy Type | # Households | Median Income |
| Owner-Occupied | 5,523 (63.5%) | $73,727 |
| Renter-Occupied | 3,180 (36.5%) | $33,409 |
| Average | 8,703 (100.0%) | $56,771 |
Occupancy by Householder Income Bracket in Tullahoma
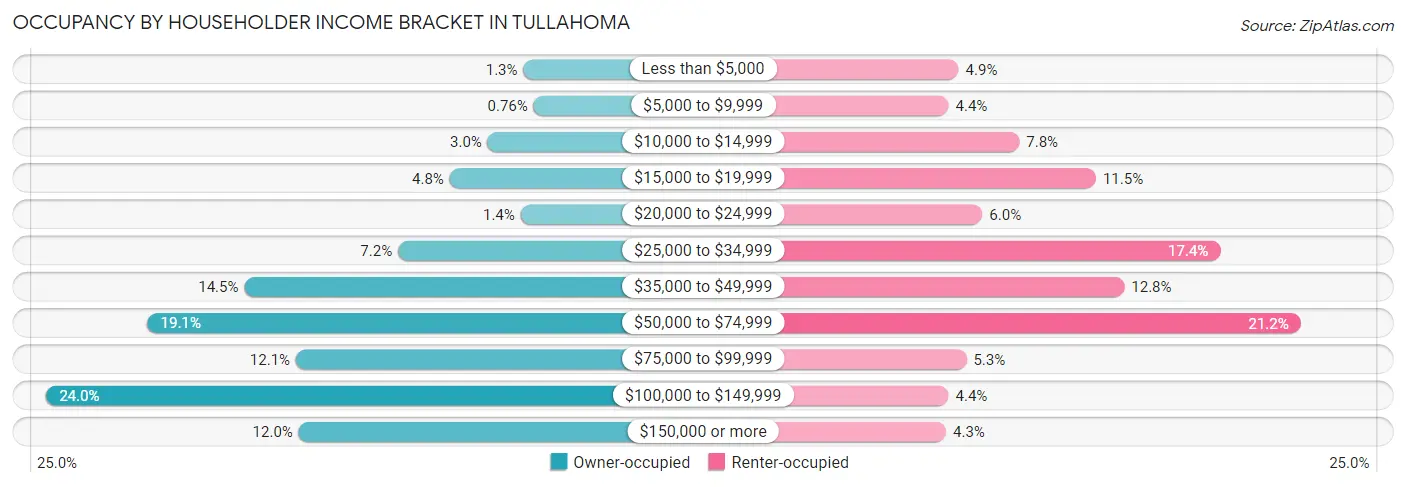
| Income Bracket | Owner-occupied | Renter-occupied |
| Less than $5,000 | 69 (1.3%) | 156 (4.9%) |
| $5,000 to $9,999 | 42 (0.8%) | 141 (4.4%) |
| $10,000 to $14,999 | 163 (2.9%) | 248 (7.8%) |
| $15,000 to $19,999 | 263 (4.8%) | 364 (11.5%) |
| $20,000 to $24,999 | 76 (1.4%) | 192 (6.0%) |
| $25,000 to $34,999 | 399 (7.2%) | 552 (17.4%) |
| $35,000 to $49,999 | 803 (14.5%) | 407 (12.8%) |
| $50,000 to $74,999 | 1,057 (19.1%) | 674 (21.2%) |
| $75,000 to $99,999 | 667 (12.1%) | 168 (5.3%) |
| $100,000 to $149,999 | 1,324 (24.0%) | 141 (4.4%) |
| $150,000 or more | 660 (11.9%) | 137 (4.3%) |
| Total | 5,523 (100.0%) | 3,180 (100.0%) |
Monthly Housing Cost Tiers in Tullahoma
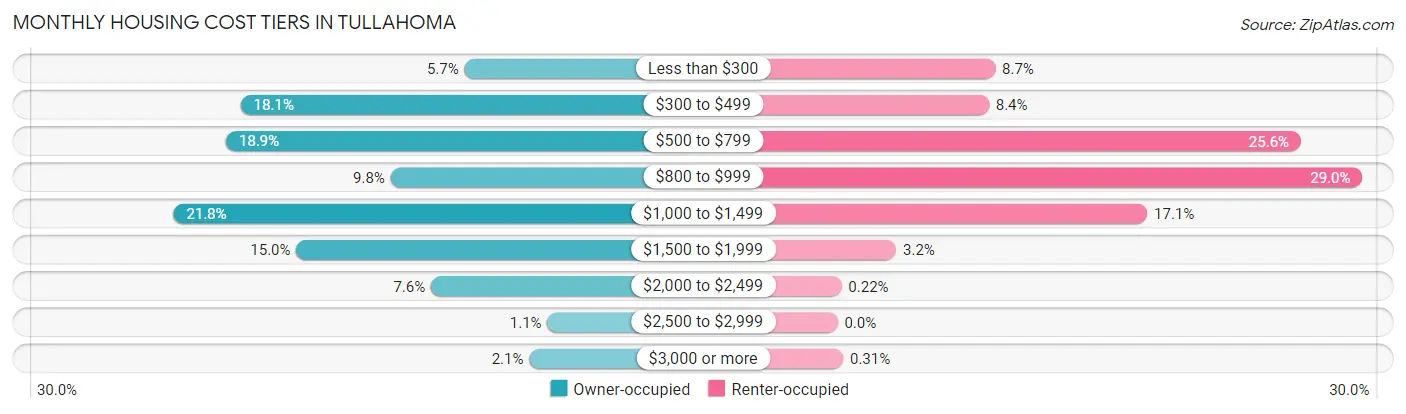
| Monthly Cost | Owner-occupied | Renter-occupied |
| Less than $300 | 315 (5.7%) | 277 (8.7%) |
| $300 to $499 | 998 (18.1%) | 266 (8.4%) |
| $500 to $799 | 1,043 (18.9%) | 814 (25.6%) |
| $800 to $999 | 540 (9.8%) | 922 (29.0%) |
| $1,000 to $1,499 | 1,203 (21.8%) | 544 (17.1%) |
| $1,500 to $1,999 | 828 (15.0%) | 103 (3.2%) |
| $2,000 to $2,499 | 417 (7.5%) | 7 (0.2%) |
| $2,500 to $2,999 | 62 (1.1%) | 0 (0.0%) |
| $3,000 or more | 117 (2.1%) | 10 (0.3%) |
| Total | 5,523 (100.0%) | 3,180 (100.0%) |
Physical Housing Characteristics in Tullahoma
Housing Structures in Tullahoma
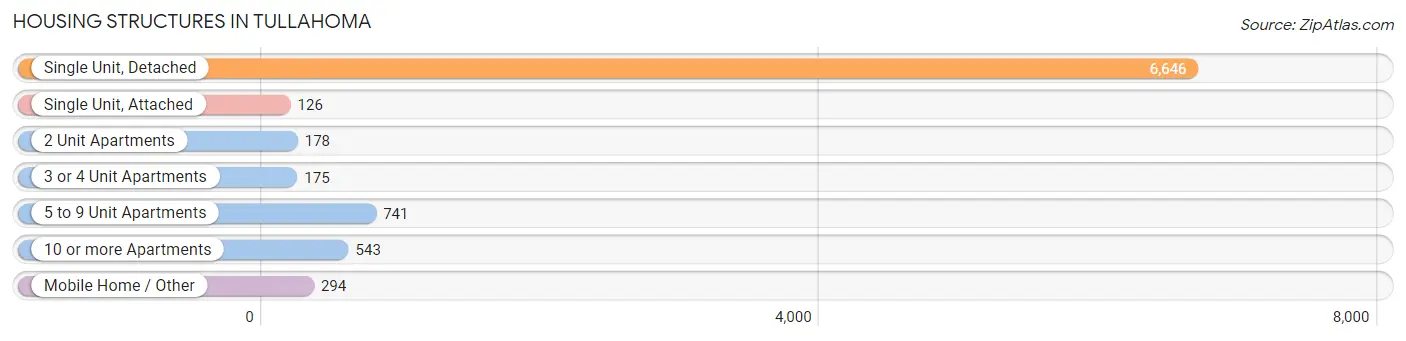
| Structure Type | # Housing Units | % Housing Units |
| Single Unit, Detached | 6,646 | 76.4% |
| Single Unit, Attached | 126 | 1.5% |
| 2 Unit Apartments | 178 | 2.1% |
| 3 or 4 Unit Apartments | 175 | 2.0% |
| 5 to 9 Unit Apartments | 741 | 8.5% |
| 10 or more Apartments | 543 | 6.2% |
| Mobile Home / Other | 294 | 3.4% |
| Total | 8,703 | 100.0% |
Housing Structures by Occupancy in Tullahoma
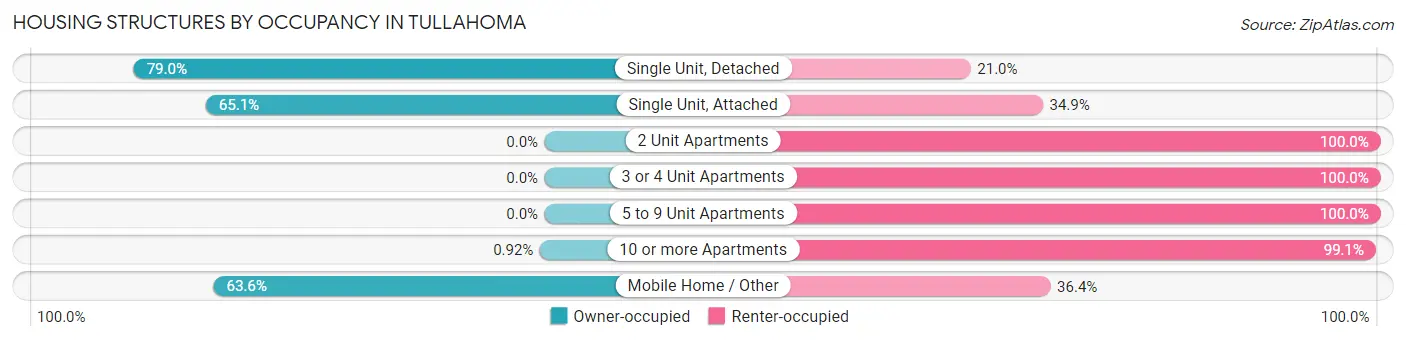
| Structure Type | Owner-occupied | Renter-occupied |
| Single Unit, Detached | 5,249 (79.0%) | 1,397 (21.0%) |
| Single Unit, Attached | 82 (65.1%) | 44 (34.9%) |
| 2 Unit Apartments | 0 (0.0%) | 178 (100.0%) |
| 3 or 4 Unit Apartments | 0 (0.0%) | 175 (100.0%) |
| 5 to 9 Unit Apartments | 0 (0.0%) | 741 (100.0%) |
| 10 or more Apartments | 5 (0.9%) | 538 (99.1%) |
| Mobile Home / Other | 187 (63.6%) | 107 (36.4%) |
| Total | 5,523 (63.5%) | 3,180 (36.5%) |
Housing Structures by Number of Rooms in Tullahoma
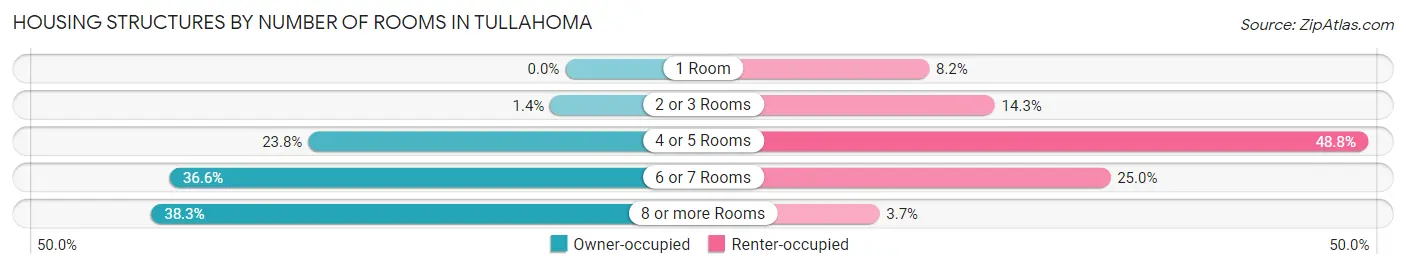
| Number of Rooms | Owner-occupied | Renter-occupied |
| 1 Room | 0 (0.0%) | 262 (8.2%) |
| 2 or 3 Rooms | 77 (1.4%) | 455 (14.3%) |
| 4 or 5 Rooms | 1,313 (23.8%) | 1,552 (48.8%) |
| 6 or 7 Rooms | 2,019 (36.6%) | 795 (25.0%) |
| 8 or more Rooms | 2,114 (38.3%) | 116 (3.6%) |
| Total | 5,523 (100.0%) | 3,180 (100.0%) |
Housing Structure by Heating Type in Tullahoma
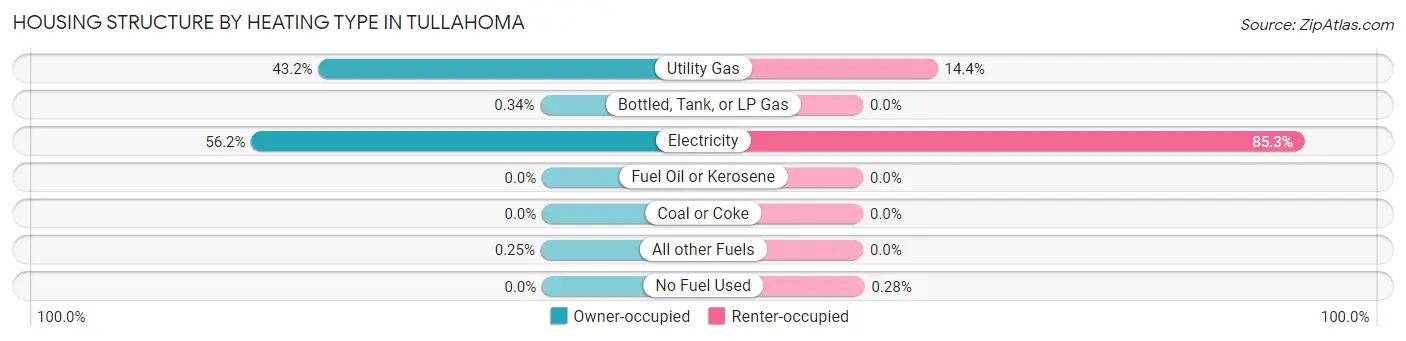
| Heating Type | Owner-occupied | Renter-occupied |
| Utility Gas | 2,387 (43.2%) | 458 (14.4%) |
| Bottled, Tank, or LP Gas | 19 (0.3%) | 0 (0.0%) |
| Electricity | 3,103 (56.2%) | 2,713 (85.3%) |
| Fuel Oil or Kerosene | 0 (0.0%) | 0 (0.0%) |
| Coal or Coke | 0 (0.0%) | 0 (0.0%) |
| All other Fuels | 14 (0.3%) | 0 (0.0%) |
| No Fuel Used | 0 (0.0%) | 9 (0.3%) |
| Total | 5,523 (100.0%) | 3,180 (100.0%) |
Household Vehicle Usage in Tullahoma
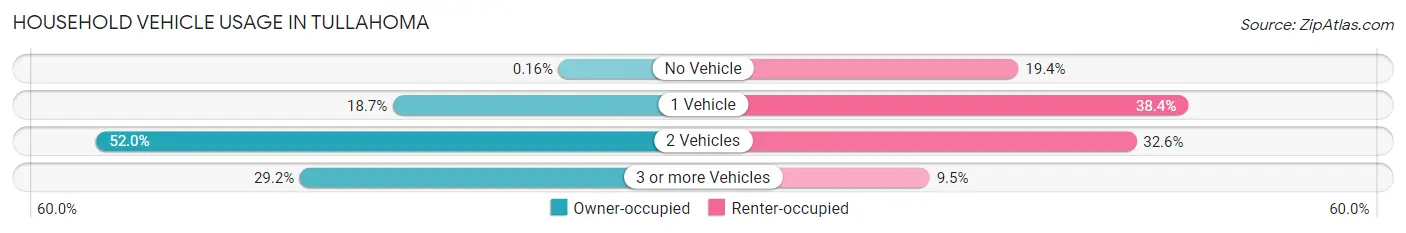
| Vehicles per Household | Owner-occupied | Renter-occupied |
| No Vehicle | 9 (0.2%) | 618 (19.4%) |
| 1 Vehicle | 1,034 (18.7%) | 1,222 (38.4%) |
| 2 Vehicles | 2,870 (52.0%) | 1,038 (32.6%) |
| 3 or more Vehicles | 1,610 (29.1%) | 302 (9.5%) |
| Total | 5,523 (100.0%) | 3,180 (100.0%) |
Real Estate & Mortgages in Tullahoma
Real Estate and Mortgage Overview in Tullahoma
| Characteristic | Without Mortgage | With Mortgage |
| Housing Units | 2,259 | 3,264 |
| Median Property Value | $186,100 | $213,500 |
| Median Household Income | $51,530 | $474 |
| Monthly Housing Costs | $470 | $117 |
| Real Estate Taxes | $1,510 | $107 |
Property Value by Mortgage Status in Tullahoma
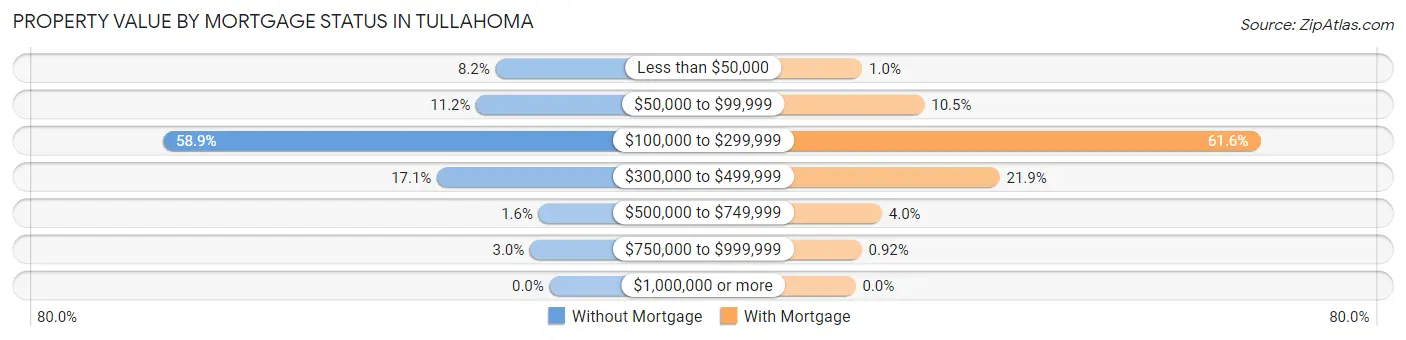
| Property Value | Without Mortgage | With Mortgage |
| Less than $50,000 | 186 (8.2%) | 33 (1.0%) |
| $50,000 to $99,999 | 252 (11.2%) | 342 (10.5%) |
| $100,000 to $299,999 | 1,330 (58.9%) | 2,012 (61.6%) |
| $300,000 to $499,999 | 387 (17.1%) | 716 (21.9%) |
| $500,000 to $749,999 | 37 (1.6%) | 131 (4.0%) |
| $750,000 to $999,999 | 67 (3.0%) | 30 (0.9%) |
| $1,000,000 or more | 0 (0.0%) | 0 (0.0%) |
| Total | 2,259 (100.0%) | 3,264 (100.0%) |
Household Income by Mortgage Status in Tullahoma
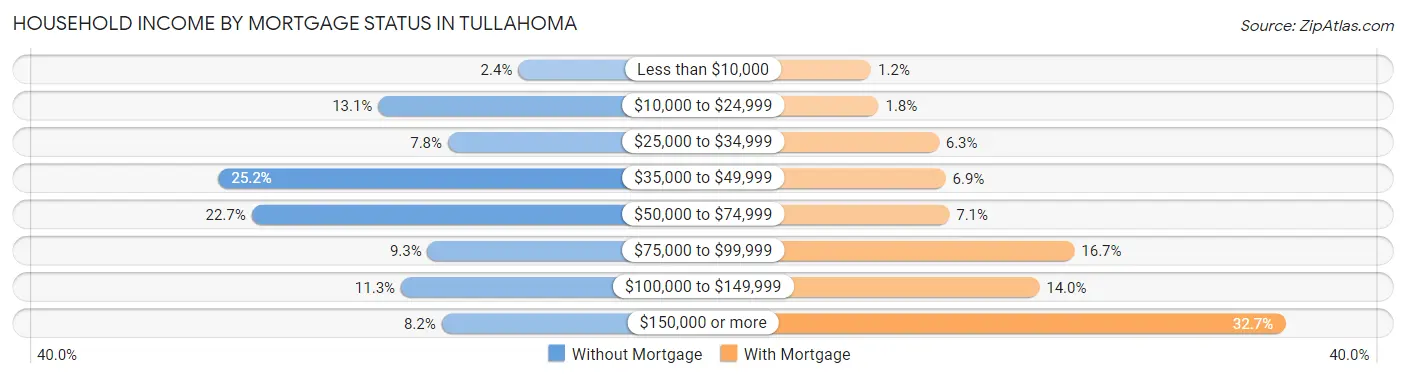
| Household Income | Without Mortgage | With Mortgage |
| Less than $10,000 | 54 (2.4%) | 39 (1.2%) |
| $10,000 to $24,999 | 295 (13.1%) | 57 (1.8%) |
| $25,000 to $34,999 | 175 (7.7%) | 207 (6.3%) |
| $35,000 to $49,999 | 570 (25.2%) | 224 (6.9%) |
| $50,000 to $74,999 | 513 (22.7%) | 233 (7.1%) |
| $75,000 to $99,999 | 210 (9.3%) | 544 (16.7%) |
| $100,000 to $149,999 | 256 (11.3%) | 457 (14.0%) |
| $150,000 or more | 186 (8.2%) | 1,068 (32.7%) |
| Total | 2,259 (100.0%) | 3,264 (100.0%) |
Property Value to Household Income Ratio in Tullahoma
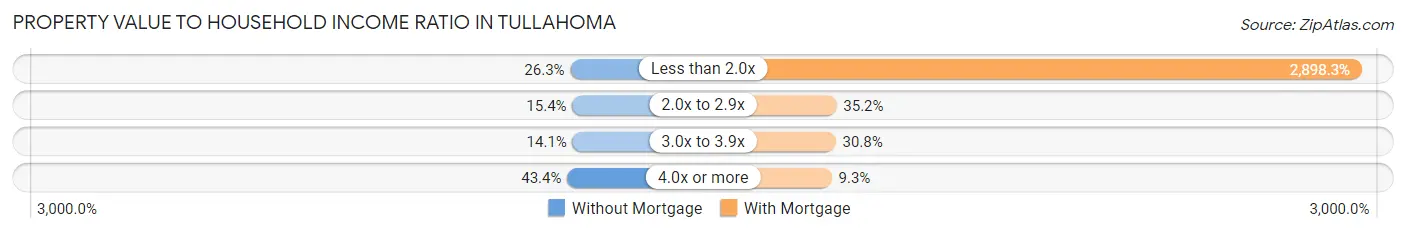
| Value-to-Income Ratio | Without Mortgage | With Mortgage |
| Less than 2.0x | 595 (26.3%) | 94,600 (2,898.3%) |
| 2.0x to 2.9x | 347 (15.4%) | 1,148 (35.2%) |
| 3.0x to 3.9x | 319 (14.1%) | 1,004 (30.8%) |
| 4.0x or more | 980 (43.4%) | 305 (9.3%) |
| Total | 2,259 (100.0%) | 3,264 (100.0%) |
Real Estate Taxes by Mortgage Status in Tullahoma
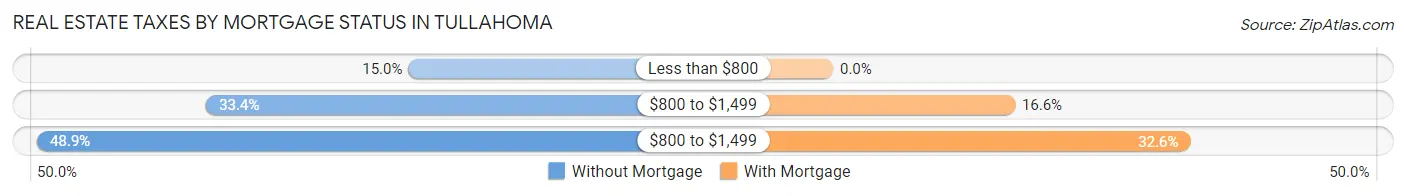
| Property Taxes | Without Mortgage | With Mortgage |
| Less than $800 | 338 (15.0%) | 0 (0.0%) |
| $800 to $1,499 | 755 (33.4%) | 542 (16.6%) |
| $800 to $1,499 | 1,104 (48.9%) | 1,065 (32.6%) |
| Total | 2,259 (100.0%) | 3,264 (100.0%) |
Health & Disability in Tullahoma
Health Insurance Coverage by Age in Tullahoma
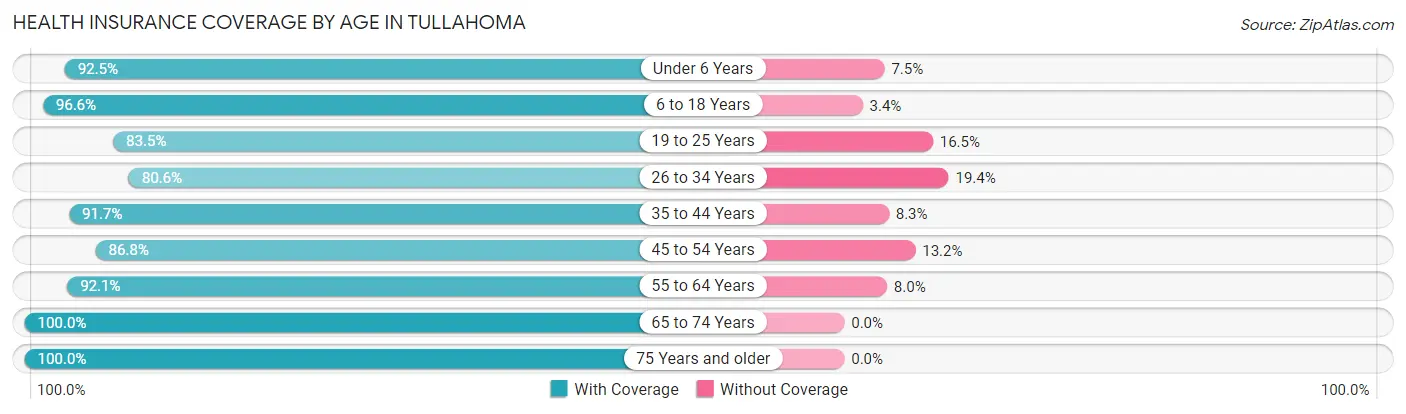
| Age Bracket | With Coverage | Without Coverage |
| Under 6 Years | 1,853 (92.5%) | 150 (7.5%) |
| 6 to 18 Years | 3,116 (96.6%) | 110 (3.4%) |
| 19 to 25 Years | 1,310 (83.5%) | 259 (16.5%) |
| 26 to 34 Years | 2,076 (80.6%) | 501 (19.4%) |
| 35 to 44 Years | 2,265 (91.7%) | 205 (8.3%) |
| 45 to 54 Years | 2,196 (86.8%) | 335 (13.2%) |
| 55 to 64 Years | 2,466 (92.0%) | 213 (8.0%) |
| 65 to 74 Years | 2,287 (100.0%) | 0 (0.0%) |
| 75 Years and older | 1,618 (100.0%) | 0 (0.0%) |
| Total | 19,187 (91.5%) | 1,773 (8.5%) |
Health Insurance Coverage by Citizenship Status in Tullahoma
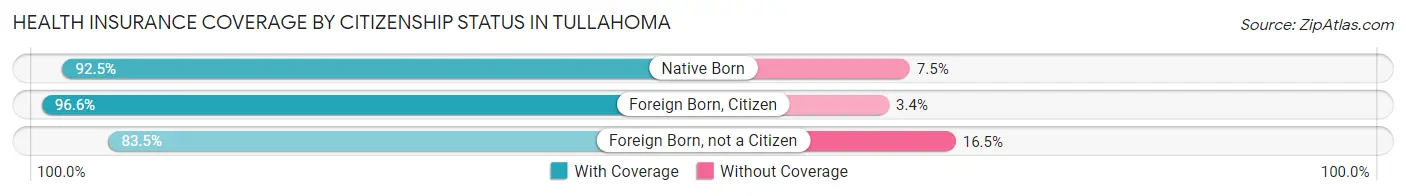
| Citizenship Status | With Coverage | Without Coverage |
| Native Born | 1,853 (92.5%) | 150 (7.5%) |
| Foreign Born, Citizen | 3,116 (96.6%) | 110 (3.4%) |
| Foreign Born, not a Citizen | 1,310 (83.5%) | 259 (16.5%) |
Health Insurance Coverage by Household Income in Tullahoma
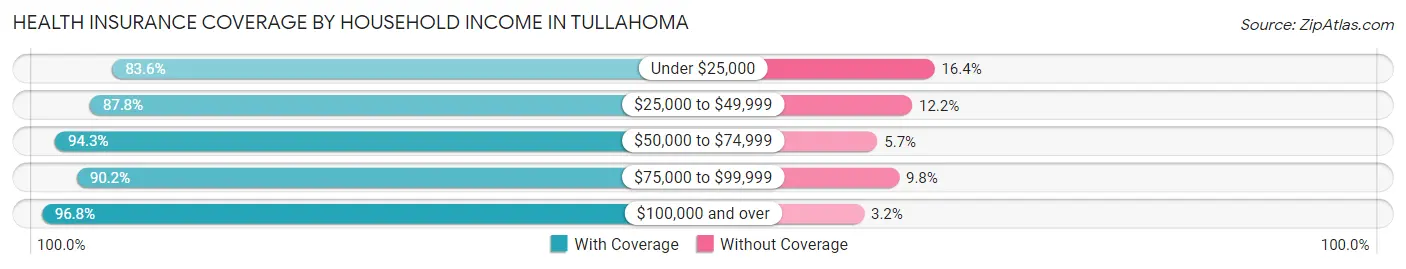
| Household Income | With Coverage | Without Coverage |
| Under $25,000 | 2,944 (83.6%) | 579 (16.4%) |
| $25,000 to $49,999 | 3,353 (87.8%) | 467 (12.2%) |
| $50,000 to $74,999 | 4,098 (94.3%) | 249 (5.7%) |
| $75,000 to $99,999 | 2,083 (90.2%) | 226 (9.8%) |
| $100,000 and over | 6,686 (96.8%) | 223 (3.2%) |
Public vs Private Health Insurance Coverage by Age in Tullahoma
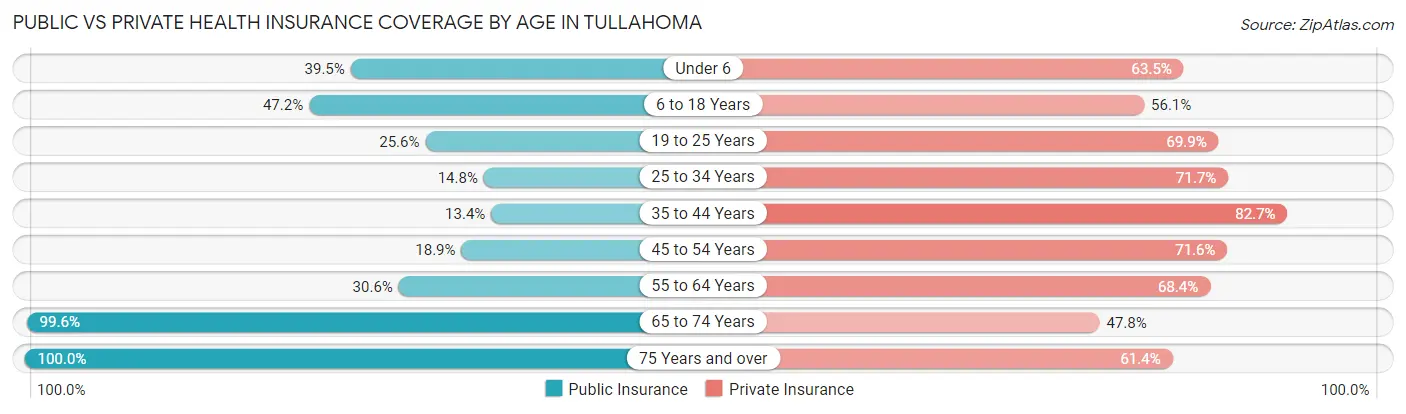
| Age Bracket | Public Insurance | Private Insurance |
| Under 6 | 791 (39.5%) | 1,271 (63.4%) |
| 6 to 18 Years | 1,523 (47.2%) | 1,810 (56.1%) |
| 19 to 25 Years | 402 (25.6%) | 1,097 (69.9%) |
| 25 to 34 Years | 381 (14.8%) | 1,848 (71.7%) |
| 35 to 44 Years | 331 (13.4%) | 2,043 (82.7%) |
| 45 to 54 Years | 479 (18.9%) | 1,811 (71.6%) |
| 55 to 64 Years | 819 (30.6%) | 1,831 (68.3%) |
| 65 to 74 Years | 2,278 (99.6%) | 1,094 (47.8%) |
| 75 Years and over | 1,618 (100.0%) | 993 (61.4%) |
| Total | 8,622 (41.1%) | 13,798 (65.8%) |
Disability Status by Sex by Age in Tullahoma
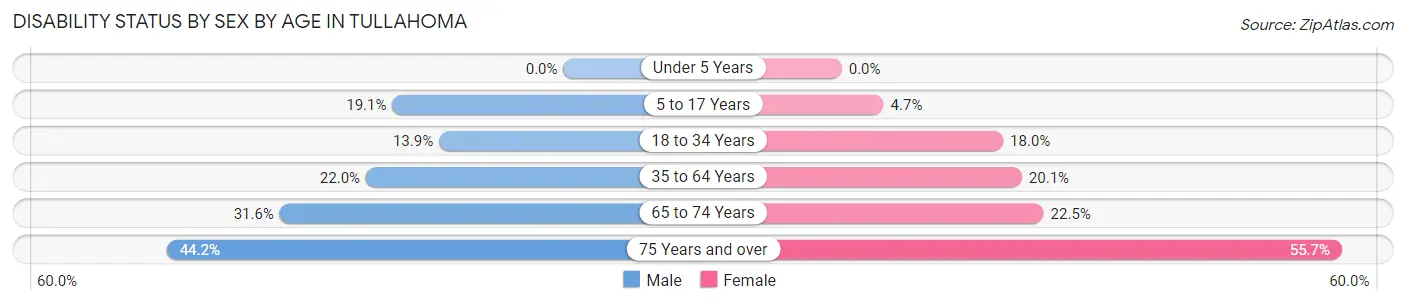
| Age Bracket | Male | Female |
| Under 5 Years | 0 (0.0%) | 0 (0.0%) |
| 5 to 17 Years | 292 (19.1%) | 83 (4.7%) |
| 18 to 34 Years | 315 (13.9%) | 368 (18.0%) |
| 35 to 64 Years | 826 (22.0%) | 787 (20.1%) |
| 65 to 74 Years | 350 (31.6%) | 265 (22.5%) |
| 75 Years and over | 326 (44.2%) | 490 (55.7%) |
Disability Class by Sex by Age in Tullahoma
Disability Class: Hearing Difficulty
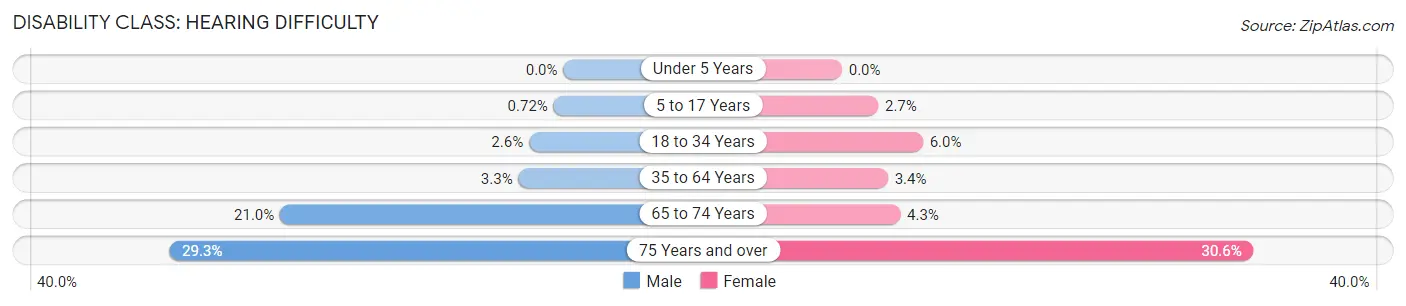
| Age Bracket | Male | Female |
| Under 5 Years | 0 (0.0%) | 0 (0.0%) |
| 5 to 17 Years | 11 (0.7%) | 48 (2.7%) |
| 18 to 34 Years | 58 (2.5%) | 123 (6.0%) |
| 35 to 64 Years | 125 (3.3%) | 134 (3.4%) |
| 65 to 74 Years | 233 (21.0%) | 51 (4.3%) |
| 75 Years and over | 216 (29.3%) | 269 (30.6%) |
Disability Class: Vision Difficulty
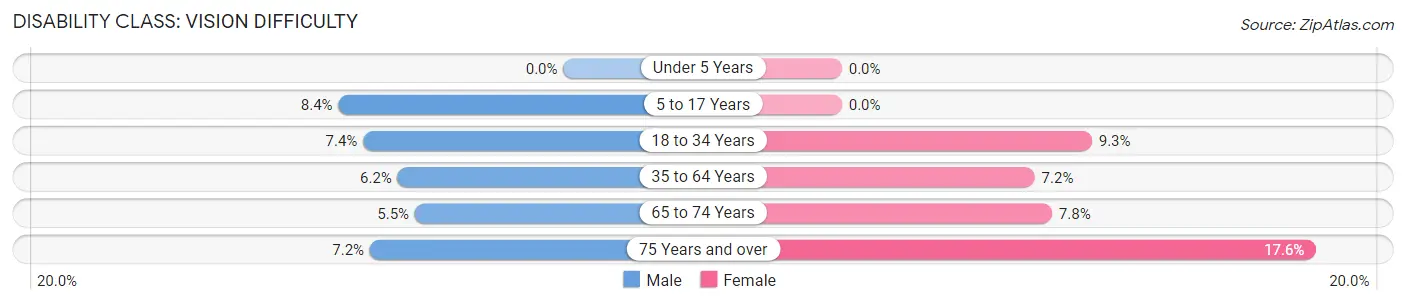
| Age Bracket | Male | Female |
| Under 5 Years | 0 (0.0%) | 0 (0.0%) |
| 5 to 17 Years | 128 (8.4%) | 0 (0.0%) |
| 18 to 34 Years | 169 (7.4%) | 190 (9.3%) |
| 35 to 64 Years | 231 (6.1%) | 281 (7.2%) |
| 65 to 74 Years | 61 (5.5%) | 92 (7.8%) |
| 75 Years and over | 53 (7.2%) | 155 (17.6%) |
Disability Class: Cognitive Difficulty
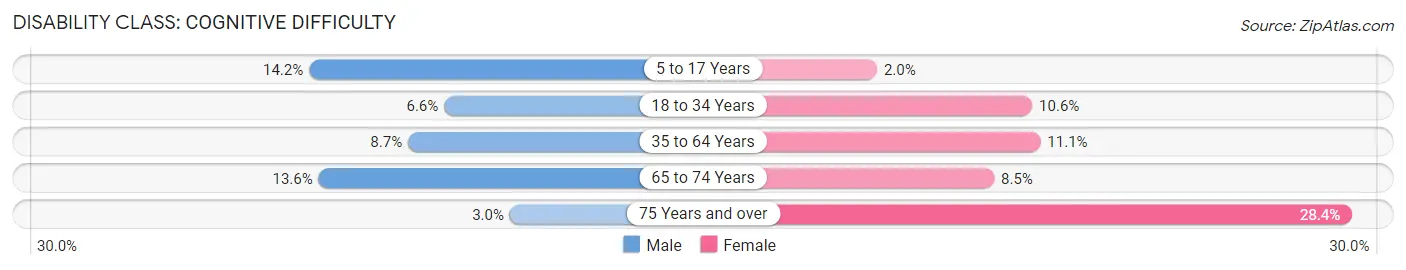
| Age Bracket | Male | Female |
| 5 to 17 Years | 217 (14.2%) | 35 (2.0%) |
| 18 to 34 Years | 151 (6.6%) | 217 (10.6%) |
| 35 to 64 Years | 325 (8.6%) | 434 (11.1%) |
| 65 to 74 Years | 151 (13.6%) | 100 (8.5%) |
| 75 Years and over | 22 (3.0%) | 250 (28.4%) |
Disability Class: Ambulatory Difficulty
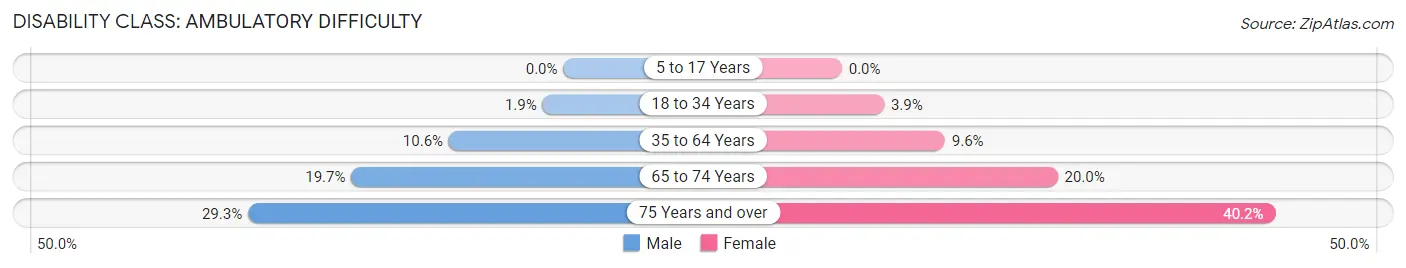
| Age Bracket | Male | Female |
| 5 to 17 Years | 0 (0.0%) | 0 (0.0%) |
| 18 to 34 Years | 44 (1.9%) | 80 (3.9%) |
| 35 to 64 Years | 399 (10.6%) | 375 (9.6%) |
| 65 to 74 Years | 218 (19.7%) | 236 (20.0%) |
| 75 Years and over | 216 (29.3%) | 354 (40.2%) |
Disability Class: Self-Care Difficulty
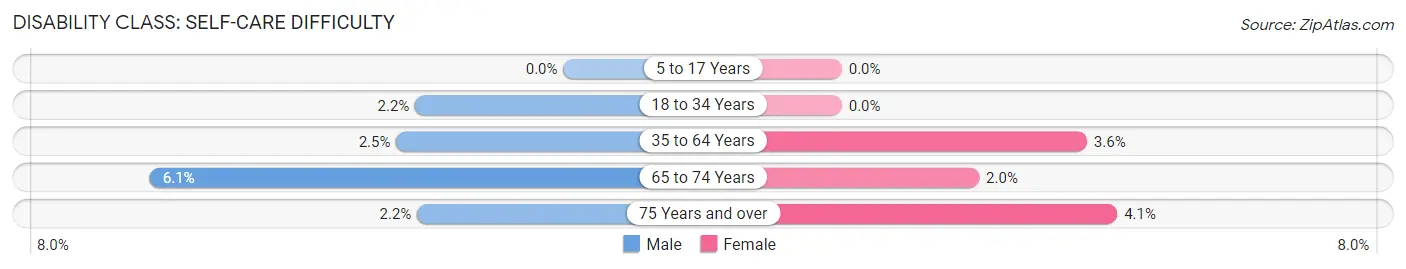
| Age Bracket | Male | Female |
| 5 to 17 Years | 0 (0.0%) | 0 (0.0%) |
| 18 to 34 Years | 50 (2.2%) | 0 (0.0%) |
| 35 to 64 Years | 93 (2.5%) | 143 (3.6%) |
| 65 to 74 Years | 68 (6.1%) | 24 (2.0%) |
| 75 Years and over | 16 (2.2%) | 36 (4.1%) |
Technology Access in Tullahoma
Computing Device Access in Tullahoma
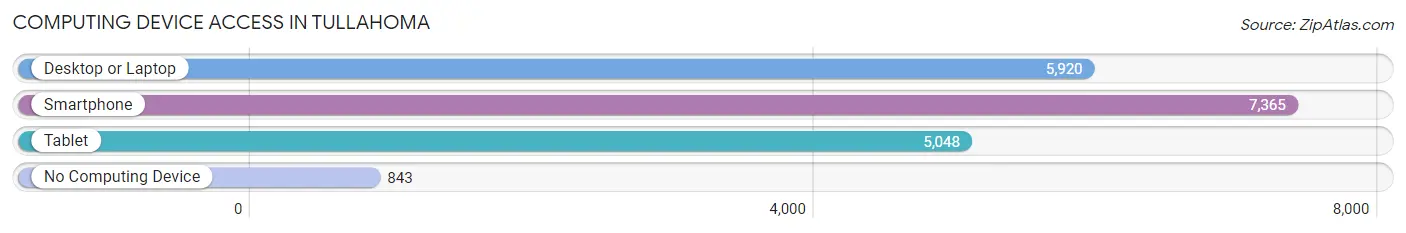
| Device Type | # Households | % Households |
| Desktop or Laptop | 5,920 | 68.0% |
| Smartphone | 7,365 | 84.6% |
| Tablet | 5,048 | 58.0% |
| No Computing Device | 843 | 9.7% |
| Total | 8,703 | 100.0% |
Internet Access in Tullahoma
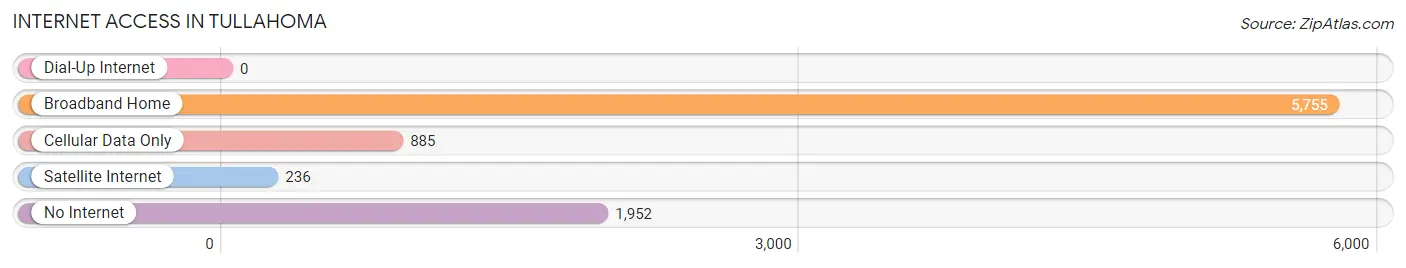
| Internet Type | # Households | % Households |
| Dial-Up Internet | 0 | 0.0% |
| Broadband Home | 5,755 | 66.1% |
| Cellular Data Only | 885 | 10.2% |
| Satellite Internet | 236 | 2.7% |
| No Internet | 1,952 | 22.4% |
| Total | 8,703 | 100.0% |
Tullahoma Summary
Tullahoma, Tennessee is a city located in the south-central part of the state, in Coffee and Franklin counties. It is the county seat of Coffee County and is located approximately 90 miles southeast of Nashville. The city is situated in the foothills of the Cumberland Plateau and is known for its rolling hills and scenic views.
History
Tullahoma was founded in 1852 by settlers from Virginia and North Carolina. The city was named after Chief Tullahoma, a Cherokee leader who lived in the area. The city was originally known as Wartrace, but the name was changed to Tullahoma in 1855.
The city was an important railroad hub during the Civil War, and was the site of several battles. In 1863, the Battle of Tullahoma was fought in the city, resulting in a Confederate victory.
In the late 19th century, Tullahoma became an important industrial center, with several factories and mills located in the city. The city was also home to several military bases, including Camp Forrest, which was established in 1941.
Geography
Tullahoma is located in the south-central part of Tennessee, in Coffee and Franklin counties. The city is situated in the foothills of the Cumberland Plateau, and is known for its rolling hills and scenic views. The city is located approximately 90 miles southeast of Nashville.
The city has a total area of 16.2 square miles, of which 16.1 square miles is land and 0.1 square miles is water. The city is located at an elevation of 1,068 feet above sea level.
Economy
Tullahoma’s economy is largely based on manufacturing and tourism. The city is home to several large manufacturing companies, including A.O. Smith, which produces water heaters and other products. The city is also home to several military bases, including Arnold Air Force Base, which is the largest employer in the city.
Tourism is also an important part of the city’s economy. The city is home to several attractions, including the Tullahoma Arts Center, the George Dickel Distillery, and the Tullahoma Historic District.
Demographics
As of the 2010 census, the population of Tullahoma was 18,655. The city has a population density of 1,154 people per square mile. The median age of the city’s population is 38.7 years.
The racial makeup of the city is 87.2% White, 8.3% African American, 0.5% Native American, 1.2% Asian, 0.1% Pacific Islander, 1.2% from other races, and 1.5% from two or more races. The city’s Hispanic population is 2.7%.
The median household income in Tullahoma is $41,945, and the median family income is $50,945. The city’s per capita income is $21,945. The city’s poverty rate is 17.2%.
Common Questions
What is the Total Population of Tullahoma?
Total Population of Tullahoma is 21,107.
What is the Total Male Population of Tullahoma?
Total Male Population of Tullahoma is 10,204.
What is the Total Female Population of Tullahoma?
Total Female Population of Tullahoma is 10,903.
What is the Ratio of Males per 100 Females in Tullahoma?
There are 93.59 Males per 100 Females in Tullahoma.
What is the Ratio of Females per 100 Males in Tullahoma?
There are 106.85 Females per 100 Males in Tullahoma.
What is the Median Population Age in Tullahoma?
Median Population Age in Tullahoma is 40.2 Years.
What is the Average Family Size in Tullahoma
Average Family Size in Tullahoma is 3.0 People.
What is the Average Household Size in Tullahoma
Average Household Size in Tullahoma is 2.4 People.
What is Per Capita Income in Tullahoma?
Per Capita income in Tullahoma is $32,431.
What is the Median Family Income in Tullahoma?
Median Family Income in Tullahoma is $71,515.
What is the Median Household income in Tullahoma?
Median Household Income in Tullahoma is $56,771.
What is Income or Wage Gap in Tullahoma?
Income or Wage Gap in Tullahoma is 36.7%.
Women in Tullahoma earn 63.3 cents for every dollar earned by a man.
What is Family Income Deficit in Tullahoma?
Family Income Deficit in Tullahoma is $9,923.
Families that are below poverty line in Tullahoma earn $9,923 less on average than the poverty threshold level.
What is Inequality or Gini Index in Tullahoma?
Inequality or Gini Index in Tullahoma is 0.45.
How Large is the Labor Force in Tullahoma?
There are 9,997 People in the Labor Forcein in Tullahoma.
What is the Percentage of People in the Labor Force in Tullahoma?
59.9% of People are in the Labor Force in Tullahoma.
What is the Unemployment Rate in Tullahoma?
Unemployment Rate in Tullahoma is 4.1%.