Kingsport, TN
Kingsport Map
Kingsport Overview
55,415
TOTAL POPULATION
26,042
MALE POPULATION
29,373
FEMALE POPULATION
88.66
MALES / 100 FEMALES
112.79
FEMALES / 100 MALES
44.6
MEDIAN AGE
2.8
AVG FAMILY SIZE
2.2
AVG HOUSEHOLD SIZE
$34,878
PER CAPITA INCOME
$68,645
AVG FAMILY INCOME
$48,228
AVG HOUSEHOLD INCOME
37.9%
WAGE / INCOME GAP [ % ]
62.1¢/ $1
WAGE / INCOME GAP [ $ ]
$11,529
FAMILY INCOME DEFICIT
0.51
INEQUALITY / GINI INDEX
24,685
LABOR FORCE [ PEOPLE ]
53.6%
PERCENT IN LABOR FORCE
5.3%
UNEMPLOYMENT RATE
Kingsport Area Codes
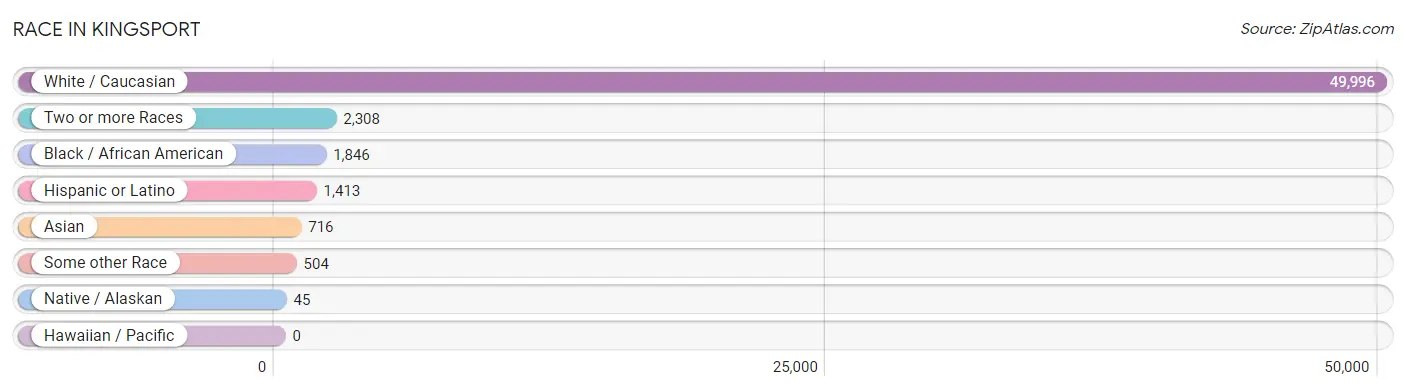
Race in Kingsport
The most populous races in Kingsport are White / Caucasian (49,996 | 90.2%), Two or more Races (2,308 | 4.2%), and Black / African American (1,846 | 3.3%).
| Race | # Population | % Population |
| Asian | 716 | 1.3% |
| Black / African American | 1,846 | 3.3% |
| Hawaiian / Pacific | 0 | 0.0% |
| Hispanic or Latino | 1,413 | 2.5% |
| Native / Alaskan | 45 | 0.1% |
| White / Caucasian | 49,996 | 90.2% |
| Two or more Races | 2,308 | 4.2% |
| Some other Race | 504 | 0.9% |
| Total | 55,415 | 100.0% |
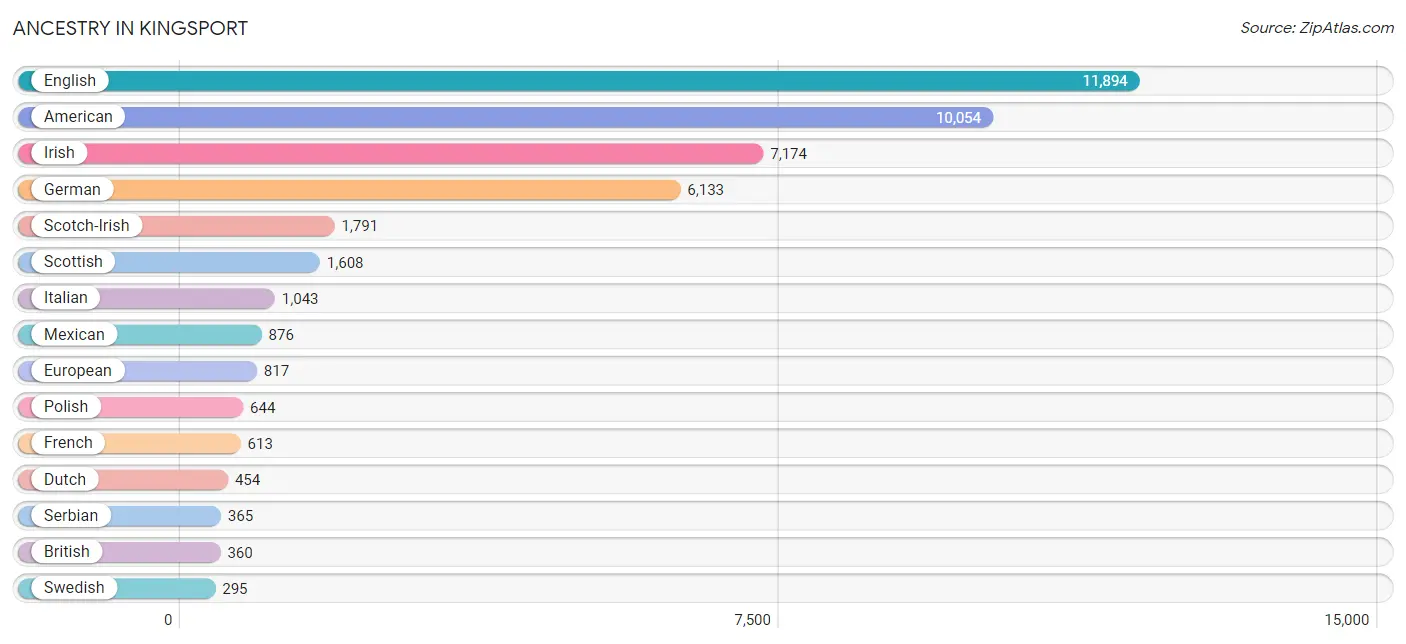
Ancestry in Kingsport
The most populous ancestries reported in Kingsport are English (11,894 | 21.5%), American (10,054 | 18.1%), Irish (7,174 | 13.0%), German (6,133 | 11.1%), and Scotch-Irish (1,791 | 3.2%), together accounting for 66.9% of all Kingsport residents.
| Ancestry | # Population | % Population |
| African | 13 | 0.0% |
| American | 10,054 | 18.1% |
| Arab | 167 | 0.3% |
| Armenian | 27 | 0.1% |
| Austrian | 70 | 0.1% |
| Bhutanese | 48 | 0.1% |
| Brazilian | 19 | 0.0% |
| British | 360 | 0.6% |
| Canadian | 20 | 0.0% |
| Central American | 147 | 0.3% |
| Central American Indian | 22 | 0.0% |
| Cherokee | 197 | 0.4% |
| Choctaw | 9 | 0.0% |
| Croatian | 47 | 0.1% |
| Cuban | 5 | 0.0% |
| Czech | 119 | 0.2% |
| Czechoslovakian | 25 | 0.1% |
| Danish | 57 | 0.1% |
| Dutch | 454 | 0.8% |
| Eastern European | 82 | 0.2% |
| Egyptian | 70 | 0.1% |
| English | 11,894 | 21.5% |
| European | 817 | 1.5% |
| Filipino | 12 | 0.0% |
| Finnish | 19 | 0.0% |
| French | 613 | 1.1% |
| French Canadian | 46 | 0.1% |
| German | 6,133 | 11.1% |
| Greek | 105 | 0.2% |
| Guatemalan | 97 | 0.2% |
| Honduran | 7 | 0.0% |
| Hungarian | 20 | 0.0% |
| Indian (Asian) | 258 | 0.5% |
| Inupiat | 6 | 0.0% |
| Iranian | 47 | 0.1% |
| Irish | 7,174 | 13.0% |
| Israeli | 58 | 0.1% |
| Italian | 1,043 | 1.9% |
| Jamaican | 11 | 0.0% |
| Korean | 185 | 0.3% |
| Lebanese | 26 | 0.1% |
| Mexican | 876 | 1.6% |
| Moroccan | 16 | 0.0% |
| Nicaraguan | 43 | 0.1% |
| Nigerian | 57 | 0.1% |
| Northern European | 101 | 0.2% |
| Norwegian | 264 | 0.5% |
| Paraguayan | 20 | 0.0% |
| Peruvian | 106 | 0.2% |
| Polish | 644 | 1.2% |
| Portuguese | 28 | 0.1% |
| Puerto Rican | 249 | 0.4% |
| Russian | 9 | 0.0% |
| Scandinavian | 145 | 0.3% |
| Scotch-Irish | 1,791 | 3.2% |
| Scottish | 1,608 | 2.9% |
| Serbian | 365 | 0.7% |
| Sioux | 1 | 0.0% |
| Slavic | 2 | 0.0% |
| Slovene | 42 | 0.1% |
| South American | 126 | 0.2% |
| Spanish | 10 | 0.0% |
| Sri Lankan | 56 | 0.1% |
| Subsaharan African | 86 | 0.2% |
| Swedish | 295 | 0.5% |
| Swiss | 77 | 0.1% |
| Thai | 267 | 0.5% |
| Ugandan | 16 | 0.0% |
| Ukrainian | 40 | 0.1% |
| Welsh | 235 | 0.4% |
| Yugoslavian | 49 | 0.1% | View All 71 Rows |
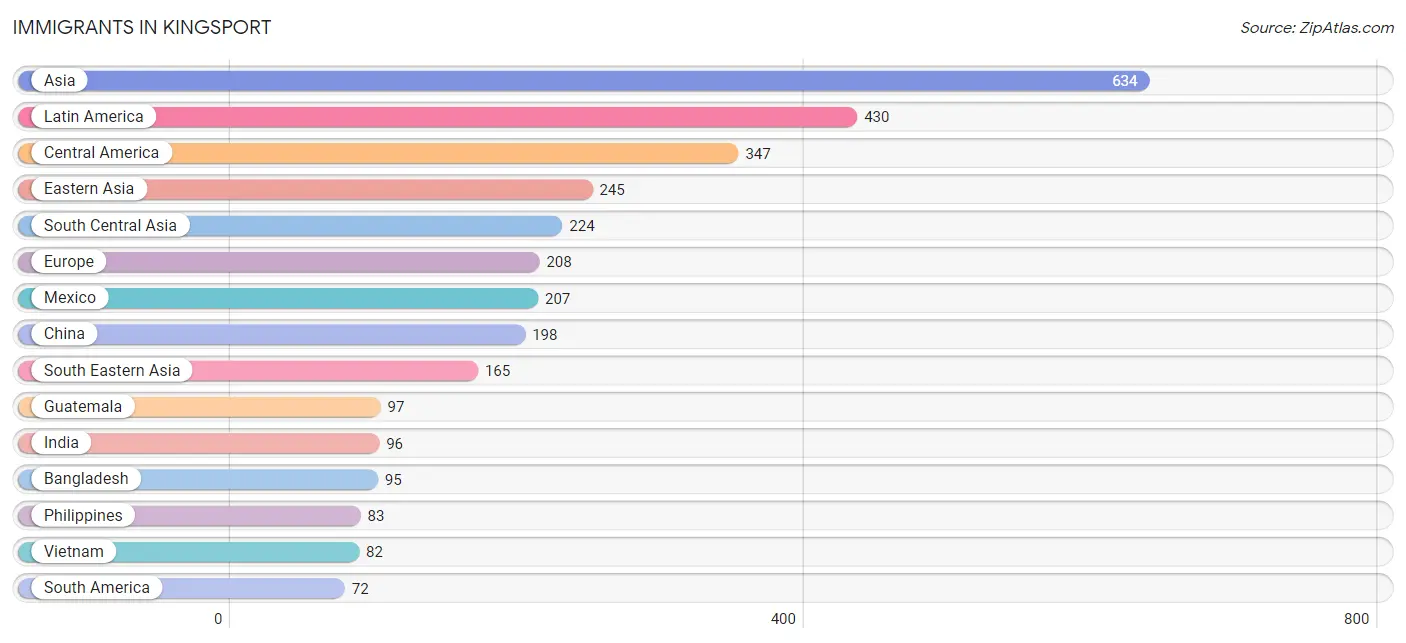
Immigrants in Kingsport
The most numerous immigrant groups reported in Kingsport came from Asia (634 | 1.1%), Latin America (430 | 0.8%), Central America (347 | 0.6%), Eastern Asia (245 | 0.4%), and South Central Asia (224 | 0.4%), together accounting for 3.4% of all Kingsport residents.
| Immigration Origin | # Population | % Population |
| Africa | 71 | 0.1% |
| Asia | 634 | 1.1% |
| Bangladesh | 95 | 0.2% |
| Bosnia and Herzegovina | 18 | 0.0% |
| Brazil | 24 | 0.0% |
| Canada | 55 | 0.1% |
| Caribbean | 11 | 0.0% |
| Central America | 347 | 0.6% |
| China | 198 | 0.4% |
| Eastern Asia | 245 | 0.4% |
| Eastern Europe | 57 | 0.1% |
| Egypt | 31 | 0.1% |
| England | 53 | 0.1% |
| Europe | 208 | 0.4% |
| France | 14 | 0.0% |
| Germany | 51 | 0.1% |
| Guatemala | 97 | 0.2% |
| India | 96 | 0.2% |
| Iran | 33 | 0.1% |
| Italy | 17 | 0.0% |
| Jamaica | 11 | 0.0% |
| Japan | 47 | 0.1% |
| Latin America | 430 | 0.8% |
| Mexico | 207 | 0.4% |
| Morocco | 16 | 0.0% |
| Netherlands | 7 | 0.0% |
| Nicaragua | 43 | 0.1% |
| Nigeria | 7 | 0.0% |
| North Macedonia | 27 | 0.1% |
| Northern Africa | 57 | 0.1% |
| Northern Europe | 62 | 0.1% |
| Peru | 29 | 0.1% |
| Philippines | 83 | 0.2% |
| South Africa | 7 | 0.0% |
| South America | 72 | 0.1% |
| South Central Asia | 224 | 0.4% |
| South Eastern Asia | 165 | 0.3% |
| Southern Europe | 17 | 0.0% |
| Taiwan | 20 | 0.0% |
| Vietnam | 82 | 0.2% |
| Western Africa | 7 | 0.0% |
| Western Europe | 72 | 0.1% | View All 42 Rows |
Sex and Age in Kingsport
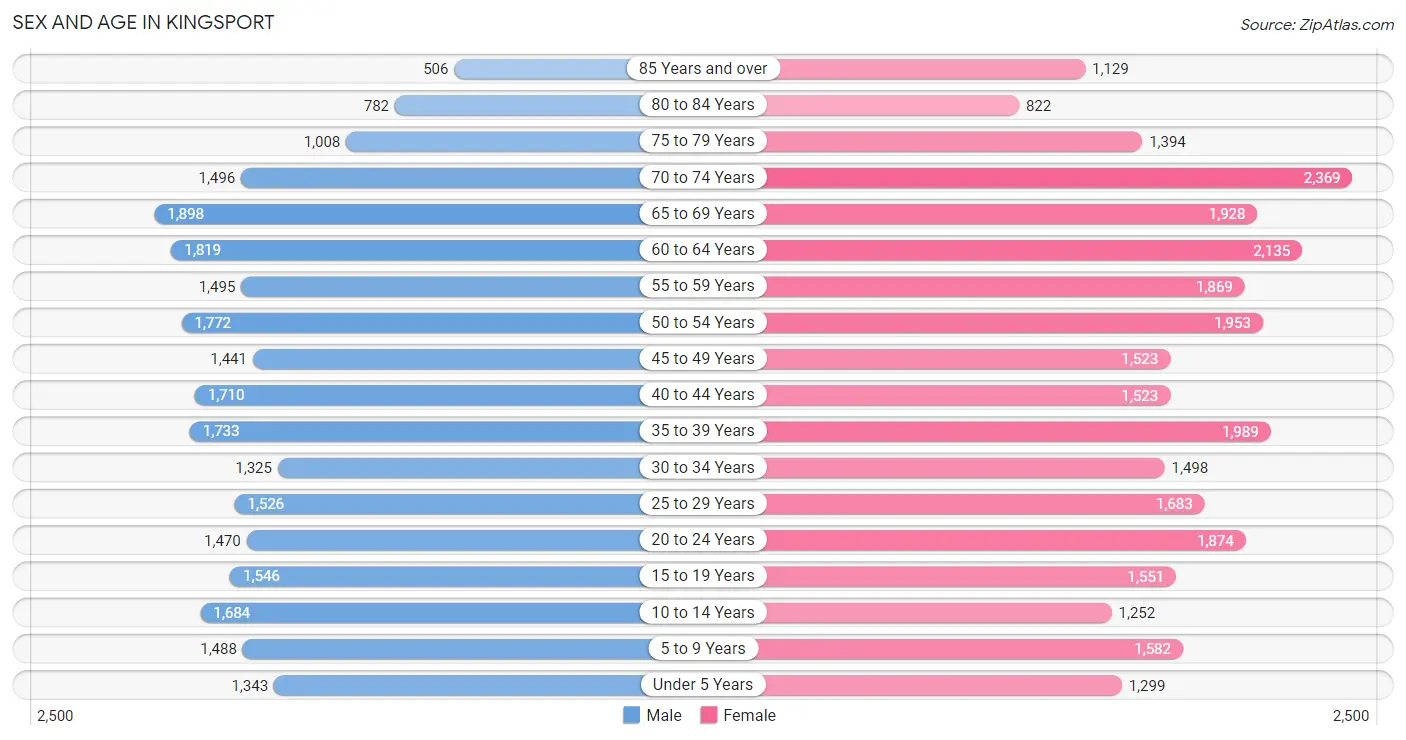
Sex and Age in Kingsport
The most populous age groups in Kingsport are 65 to 69 Years (1,898 | 7.3%) for men and 70 to 74 Years (2,369 | 8.1%) for women.
| Age Bracket | Male | Female |
| Under 5 Years | 1,343 (5.2%) | 1,299 (4.4%) |
| 5 to 9 Years | 1,488 (5.7%) | 1,582 (5.4%) |
| 10 to 14 Years | 1,684 (6.5%) | 1,252 (4.3%) |
| 15 to 19 Years | 1,546 (5.9%) | 1,551 (5.3%) |
| 20 to 24 Years | 1,470 (5.6%) | 1,874 (6.4%) |
| 25 to 29 Years | 1,526 (5.9%) | 1,683 (5.7%) |
| 30 to 34 Years | 1,325 (5.1%) | 1,498 (5.1%) |
| 35 to 39 Years | 1,733 (6.7%) | 1,989 (6.8%) |
| 40 to 44 Years | 1,710 (6.6%) | 1,523 (5.2%) |
| 45 to 49 Years | 1,441 (5.5%) | 1,523 (5.2%) |
| 50 to 54 Years | 1,772 (6.8%) | 1,953 (6.7%) |
| 55 to 59 Years | 1,495 (5.7%) | 1,869 (6.4%) |
| 60 to 64 Years | 1,819 (7.0%) | 2,135 (7.3%) |
| 65 to 69 Years | 1,898 (7.3%) | 1,928 (6.6%) |
| 70 to 74 Years | 1,496 (5.7%) | 2,369 (8.1%) |
| 75 to 79 Years | 1,008 (3.9%) | 1,394 (4.8%) |
| 80 to 84 Years | 782 (3.0%) | 822 (2.8%) |
| 85 Years and over | 506 (1.9%) | 1,129 (3.8%) |
| Total | 26,042 (100.0%) | 29,373 (100.0%) |
Families and Households in Kingsport
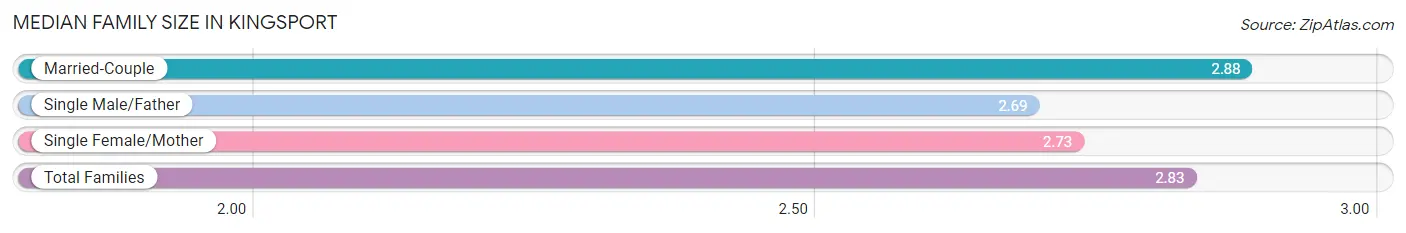
Median Family Size in Kingsport
The median family size in Kingsport is 2.83 persons per family, with married-couple families (9,957 | 67.8%) accounting for the largest median family size of 2.88 persons per family. On the other hand, single male/father families (1,089 | 7.4%) represent the smallest median family size with 2.69 persons per family.
| Family Type | # Families | Family Size |
| Married-Couple | 9,957 (67.8%) | 2.88 |
| Single Male/Father | 1,089 (7.4%) | 2.69 |
| Single Female/Mother | 3,637 (24.8%) | 2.73 |
| Total Families | 14,683 (100.0%) | 2.83 |
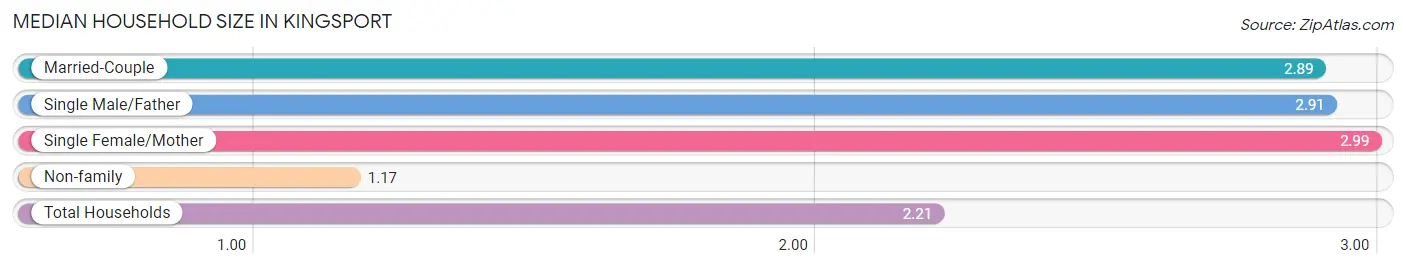
Median Household Size in Kingsport
The median household size in Kingsport is 2.21 persons per household, with single female/mother households (3,637 | 14.7%) accounting for the largest median household size of 2.99 persons per household. non-family households (10,032 | 40.6%) represent the smallest median household size with 1.17 persons per household.
| Household Type | # Households | Household Size |
| Married-Couple | 9,957 (40.3%) | 2.89 |
| Single Male/Father | 1,089 (4.4%) | 2.91 |
| Single Female/Mother | 3,637 (14.7%) | 2.99 |
| Non-family | 10,032 (40.6%) | 1.17 |
| Total Households | 24,715 (100.0%) | 2.21 |
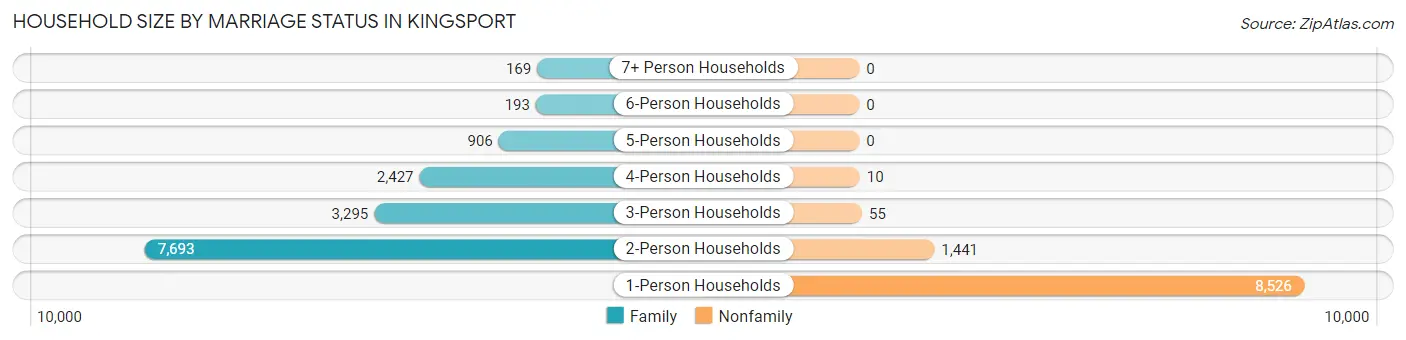
Household Size by Marriage Status in Kingsport
Out of a total of 24,715 households in Kingsport, 14,683 (59.4%) are family households, while 10,032 (40.6%) are nonfamily households. The most numerous type of family households are 2-person households, comprising 7,693, and the most common type of nonfamily households are 1-person households, comprising 8,526.
| Household Size | Family Households | Nonfamily Households |
| 1-Person Households | - | 8,526 (34.5%) |
| 2-Person Households | 7,693 (31.1%) | 1,441 (5.8%) |
| 3-Person Households | 3,295 (13.3%) | 55 (0.2%) |
| 4-Person Households | 2,427 (9.8%) | 10 (0.0%) |
| 5-Person Households | 906 (3.7%) | 0 (0.0%) |
| 6-Person Households | 193 (0.8%) | 0 (0.0%) |
| 7+ Person Households | 169 (0.7%) | 0 (0.0%) |
| Total | 14,683 (59.4%) | 10,032 (40.6%) |
Female Fertility in Kingsport
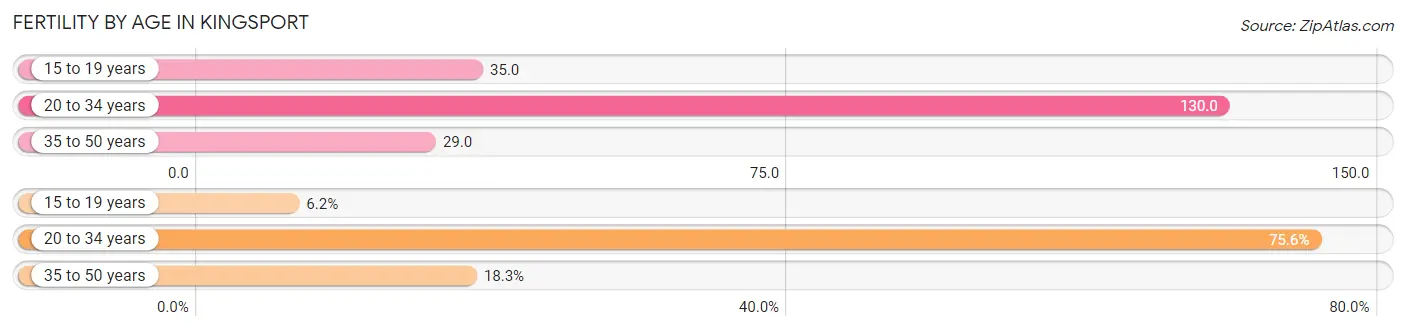
Fertility by Age in Kingsport
Average fertility rate in Kingsport is 72.0 births per 1,000 women. Women in the age bracket of 20 to 34 years have the highest fertility rate with 130.0 births per 1,000 women. Women in the age bracket of 20 to 34 years acount for 75.5% of all women with births.
| Age Bracket | Women with Births | Births / 1,000 Women |
| 15 to 19 years | 54 (6.2%) | 35.0 |
| 20 to 34 years | 658 (75.5%) | 130.0 |
| 35 to 50 years | 159 (18.2%) | 29.0 |
| Total | 871 (100.0%) | 72.0 |
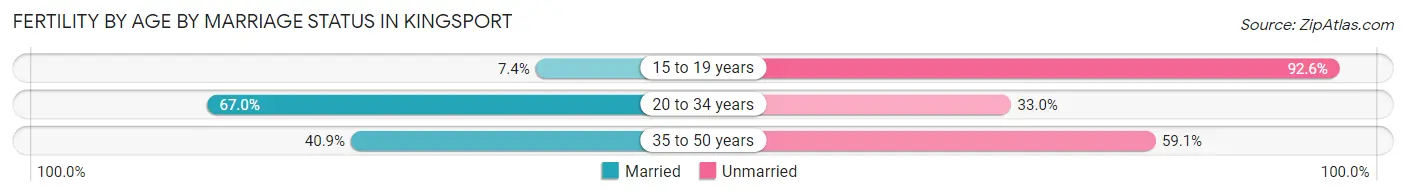
Fertility by Age by Marriage Status in Kingsport
58.6% of women with births (871) in Kingsport are married. The highest percentage of unmarried women with births falls into 15 to 19 years age bracket with 92.6% of them unmarried at the time of birth, while the lowest percentage of unmarried women with births belong to 20 to 34 years age bracket with 33.0% of them unmarried.
| Age Bracket | Married | Unmarried |
| 15 to 19 years | 4 (7.4%) | 50 (92.6%) |
| 20 to 34 years | 441 (67.0%) | 217 (33.0%) |
| 35 to 50 years | 65 (40.9%) | 94 (59.1%) |
| Total | 510 (58.6%) | 361 (41.4%) |
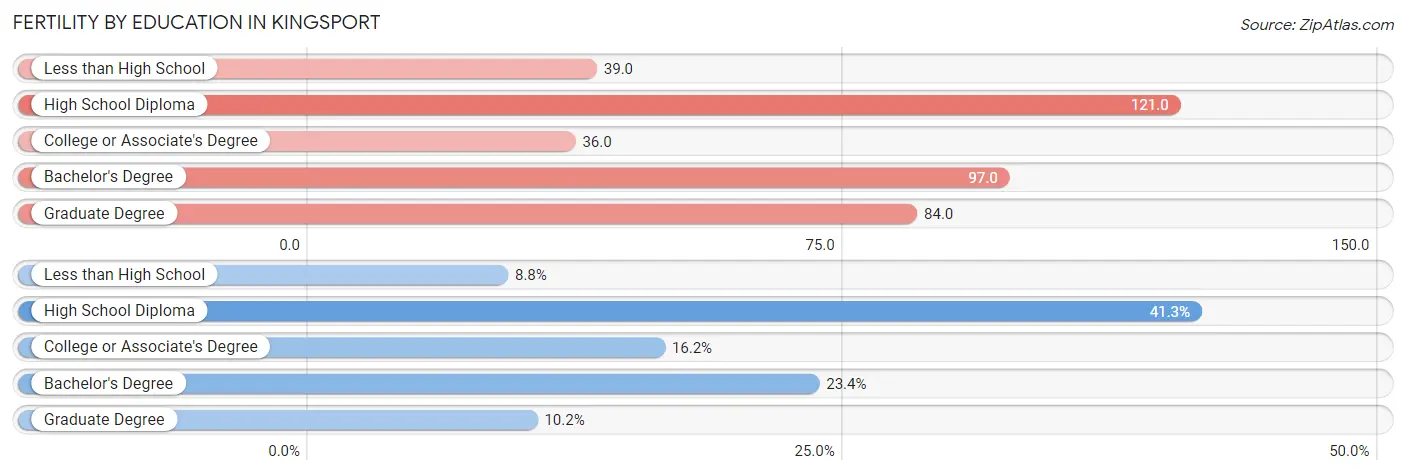
Fertility by Education in Kingsport
Average fertility rate in Kingsport is 72.0 births per 1,000 women. Women with the education attainment of high school diploma have the highest fertility rate of 121.0 births per 1,000 women, while women with the education attainment of college or associate's degree have the lowest fertility at 36.0 births per 1,000 women. Women with the education attainment of high school diploma represent 41.3% of all women with births.
| Educational Attainment | Women with Births | Births / 1,000 Women |
| Less than High School | 77 (8.8%) | 39.0 |
| High School Diploma | 360 (41.3%) | 121.0 |
| College or Associate's Degree | 141 (16.2%) | 36.0 |
| Bachelor's Degree | 204 (23.4%) | 97.0 |
| Graduate Degree | 89 (10.2%) | 84.0 |
| Total | 871 (100.0%) | 72.0 |
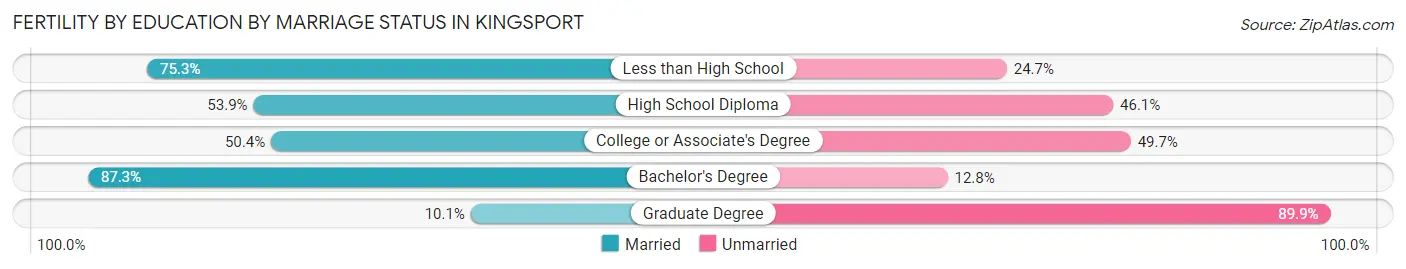
Fertility by Education by Marriage Status in Kingsport
41.4% of women with births in Kingsport are unmarried. Women with the educational attainment of bachelor's degree are most likely to be married with 87.3% of them married at childbirth, while women with the educational attainment of graduate degree are least likely to be married with 89.9% of them unmarried at childbirth.
| Educational Attainment | Married | Unmarried |
| Less than High School | 58 (75.3%) | 19 (24.7%) |
| High School Diploma | 194 (53.9%) | 166 (46.1%) |
| College or Associate's Degree | 71 (50.3%) | 70 (49.6%) |
| Bachelor's Degree | 178 (87.3%) | 26 (12.8%) |
| Graduate Degree | 9 (10.1%) | 80 (89.9%) |
| Total | 510 (58.6%) | 361 (41.4%) |
Income in Kingsport
Income Overview in Kingsport
Per Capita Income in Kingsport is $34,878, while median incomes of families and households are $68,645 and $48,228 respectively.
| Characteristic | Number | Measure |
| Per Capita Income | 55,415 | $34,878 |
| Median Family Income | 14,683 | $68,645 |
| Mean Family Income | 14,683 | $93,916 |
| Median Household Income | 24,715 | $48,228 |
| Mean Household Income | 24,715 | $76,245 |
| Income Deficit | 14,683 | $11,529 |
| Wage / Income Gap (%) | 55,415 | 37.90% |
| Wage / Income Gap ($) | 55,415 | 62.10¢ per $1 |
| Gini / Inequality Index | 55,415 | 0.51 |
Earnings by Sex in Kingsport
Average Earnings in Kingsport are $33,618, $44,150 for men and $27,419 for women, a difference of 37.9%.
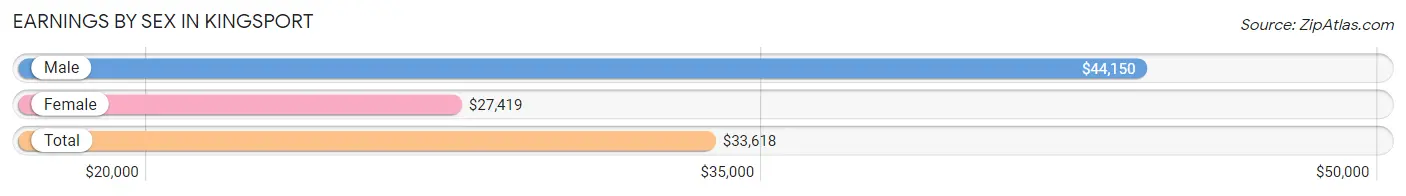
| Sex | Number | Average Earnings |
| Male | 12,831 (48.8%) | $44,150 |
| Female | 13,478 (51.2%) | $27,419 |
| Total | 26,309 (100.0%) | $33,618 |
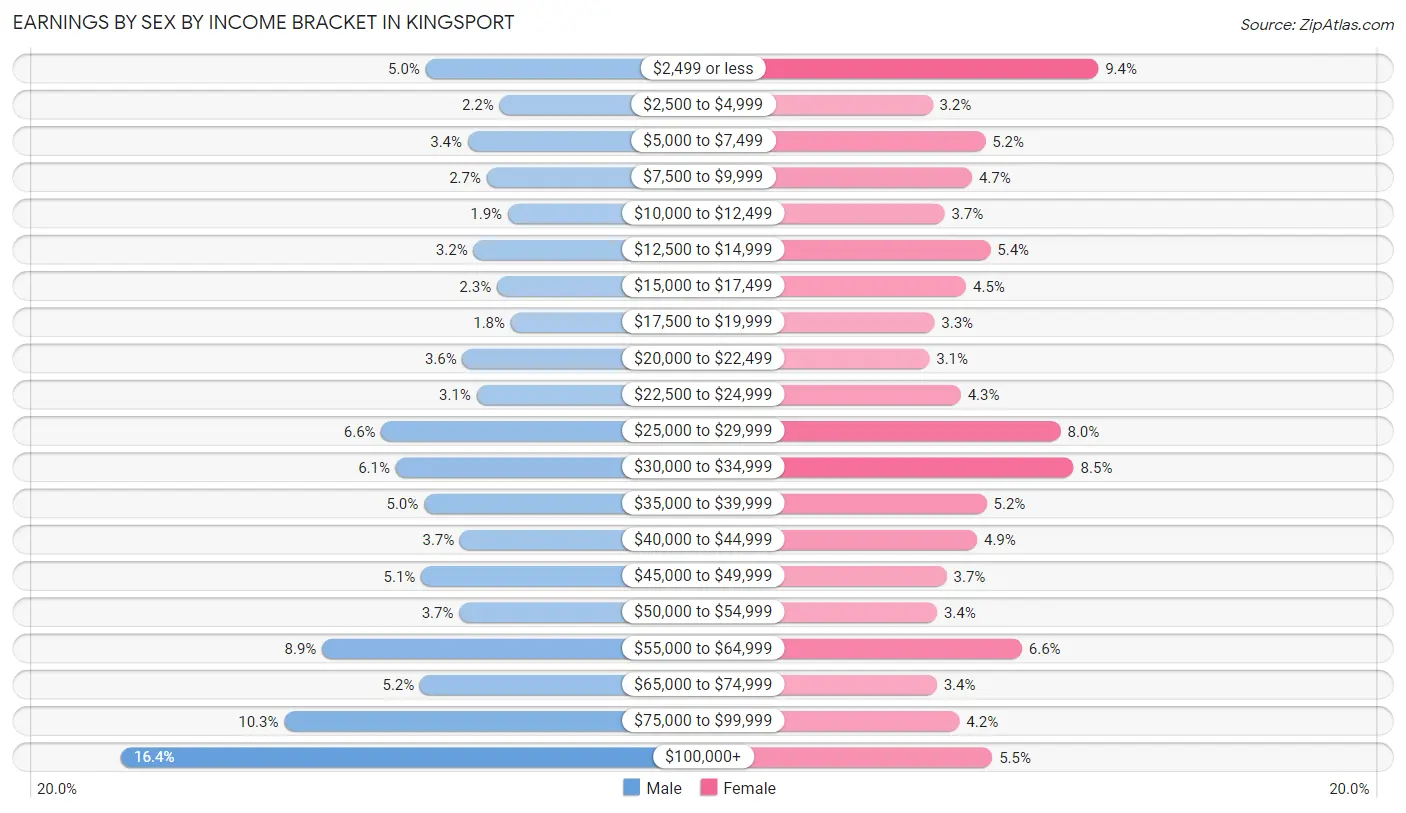
Earnings by Sex by Income Bracket in Kingsport
The most common earnings brackets in Kingsport are $100,000+ for men (2,102 | 16.4%) and $2,499 or less for women (1,269 | 9.4%).
| Income | Male | Female |
| $2,499 or less | 638 (5.0%) | 1,269 (9.4%) |
| $2,500 to $4,999 | 282 (2.2%) | 433 (3.2%) |
| $5,000 to $7,499 | 435 (3.4%) | 700 (5.2%) |
| $7,500 to $9,999 | 344 (2.7%) | 632 (4.7%) |
| $10,000 to $12,499 | 243 (1.9%) | 493 (3.7%) |
| $12,500 to $14,999 | 408 (3.2%) | 725 (5.4%) |
| $15,000 to $17,499 | 295 (2.3%) | 602 (4.5%) |
| $17,500 to $19,999 | 228 (1.8%) | 442 (3.3%) |
| $20,000 to $22,499 | 460 (3.6%) | 417 (3.1%) |
| $22,500 to $24,999 | 392 (3.1%) | 576 (4.3%) |
| $25,000 to $29,999 | 851 (6.6%) | 1,079 (8.0%) |
| $30,000 to $34,999 | 782 (6.1%) | 1,145 (8.5%) |
| $35,000 to $39,999 | 645 (5.0%) | 706 (5.2%) |
| $40,000 to $44,999 | 472 (3.7%) | 658 (4.9%) |
| $45,000 to $49,999 | 660 (5.1%) | 504 (3.7%) |
| $50,000 to $54,999 | 476 (3.7%) | 456 (3.4%) |
| $55,000 to $64,999 | 1,135 (8.8%) | 884 (6.6%) |
| $65,000 to $74,999 | 665 (5.2%) | 454 (3.4%) |
| $75,000 to $99,999 | 1,318 (10.3%) | 569 (4.2%) |
| $100,000+ | 2,102 (16.4%) | 734 (5.4%) |
| Total | 12,831 (100.0%) | 13,478 (100.0%) |
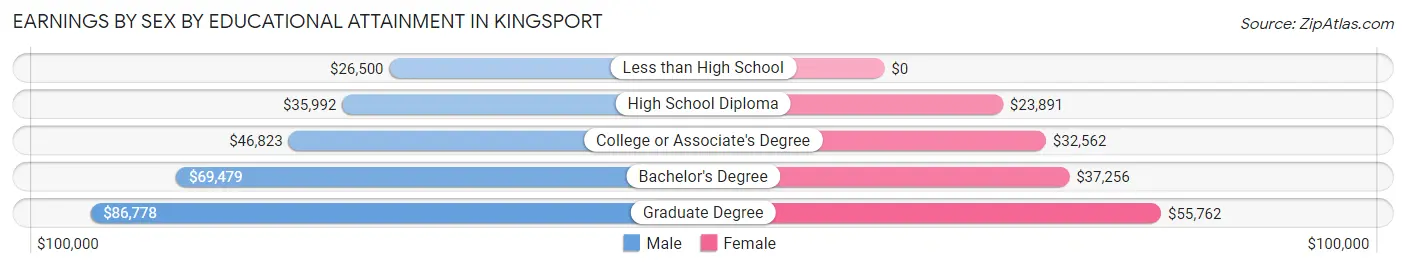
Earnings by Sex by Educational Attainment in Kingsport
Average earnings in Kingsport are $49,686 for men and $32,848 for women, a difference of 33.9%. Men with an educational attainment of graduate degree enjoy the highest average annual earnings of $86,778, while those with less than high school education earn the least with $26,500. Women with an educational attainment of graduate degree earn the most with the average annual earnings of $55,762, while those with high school diploma education have the smallest earnings of $23,891.
| Educational Attainment | Male Income | Female Income |
| Less than High School | $26,500 | $0 |
| High School Diploma | $35,992 | $23,891 |
| College or Associate's Degree | $46,823 | $32,562 |
| Bachelor's Degree | $69,479 | $37,256 |
| Graduate Degree | $86,778 | $55,762 |
| Total | $49,686 | $32,848 |
Family Income in Kingsport
Family Income Brackets in Kingsport
According to the Kingsport family income data, there are 2,614 families falling into the $100,000 to $149,999 income range, which is the most common income bracket and makes up 17.8% of all families. Conversely, the $10,000 to $14,999 income bracket is the least frequent group with only 587 families (4.0%) belonging to this category.
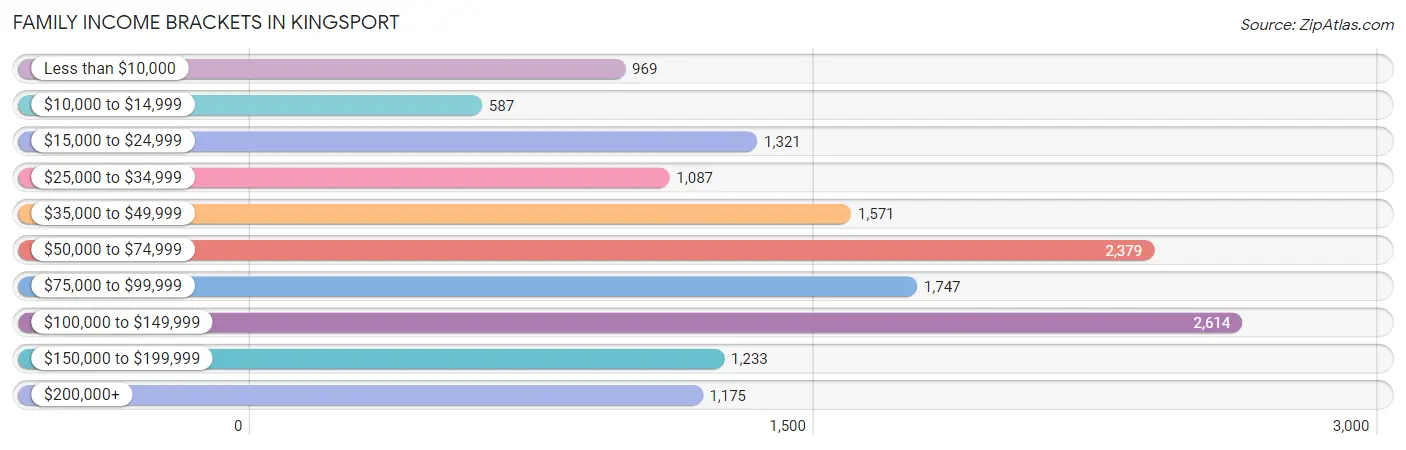
| Income Bracket | # Families | % Families |
| Less than $10,000 | 969 | 6.6% |
| $10,000 to $14,999 | 587 | 4.0% |
| $15,000 to $24,999 | 1,321 | 9.0% |
| $25,000 to $34,999 | 1,087 | 7.4% |
| $35,000 to $49,999 | 1,571 | 10.7% |
| $50,000 to $74,999 | 2,379 | 16.2% |
| $75,000 to $99,999 | 1,747 | 11.9% |
| $100,000 to $149,999 | 2,614 | 17.8% |
| $150,000 to $199,999 | 1,233 | 8.4% |
| $200,000+ | 1,175 | 8.0% |
Family Income by Famaliy Size in Kingsport
4-person families (2,357 | 16.1%) account for the highest median family income in Kingsport with $89,884 per family, while 2-person families (8,157 | 55.5%) have the highest median income of $32,204 per family member.
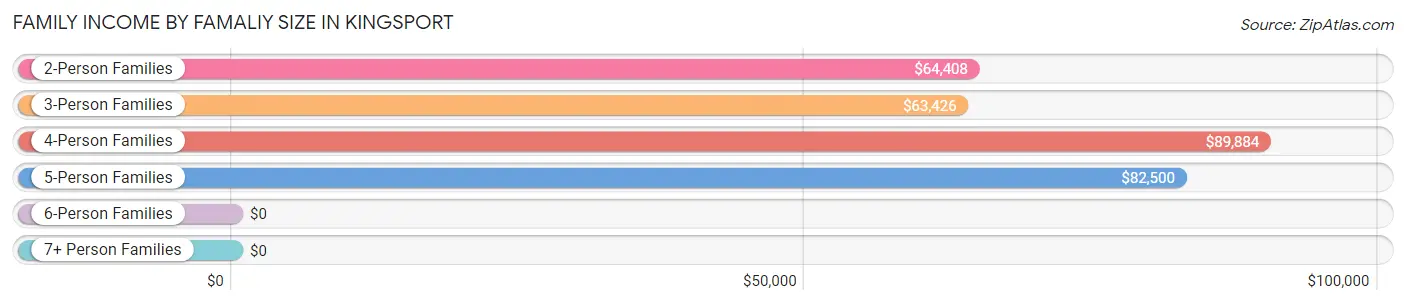
| Income Bracket | # Families | Median Income |
| 2-Person Families | 8,157 (55.5%) | $64,408 |
| 3-Person Families | 3,058 (20.8%) | $63,426 |
| 4-Person Families | 2,357 (16.1%) | $89,884 |
| 5-Person Families | 836 (5.7%) | $82,500 |
| 6-Person Families | 205 (1.4%) | $0 |
| 7+ Person Families | 70 (0.5%) | $0 |
| Total | 14,683 (100.0%) | $68,645 |
Family Income by Number of Earners in Kingsport
The median family income in Kingsport is $68,645, with families comprising 3+ earners (878) having the highest median family income of $135,357, while families with no earners (3,663) have the lowest median family income of $36,011, accounting for 6.0% and 24.9% of families, respectively.
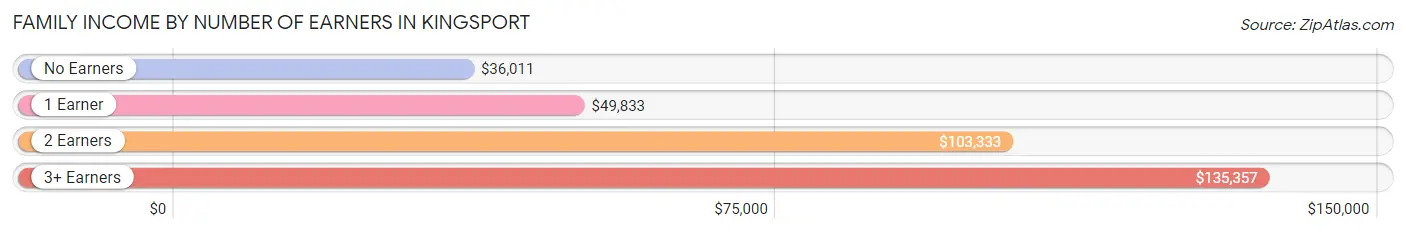
| Number of Earners | # Families | Median Income |
| No Earners | 3,663 (24.9%) | $36,011 |
| 1 Earner | 4,848 (33.0%) | $49,833 |
| 2 Earners | 5,294 (36.1%) | $103,333 |
| 3+ Earners | 878 (6.0%) | $135,357 |
| Total | 14,683 (100.0%) | $68,645 |
Household Income in Kingsport
Household Income Brackets in Kingsport
With 3,658 households falling in the category, the $50,000 to $74,999 income range is the most frequent in Kingsport, accounting for 14.8% of all households. In contrast, only 1,409 households (5.7%) fall into the $200,000+ income bracket, making it the least populous group.
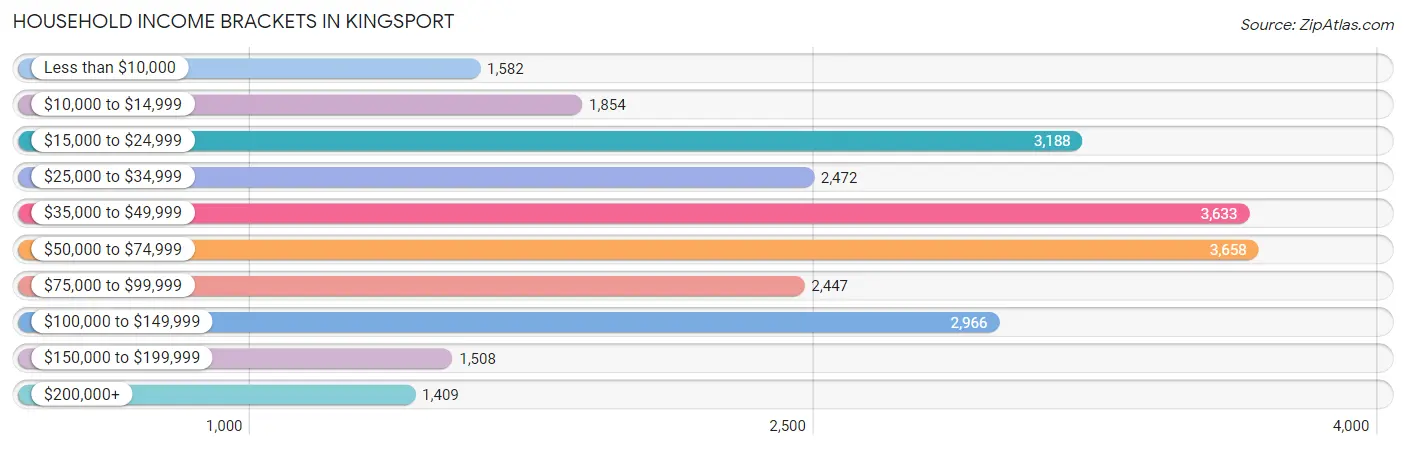
| Income Bracket | # Households | % Households |
| Less than $10,000 | 1,582 | 6.4% |
| $10,000 to $14,999 | 1,854 | 7.5% |
| $15,000 to $24,999 | 3,188 | 12.9% |
| $25,000 to $34,999 | 2,472 | 10.0% |
| $35,000 to $49,999 | 3,633 | 14.7% |
| $50,000 to $74,999 | 3,658 | 14.8% |
| $75,000 to $99,999 | 2,447 | 9.9% |
| $100,000 to $149,999 | 2,966 | 12.0% |
| $150,000 to $199,999 | 1,508 | 6.1% |
| $200,000+ | 1,409 | 5.7% |
Household Income by Householder Age in Kingsport
The median household income in Kingsport is $48,228, with the highest median household income of $59,073 found in the 45 to 64 years age bracket for the primary householder. A total of 7,916 households (32.0%) fall into this category. Meanwhile, the 15 to 24 years age bracket for the primary householder has the lowest median household income of $16,729, with 1,279 households (5.2%) in this group.
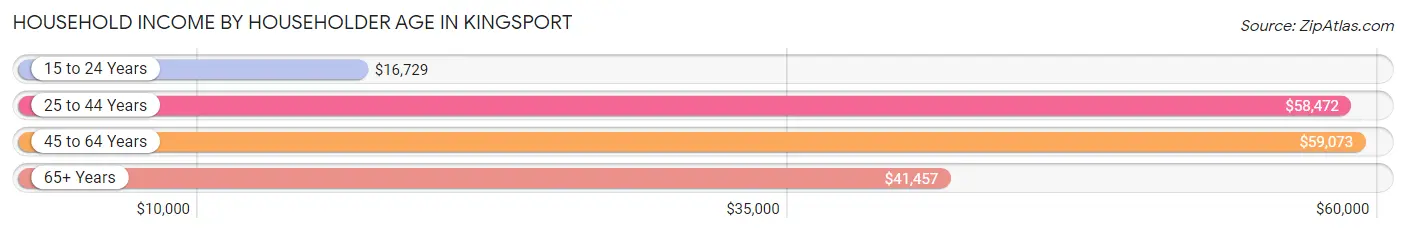
| Income Bracket | # Households | Median Income |
| 15 to 24 Years | 1,279 (5.2%) | $16,729 |
| 25 to 44 Years | 6,852 (27.7%) | $58,472 |
| 45 to 64 Years | 7,916 (32.0%) | $59,073 |
| 65+ Years | 8,668 (35.1%) | $41,457 |
| Total | 24,715 (100.0%) | $48,228 |
Poverty in Kingsport
Income Below Poverty by Sex and Age in Kingsport
With 19.3% poverty level for males and 21.0% for females among the residents of Kingsport, under 5 year old males and under 5 year old females are the most vulnerable to poverty, with 700 males (52.1%) and 553 females (42.6%) in their respective age groups living below the poverty level.
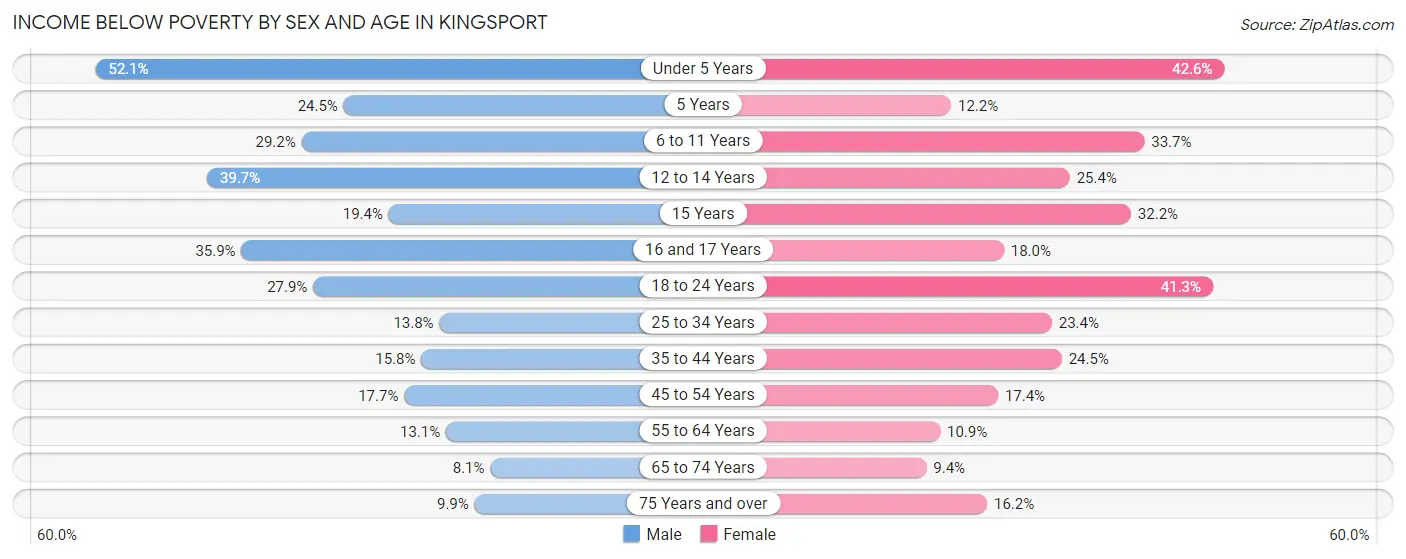
| Age Bracket | Male | Female |
| Under 5 Years | 700 (52.1%) | 553 (42.6%) |
| 5 Years | 80 (24.5%) | 41 (12.2%) |
| 6 to 11 Years | 542 (29.2%) | 573 (33.7%) |
| 12 to 14 Years | 376 (39.7%) | 202 (25.4%) |
| 15 Years | 69 (19.4%) | 114 (32.2%) |
| 16 and 17 Years | 252 (35.8%) | 138 (18.0%) |
| 18 to 24 Years | 539 (27.9%) | 940 (41.3%) |
| 25 to 34 Years | 393 (13.8%) | 743 (23.4%) |
| 35 to 44 Years | 544 (15.8%) | 853 (24.5%) |
| 45 to 54 Years | 564 (17.7%) | 603 (17.4%) |
| 55 to 64 Years | 425 (13.1%) | 434 (10.9%) |
| 65 to 74 Years | 271 (8.1%) | 404 (9.4%) |
| 75 Years and over | 222 (9.9%) | 502 (16.2%) |
| Total | 4,977 (19.3%) | 6,100 (21.0%) |
Income Above Poverty by Sex and Age in Kingsport
According to the poverty statistics in Kingsport, males aged 65 to 74 years and females aged 65 to 74 years are the age groups that are most secure financially, with 91.9% of males and 90.6% of females in these age groups living above the poverty line.
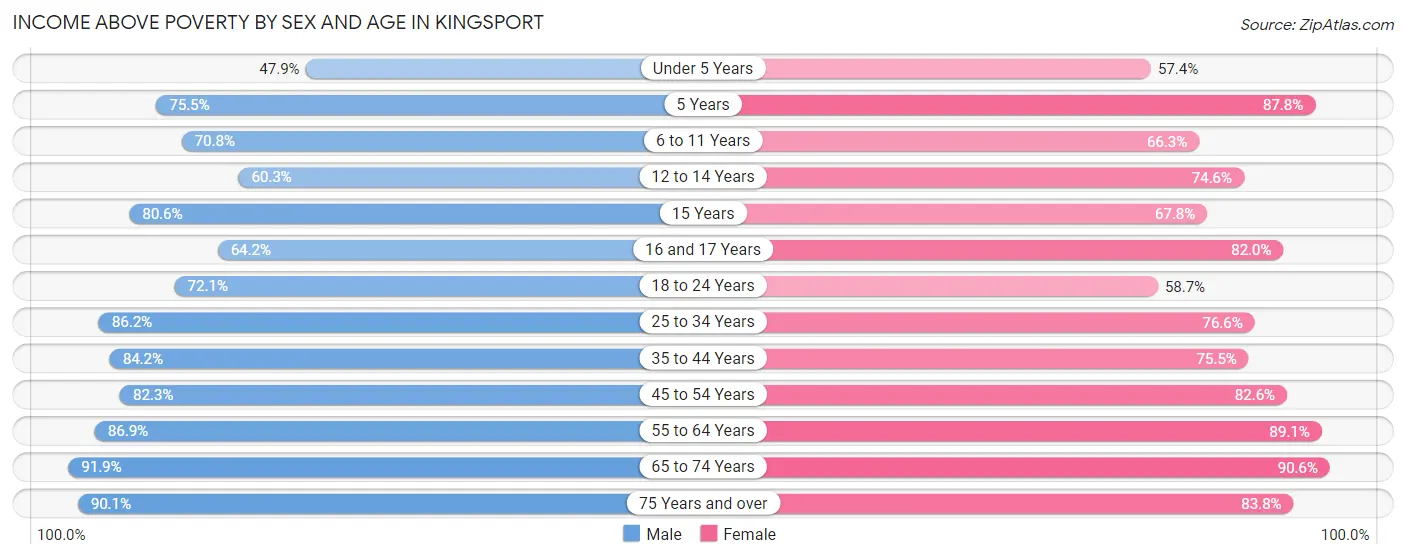
| Age Bracket | Male | Female |
| Under 5 Years | 643 (47.9%) | 745 (57.4%) |
| 5 Years | 247 (75.5%) | 296 (87.8%) |
| 6 to 11 Years | 1,317 (70.8%) | 1,128 (66.3%) |
| 12 to 14 Years | 571 (60.3%) | 594 (74.6%) |
| 15 Years | 286 (80.6%) | 240 (67.8%) |
| 16 and 17 Years | 451 (64.1%) | 627 (82.0%) |
| 18 to 24 Years | 1,396 (72.1%) | 1,335 (58.7%) |
| 25 to 34 Years | 2,455 (86.2%) | 2,433 (76.6%) |
| 35 to 44 Years | 2,894 (84.2%) | 2,630 (75.5%) |
| 45 to 54 Years | 2,618 (82.3%) | 2,864 (82.6%) |
| 55 to 64 Years | 2,830 (86.9%) | 3,532 (89.1%) |
| 65 to 74 Years | 3,062 (91.9%) | 3,883 (90.6%) |
| 75 Years and over | 2,025 (90.1%) | 2,600 (83.8%) |
| Total | 20,795 (80.7%) | 22,907 (79.0%) |
Income Below Poverty Among Married-Couple Families in Kingsport
The poverty statistics for married-couple families in Kingsport show that 3.8% or 381 of the total 9,957 families live below the poverty line. Families with 5 or more children have the highest poverty rate of 100.0%, comprising of 28 families. On the other hand, families with no children have the lowest poverty rate of 2.8%, which includes 180 families.
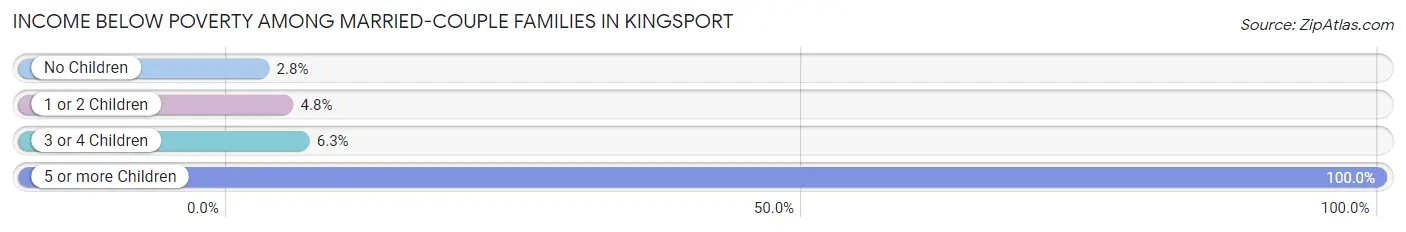
| Children | Above Poverty | Below Poverty |
| No Children | 6,372 (97.3%) | 180 (2.8%) |
| 1 or 2 Children | 2,574 (95.2%) | 131 (4.8%) |
| 3 or 4 Children | 630 (93.8%) | 42 (6.2%) |
| 5 or more Children | 0 (0.0%) | 28 (100.0%) |
| Total | 9,576 (96.2%) | 381 (3.8%) |
Income Below Poverty Among Single-Parent Households in Kingsport
According to the poverty data in Kingsport, 29.2% or 318 single-father households and 48.0% or 1,747 single-mother households are living below the poverty line. Among single-father households, those with 5 or more children have the highest poverty rate, with 7 households (100.0%) experiencing poverty. Likewise, among single-mother households, those with 5 or more children have the highest poverty rate, with 80 households (100.0%) falling below the poverty line.
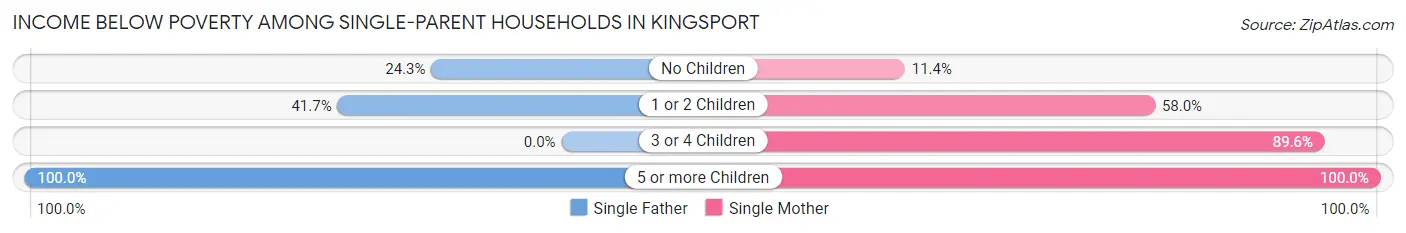
| Children | Single Father | Single Mother |
| No Children | 170 (24.2%) | 125 (11.4%) |
| 1 or 2 Children | 141 (41.7%) | 1,214 (58.0%) |
| 3 or 4 Children | 0 (0.0%) | 328 (89.6%) |
| 5 or more Children | 7 (100.0%) | 80 (100.0%) |
| Total | 318 (29.2%) | 1,747 (48.0%) |
Income Below Poverty Among Married-Couple vs Single-Parent Households in Kingsport
The poverty data for Kingsport shows that 381 of the married-couple family households (3.8%) and 2,065 of the single-parent households (43.7%) are living below the poverty level. Within the married-couple family households, those with 5 or more children have the highest poverty rate, with 28 households (100.0%) falling below the poverty line. Among the single-parent households, those with 5 or more children have the highest poverty rate, with 87 household (100.0%) living below poverty.
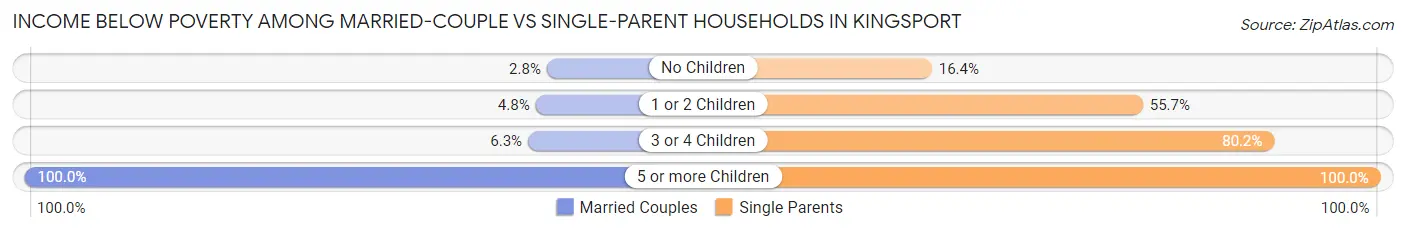
| Children | Married-Couple Families | Single-Parent Households |
| No Children | 180 (2.8%) | 295 (16.4%) |
| 1 or 2 Children | 131 (4.8%) | 1,355 (55.7%) |
| 3 or 4 Children | 42 (6.2%) | 328 (80.2%) |
| 5 or more Children | 28 (100.0%) | 87 (100.0%) |
| Total | 381 (3.8%) | 2,065 (43.7%) |
Employment Characteristics in Kingsport
Employment by Class of Employer in Kingsport
Among the 22,670 employed individuals in Kingsport, private company employees (16,302 | 71.9%), not-for-profit organizations (1,774 | 7.8%), and self-employed (not incorporated) (1,517 | 6.7%) make up the most common classes of employment.
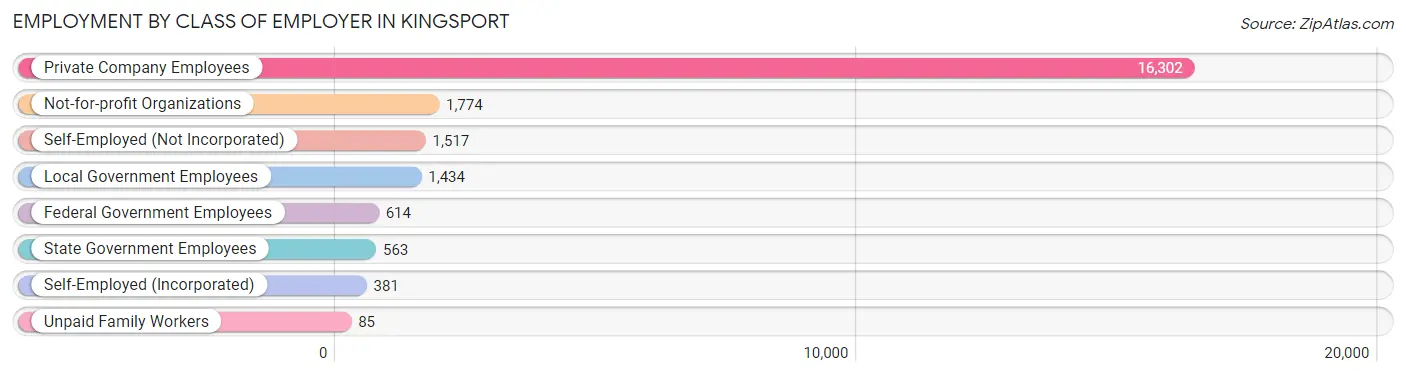
| Employer Class | # Employees | % Employees |
| Private Company Employees | 16,302 | 71.9% |
| Self-Employed (Incorporated) | 381 | 1.7% |
| Self-Employed (Not Incorporated) | 1,517 | 6.7% |
| Not-for-profit Organizations | 1,774 | 7.8% |
| Local Government Employees | 1,434 | 6.3% |
| State Government Employees | 563 | 2.5% |
| Federal Government Employees | 614 | 2.7% |
| Unpaid Family Workers | 85 | 0.4% |
| Total | 22,670 | 100.0% |
Employment Status by Age in Kingsport
According to the labor force statistics for Kingsport, out of the total population over 16 years of age (46,054), 53.6% or 24,685 individuals are in the labor force, with 5.3% or 1,308 of them unemployed. The age group with the highest labor force participation rate is 30 to 34 years, with 82.9% or 2,340 individuals in the labor force. Within the labor force, the 20 to 24 years age range has the highest percentage of unemployed individuals, with 15.0% or 356 of them being unemployed.
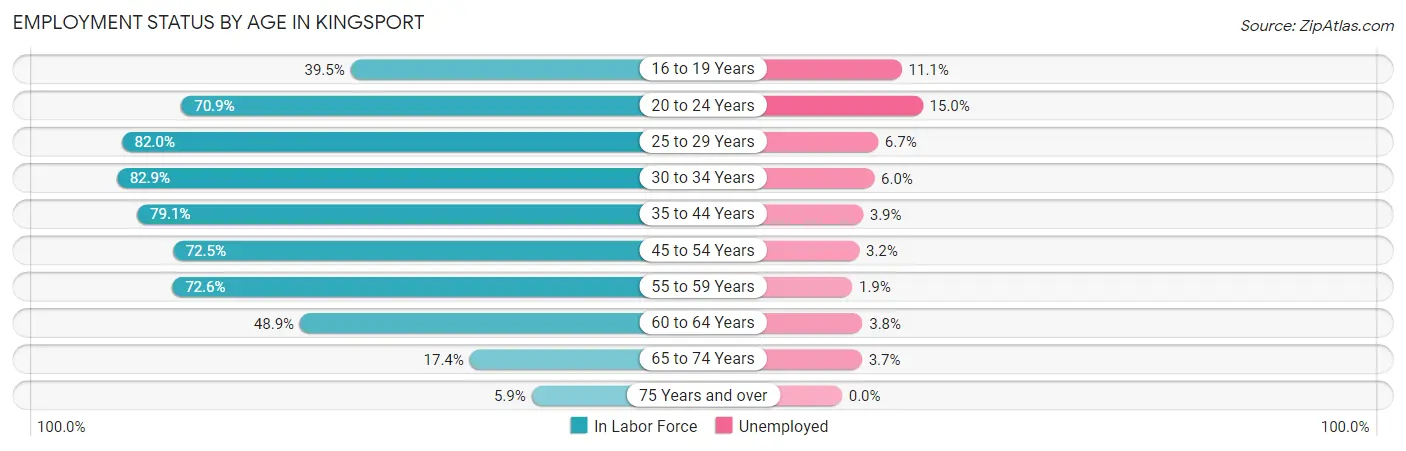
| Age Bracket | In Labor Force | Unemployed |
| 16 to 19 Years | 942 (39.5%) | 105 (11.1%) |
| 20 to 24 Years | 2,371 (70.9%) | 356 (15.0%) |
| 25 to 29 Years | 2,631 (82.0%) | 176 (6.7%) |
| 30 to 34 Years | 2,340 (82.9%) | 140 (6.0%) |
| 35 to 44 Years | 5,501 (79.1%) | 215 (3.9%) |
| 45 to 54 Years | 4,850 (72.5%) | 155 (3.2%) |
| 55 to 59 Years | 2,442 (72.6%) | 46 (1.9%) |
| 60 to 64 Years | 1,934 (48.9%) | 73 (3.8%) |
| 65 to 74 Years | 1,338 (17.4%) | 50 (3.7%) |
| 75 Years and over | 333 (5.9%) | 0 (0.0%) |
| Total | 24,685 (53.6%) | 1,308 (5.3%) |
Employment Status by Educational Attainment in Kingsport
According to labor force statistics for Kingsport, 73.0% of individuals (19,706) out of the total population between 25 and 64 years of age (26,994) are in the labor force, with 4.1% or 808 of them being unemployed. The group with the highest labor force participation rate are those with the educational attainment of bachelor's degree or higher, with 84.7% or 6,850 individuals in the labor force. Within the labor force, individuals with less than high school education have the highest percentage of unemployment, with 11.6% or 107 of them being unemployed.
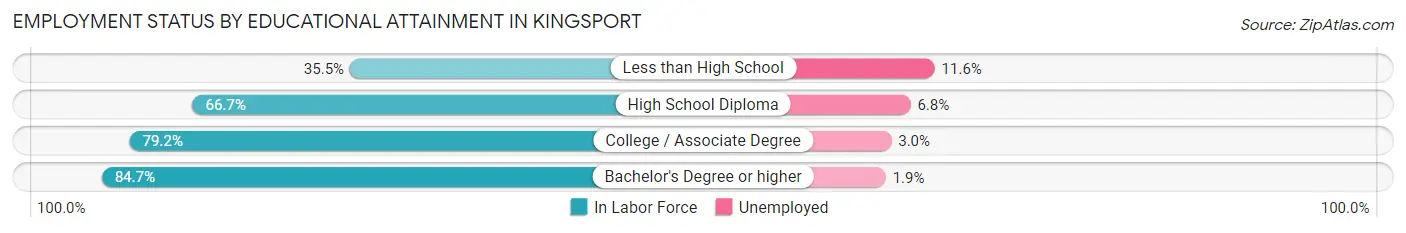
| Educational Attainment | In Labor Force | Unemployed |
| Less than High School | 926 (35.5%) | 303 (11.6%) |
| High School Diploma | 5,276 (66.7%) | 538 (6.8%) |
| College / Associate Degree | 6,643 (79.2%) | 252 (3.0%) |
| Bachelor's Degree or higher | 6,850 (84.7%) | 154 (1.9%) |
| Total | 19,706 (73.0%) | 1,107 (4.1%) |
Employment Occupations by Sex in Kingsport
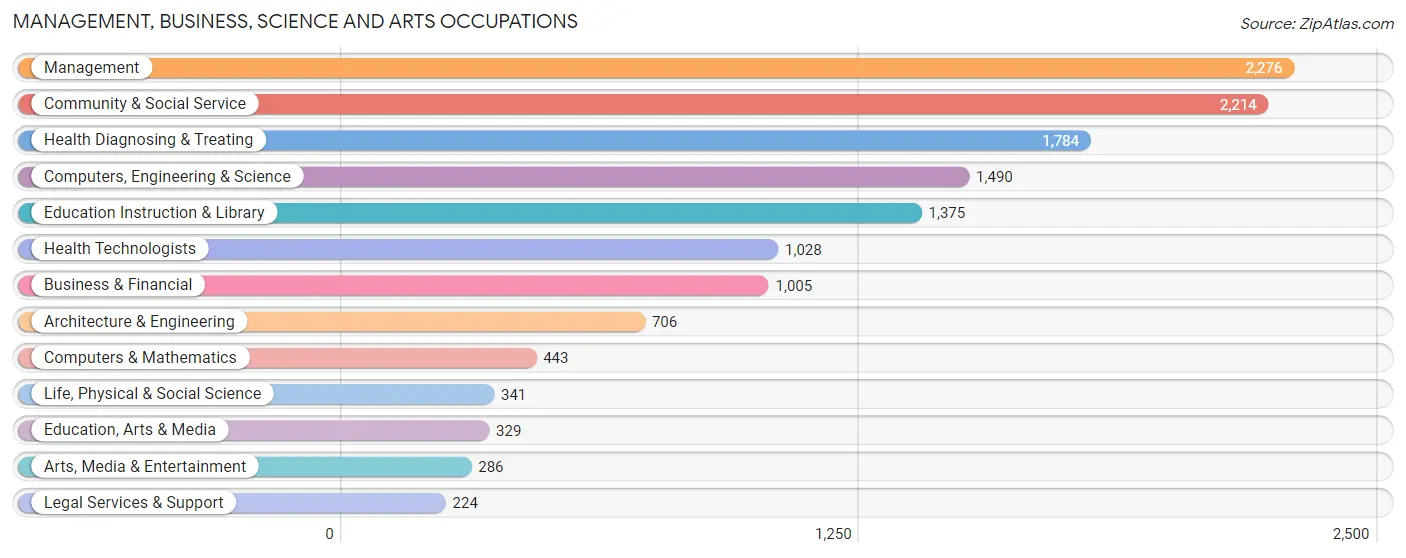
Management, Business, Science and Arts Occupations
The most common Management, Business, Science and Arts occupations in Kingsport are Management (2,276 | 9.8%), Community & Social Service (2,214 | 9.5%), Health Diagnosing & Treating (1,784 | 7.7%), Computers, Engineering & Science (1,490 | 6.4%), and Education Instruction & Library (1,375 | 5.9%).
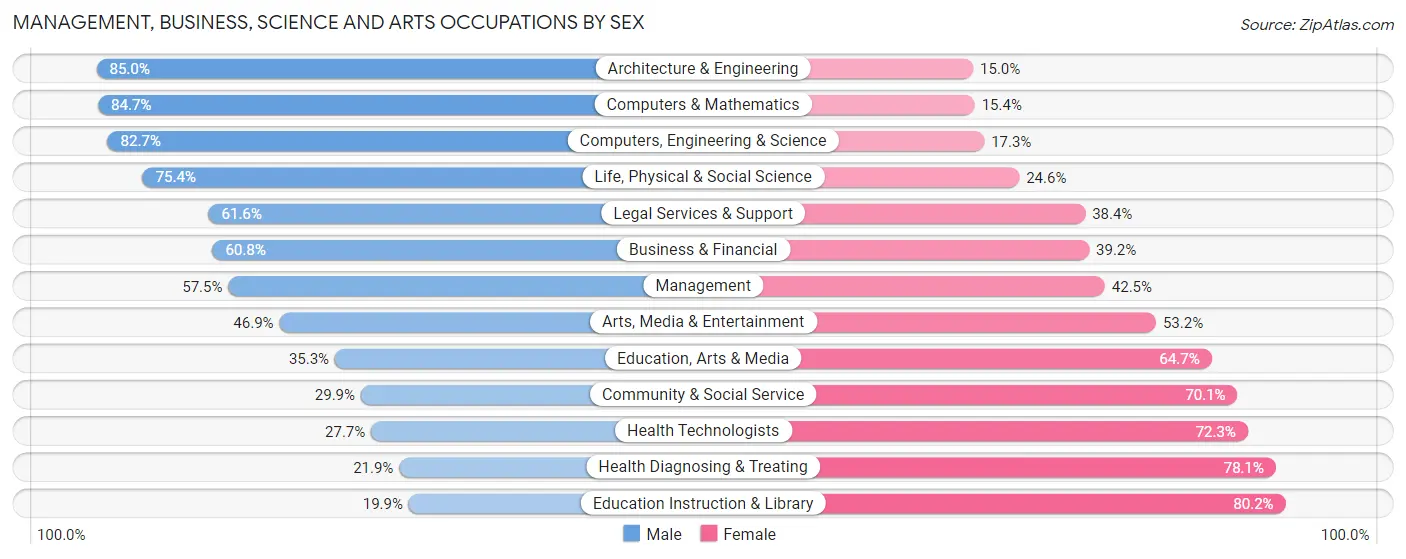
Management, Business, Science and Arts Occupations by Sex
Within the Management, Business, Science and Arts occupations in Kingsport, the most male-oriented occupations are Architecture & Engineering (85.0%), Computers & Mathematics (84.7%), and Computers, Engineering & Science (82.7%), while the most female-oriented occupations are Education Instruction & Library (80.1%), Health Diagnosing & Treating (78.1%), and Health Technologists (72.3%).
| Occupation | Male | Female |
| Management | 1,309 (57.5%) | 967 (42.5%) |
| Business & Financial | 611 (60.8%) | 394 (39.2%) |
| Computers, Engineering & Science | 1,232 (82.7%) | 258 (17.3%) |
| Computers & Mathematics | 375 (84.7%) | 68 (15.3%) |
| Architecture & Engineering | 600 (85.0%) | 106 (15.0%) |
| Life, Physical & Social Science | 257 (75.4%) | 84 (24.6%) |
| Community & Social Service | 661 (29.9%) | 1,553 (70.1%) |
| Education, Arts & Media | 116 (35.3%) | 213 (64.7%) |
| Legal Services & Support | 138 (61.6%) | 86 (38.4%) |
| Education Instruction & Library | 273 (19.9%) | 1,102 (80.1%) |
| Arts, Media & Entertainment | 134 (46.9%) | 152 (53.1%) |
| Health Diagnosing & Treating | 390 (21.9%) | 1,394 (78.1%) |
| Health Technologists | 285 (27.7%) | 743 (72.3%) |
| Total (Category) | 4,203 (47.9%) | 4,566 (52.1%) |
| Total (Overall) | 11,634 (49.9%) | 11,655 (50.0%) |
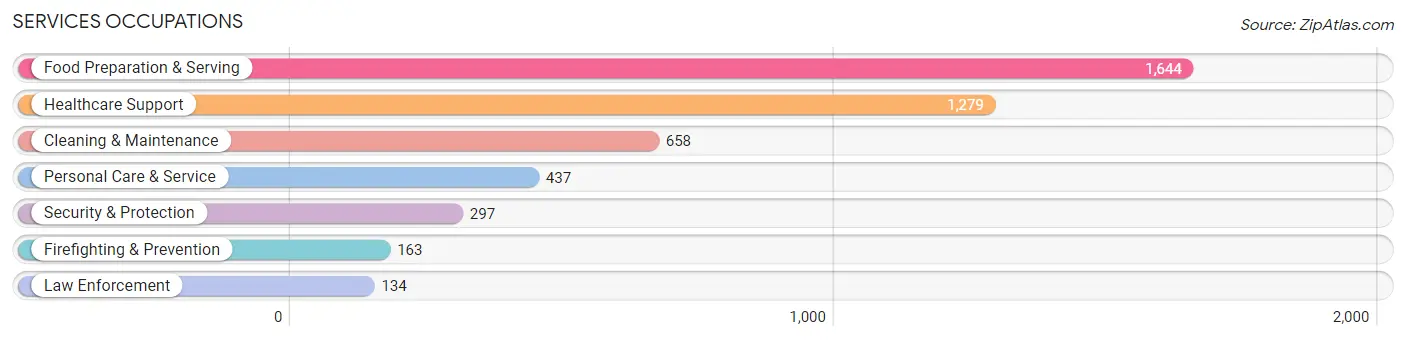
Services Occupations
The most common Services occupations in Kingsport are Food Preparation & Serving (1,644 | 7.1%), Healthcare Support (1,279 | 5.5%), Cleaning & Maintenance (658 | 2.8%), Personal Care & Service (437 | 1.9%), and Security & Protection (297 | 1.3%).
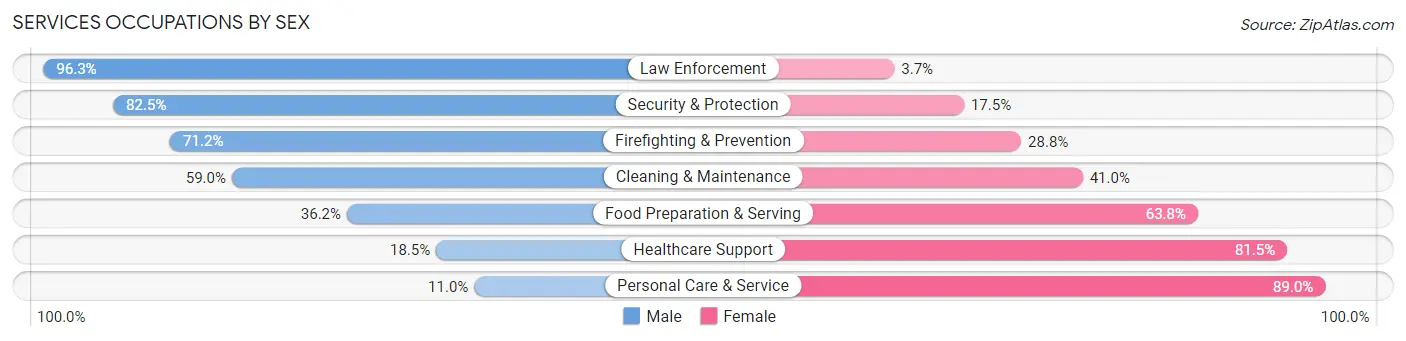
Services Occupations by Sex
Within the Services occupations in Kingsport, the most male-oriented occupations are Law Enforcement (96.3%), Security & Protection (82.5%), and Firefighting & Prevention (71.2%), while the most female-oriented occupations are Personal Care & Service (89.0%), Healthcare Support (81.5%), and Food Preparation & Serving (63.8%).
| Occupation | Male | Female |
| Healthcare Support | 237 (18.5%) | 1,042 (81.5%) |
| Security & Protection | 245 (82.5%) | 52 (17.5%) |
| Firefighting & Prevention | 116 (71.2%) | 47 (28.8%) |
| Law Enforcement | 129 (96.3%) | 5 (3.7%) |
| Food Preparation & Serving | 595 (36.2%) | 1,049 (63.8%) |
| Cleaning & Maintenance | 388 (59.0%) | 270 (41.0%) |
| Personal Care & Service | 48 (11.0%) | 389 (89.0%) |
| Total (Category) | 1,513 (35.1%) | 2,802 (64.9%) |
| Total (Overall) | 11,634 (49.9%) | 11,655 (50.0%) |
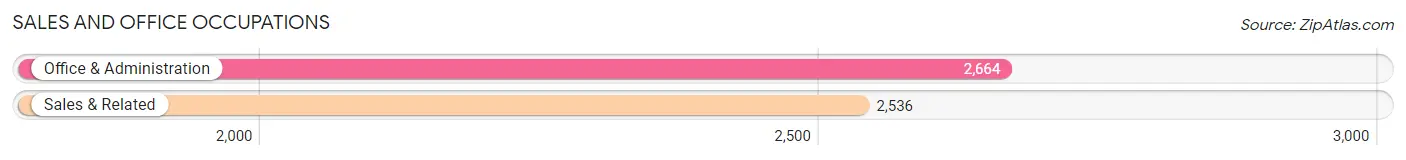
Sales and Office Occupations
The most common Sales and Office occupations in Kingsport are Office & Administration (2,664 | 11.4%), and Sales & Related (2,536 | 10.9%).
Sales and Office Occupations by Sex
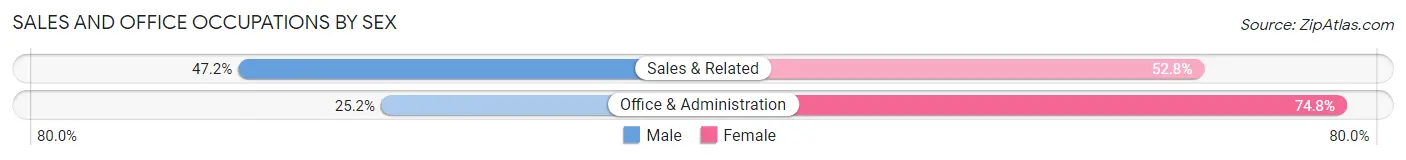
| Occupation | Male | Female |
| Sales & Related | 1,196 (47.2%) | 1,340 (52.8%) |
| Office & Administration | 671 (25.2%) | 1,993 (74.8%) |
| Total (Category) | 1,867 (35.9%) | 3,333 (64.1%) |
| Total (Overall) | 11,634 (49.9%) | 11,655 (50.0%) |
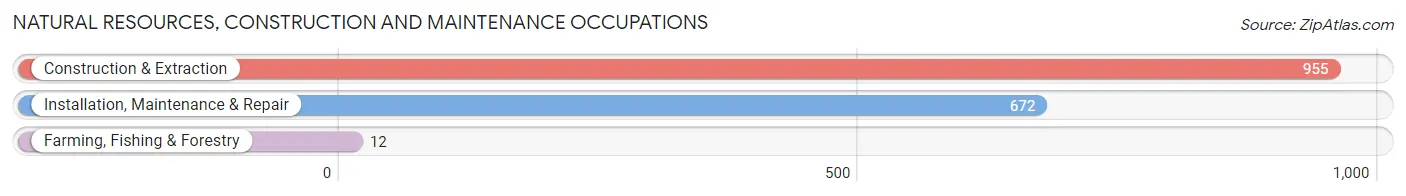
Natural Resources, Construction and Maintenance Occupations
The most common Natural Resources, Construction and Maintenance occupations in Kingsport are Construction & Extraction (955 | 4.1%), Installation, Maintenance & Repair (672 | 2.9%), and Farming, Fishing & Forestry (12 | 0.1%).
Natural Resources, Construction and Maintenance Occupations by Sex
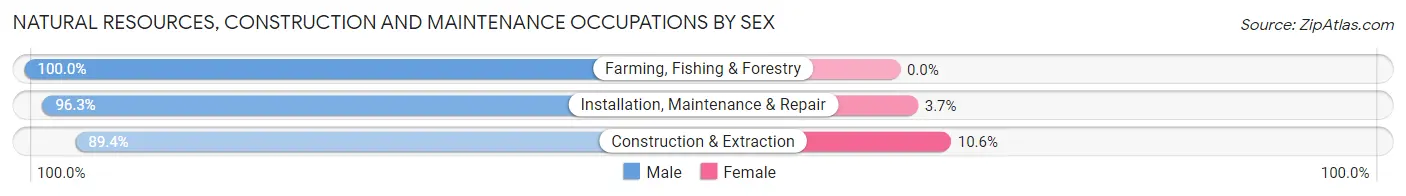
| Occupation | Male | Female |
| Farming, Fishing & Forestry | 12 (100.0%) | 0 (0.0%) |
| Construction & Extraction | 854 (89.4%) | 101 (10.6%) |
| Installation, Maintenance & Repair | 647 (96.3%) | 25 (3.7%) |
| Total (Category) | 1,513 (92.3%) | 126 (7.7%) |
| Total (Overall) | 11,634 (49.9%) | 11,655 (50.0%) |
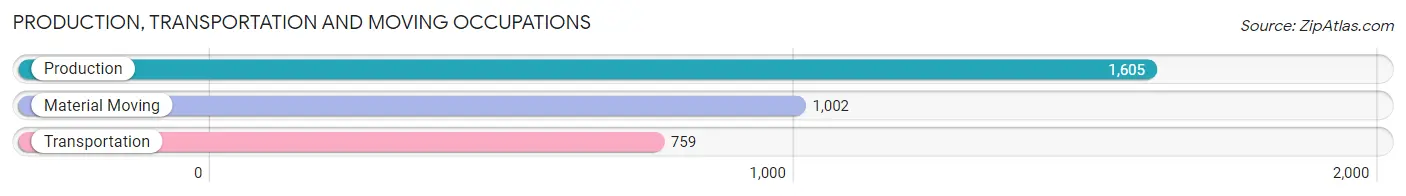
Production, Transportation and Moving Occupations
The most common Production, Transportation and Moving occupations in Kingsport are Production (1,605 | 6.9%), Material Moving (1,002 | 4.3%), and Transportation (759 | 3.3%).
Production, Transportation and Moving Occupations by Sex
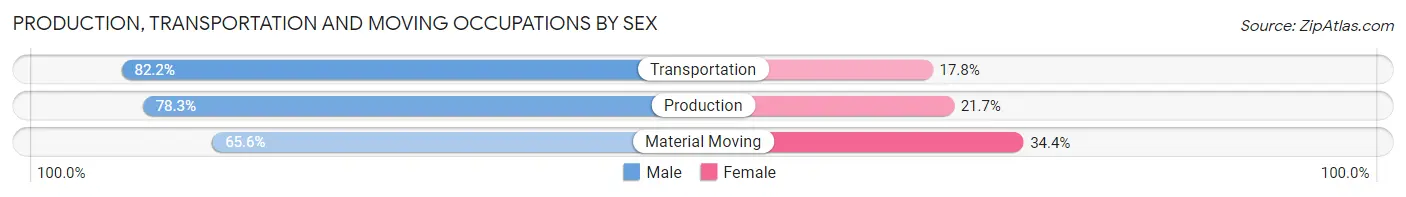
| Occupation | Male | Female |
| Production | 1,257 (78.3%) | 348 (21.7%) |
| Transportation | 624 (82.2%) | 135 (17.8%) |
| Material Moving | 657 (65.6%) | 345 (34.4%) |
| Total (Category) | 2,538 (75.4%) | 828 (24.6%) |
| Total (Overall) | 11,634 (49.9%) | 11,655 (50.0%) |
Employment Industries by Sex in Kingsport
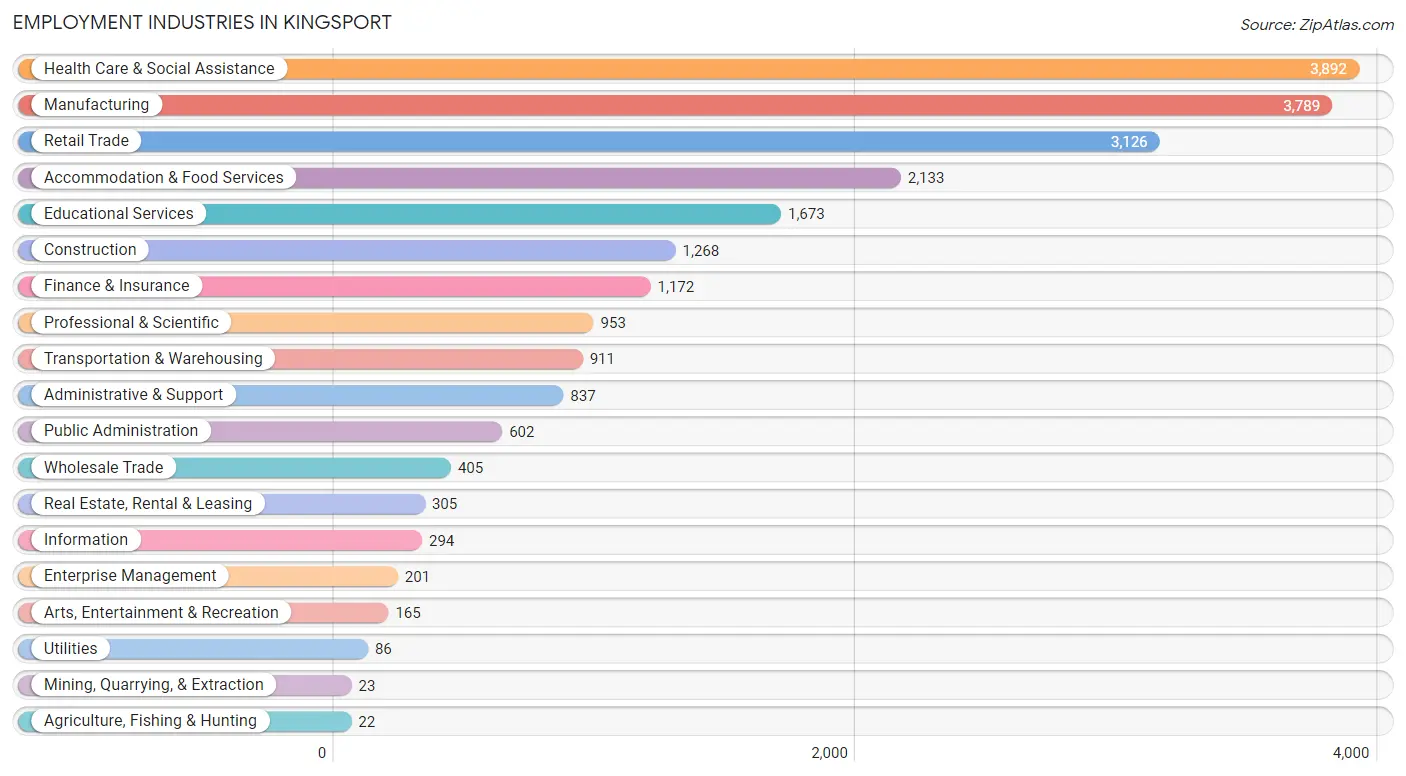
Employment Industries in Kingsport
The major employment industries in Kingsport include Health Care & Social Assistance (3,892 | 16.7%), Manufacturing (3,789 | 16.3%), Retail Trade (3,126 | 13.4%), Accommodation & Food Services (2,133 | 9.2%), and Educational Services (1,673 | 7.2%).
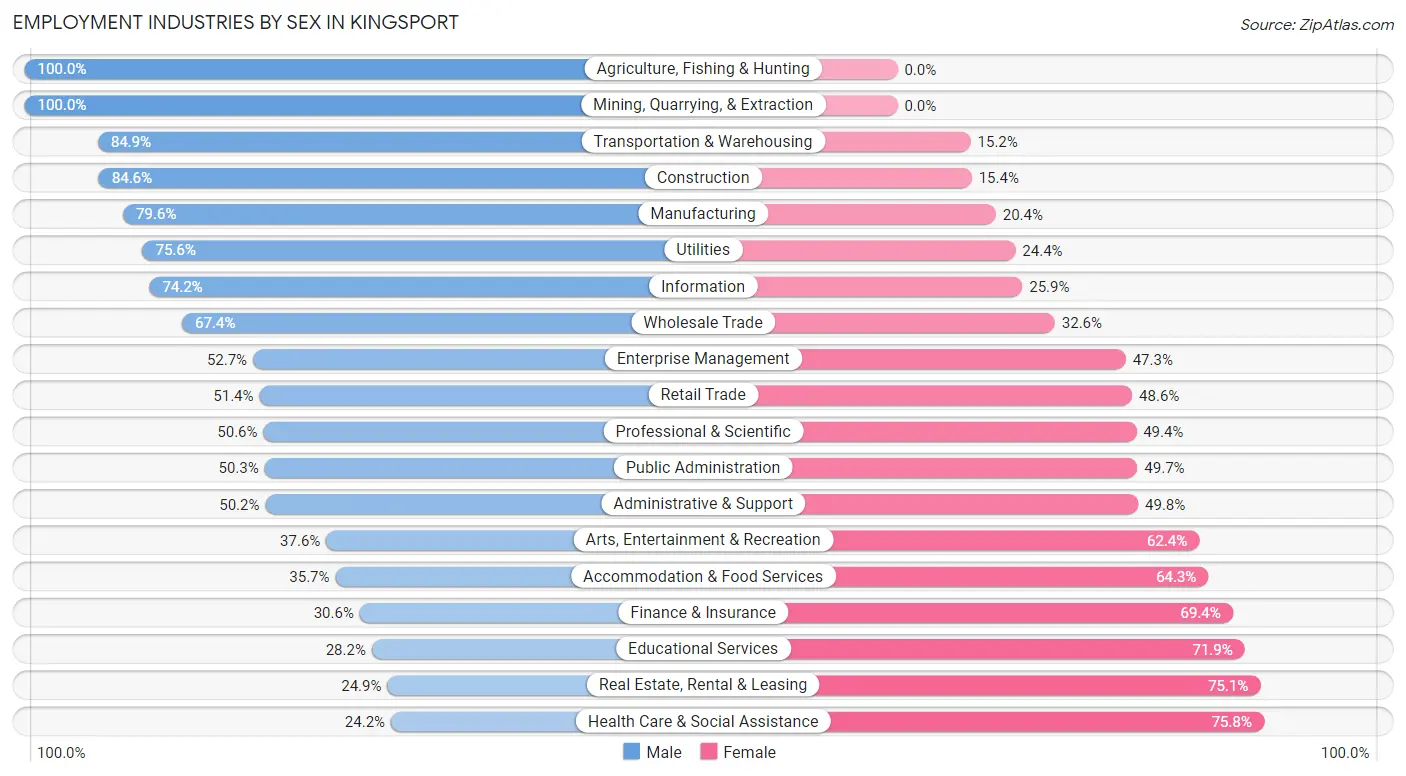
Employment Industries by Sex in Kingsport
The Kingsport industries that see more men than women are Agriculture, Fishing & Hunting (100.0%), Mining, Quarrying, & Extraction (100.0%), and Transportation & Warehousing (84.9%), whereas the industries that tend to have a higher number of women are Health Care & Social Assistance (75.8%), Real Estate, Rental & Leasing (75.1%), and Educational Services (71.9%).
| Industry | Male | Female |
| Agriculture, Fishing & Hunting | 22 (100.0%) | 0 (0.0%) |
| Mining, Quarrying, & Extraction | 23 (100.0%) | 0 (0.0%) |
| Construction | 1,073 (84.6%) | 195 (15.4%) |
| Manufacturing | 3,017 (79.6%) | 772 (20.4%) |
| Wholesale Trade | 273 (67.4%) | 132 (32.6%) |
| Retail Trade | 1,607 (51.4%) | 1,519 (48.6%) |
| Transportation & Warehousing | 773 (84.9%) | 138 (15.1%) |
| Utilities | 65 (75.6%) | 21 (24.4%) |
| Information | 218 (74.2%) | 76 (25.9%) |
| Finance & Insurance | 359 (30.6%) | 813 (69.4%) |
| Real Estate, Rental & Leasing | 76 (24.9%) | 229 (75.1%) |
| Professional & Scientific | 482 (50.6%) | 471 (49.4%) |
| Enterprise Management | 106 (52.7%) | 95 (47.3%) |
| Administrative & Support | 420 (50.2%) | 417 (49.8%) |
| Educational Services | 471 (28.1%) | 1,202 (71.9%) |
| Health Care & Social Assistance | 941 (24.2%) | 2,951 (75.8%) |
| Arts, Entertainment & Recreation | 62 (37.6%) | 103 (62.4%) |
| Accommodation & Food Services | 761 (35.7%) | 1,372 (64.3%) |
| Public Administration | 303 (50.3%) | 299 (49.7%) |
| Total | 11,634 (49.9%) | 11,655 (50.0%) |
Education in Kingsport
School Enrollment in Kingsport
The most common levels of schooling among the 11,060 students in Kingsport are high school (2,576 | 23.3%), elementary school (2,514 | 22.7%), and middle school (2,339 | 21.1%).
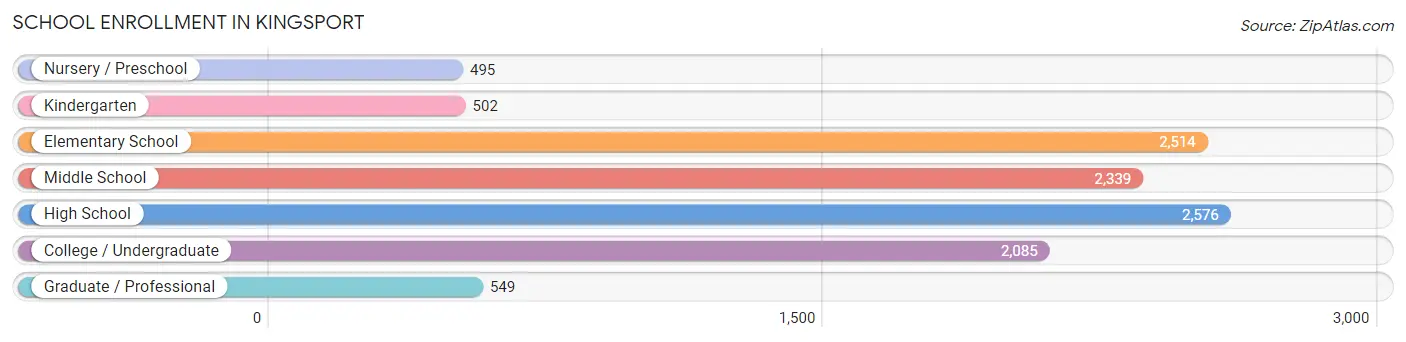
| School Level | # Students | % Students |
| Nursery / Preschool | 495 | 4.5% |
| Kindergarten | 502 | 4.5% |
| Elementary School | 2,514 | 22.7% |
| Middle School | 2,339 | 21.1% |
| High School | 2,576 | 23.3% |
| College / Undergraduate | 2,085 | 18.9% |
| Graduate / Professional | 549 | 5.0% |
| Total | 11,060 | 100.0% |
School Enrollment by Age by Funding Source in Kingsport
Out of a total of 11,060 students who are enrolled in schools in Kingsport, 1,736 (15.7%) attend a private institution, while the remaining 9,324 (84.3%) are enrolled in public schools. The age group of 3 to 4 year olds has the highest likelihood of being enrolled in private schools, with 159 (50.8% in the age bracket) enrolled. Conversely, the age group of 10 to 14 year olds has the lowest likelihood of being enrolled in a private school, with 2,617 (90.5% in the age bracket) attending a public institution.
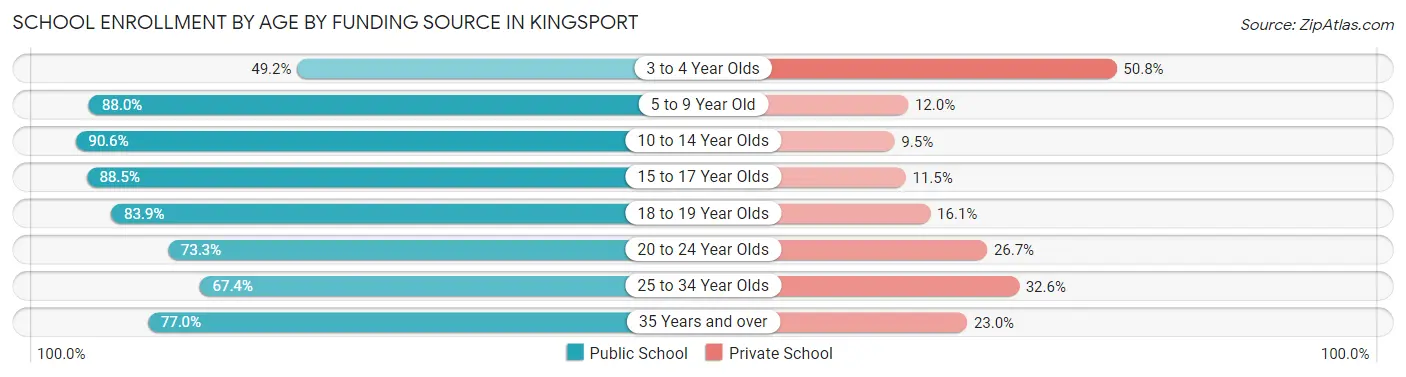
| Age Bracket | Public School | Private School |
| 3 to 4 Year Olds | 154 (49.2%) | 159 (50.8%) |
| 5 to 9 Year Old | 2,497 (88.0%) | 340 (12.0%) |
| 10 to 14 Year Olds | 2,617 (90.5%) | 273 (9.5%) |
| 15 to 17 Year Olds | 1,865 (88.5%) | 243 (11.5%) |
| 18 to 19 Year Olds | 453 (83.9%) | 87 (16.1%) |
| 20 to 24 Year Olds | 802 (73.3%) | 292 (26.7%) |
| 25 to 34 Year Olds | 374 (67.4%) | 181 (32.6%) |
| 35 Years and over | 557 (77.0%) | 166 (23.0%) |
| Total | 9,324 (84.3%) | 1,736 (15.7%) |
Educational Attainment by Field of Study in Kingsport
Business (2,396 | 18.6%), education (2,128 | 16.5%), science & technology (1,487 | 11.5%), engineering (1,340 | 10.4%), and bio, nature & agricultural (1,015 | 7.9%) are the most common fields of study among 12,883 individuals in Kingsport who have obtained a bachelor's degree or higher.
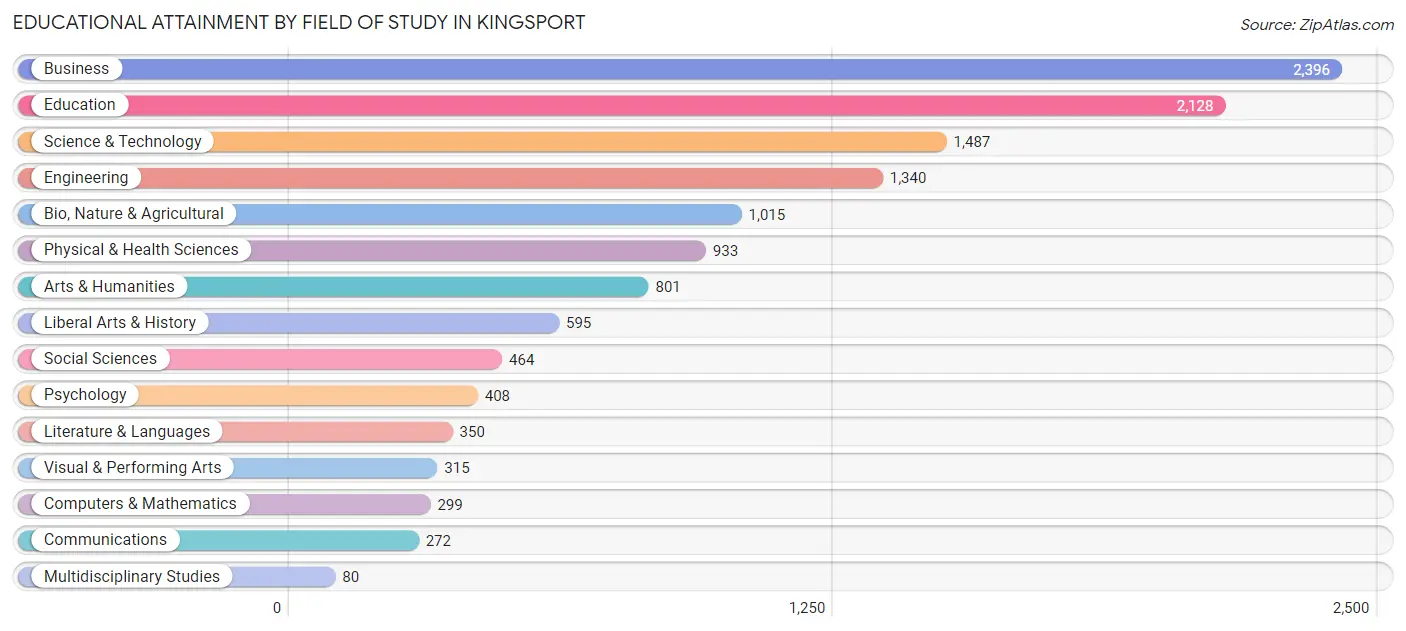
| Field of Study | # Graduates | % Graduates |
| Computers & Mathematics | 299 | 2.3% |
| Bio, Nature & Agricultural | 1,015 | 7.9% |
| Physical & Health Sciences | 933 | 7.2% |
| Psychology | 408 | 3.2% |
| Social Sciences | 464 | 3.6% |
| Engineering | 1,340 | 10.4% |
| Multidisciplinary Studies | 80 | 0.6% |
| Science & Technology | 1,487 | 11.5% |
| Business | 2,396 | 18.6% |
| Education | 2,128 | 16.5% |
| Literature & Languages | 350 | 2.7% |
| Liberal Arts & History | 595 | 4.6% |
| Visual & Performing Arts | 315 | 2.5% |
| Communications | 272 | 2.1% |
| Arts & Humanities | 801 | 6.2% |
| Total | 12,883 | 100.0% |
Transportation & Commute in Kingsport
Vehicle Availability by Sex in Kingsport
The most prevalent vehicle ownership categories in Kingsport are males with 2 vehicles (4,988, accounting for 44.4%) and females with 2 vehicles (4,627, making up 44.0%).
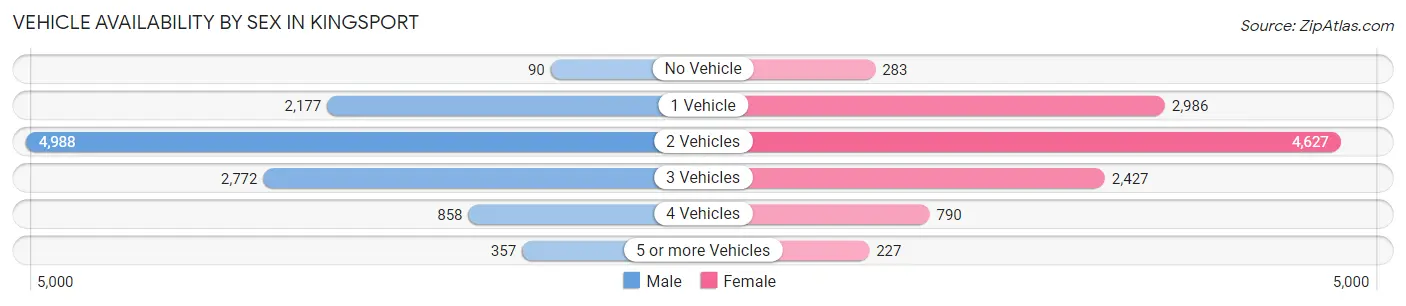
| Vehicles Available | Male | Female |
| No Vehicle | 90 (0.8%) | 283 (2.5%) |
| 1 Vehicle | 2,177 (19.4%) | 2,986 (26.3%) |
| 2 Vehicles | 4,988 (44.4%) | 4,627 (40.8%) |
| 3 Vehicles | 2,772 (24.7%) | 2,427 (21.4%) |
| 4 Vehicles | 858 (7.6%) | 790 (7.0%) |
| 5 or more Vehicles | 357 (3.2%) | 227 (2.0%) |
| Total | 11,242 (100.0%) | 11,340 (100.0%) |
Commute Time in Kingsport
The most frequently occuring commute durations in Kingsport are 15 to 19 minutes (4,603 commuters, 22.5%), 10 to 14 minutes (4,514 commuters, 22.1%), and 5 to 9 minutes (3,114 commuters, 15.2%).
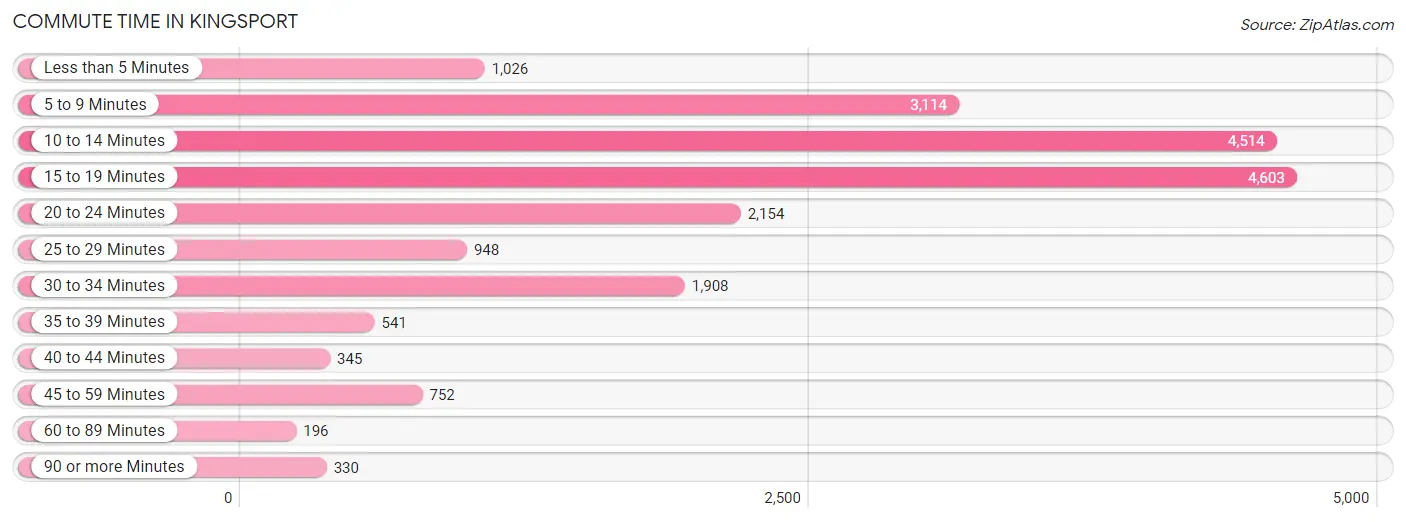
| Commute Time | # Commuters | % Commuters |
| Less than 5 Minutes | 1,026 | 5.0% |
| 5 to 9 Minutes | 3,114 | 15.2% |
| 10 to 14 Minutes | 4,514 | 22.1% |
| 15 to 19 Minutes | 4,603 | 22.5% |
| 20 to 24 Minutes | 2,154 | 10.5% |
| 25 to 29 Minutes | 948 | 4.6% |
| 30 to 34 Minutes | 1,908 | 9.3% |
| 35 to 39 Minutes | 541 | 2.6% |
| 40 to 44 Minutes | 345 | 1.7% |
| 45 to 59 Minutes | 752 | 3.7% |
| 60 to 89 Minutes | 196 | 1.0% |
| 90 or more Minutes | 330 | 1.6% |
Commute Time by Sex in Kingsport
The most common commute times in Kingsport are 15 to 19 minutes (2,259 commuters, 21.8%) for males and 10 to 14 minutes (2,350 commuters, 23.3%) for females.
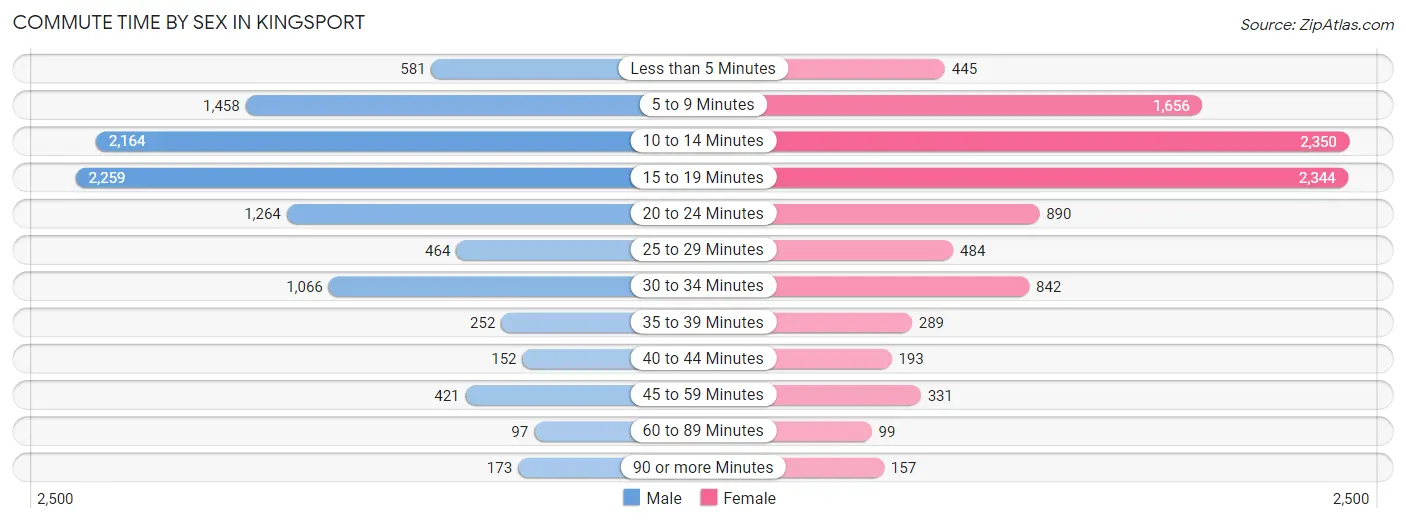
| Commute Time | Male | Female |
| Less than 5 Minutes | 581 (5.6%) | 445 (4.4%) |
| 5 to 9 Minutes | 1,458 (14.1%) | 1,656 (16.4%) |
| 10 to 14 Minutes | 2,164 (20.9%) | 2,350 (23.3%) |
| 15 to 19 Minutes | 2,259 (21.8%) | 2,344 (23.3%) |
| 20 to 24 Minutes | 1,264 (12.2%) | 890 (8.8%) |
| 25 to 29 Minutes | 464 (4.5%) | 484 (4.8%) |
| 30 to 34 Minutes | 1,066 (10.3%) | 842 (8.4%) |
| 35 to 39 Minutes | 252 (2.4%) | 289 (2.9%) |
| 40 to 44 Minutes | 152 (1.5%) | 193 (1.9%) |
| 45 to 59 Minutes | 421 (4.1%) | 331 (3.3%) |
| 60 to 89 Minutes | 97 (0.9%) | 99 (1.0%) |
| 90 or more Minutes | 173 (1.7%) | 157 (1.6%) |
Time of Departure to Work by Sex in Kingsport
The most frequent times of departure to work in Kingsport are 7:00 AM to 7:29 AM (1,763, 17.0%) for males and 7:00 AM to 7:29 AM (1,794, 17.8%) for females.
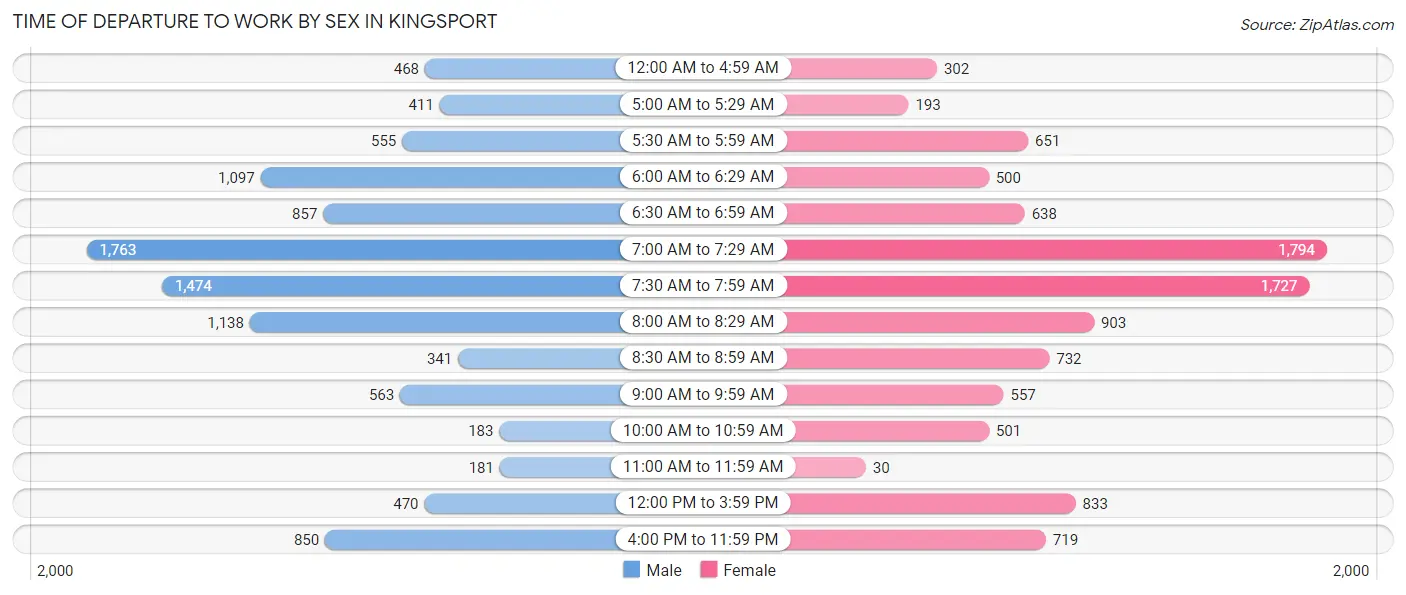
| Time of Departure | Male | Female |
| 12:00 AM to 4:59 AM | 468 (4.5%) | 302 (3.0%) |
| 5:00 AM to 5:29 AM | 411 (4.0%) | 193 (1.9%) |
| 5:30 AM to 5:59 AM | 555 (5.4%) | 651 (6.5%) |
| 6:00 AM to 6:29 AM | 1,097 (10.6%) | 500 (5.0%) |
| 6:30 AM to 6:59 AM | 857 (8.3%) | 638 (6.3%) |
| 7:00 AM to 7:29 AM | 1,763 (17.0%) | 1,794 (17.8%) |
| 7:30 AM to 7:59 AM | 1,474 (14.2%) | 1,727 (17.1%) |
| 8:00 AM to 8:29 AM | 1,138 (11.0%) | 903 (9.0%) |
| 8:30 AM to 8:59 AM | 341 (3.3%) | 732 (7.3%) |
| 9:00 AM to 9:59 AM | 563 (5.4%) | 557 (5.5%) |
| 10:00 AM to 10:59 AM | 183 (1.8%) | 501 (5.0%) |
| 11:00 AM to 11:59 AM | 181 (1.8%) | 30 (0.3%) |
| 12:00 PM to 3:59 PM | 470 (4.5%) | 833 (8.3%) |
| 4:00 PM to 11:59 PM | 850 (8.2%) | 719 (7.1%) |
| Total | 10,351 (100.0%) | 10,080 (100.0%) |
Housing Occupancy in Kingsport
Occupancy by Ownership in Kingsport
Of the total 24,715 dwellings in Kingsport, owner-occupied units account for 15,281 (61.8%), while renter-occupied units make up 9,434 (38.2%).
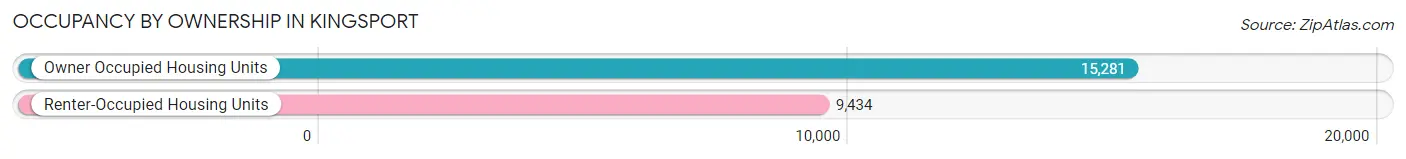
| Occupancy | # Housing Units | % Housing Units |
| Owner Occupied Housing Units | 15,281 | 61.8% |
| Renter-Occupied Housing Units | 9,434 | 38.2% |
| Total Occupied Housing Units | 24,715 | 100.0% |
Occupancy by Household Size in Kingsport
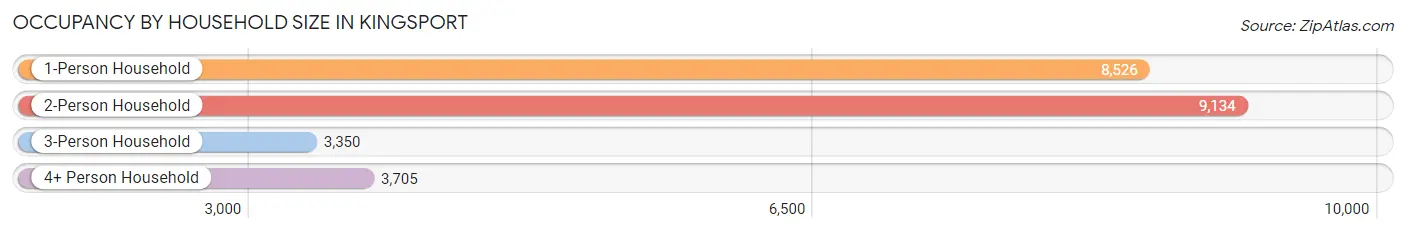
| Household Size | # Housing Units | % Housing Units |
| 1-Person Household | 8,526 | 34.5% |
| 2-Person Household | 9,134 | 37.0% |
| 3-Person Household | 3,350 | 13.6% |
| 4+ Person Household | 3,705 | 15.0% |
| Total Housing Units | 24,715 | 100.0% |
Occupancy by Ownership by Household Size in Kingsport
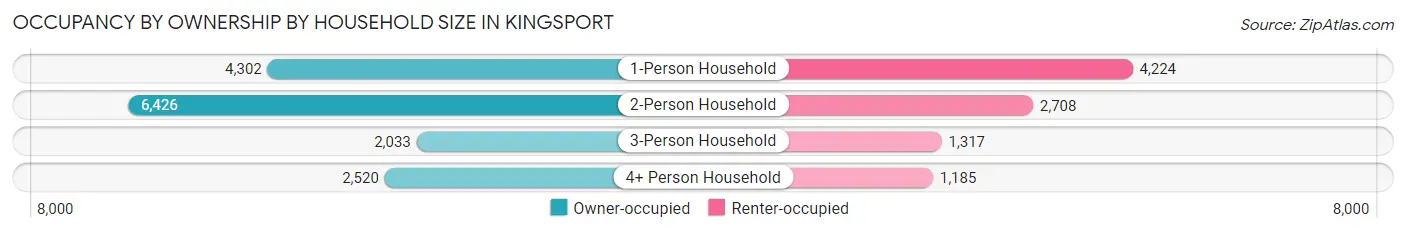
| Household Size | Owner-occupied | Renter-occupied |
| 1-Person Household | 4,302 (50.5%) | 4,224 (49.5%) |
| 2-Person Household | 6,426 (70.4%) | 2,708 (29.6%) |
| 3-Person Household | 2,033 (60.7%) | 1,317 (39.3%) |
| 4+ Person Household | 2,520 (68.0%) | 1,185 (32.0%) |
| Total Housing Units | 15,281 (61.8%) | 9,434 (38.2%) |
Occupancy by Educational Attainment in Kingsport
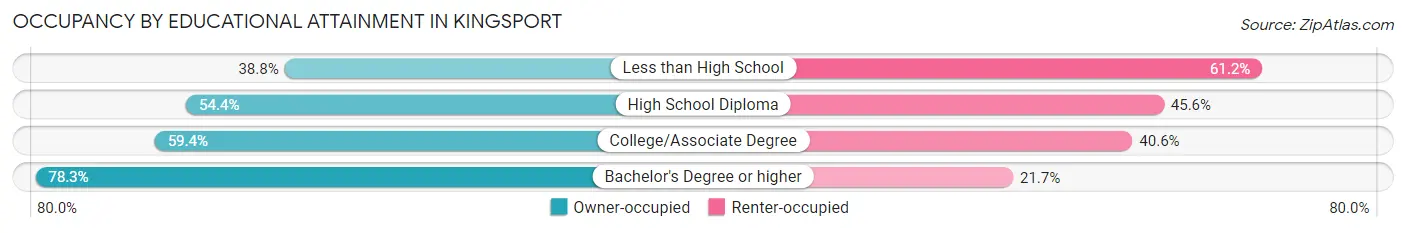
| Household Size | Owner-occupied | Renter-occupied |
| Less than High School | 921 (38.8%) | 1,454 (61.2%) |
| High School Diploma | 3,941 (54.4%) | 3,307 (45.6%) |
| College/Associate Degree | 4,379 (59.4%) | 2,998 (40.6%) |
| Bachelor's Degree or higher | 6,040 (78.3%) | 1,675 (21.7%) |
Occupancy by Age of Householder in Kingsport
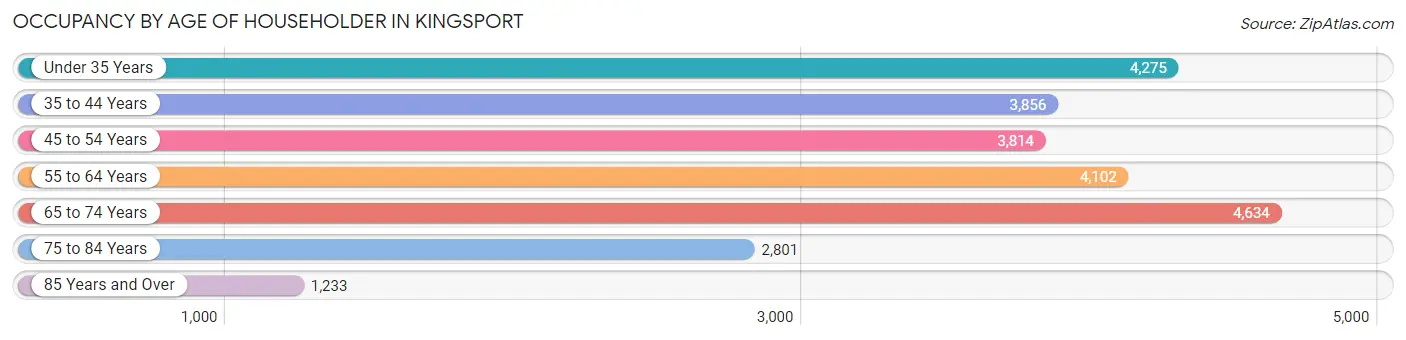
| Age Bracket | # Households | % Households |
| Under 35 Years | 4,275 | 17.3% |
| 35 to 44 Years | 3,856 | 15.6% |
| 45 to 54 Years | 3,814 | 15.4% |
| 55 to 64 Years | 4,102 | 16.6% |
| 65 to 74 Years | 4,634 | 18.8% |
| 75 to 84 Years | 2,801 | 11.3% |
| 85 Years and Over | 1,233 | 5.0% |
| Total | 24,715 | 100.0% |
Housing Finances in Kingsport
Median Income by Occupancy in Kingsport
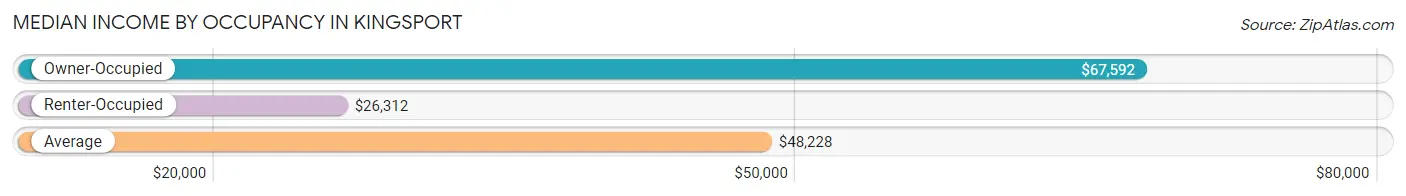
| Occupancy Type | # Households | Median Income |
| Owner-Occupied | 15,281 (61.8%) | $67,592 |
| Renter-Occupied | 9,434 (38.2%) | $26,312 |
| Average | 24,715 (100.0%) | $48,228 |
Occupancy by Householder Income Bracket in Kingsport
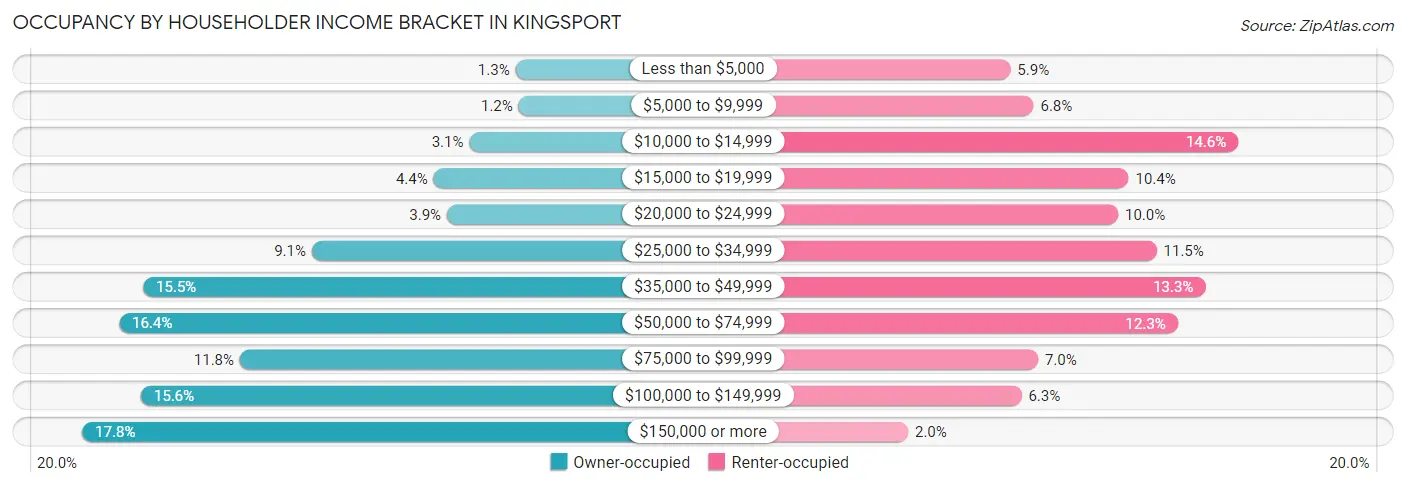
| Income Bracket | Owner-occupied | Renter-occupied |
| Less than $5,000 | 199 (1.3%) | 557 (5.9%) |
| $5,000 to $9,999 | 180 (1.2%) | 640 (6.8%) |
| $10,000 to $14,999 | 468 (3.1%) | 1,375 (14.6%) |
| $15,000 to $19,999 | 676 (4.4%) | 981 (10.4%) |
| $20,000 to $24,999 | 597 (3.9%) | 943 (10.0%) |
| $25,000 to $34,999 | 1,385 (9.1%) | 1,082 (11.5%) |
| $35,000 to $49,999 | 2,367 (15.5%) | 1,257 (13.3%) |
| $50,000 to $74,999 | 2,506 (16.4%) | 1,158 (12.3%) |
| $75,000 to $99,999 | 1,803 (11.8%) | 656 (7.0%) |
| $100,000 to $149,999 | 2,379 (15.6%) | 596 (6.3%) |
| $150,000 or more | 2,721 (17.8%) | 189 (2.0%) |
| Total | 15,281 (100.0%) | 9,434 (100.0%) |
Monthly Housing Cost Tiers in Kingsport
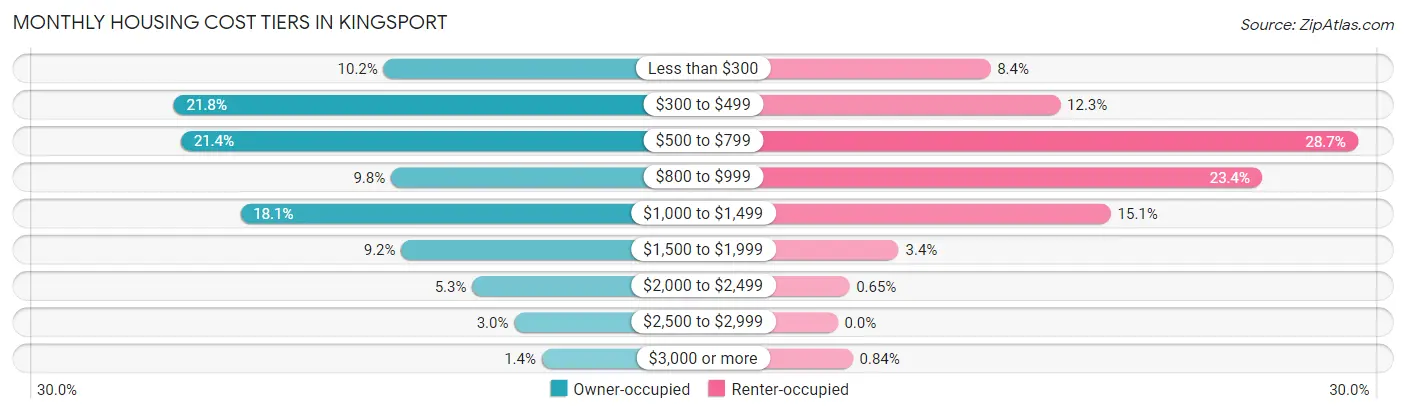
| Monthly Cost | Owner-occupied | Renter-occupied |
| Less than $300 | 1,554 (10.2%) | 796 (8.4%) |
| $300 to $499 | 3,326 (21.8%) | 1,160 (12.3%) |
| $500 to $799 | 3,266 (21.4%) | 2,710 (28.7%) |
| $800 to $999 | 1,492 (9.8%) | 2,211 (23.4%) |
| $1,000 to $1,499 | 2,764 (18.1%) | 1,424 (15.1%) |
| $1,500 to $1,999 | 1,404 (9.2%) | 319 (3.4%) |
| $2,000 to $2,499 | 805 (5.3%) | 61 (0.6%) |
| $2,500 to $2,999 | 451 (2.9%) | 0 (0.0%) |
| $3,000 or more | 219 (1.4%) | 79 (0.8%) |
| Total | 15,281 (100.0%) | 9,434 (100.0%) |
Physical Housing Characteristics in Kingsport
Housing Structures in Kingsport
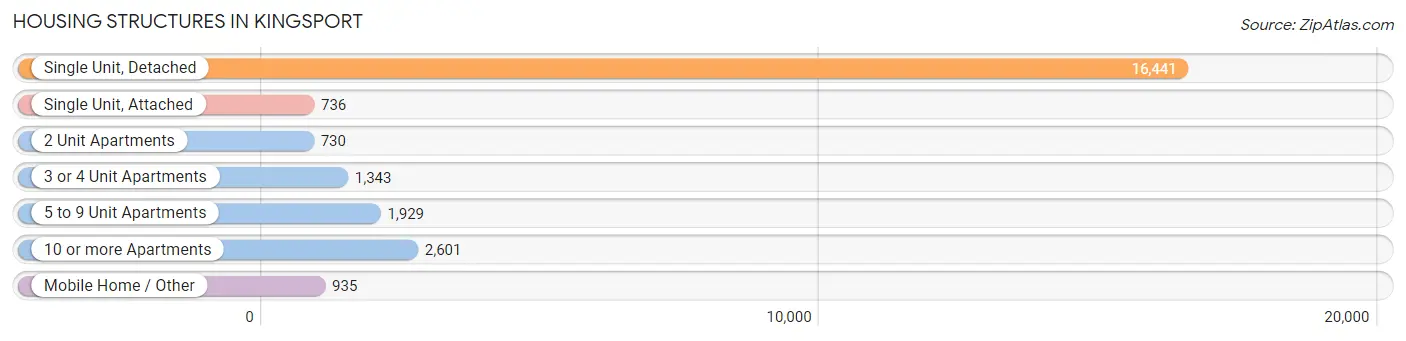
| Structure Type | # Housing Units | % Housing Units |
| Single Unit, Detached | 16,441 | 66.5% |
| Single Unit, Attached | 736 | 3.0% |
| 2 Unit Apartments | 730 | 2.9% |
| 3 or 4 Unit Apartments | 1,343 | 5.4% |
| 5 to 9 Unit Apartments | 1,929 | 7.8% |
| 10 or more Apartments | 2,601 | 10.5% |
| Mobile Home / Other | 935 | 3.8% |
| Total | 24,715 | 100.0% |
Housing Structures by Occupancy in Kingsport
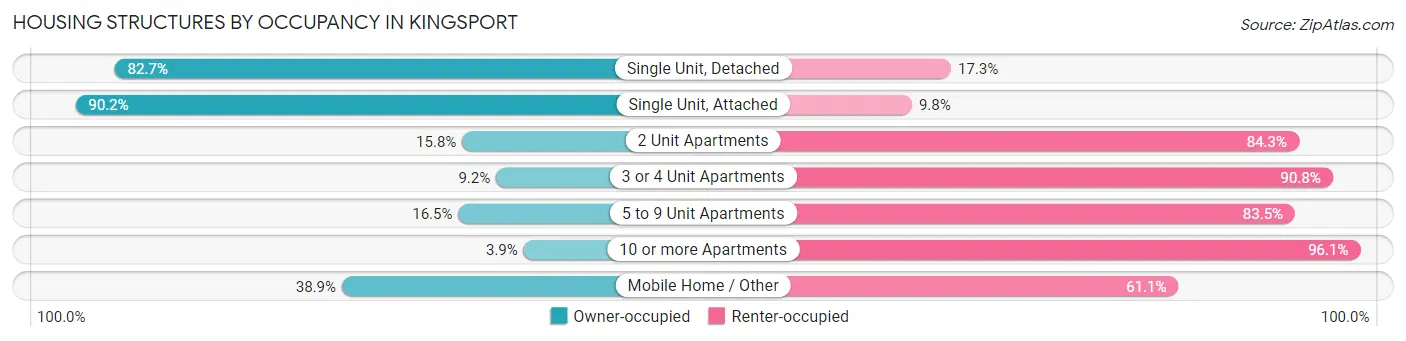
| Structure Type | Owner-occupied | Renter-occupied |
| Single Unit, Detached | 13,594 (82.7%) | 2,847 (17.3%) |
| Single Unit, Attached | 664 (90.2%) | 72 (9.8%) |
| 2 Unit Apartments | 115 (15.8%) | 615 (84.3%) |
| 3 or 4 Unit Apartments | 124 (9.2%) | 1,219 (90.8%) |
| 5 to 9 Unit Apartments | 318 (16.5%) | 1,611 (83.5%) |
| 10 or more Apartments | 102 (3.9%) | 2,499 (96.1%) |
| Mobile Home / Other | 364 (38.9%) | 571 (61.1%) |
| Total | 15,281 (61.8%) | 9,434 (38.2%) |
Housing Structures by Number of Rooms in Kingsport
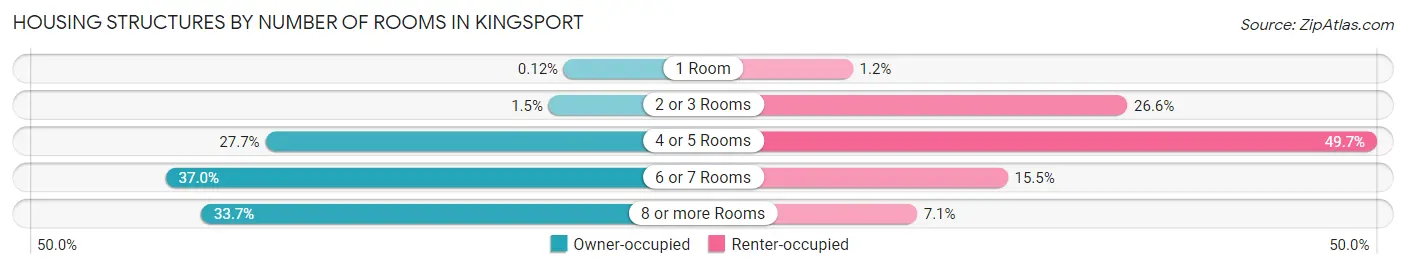
| Number of Rooms | Owner-occupied | Renter-occupied |
| 1 Room | 18 (0.1%) | 110 (1.2%) |
| 2 or 3 Rooms | 232 (1.5%) | 2,506 (26.6%) |
| 4 or 5 Rooms | 4,237 (27.7%) | 4,685 (49.7%) |
| 6 or 7 Rooms | 5,646 (36.9%) | 1,462 (15.5%) |
| 8 or more Rooms | 5,148 (33.7%) | 671 (7.1%) |
| Total | 15,281 (100.0%) | 9,434 (100.0%) |
Housing Structure by Heating Type in Kingsport
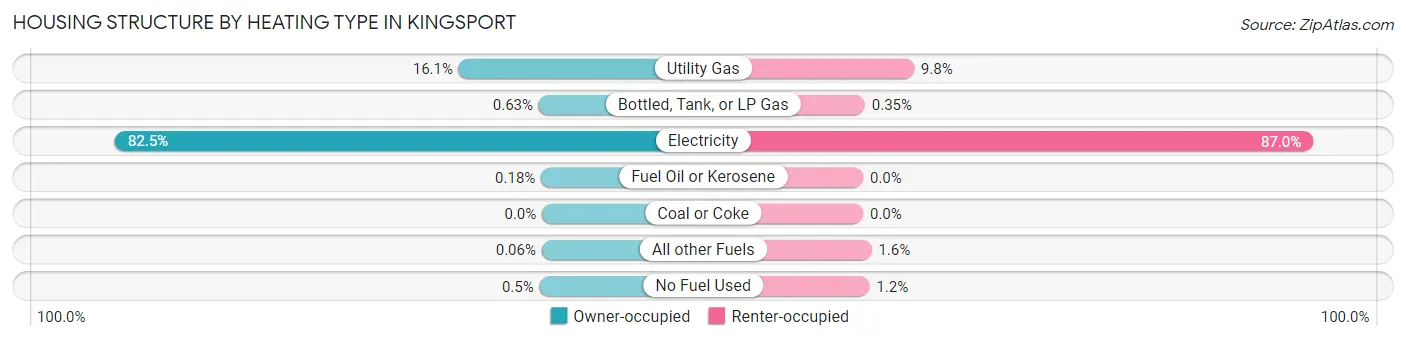
| Heating Type | Owner-occupied | Renter-occupied |
| Utility Gas | 2,458 (16.1%) | 927 (9.8%) |
| Bottled, Tank, or LP Gas | 96 (0.6%) | 33 (0.4%) |
| Electricity | 12,613 (82.5%) | 8,204 (87.0%) |
| Fuel Oil or Kerosene | 28 (0.2%) | 0 (0.0%) |
| Coal or Coke | 0 (0.0%) | 0 (0.0%) |
| All other Fuels | 9 (0.1%) | 153 (1.6%) |
| No Fuel Used | 77 (0.5%) | 117 (1.2%) |
| Total | 15,281 (100.0%) | 9,434 (100.0%) |
Household Vehicle Usage in Kingsport
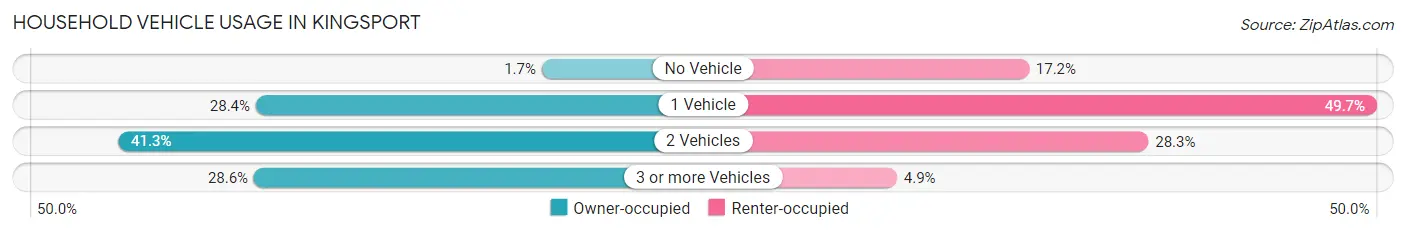
| Vehicles per Household | Owner-occupied | Renter-occupied |
| No Vehicle | 263 (1.7%) | 1,620 (17.2%) |
| 1 Vehicle | 4,342 (28.4%) | 4,684 (49.6%) |
| 2 Vehicles | 6,307 (41.3%) | 2,672 (28.3%) |
| 3 or more Vehicles | 4,369 (28.6%) | 458 (4.9%) |
| Total | 15,281 (100.0%) | 9,434 (100.0%) |
Real Estate & Mortgages in Kingsport
Real Estate and Mortgage Overview in Kingsport
| Characteristic | Without Mortgage | With Mortgage |
| Housing Units | 7,204 | 8,077 |
| Median Property Value | $177,500 | $183,900 |
| Median Household Income | $51,261 | $1,841 |
| Monthly Housing Costs | $431 | $219 |
| Real Estate Taxes | $1,451 | $201 |
Property Value by Mortgage Status in Kingsport
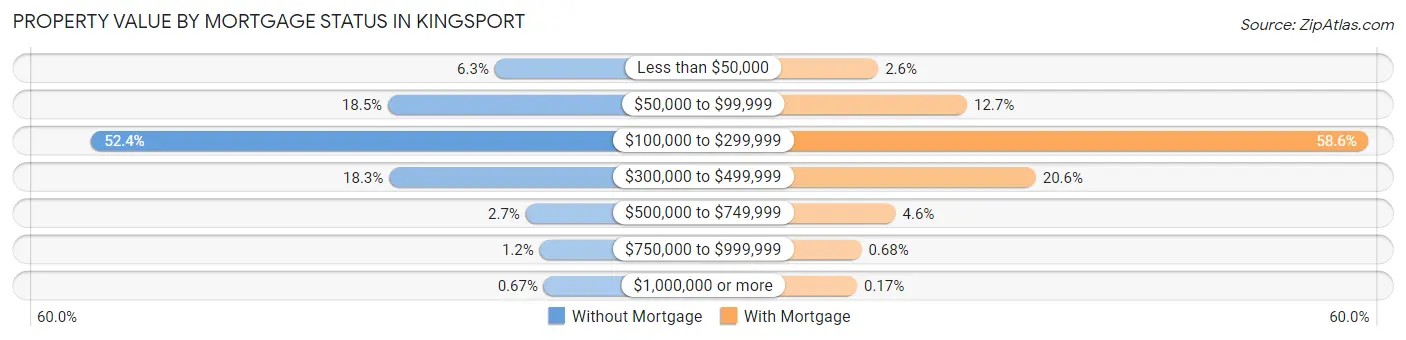
| Property Value | Without Mortgage | With Mortgage |
| Less than $50,000 | 452 (6.3%) | 209 (2.6%) |
| $50,000 to $99,999 | 1,331 (18.5%) | 1,029 (12.7%) |
| $100,000 to $299,999 | 3,772 (52.4%) | 4,736 (58.6%) |
| $300,000 to $499,999 | 1,321 (18.3%) | 1,664 (20.6%) |
| $500,000 to $749,999 | 197 (2.7%) | 370 (4.6%) |
| $750,000 to $999,999 | 83 (1.1%) | 55 (0.7%) |
| $1,000,000 or more | 48 (0.7%) | 14 (0.2%) |
| Total | 7,204 (100.0%) | 8,077 (100.0%) |
Household Income by Mortgage Status in Kingsport
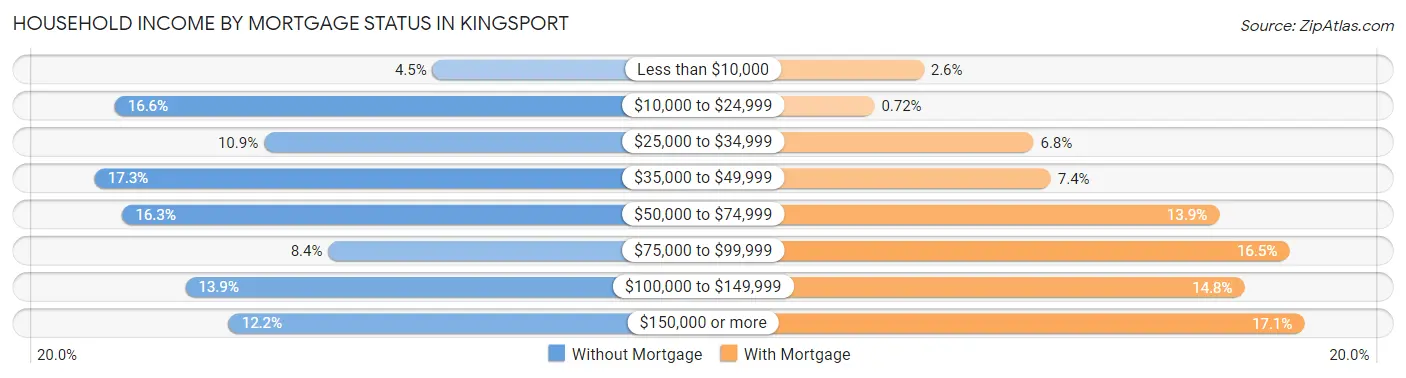
| Household Income | Without Mortgage | With Mortgage |
| Less than $10,000 | 321 (4.5%) | 210 (2.6%) |
| $10,000 to $24,999 | 1,193 (16.6%) | 58 (0.7%) |
| $25,000 to $34,999 | 784 (10.9%) | 548 (6.8%) |
| $35,000 to $49,999 | 1,248 (17.3%) | 601 (7.4%) |
| $50,000 to $74,999 | 1,172 (16.3%) | 1,119 (13.9%) |
| $75,000 to $99,999 | 607 (8.4%) | 1,334 (16.5%) |
| $100,000 to $149,999 | 999 (13.9%) | 1,196 (14.8%) |
| $150,000 or more | 880 (12.2%) | 1,380 (17.1%) |
| Total | 7,204 (100.0%) | 8,077 (100.0%) |
Property Value to Household Income Ratio in Kingsport

| Value-to-Income Ratio | Without Mortgage | With Mortgage |
| Less than 2.0x | 2,220 (30.8%) | 81,860 (1,013.5%) |
| 2.0x to 2.9x | 1,187 (16.5%) | 3,118 (38.6%) |
| 3.0x to 3.9x | 843 (11.7%) | 1,985 (24.6%) |
| 4.0x or more | 2,924 (40.6%) | 1,272 (15.8%) |
| Total | 7,204 (100.0%) | 8,077 (100.0%) |
Real Estate Taxes by Mortgage Status in Kingsport
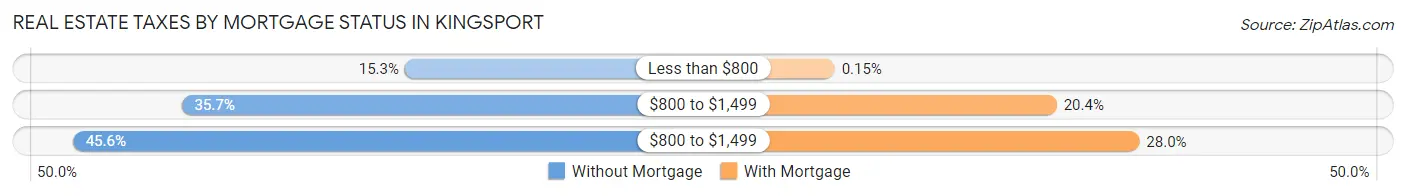
| Property Taxes | Without Mortgage | With Mortgage |
| Less than $800 | 1,101 (15.3%) | 12 (0.2%) |
| $800 to $1,499 | 2,570 (35.7%) | 1,650 (20.4%) |
| $800 to $1,499 | 3,285 (45.6%) | 2,260 (28.0%) |
| Total | 7,204 (100.0%) | 8,077 (100.0%) |
Health & Disability in Kingsport
Health Insurance Coverage by Age in Kingsport
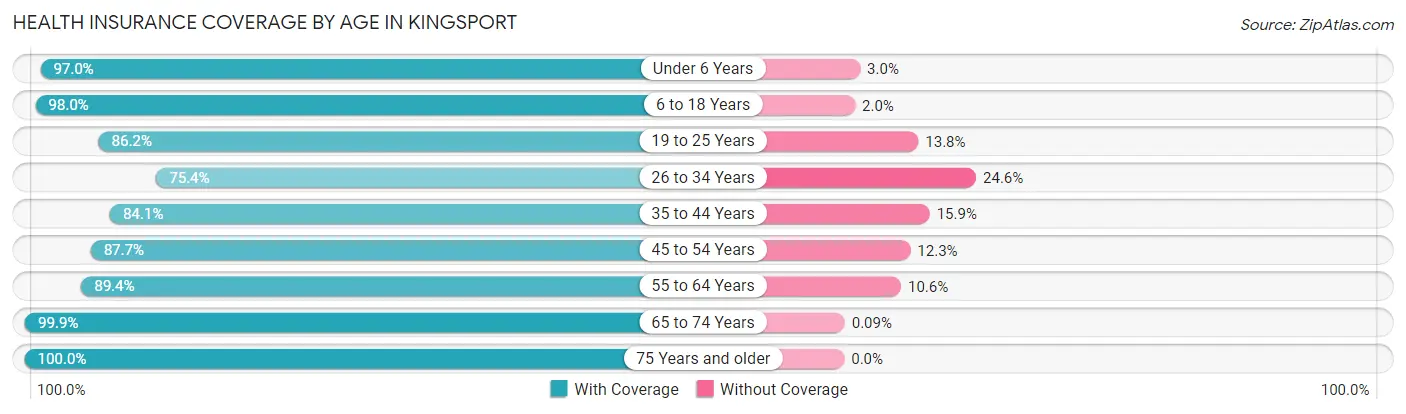
| Age Bracket | With Coverage | Without Coverage |
| Under 6 Years | 3,208 (97.0%) | 98 (3.0%) |
| 6 to 18 Years | 7,923 (98.0%) | 163 (2.0%) |
| 19 to 25 Years | 3,557 (86.2%) | 570 (13.8%) |
| 26 to 34 Years | 4,164 (75.4%) | 1,357 (24.6%) |
| 35 to 44 Years | 5,765 (84.1%) | 1,092 (15.9%) |
| 45 to 54 Years | 5,826 (87.7%) | 819 (12.3%) |
| 55 to 64 Years | 6,457 (89.4%) | 764 (10.6%) |
| 65 to 74 Years | 7,613 (99.9%) | 7 (0.1%) |
| 75 Years and older | 5,349 (100.0%) | 0 (0.0%) |
| Total | 49,862 (91.1%) | 4,870 (8.9%) |
Health Insurance Coverage by Citizenship Status in Kingsport
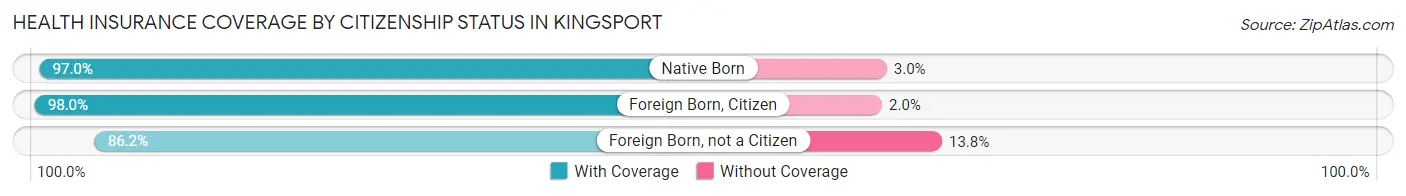
| Citizenship Status | With Coverage | Without Coverage |
| Native Born | 3,208 (97.0%) | 98 (3.0%) |
| Foreign Born, Citizen | 7,923 (98.0%) | 163 (2.0%) |
| Foreign Born, not a Citizen | 3,557 (86.2%) | 570 (13.8%) |
Health Insurance Coverage by Household Income in Kingsport
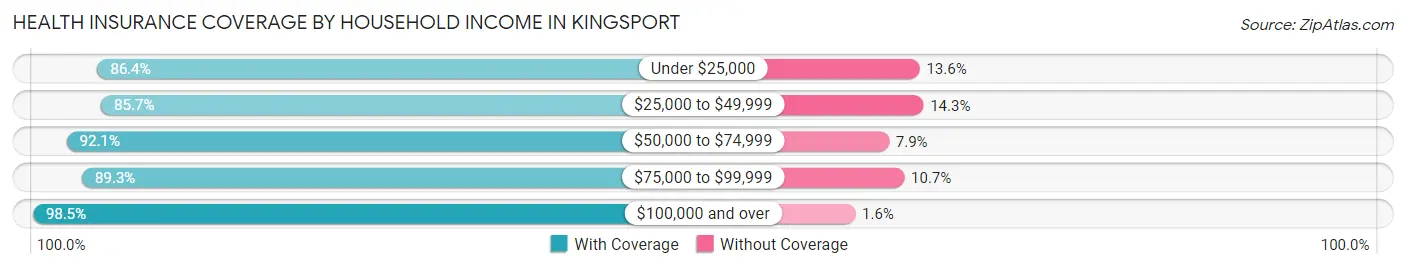
| Household Income | With Coverage | Without Coverage |
| Under $25,000 | 9,921 (86.4%) | 1,564 (13.6%) |
| $25,000 to $49,999 | 9,863 (85.7%) | 1,649 (14.3%) |
| $50,000 to $74,999 | 7,813 (92.1%) | 668 (7.9%) |
| $75,000 to $99,999 | 5,624 (89.3%) | 677 (10.7%) |
| $100,000 and over | 16,435 (98.5%) | 259 (1.5%) |
Public vs Private Health Insurance Coverage by Age in Kingsport
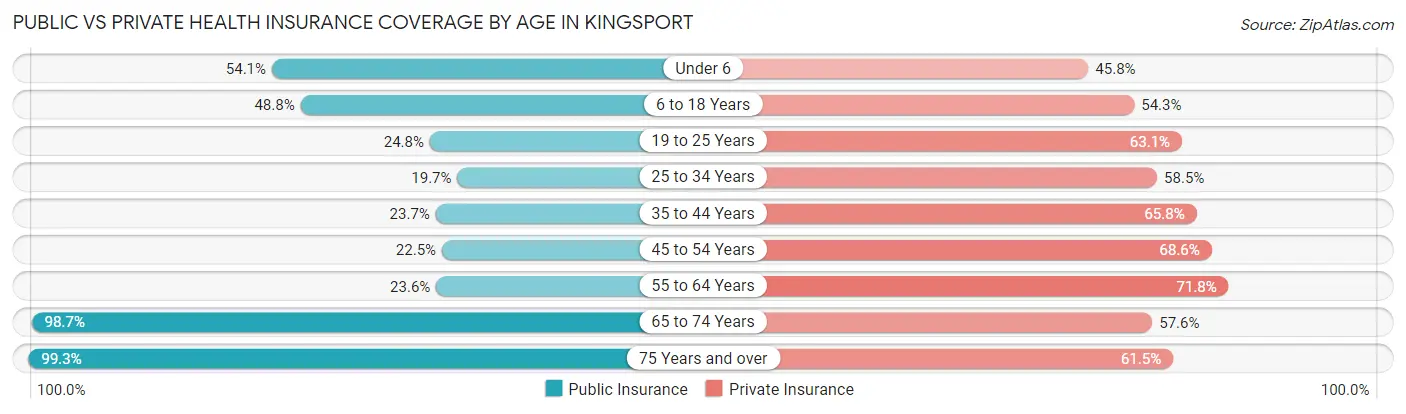
| Age Bracket | Public Insurance | Private Insurance |
| Under 6 | 1,789 (54.1%) | 1,513 (45.8%) |
| 6 to 18 Years | 3,945 (48.8%) | 4,390 (54.3%) |
| 19 to 25 Years | 1,023 (24.8%) | 2,605 (63.1%) |
| 25 to 34 Years | 1,086 (19.7%) | 3,232 (58.5%) |
| 35 to 44 Years | 1,625 (23.7%) | 4,514 (65.8%) |
| 45 to 54 Years | 1,498 (22.5%) | 4,561 (68.6%) |
| 55 to 64 Years | 1,705 (23.6%) | 5,184 (71.8%) |
| 65 to 74 Years | 7,522 (98.7%) | 4,392 (57.6%) |
| 75 Years and over | 5,312 (99.3%) | 3,289 (61.5%) |
| Total | 25,505 (46.6%) | 33,680 (61.5%) |
Disability Status by Sex by Age in Kingsport
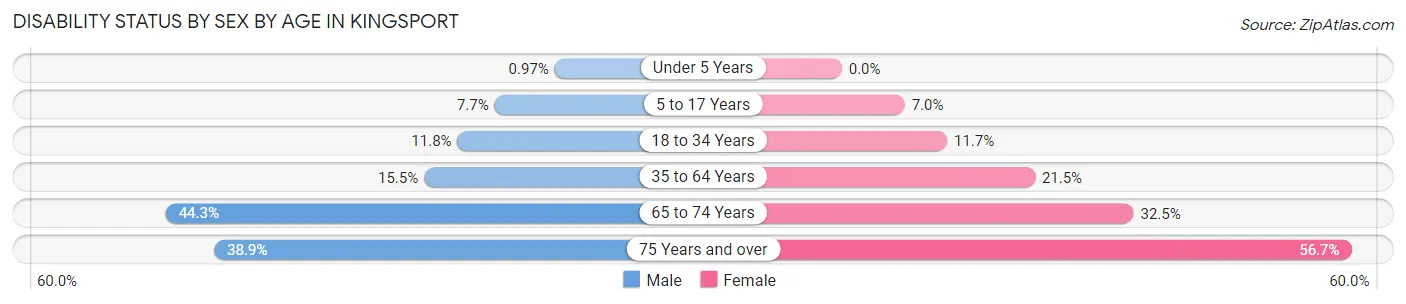
| Age Bracket | Male | Female |
| Under 5 Years | 13 (1.0%) | 0 (0.0%) |
| 5 to 17 Years | 324 (7.7%) | 277 (7.0%) |
| 18 to 34 Years | 562 (11.8%) | 639 (11.7%) |
| 35 to 64 Years | 1,531 (15.5%) | 2,334 (21.5%) |
| 65 to 74 Years | 1,476 (44.3%) | 1,393 (32.5%) |
| 75 Years and over | 874 (38.9%) | 1,760 (56.7%) |
Disability Class by Sex by Age in Kingsport
Disability Class: Hearing Difficulty
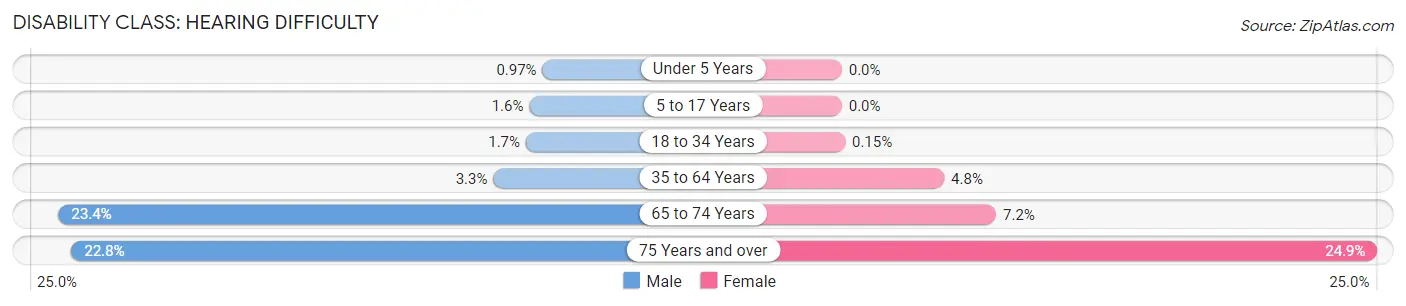
| Age Bracket | Male | Female |
| Under 5 Years | 13 (1.0%) | 0 (0.0%) |
| 5 to 17 Years | 67 (1.6%) | 0 (0.0%) |
| 18 to 34 Years | 83 (1.7%) | 8 (0.2%) |
| 35 to 64 Years | 321 (3.3%) | 516 (4.8%) |
| 65 to 74 Years | 781 (23.4%) | 307 (7.2%) |
| 75 Years and over | 513 (22.8%) | 771 (24.8%) |
Disability Class: Vision Difficulty
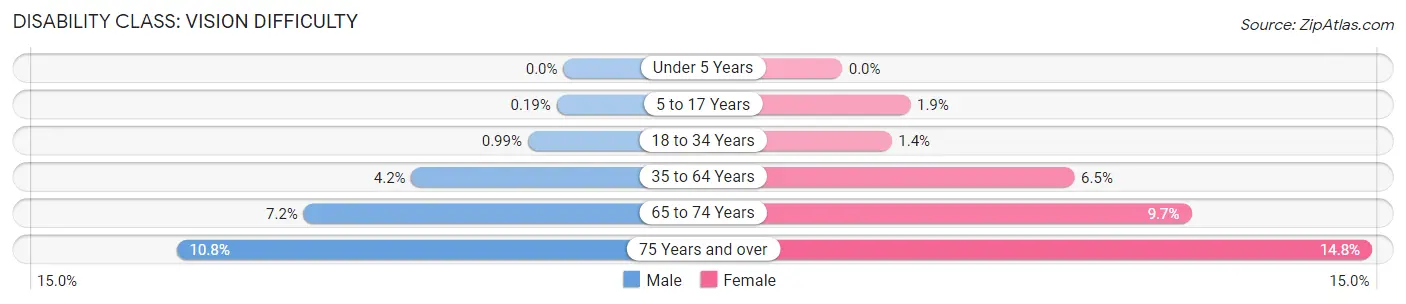
| Age Bracket | Male | Female |
| Under 5 Years | 0 (0.0%) | 0 (0.0%) |
| 5 to 17 Years | 8 (0.2%) | 75 (1.9%) |
| 18 to 34 Years | 47 (1.0%) | 75 (1.4%) |
| 35 to 64 Years | 418 (4.2%) | 702 (6.5%) |
| 65 to 74 Years | 241 (7.2%) | 417 (9.7%) |
| 75 Years and over | 242 (10.8%) | 458 (14.8%) |
Disability Class: Cognitive Difficulty
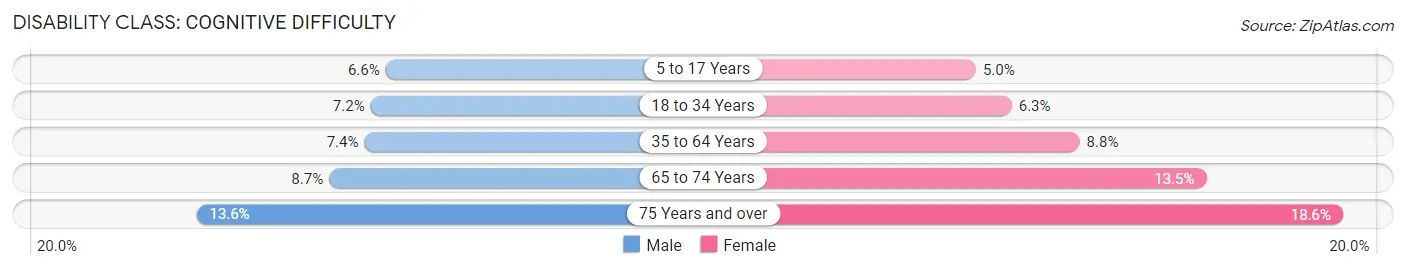
| Age Bracket | Male | Female |
| 5 to 17 Years | 279 (6.6%) | 197 (5.0%) |
| 18 to 34 Years | 341 (7.2%) | 344 (6.3%) |
| 35 to 64 Years | 729 (7.4%) | 958 (8.8%) |
| 65 to 74 Years | 290 (8.7%) | 580 (13.5%) |
| 75 Years and over | 306 (13.6%) | 577 (18.6%) |
Disability Class: Ambulatory Difficulty
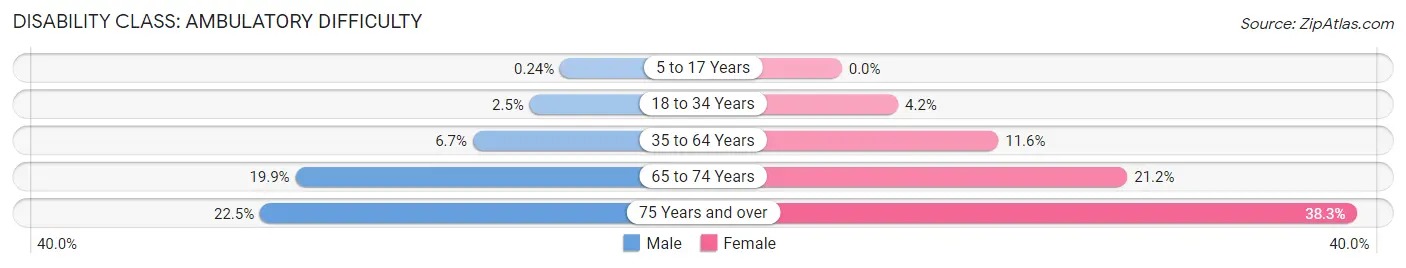
| Age Bracket | Male | Female |
| 5 to 17 Years | 10 (0.2%) | 0 (0.0%) |
| 18 to 34 Years | 119 (2.5%) | 228 (4.2%) |
| 35 to 64 Years | 663 (6.7%) | 1,261 (11.6%) |
| 65 to 74 Years | 663 (19.9%) | 909 (21.2%) |
| 75 Years and over | 506 (22.5%) | 1,187 (38.3%) |
Disability Class: Self-Care Difficulty
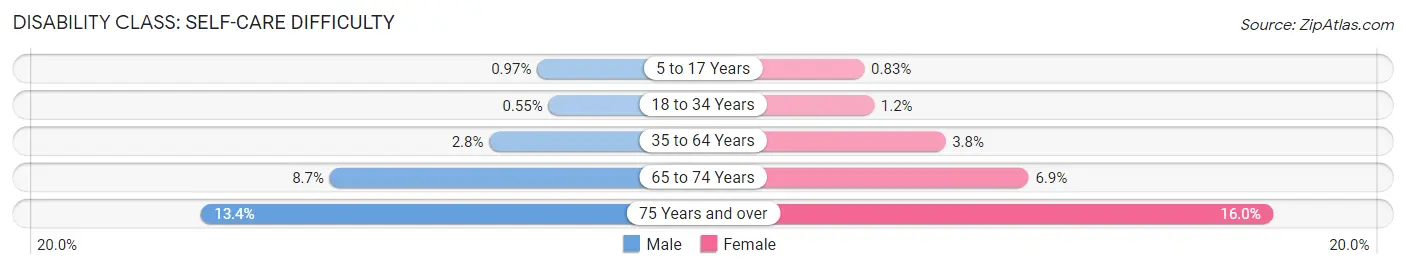
| Age Bracket | Male | Female |
| 5 to 17 Years | 41 (1.0%) | 33 (0.8%) |
| 18 to 34 Years | 26 (0.5%) | 65 (1.2%) |
| 35 to 64 Years | 271 (2.8%) | 417 (3.8%) |
| 65 to 74 Years | 289 (8.7%) | 297 (6.9%) |
| 75 Years and over | 302 (13.4%) | 496 (16.0%) |
Technology Access in Kingsport
Computing Device Access in Kingsport
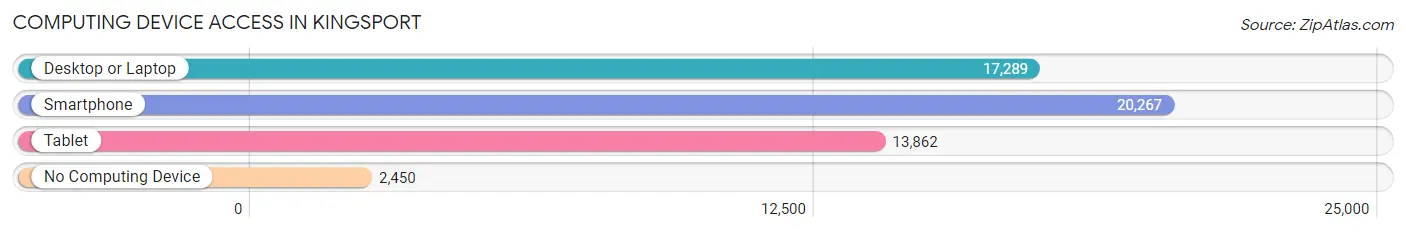
| Device Type | # Households | % Households |
| Desktop or Laptop | 17,289 | 70.0% |
| Smartphone | 20,267 | 82.0% |
| Tablet | 13,862 | 56.1% |
| No Computing Device | 2,450 | 9.9% |
| Total | 24,715 | 100.0% |
Internet Access in Kingsport
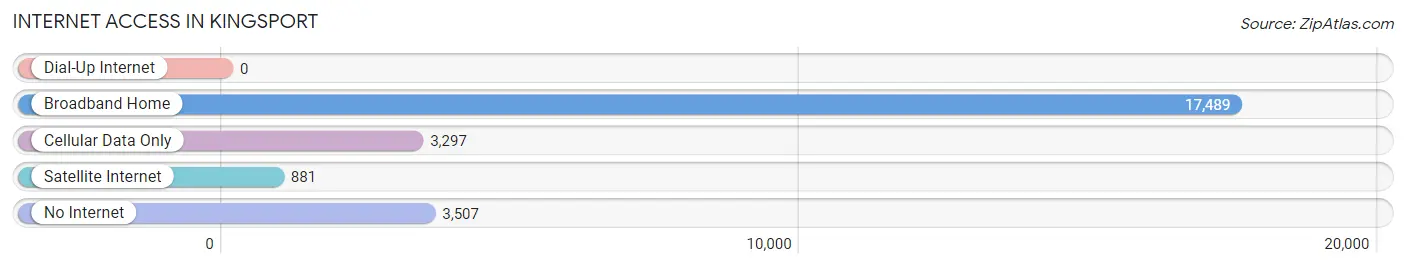
| Internet Type | # Households | % Households |
| Dial-Up Internet | 0 | 0.0% |
| Broadband Home | 17,489 | 70.8% |
| Cellular Data Only | 3,297 | 13.3% |
| Satellite Internet | 881 | 3.6% |
| No Internet | 3,507 | 14.2% |
| Total | 24,715 | 100.0% |
Kingsport Summary
Kingsport, Tennessee is a city located in the northeastern corner of the state, in the Appalachian Mountains. It is part of the Tri-Cities region, which includes Johnson City and Bristol, and is the largest city in the region. Kingsport is located along the Holston River, and is bordered by Sullivan and Hawkins counties. The city has a population of approximately 53,000 people, and is the fifth-largest city in the state.
History
The area that is now Kingsport was first settled in the late 1700s by settlers from the Watauga Association, a group of frontiersmen who had moved to the area from North Carolina. The settlement was originally known as Salt Lick, and was located near the present-day intersection of Eastman Road and Wilcox Drive. In 1779, the settlement was renamed Kingsport, after the nearby King's Port, a port on the Holston River.
In the early 1800s, the area began to grow and develop, and by the mid-1800s, Kingsport had become an important trading center. The city was incorporated in 1822, and by the late 1800s, it had become a major industrial center, with several factories and mills located in the area.
Geography
Kingsport is located in the northeastern corner of Tennessee, in the Appalachian Mountains. The city is situated along the Holston River, and is bordered by Sullivan and Hawkins counties. The city has a total area of approximately 40 square miles, and is located at an elevation of 1,400 feet.
The city is located in a temperate climate zone, with hot, humid summers and mild winters. The average annual temperature is around 57 degrees Fahrenheit, and the average annual precipitation is around 45 inches.
Economy
Kingsport is a major industrial center, with several large factories and mills located in the area. The city is home to Eastman Chemical Company, which is one of the largest employers in the region. Other major employers in the area include Domtar, Holston Valley Medical Center, and the Kingsport City Schools.
The city is also home to several major retail centers, including the Kingsport Town Center, which is the largest shopping mall in the region. The city also has a vibrant tourism industry, with several attractions, including Bays Mountain Park, the Kingsport Aquatic Center, and the Kingsport Greenbelt.
Demographics
As of the 2010 census, the population of Kingsport was 53,000. The racial makeup of the city was 87.3% White, 8.2% African American, 0.7% Native American, 1.2% Asian, 0.1% Pacific Islander, and 2.5% from other races. The median household income was $37,000, and the median family income was $45,000.
The city is home to several religious denominations, including Baptist, Methodist, Presbyterian, and Catholic. The city also has a large number of public and private schools, including the University of Tennessee at Kingsport, King College, and East Tennessee State University.
Conclusion
Kingsport, Tennessee is a city located in the northeastern corner of the state, in the Appalachian Mountains. It is part of the Tri-Cities region, and is the largest city in the region. The city has a population of approximately 53,000 people, and is the fifth-largest city in the state. Kingsport is a major industrial center, with several large factories and mills located in the area. The city is also home to several major retail centers, and has a vibrant tourism industry. The city is home to several religious denominations, and has a large number of public and private schools.
Common Questions
What is the Total Population of Kingsport?
Total Population of Kingsport is 55,415.
What is the Total Male Population of Kingsport?
Total Male Population of Kingsport is 26,042.
What is the Total Female Population of Kingsport?
Total Female Population of Kingsport is 29,373.
What is the Ratio of Males per 100 Females in Kingsport?
There are 88.66 Males per 100 Females in Kingsport.
What is the Ratio of Females per 100 Males in Kingsport?
There are 112.79 Females per 100 Males in Kingsport.
What is the Median Population Age in Kingsport?
Median Population Age in Kingsport is 44.6 Years.
What is the Average Family Size in Kingsport
Average Family Size in Kingsport is 2.8 People.
What is the Average Household Size in Kingsport
Average Household Size in Kingsport is 2.2 People.
What is Per Capita Income in Kingsport?
Per Capita income in Kingsport is $34,878.
What is the Median Family Income in Kingsport?
Median Family Income in Kingsport is $68,645.
What is the Median Household income in Kingsport?
Median Household Income in Kingsport is $48,228.
What is Income or Wage Gap in Kingsport?
Income or Wage Gap in Kingsport is 37.9%.
Women in Kingsport earn 62.1 cents for every dollar earned by a man.
What is Family Income Deficit in Kingsport?
Family Income Deficit in Kingsport is $11,529.
Families that are below poverty line in Kingsport earn $11,529 less on average than the poverty threshold level.
What is Inequality or Gini Index in Kingsport?
Inequality or Gini Index in Kingsport is 0.51.
How Large is the Labor Force in Kingsport?
There are 24,685 People in the Labor Forcein in Kingsport.
What is the Percentage of People in the Labor Force in Kingsport?
53.6% of People are in the Labor Force in Kingsport.
What is the Unemployment Rate in Kingsport?
Unemployment Rate in Kingsport is 5.3%.