Colonial Heights, TN
Colonial Heights Map
Colonial Heights Overview
2,667
TOTAL POPULATION
1,318
MALE POPULATION
1,349
FEMALE POPULATION
97.70
MALES / 100 FEMALES
102.35
FEMALES / 100 MALES
50.3
MEDIAN AGE
2.9
AVG FAMILY SIZE
2.1
AVG HOUSEHOLD SIZE
$44,121
PER CAPITA INCOME
$97,083
AVG FAMILY INCOME
$76,109
AVG HOUSEHOLD INCOME
12.4%
WAGE / INCOME GAP [ % ]
87.6¢/ $1
WAGE / INCOME GAP [ $ ]
0.39
INEQUALITY / GINI INDEX
1,667
LABOR FORCE [ PEOPLE ]
68.2%
PERCENT IN LABOR FORCE
4.3%
UNEMPLOYMENT RATE
Colonial Heights Area Codes
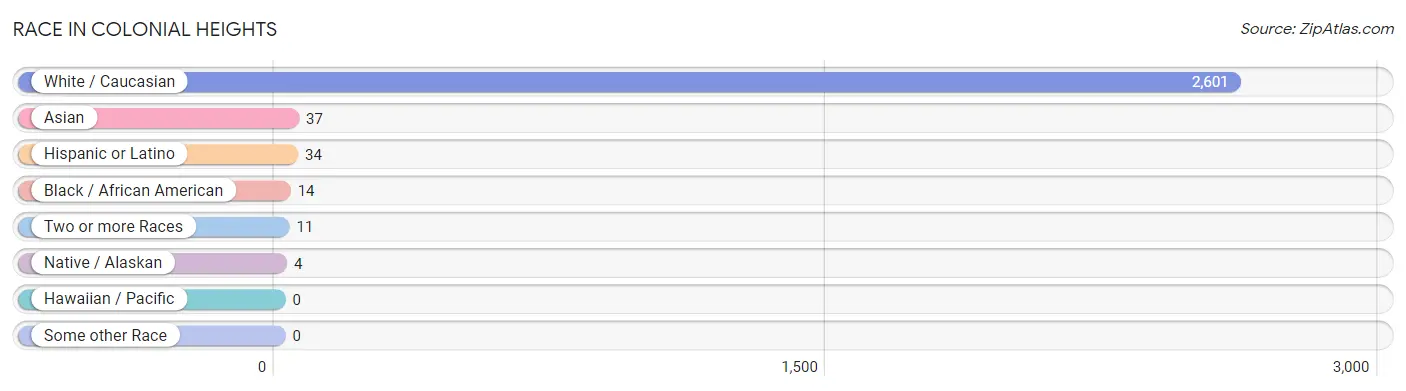
Race in Colonial Heights
The most populous races in Colonial Heights are White / Caucasian (2,601 | 97.5%), Asian (37 | 1.4%), and Hispanic or Latino (34 | 1.3%).
| Race | # Population | % Population |
| Asian | 37 | 1.4% |
| Black / African American | 14 | 0.5% |
| Hawaiian / Pacific | 0 | 0.0% |
| Hispanic or Latino | 34 | 1.3% |
| Native / Alaskan | 4 | 0.2% |
| White / Caucasian | 2,601 | 97.5% |
| Two or more Races | 11 | 0.4% |
| Some other Race | 0 | 0.0% |
| Total | 2,667 | 100.0% |
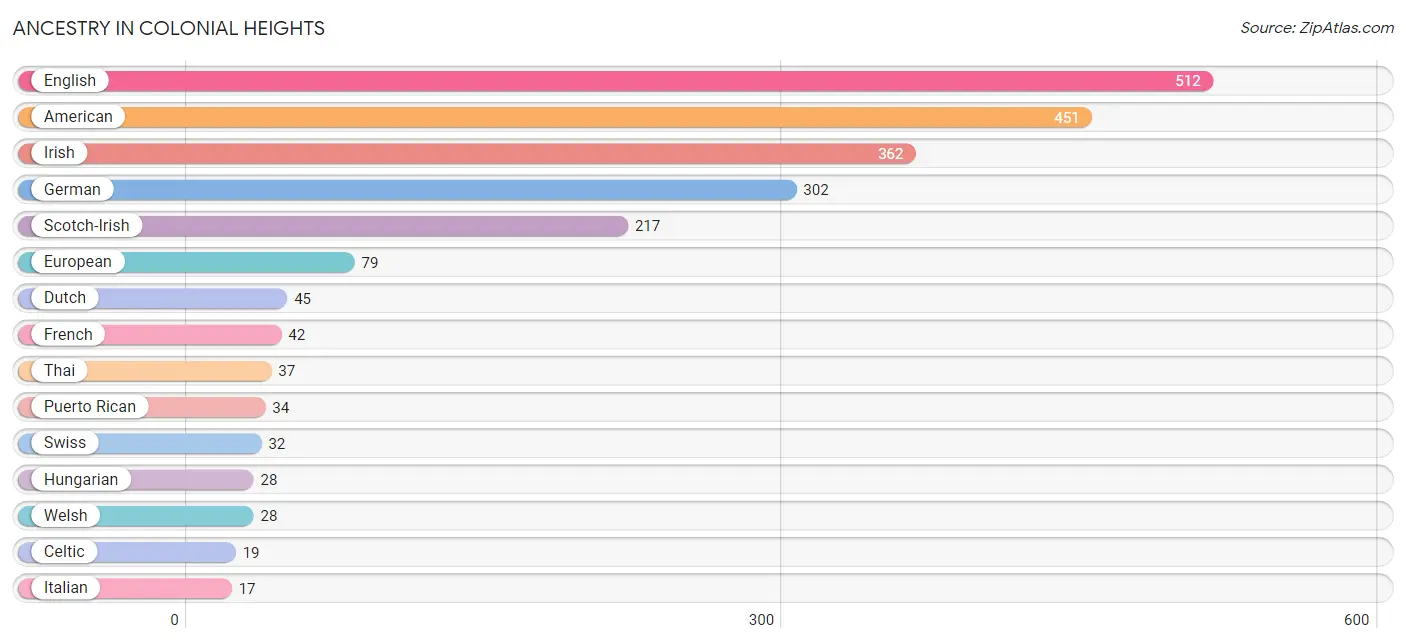
Ancestry in Colonial Heights
The most populous ancestries reported in Colonial Heights are English (512 | 19.2%), American (451 | 16.9%), Irish (362 | 13.6%), German (302 | 11.3%), and Scotch-Irish (217 | 8.1%), together accounting for 69.1% of all Colonial Heights residents.
| Ancestry | # Population | % Population |
| American | 451 | 16.9% |
| Blackfeet | 4 | 0.2% |
| Celtic | 19 | 0.7% |
| Cherokee | 5 | 0.2% |
| Dutch | 45 | 1.7% |
| English | 512 | 19.2% |
| European | 79 | 3.0% |
| French | 42 | 1.6% |
| French Canadian | 9 | 0.3% |
| German | 302 | 11.3% |
| Hungarian | 28 | 1.1% |
| Irish | 362 | 13.6% |
| Italian | 17 | 0.6% |
| Pennsylvania German | 9 | 0.3% |
| Polish | 10 | 0.4% |
| Puerto Rican | 34 | 1.3% |
| Scandinavian | 9 | 0.3% |
| Scotch-Irish | 217 | 8.1% |
| Scottish | 16 | 0.6% |
| Swiss | 32 | 1.2% |
| Thai | 37 | 1.4% |
| Welsh | 28 | 1.1% |
| Yugoslavian | 5 | 0.2% | View All 23 Rows |
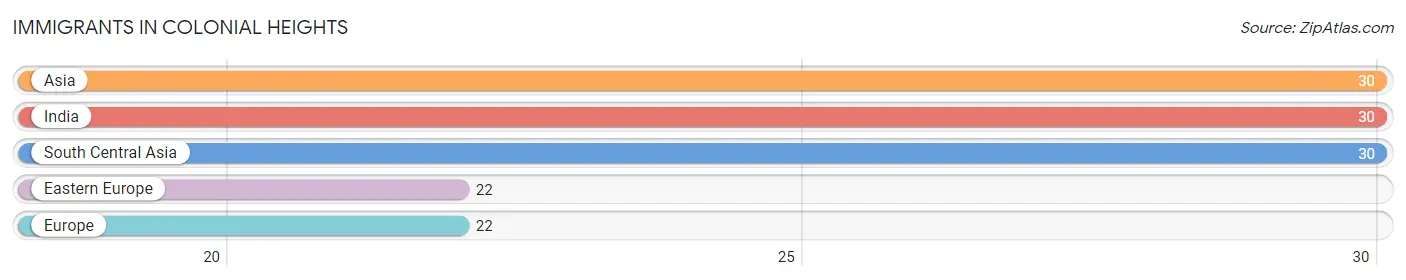
Immigrants in Colonial Heights
The most numerous immigrant groups reported in Colonial Heights came from Asia (30 | 1.1%), India (30 | 1.1%), South Central Asia (30 | 1.1%), Eastern Europe (22 | 0.8%), and Europe (22 | 0.8%), together accounting for 5.0% of all Colonial Heights residents.
| Immigration Origin | # Population | % Population |
| Asia | 30 | 1.1% |
| Eastern Europe | 22 | 0.8% |
| Europe | 22 | 0.8% |
| India | 30 | 1.1% |
| South Central Asia | 30 | 1.1% | View All 5 Rows |
Sex and Age in Colonial Heights
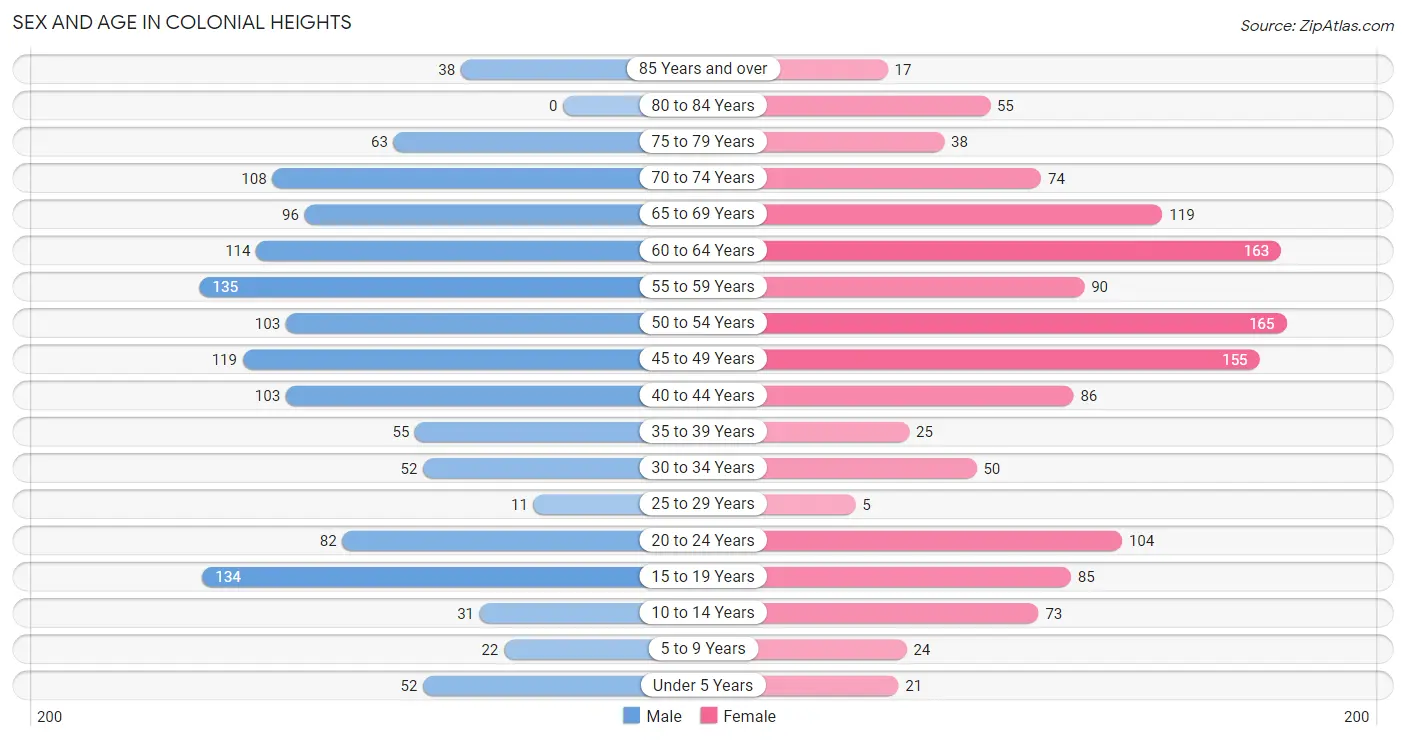
Sex and Age in Colonial Heights
The most populous age groups in Colonial Heights are 55 to 59 Years (135 | 10.2%) for men and 50 to 54 Years (165 | 12.2%) for women.
| Age Bracket | Male | Female |
| Under 5 Years | 52 (4.0%) | 21 (1.6%) |
| 5 to 9 Years | 22 (1.7%) | 24 (1.8%) |
| 10 to 14 Years | 31 (2.4%) | 73 (5.4%) |
| 15 to 19 Years | 134 (10.2%) | 85 (6.3%) |
| 20 to 24 Years | 82 (6.2%) | 104 (7.7%) |
| 25 to 29 Years | 11 (0.8%) | 5 (0.4%) |
| 30 to 34 Years | 52 (4.0%) | 50 (3.7%) |
| 35 to 39 Years | 55 (4.2%) | 25 (1.8%) |
| 40 to 44 Years | 103 (7.8%) | 86 (6.4%) |
| 45 to 49 Years | 119 (9.0%) | 155 (11.5%) |
| 50 to 54 Years | 103 (7.8%) | 165 (12.2%) |
| 55 to 59 Years | 135 (10.2%) | 90 (6.7%) |
| 60 to 64 Years | 114 (8.6%) | 163 (12.1%) |
| 65 to 69 Years | 96 (7.3%) | 119 (8.8%) |
| 70 to 74 Years | 108 (8.2%) | 74 (5.5%) |
| 75 to 79 Years | 63 (4.8%) | 38 (2.8%) |
| 80 to 84 Years | 0 (0.0%) | 55 (4.1%) |
| 85 Years and over | 38 (2.9%) | 17 (1.3%) |
| Total | 1,318 (100.0%) | 1,349 (100.0%) |
Families and Households in Colonial Heights
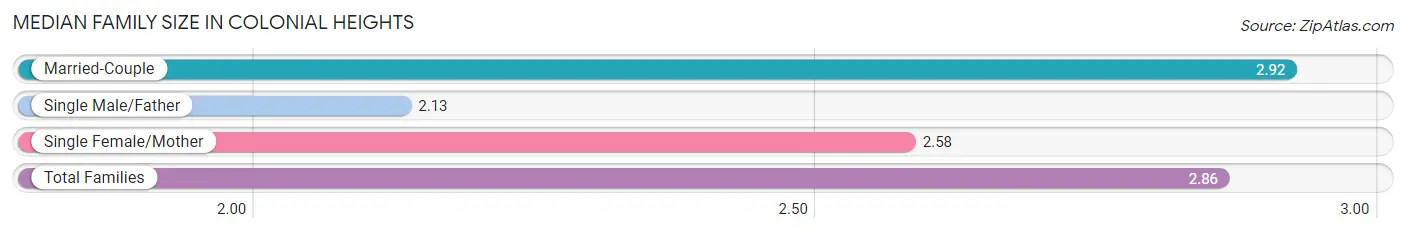
Median Family Size in Colonial Heights
The median family size in Colonial Heights is 2.86 persons per family, with married-couple families (634 | 86.9%) accounting for the largest median family size of 2.92 persons per family. On the other hand, single male/father families (24 | 3.3%) represent the smallest median family size with 2.13 persons per family.
| Family Type | # Families | Family Size |
| Married-Couple | 634 (86.9%) | 2.92 |
| Single Male/Father | 24 (3.3%) | 2.13 |
| Single Female/Mother | 72 (9.9%) | 2.58 |
| Total Families | 730 (100.0%) | 2.86 |
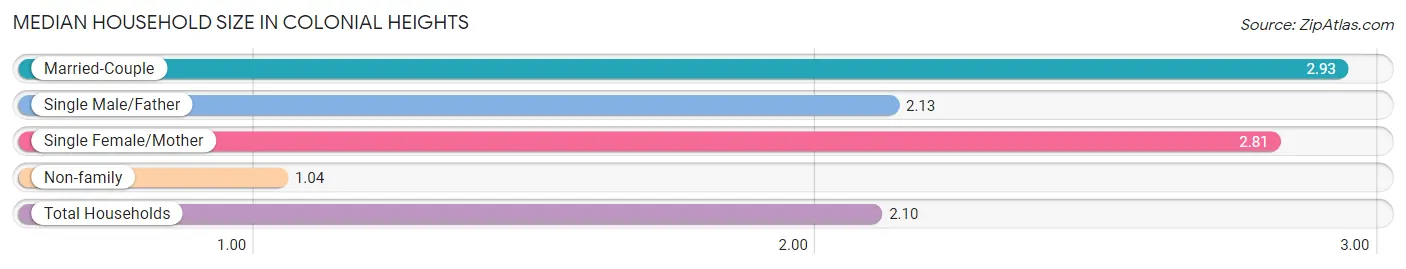
Median Household Size in Colonial Heights
The median household size in Colonial Heights is 2.10 persons per household, with married-couple households (634 | 50.0%) accounting for the largest median household size of 2.93 persons per household. non-family households (537 | 42.4%) represent the smallest median household size with 1.04 persons per household.
| Household Type | # Households | Household Size |
| Married-Couple | 634 (50.0%) | 2.93 |
| Single Male/Father | 24 (1.9%) | 2.13 |
| Single Female/Mother | 72 (5.7%) | 2.81 |
| Non-family | 537 (42.4%) | 1.04 |
| Total Households | 1,267 (100.0%) | 2.10 |
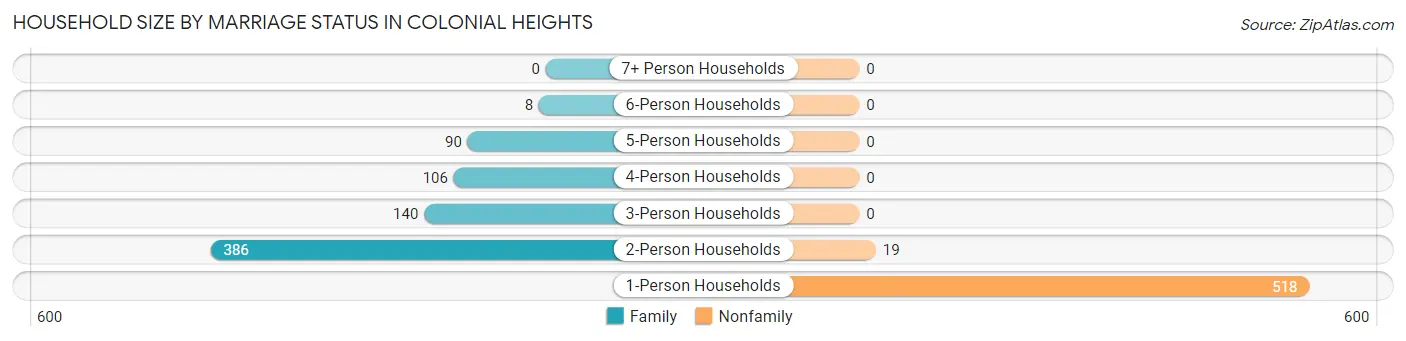
Household Size by Marriage Status in Colonial Heights
Out of a total of 1,267 households in Colonial Heights, 730 (57.6%) are family households, while 537 (42.4%) are nonfamily households. The most numerous type of family households are 2-person households, comprising 386, and the most common type of nonfamily households are 1-person households, comprising 518.
| Household Size | Family Households | Nonfamily Households |
| 1-Person Households | - | 518 (40.9%) |
| 2-Person Households | 386 (30.5%) | 19 (1.5%) |
| 3-Person Households | 140 (11.1%) | 0 (0.0%) |
| 4-Person Households | 106 (8.4%) | 0 (0.0%) |
| 5-Person Households | 90 (7.1%) | 0 (0.0%) |
| 6-Person Households | 8 (0.6%) | 0 (0.0%) |
| 7+ Person Households | 0 (0.0%) | 0 (0.0%) |
| Total | 730 (57.6%) | 537 (42.4%) |
Female Fertility in Colonial Heights
Fertility by Age in Colonial Heights
Average fertility rate in Colonial Heights is 73.0 births per 1,000 women. Women in the age bracket of 20 to 34 years have the highest fertility rate with 270.0 births per 1,000 women. Women in the age bracket of 20 to 34 years acount for 100.0% of all women with births.
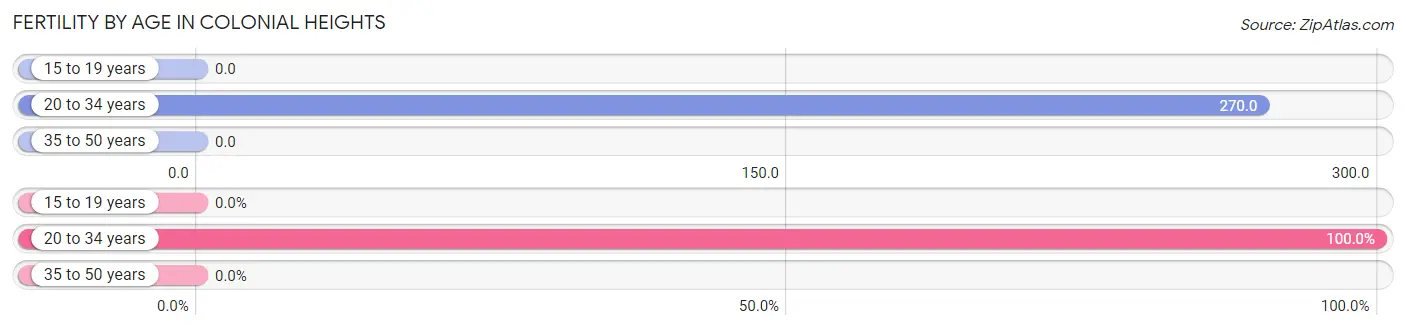
| Age Bracket | Women with Births | Births / 1,000 Women |
| 15 to 19 years | 0 (0.0%) | 0.0 |
| 20 to 34 years | 43 (100.0%) | 270.0 |
| 35 to 50 years | 0 (0.0%) | 0.0 |
| Total | 43 (100.0%) | 73.0 |
Fertility by Age by Marriage Status in Colonial Heights
67.4% of women with births (43) in Colonial Heights are married. The highest percentage of unmarried women with births falls into 20 to 34 years age bracket with 32.6% of them unmarried at the time of birth, while the lowest percentage of unmarried women with births belong to 20 to 34 years age bracket with 32.6% of them unmarried.
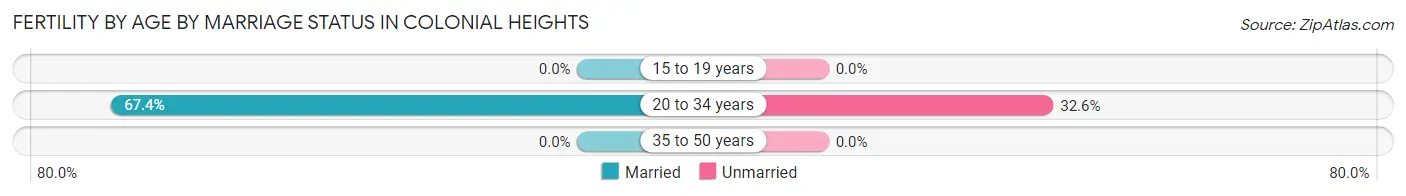
| Age Bracket | Married | Unmarried |
| 15 to 19 years | 0 (0.0%) | 0 (0.0%) |
| 20 to 34 years | 29 (67.4%) | 14 (32.6%) |
| 35 to 50 years | 0 (0.0%) | 0 (0.0%) |
| Total | 29 (67.4%) | 14 (32.6%) |
Fertility by Education in Colonial Heights
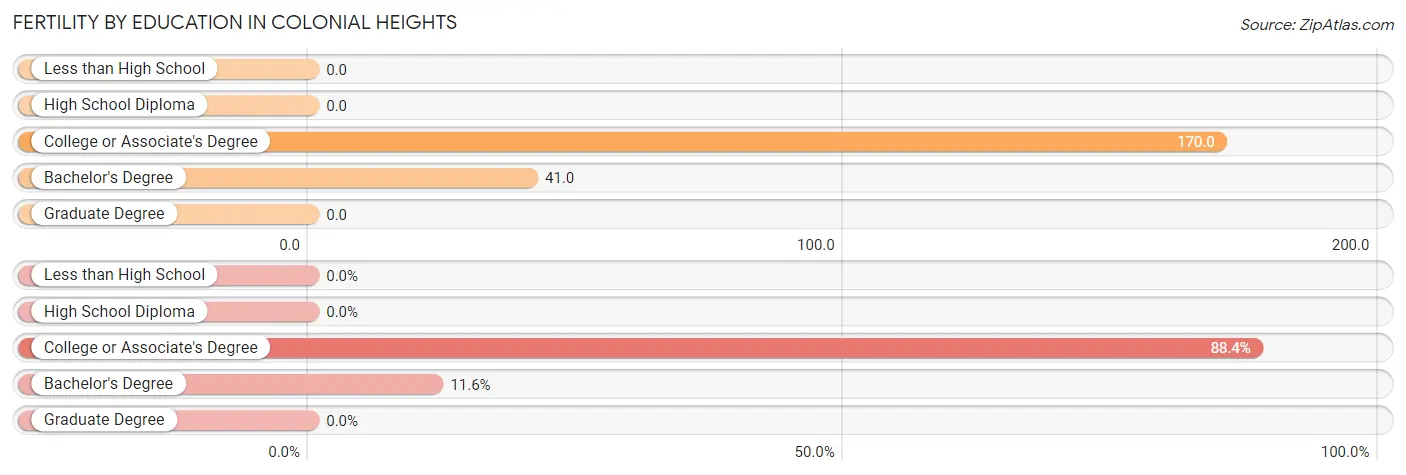
| Educational Attainment | Women with Births | Births / 1,000 Women |
| Less than High School | 0 (0.0%) | 0.0 |
| High School Diploma | 0 (0.0%) | 0.0 |
| College or Associate's Degree | 38 (88.4%) | 170.0 |
| Bachelor's Degree | 5 (11.6%) | 41.0 |
| Graduate Degree | 0 (0.0%) | 0.0 |
| Total | 43 (100.0%) | 73.0 |
Fertility by Education by Marriage Status in Colonial Heights
32.6% of women with births in Colonial Heights are unmarried. Women with the educational attainment of bachelor's degree are most likely to be married with 100.0% of them married at childbirth, while women with the educational attainment of college or associate's degree are least likely to be married with 36.8% of them unmarried at childbirth.
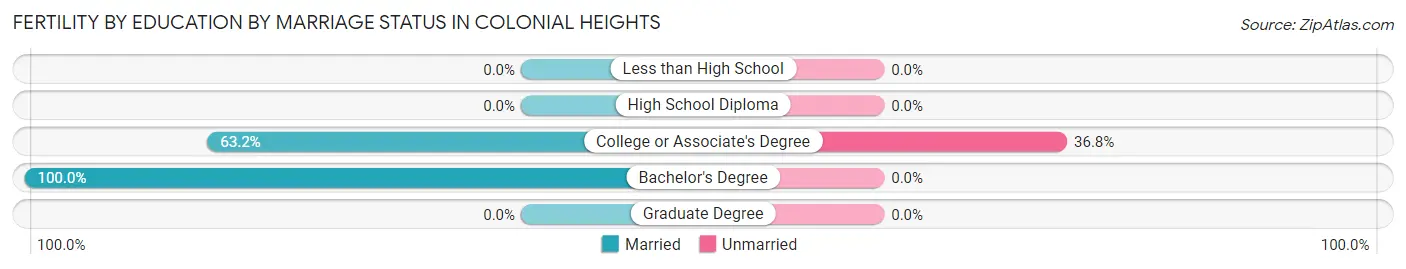
| Educational Attainment | Married | Unmarried |
| Less than High School | 0 (0.0%) | 0 (0.0%) |
| High School Diploma | 0 (0.0%) | 0 (0.0%) |
| College or Associate's Degree | 24 (63.2%) | 14 (36.8%) |
| Bachelor's Degree | 5 (100.0%) | 0 (0.0%) |
| Graduate Degree | 0 (0.0%) | 0 (0.0%) |
| Total | 29 (67.4%) | 14 (32.6%) |
Income in Colonial Heights
Income Overview in Colonial Heights
Per Capita Income in Colonial Heights is $44,121, while median incomes of families and households are $97,083 and $76,109 respectively.
| Characteristic | Number | Measure |
| Per Capita Income | 2,667 | $44,121 |
| Median Family Income | 730 | $97,083 |
| Mean Family Income | 730 | $116,270 |
| Median Household Income | 1,267 | $76,109 |
| Mean Household Income | 1,267 | $88,623 |
| Income Deficit | 730 | $0 |
| Wage / Income Gap (%) | 2,667 | 12.40% |
| Wage / Income Gap ($) | 2,667 | 87.60¢ per $1 |
| Gini / Inequality Index | 2,667 | 0.39 |
Earnings by Sex in Colonial Heights
Average Earnings in Colonial Heights are $42,099, $45,823 for men and $40,142 for women, a difference of 12.4%.
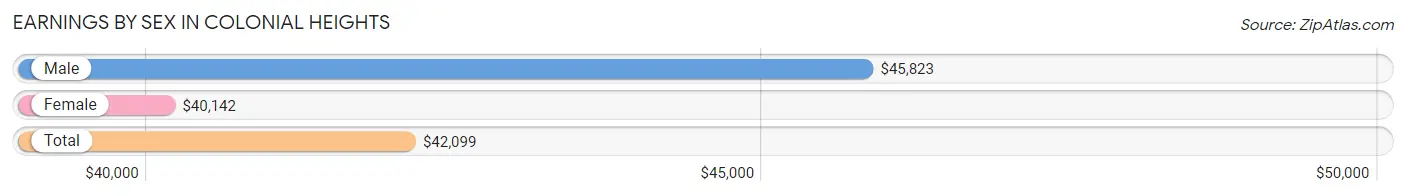
| Sex | Number | Average Earnings |
| Male | 875 (50.8%) | $45,823 |
| Female | 847 (49.2%) | $40,142 |
| Total | 1,722 (100.0%) | $42,099 |
Earnings by Sex by Income Bracket in Colonial Heights
The most common earnings brackets in Colonial Heights are $100,000+ for men (151 | 17.3%) and $55,000 to $64,999 for women (125 | 14.8%).
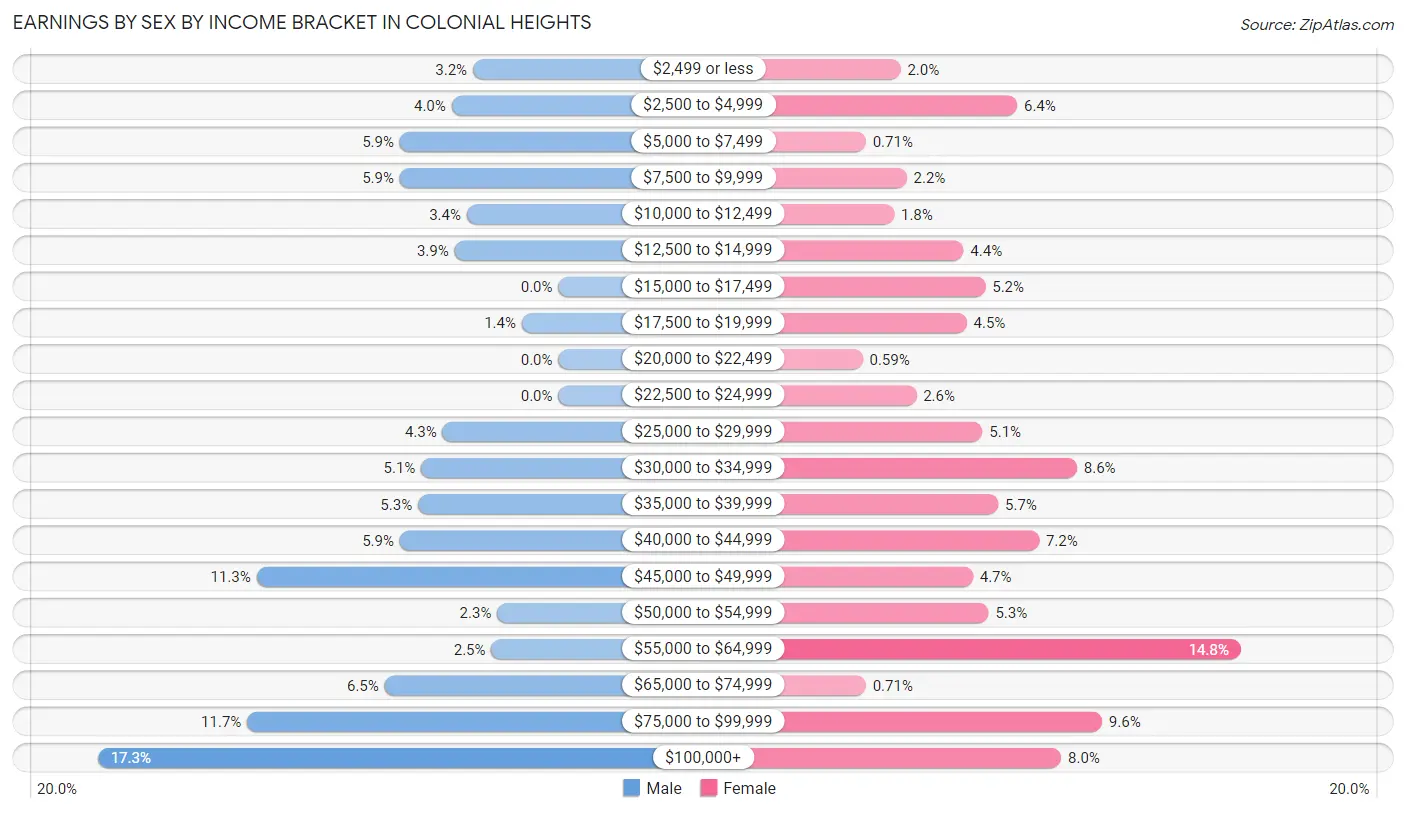
| Income | Male | Female |
| $2,499 or less | 28 (3.2%) | 17 (2.0%) |
| $2,500 to $4,999 | 35 (4.0%) | 54 (6.4%) |
| $5,000 to $7,499 | 52 (5.9%) | 6 (0.7%) |
| $7,500 to $9,999 | 52 (5.9%) | 19 (2.2%) |
| $10,000 to $12,499 | 30 (3.4%) | 15 (1.8%) |
| $12,500 to $14,999 | 34 (3.9%) | 37 (4.4%) |
| $15,000 to $17,499 | 0 (0.0%) | 44 (5.2%) |
| $17,500 to $19,999 | 12 (1.4%) | 38 (4.5%) |
| $20,000 to $22,499 | 0 (0.0%) | 5 (0.6%) |
| $22,500 to $24,999 | 0 (0.0%) | 22 (2.6%) |
| $25,000 to $29,999 | 38 (4.3%) | 43 (5.1%) |
| $30,000 to $34,999 | 45 (5.1%) | 73 (8.6%) |
| $35,000 to $39,999 | 46 (5.3%) | 48 (5.7%) |
| $40,000 to $44,999 | 52 (5.9%) | 61 (7.2%) |
| $45,000 to $49,999 | 99 (11.3%) | 40 (4.7%) |
| $50,000 to $54,999 | 20 (2.3%) | 45 (5.3%) |
| $55,000 to $64,999 | 22 (2.5%) | 125 (14.8%) |
| $65,000 to $74,999 | 57 (6.5%) | 6 (0.7%) |
| $75,000 to $99,999 | 102 (11.7%) | 81 (9.6%) |
| $100,000+ | 151 (17.3%) | 68 (8.0%) |
| Total | 875 (100.0%) | 847 (100.0%) |
Earnings by Sex by Educational Attainment in Colonial Heights
Average earnings in Colonial Heights are $50,625 for men and $46,055 for women, a difference of 9.0%. Men with an educational attainment of bachelor's degree enjoy the highest average annual earnings of $157,654, while those with less than high school education earn the least with $26,333. Women with an educational attainment of bachelor's degree earn the most with the average annual earnings of $76,169, while those with high school diploma education have the smallest earnings of $29,821.
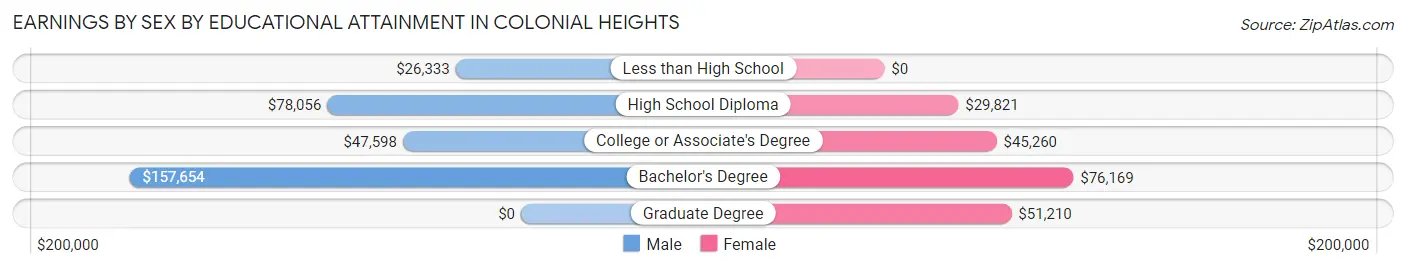
| Educational Attainment | Male Income | Female Income |
| Less than High School | $26,333 | $0 |
| High School Diploma | $78,056 | $29,821 |
| College or Associate's Degree | $47,598 | $45,260 |
| Bachelor's Degree | $157,654 | $76,169 |
| Graduate Degree | - | - |
| Total | $50,625 | $46,055 |
Family Income in Colonial Heights
Family Income Brackets in Colonial Heights
According to the Colonial Heights family income data, there are 174 families falling into the $100,000 to $149,999 income range, which is the most common income bracket and makes up 23.8% of all families.
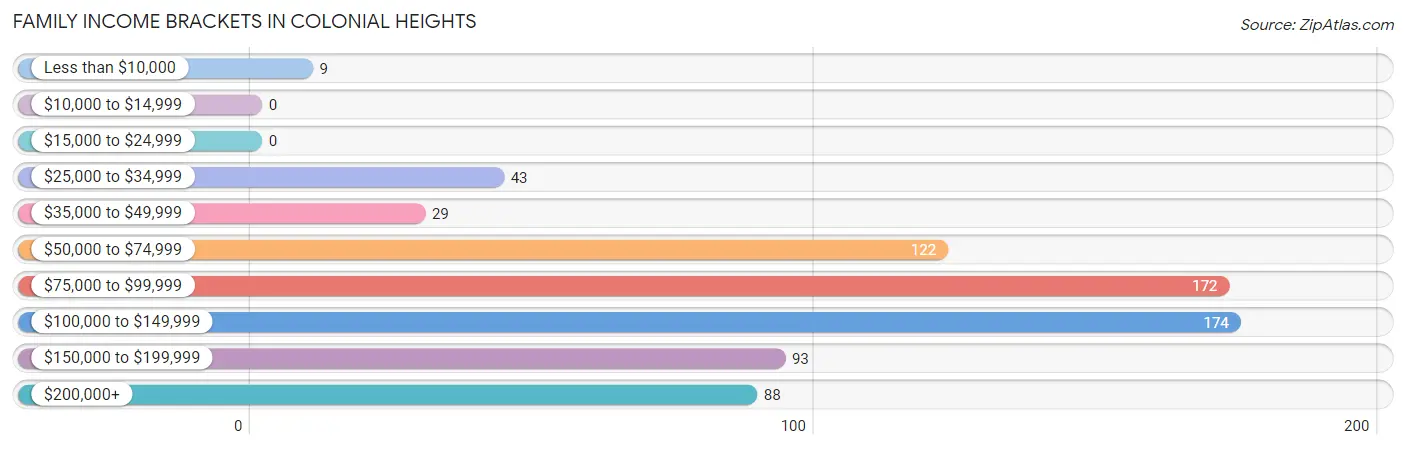
| Income Bracket | # Families | % Families |
| Less than $10,000 | 9 | 1.2% |
| $10,000 to $14,999 | 0 | 0.0% |
| $15,000 to $24,999 | 0 | 0.0% |
| $25,000 to $34,999 | 43 | 5.9% |
| $35,000 to $49,999 | 29 | 4.0% |
| $50,000 to $74,999 | 122 | 16.7% |
| $75,000 to $99,999 | 172 | 23.6% |
| $100,000 to $149,999 | 174 | 23.8% |
| $150,000 to $199,999 | 93 | 12.7% |
| $200,000+ | 88 | 12.1% |
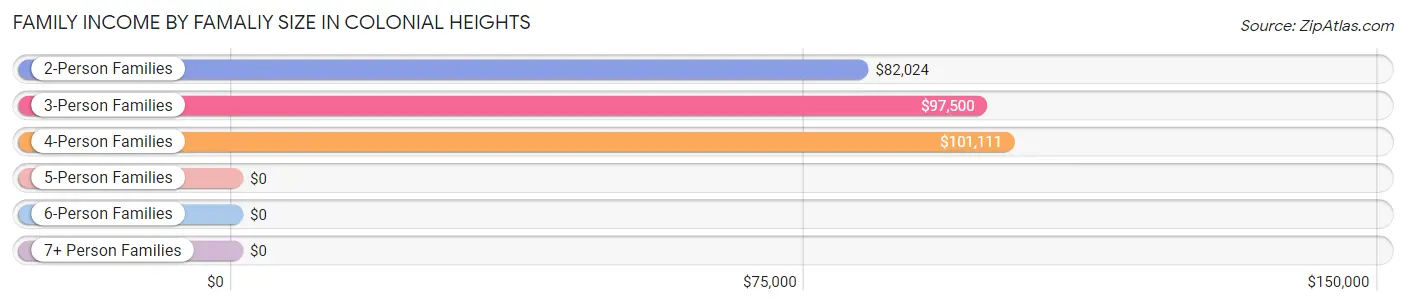
Family Income by Famaliy Size in Colonial Heights
4-person families (88 | 12.0%) account for the highest median family income in Colonial Heights with $101,111 per family, while 2-person families (386 | 52.9%) have the highest median income of $41,012 per family member.
| Income Bracket | # Families | Median Income |
| 2-Person Families | 386 (52.9%) | $82,024 |
| 3-Person Families | 158 (21.6%) | $97,500 |
| 4-Person Families | 88 (12.0%) | $101,111 |
| 5-Person Families | 90 (12.3%) | $0 |
| 6-Person Families | 8 (1.1%) | $0 |
| 7+ Person Families | 0 (0.0%) | $0 |
| Total | 730 (100.0%) | $97,083 |
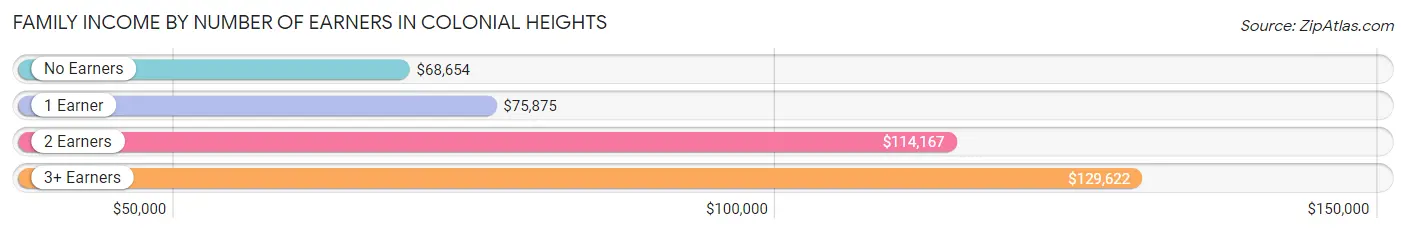
Family Income by Number of Earners in Colonial Heights
The median family income in Colonial Heights is $97,083, with families comprising 3+ earners (189) having the highest median family income of $129,622, while families with no earners (120) have the lowest median family income of $68,654, accounting for 25.9% and 16.4% of families, respectively.
| Number of Earners | # Families | Median Income |
| No Earners | 120 (16.4%) | $68,654 |
| 1 Earner | 149 (20.4%) | $75,875 |
| 2 Earners | 272 (37.3%) | $114,167 |
| 3+ Earners | 189 (25.9%) | $129,622 |
| Total | 730 (100.0%) | $97,083 |
Household Income in Colonial Heights
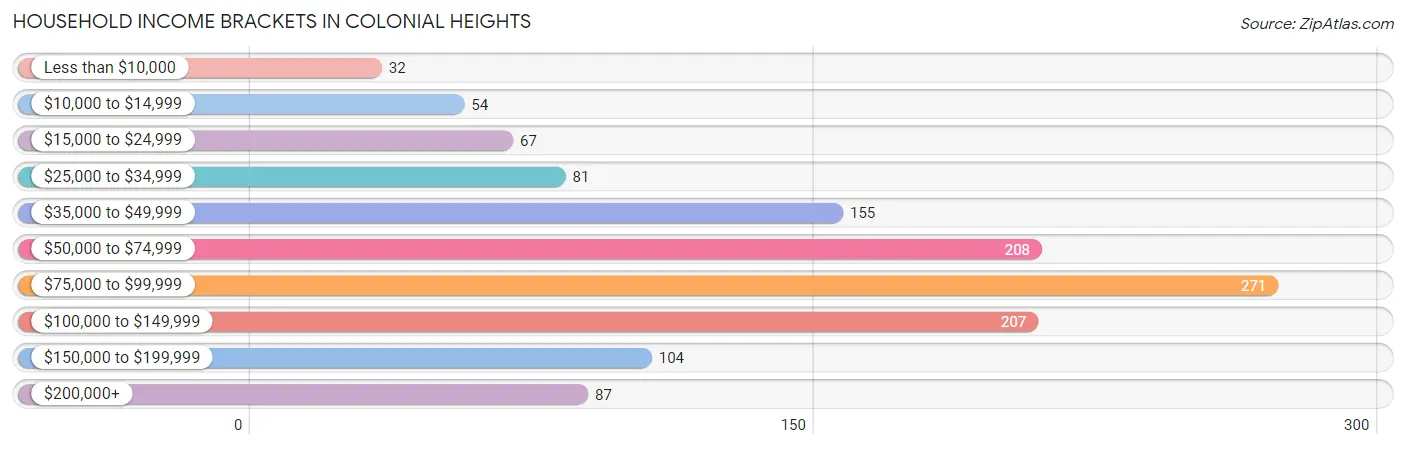
Household Income Brackets in Colonial Heights
With 271 households falling in the category, the $75,000 to $99,999 income range is the most frequent in Colonial Heights, accounting for 21.4% of all households. In contrast, only 32 households (2.5%) fall into the less than $10,000 income bracket, making it the least populous group.
| Income Bracket | # Households | % Households |
| Less than $10,000 | 32 | 2.5% |
| $10,000 to $14,999 | 54 | 4.3% |
| $15,000 to $24,999 | 67 | 5.3% |
| $25,000 to $34,999 | 81 | 6.4% |
| $35,000 to $49,999 | 155 | 12.2% |
| $50,000 to $74,999 | 208 | 16.4% |
| $75,000 to $99,999 | 271 | 21.4% |
| $100,000 to $149,999 | 207 | 16.3% |
| $150,000 to $199,999 | 104 | 8.2% |
| $200,000+ | 87 | 6.9% |
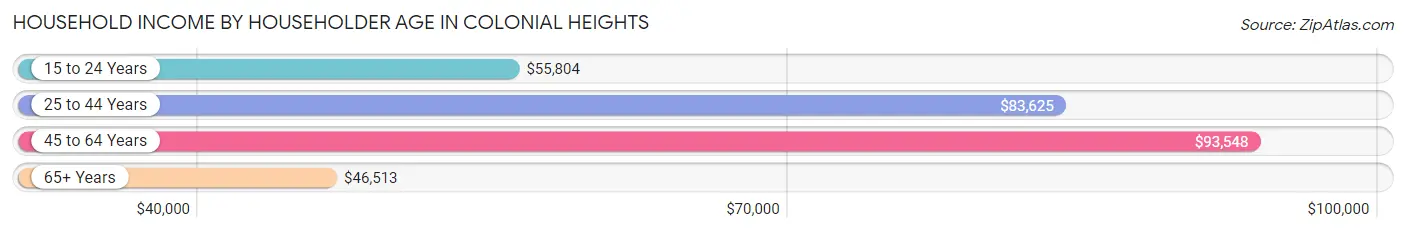
Household Income by Householder Age in Colonial Heights
The median household income in Colonial Heights is $76,109, with the highest median household income of $93,548 found in the 45 to 64 years age bracket for the primary householder. A total of 640 households (50.5%) fall into this category. Meanwhile, the 65+ years age bracket for the primary householder has the lowest median household income of $46,513, with 439 households (34.6%) in this group.
| Income Bracket | # Households | Median Income |
| 15 to 24 Years | 29 (2.3%) | $55,804 |
| 25 to 44 Years | 159 (12.6%) | $83,625 |
| 45 to 64 Years | 640 (50.5%) | $93,548 |
| 65+ Years | 439 (34.6%) | $46,513 |
| Total | 1,267 (100.0%) | $76,109 |
Poverty in Colonial Heights
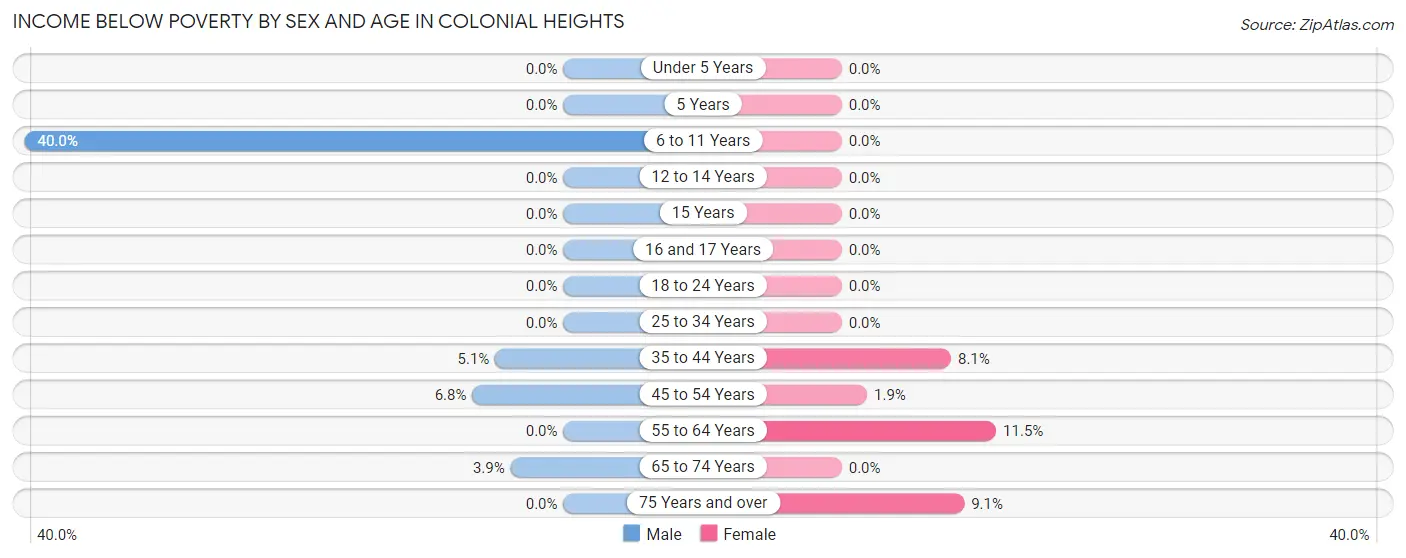
Income Below Poverty by Sex and Age in Colonial Heights
With 3.7% poverty level for males and 4.0% for females among the residents of Colonial Heights, 6 to 11 year old males and 55 to 64 year old females are the most vulnerable to poverty, with 18 males (40.0%) and 29 females (11.5%) in their respective age groups living below the poverty level.
| Age Bracket | Male | Female |
| Under 5 Years | 0 (0.0%) | 0 (0.0%) |
| 5 Years | 0 (0.0%) | 0 (0.0%) |
| 6 to 11 Years | 18 (40.0%) | 0 (0.0%) |
| 12 to 14 Years | 0 (0.0%) | 0 (0.0%) |
| 15 Years | 0 (0.0%) | 0 (0.0%) |
| 16 and 17 Years | 0 (0.0%) | 0 (0.0%) |
| 18 to 24 Years | 0 (0.0%) | 0 (0.0%) |
| 25 to 34 Years | 0 (0.0%) | 0 (0.0%) |
| 35 to 44 Years | 8 (5.1%) | 9 (8.1%) |
| 45 to 54 Years | 15 (6.8%) | 6 (1.9%) |
| 55 to 64 Years | 0 (0.0%) | 29 (11.5%) |
| 65 to 74 Years | 8 (3.9%) | 0 (0.0%) |
| 75 Years and over | 0 (0.0%) | 10 (9.1%) |
| Total | 49 (3.7%) | 54 (4.0%) |
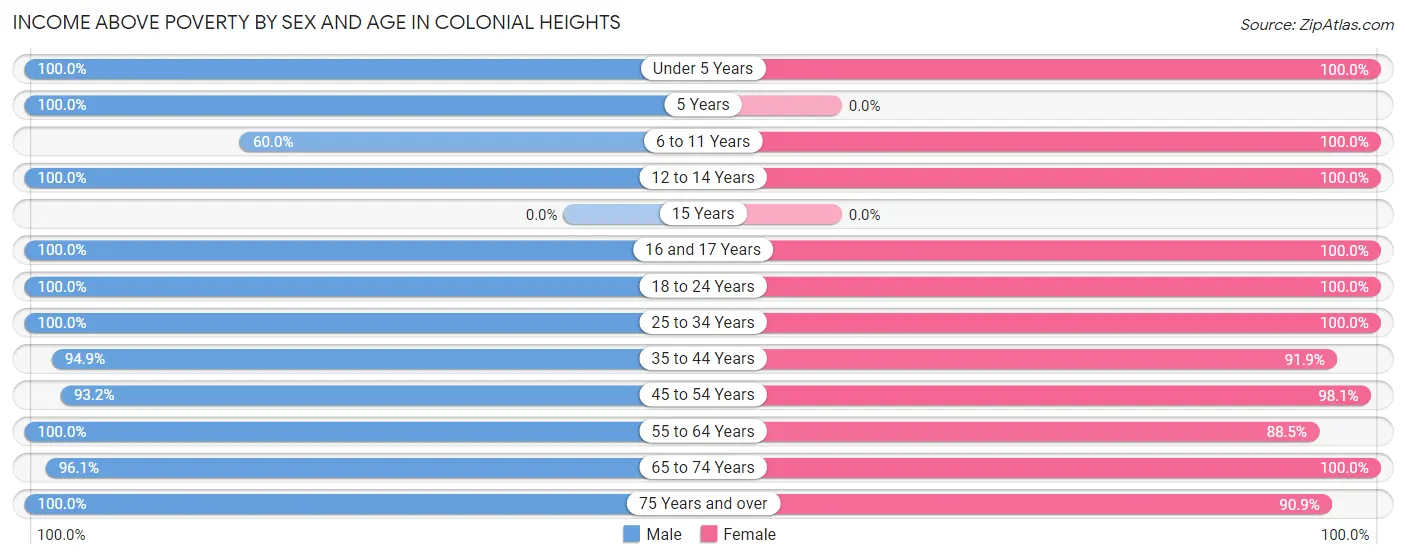
Income Above Poverty by Sex and Age in Colonial Heights
According to the poverty statistics in Colonial Heights, males aged under 5 years and females aged under 5 years are the age groups that are most secure financially, with 100.0% of males and 100.0% of females in these age groups living above the poverty line.
| Age Bracket | Male | Female |
| Under 5 Years | 52 (100.0%) | 21 (100.0%) |
| 5 Years | 4 (100.0%) | 0 (0.0%) |
| 6 to 11 Years | 27 (60.0%) | 50 (100.0%) |
| 12 to 14 Years | 4 (100.0%) | 47 (100.0%) |
| 15 Years | 0 (0.0%) | 0 (0.0%) |
| 16 and 17 Years | 75 (100.0%) | 16 (100.0%) |
| 18 to 24 Years | 141 (100.0%) | 173 (100.0%) |
| 25 to 34 Years | 63 (100.0%) | 55 (100.0%) |
| 35 to 44 Years | 150 (94.9%) | 102 (91.9%) |
| 45 to 54 Years | 207 (93.2%) | 314 (98.1%) |
| 55 to 64 Years | 249 (100.0%) | 224 (88.5%) |
| 65 to 74 Years | 196 (96.1%) | 193 (100.0%) |
| 75 Years and over | 101 (100.0%) | 100 (90.9%) |
| Total | 1,269 (96.3%) | 1,295 (96.0%) |
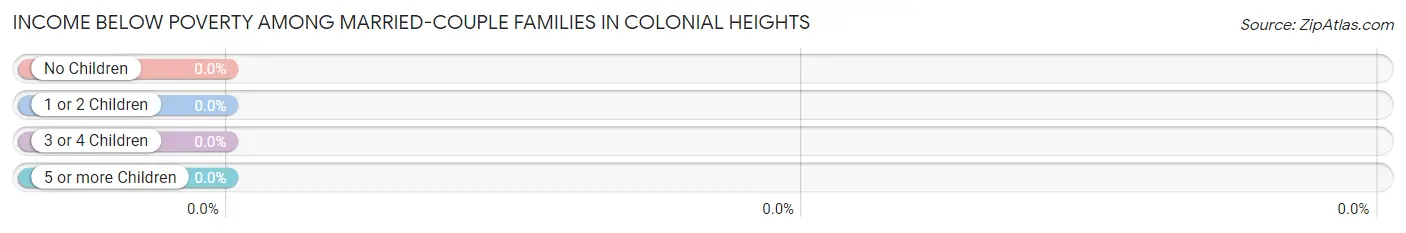
Income Below Poverty Among Married-Couple Families in Colonial Heights
| Children | Above Poverty | Below Poverty |
| No Children | 437 (100.0%) | 0 (0.0%) |
| 1 or 2 Children | 189 (100.0%) | 0 (0.0%) |
| 3 or 4 Children | 8 (100.0%) | 0 (0.0%) |
| 5 or more Children | 0 (0.0%) | 0 (0.0%) |
| Total | 634 (100.0%) | 0 (0.0%) |
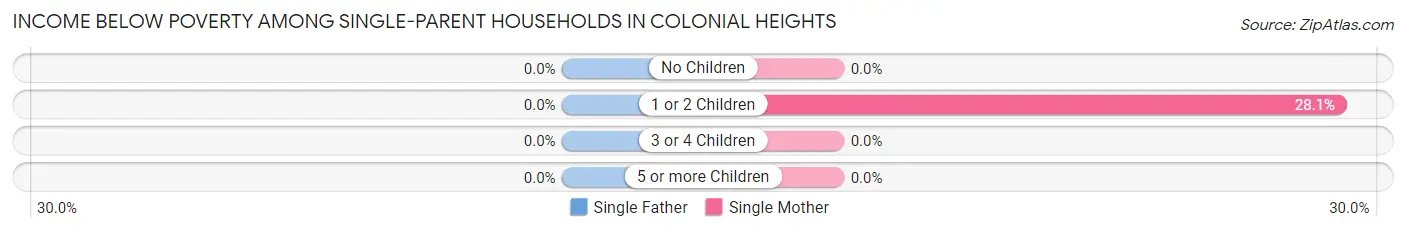
Income Below Poverty Among Single-Parent Households in Colonial Heights
| Children | Single Father | Single Mother |
| No Children | 0 (0.0%) | 0 (0.0%) |
| 1 or 2 Children | 0 (0.0%) | 9 (28.1%) |
| 3 or 4 Children | 0 (0.0%) | 0 (0.0%) |
| 5 or more Children | 0 (0.0%) | 0 (0.0%) |
| Total | 0 (0.0%) | 9 (12.5%) |
Income Below Poverty Among Married-Couple vs Single-Parent Households in Colonial Heights
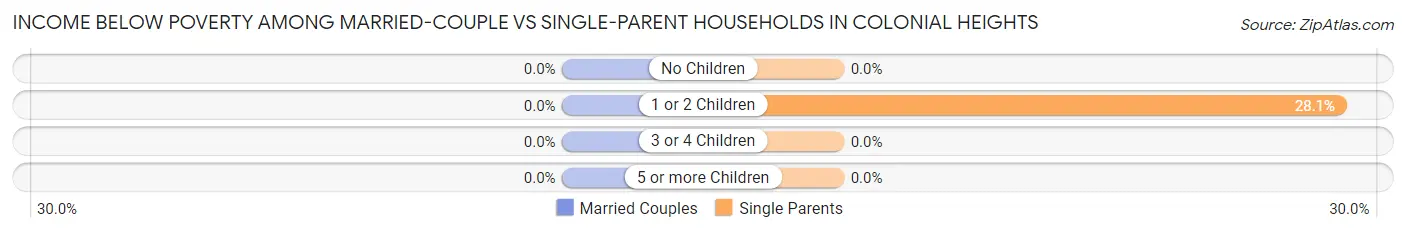
| Children | Married-Couple Families | Single-Parent Households |
| No Children | 0 (0.0%) | 0 (0.0%) |
| 1 or 2 Children | 0 (0.0%) | 9 (28.1%) |
| 3 or 4 Children | 0 (0.0%) | 0 (0.0%) |
| 5 or more Children | 0 (0.0%) | 0 (0.0%) |
| Total | 0 (0.0%) | 9 (9.4%) |
Employment Characteristics in Colonial Heights
Employment by Class of Employer in Colonial Heights
Among the 1,527 employed individuals in Colonial Heights, private company employees (1,068 | 69.9%), not-for-profit organizations (160 | 10.5%), and local government employees (88 | 5.8%) make up the most common classes of employment.
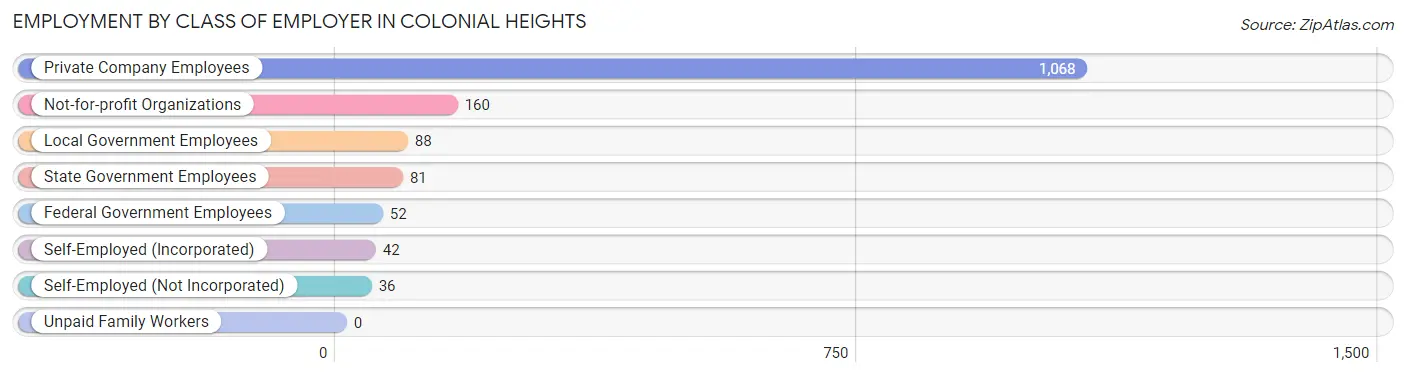
| Employer Class | # Employees | % Employees |
| Private Company Employees | 1,068 | 69.9% |
| Self-Employed (Incorporated) | 42 | 2.8% |
| Self-Employed (Not Incorporated) | 36 | 2.4% |
| Not-for-profit Organizations | 160 | 10.5% |
| Local Government Employees | 88 | 5.8% |
| State Government Employees | 81 | 5.3% |
| Federal Government Employees | 52 | 3.4% |
| Unpaid Family Workers | 0 | 0.0% |
| Total | 1,527 | 100.0% |
Employment Status by Age in Colonial Heights
According to the labor force statistics for Colonial Heights, out of the total population over 16 years of age (2,444), 68.2% or 1,667 individuals are in the labor force, with 4.3% or 72 of them unemployed. The age group with the highest labor force participation rate is 25 to 29 years, with 100.0% or 16 individuals in the labor force. Within the labor force, the 16 to 19 years age range has the highest percentage of unemployed individuals, with 16.1% or 26 of them being unemployed.
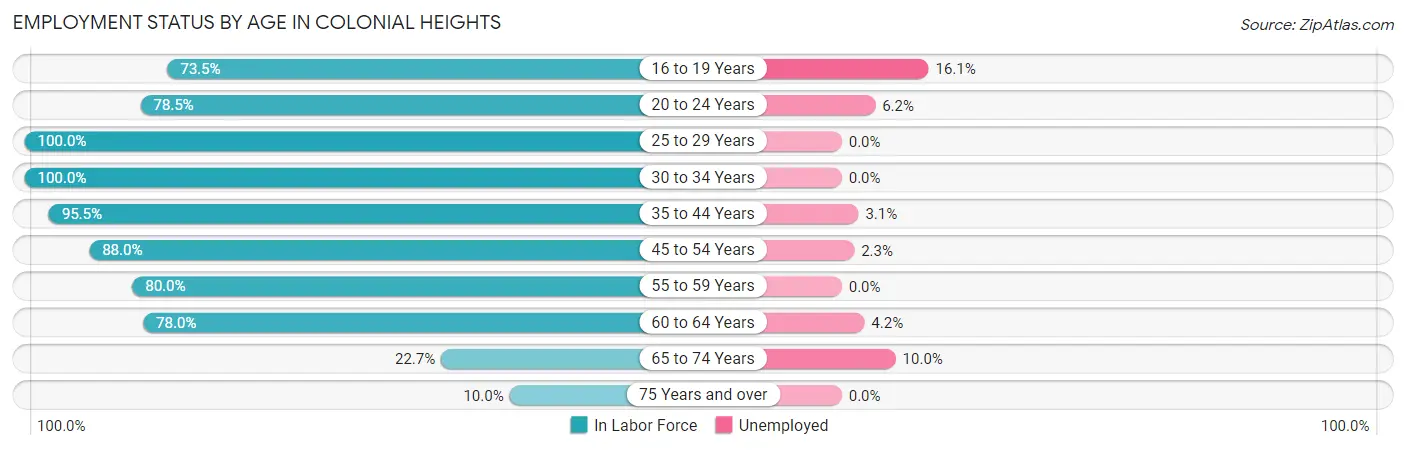
| Age Bracket | In Labor Force | Unemployed |
| 16 to 19 Years | 161 (73.5%) | 26 (16.1%) |
| 20 to 24 Years | 146 (78.5%) | 9 (6.2%) |
| 25 to 29 Years | 16 (100.0%) | 0 (0.0%) |
| 30 to 34 Years | 102 (100.0%) | 0 (0.0%) |
| 35 to 44 Years | 257 (95.5%) | 8 (3.1%) |
| 45 to 54 Years | 477 (88.0%) | 11 (2.3%) |
| 55 to 59 Years | 180 (80.0%) | 0 (0.0%) |
| 60 to 64 Years | 216 (78.0%) | 9 (4.2%) |
| 65 to 74 Years | 90 (22.7%) | 9 (10.0%) |
| 75 Years and over | 21 (10.0%) | 0 (0.0%) |
| Total | 1,667 (68.2%) | 72 (4.3%) |
Employment Status by Educational Attainment in Colonial Heights
According to labor force statistics for Colonial Heights, 87.2% of individuals (1,248) out of the total population between 25 and 64 years of age (1,431) are in the labor force, with 2.2% or 27 of them being unemployed. The group with the highest labor force participation rate are those with the educational attainment of bachelor's degree or higher, with 95.6% or 502 individuals in the labor force. Within the labor force, individuals with college / associate degree education have the highest percentage of unemployment, with 4.2% or 19 of them being unemployed.
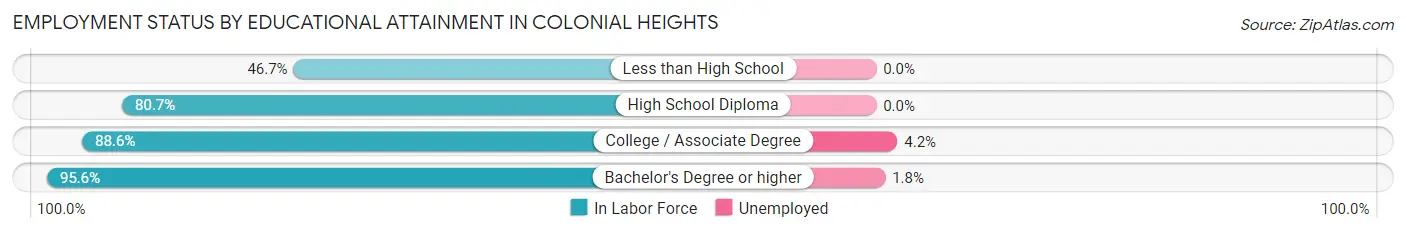
| Educational Attainment | In Labor Force | Unemployed |
| Less than High School | 35 (46.7%) | 0 (0.0%) |
| High School Diploma | 260 (80.7%) | 0 (0.0%) |
| College / Associate Degree | 451 (88.6%) | 21 (4.2%) |
| Bachelor's Degree or higher | 502 (95.6%) | 9 (1.8%) |
| Total | 1,248 (87.2%) | 31 (2.2%) |
Employment Occupations by Sex in Colonial Heights
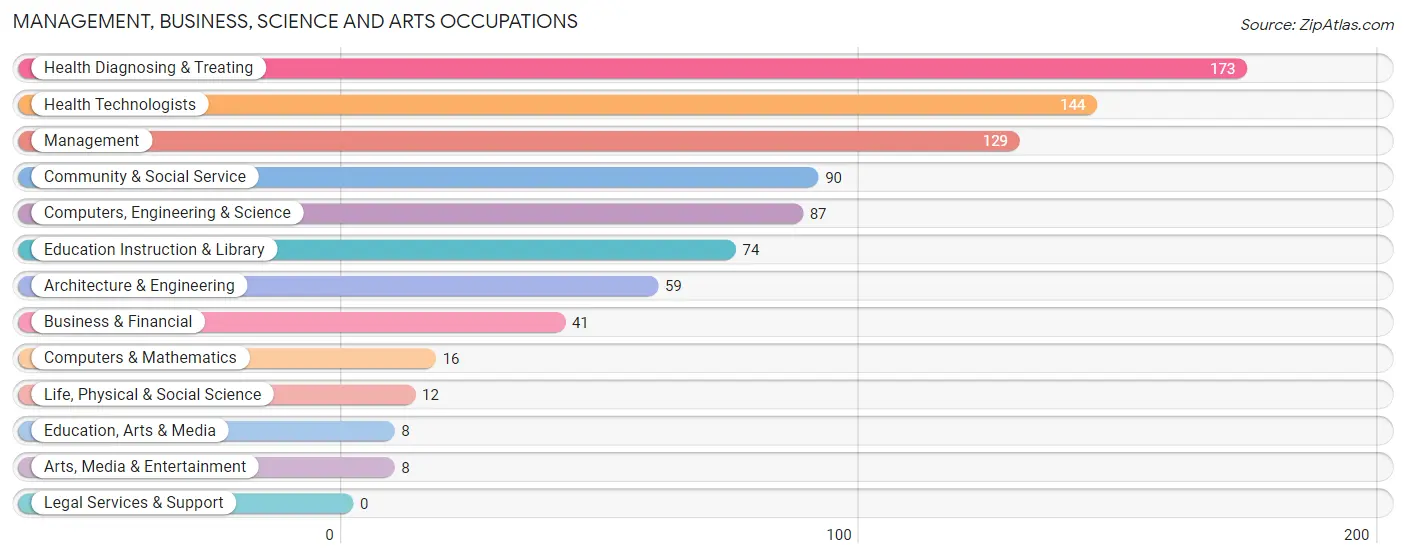
Management, Business, Science and Arts Occupations
The most common Management, Business, Science and Arts occupations in Colonial Heights are Health Diagnosing & Treating (173 | 10.8%), Health Technologists (144 | 9.0%), Management (129 | 8.1%), Community & Social Service (90 | 5.7%), and Computers, Engineering & Science (87 | 5.5%).
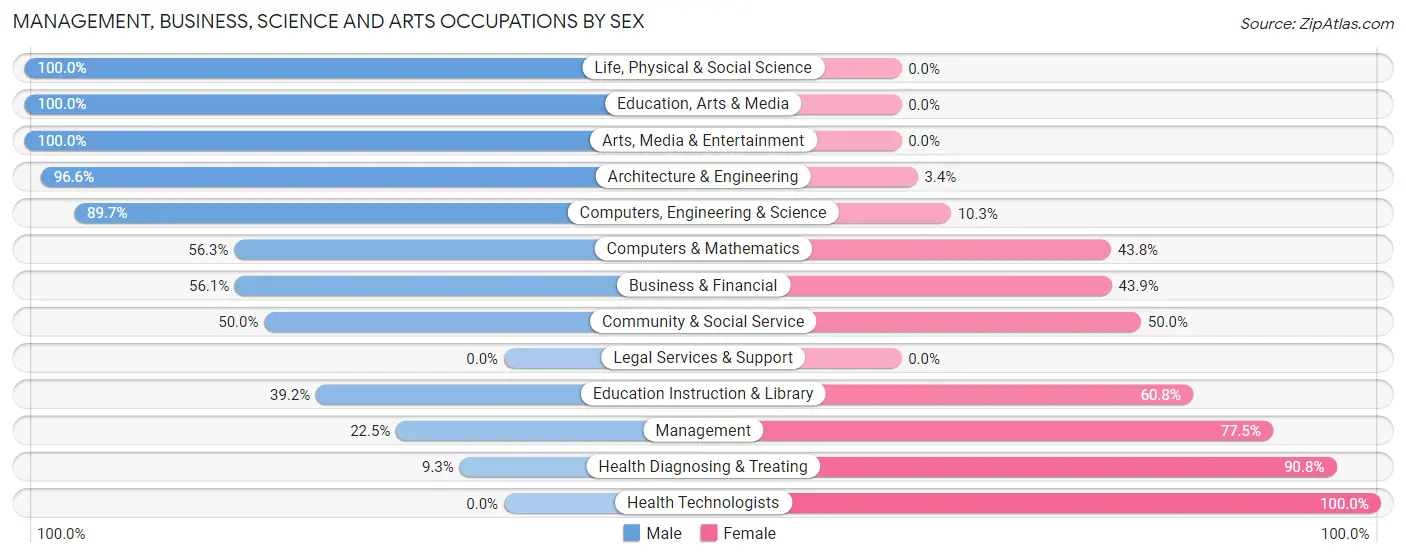
Management, Business, Science and Arts Occupations by Sex
Within the Management, Business, Science and Arts occupations in Colonial Heights, the most male-oriented occupations are Life, Physical & Social Science (100.0%), Education, Arts & Media (100.0%), and Arts, Media & Entertainment (100.0%), while the most female-oriented occupations are Health Technologists (100.0%), Health Diagnosing & Treating (90.7%), and Management (77.5%).
| Occupation | Male | Female |
| Management | 29 (22.5%) | 100 (77.5%) |
| Business & Financial | 23 (56.1%) | 18 (43.9%) |
| Computers, Engineering & Science | 78 (89.7%) | 9 (10.3%) |
| Computers & Mathematics | 9 (56.2%) | 7 (43.8%) |
| Architecture & Engineering | 57 (96.6%) | 2 (3.4%) |
| Life, Physical & Social Science | 12 (100.0%) | 0 (0.0%) |
| Community & Social Service | 45 (50.0%) | 45 (50.0%) |
| Education, Arts & Media | 8 (100.0%) | 0 (0.0%) |
| Legal Services & Support | 0 (0.0%) | 0 (0.0%) |
| Education Instruction & Library | 29 (39.2%) | 45 (60.8%) |
| Arts, Media & Entertainment | 8 (100.0%) | 0 (0.0%) |
| Health Diagnosing & Treating | 16 (9.2%) | 157 (90.7%) |
| Health Technologists | 0 (0.0%) | 144 (100.0%) |
| Total (Category) | 191 (36.7%) | 329 (63.3%) |
| Total (Overall) | 829 (52.0%) | 765 (48.0%) |
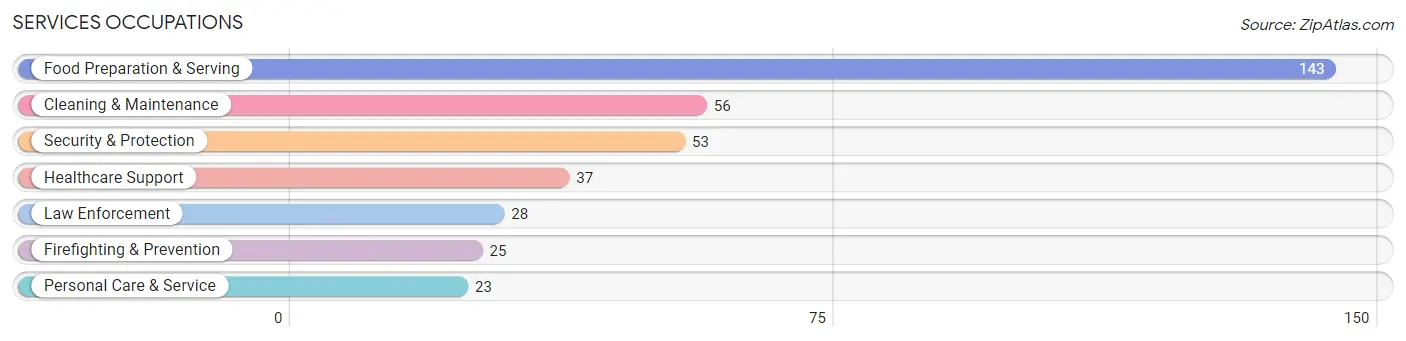
Services Occupations
The most common Services occupations in Colonial Heights are Food Preparation & Serving (143 | 9.0%), Cleaning & Maintenance (56 | 3.5%), Security & Protection (53 | 3.3%), Healthcare Support (37 | 2.3%), and Law Enforcement (28 | 1.8%).
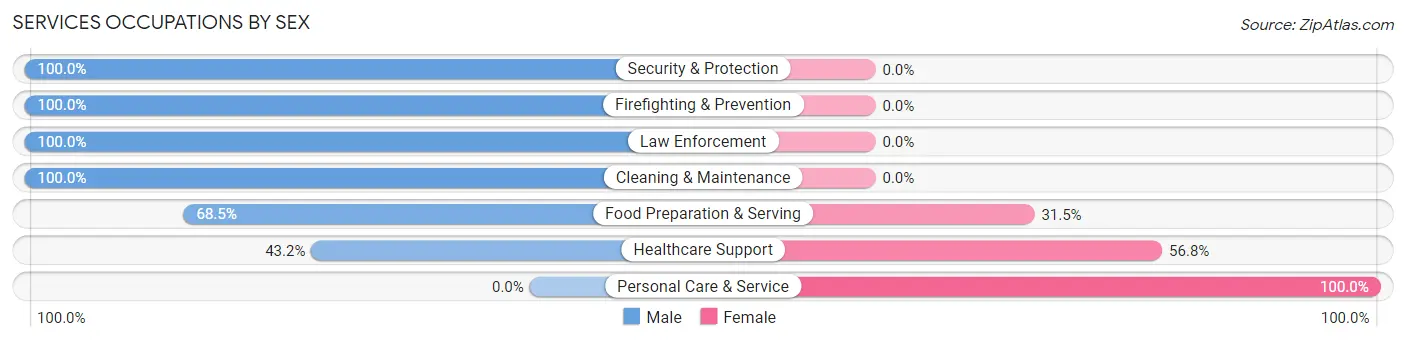
Services Occupations by Sex
Within the Services occupations in Colonial Heights, the most male-oriented occupations are Security & Protection (100.0%), Firefighting & Prevention (100.0%), and Law Enforcement (100.0%), while the most female-oriented occupations are Personal Care & Service (100.0%), Healthcare Support (56.8%), and Food Preparation & Serving (31.5%).
| Occupation | Male | Female |
| Healthcare Support | 16 (43.2%) | 21 (56.8%) |
| Security & Protection | 53 (100.0%) | 0 (0.0%) |
| Firefighting & Prevention | 25 (100.0%) | 0 (0.0%) |
| Law Enforcement | 28 (100.0%) | 0 (0.0%) |
| Food Preparation & Serving | 98 (68.5%) | 45 (31.5%) |
| Cleaning & Maintenance | 56 (100.0%) | 0 (0.0%) |
| Personal Care & Service | 0 (0.0%) | 23 (100.0%) |
| Total (Category) | 223 (71.5%) | 89 (28.5%) |
| Total (Overall) | 829 (52.0%) | 765 (48.0%) |
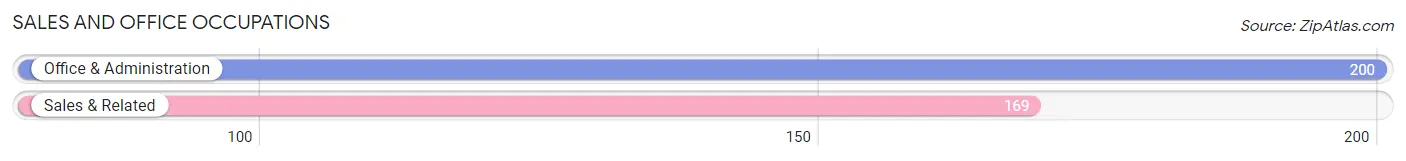
Sales and Office Occupations
The most common Sales and Office occupations in Colonial Heights are Office & Administration (200 | 12.6%), and Sales & Related (169 | 10.6%).
Sales and Office Occupations by Sex
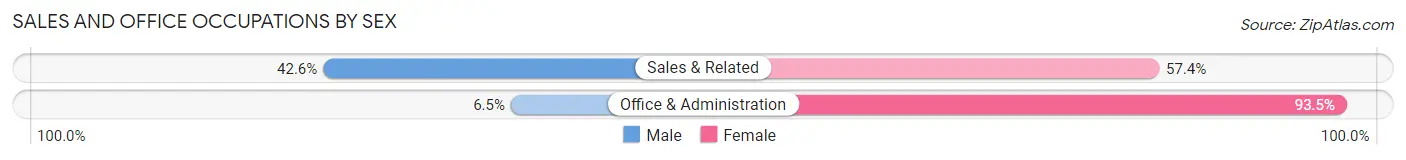
| Occupation | Male | Female |
| Sales & Related | 72 (42.6%) | 97 (57.4%) |
| Office & Administration | 13 (6.5%) | 187 (93.5%) |
| Total (Category) | 85 (23.0%) | 284 (77.0%) |
| Total (Overall) | 829 (52.0%) | 765 (48.0%) |
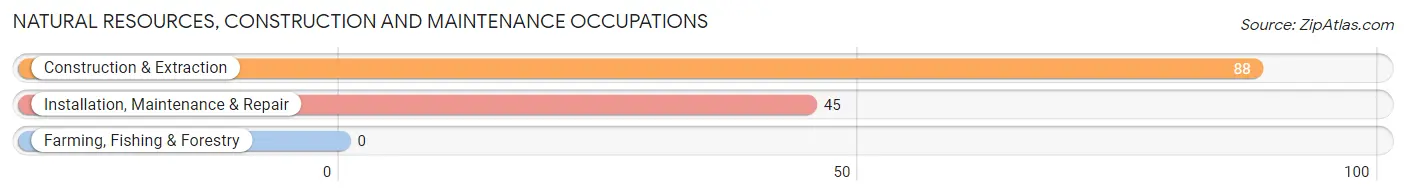
Natural Resources, Construction and Maintenance Occupations
The most common Natural Resources, Construction and Maintenance occupations in Colonial Heights are Construction & Extraction (88 | 5.5%), and Installation, Maintenance & Repair (45 | 2.8%).
Natural Resources, Construction and Maintenance Occupations by Sex
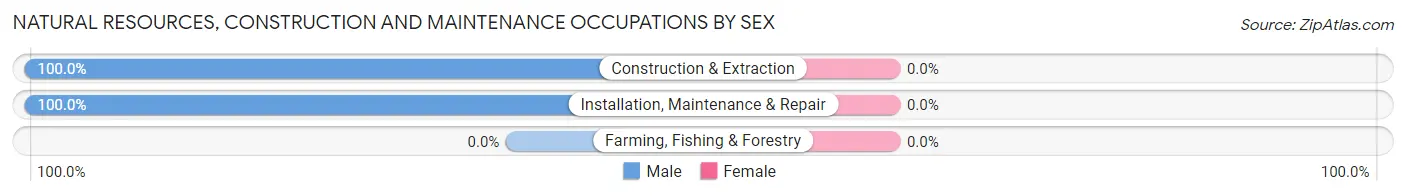
| Occupation | Male | Female |
| Farming, Fishing & Forestry | 0 (0.0%) | 0 (0.0%) |
| Construction & Extraction | 88 (100.0%) | 0 (0.0%) |
| Installation, Maintenance & Repair | 45 (100.0%) | 0 (0.0%) |
| Total (Category) | 133 (100.0%) | 0 (0.0%) |
| Total (Overall) | 829 (52.0%) | 765 (48.0%) |
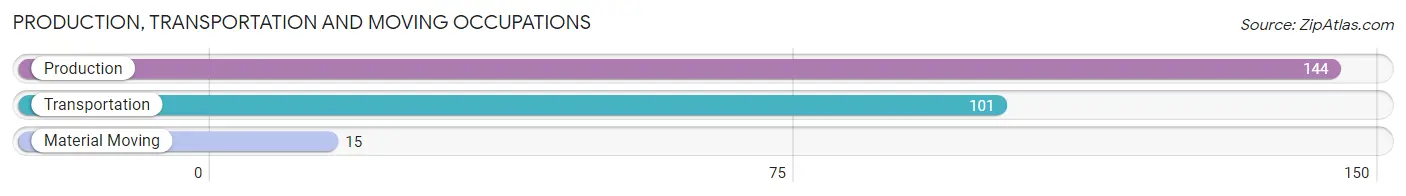
Production, Transportation and Moving Occupations
The most common Production, Transportation and Moving occupations in Colonial Heights are Production (144 | 9.0%), Transportation (101 | 6.3%), and Material Moving (15 | 0.9%).
Production, Transportation and Moving Occupations by Sex
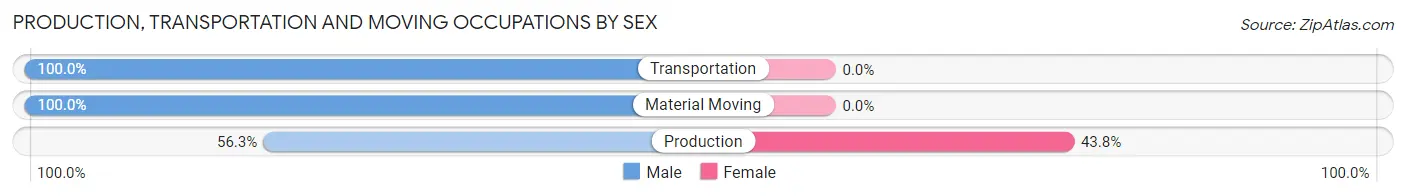
| Occupation | Male | Female |
| Production | 81 (56.2%) | 63 (43.8%) |
| Transportation | 101 (100.0%) | 0 (0.0%) |
| Material Moving | 15 (100.0%) | 0 (0.0%) |
| Total (Category) | 197 (75.8%) | 63 (24.2%) |
| Total (Overall) | 829 (52.0%) | 765 (48.0%) |
Employment Industries by Sex in Colonial Heights
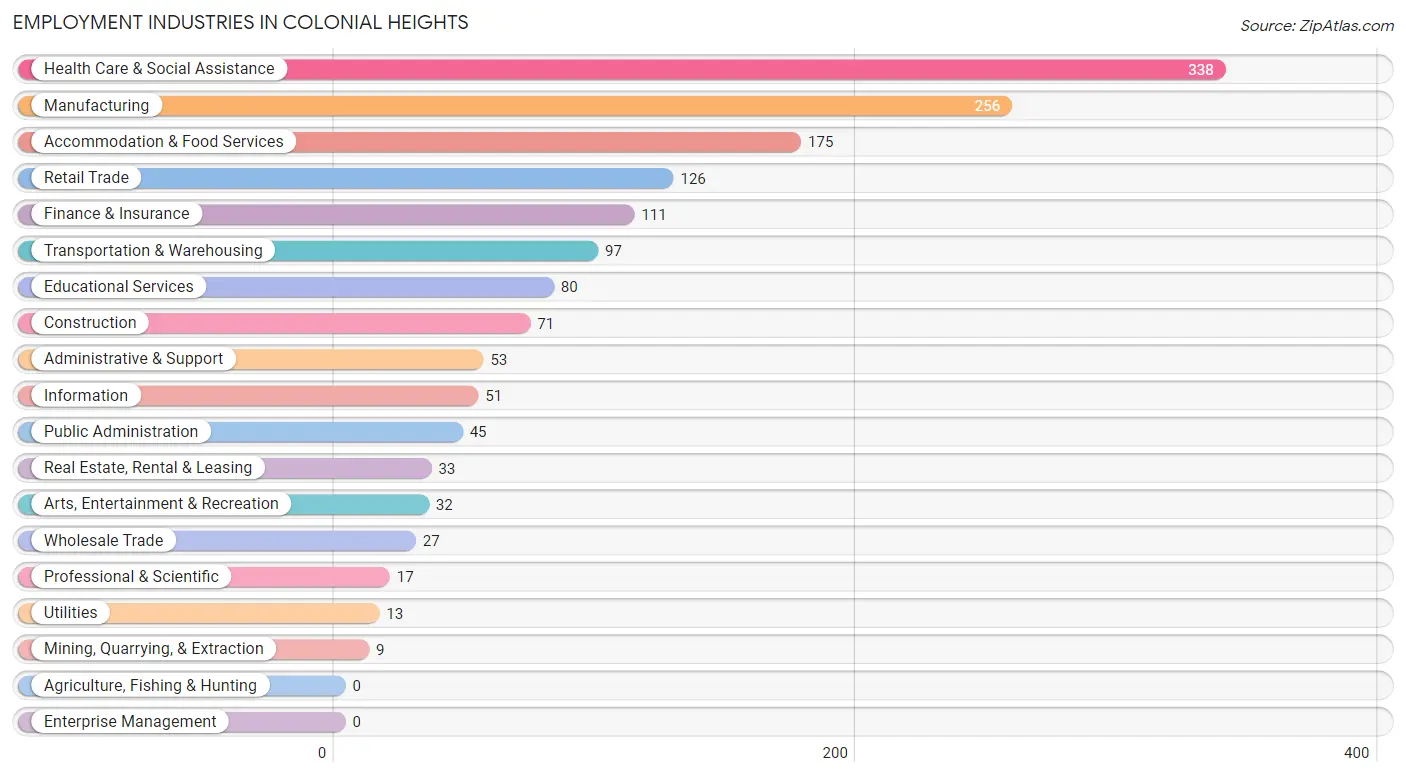
Employment Industries in Colonial Heights
The major employment industries in Colonial Heights include Health Care & Social Assistance (338 | 21.2%), Manufacturing (256 | 16.1%), Accommodation & Food Services (175 | 11.0%), Retail Trade (126 | 7.9%), and Finance & Insurance (111 | 7.0%).
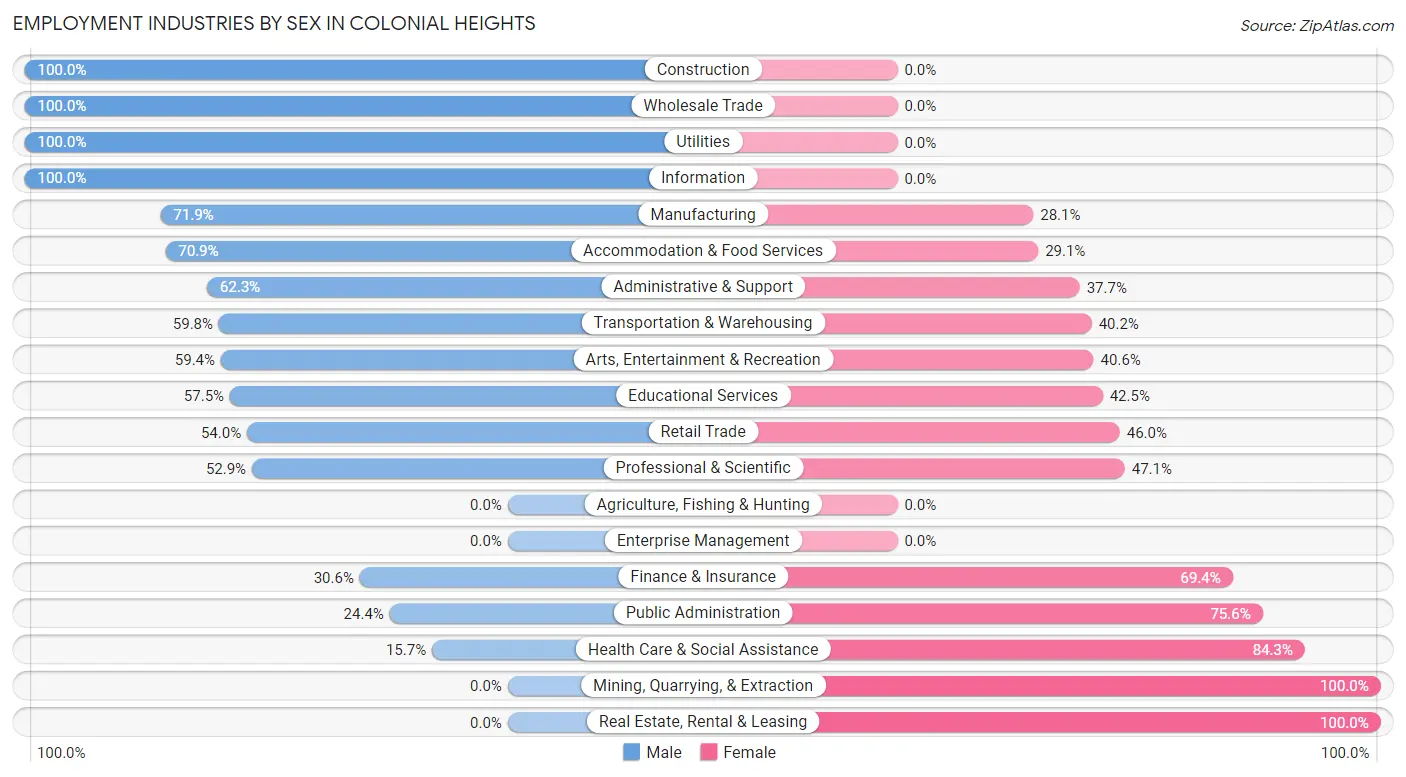
Employment Industries by Sex in Colonial Heights
The Colonial Heights industries that see more men than women are Construction (100.0%), Wholesale Trade (100.0%), and Utilities (100.0%), whereas the industries that tend to have a higher number of women are Mining, Quarrying, & Extraction (100.0%), Real Estate, Rental & Leasing (100.0%), and Health Care & Social Assistance (84.3%).
| Industry | Male | Female |
| Agriculture, Fishing & Hunting | 0 (0.0%) | 0 (0.0%) |
| Mining, Quarrying, & Extraction | 0 (0.0%) | 9 (100.0%) |
| Construction | 71 (100.0%) | 0 (0.0%) |
| Manufacturing | 184 (71.9%) | 72 (28.1%) |
| Wholesale Trade | 27 (100.0%) | 0 (0.0%) |
| Retail Trade | 68 (54.0%) | 58 (46.0%) |
| Transportation & Warehousing | 58 (59.8%) | 39 (40.2%) |
| Utilities | 13 (100.0%) | 0 (0.0%) |
| Information | 51 (100.0%) | 0 (0.0%) |
| Finance & Insurance | 34 (30.6%) | 77 (69.4%) |
| Real Estate, Rental & Leasing | 0 (0.0%) | 33 (100.0%) |
| Professional & Scientific | 9 (52.9%) | 8 (47.1%) |
| Enterprise Management | 0 (0.0%) | 0 (0.0%) |
| Administrative & Support | 33 (62.3%) | 20 (37.7%) |
| Educational Services | 46 (57.5%) | 34 (42.5%) |
| Health Care & Social Assistance | 53 (15.7%) | 285 (84.3%) |
| Arts, Entertainment & Recreation | 19 (59.4%) | 13 (40.6%) |
| Accommodation & Food Services | 124 (70.9%) | 51 (29.1%) |
| Public Administration | 11 (24.4%) | 34 (75.6%) |
| Total | 829 (52.0%) | 765 (48.0%) |
Education in Colonial Heights
School Enrollment in Colonial Heights
The most common levels of schooling among the 355 students in Colonial Heights are college / undergraduate (144 | 40.6%), high school (129 | 36.3%), and middle school (36 | 10.1%).
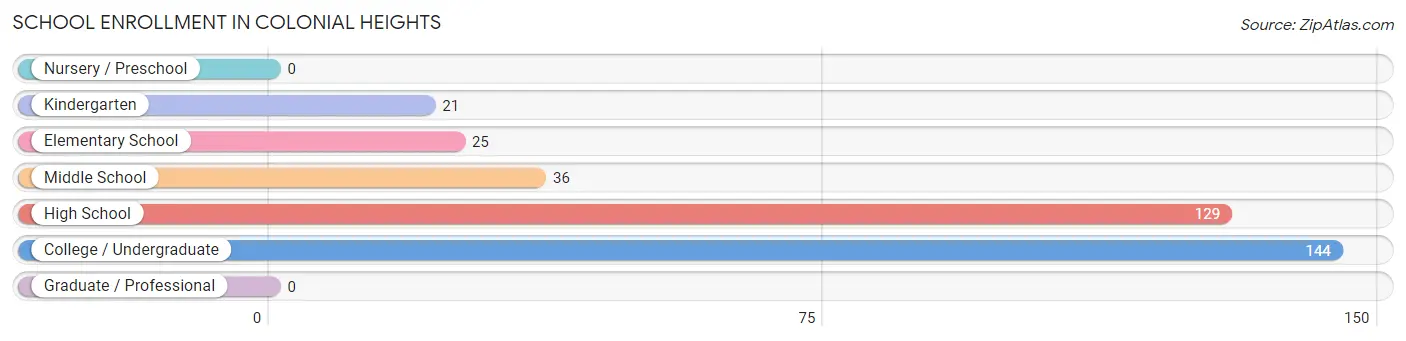
| School Level | # Students | % Students |
| Nursery / Preschool | 0 | 0.0% |
| Kindergarten | 21 | 5.9% |
| Elementary School | 25 | 7.0% |
| Middle School | 36 | 10.1% |
| High School | 129 | 36.3% |
| College / Undergraduate | 144 | 40.6% |
| Graduate / Professional | 0 | 0.0% |
| Total | 355 | 100.0% |
School Enrollment by Age by Funding Source in Colonial Heights
Out of a total of 355 students who are enrolled in schools in Colonial Heights, 43 (12.1%) attend a private institution, while the remaining 312 (87.9%) are enrolled in public schools. The age group of 18 to 19 year olds has the highest likelihood of being enrolled in private schools, with 34 (35.8% in the age bracket) enrolled. Conversely, the age group of 15 to 17 year olds has the lowest likelihood of being enrolled in a private school, with 91 (100.0% in the age bracket) attending a public institution.
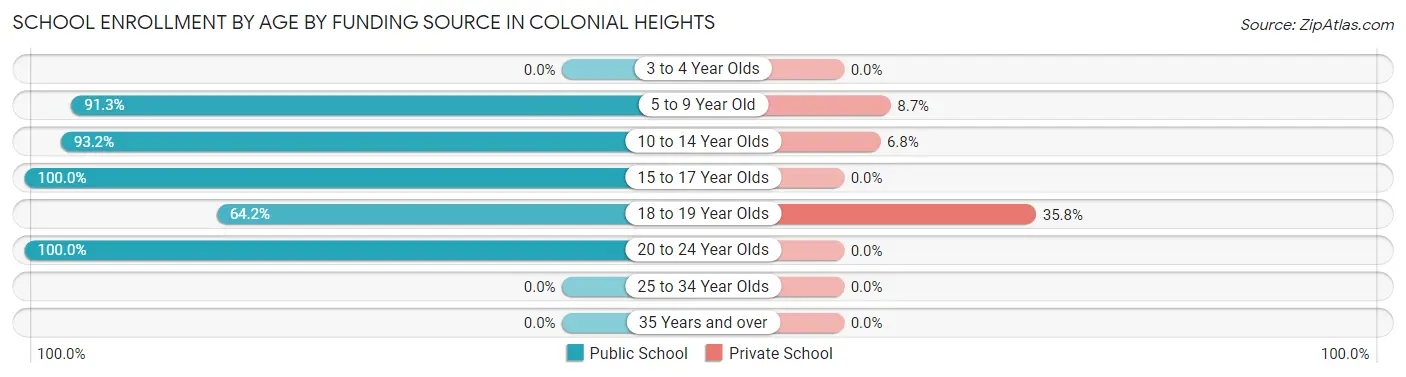
| Age Bracket | Public School | Private School |
| 3 to 4 Year Olds | 0 (0.0%) | 0 (0.0%) |
| 5 to 9 Year Old | 42 (91.3%) | 4 (8.7%) |
| 10 to 14 Year Olds | 69 (93.2%) | 5 (6.8%) |
| 15 to 17 Year Olds | 91 (100.0%) | 0 (0.0%) |
| 18 to 19 Year Olds | 61 (64.2%) | 34 (35.8%) |
| 20 to 24 Year Olds | 49 (100.0%) | 0 (0.0%) |
| 25 to 34 Year Olds | 0 (0.0%) | 0 (0.0%) |
| 35 Years and over | 0 (0.0%) | 0 (0.0%) |
| Total | 312 (87.9%) | 43 (12.1%) |
Educational Attainment by Field of Study in Colonial Heights
Science & technology (125 | 17.8%), education (117 | 16.6%), engineering (102 | 14.5%), business (98 | 13.9%), and arts & humanities (74 | 10.5%) are the most common fields of study among 703 individuals in Colonial Heights who have obtained a bachelor's degree or higher.
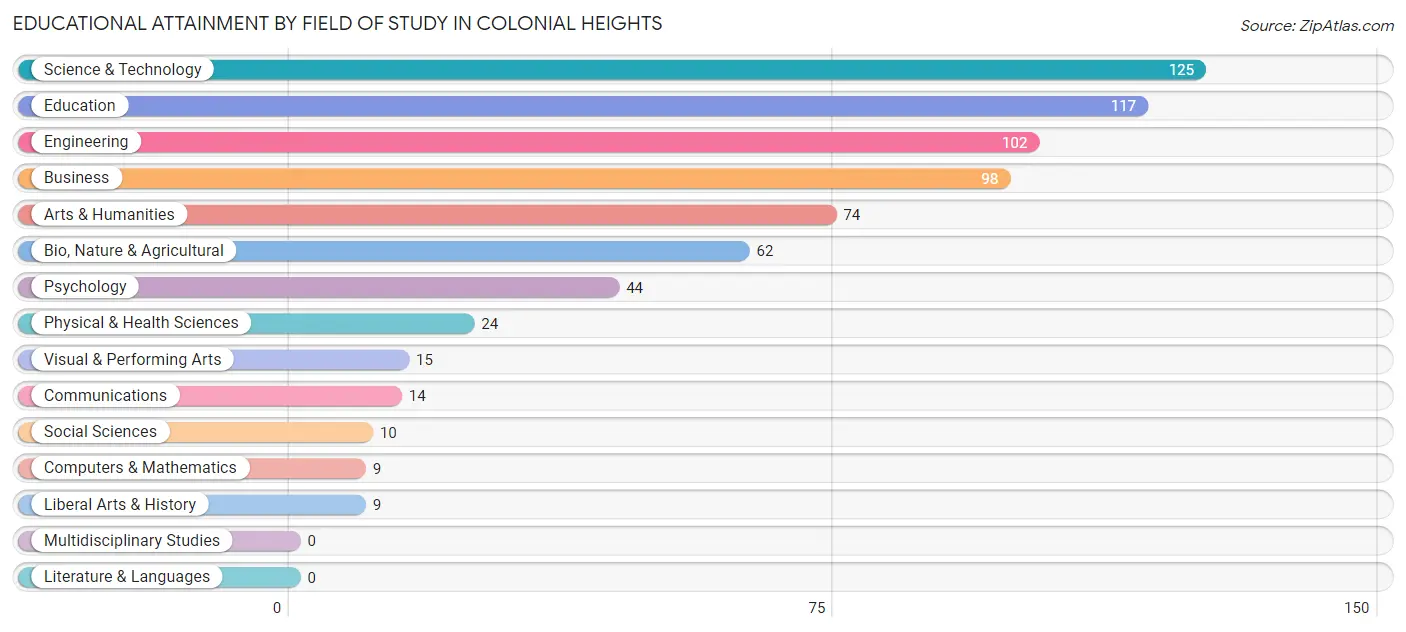
| Field of Study | # Graduates | % Graduates |
| Computers & Mathematics | 9 | 1.3% |
| Bio, Nature & Agricultural | 62 | 8.8% |
| Physical & Health Sciences | 24 | 3.4% |
| Psychology | 44 | 6.3% |
| Social Sciences | 10 | 1.4% |
| Engineering | 102 | 14.5% |
| Multidisciplinary Studies | 0 | 0.0% |
| Science & Technology | 125 | 17.8% |
| Business | 98 | 13.9% |
| Education | 117 | 16.6% |
| Literature & Languages | 0 | 0.0% |
| Liberal Arts & History | 9 | 1.3% |
| Visual & Performing Arts | 15 | 2.1% |
| Communications | 14 | 2.0% |
| Arts & Humanities | 74 | 10.5% |
| Total | 703 | 100.0% |
Transportation & Commute in Colonial Heights
Vehicle Availability by Sex in Colonial Heights
The most prevalent vehicle ownership categories in Colonial Heights are males with 2 vehicles (262, accounting for 32.9%) and females with 2 vehicles (309, making up 35.8%).
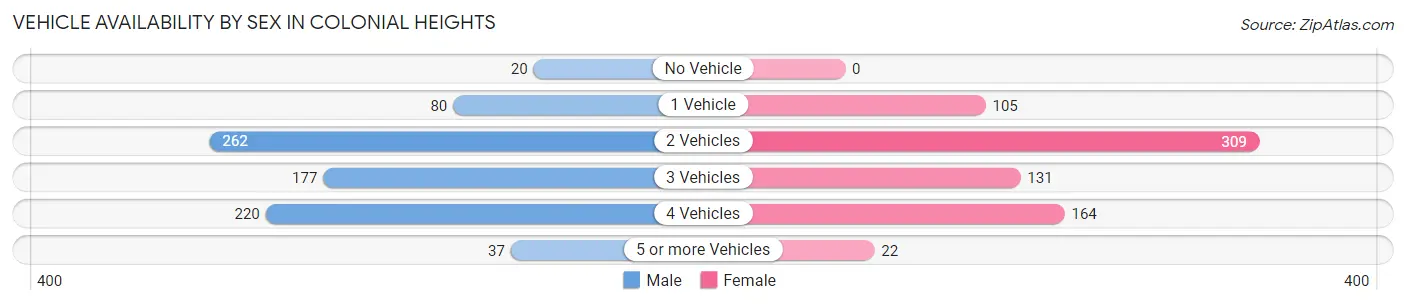
| Vehicles Available | Male | Female |
| No Vehicle | 20 (2.5%) | 0 (0.0%) |
| 1 Vehicle | 80 (10.1%) | 105 (14.4%) |
| 2 Vehicles | 262 (32.9%) | 309 (42.3%) |
| 3 Vehicles | 177 (22.2%) | 131 (17.9%) |
| 4 Vehicles | 220 (27.6%) | 164 (22.4%) |
| 5 or more Vehicles | 37 (4.6%) | 22 (3.0%) |
| Total | 796 (100.0%) | 731 (100.0%) |
Commute Time in Colonial Heights
The most frequently occuring commute durations in Colonial Heights are 20 to 24 minutes (291 commuters, 21.2%), 15 to 19 minutes (273 commuters, 19.9%), and 10 to 14 minutes (213 commuters, 15.5%).
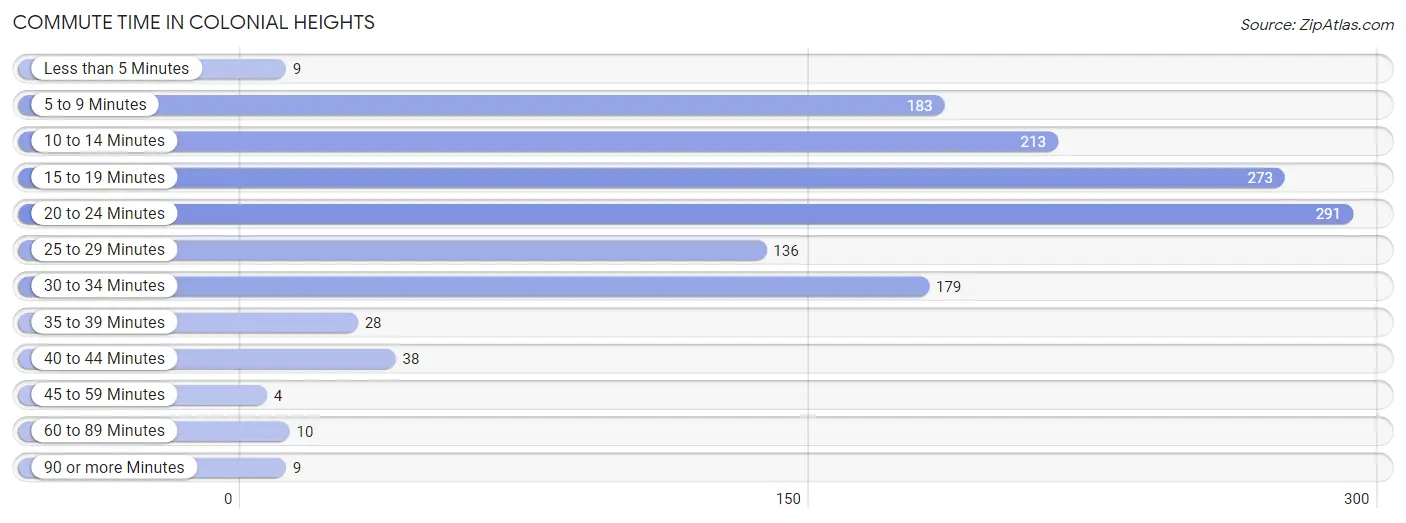
| Commute Time | # Commuters | % Commuters |
| Less than 5 Minutes | 9 | 0.7% |
| 5 to 9 Minutes | 183 | 13.3% |
| 10 to 14 Minutes | 213 | 15.5% |
| 15 to 19 Minutes | 273 | 19.9% |
| 20 to 24 Minutes | 291 | 21.2% |
| 25 to 29 Minutes | 136 | 9.9% |
| 30 to 34 Minutes | 179 | 13.0% |
| 35 to 39 Minutes | 28 | 2.0% |
| 40 to 44 Minutes | 38 | 2.8% |
| 45 to 59 Minutes | 4 | 0.3% |
| 60 to 89 Minutes | 10 | 0.7% |
| 90 or more Minutes | 9 | 0.7% |
Commute Time by Sex in Colonial Heights
The most common commute times in Colonial Heights are 10 to 14 minutes (169 commuters, 23.4%) for males and 20 to 24 minutes (178 commuters, 27.3%) for females.
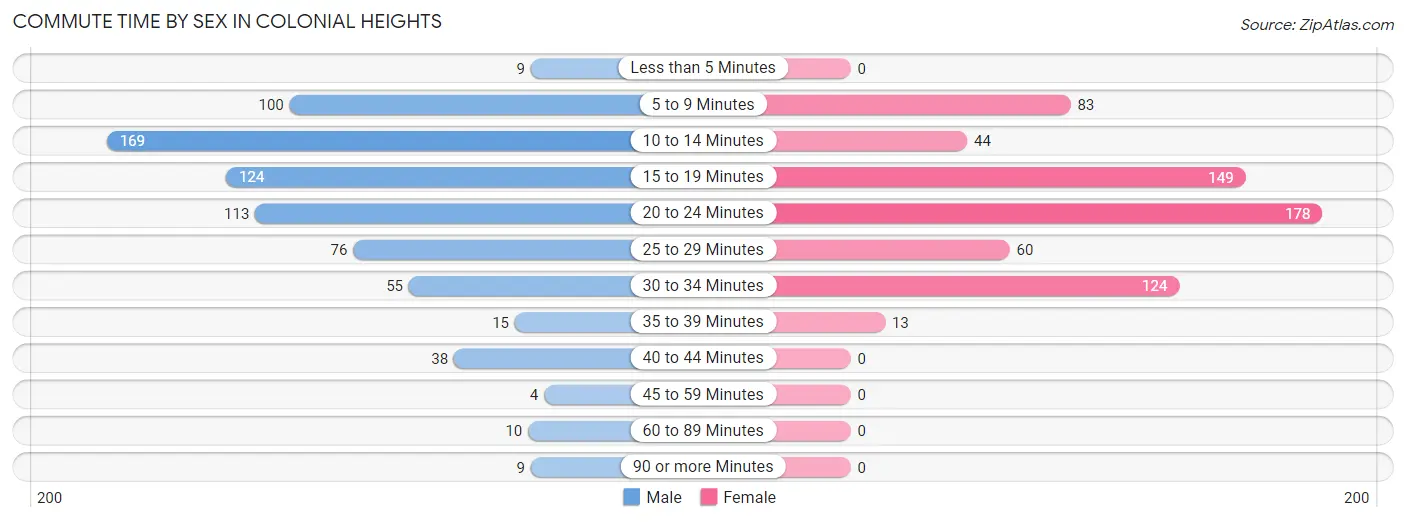
| Commute Time | Male | Female |
| Less than 5 Minutes | 9 (1.3%) | 0 (0.0%) |
| 5 to 9 Minutes | 100 (13.9%) | 83 (12.8%) |
| 10 to 14 Minutes | 169 (23.4%) | 44 (6.8%) |
| 15 to 19 Minutes | 124 (17.2%) | 149 (22.9%) |
| 20 to 24 Minutes | 113 (15.7%) | 178 (27.3%) |
| 25 to 29 Minutes | 76 (10.5%) | 60 (9.2%) |
| 30 to 34 Minutes | 55 (7.6%) | 124 (19.1%) |
| 35 to 39 Minutes | 15 (2.1%) | 13 (2.0%) |
| 40 to 44 Minutes | 38 (5.3%) | 0 (0.0%) |
| 45 to 59 Minutes | 4 (0.5%) | 0 (0.0%) |
| 60 to 89 Minutes | 10 (1.4%) | 0 (0.0%) |
| 90 or more Minutes | 9 (1.3%) | 0 (0.0%) |
Time of Departure to Work by Sex in Colonial Heights
The most frequent times of departure to work in Colonial Heights are 6:30 AM to 6:59 AM (161, 22.3%) for males and 5:30 AM to 5:59 AM (139, 21.3%) for females.
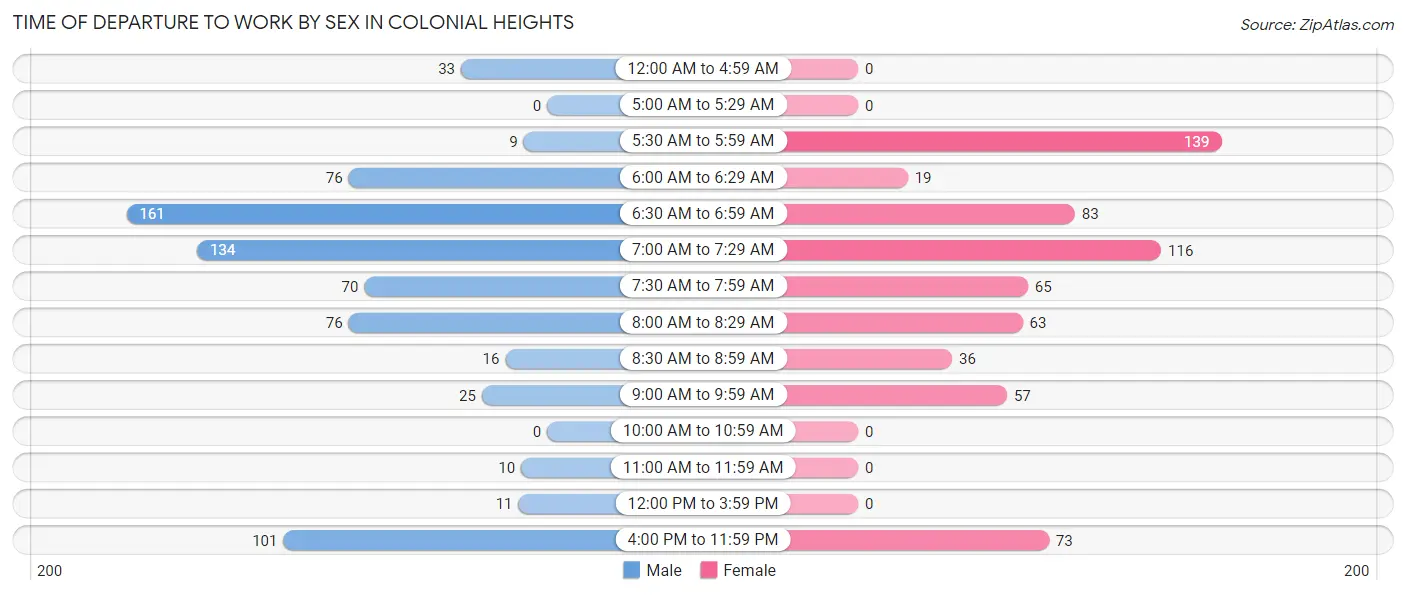
| Time of Departure | Male | Female |
| 12:00 AM to 4:59 AM | 33 (4.6%) | 0 (0.0%) |
| 5:00 AM to 5:29 AM | 0 (0.0%) | 0 (0.0%) |
| 5:30 AM to 5:59 AM | 9 (1.3%) | 139 (21.3%) |
| 6:00 AM to 6:29 AM | 76 (10.5%) | 19 (2.9%) |
| 6:30 AM to 6:59 AM | 161 (22.3%) | 83 (12.8%) |
| 7:00 AM to 7:29 AM | 134 (18.6%) | 116 (17.8%) |
| 7:30 AM to 7:59 AM | 70 (9.7%) | 65 (10.0%) |
| 8:00 AM to 8:29 AM | 76 (10.5%) | 63 (9.7%) |
| 8:30 AM to 8:59 AM | 16 (2.2%) | 36 (5.5%) |
| 9:00 AM to 9:59 AM | 25 (3.5%) | 57 (8.8%) |
| 10:00 AM to 10:59 AM | 0 (0.0%) | 0 (0.0%) |
| 11:00 AM to 11:59 AM | 10 (1.4%) | 0 (0.0%) |
| 12:00 PM to 3:59 PM | 11 (1.5%) | 0 (0.0%) |
| 4:00 PM to 11:59 PM | 101 (14.0%) | 73 (11.2%) |
| Total | 722 (100.0%) | 651 (100.0%) |
Housing Occupancy in Colonial Heights
Occupancy by Ownership in Colonial Heights
Of the total 1,267 dwellings in Colonial Heights, owner-occupied units account for 1,132 (89.3%), while renter-occupied units make up 135 (10.7%).
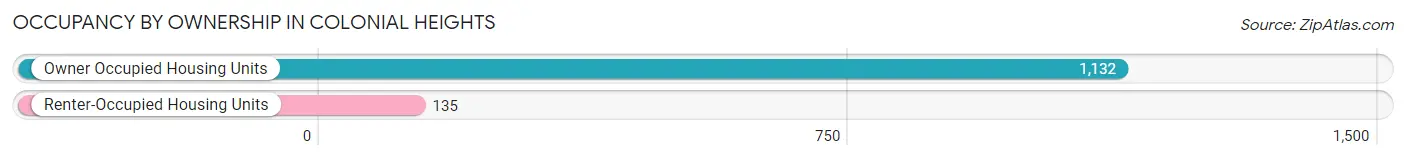
| Occupancy | # Housing Units | % Housing Units |
| Owner Occupied Housing Units | 1,132 | 89.3% |
| Renter-Occupied Housing Units | 135 | 10.7% |
| Total Occupied Housing Units | 1,267 | 100.0% |
Occupancy by Household Size in Colonial Heights
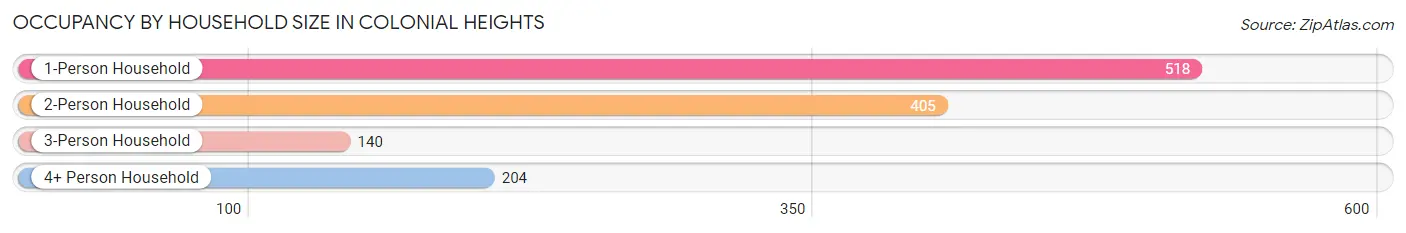
| Household Size | # Housing Units | % Housing Units |
| 1-Person Household | 518 | 40.9% |
| 2-Person Household | 405 | 32.0% |
| 3-Person Household | 140 | 11.1% |
| 4+ Person Household | 204 | 16.1% |
| Total Housing Units | 1,267 | 100.0% |
Occupancy by Ownership by Household Size in Colonial Heights
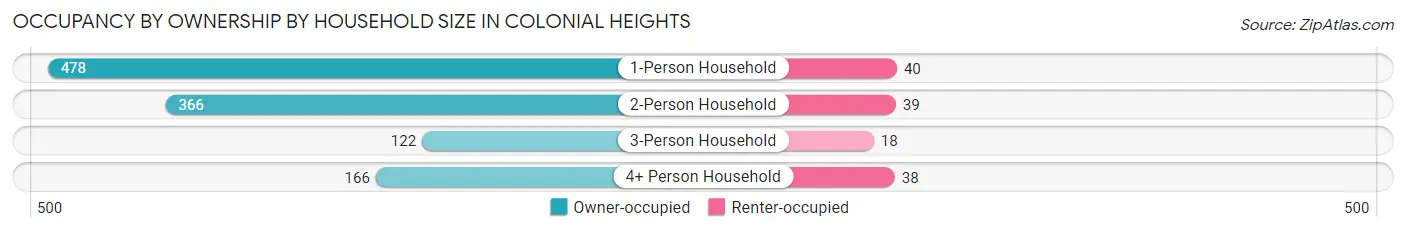
| Household Size | Owner-occupied | Renter-occupied |
| 1-Person Household | 478 (92.3%) | 40 (7.7%) |
| 2-Person Household | 366 (90.4%) | 39 (9.6%) |
| 3-Person Household | 122 (87.1%) | 18 (12.9%) |
| 4+ Person Household | 166 (81.4%) | 38 (18.6%) |
| Total Housing Units | 1,132 (89.3%) | 135 (10.7%) |
Occupancy by Educational Attainment in Colonial Heights
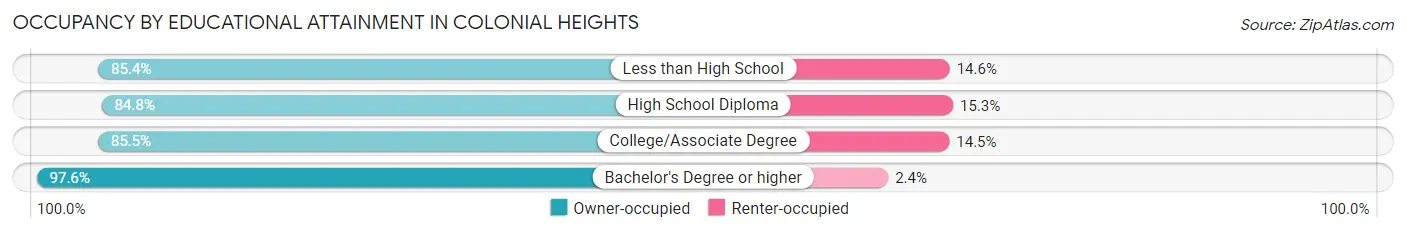
| Household Size | Owner-occupied | Renter-occupied |
| Less than High School | 82 (85.4%) | 14 (14.6%) |
| High School Diploma | 200 (84.8%) | 36 (15.2%) |
| College/Associate Degree | 442 (85.5%) | 75 (14.5%) |
| Bachelor's Degree or higher | 408 (97.6%) | 10 (2.4%) |
Occupancy by Age of Householder in Colonial Heights
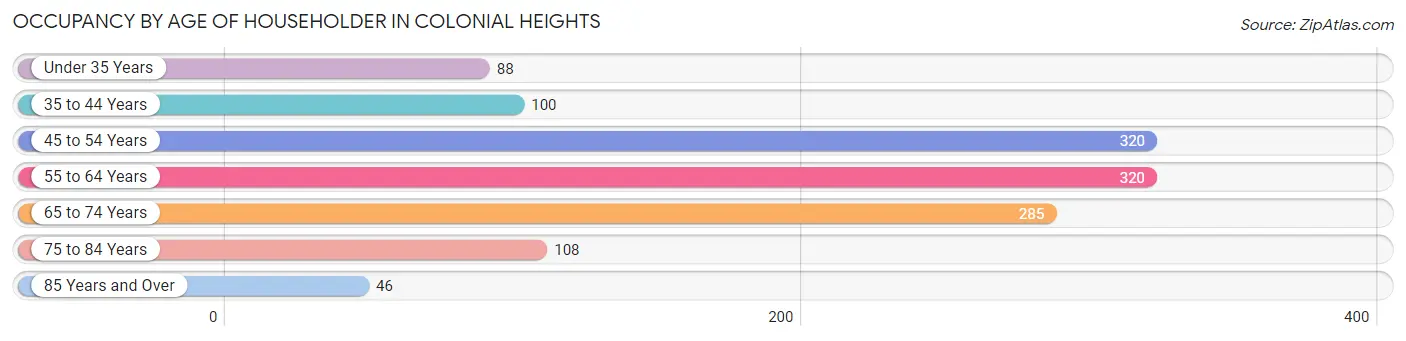
| Age Bracket | # Households | % Households |
| Under 35 Years | 88 | 7.0% |
| 35 to 44 Years | 100 | 7.9% |
| 45 to 54 Years | 320 | 25.3% |
| 55 to 64 Years | 320 | 25.3% |
| 65 to 74 Years | 285 | 22.5% |
| 75 to 84 Years | 108 | 8.5% |
| 85 Years and Over | 46 | 3.6% |
| Total | 1,267 | 100.0% |
Housing Finances in Colonial Heights
Median Income by Occupancy in Colonial Heights
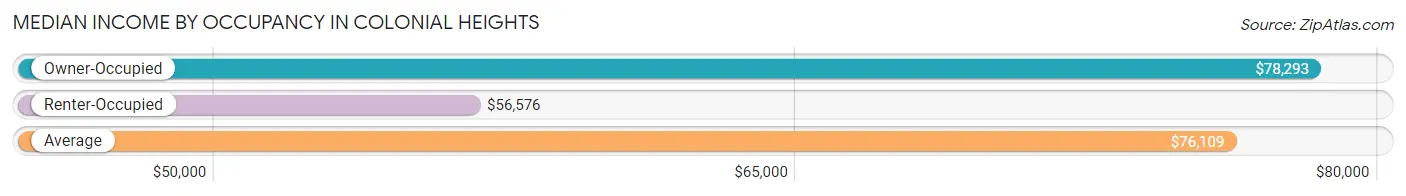
| Occupancy Type | # Households | Median Income |
| Owner-Occupied | 1,132 (89.3%) | $78,293 |
| Renter-Occupied | 135 (10.7%) | $56,576 |
| Average | 1,267 (100.0%) | $76,109 |
Occupancy by Householder Income Bracket in Colonial Heights
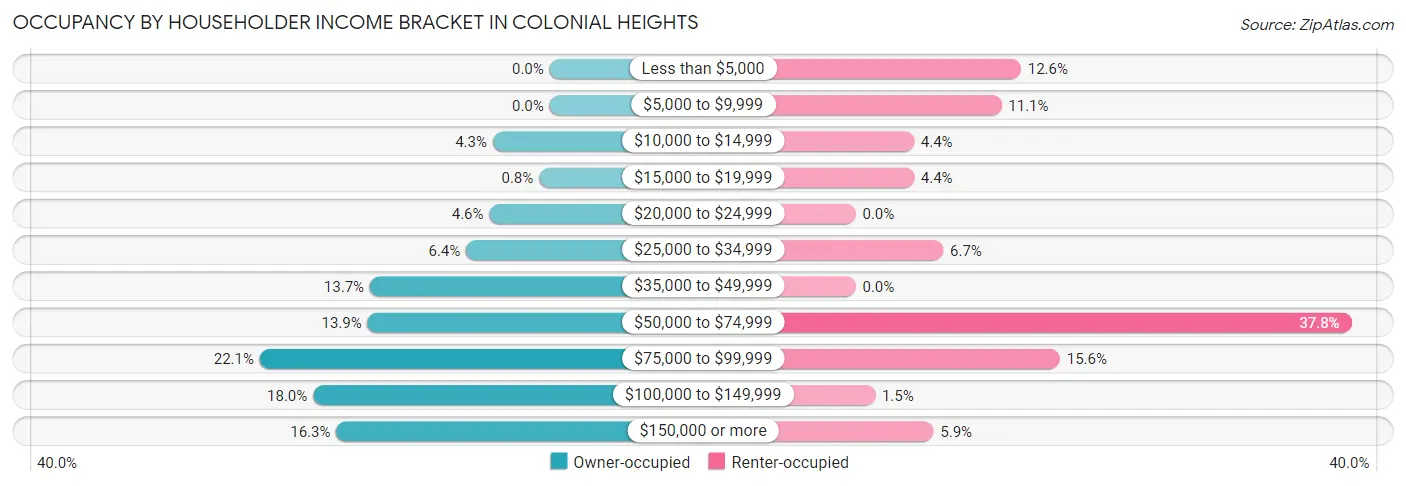
| Income Bracket | Owner-occupied | Renter-occupied |
| Less than $5,000 | 0 (0.0%) | 17 (12.6%) |
| $5,000 to $9,999 | 0 (0.0%) | 15 (11.1%) |
| $10,000 to $14,999 | 49 (4.3%) | 6 (4.4%) |
| $15,000 to $19,999 | 9 (0.8%) | 6 (4.4%) |
| $20,000 to $24,999 | 52 (4.6%) | 0 (0.0%) |
| $25,000 to $34,999 | 72 (6.4%) | 9 (6.7%) |
| $35,000 to $49,999 | 155 (13.7%) | 0 (0.0%) |
| $50,000 to $74,999 | 157 (13.9%) | 51 (37.8%) |
| $75,000 to $99,999 | 250 (22.1%) | 21 (15.6%) |
| $100,000 to $149,999 | 204 (18.0%) | 2 (1.5%) |
| $150,000 or more | 184 (16.3%) | 8 (5.9%) |
| Total | 1,132 (100.0%) | 135 (100.0%) |
Monthly Housing Cost Tiers in Colonial Heights
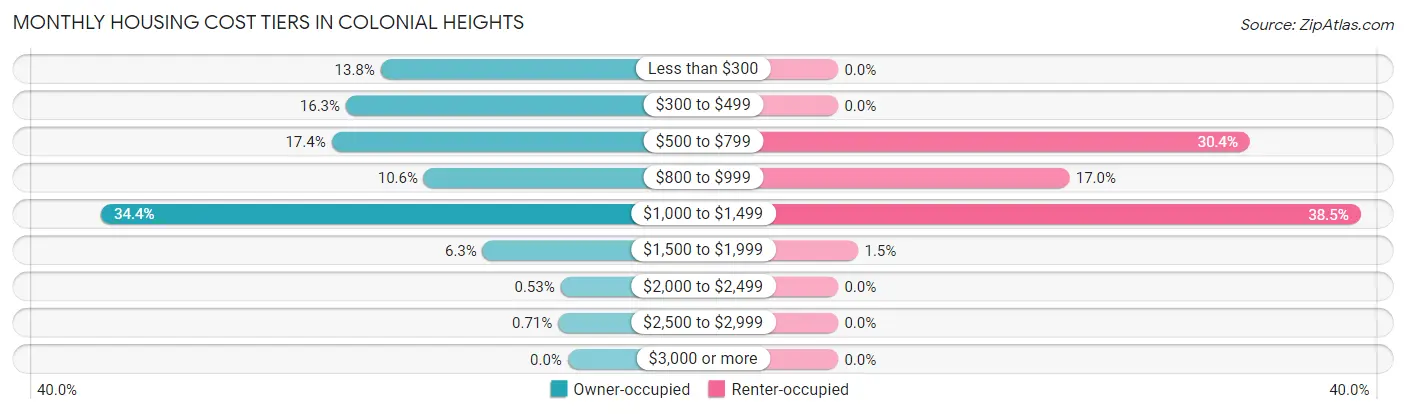
| Monthly Cost | Owner-occupied | Renter-occupied |
| Less than $300 | 156 (13.8%) | 0 (0.0%) |
| $300 to $499 | 185 (16.3%) | 0 (0.0%) |
| $500 to $799 | 197 (17.4%) | 41 (30.4%) |
| $800 to $999 | 120 (10.6%) | 23 (17.0%) |
| $1,000 to $1,499 | 389 (34.4%) | 52 (38.5%) |
| $1,500 to $1,999 | 71 (6.3%) | 2 (1.5%) |
| $2,000 to $2,499 | 6 (0.5%) | 0 (0.0%) |
| $2,500 to $2,999 | 8 (0.7%) | 0 (0.0%) |
| $3,000 or more | 0 (0.0%) | 0 (0.0%) |
| Total | 1,132 (100.0%) | 135 (100.0%) |
Physical Housing Characteristics in Colonial Heights
Housing Structures in Colonial Heights
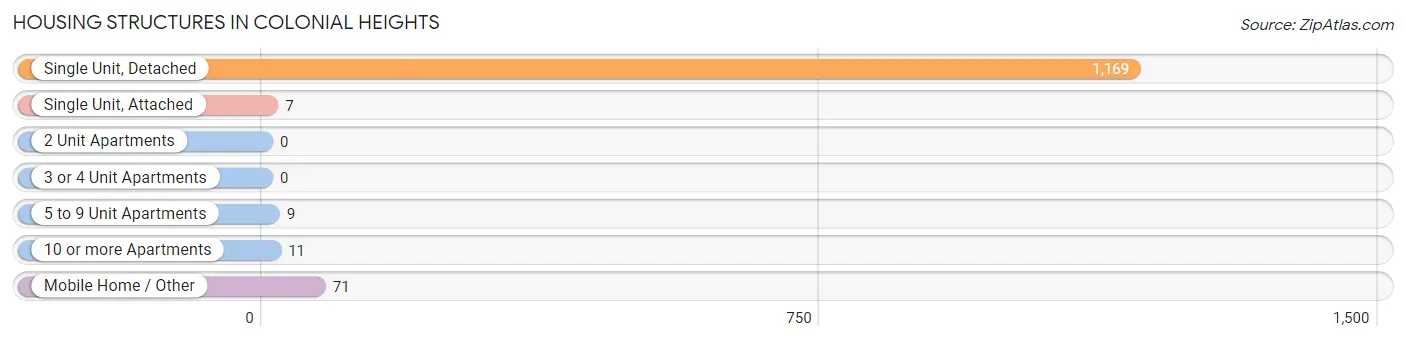
| Structure Type | # Housing Units | % Housing Units |
| Single Unit, Detached | 1,169 | 92.3% |
| Single Unit, Attached | 7 | 0.5% |
| 2 Unit Apartments | 0 | 0.0% |
| 3 or 4 Unit Apartments | 0 | 0.0% |
| 5 to 9 Unit Apartments | 9 | 0.7% |
| 10 or more Apartments | 11 | 0.9% |
| Mobile Home / Other | 71 | 5.6% |
| Total | 1,267 | 100.0% |
Housing Structures by Occupancy in Colonial Heights
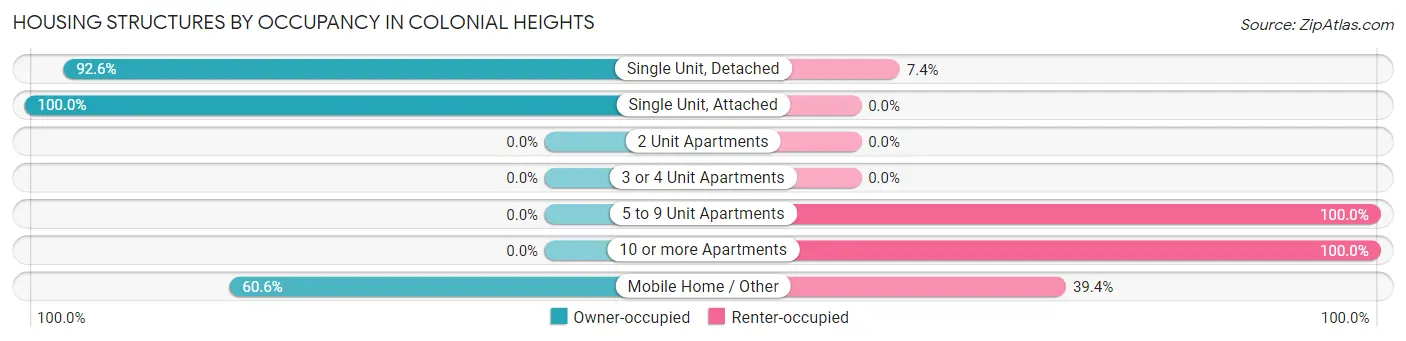
| Structure Type | Owner-occupied | Renter-occupied |
| Single Unit, Detached | 1,082 (92.6%) | 87 (7.4%) |
| Single Unit, Attached | 7 (100.0%) | 0 (0.0%) |
| 2 Unit Apartments | 0 (0.0%) | 0 (0.0%) |
| 3 or 4 Unit Apartments | 0 (0.0%) | 0 (0.0%) |
| 5 to 9 Unit Apartments | 0 (0.0%) | 9 (100.0%) |
| 10 or more Apartments | 0 (0.0%) | 11 (100.0%) |
| Mobile Home / Other | 43 (60.6%) | 28 (39.4%) |
| Total | 1,132 (89.3%) | 135 (10.7%) |
Housing Structures by Number of Rooms in Colonial Heights
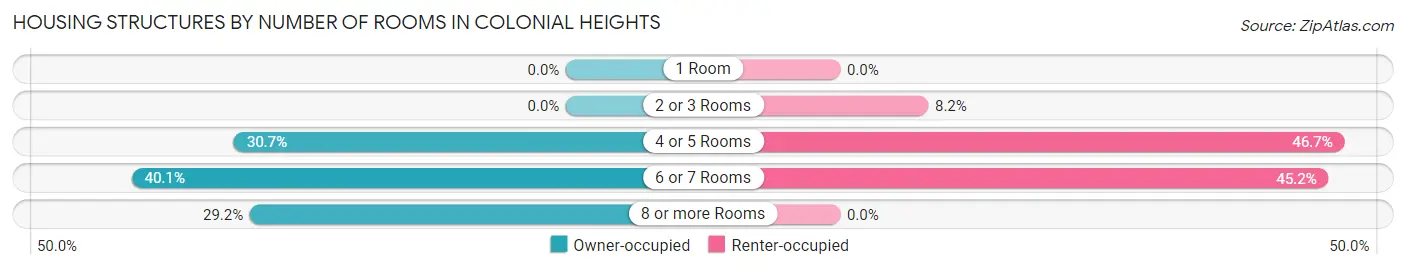
| Number of Rooms | Owner-occupied | Renter-occupied |
| 1 Room | 0 (0.0%) | 0 (0.0%) |
| 2 or 3 Rooms | 0 (0.0%) | 11 (8.2%) |
| 4 or 5 Rooms | 347 (30.6%) | 63 (46.7%) |
| 6 or 7 Rooms | 454 (40.1%) | 61 (45.2%) |
| 8 or more Rooms | 331 (29.2%) | 0 (0.0%) |
| Total | 1,132 (100.0%) | 135 (100.0%) |
Housing Structure by Heating Type in Colonial Heights
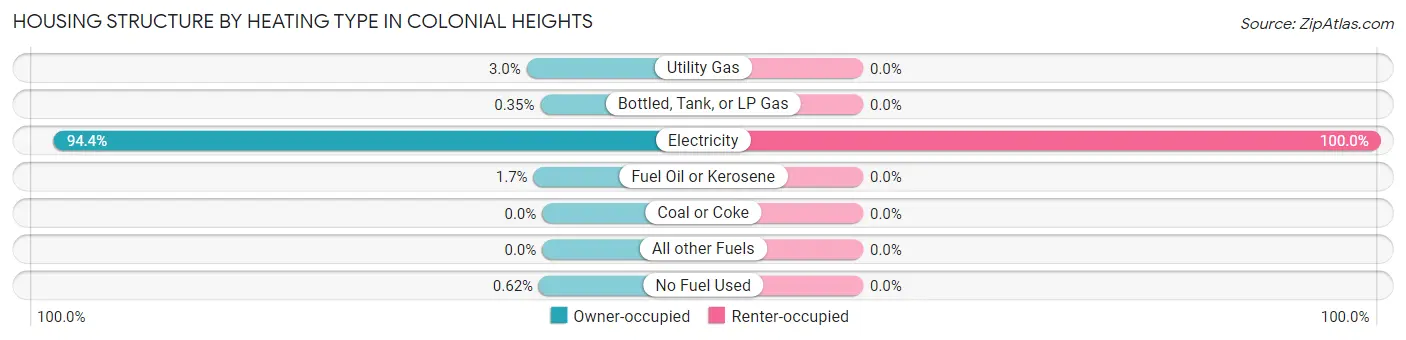
| Heating Type | Owner-occupied | Renter-occupied |
| Utility Gas | 34 (3.0%) | 0 (0.0%) |
| Bottled, Tank, or LP Gas | 4 (0.4%) | 0 (0.0%) |
| Electricity | 1,068 (94.4%) | 135 (100.0%) |
| Fuel Oil or Kerosene | 19 (1.7%) | 0 (0.0%) |
| Coal or Coke | 0 (0.0%) | 0 (0.0%) |
| All other Fuels | 0 (0.0%) | 0 (0.0%) |
| No Fuel Used | 7 (0.6%) | 0 (0.0%) |
| Total | 1,132 (100.0%) | 135 (100.0%) |
Household Vehicle Usage in Colonial Heights
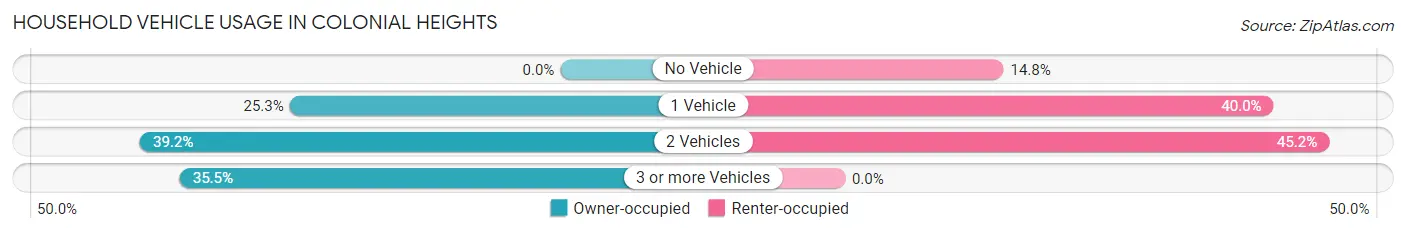
| Vehicles per Household | Owner-occupied | Renter-occupied |
| No Vehicle | 0 (0.0%) | 20 (14.8%) |
| 1 Vehicle | 286 (25.3%) | 54 (40.0%) |
| 2 Vehicles | 444 (39.2%) | 61 (45.2%) |
| 3 or more Vehicles | 402 (35.5%) | 0 (0.0%) |
| Total | 1,132 (100.0%) | 135 (100.0%) |
Real Estate & Mortgages in Colonial Heights
Real Estate and Mortgage Overview in Colonial Heights
| Characteristic | Without Mortgage | With Mortgage |
| Housing Units | 424 | 708 |
| Median Property Value | $179,500 | $174,500 |
| Median Household Income | $69,231 | $100 |
| Monthly Housing Costs | $348 | $0 |
| Real Estate Taxes | $917 | $9 |
Property Value by Mortgage Status in Colonial Heights
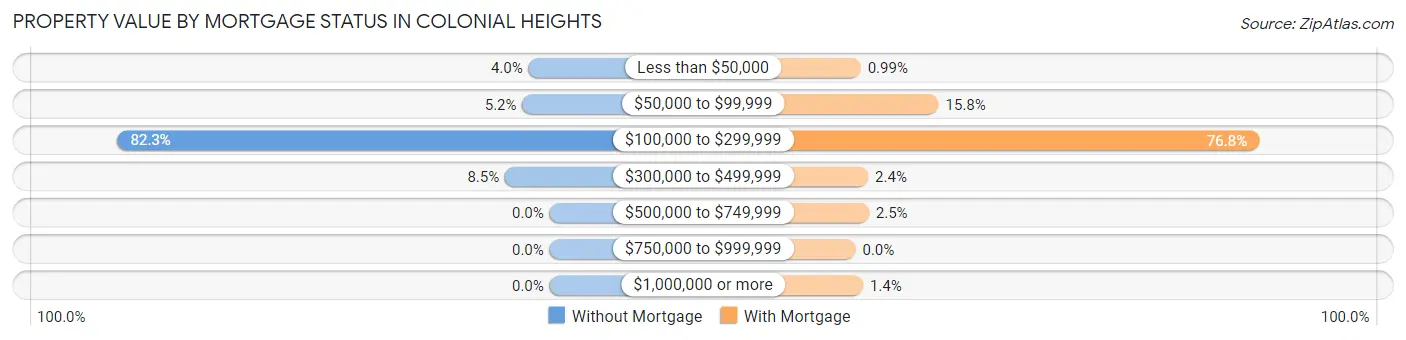
| Property Value | Without Mortgage | With Mortgage |
| Less than $50,000 | 17 (4.0%) | 7 (1.0%) |
| $50,000 to $99,999 | 22 (5.2%) | 112 (15.8%) |
| $100,000 to $299,999 | 349 (82.3%) | 544 (76.8%) |
| $300,000 to $499,999 | 36 (8.5%) | 17 (2.4%) |
| $500,000 to $749,999 | 0 (0.0%) | 18 (2.5%) |
| $750,000 to $999,999 | 0 (0.0%) | 0 (0.0%) |
| $1,000,000 or more | 0 (0.0%) | 10 (1.4%) |
| Total | 424 (100.0%) | 708 (100.0%) |
Household Income by Mortgage Status in Colonial Heights
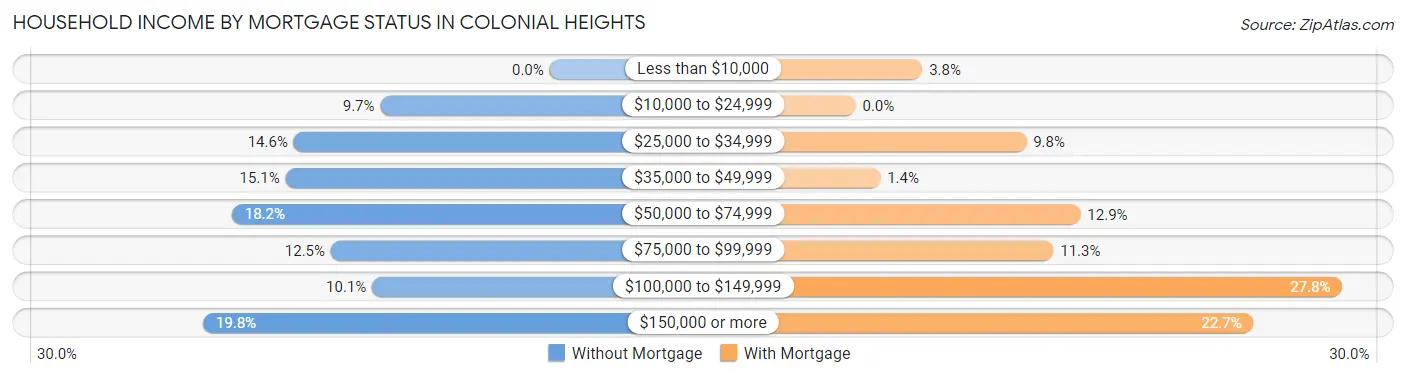
| Household Income | Without Mortgage | With Mortgage |
| Less than $10,000 | 0 (0.0%) | 27 (3.8%) |
| $10,000 to $24,999 | 41 (9.7%) | 0 (0.0%) |
| $25,000 to $34,999 | 62 (14.6%) | 69 (9.8%) |
| $35,000 to $49,999 | 64 (15.1%) | 10 (1.4%) |
| $50,000 to $74,999 | 77 (18.2%) | 91 (12.9%) |
| $75,000 to $99,999 | 53 (12.5%) | 80 (11.3%) |
| $100,000 to $149,999 | 43 (10.1%) | 197 (27.8%) |
| $150,000 or more | 84 (19.8%) | 161 (22.7%) |
| Total | 424 (100.0%) | 708 (100.0%) |
Property Value to Household Income Ratio in Colonial Heights
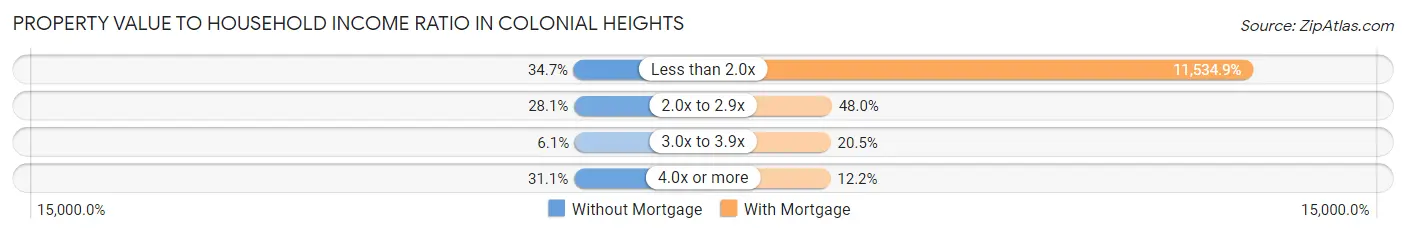
| Value-to-Income Ratio | Without Mortgage | With Mortgage |
| Less than 2.0x | 147 (34.7%) | 81,667 (11,534.9%) |
| 2.0x to 2.9x | 119 (28.1%) | 340 (48.0%) |
| 3.0x to 3.9x | 26 (6.1%) | 145 (20.5%) |
| 4.0x or more | 132 (31.1%) | 86 (12.1%) |
| Total | 424 (100.0%) | 708 (100.0%) |
Real Estate Taxes by Mortgage Status in Colonial Heights
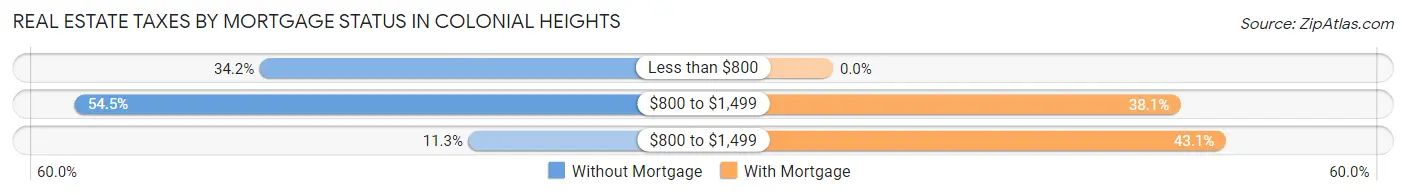
| Property Taxes | Without Mortgage | With Mortgage |
| Less than $800 | 145 (34.2%) | 0 (0.0%) |
| $800 to $1,499 | 231 (54.5%) | 270 (38.1%) |
| $800 to $1,499 | 48 (11.3%) | 305 (43.1%) |
| Total | 424 (100.0%) | 708 (100.0%) |
Health & Disability in Colonial Heights
Health Insurance Coverage by Age in Colonial Heights
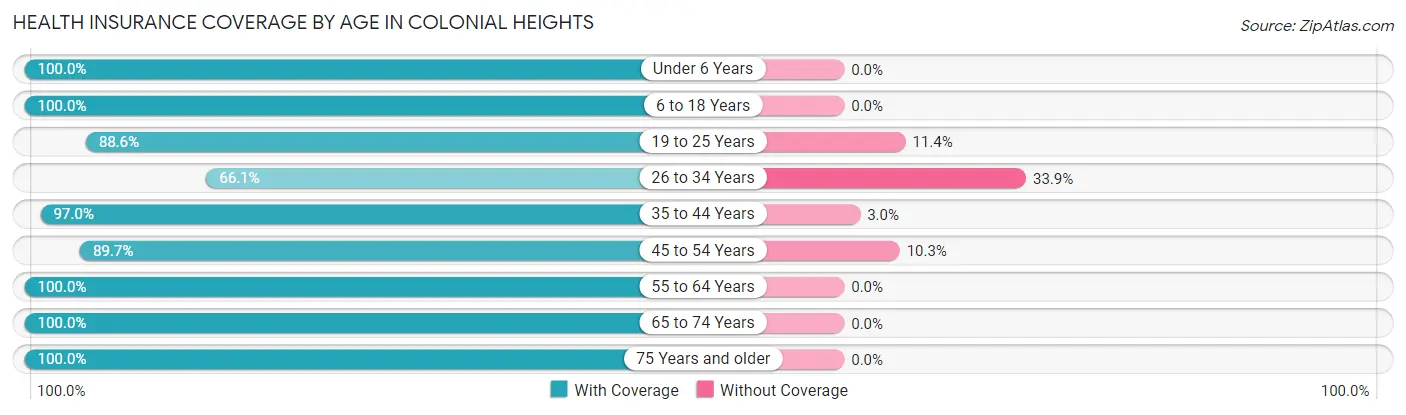
| Age Bracket | With Coverage | Without Coverage |
| Under 6 Years | 77 (100.0%) | 0 (0.0%) |
| 6 to 18 Years | 297 (100.0%) | 0 (0.0%) |
| 19 to 25 Years | 225 (88.6%) | 29 (11.4%) |
| 26 to 34 Years | 78 (66.1%) | 40 (33.9%) |
| 35 to 44 Years | 261 (97.0%) | 8 (3.0%) |
| 45 to 54 Years | 486 (89.7%) | 56 (10.3%) |
| 55 to 64 Years | 502 (100.0%) | 0 (0.0%) |
| 65 to 74 Years | 397 (100.0%) | 0 (0.0%) |
| 75 Years and older | 211 (100.0%) | 0 (0.0%) |
| Total | 2,534 (95.0%) | 133 (5.0%) |
Health Insurance Coverage by Citizenship Status in Colonial Heights
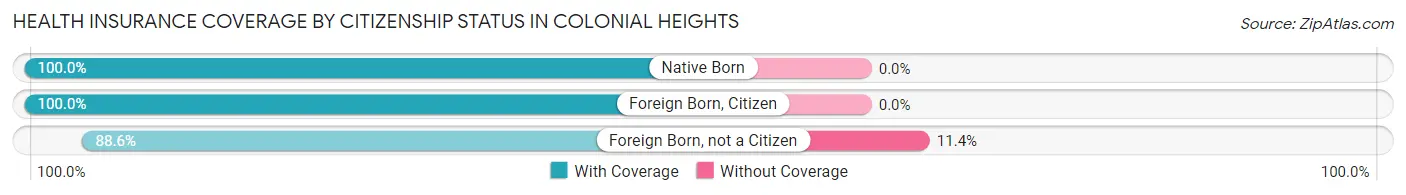
| Citizenship Status | With Coverage | Without Coverage |
| Native Born | 77 (100.0%) | 0 (0.0%) |
| Foreign Born, Citizen | 297 (100.0%) | 0 (0.0%) |
| Foreign Born, not a Citizen | 225 (88.6%) | 29 (11.4%) |
Health Insurance Coverage by Household Income in Colonial Heights
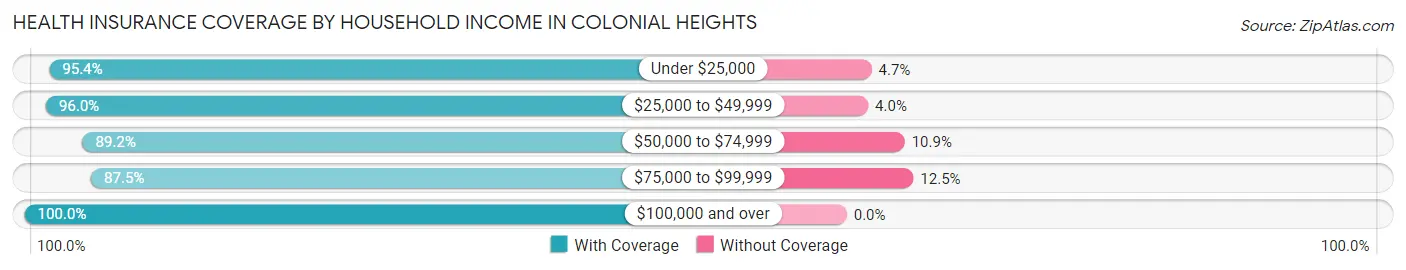
| Household Income | With Coverage | Without Coverage |
| Under $25,000 | 164 (95.4%) | 8 (4.6%) |
| $25,000 to $49,999 | 288 (96.0%) | 12 (4.0%) |
| $50,000 to $74,999 | 345 (89.1%) | 42 (10.8%) |
| $75,000 to $99,999 | 498 (87.5%) | 71 (12.5%) |
| $100,000 and over | 1,239 (100.0%) | 0 (0.0%) |
Public vs Private Health Insurance Coverage by Age in Colonial Heights
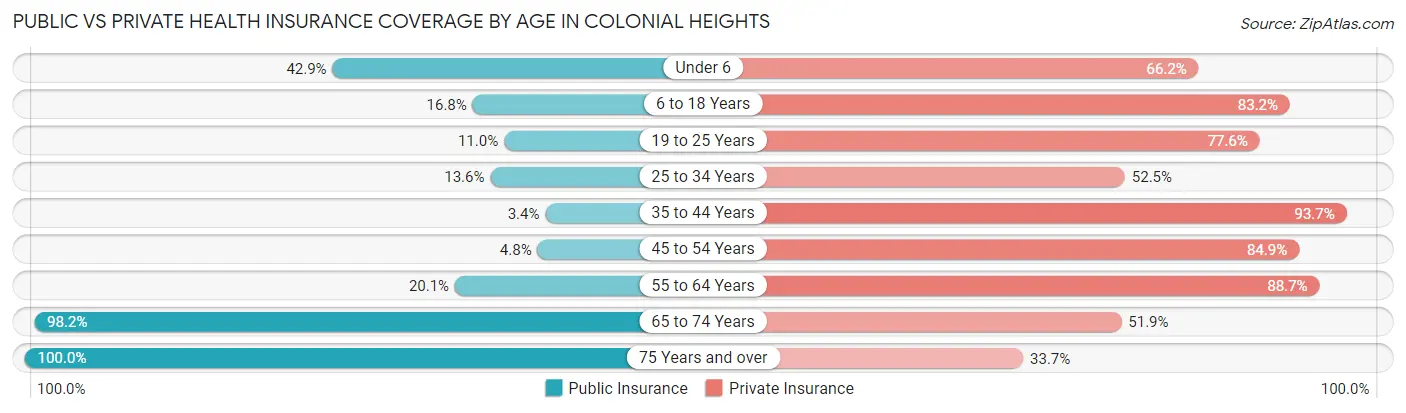
| Age Bracket | Public Insurance | Private Insurance |
| Under 6 | 33 (42.9%) | 51 (66.2%) |
| 6 to 18 Years | 50 (16.8%) | 247 (83.2%) |
| 19 to 25 Years | 28 (11.0%) | 197 (77.6%) |
| 25 to 34 Years | 16 (13.6%) | 62 (52.5%) |
| 35 to 44 Years | 9 (3.4%) | 252 (93.7%) |
| 45 to 54 Years | 26 (4.8%) | 460 (84.9%) |
| 55 to 64 Years | 101 (20.1%) | 445 (88.6%) |
| 65 to 74 Years | 390 (98.2%) | 206 (51.9%) |
| 75 Years and over | 211 (100.0%) | 71 (33.7%) |
| Total | 864 (32.4%) | 1,991 (74.7%) |
Disability Status by Sex by Age in Colonial Heights
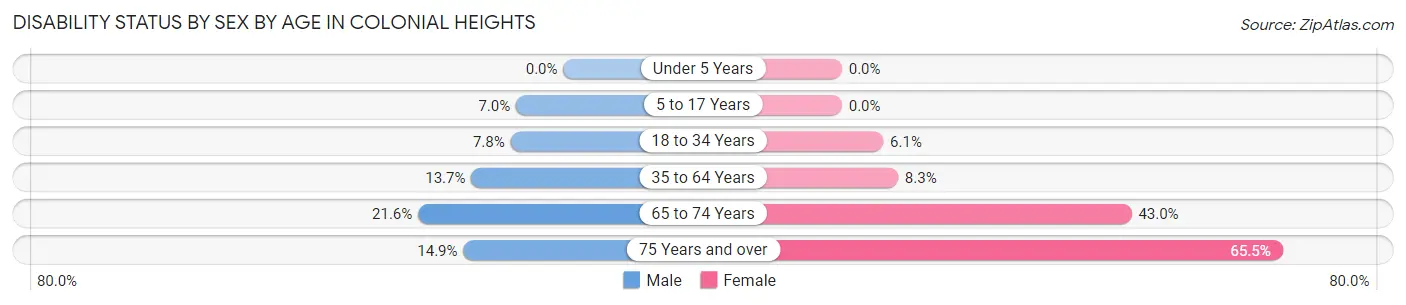
| Age Bracket | Male | Female |
| Under 5 Years | 0 (0.0%) | 0 (0.0%) |
| 5 to 17 Years | 9 (7.0%) | 0 (0.0%) |
| 18 to 34 Years | 16 (7.8%) | 14 (6.1%) |
| 35 to 64 Years | 86 (13.7%) | 57 (8.3%) |
| 65 to 74 Years | 44 (21.6%) | 83 (43.0%) |
| 75 Years and over | 15 (14.8%) | 72 (65.4%) |
Disability Class by Sex by Age in Colonial Heights
Disability Class: Hearing Difficulty
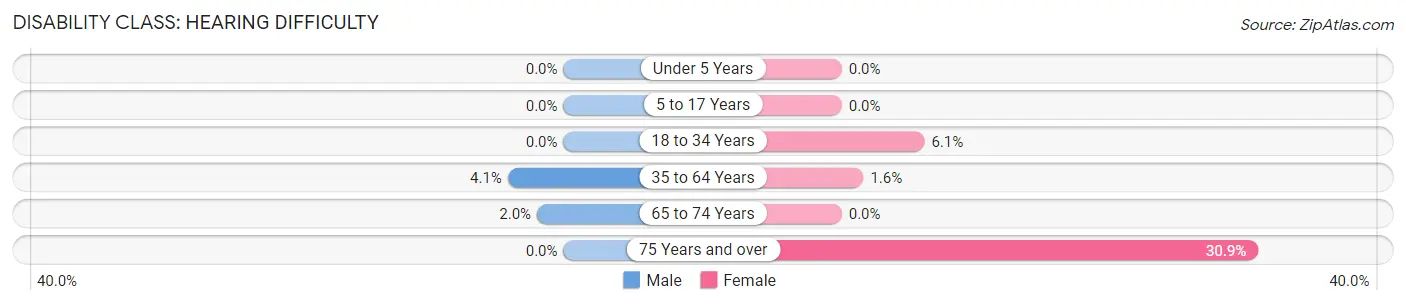
| Age Bracket | Male | Female |
| Under 5 Years | 0 (0.0%) | 0 (0.0%) |
| 5 to 17 Years | 0 (0.0%) | 0 (0.0%) |
| 18 to 34 Years | 0 (0.0%) | 14 (6.1%) |
| 35 to 64 Years | 26 (4.1%) | 11 (1.6%) |
| 65 to 74 Years | 4 (2.0%) | 0 (0.0%) |
| 75 Years and over | 0 (0.0%) | 34 (30.9%) |
Disability Class: Vision Difficulty
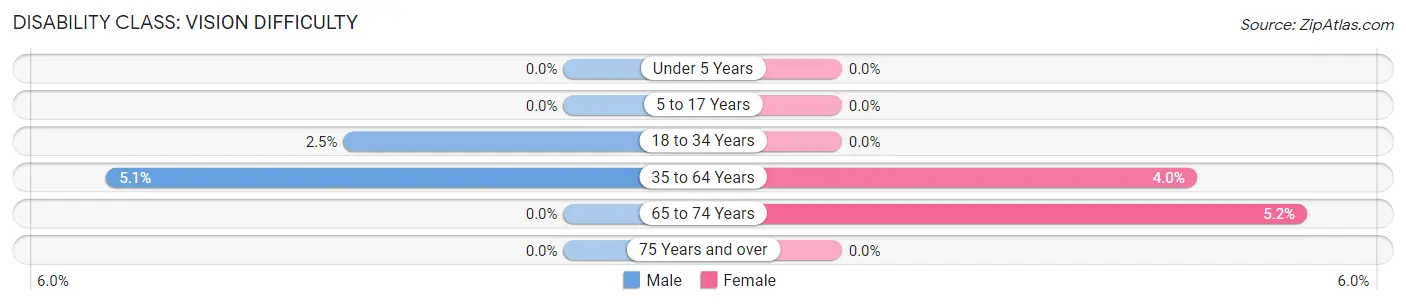
| Age Bracket | Male | Female |
| Under 5 Years | 0 (0.0%) | 0 (0.0%) |
| 5 to 17 Years | 0 (0.0%) | 0 (0.0%) |
| 18 to 34 Years | 5 (2.5%) | 0 (0.0%) |
| 35 to 64 Years | 32 (5.1%) | 27 (4.0%) |
| 65 to 74 Years | 0 (0.0%) | 10 (5.2%) |
| 75 Years and over | 0 (0.0%) | 0 (0.0%) |
Disability Class: Cognitive Difficulty
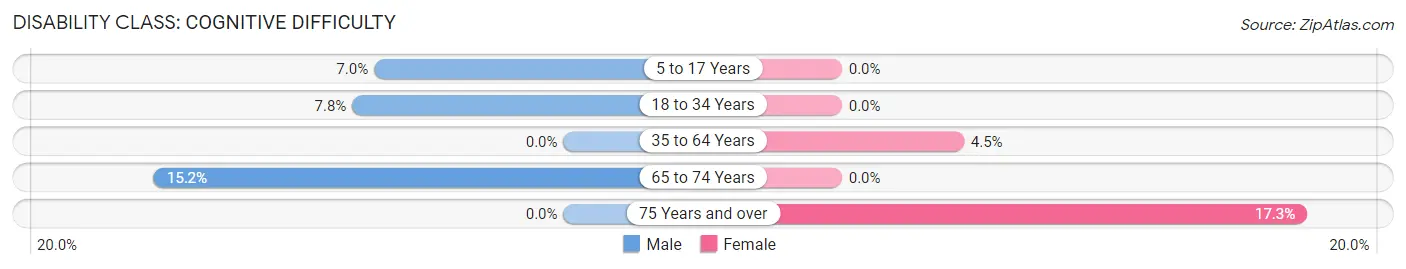
| Age Bracket | Male | Female |
| 5 to 17 Years | 9 (7.0%) | 0 (0.0%) |
| 18 to 34 Years | 16 (7.8%) | 0 (0.0%) |
| 35 to 64 Years | 0 (0.0%) | 31 (4.5%) |
| 65 to 74 Years | 31 (15.2%) | 0 (0.0%) |
| 75 Years and over | 0 (0.0%) | 19 (17.3%) |
Disability Class: Ambulatory Difficulty
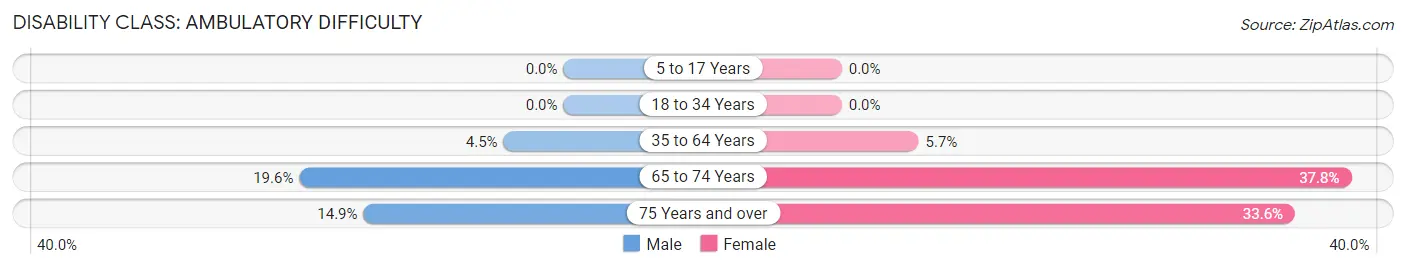
| Age Bracket | Male | Female |
| 5 to 17 Years | 0 (0.0%) | 0 (0.0%) |
| 18 to 34 Years | 0 (0.0%) | 0 (0.0%) |
| 35 to 64 Years | 28 (4.4%) | 39 (5.7%) |
| 65 to 74 Years | 40 (19.6%) | 73 (37.8%) |
| 75 Years and over | 15 (14.8%) | 37 (33.6%) |
Disability Class: Self-Care Difficulty
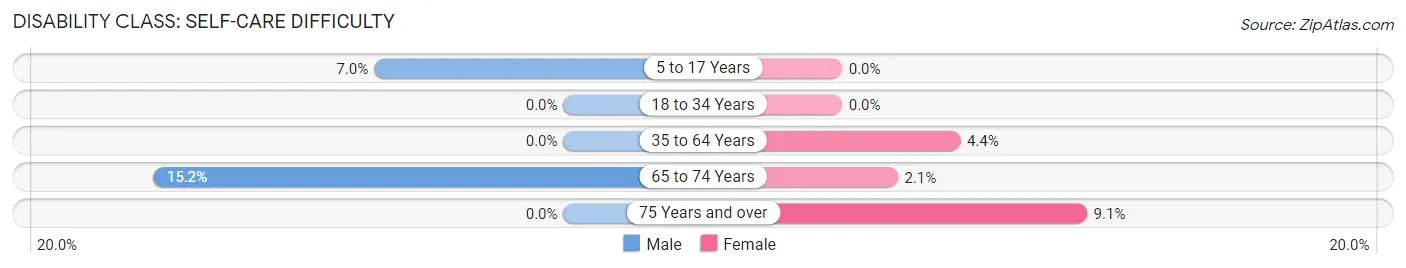
| Age Bracket | Male | Female |
| 5 to 17 Years | 9 (7.0%) | 0 (0.0%) |
| 18 to 34 Years | 0 (0.0%) | 0 (0.0%) |
| 35 to 64 Years | 0 (0.0%) | 30 (4.4%) |
| 65 to 74 Years | 31 (15.2%) | 4 (2.1%) |
| 75 Years and over | 0 (0.0%) | 10 (9.1%) |
Technology Access in Colonial Heights
Computing Device Access in Colonial Heights
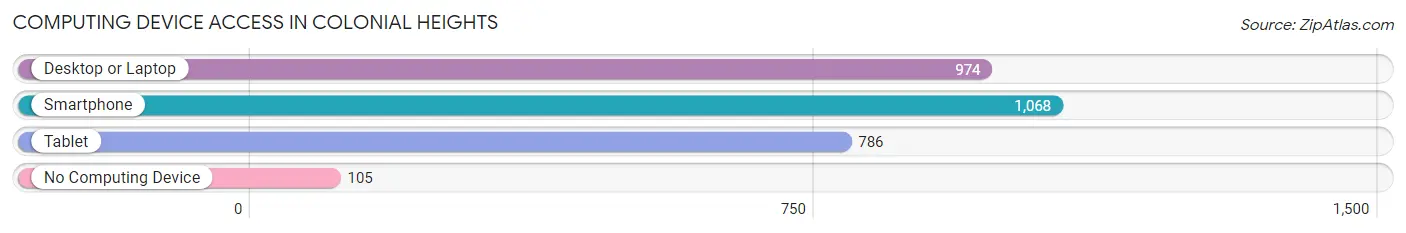
| Device Type | # Households | % Households |
| Desktop or Laptop | 974 | 76.9% |
| Smartphone | 1,068 | 84.3% |
| Tablet | 786 | 62.0% |
| No Computing Device | 105 | 8.3% |
| Total | 1,267 | 100.0% |
Internet Access in Colonial Heights
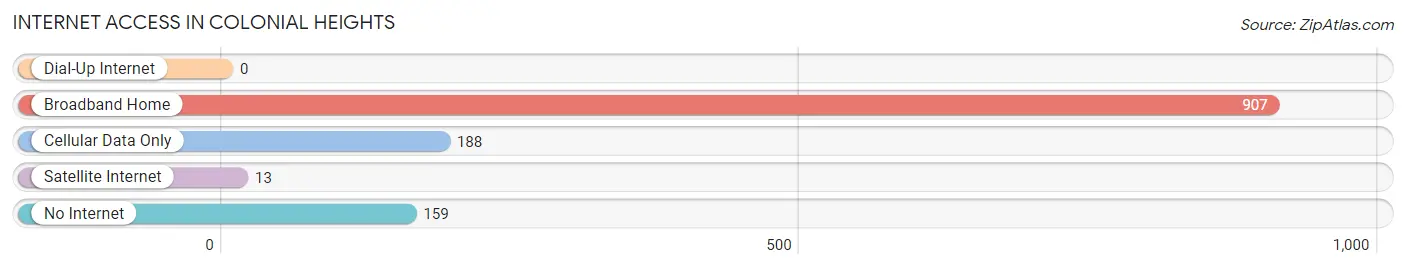
| Internet Type | # Households | % Households |
| Dial-Up Internet | 0 | 0.0% |
| Broadband Home | 907 | 71.6% |
| Cellular Data Only | 188 | 14.8% |
| Satellite Internet | 13 | 1.0% |
| No Internet | 159 | 12.6% |
| Total | 1,267 | 100.0% |
Colonial Heights Summary
Colonial Heights is a small town located in Hawkins County, Tennessee. It is situated on the banks of the Holston River, and is part of the Kingsport-Bristol-Bristol metropolitan area. The town has a population of approximately 1,500 people, and is known for its small-town charm and friendly atmosphere.
History
Colonial Heights was founded in 1820 by a group of settlers from Virginia. The town was originally known as “Mountain View”, but was later renamed to “Colonial Heights” in 1836. The town was named after the nearby Colonial Heights, Virginia, which was the site of a Revolutionary War battle.
The town was an important stop on the stagecoach route between Knoxville and Abingdon, Virginia. The stagecoach route was used to transport goods and passengers between the two cities.
In the late 19th century, the town was a popular destination for tourists. The town was known for its scenic beauty, and was home to several resorts and hotels.
Geography
Colonial Heights is located in Hawkins County, Tennessee. It is situated on the banks of the Holston River, and is part of the Kingsport-Bristol-Bristol metropolitan area. The town is located in the Appalachian Mountains, and is surrounded by rolling hills and lush forests.
The town has a total area of 1.2 square miles, all of which is land. The town is located at an elevation of 1,400 feet above sea level.
Economy
The economy of Colonial Heights is largely based on tourism and agriculture. The town is home to several resorts and hotels, which attract visitors from all over the country. The town is also home to several farms, which produce a variety of crops, including corn, soybeans, and hay.
The town is also home to several small businesses including restaurants shops and other services
Demographics
As of the 2010 census, the population of Colonial Heights was 1,500. The racial makeup of the town was 97.3% White, 0.7% African American, 0.3% Native American, 0.3% Asian, and 1.3% from other races.
The median household income in the town was $35,000, and the median family income was $41,000. The per capita income in the town was $17,000.
Conclusion
Colonial Heights is a small town located in Hawkins County, Tennessee. It is situated on the banks of the Holston River, and is part of the Kingsport-Bristol-Bristol metropolitan area. The town has a population of approximately 1,500 people, and is known for its small-town charm and friendly atmosphere. The economy of the town is largely based on tourism and agriculture, and the town is home to several resorts and hotels, as well as several farms. The racial makeup of the town is predominantly White, with a small percentage of African American, Native American, and Asian residents. The median household income in the town is $35,000, and the median family income is $41,000.
Common Questions
What is the Total Population of Colonial Heights?
Total Population of Colonial Heights is 2,667.
What is the Total Male Population of Colonial Heights?
Total Male Population of Colonial Heights is 1,318.
What is the Total Female Population of Colonial Heights?
Total Female Population of Colonial Heights is 1,349.
What is the Ratio of Males per 100 Females in Colonial Heights?
There are 97.70 Males per 100 Females in Colonial Heights.
What is the Ratio of Females per 100 Males in Colonial Heights?
There are 102.35 Females per 100 Males in Colonial Heights.
What is the Median Population Age in Colonial Heights?
Median Population Age in Colonial Heights is 50.3 Years.
What is the Average Family Size in Colonial Heights
Average Family Size in Colonial Heights is 2.9 People.
What is the Average Household Size in Colonial Heights
Average Household Size in Colonial Heights is 2.1 People.
What is Per Capita Income in Colonial Heights?
Per Capita income in Colonial Heights is $44,121.
What is the Median Family Income in Colonial Heights?
Median Family Income in Colonial Heights is $97,083.
What is the Median Household income in Colonial Heights?
Median Household Income in Colonial Heights is $76,109.
What is Income or Wage Gap in Colonial Heights?
Income or Wage Gap in Colonial Heights is 12.4%.
Women in Colonial Heights earn 87.6 cents for every dollar earned by a man.
What is Inequality or Gini Index in Colonial Heights?
Inequality or Gini Index in Colonial Heights is 0.39.
How Large is the Labor Force in Colonial Heights?
There are 1,667 People in the Labor Forcein in Colonial Heights.
What is the Percentage of People in the Labor Force in Colonial Heights?
68.2% of People are in the Labor Force in Colonial Heights.
What is the Unemployment Rate in Colonial Heights?
Unemployment Rate in Colonial Heights is 4.3%.