Mcminnville, TN
Mcminnville Map
Mcminnville Overview
13,756
TOTAL POPULATION
6,594
MALE POPULATION
7,162
FEMALE POPULATION
92.07
MALES / 100 FEMALES
108.61
FEMALES / 100 MALES
38.9
MEDIAN AGE
3.3
AVG FAMILY SIZE
2.4
AVG HOUSEHOLD SIZE
$26,300
PER CAPITA INCOME
$54,040
AVG FAMILY INCOME
$42,130
AVG HOUSEHOLD INCOME
18.8%
WAGE / INCOME GAP [ % ]
81.2¢/ $1
WAGE / INCOME GAP [ $ ]
$7,459
FAMILY INCOME DEFICIT
0.50
INEQUALITY / GINI INDEX
5,673
LABOR FORCE [ PEOPLE ]
51.4%
PERCENT IN LABOR FORCE
5.3%
UNEMPLOYMENT RATE
Mcminnville Zip Codes
Mcminnville Area Codes
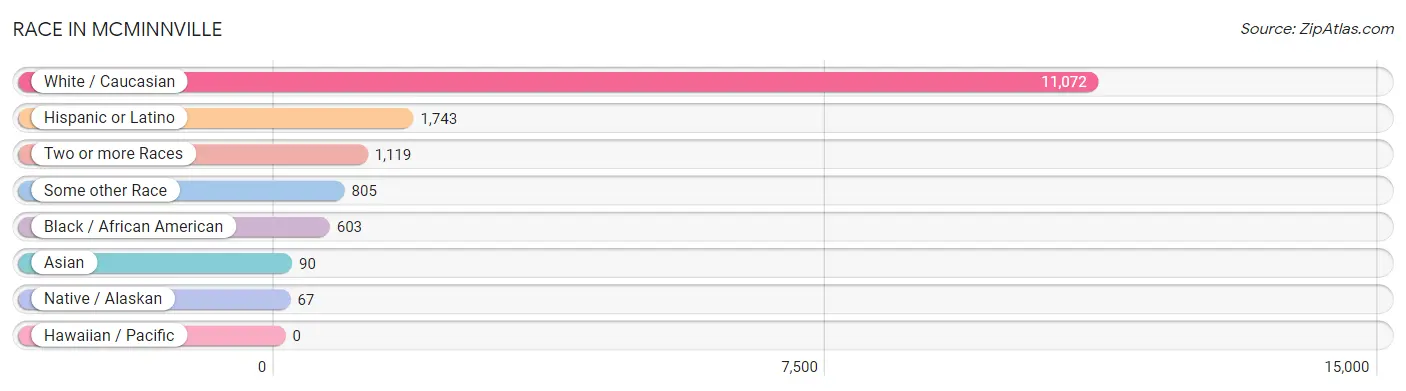
Race in Mcminnville
The most populous races in Mcminnville are White / Caucasian (11,072 | 80.5%), Hispanic or Latino (1,743 | 12.7%), and Two or more Races (1,119 | 8.1%).
| Race | # Population | % Population |
| Asian | 90 | 0.6% |
| Black / African American | 603 | 4.4% |
| Hawaiian / Pacific | 0 | 0.0% |
| Hispanic or Latino | 1,743 | 12.7% |
| Native / Alaskan | 67 | 0.5% |
| White / Caucasian | 11,072 | 80.5% |
| Two or more Races | 1,119 | 8.1% |
| Some other Race | 805 | 5.9% |
| Total | 13,756 | 100.0% |
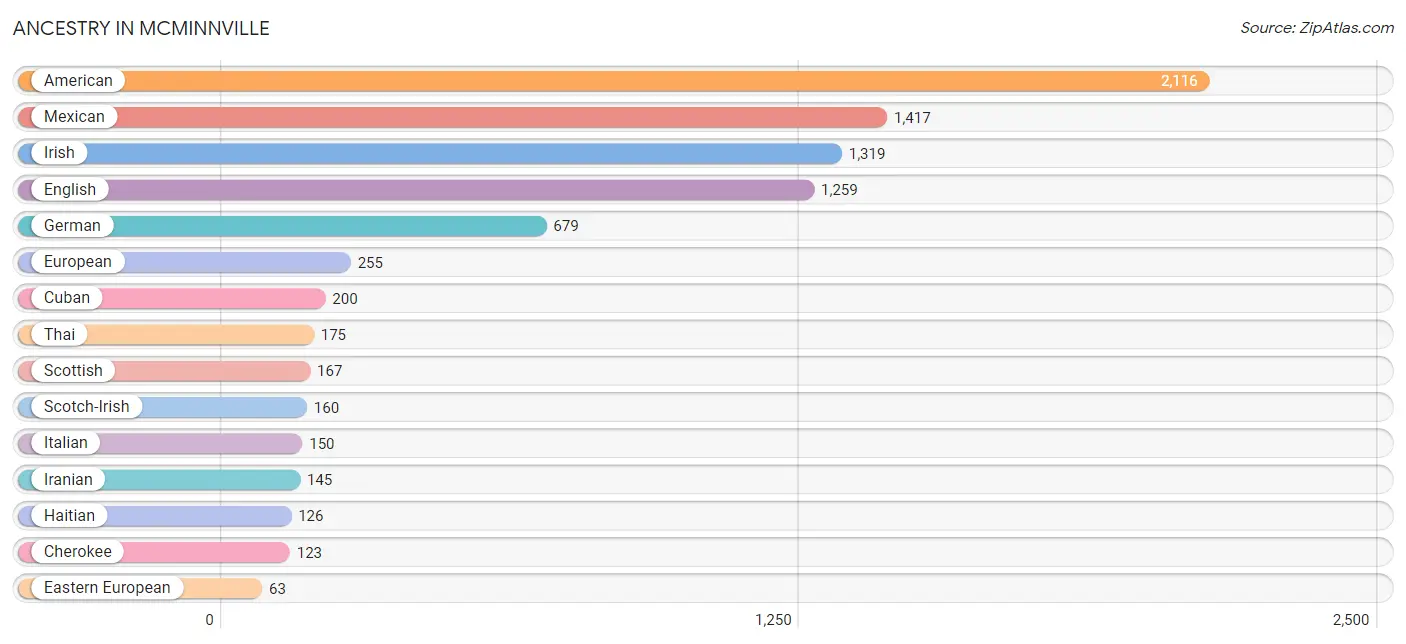
Ancestry in Mcminnville
The most populous ancestries reported in Mcminnville are American (2,116 | 15.4%), Mexican (1,417 | 10.3%), Irish (1,319 | 9.6%), English (1,259 | 9.1%), and German (679 | 4.9%), together accounting for 49.4% of all Mcminnville residents.
| Ancestry | # Population | % Population |
| African | 21 | 0.2% |
| American | 2,116 | 15.4% |
| Austrian | 7 | 0.1% |
| Belgian | 13 | 0.1% |
| Bolivian | 16 | 0.1% |
| British | 26 | 0.2% |
| Burmese | 9 | 0.1% |
| Canadian | 9 | 0.1% |
| Central American | 56 | 0.4% |
| Central American Indian | 41 | 0.3% |
| Cherokee | 123 | 0.9% |
| Cuban | 200 | 1.5% |
| Czechoslovakian | 16 | 0.1% |
| Danish | 15 | 0.1% |
| Dutch | 29 | 0.2% |
| Dutch West Indian | 55 | 0.4% |
| Eastern European | 63 | 0.5% |
| English | 1,259 | 9.1% |
| European | 255 | 1.8% |
| French | 60 | 0.4% |
| German | 679 | 4.9% |
| Greek | 15 | 0.1% |
| Guatemalan | 41 | 0.3% |
| Haitian | 126 | 0.9% |
| Hungarian | 8 | 0.1% |
| Indian (Asian) | 1 | 0.0% |
| Iranian | 145 | 1.1% |
| Irish | 1,319 | 9.6% |
| Italian | 150 | 1.1% |
| Jamaican | 7 | 0.1% |
| Korean | 19 | 0.1% |
| Malaysian | 63 | 0.5% |
| Mexican | 1,417 | 10.3% |
| Northern European | 18 | 0.1% |
| Norwegian | 20 | 0.2% |
| Pakistani | 23 | 0.2% |
| Polish | 61 | 0.4% |
| Puerto Rican | 27 | 0.2% |
| Romanian | 9 | 0.1% |
| Salvadoran | 15 | 0.1% |
| Scotch-Irish | 160 | 1.2% |
| Scottish | 167 | 1.2% |
| Sioux | 6 | 0.0% |
| South American | 16 | 0.1% |
| Spanish | 7 | 0.1% |
| Subsaharan African | 21 | 0.2% |
| Swedish | 59 | 0.4% |
| Swiss | 15 | 0.1% |
| Thai | 175 | 1.3% | View All 49 Rows |
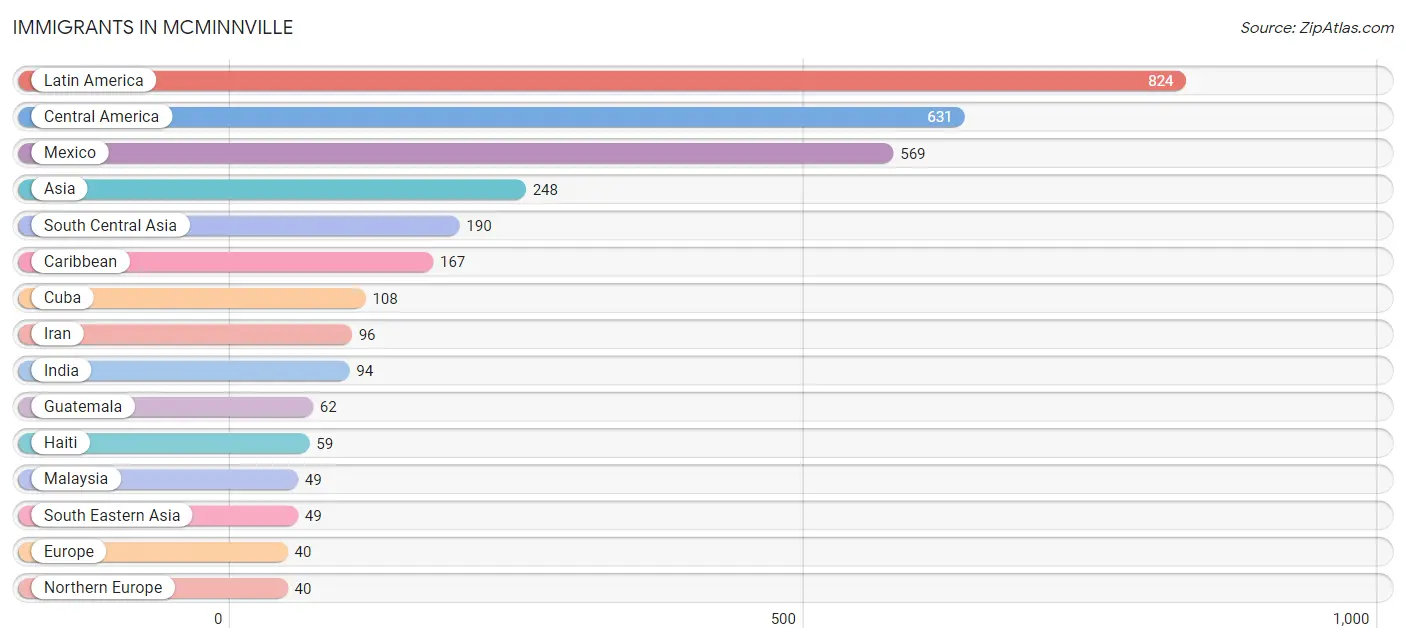
Immigrants in Mcminnville
The most numerous immigrant groups reported in Mcminnville came from Latin America (824 | 6.0%), Central America (631 | 4.6%), Mexico (569 | 4.1%), Asia (248 | 1.8%), and South Central Asia (190 | 1.4%), together accounting for 17.9% of all Mcminnville residents.
| Immigration Origin | # Population | % Population |
| Africa | 7 | 0.1% |
| Asia | 248 | 1.8% |
| Bolivia | 16 | 0.1% |
| Canada | 9 | 0.1% |
| Caribbean | 167 | 1.2% |
| Central America | 631 | 4.6% |
| Cuba | 108 | 0.8% |
| Eastern Africa | 7 | 0.1% |
| Eastern Asia | 9 | 0.1% |
| England | 39 | 0.3% |
| Eritrea | 7 | 0.1% |
| Europe | 40 | 0.3% |
| Guatemala | 62 | 0.4% |
| Haiti | 59 | 0.4% |
| India | 94 | 0.7% |
| Iran | 96 | 0.7% |
| Korea | 9 | 0.1% |
| Latin America | 824 | 6.0% |
| Malaysia | 49 | 0.4% |
| Mexico | 569 | 4.1% |
| Northern Europe | 40 | 0.3% |
| South America | 26 | 0.2% |
| South Central Asia | 190 | 1.4% |
| South Eastern Asia | 49 | 0.4% |
| Sweden | 1 | 0.0% |
| Venezuela | 10 | 0.1% | View All 26 Rows |
Sex and Age in Mcminnville
Sex and Age in Mcminnville
The most populous age groups in Mcminnville are 25 to 29 Years (582 | 8.8%) for men and 55 to 59 Years (642 | 9.0%) for women.
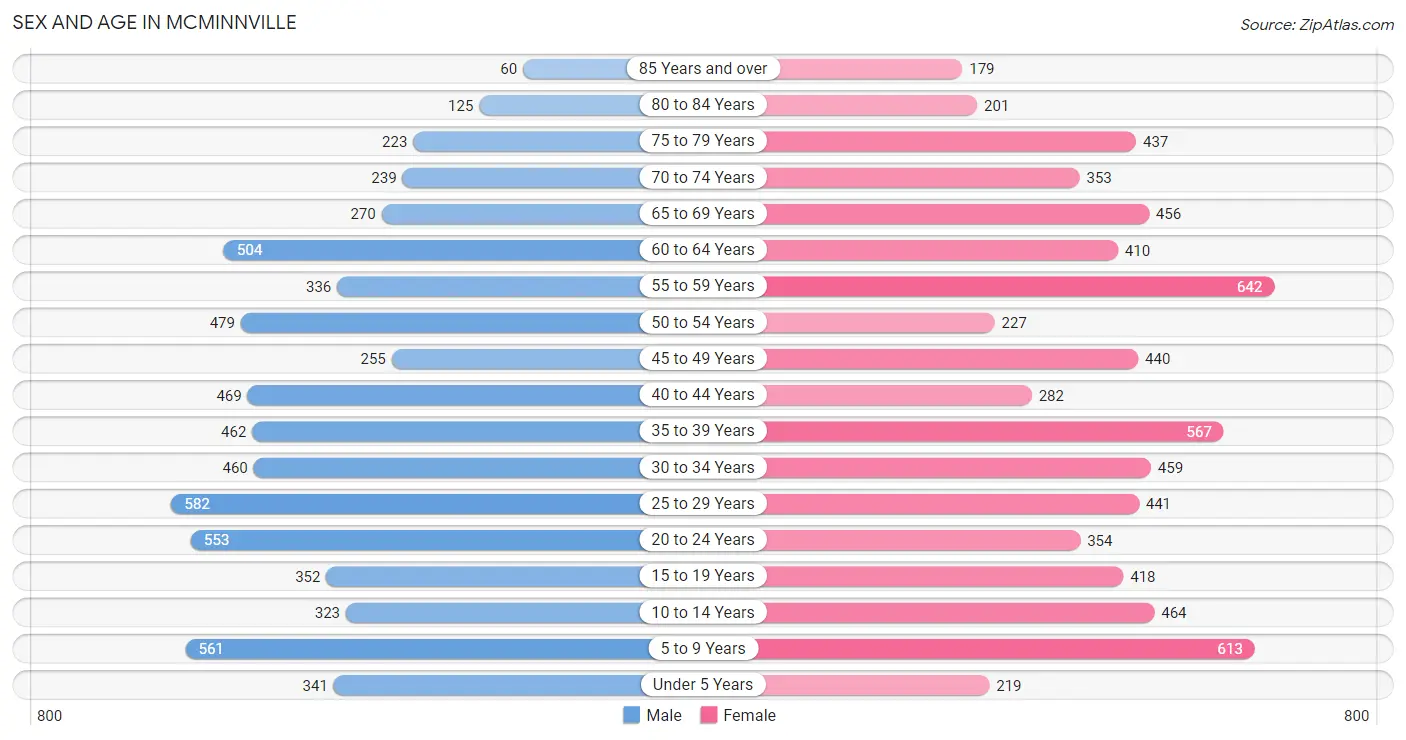
| Age Bracket | Male | Female |
| Under 5 Years | 341 (5.2%) | 219 (3.1%) |
| 5 to 9 Years | 561 (8.5%) | 613 (8.6%) |
| 10 to 14 Years | 323 (4.9%) | 464 (6.5%) |
| 15 to 19 Years | 352 (5.3%) | 418 (5.8%) |
| 20 to 24 Years | 553 (8.4%) | 354 (4.9%) |
| 25 to 29 Years | 582 (8.8%) | 441 (6.2%) |
| 30 to 34 Years | 460 (7.0%) | 459 (6.4%) |
| 35 to 39 Years | 462 (7.0%) | 567 (7.9%) |
| 40 to 44 Years | 469 (7.1%) | 282 (3.9%) |
| 45 to 49 Years | 255 (3.9%) | 440 (6.1%) |
| 50 to 54 Years | 479 (7.3%) | 227 (3.2%) |
| 55 to 59 Years | 336 (5.1%) | 642 (9.0%) |
| 60 to 64 Years | 504 (7.6%) | 410 (5.7%) |
| 65 to 69 Years | 270 (4.1%) | 456 (6.4%) |
| 70 to 74 Years | 239 (3.6%) | 353 (4.9%) |
| 75 to 79 Years | 223 (3.4%) | 437 (6.1%) |
| 80 to 84 Years | 125 (1.9%) | 201 (2.8%) |
| 85 Years and over | 60 (0.9%) | 179 (2.5%) |
| Total | 6,594 (100.0%) | 7,162 (100.0%) |
Families and Households in Mcminnville
Median Family Size in Mcminnville
The median family size in Mcminnville is 3.26 persons per family, with married-couple families (1,724 | 56.8%) accounting for the largest median family size of 3.28 persons per family. On the other hand, single male/father families (395 | 13.0%) represent the smallest median family size with 3.17 persons per family.
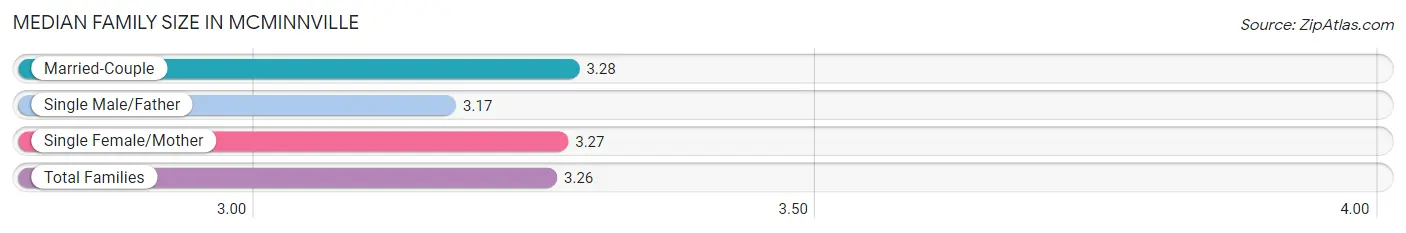
| Family Type | # Families | Family Size |
| Married-Couple | 1,724 (56.8%) | 3.28 |
| Single Male/Father | 395 (13.0%) | 3.17 |
| Single Female/Mother | 915 (30.2%) | 3.27 |
| Total Families | 3,034 (100.0%) | 3.26 |
Median Household Size in Mcminnville
The median household size in Mcminnville is 2.38 persons per household, with single male/father households (395 | 7.1%) accounting for the largest median household size of 3.76 persons per household. non-family households (2,537 | 45.5%) represent the smallest median household size with 1.14 persons per household.
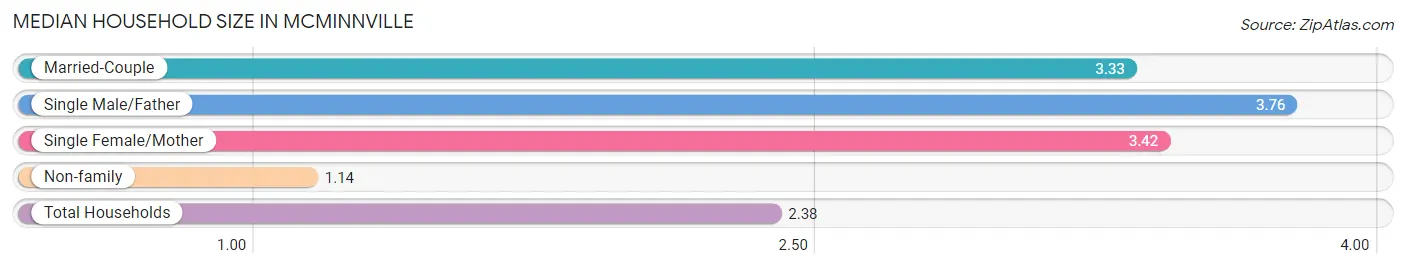
| Household Type | # Households | Household Size |
| Married-Couple | 1,724 (30.9%) | 3.33 |
| Single Male/Father | 395 (7.1%) | 3.76 |
| Single Female/Mother | 915 (16.4%) | 3.42 |
| Non-family | 2,537 (45.5%) | 1.14 |
| Total Households | 5,571 (100.0%) | 2.38 |
Household Size by Marriage Status in Mcminnville
Out of a total of 5,571 households in Mcminnville, 3,034 (54.5%) are family households, while 2,537 (45.5%) are nonfamily households. The most numerous type of family households are 2-person households, comprising 1,208, and the most common type of nonfamily households are 1-person households, comprising 2,300.
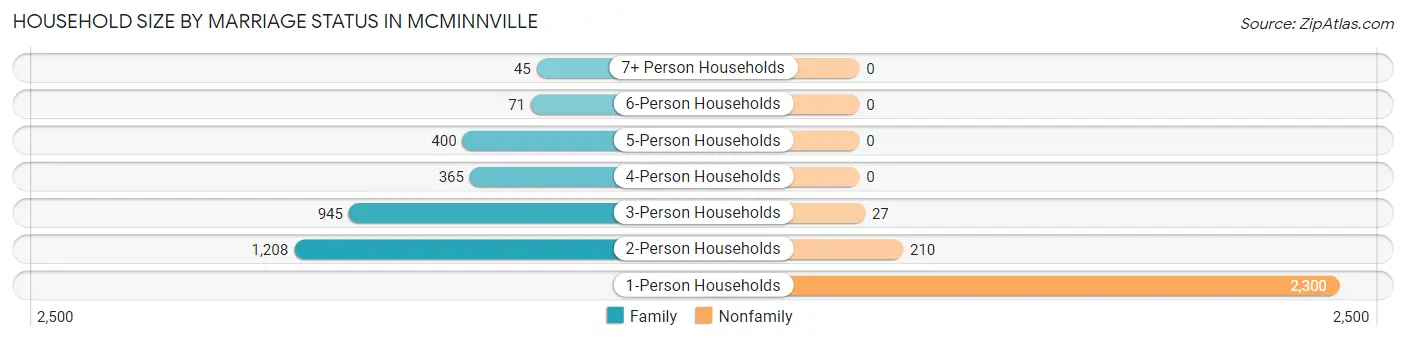
| Household Size | Family Households | Nonfamily Households |
| 1-Person Households | - | 2,300 (41.3%) |
| 2-Person Households | 1,208 (21.7%) | 210 (3.8%) |
| 3-Person Households | 945 (17.0%) | 27 (0.5%) |
| 4-Person Households | 365 (6.6%) | 0 (0.0%) |
| 5-Person Households | 400 (7.2%) | 0 (0.0%) |
| 6-Person Households | 71 (1.3%) | 0 (0.0%) |
| 7+ Person Households | 45 (0.8%) | 0 (0.0%) |
| Total | 3,034 (54.5%) | 2,537 (45.5%) |
Female Fertility in Mcminnville
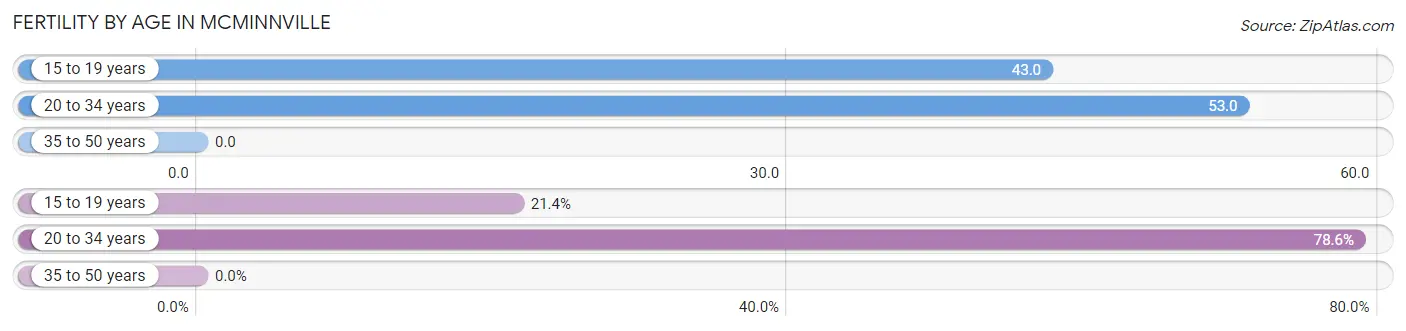
Fertility by Age in Mcminnville
Average fertility rate in Mcminnville is 28.0 births per 1,000 women. Women in the age bracket of 20 to 34 years have the highest fertility rate with 53.0 births per 1,000 women. Women in the age bracket of 20 to 34 years acount for 78.6% of all women with births.
| Age Bracket | Women with Births | Births / 1,000 Women |
| 15 to 19 years | 18 (21.4%) | 43.0 |
| 20 to 34 years | 66 (78.6%) | 53.0 |
| 35 to 50 years | 0 (0.0%) | 0.0 |
| Total | 84 (100.0%) | 28.0 |
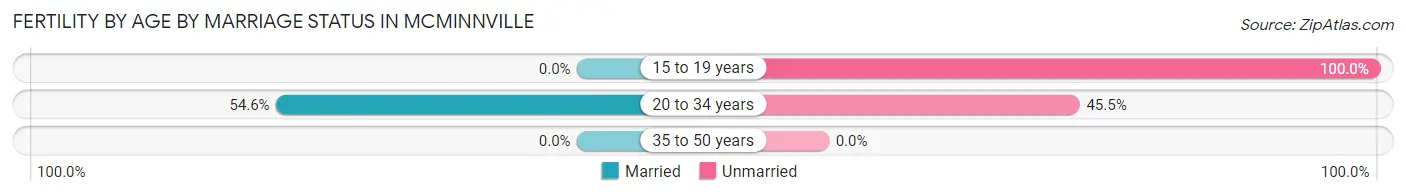
Fertility by Age by Marriage Status in Mcminnville
42.9% of women with births (84) in Mcminnville are married. The highest percentage of unmarried women with births falls into 15 to 19 years age bracket with 100.0% of them unmarried at the time of birth, while the lowest percentage of unmarried women with births belong to 20 to 34 years age bracket with 45.5% of them unmarried.
| Age Bracket | Married | Unmarried |
| 15 to 19 years | 0 (0.0%) | 18 (100.0%) |
| 20 to 34 years | 36 (54.5%) | 30 (45.5%) |
| 35 to 50 years | 0 (0.0%) | 0 (0.0%) |
| Total | 36 (42.9%) | 48 (57.1%) |
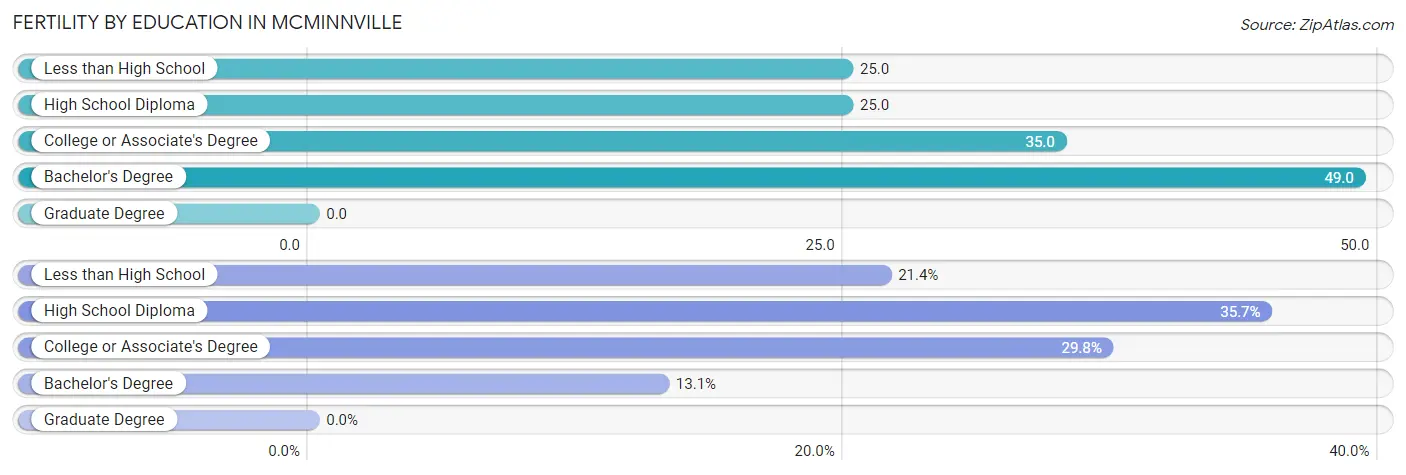
Fertility by Education in Mcminnville
| Educational Attainment | Women with Births | Births / 1,000 Women |
| Less than High School | 18 (21.4%) | 25.0 |
| High School Diploma | 30 (35.7%) | 25.0 |
| College or Associate's Degree | 25 (29.8%) | 35.0 |
| Bachelor's Degree | 11 (13.1%) | 49.0 |
| Graduate Degree | 0 (0.0%) | 0.0 |
| Total | 84 (100.0%) | 28.0 |
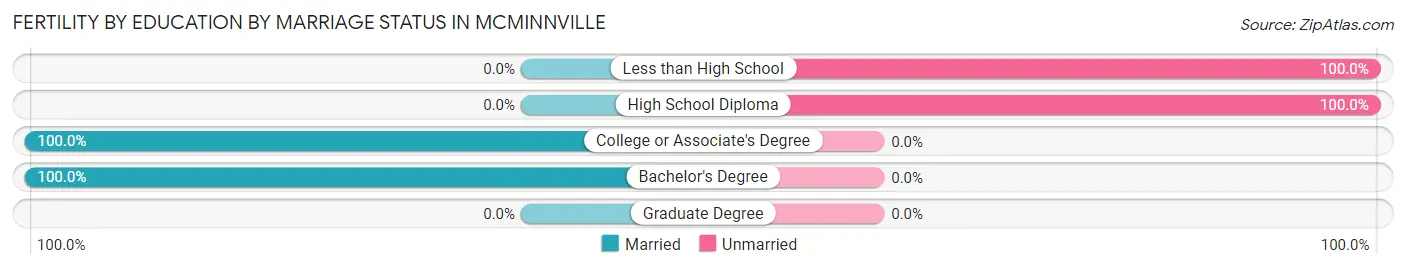
Fertility by Education by Marriage Status in Mcminnville
57.1% of women with births in Mcminnville are unmarried. Women with the educational attainment of college or associate's degree are most likely to be married with 100.0% of them married at childbirth, while women with the educational attainment of less than high school are least likely to be married with 100.0% of them unmarried at childbirth.
| Educational Attainment | Married | Unmarried |
| Less than High School | 0 (0.0%) | 18 (100.0%) |
| High School Diploma | 0 (0.0%) | 30 (100.0%) |
| College or Associate's Degree | 25 (100.0%) | 0 (0.0%) |
| Bachelor's Degree | 11 (100.0%) | 0 (0.0%) |
| Graduate Degree | 0 (0.0%) | 0 (0.0%) |
| Total | 36 (42.9%) | 48 (57.1%) |
Income in Mcminnville
Income Overview in Mcminnville
Per Capita Income in Mcminnville is $26,300, while median incomes of families and households are $54,040 and $42,130 respectively.
| Characteristic | Number | Measure |
| Per Capita Income | 13,756 | $26,300 |
| Median Family Income | 3,034 | $54,040 |
| Mean Family Income | 3,034 | $76,592 |
| Median Household Income | 5,571 | $42,130 |
| Mean Household Income | 5,571 | $60,717 |
| Income Deficit | 3,034 | $7,459 |
| Wage / Income Gap (%) | 13,756 | 18.85% |
| Wage / Income Gap ($) | 13,756 | 81.15¢ per $1 |
| Gini / Inequality Index | 13,756 | 0.50 |
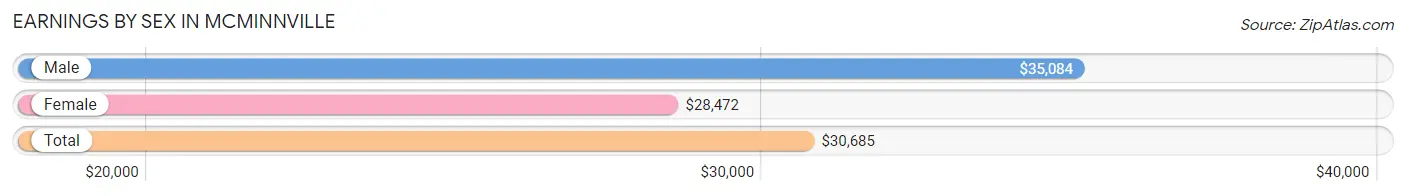
Earnings by Sex in Mcminnville
Average Earnings in Mcminnville are $30,685, $35,084 for men and $28,472 for women, a difference of 18.9%.
| Sex | Number | Average Earnings |
| Male | 3,410 (56.6%) | $35,084 |
| Female | 2,612 (43.4%) | $28,472 |
| Total | 6,022 (100.0%) | $30,685 |
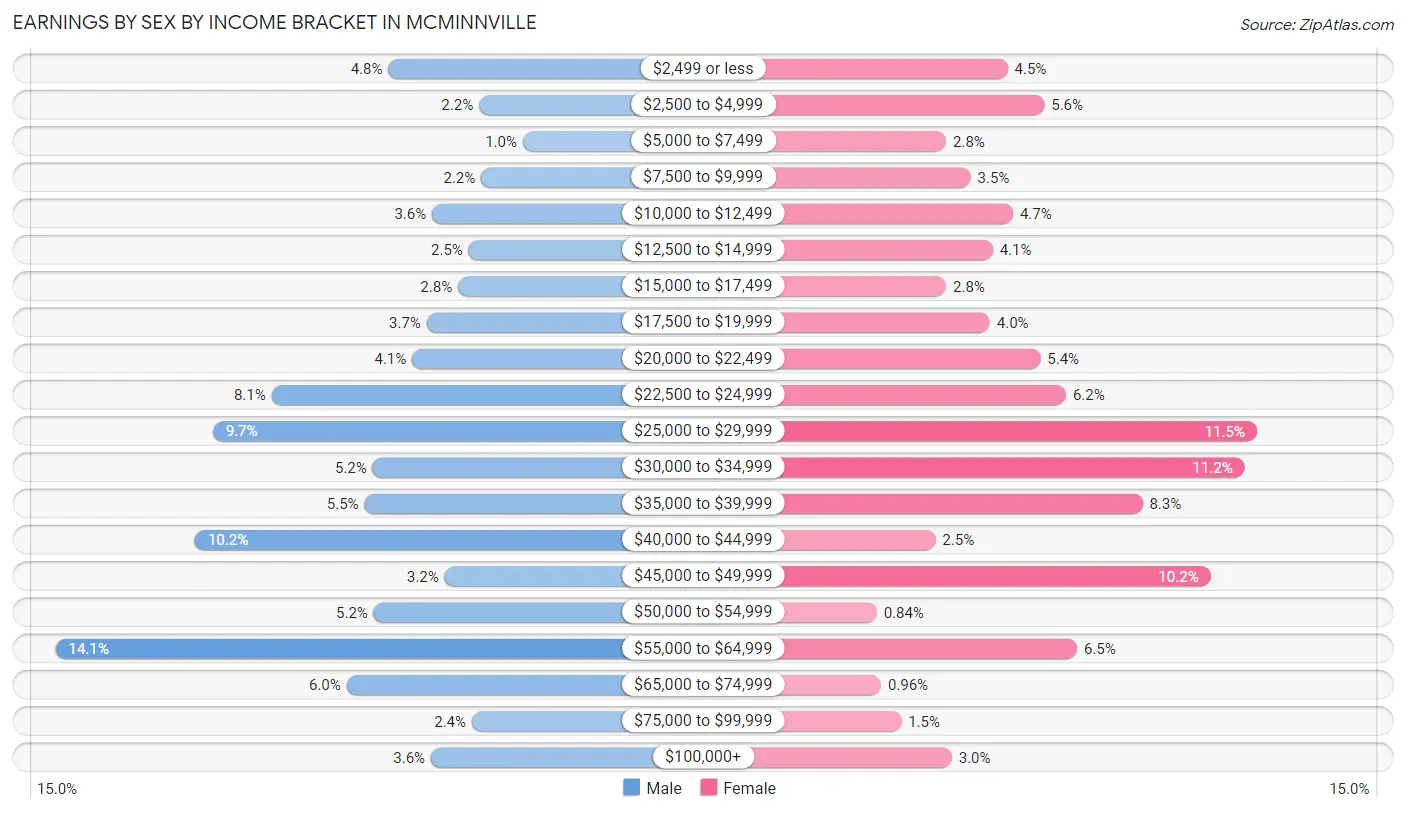
Earnings by Sex by Income Bracket in Mcminnville
The most common earnings brackets in Mcminnville are $55,000 to $64,999 for men (482 | 14.1%) and $25,000 to $29,999 for women (301 | 11.5%).
| Income | Male | Female |
| $2,499 or less | 163 (4.8%) | 118 (4.5%) |
| $2,500 to $4,999 | 76 (2.2%) | 145 (5.6%) |
| $5,000 to $7,499 | 34 (1.0%) | 73 (2.8%) |
| $7,500 to $9,999 | 74 (2.2%) | 91 (3.5%) |
| $10,000 to $12,499 | 121 (3.5%) | 122 (4.7%) |
| $12,500 to $14,999 | 86 (2.5%) | 107 (4.1%) |
| $15,000 to $17,499 | 96 (2.8%) | 73 (2.8%) |
| $17,500 to $19,999 | 126 (3.7%) | 105 (4.0%) |
| $20,000 to $22,499 | 140 (4.1%) | 142 (5.4%) |
| $22,500 to $24,999 | 275 (8.1%) | 161 (6.2%) |
| $25,000 to $29,999 | 331 (9.7%) | 301 (11.5%) |
| $30,000 to $34,999 | 178 (5.2%) | 292 (11.2%) |
| $35,000 to $39,999 | 186 (5.4%) | 217 (8.3%) |
| $40,000 to $44,999 | 348 (10.2%) | 65 (2.5%) |
| $45,000 to $49,999 | 109 (3.2%) | 267 (10.2%) |
| $50,000 to $54,999 | 177 (5.2%) | 22 (0.8%) |
| $55,000 to $64,999 | 482 (14.1%) | 169 (6.5%) |
| $65,000 to $74,999 | 203 (5.9%) | 25 (1.0%) |
| $75,000 to $99,999 | 83 (2.4%) | 40 (1.5%) |
| $100,000+ | 122 (3.6%) | 77 (2.9%) |
| Total | 3,410 (100.0%) | 2,612 (100.0%) |
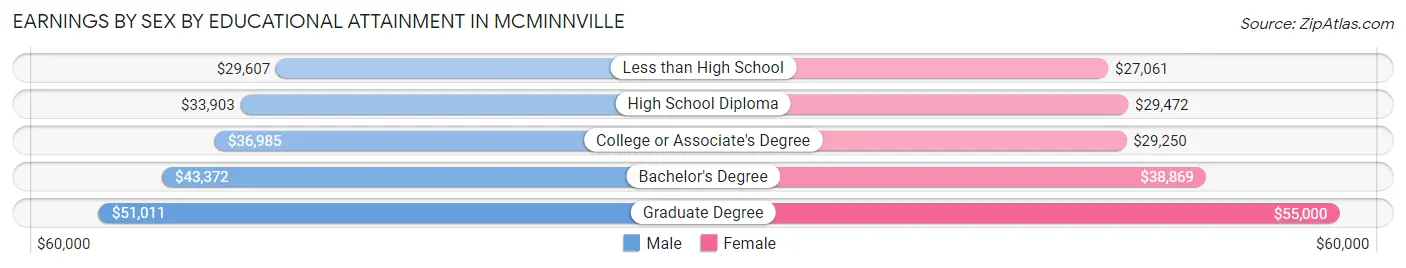
Earnings by Sex by Educational Attainment in Mcminnville
Average earnings in Mcminnville are $36,850 for men and $30,460 for women, a difference of 17.3%. Men with an educational attainment of graduate degree enjoy the highest average annual earnings of $51,011, while those with less than high school education earn the least with $29,607. Women with an educational attainment of graduate degree earn the most with the average annual earnings of $55,000, while those with less than high school education have the smallest earnings of $27,061.
| Educational Attainment | Male Income | Female Income |
| Less than High School | $29,607 | $27,061 |
| High School Diploma | $33,903 | $29,472 |
| College or Associate's Degree | $36,985 | $29,250 |
| Bachelor's Degree | $43,372 | $38,869 |
| Graduate Degree | $51,011 | $55,000 |
| Total | $36,850 | $30,460 |
Family Income in Mcminnville
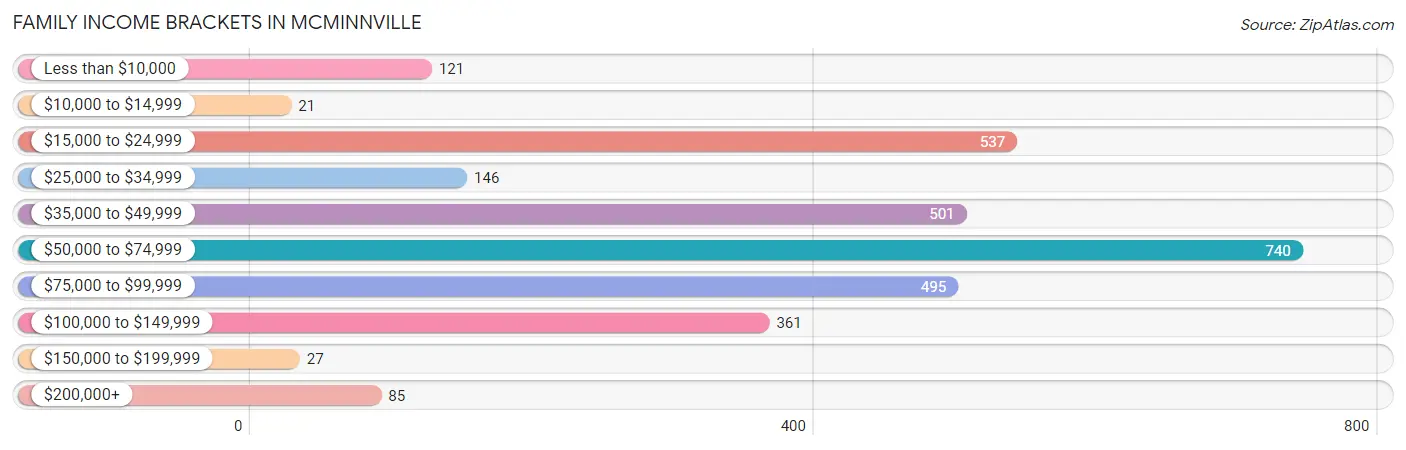
Family Income Brackets in Mcminnville
According to the Mcminnville family income data, there are 740 families falling into the $50,000 to $74,999 income range, which is the most common income bracket and makes up 24.4% of all families. Conversely, the $10,000 to $14,999 income bracket is the least frequent group with only 21 families (0.7%) belonging to this category.
| Income Bracket | # Families | % Families |
| Less than $10,000 | 121 | 4.0% |
| $10,000 to $14,999 | 21 | 0.7% |
| $15,000 to $24,999 | 537 | 17.7% |
| $25,000 to $34,999 | 146 | 4.8% |
| $35,000 to $49,999 | 501 | 16.5% |
| $50,000 to $74,999 | 740 | 24.4% |
| $75,000 to $99,999 | 495 | 16.3% |
| $100,000 to $149,999 | 361 | 11.9% |
| $150,000 to $199,999 | 27 | 0.9% |
| $200,000+ | 85 | 2.8% |
Family Income by Famaliy Size in Mcminnville
7+ person families (24 | 0.8%) account for the highest median family income in Mcminnville with $123,750 per family, while 2-person families (1,369 | 45.1%) have the highest median income of $27,348 per family member.
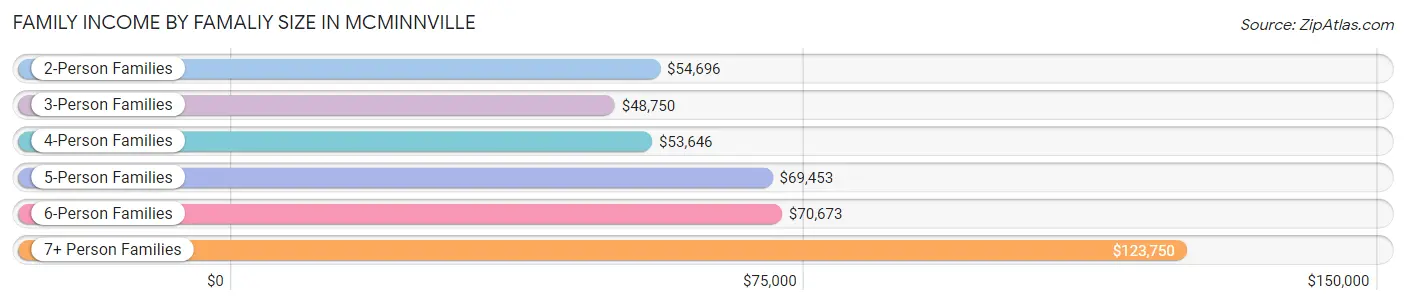
| Income Bracket | # Families | Median Income |
| 2-Person Families | 1,369 (45.1%) | $54,696 |
| 3-Person Families | 836 (27.6%) | $48,750 |
| 4-Person Families | 373 (12.3%) | $53,646 |
| 5-Person Families | 383 (12.6%) | $69,453 |
| 6-Person Families | 49 (1.6%) | $70,673 |
| 7+ Person Families | 24 (0.8%) | $123,750 |
| Total | 3,034 (100.0%) | $54,040 |
Family Income by Number of Earners in Mcminnville
The median family income in Mcminnville is $54,040, with families comprising 3+ earners (236) having the highest median family income of $100,880, while families with no earners (548) have the lowest median family income of $42,330, accounting for 7.8% and 18.1% of families, respectively.
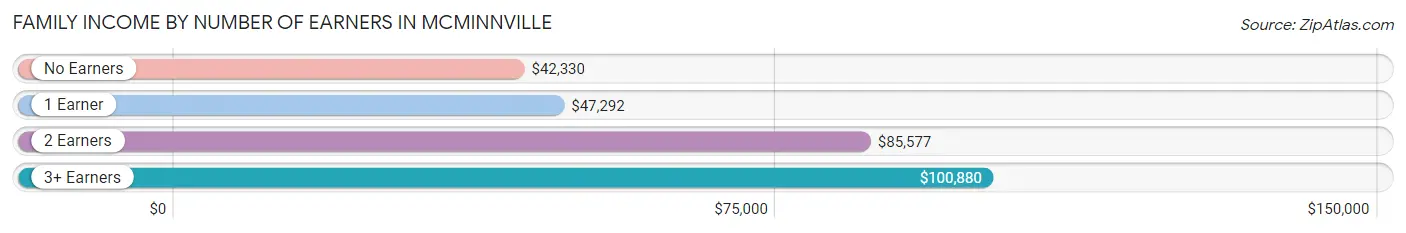
| Number of Earners | # Families | Median Income |
| No Earners | 548 (18.1%) | $42,330 |
| 1 Earner | 1,340 (44.2%) | $47,292 |
| 2 Earners | 910 (30.0%) | $85,577 |
| 3+ Earners | 236 (7.8%) | $100,880 |
| Total | 3,034 (100.0%) | $54,040 |
Household Income in Mcminnville
Household Income Brackets in Mcminnville
With 1,159 households falling in the category, the $50,000 to $74,999 income range is the most frequent in Mcminnville, accounting for 20.8% of all households. In contrast, only 78 households (1.4%) fall into the $150,000 to $199,999 income bracket, making it the least populous group.
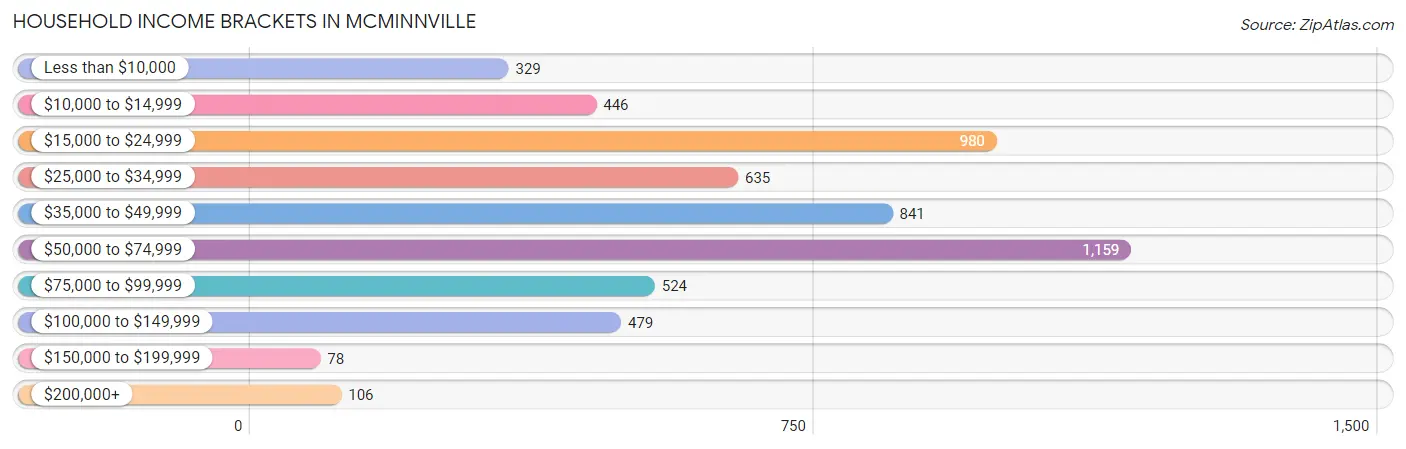
| Income Bracket | # Households | % Households |
| Less than $10,000 | 329 | 5.9% |
| $10,000 to $14,999 | 446 | 8.0% |
| $15,000 to $24,999 | 980 | 17.6% |
| $25,000 to $34,999 | 635 | 11.4% |
| $35,000 to $49,999 | 841 | 15.1% |
| $50,000 to $74,999 | 1,159 | 20.8% |
| $75,000 to $99,999 | 524 | 9.4% |
| $100,000 to $149,999 | 479 | 8.6% |
| $150,000 to $199,999 | 78 | 1.4% |
| $200,000+ | 106 | 1.9% |
Household Income by Householder Age in Mcminnville
The median household income in Mcminnville is $42,130, with the highest median household income of $49,587 found in the 45 to 64 years age bracket for the primary householder. A total of 1,842 households (33.1%) fall into this category. Meanwhile, the 65+ years age bracket for the primary householder has the lowest median household income of $32,297, with 1,724 households (30.9%) in this group.
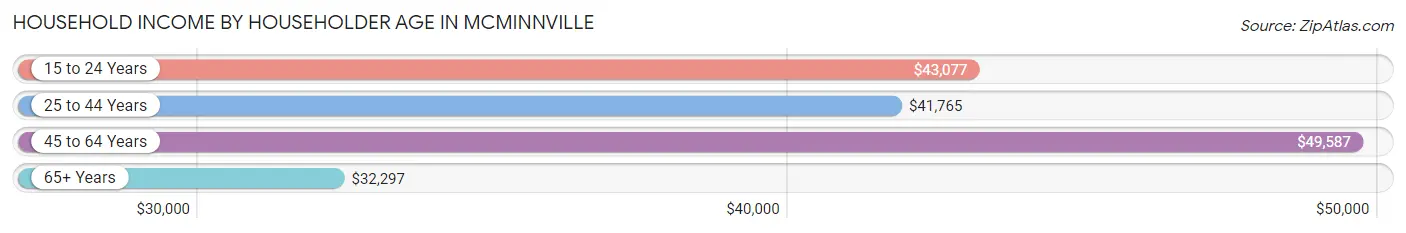
| Income Bracket | # Households | Median Income |
| 15 to 24 Years | 286 (5.1%) | $43,077 |
| 25 to 44 Years | 1,719 (30.9%) | $41,765 |
| 45 to 64 Years | 1,842 (33.1%) | $49,587 |
| 65+ Years | 1,724 (30.9%) | $32,297 |
| Total | 5,571 (100.0%) | $42,130 |
Poverty in Mcminnville
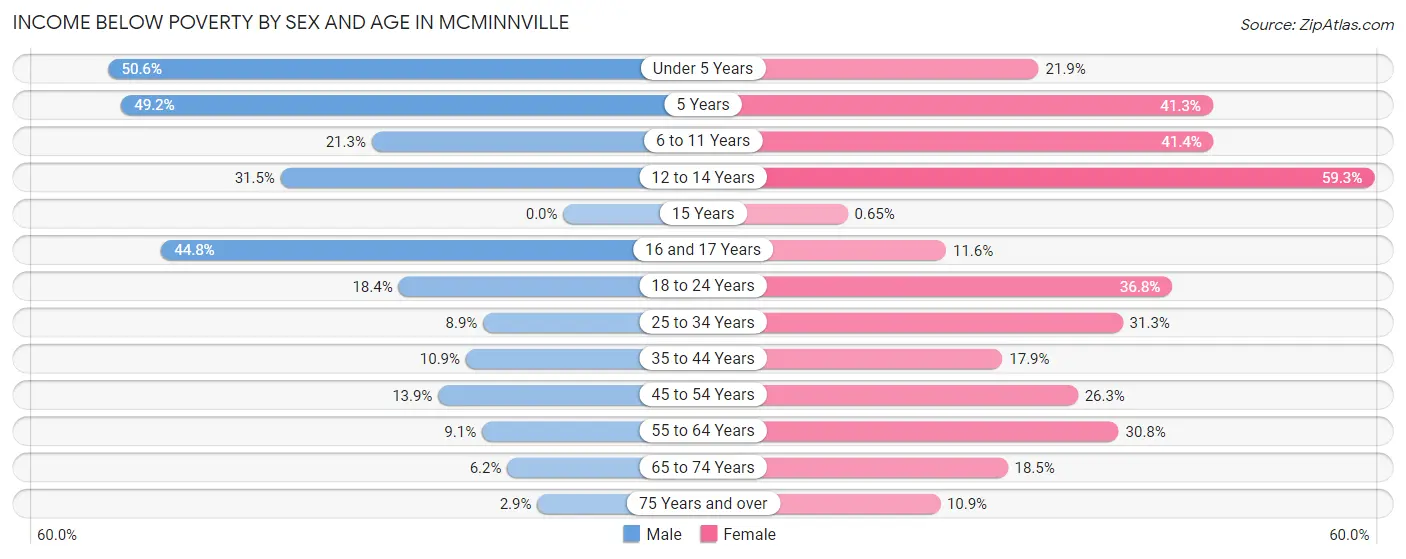
Income Below Poverty by Sex and Age in Mcminnville
With 16.2% poverty level for males and 26.8% for females among the residents of Mcminnville, under 5 year old males and 12 to 14 year old females are the most vulnerable to poverty, with 159 males (50.6%) and 131 females (59.3%) in their respective age groups living below the poverty level.
| Age Bracket | Male | Female |
| Under 5 Years | 159 (50.6%) | 48 (21.9%) |
| 5 Years | 127 (49.2%) | 19 (41.3%) |
| 6 to 11 Years | 99 (21.3%) | 330 (41.4%) |
| 12 to 14 Years | 51 (31.5%) | 131 (59.3%) |
| 15 Years | 0 (0.0%) | 1 (0.6%) |
| 16 and 17 Years | 64 (44.8%) | 13 (11.6%) |
| 18 to 24 Years | 123 (18.4%) | 181 (36.8%) |
| 25 to 34 Years | 89 (8.9%) | 279 (31.3%) |
| 35 to 44 Years | 96 (10.9%) | 150 (17.9%) |
| 45 to 54 Years | 99 (13.9%) | 166 (26.3%) |
| 55 to 64 Years | 74 (9.1%) | 324 (30.8%) |
| 65 to 74 Years | 30 (6.2%) | 134 (18.5%) |
| 75 Years and over | 11 (2.9%) | 82 (10.9%) |
| Total | 1,022 (16.2%) | 1,858 (26.8%) |
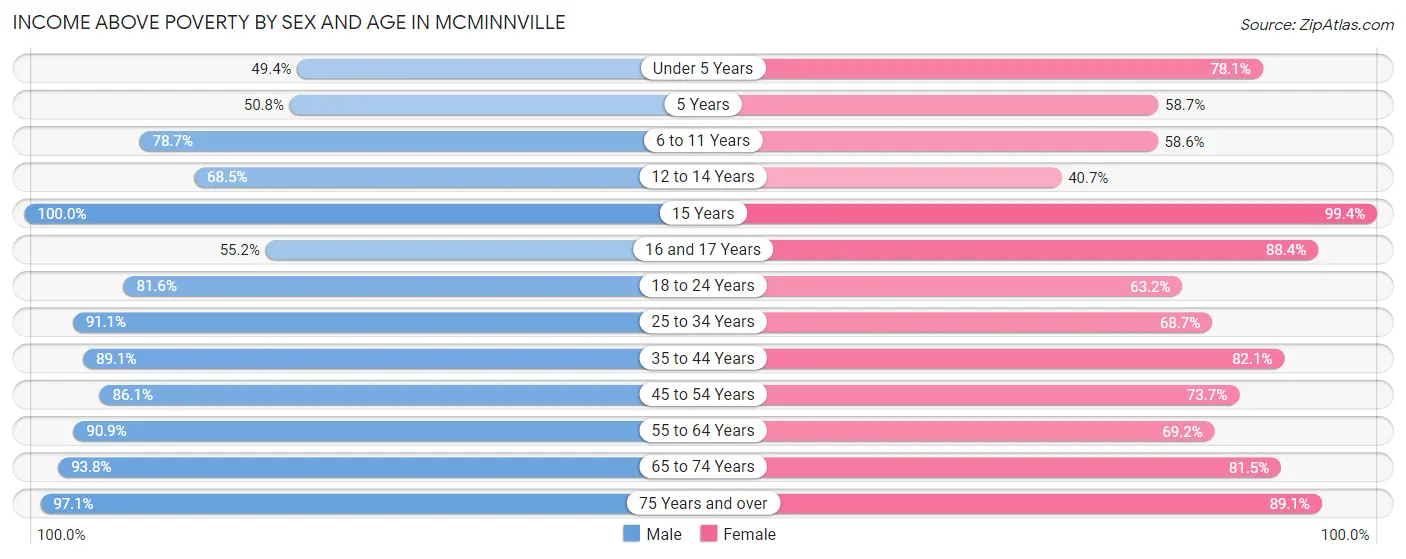
Income Above Poverty by Sex and Age in Mcminnville
According to the poverty statistics in Mcminnville, males aged 15 years and females aged 15 years are the age groups that are most secure financially, with 100.0% of males and 99.4% of females in these age groups living above the poverty line.
| Age Bracket | Male | Female |
| Under 5 Years | 155 (49.4%) | 171 (78.1%) |
| 5 Years | 131 (50.8%) | 27 (58.7%) |
| 6 to 11 Years | 365 (78.7%) | 467 (58.6%) |
| 12 to 14 Years | 111 (68.5%) | 90 (40.7%) |
| 15 Years | 43 (100.0%) | 154 (99.4%) |
| 16 and 17 Years | 79 (55.2%) | 99 (88.4%) |
| 18 to 24 Years | 547 (81.6%) | 311 (63.2%) |
| 25 to 34 Years | 908 (91.1%) | 613 (68.7%) |
| 35 to 44 Years | 788 (89.1%) | 689 (82.1%) |
| 45 to 54 Years | 611 (86.1%) | 466 (73.7%) |
| 55 to 64 Years | 743 (90.9%) | 727 (69.2%) |
| 65 to 74 Years | 451 (93.8%) | 592 (81.5%) |
| 75 Years and over | 368 (97.1%) | 668 (89.1%) |
| Total | 5,300 (83.8%) | 5,074 (73.2%) |
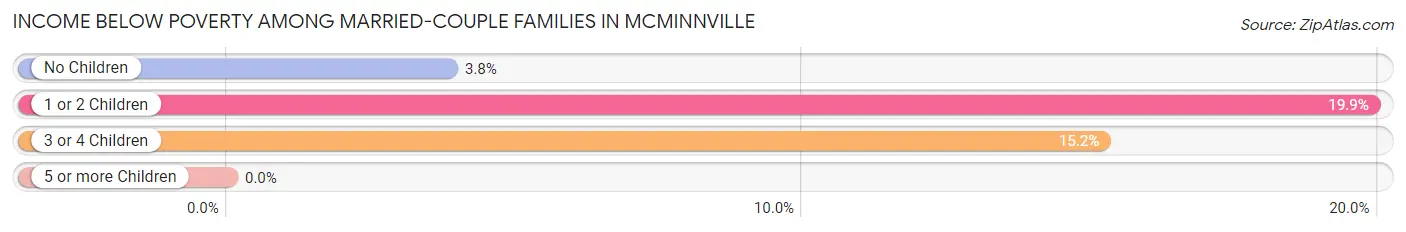
Income Below Poverty Among Married-Couple Families in Mcminnville
The poverty statistics for married-couple families in Mcminnville show that 9.6% or 165 of the total 1,724 families live below the poverty line. Families with 1 or 2 children have the highest poverty rate of 19.9%, comprising of 105 families. On the other hand, families with no children have the lowest poverty rate of 3.8%, which includes 41 families.
| Children | Above Poverty | Below Poverty |
| No Children | 1,030 (96.2%) | 41 (3.8%) |
| 1 or 2 Children | 423 (80.1%) | 105 (19.9%) |
| 3 or 4 Children | 106 (84.8%) | 19 (15.2%) |
| 5 or more Children | 0 (0.0%) | 0 (0.0%) |
| Total | 1,559 (90.4%) | 165 (9.6%) |
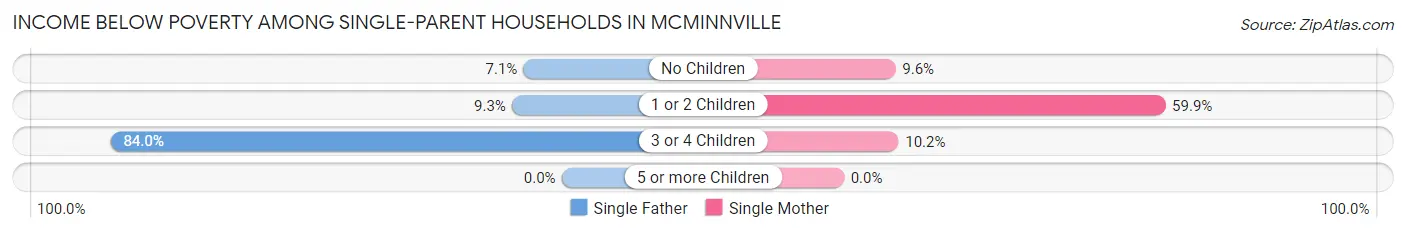
Income Below Poverty Among Single-Parent Households in Mcminnville
According to the poverty data in Mcminnville, 18.0% or 71 single-father households and 36.9% or 338 single-mother households are living below the poverty line. Among single-father households, those with 3 or 4 children have the highest poverty rate, with 42 households (84.0%) experiencing poverty. Likewise, among single-mother households, those with 1 or 2 children have the highest poverty rate, with 297 households (59.9%) falling below the poverty line.
| Children | Single Father | Single Mother |
| No Children | 10 (7.1%) | 29 (9.6%) |
| 1 or 2 Children | 19 (9.3%) | 297 (59.9%) |
| 3 or 4 Children | 42 (84.0%) | 12 (10.2%) |
| 5 or more Children | 0 (0.0%) | 0 (0.0%) |
| Total | 71 (18.0%) | 338 (36.9%) |
Income Below Poverty Among Married-Couple vs Single-Parent Households in Mcminnville
The poverty data for Mcminnville shows that 165 of the married-couple family households (9.6%) and 409 of the single-parent households (31.2%) are living below the poverty level. Within the married-couple family households, those with 1 or 2 children have the highest poverty rate, with 105 households (19.9%) falling below the poverty line. Among the single-parent households, those with 1 or 2 children have the highest poverty rate, with 316 household (45.1%) living below poverty.
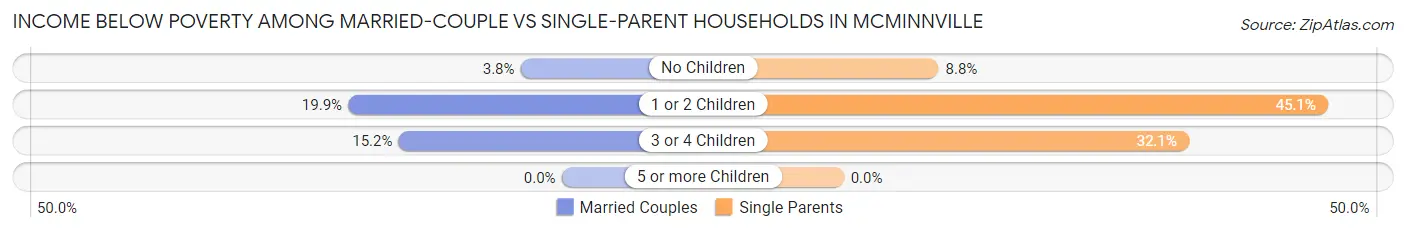
| Children | Married-Couple Families | Single-Parent Households |
| No Children | 41 (3.8%) | 39 (8.8%) |
| 1 or 2 Children | 105 (19.9%) | 316 (45.1%) |
| 3 or 4 Children | 19 (15.2%) | 54 (32.1%) |
| 5 or more Children | 0 (0.0%) | 0 (0.0%) |
| Total | 165 (9.6%) | 409 (31.2%) |
Employment Characteristics in Mcminnville
Employment by Class of Employer in Mcminnville
Among the 5,304 employed individuals in Mcminnville, private company employees (3,979 | 75.0%), self-employed (not incorporated) (419 | 7.9%), and local government employees (364 | 6.9%) make up the most common classes of employment.
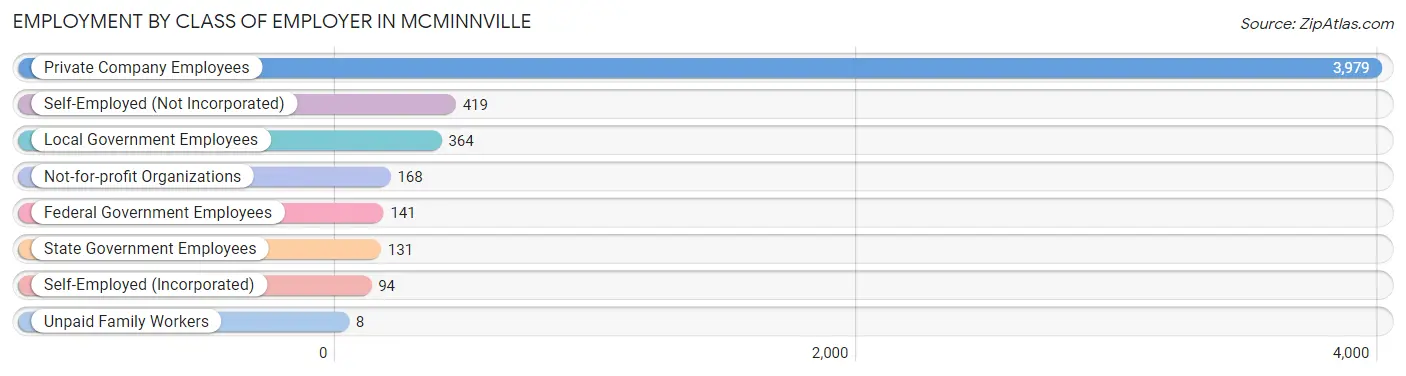
| Employer Class | # Employees | % Employees |
| Private Company Employees | 3,979 | 75.0% |
| Self-Employed (Incorporated) | 94 | 1.8% |
| Self-Employed (Not Incorporated) | 419 | 7.9% |
| Not-for-profit Organizations | 168 | 3.2% |
| Local Government Employees | 364 | 6.9% |
| State Government Employees | 131 | 2.5% |
| Federal Government Employees | 141 | 2.7% |
| Unpaid Family Workers | 8 | 0.2% |
| Total | 5,304 | 100.0% |
Employment Status by Age in Mcminnville
According to the labor force statistics for Mcminnville, out of the total population over 16 years of age (11,037), 51.4% or 5,673 individuals are in the labor force, with 5.3% or 301 of them unemployed. The age group with the highest labor force participation rate is 25 to 29 years, with 80.3% or 821 individuals in the labor force. Within the labor force, the 16 to 19 years age range has the highest percentage of unemployed individuals, with 16.5% or 47 of them being unemployed.
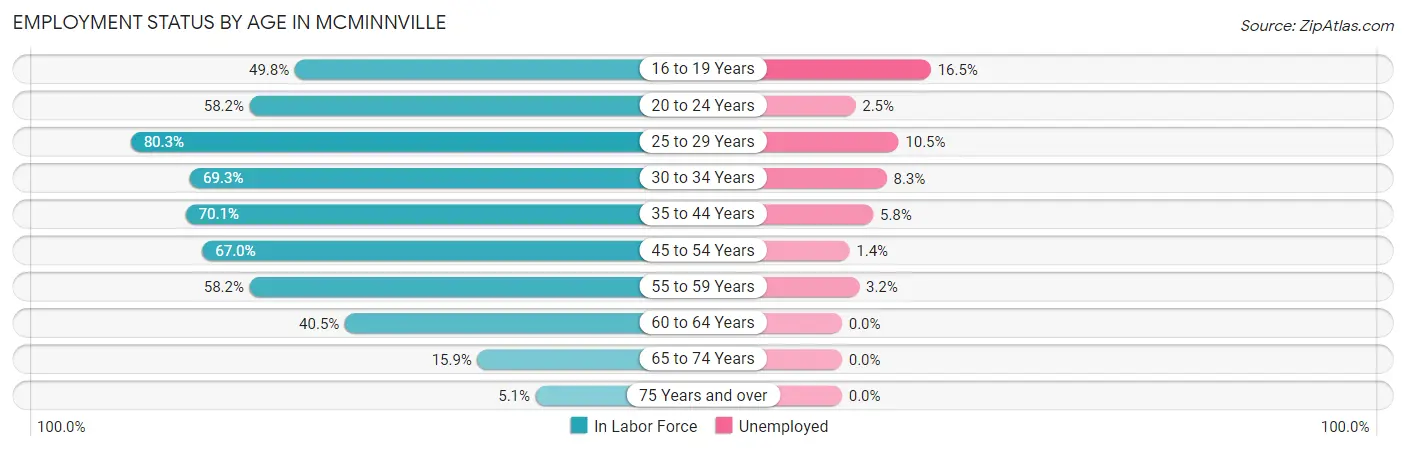
| Age Bracket | In Labor Force | Unemployed |
| 16 to 19 Years | 285 (49.8%) | 47 (16.5%) |
| 20 to 24 Years | 528 (58.2%) | 13 (2.5%) |
| 25 to 29 Years | 821 (80.3%) | 86 (10.5%) |
| 30 to 34 Years | 637 (69.3%) | 53 (8.3%) |
| 35 to 44 Years | 1,248 (70.1%) | 72 (5.8%) |
| 45 to 54 Years | 939 (67.0%) | 13 (1.4%) |
| 55 to 59 Years | 569 (58.2%) | 18 (3.2%) |
| 60 to 64 Years | 370 (40.5%) | 0 (0.0%) |
| 65 to 74 Years | 210 (15.9%) | 0 (0.0%) |
| 75 Years and over | 62 (5.1%) | 0 (0.0%) |
| Total | 5,673 (51.4%) | 301 (5.3%) |
Employment Status by Educational Attainment in Mcminnville
According to labor force statistics for Mcminnville, 65.3% of individuals (4,581) out of the total population between 25 and 64 years of age (7,015) are in the labor force, with 5.3% or 243 of them being unemployed. The group with the highest labor force participation rate are those with the educational attainment of college / associate degree, with 81.4% or 1,245 individuals in the labor force. Within the labor force, individuals with high school diploma education have the highest percentage of unemployment, with 6.7% or 147 of them being unemployed.
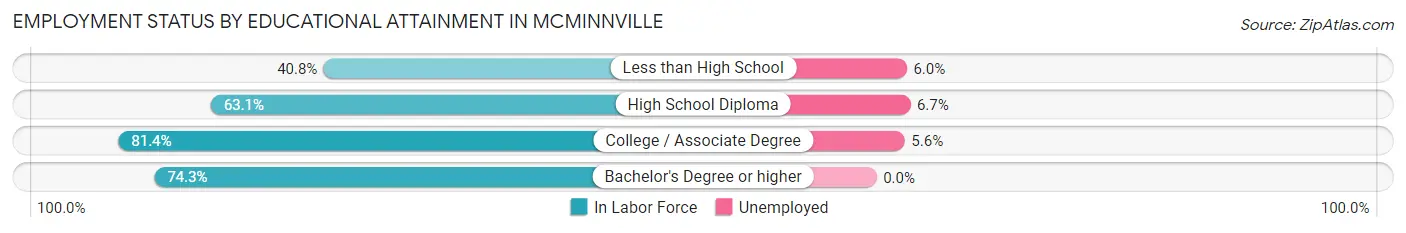
| Educational Attainment | In Labor Force | Unemployed |
| Less than High School | 420 (40.8%) | 62 (6.0%) |
| High School Diploma | 2,200 (63.1%) | 234 (6.7%) |
| College / Associate Degree | 1,245 (81.4%) | 86 (5.6%) |
| Bachelor's Degree or higher | 721 (74.3%) | 0 (0.0%) |
| Total | 4,581 (65.3%) | 372 (5.3%) |
Employment Occupations by Sex in Mcminnville
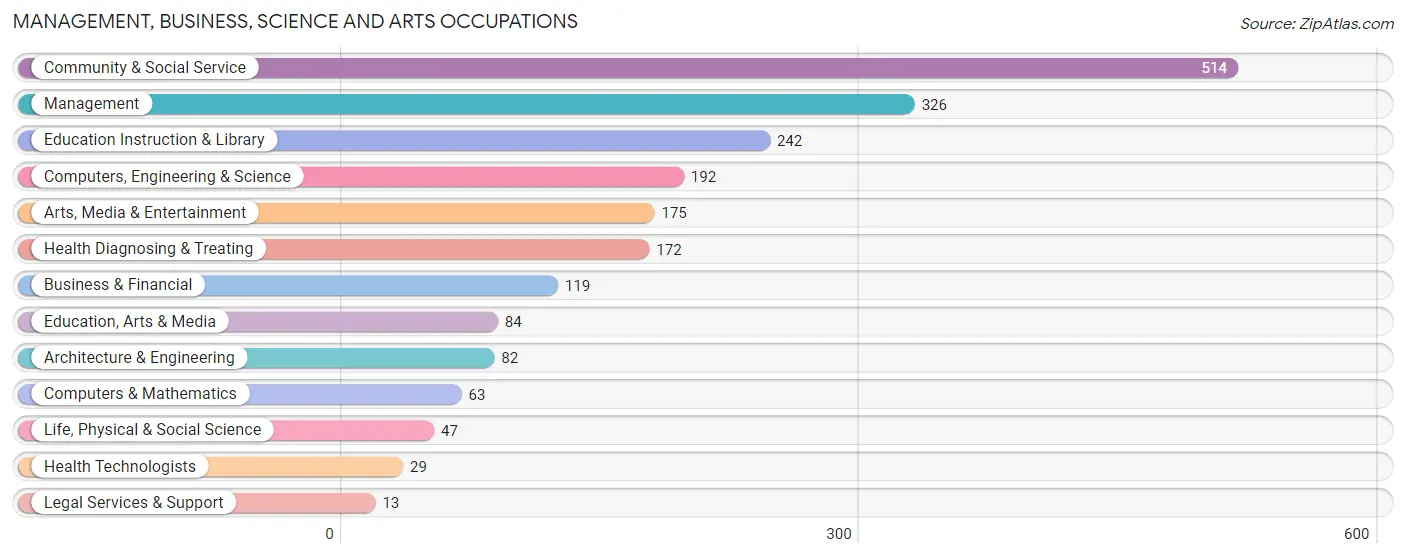
Management, Business, Science and Arts Occupations
The most common Management, Business, Science and Arts occupations in Mcminnville are Community & Social Service (514 | 9.6%), Management (326 | 6.1%), Education Instruction & Library (242 | 4.5%), Computers, Engineering & Science (192 | 3.6%), and Arts, Media & Entertainment (175 | 3.3%).
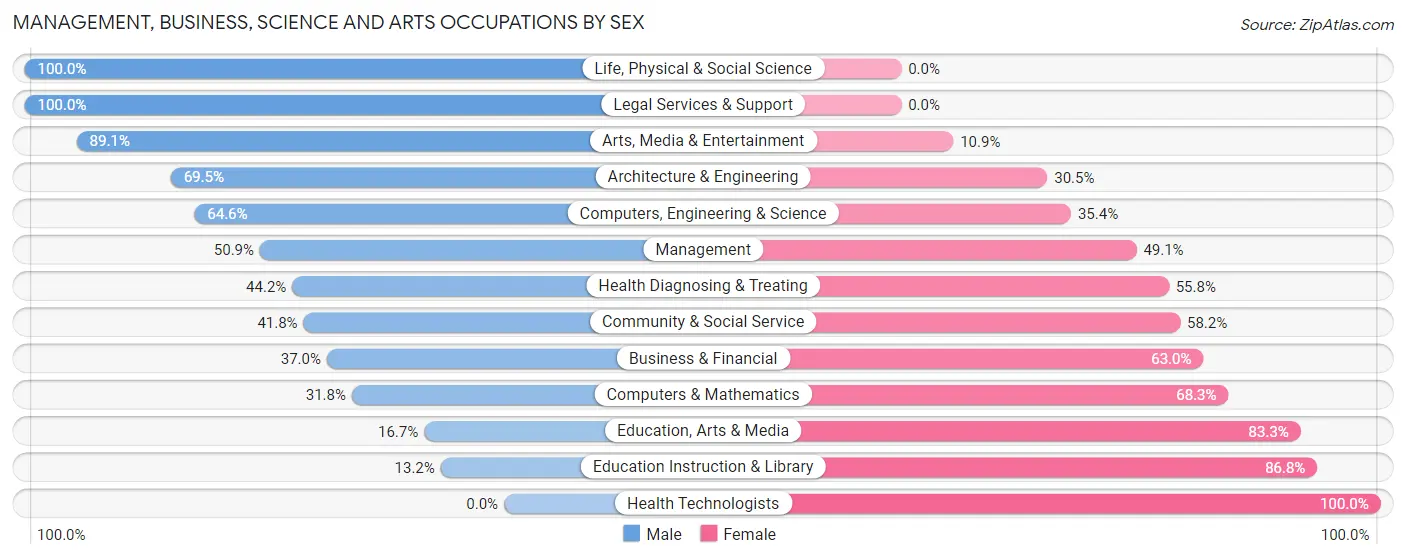
Management, Business, Science and Arts Occupations by Sex
Within the Management, Business, Science and Arts occupations in Mcminnville, the most male-oriented occupations are Life, Physical & Social Science (100.0%), Legal Services & Support (100.0%), and Arts, Media & Entertainment (89.1%), while the most female-oriented occupations are Health Technologists (100.0%), Education Instruction & Library (86.8%), and Education, Arts & Media (83.3%).
| Occupation | Male | Female |
| Management | 166 (50.9%) | 160 (49.1%) |
| Business & Financial | 44 (37.0%) | 75 (63.0%) |
| Computers, Engineering & Science | 124 (64.6%) | 68 (35.4%) |
| Computers & Mathematics | 20 (31.8%) | 43 (68.2%) |
| Architecture & Engineering | 57 (69.5%) | 25 (30.5%) |
| Life, Physical & Social Science | 47 (100.0%) | 0 (0.0%) |
| Community & Social Service | 215 (41.8%) | 299 (58.2%) |
| Education, Arts & Media | 14 (16.7%) | 70 (83.3%) |
| Legal Services & Support | 13 (100.0%) | 0 (0.0%) |
| Education Instruction & Library | 32 (13.2%) | 210 (86.8%) |
| Arts, Media & Entertainment | 156 (89.1%) | 19 (10.9%) |
| Health Diagnosing & Treating | 76 (44.2%) | 96 (55.8%) |
| Health Technologists | 0 (0.0%) | 29 (100.0%) |
| Total (Category) | 625 (47.2%) | 698 (52.8%) |
| Total (Overall) | 3,099 (57.8%) | 2,267 (42.2%) |
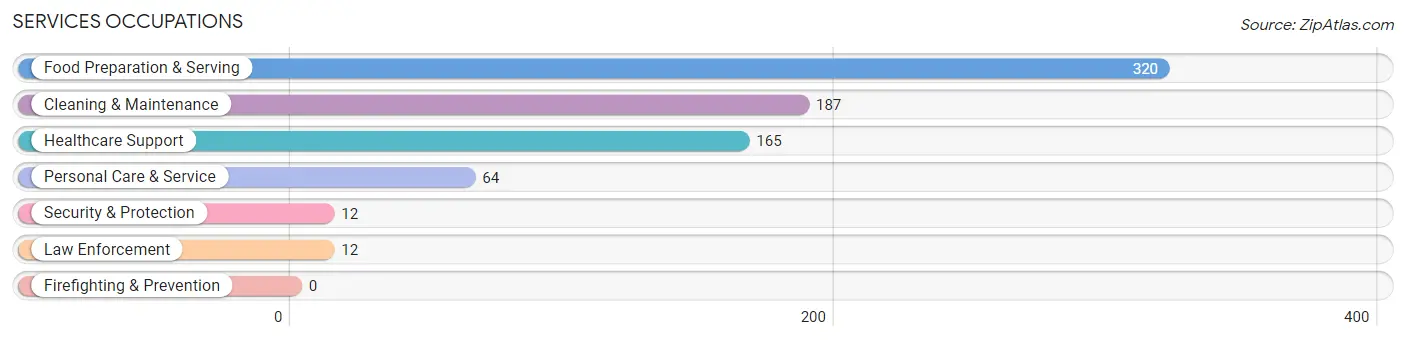
Services Occupations
The most common Services occupations in Mcminnville are Food Preparation & Serving (320 | 6.0%), Cleaning & Maintenance (187 | 3.5%), Healthcare Support (165 | 3.1%), Personal Care & Service (64 | 1.2%), and Security & Protection (12 | 0.2%).
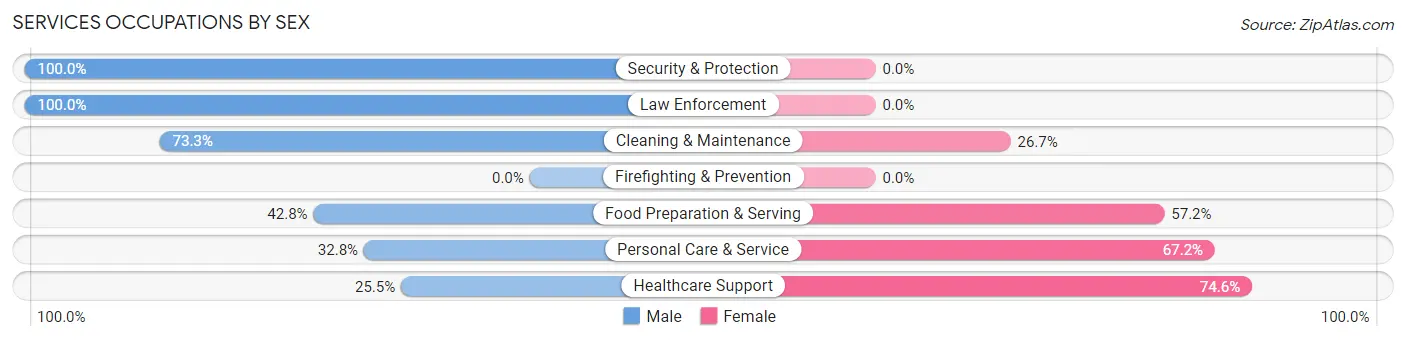
Services Occupations by Sex
Within the Services occupations in Mcminnville, the most male-oriented occupations are Security & Protection (100.0%), Law Enforcement (100.0%), and Cleaning & Maintenance (73.3%), while the most female-oriented occupations are Healthcare Support (74.6%), Personal Care & Service (67.2%), and Food Preparation & Serving (57.2%).
| Occupation | Male | Female |
| Healthcare Support | 42 (25.5%) | 123 (74.6%) |
| Security & Protection | 12 (100.0%) | 0 (0.0%) |
| Firefighting & Prevention | 0 (0.0%) | 0 (0.0%) |
| Law Enforcement | 12 (100.0%) | 0 (0.0%) |
| Food Preparation & Serving | 137 (42.8%) | 183 (57.2%) |
| Cleaning & Maintenance | 137 (73.3%) | 50 (26.7%) |
| Personal Care & Service | 21 (32.8%) | 43 (67.2%) |
| Total (Category) | 349 (46.7%) | 399 (53.3%) |
| Total (Overall) | 3,099 (57.8%) | 2,267 (42.2%) |
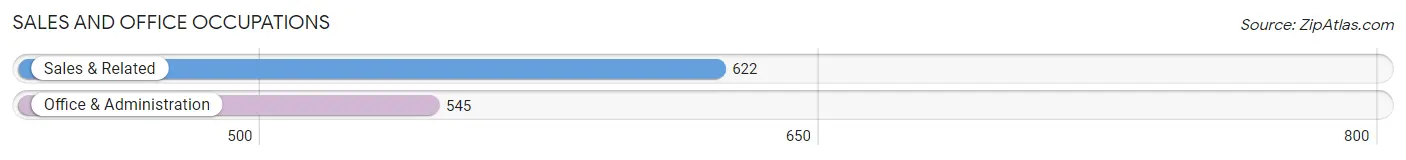
Sales and Office Occupations
The most common Sales and Office occupations in Mcminnville are Sales & Related (622 | 11.6%), and Office & Administration (545 | 10.2%).
Sales and Office Occupations by Sex
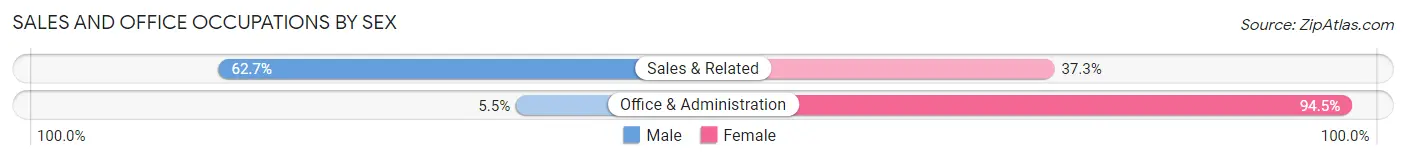
| Occupation | Male | Female |
| Sales & Related | 390 (62.7%) | 232 (37.3%) |
| Office & Administration | 30 (5.5%) | 515 (94.5%) |
| Total (Category) | 420 (36.0%) | 747 (64.0%) |
| Total (Overall) | 3,099 (57.8%) | 2,267 (42.2%) |
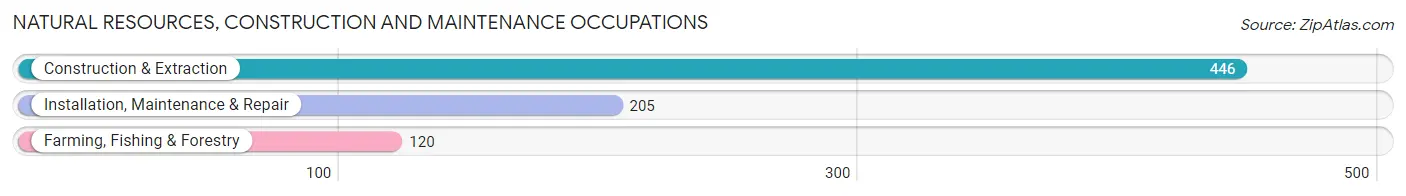
Natural Resources, Construction and Maintenance Occupations
The most common Natural Resources, Construction and Maintenance occupations in Mcminnville are Construction & Extraction (446 | 8.3%), Installation, Maintenance & Repair (205 | 3.8%), and Farming, Fishing & Forestry (120 | 2.2%).
Natural Resources, Construction and Maintenance Occupations by Sex
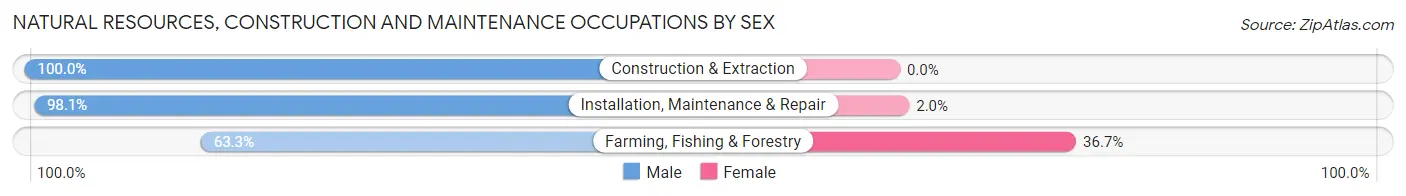
| Occupation | Male | Female |
| Farming, Fishing & Forestry | 76 (63.3%) | 44 (36.7%) |
| Construction & Extraction | 446 (100.0%) | 0 (0.0%) |
| Installation, Maintenance & Repair | 201 (98.1%) | 4 (1.9%) |
| Total (Category) | 723 (93.8%) | 48 (6.2%) |
| Total (Overall) | 3,099 (57.8%) | 2,267 (42.2%) |
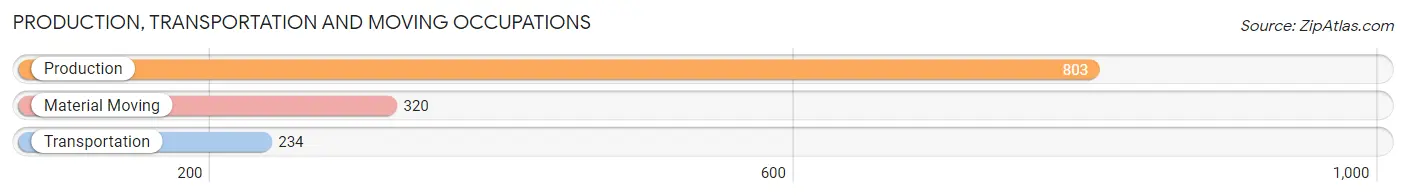
Production, Transportation and Moving Occupations
The most common Production, Transportation and Moving occupations in Mcminnville are Production (803 | 15.0%), Material Moving (320 | 6.0%), and Transportation (234 | 4.4%).
Production, Transportation and Moving Occupations by Sex
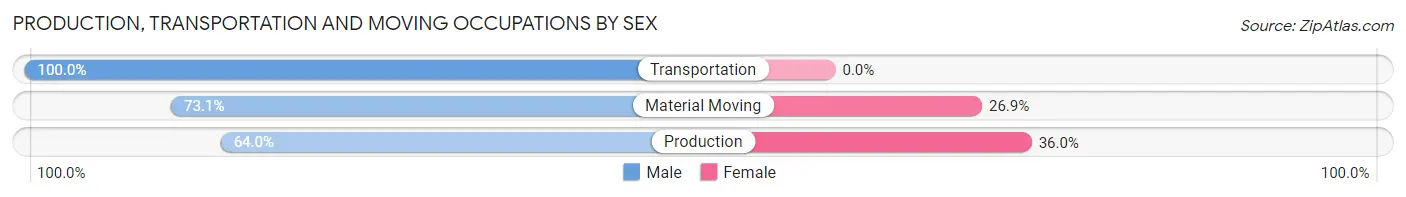
| Occupation | Male | Female |
| Production | 514 (64.0%) | 289 (36.0%) |
| Transportation | 234 (100.0%) | 0 (0.0%) |
| Material Moving | 234 (73.1%) | 86 (26.9%) |
| Total (Category) | 982 (72.4%) | 375 (27.6%) |
| Total (Overall) | 3,099 (57.8%) | 2,267 (42.2%) |
Employment Industries by Sex in Mcminnville
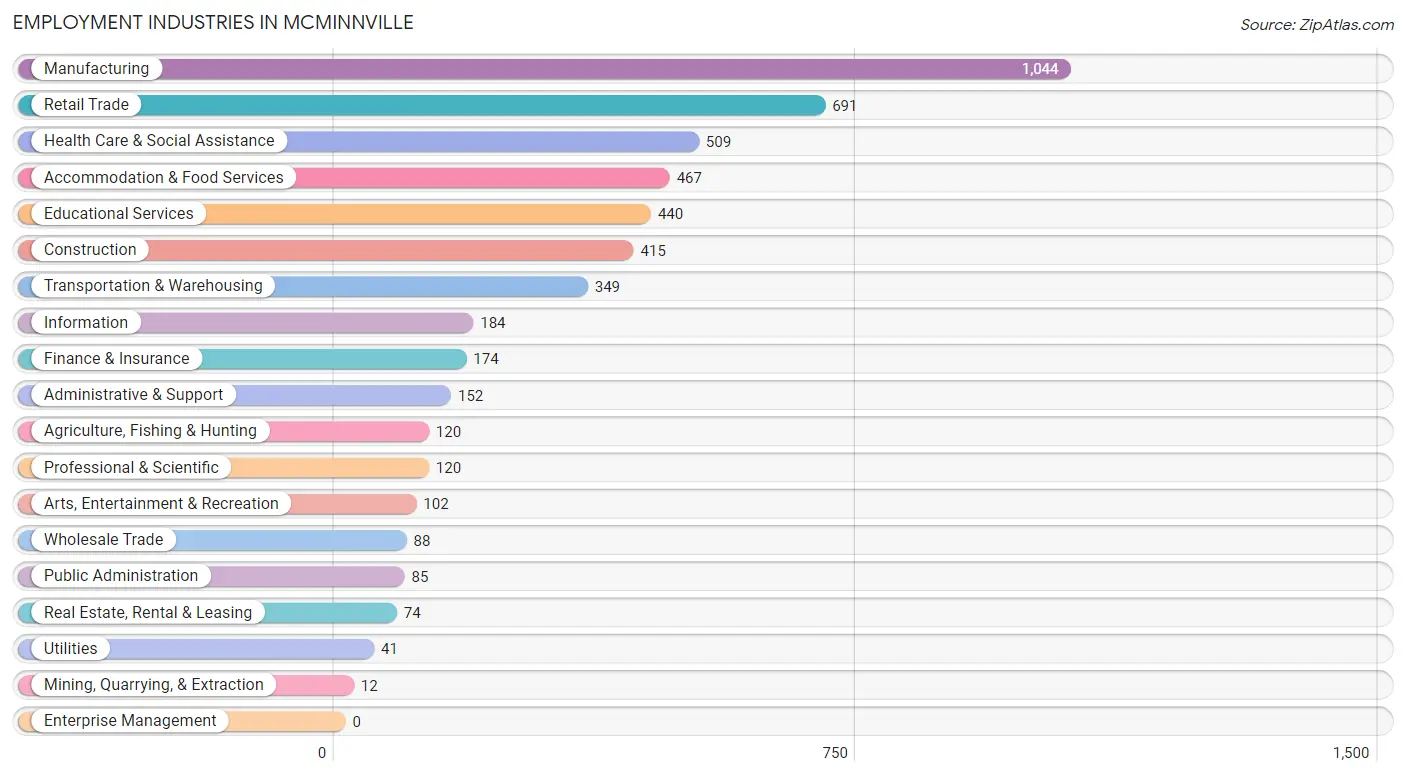
Employment Industries in Mcminnville
The major employment industries in Mcminnville include Manufacturing (1,044 | 19.5%), Retail Trade (691 | 12.9%), Health Care & Social Assistance (509 | 9.5%), Accommodation & Food Services (467 | 8.7%), and Educational Services (440 | 8.2%).
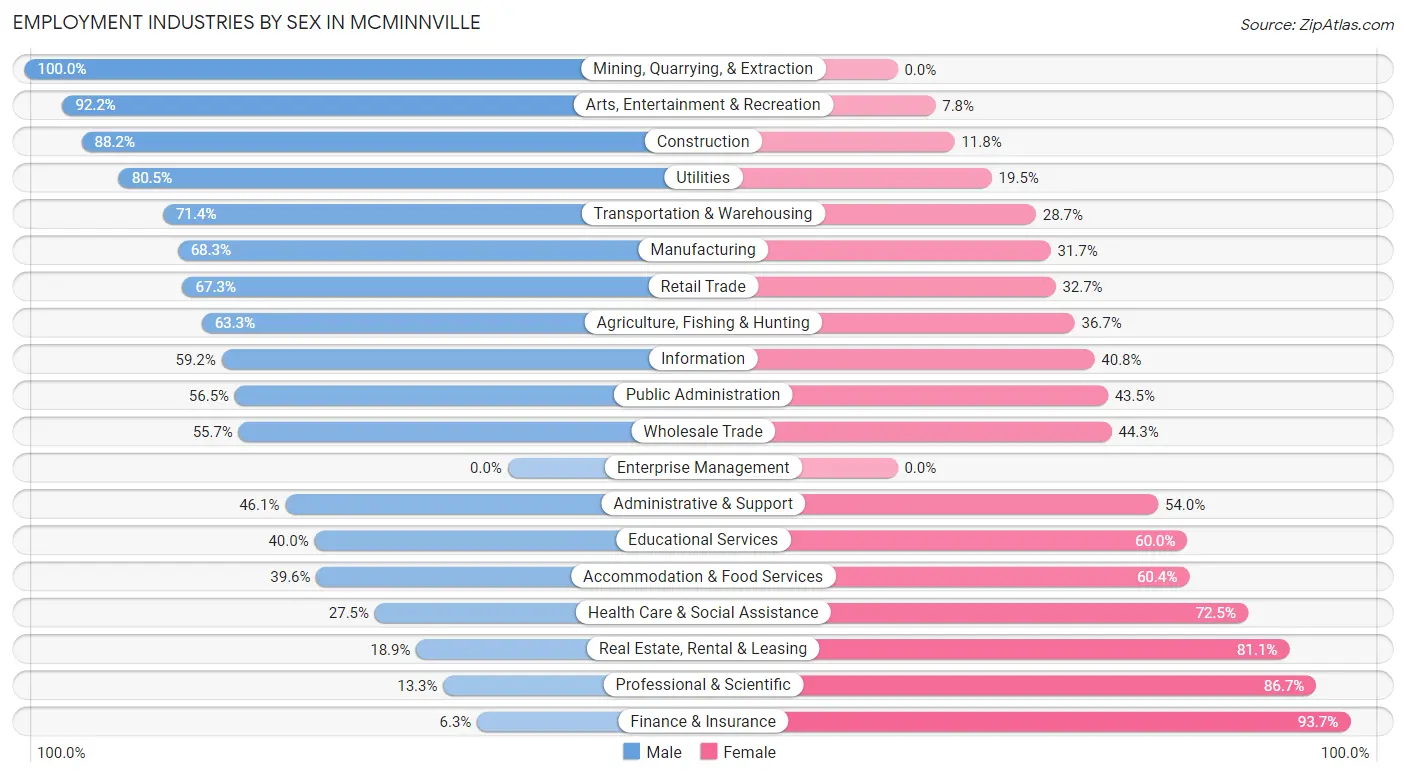
Employment Industries by Sex in Mcminnville
The Mcminnville industries that see more men than women are Mining, Quarrying, & Extraction (100.0%), Arts, Entertainment & Recreation (92.2%), and Construction (88.2%), whereas the industries that tend to have a higher number of women are Finance & Insurance (93.7%), Professional & Scientific (86.7%), and Real Estate, Rental & Leasing (81.1%).
| Industry | Male | Female |
| Agriculture, Fishing & Hunting | 76 (63.3%) | 44 (36.7%) |
| Mining, Quarrying, & Extraction | 12 (100.0%) | 0 (0.0%) |
| Construction | 366 (88.2%) | 49 (11.8%) |
| Manufacturing | 713 (68.3%) | 331 (31.7%) |
| Wholesale Trade | 49 (55.7%) | 39 (44.3%) |
| Retail Trade | 465 (67.3%) | 226 (32.7%) |
| Transportation & Warehousing | 249 (71.4%) | 100 (28.6%) |
| Utilities | 33 (80.5%) | 8 (19.5%) |
| Information | 109 (59.2%) | 75 (40.8%) |
| Finance & Insurance | 11 (6.3%) | 163 (93.7%) |
| Real Estate, Rental & Leasing | 14 (18.9%) | 60 (81.1%) |
| Professional & Scientific | 16 (13.3%) | 104 (86.7%) |
| Enterprise Management | 0 (0.0%) | 0 (0.0%) |
| Administrative & Support | 70 (46.1%) | 82 (53.9%) |
| Educational Services | 176 (40.0%) | 264 (60.0%) |
| Health Care & Social Assistance | 140 (27.5%) | 369 (72.5%) |
| Arts, Entertainment & Recreation | 94 (92.2%) | 8 (7.8%) |
| Accommodation & Food Services | 185 (39.6%) | 282 (60.4%) |
| Public Administration | 48 (56.5%) | 37 (43.5%) |
| Total | 3,099 (57.8%) | 2,267 (42.2%) |
Education in Mcminnville
School Enrollment in Mcminnville
The most common levels of schooling among the 2,896 students in Mcminnville are elementary school (978 | 33.8%), middle school (629 | 21.7%), and high school (567 | 19.6%).
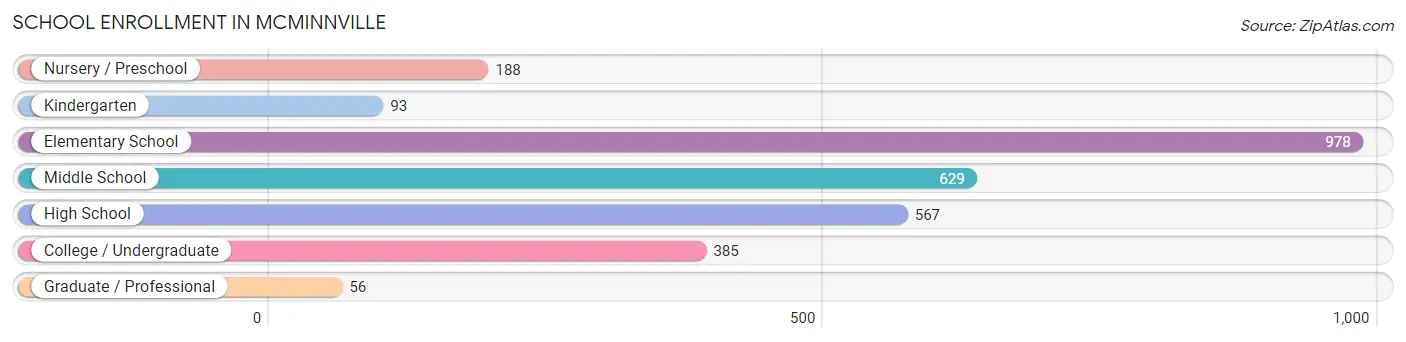
| School Level | # Students | % Students |
| Nursery / Preschool | 188 | 6.5% |
| Kindergarten | 93 | 3.2% |
| Elementary School | 978 | 33.8% |
| Middle School | 629 | 21.7% |
| High School | 567 | 19.6% |
| College / Undergraduate | 385 | 13.3% |
| Graduate / Professional | 56 | 1.9% |
| Total | 2,896 | 100.0% |
School Enrollment by Age by Funding Source in Mcminnville
Out of a total of 2,896 students who are enrolled in schools in Mcminnville, 272 (9.4%) attend a private institution, while the remaining 2,624 (90.6%) are enrolled in public schools. The age group of 3 to 4 year olds has the highest likelihood of being enrolled in private schools, with 35 (46.7% in the age bracket) enrolled. Conversely, the age group of 10 to 14 year olds has the lowest likelihood of being enrolled in a private school, with 756 (97.6% in the age bracket) attending a public institution.
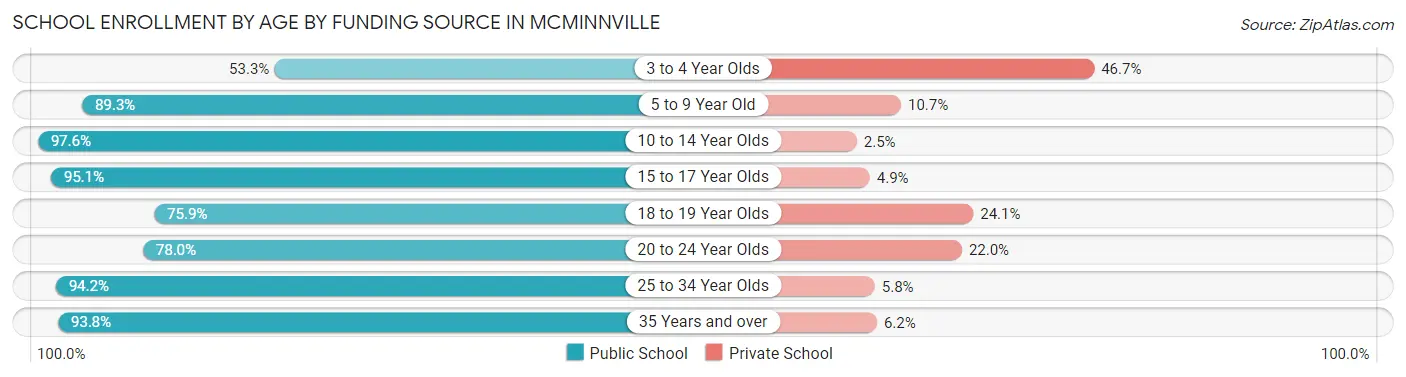
| Age Bracket | Public School | Private School |
| 3 to 4 Year Olds | 40 (53.3%) | 35 (46.7%) |
| 5 to 9 Year Old | 961 (89.3%) | 115 (10.7%) |
| 10 to 14 Year Olds | 756 (97.6%) | 19 (2.5%) |
| 15 to 17 Year Olds | 390 (95.1%) | 20 (4.9%) |
| 18 to 19 Year Olds | 88 (75.9%) | 28 (24.1%) |
| 20 to 24 Year Olds | 138 (78.0%) | 39 (22.0%) |
| 25 to 34 Year Olds | 130 (94.2%) | 8 (5.8%) |
| 35 Years and over | 121 (93.8%) | 8 (6.2%) |
| Total | 2,624 (90.6%) | 272 (9.4%) |
Educational Attainment by Field of Study in Mcminnville
Education (383 | 25.7%), business (280 | 18.8%), science & technology (142 | 9.5%), arts & humanities (126 | 8.5%), and bio, nature & agricultural (122 | 8.2%) are the most common fields of study among 1,490 individuals in Mcminnville who have obtained a bachelor's degree or higher.
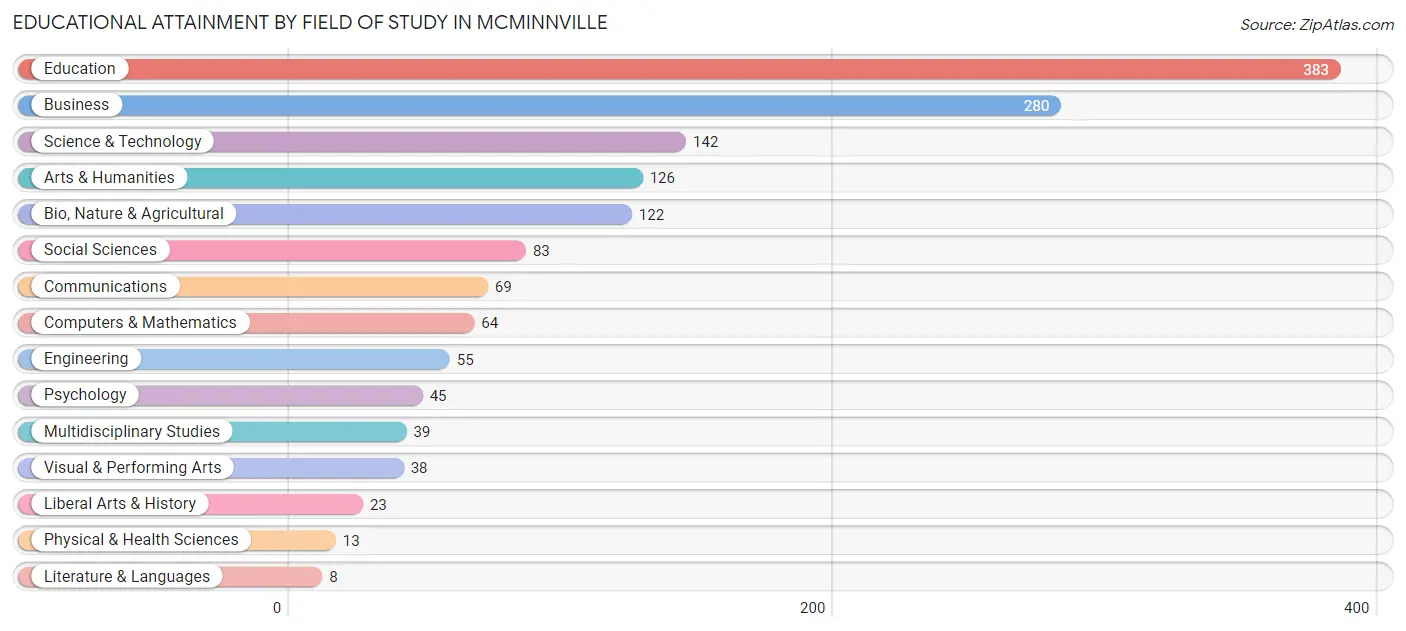
| Field of Study | # Graduates | % Graduates |
| Computers & Mathematics | 64 | 4.3% |
| Bio, Nature & Agricultural | 122 | 8.2% |
| Physical & Health Sciences | 13 | 0.9% |
| Psychology | 45 | 3.0% |
| Social Sciences | 83 | 5.6% |
| Engineering | 55 | 3.7% |
| Multidisciplinary Studies | 39 | 2.6% |
| Science & Technology | 142 | 9.5% |
| Business | 280 | 18.8% |
| Education | 383 | 25.7% |
| Literature & Languages | 8 | 0.5% |
| Liberal Arts & History | 23 | 1.5% |
| Visual & Performing Arts | 38 | 2.5% |
| Communications | 69 | 4.6% |
| Arts & Humanities | 126 | 8.5% |
| Total | 1,490 | 100.0% |
Transportation & Commute in Mcminnville
Vehicle Availability by Sex in Mcminnville
The most prevalent vehicle ownership categories in Mcminnville are males with 2 vehicles (1,245, accounting for 41.0%) and females with 2 vehicles (781, making up 55.6%).
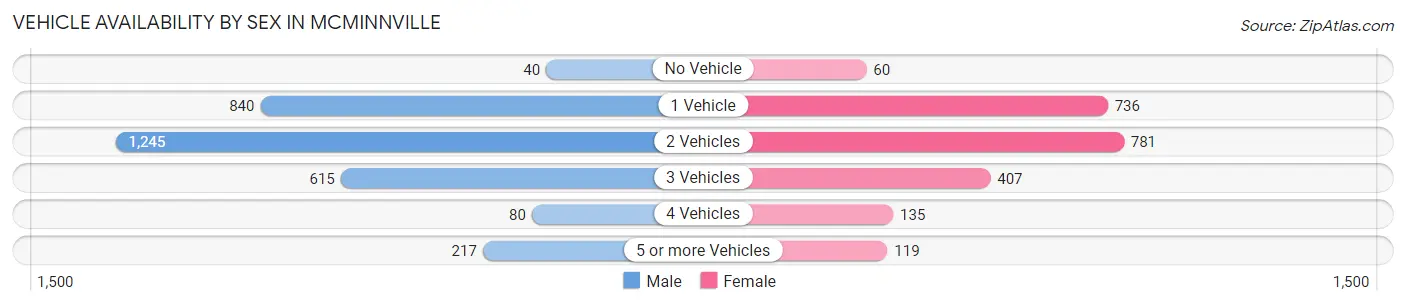
| Vehicles Available | Male | Female |
| No Vehicle | 40 (1.3%) | 60 (2.7%) |
| 1 Vehicle | 840 (27.7%) | 736 (32.9%) |
| 2 Vehicles | 1,245 (41.0%) | 781 (34.9%) |
| 3 Vehicles | 615 (20.3%) | 407 (18.2%) |
| 4 Vehicles | 80 (2.6%) | 135 (6.0%) |
| 5 or more Vehicles | 217 (7.1%) | 119 (5.3%) |
| Total | 3,037 (100.0%) | 2,238 (100.0%) |
Commute Time in Mcminnville
The most frequently occuring commute durations in Mcminnville are 5 to 9 minutes (1,206 commuters, 24.5%), 10 to 14 minutes (971 commuters, 19.7%), and 30 to 34 minutes (712 commuters, 14.5%).
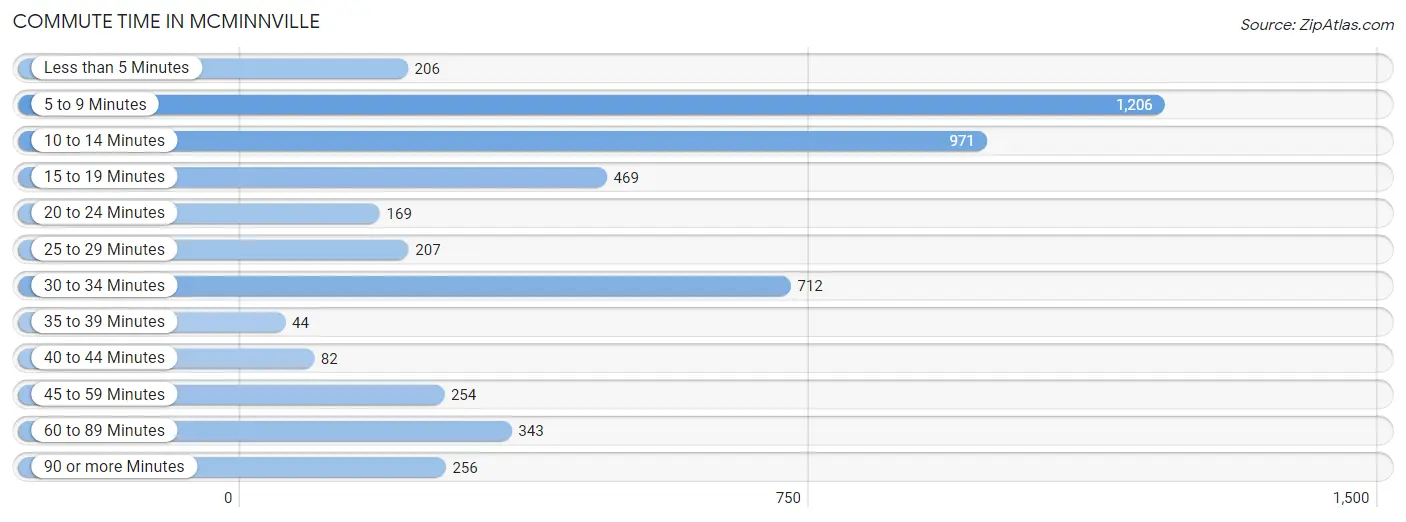
| Commute Time | # Commuters | % Commuters |
| Less than 5 Minutes | 206 | 4.2% |
| 5 to 9 Minutes | 1,206 | 24.5% |
| 10 to 14 Minutes | 971 | 19.7% |
| 15 to 19 Minutes | 469 | 9.5% |
| 20 to 24 Minutes | 169 | 3.4% |
| 25 to 29 Minutes | 207 | 4.2% |
| 30 to 34 Minutes | 712 | 14.5% |
| 35 to 39 Minutes | 44 | 0.9% |
| 40 to 44 Minutes | 82 | 1.7% |
| 45 to 59 Minutes | 254 | 5.2% |
| 60 to 89 Minutes | 343 | 7.0% |
| 90 or more Minutes | 256 | 5.2% |
Commute Time by Sex in Mcminnville
The most common commute times in Mcminnville are 30 to 34 minutes (587 commuters, 21.2%) for males and 10 to 14 minutes (656 commuters, 30.5%) for females.
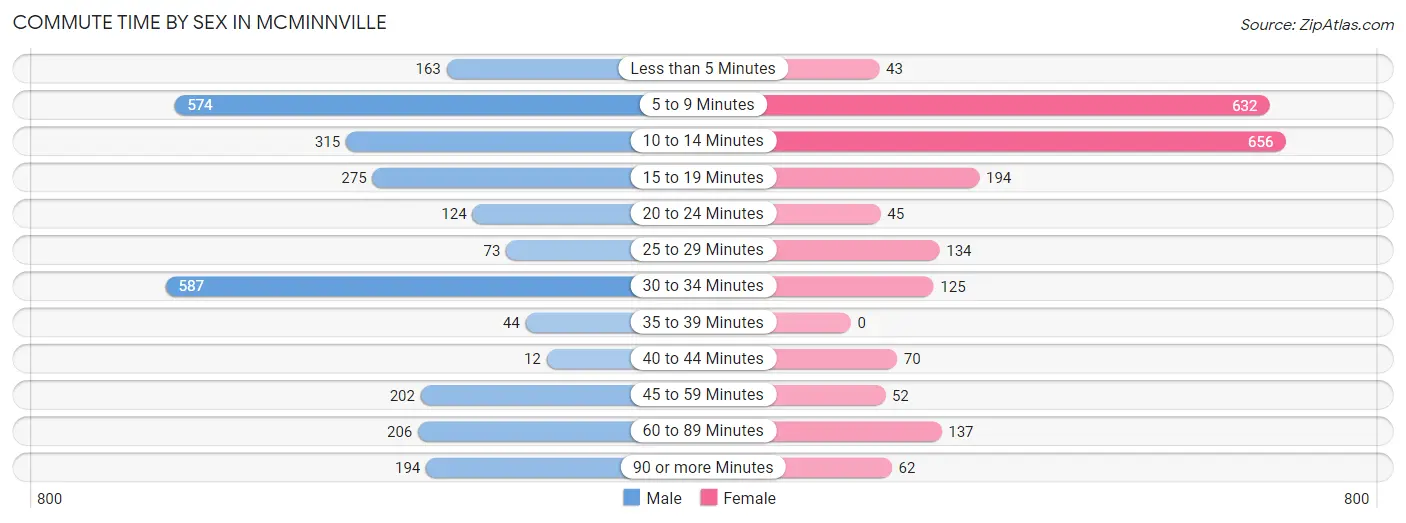
| Commute Time | Male | Female |
| Less than 5 Minutes | 163 (5.9%) | 43 (2.0%) |
| 5 to 9 Minutes | 574 (20.7%) | 632 (29.4%) |
| 10 to 14 Minutes | 315 (11.4%) | 656 (30.5%) |
| 15 to 19 Minutes | 275 (9.9%) | 194 (9.0%) |
| 20 to 24 Minutes | 124 (4.5%) | 45 (2.1%) |
| 25 to 29 Minutes | 73 (2.6%) | 134 (6.2%) |
| 30 to 34 Minutes | 587 (21.2%) | 125 (5.8%) |
| 35 to 39 Minutes | 44 (1.6%) | 0 (0.0%) |
| 40 to 44 Minutes | 12 (0.4%) | 70 (3.3%) |
| 45 to 59 Minutes | 202 (7.3%) | 52 (2.4%) |
| 60 to 89 Minutes | 206 (7.4%) | 137 (6.4%) |
| 90 or more Minutes | 194 (7.0%) | 62 (2.9%) |
Time of Departure to Work by Sex in Mcminnville
The most frequent times of departure to work in Mcminnville are 4:00 PM to 11:59 PM (484, 17.5%) for males and 7:30 AM to 7:59 AM (463, 21.5%) for females.
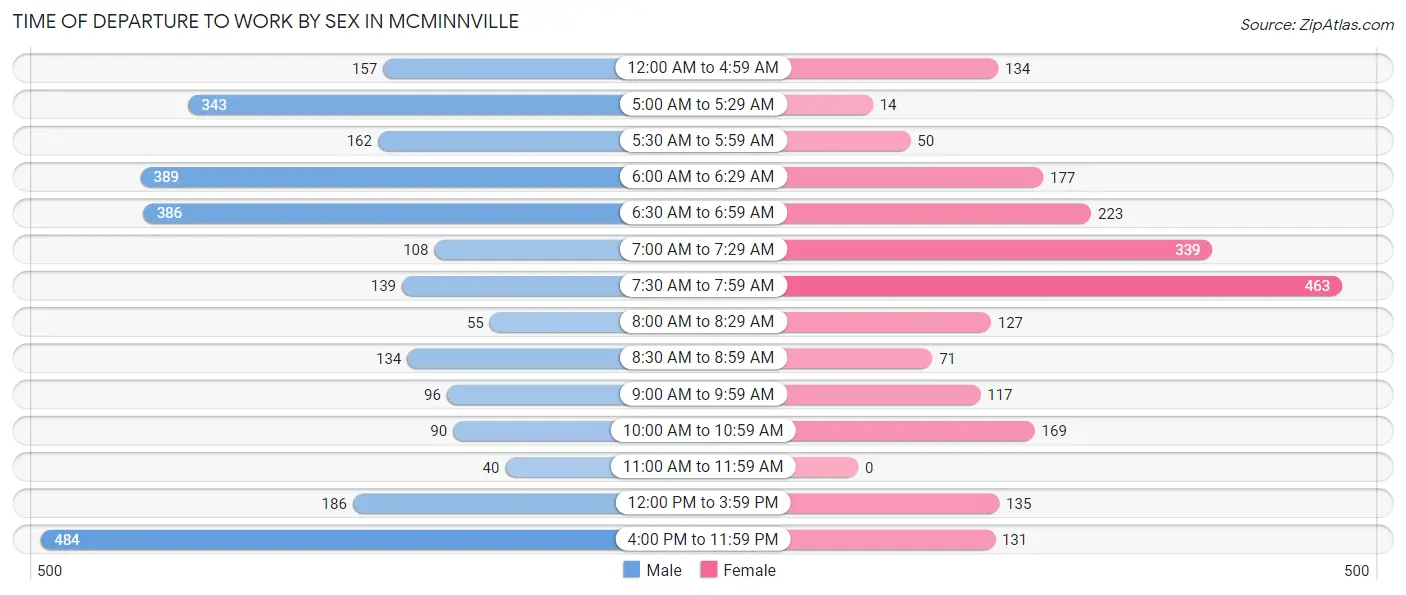
| Time of Departure | Male | Female |
| 12:00 AM to 4:59 AM | 157 (5.7%) | 134 (6.2%) |
| 5:00 AM to 5:29 AM | 343 (12.4%) | 14 (0.6%) |
| 5:30 AM to 5:59 AM | 162 (5.9%) | 50 (2.3%) |
| 6:00 AM to 6:29 AM | 389 (14.1%) | 177 (8.2%) |
| 6:30 AM to 6:59 AM | 386 (13.9%) | 223 (10.4%) |
| 7:00 AM to 7:29 AM | 108 (3.9%) | 339 (15.8%) |
| 7:30 AM to 7:59 AM | 139 (5.0%) | 463 (21.5%) |
| 8:00 AM to 8:29 AM | 55 (2.0%) | 127 (5.9%) |
| 8:30 AM to 8:59 AM | 134 (4.8%) | 71 (3.3%) |
| 9:00 AM to 9:59 AM | 96 (3.5%) | 117 (5.4%) |
| 10:00 AM to 10:59 AM | 90 (3.3%) | 169 (7.9%) |
| 11:00 AM to 11:59 AM | 40 (1.4%) | 0 (0.0%) |
| 12:00 PM to 3:59 PM | 186 (6.7%) | 135 (6.3%) |
| 4:00 PM to 11:59 PM | 484 (17.5%) | 131 (6.1%) |
| Total | 2,769 (100.0%) | 2,150 (100.0%) |
Housing Occupancy in Mcminnville
Occupancy by Ownership in Mcminnville
Of the total 5,571 dwellings in Mcminnville, owner-occupied units account for 2,730 (49.0%), while renter-occupied units make up 2,841 (51.0%).
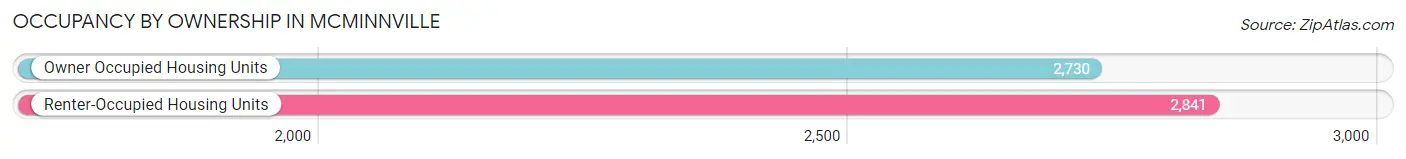
| Occupancy | # Housing Units | % Housing Units |
| Owner Occupied Housing Units | 2,730 | 49.0% |
| Renter-Occupied Housing Units | 2,841 | 51.0% |
| Total Occupied Housing Units | 5,571 | 100.0% |
Occupancy by Household Size in Mcminnville
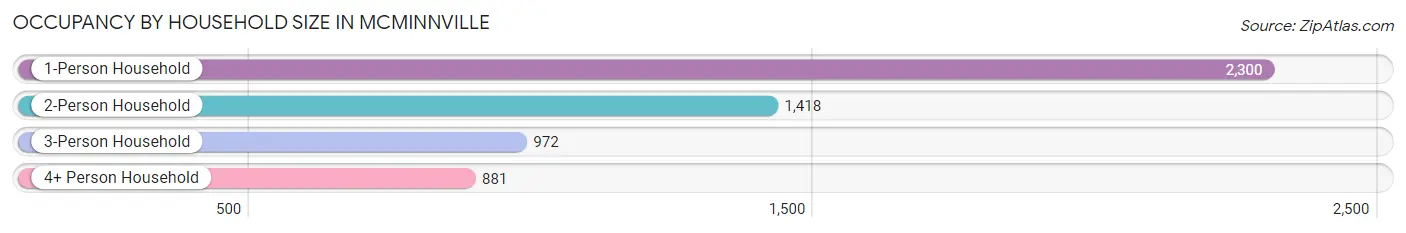
| Household Size | # Housing Units | % Housing Units |
| 1-Person Household | 2,300 | 41.3% |
| 2-Person Household | 1,418 | 25.5% |
| 3-Person Household | 972 | 17.4% |
| 4+ Person Household | 881 | 15.8% |
| Total Housing Units | 5,571 | 100.0% |
Occupancy by Ownership by Household Size in Mcminnville
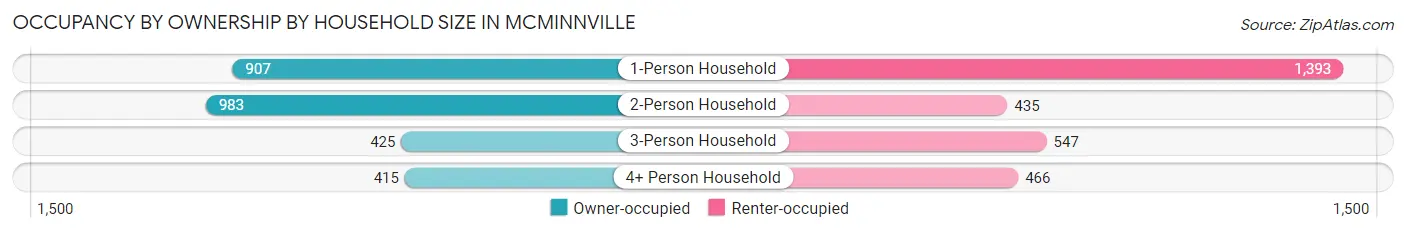
| Household Size | Owner-occupied | Renter-occupied |
| 1-Person Household | 907 (39.4%) | 1,393 (60.6%) |
| 2-Person Household | 983 (69.3%) | 435 (30.7%) |
| 3-Person Household | 425 (43.7%) | 547 (56.3%) |
| 4+ Person Household | 415 (47.1%) | 466 (52.9%) |
| Total Housing Units | 2,730 (49.0%) | 2,841 (51.0%) |
Occupancy by Educational Attainment in Mcminnville
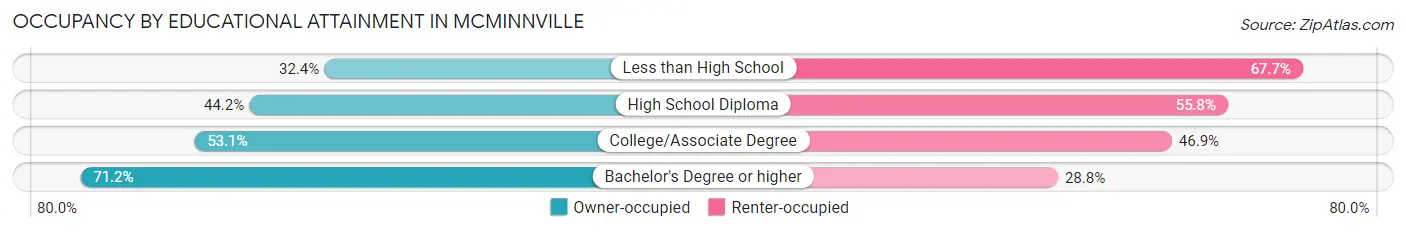
| Household Size | Owner-occupied | Renter-occupied |
| Less than High School | 284 (32.4%) | 594 (67.6%) |
| High School Diploma | 1,045 (44.2%) | 1,317 (55.8%) |
| College/Associate Degree | 757 (53.1%) | 669 (46.9%) |
| Bachelor's Degree or higher | 644 (71.2%) | 261 (28.8%) |
Occupancy by Age of Householder in Mcminnville
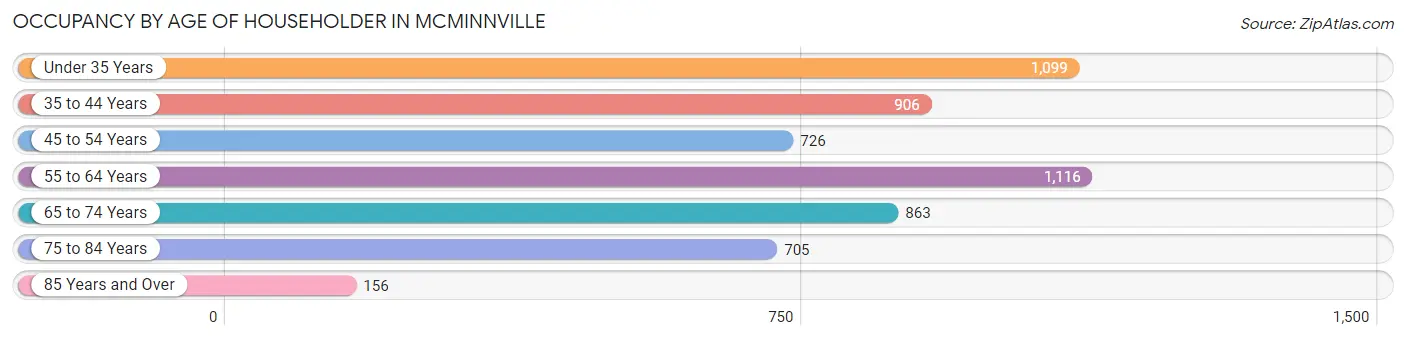
| Age Bracket | # Households | % Households |
| Under 35 Years | 1,099 | 19.7% |
| 35 to 44 Years | 906 | 16.3% |
| 45 to 54 Years | 726 | 13.0% |
| 55 to 64 Years | 1,116 | 20.0% |
| 65 to 74 Years | 863 | 15.5% |
| 75 to 84 Years | 705 | 12.7% |
| 85 Years and Over | 156 | 2.8% |
| Total | 5,571 | 100.0% |
Housing Finances in Mcminnville
Median Income by Occupancy in Mcminnville
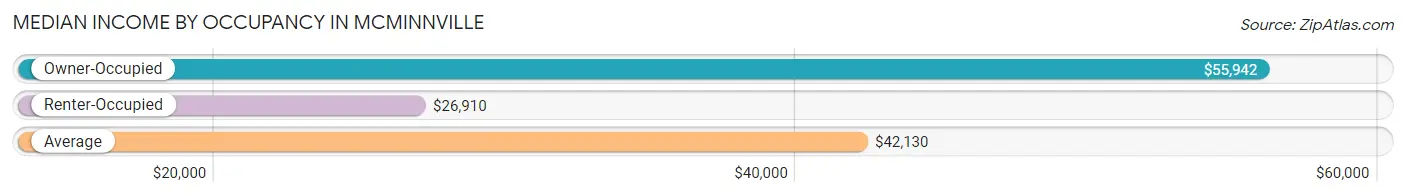
| Occupancy Type | # Households | Median Income |
| Owner-Occupied | 2,730 (49.0%) | $55,942 |
| Renter-Occupied | 2,841 (51.0%) | $26,910 |
| Average | 5,571 (100.0%) | $42,130 |
Occupancy by Householder Income Bracket in Mcminnville
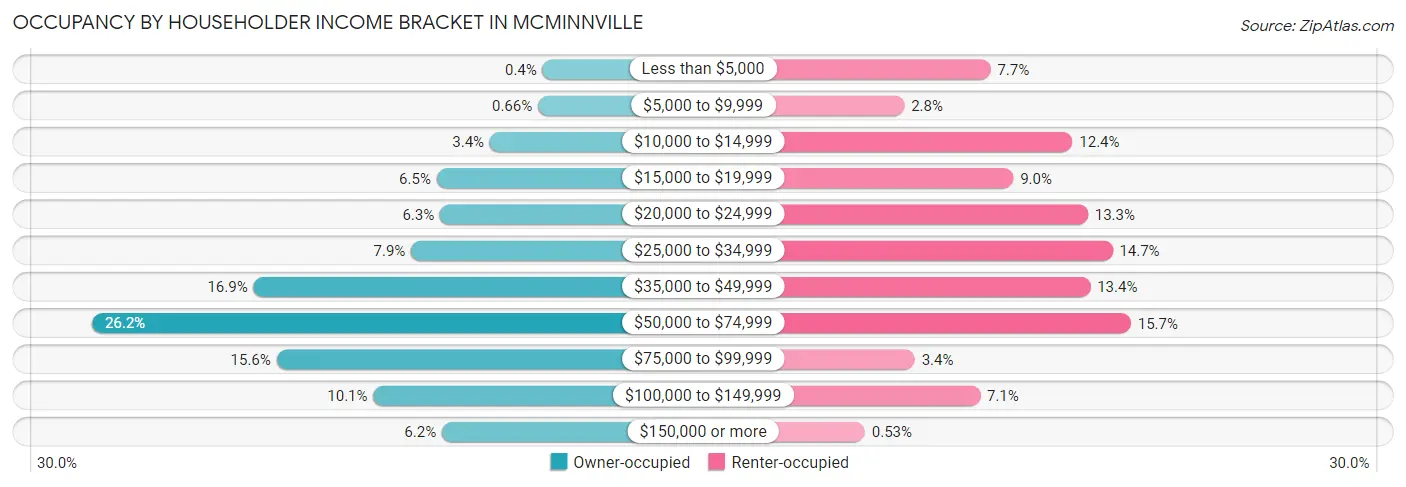
| Income Bracket | Owner-occupied | Renter-occupied |
| Less than $5,000 | 11 (0.4%) | 219 (7.7%) |
| $5,000 to $9,999 | 18 (0.7%) | 79 (2.8%) |
| $10,000 to $14,999 | 93 (3.4%) | 352 (12.4%) |
| $15,000 to $19,999 | 176 (6.5%) | 256 (9.0%) |
| $20,000 to $24,999 | 171 (6.3%) | 377 (13.3%) |
| $25,000 to $34,999 | 216 (7.9%) | 417 (14.7%) |
| $35,000 to $49,999 | 462 (16.9%) | 381 (13.4%) |
| $50,000 to $74,999 | 714 (26.2%) | 447 (15.7%) |
| $75,000 to $99,999 | 426 (15.6%) | 96 (3.4%) |
| $100,000 to $149,999 | 275 (10.1%) | 202 (7.1%) |
| $150,000 or more | 168 (6.1%) | 15 (0.5%) |
| Total | 2,730 (100.0%) | 2,841 (100.0%) |
Monthly Housing Cost Tiers in Mcminnville
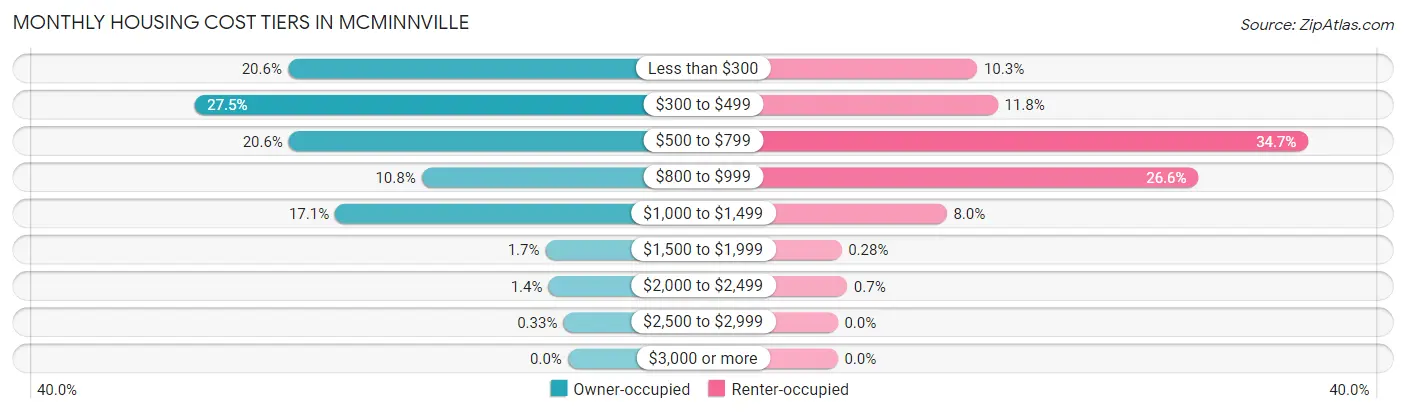
| Monthly Cost | Owner-occupied | Renter-occupied |
| Less than $300 | 563 (20.6%) | 292 (10.3%) |
| $300 to $499 | 751 (27.5%) | 335 (11.8%) |
| $500 to $799 | 561 (20.5%) | 985 (34.7%) |
| $800 to $999 | 294 (10.8%) | 755 (26.6%) |
| $1,000 to $1,499 | 468 (17.1%) | 228 (8.0%) |
| $1,500 to $1,999 | 45 (1.7%) | 8 (0.3%) |
| $2,000 to $2,499 | 39 (1.4%) | 20 (0.7%) |
| $2,500 to $2,999 | 9 (0.3%) | 0 (0.0%) |
| $3,000 or more | 0 (0.0%) | 0 (0.0%) |
| Total | 2,730 (100.0%) | 2,841 (100.0%) |
Physical Housing Characteristics in Mcminnville
Housing Structures in Mcminnville
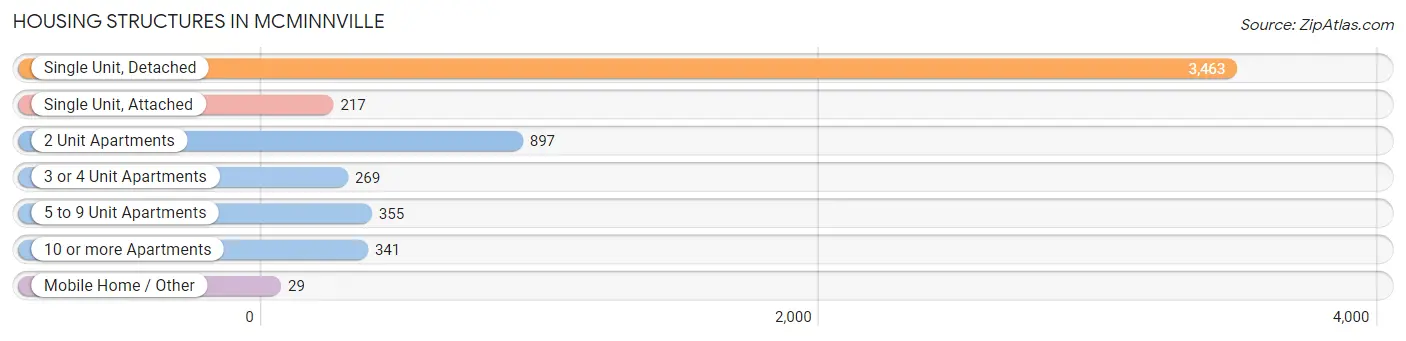
| Structure Type | # Housing Units | % Housing Units |
| Single Unit, Detached | 3,463 | 62.2% |
| Single Unit, Attached | 217 | 3.9% |
| 2 Unit Apartments | 897 | 16.1% |
| 3 or 4 Unit Apartments | 269 | 4.8% |
| 5 to 9 Unit Apartments | 355 | 6.4% |
| 10 or more Apartments | 341 | 6.1% |
| Mobile Home / Other | 29 | 0.5% |
| Total | 5,571 | 100.0% |
Housing Structures by Occupancy in Mcminnville
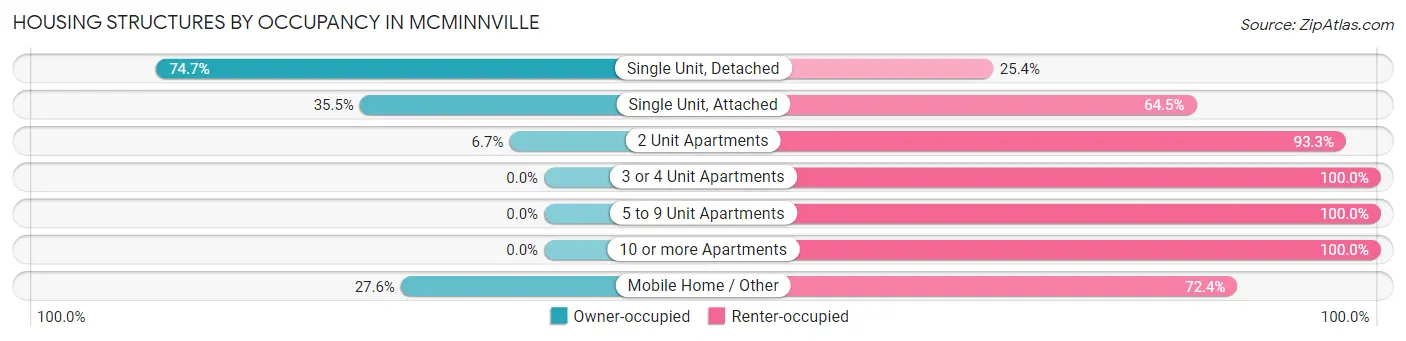
| Structure Type | Owner-occupied | Renter-occupied |
| Single Unit, Detached | 2,585 (74.7%) | 878 (25.4%) |
| Single Unit, Attached | 77 (35.5%) | 140 (64.5%) |
| 2 Unit Apartments | 60 (6.7%) | 837 (93.3%) |
| 3 or 4 Unit Apartments | 0 (0.0%) | 269 (100.0%) |
| 5 to 9 Unit Apartments | 0 (0.0%) | 355 (100.0%) |
| 10 or more Apartments | 0 (0.0%) | 341 (100.0%) |
| Mobile Home / Other | 8 (27.6%) | 21 (72.4%) |
| Total | 2,730 (49.0%) | 2,841 (51.0%) |
Housing Structures by Number of Rooms in Mcminnville
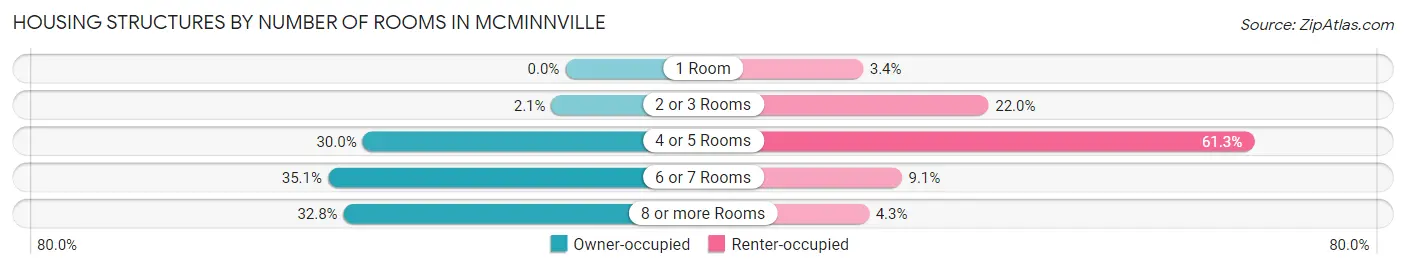
| Number of Rooms | Owner-occupied | Renter-occupied |
| 1 Room | 0 (0.0%) | 96 (3.4%) |
| 2 or 3 Rooms | 56 (2.1%) | 624 (22.0%) |
| 4 or 5 Rooms | 819 (30.0%) | 1,741 (61.3%) |
| 6 or 7 Rooms | 959 (35.1%) | 259 (9.1%) |
| 8 or more Rooms | 896 (32.8%) | 121 (4.3%) |
| Total | 2,730 (100.0%) | 2,841 (100.0%) |
Housing Structure by Heating Type in Mcminnville
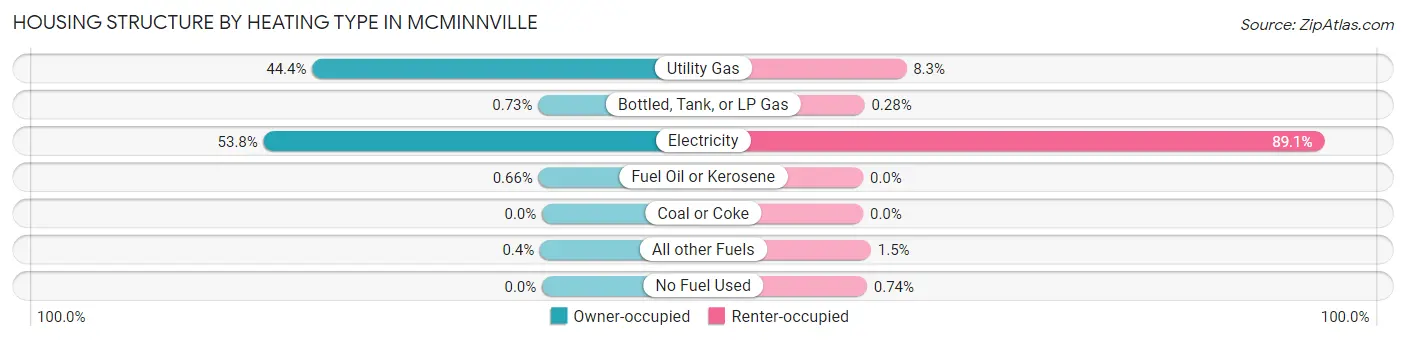
| Heating Type | Owner-occupied | Renter-occupied |
| Utility Gas | 1,212 (44.4%) | 237 (8.3%) |
| Bottled, Tank, or LP Gas | 20 (0.7%) | 8 (0.3%) |
| Electricity | 1,469 (53.8%) | 2,532 (89.1%) |
| Fuel Oil or Kerosene | 18 (0.7%) | 0 (0.0%) |
| Coal or Coke | 0 (0.0%) | 0 (0.0%) |
| All other Fuels | 11 (0.4%) | 43 (1.5%) |
| No Fuel Used | 0 (0.0%) | 21 (0.7%) |
| Total | 2,730 (100.0%) | 2,841 (100.0%) |
Household Vehicle Usage in Mcminnville
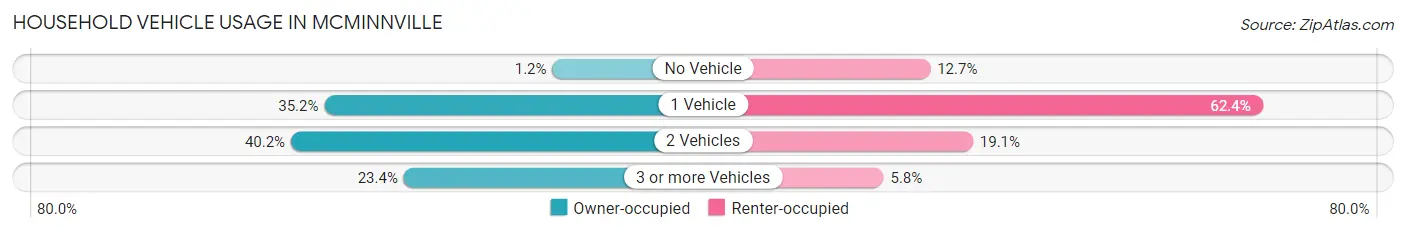
| Vehicles per Household | Owner-occupied | Renter-occupied |
| No Vehicle | 32 (1.2%) | 362 (12.7%) |
| 1 Vehicle | 962 (35.2%) | 1,772 (62.4%) |
| 2 Vehicles | 1,098 (40.2%) | 543 (19.1%) |
| 3 or more Vehicles | 638 (23.4%) | 164 (5.8%) |
| Total | 2,730 (100.0%) | 2,841 (100.0%) |
Real Estate & Mortgages in Mcminnville
Real Estate and Mortgage Overview in Mcminnville
| Characteristic | Without Mortgage | With Mortgage |
| Housing Units | 1,556 | 1,174 |
| Median Property Value | $125,300 | $125,800 |
| Median Household Income | $54,091 | $69 |
| Monthly Housing Costs | $351 | $0 |
| Real Estate Taxes | $936 | $8 |
Property Value by Mortgage Status in Mcminnville
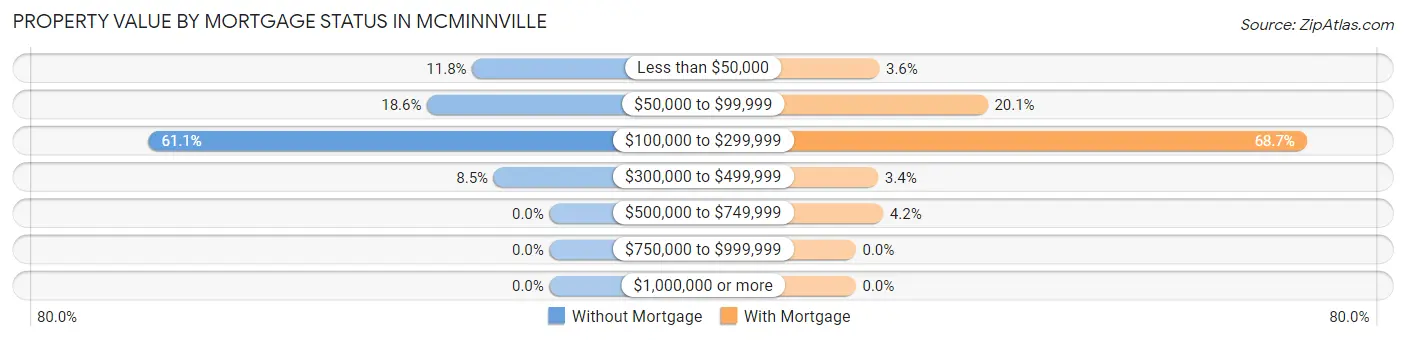
| Property Value | Without Mortgage | With Mortgage |
| Less than $50,000 | 183 (11.8%) | 42 (3.6%) |
| $50,000 to $99,999 | 290 (18.6%) | 236 (20.1%) |
| $100,000 to $299,999 | 951 (61.1%) | 807 (68.7%) |
| $300,000 to $499,999 | 132 (8.5%) | 40 (3.4%) |
| $500,000 to $749,999 | 0 (0.0%) | 49 (4.2%) |
| $750,000 to $999,999 | 0 (0.0%) | 0 (0.0%) |
| $1,000,000 or more | 0 (0.0%) | 0 (0.0%) |
| Total | 1,556 (100.0%) | 1,174 (100.0%) |
Household Income by Mortgage Status in Mcminnville
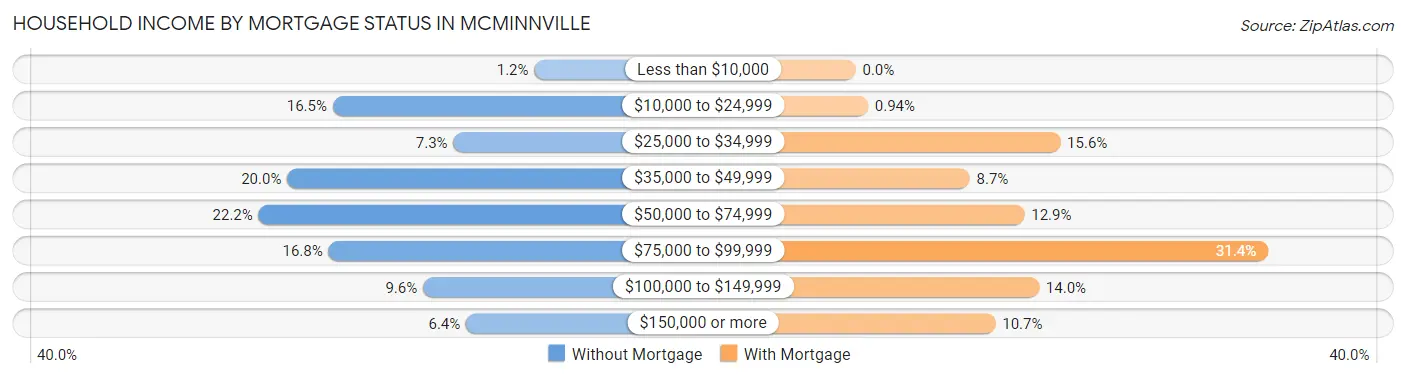
| Household Income | Without Mortgage | With Mortgage |
| Less than $10,000 | 18 (1.2%) | 0 (0.0%) |
| $10,000 to $24,999 | 257 (16.5%) | 11 (0.9%) |
| $25,000 to $34,999 | 114 (7.3%) | 183 (15.6%) |
| $35,000 to $49,999 | 311 (20.0%) | 102 (8.7%) |
| $50,000 to $74,999 | 345 (22.2%) | 151 (12.9%) |
| $75,000 to $99,999 | 262 (16.8%) | 369 (31.4%) |
| $100,000 to $149,999 | 150 (9.6%) | 164 (14.0%) |
| $150,000 or more | 99 (6.4%) | 125 (10.6%) |
| Total | 1,556 (100.0%) | 1,174 (100.0%) |
Property Value to Household Income Ratio in Mcminnville
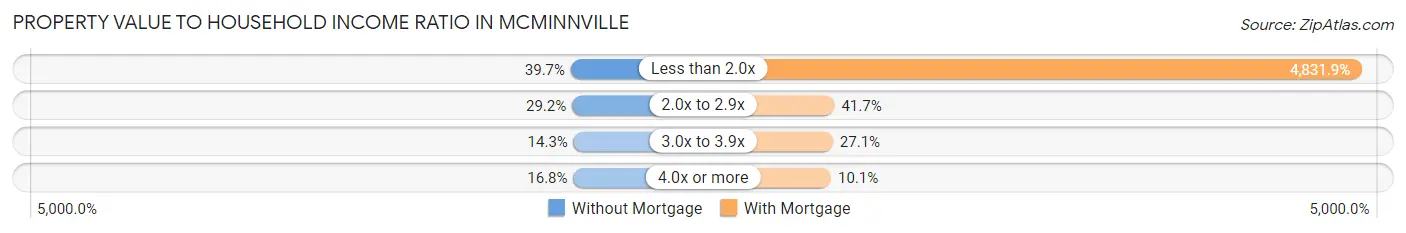
| Value-to-Income Ratio | Without Mortgage | With Mortgage |
| Less than 2.0x | 617 (39.7%) | 56,727 (4,831.9%) |
| 2.0x to 2.9x | 455 (29.2%) | 489 (41.6%) |
| 3.0x to 3.9x | 222 (14.3%) | 318 (27.1%) |
| 4.0x or more | 262 (16.8%) | 119 (10.1%) |
| Total | 1,556 (100.0%) | 1,174 (100.0%) |
Real Estate Taxes by Mortgage Status in Mcminnville
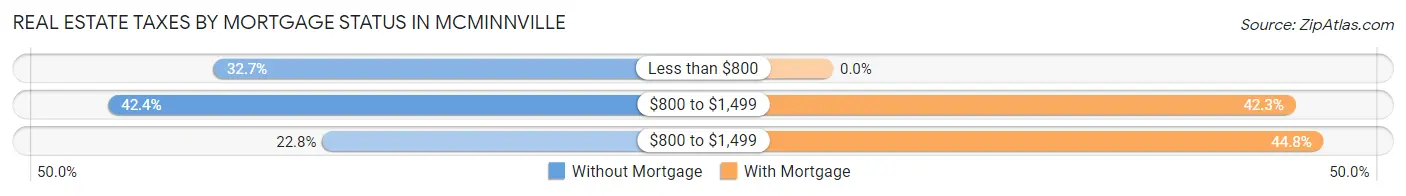
| Property Taxes | Without Mortgage | With Mortgage |
| Less than $800 | 509 (32.7%) | 0 (0.0%) |
| $800 to $1,499 | 659 (42.3%) | 496 (42.2%) |
| $800 to $1,499 | 355 (22.8%) | 526 (44.8%) |
| Total | 1,556 (100.0%) | 1,174 (100.0%) |
Health & Disability in Mcminnville
Health Insurance Coverage by Age in Mcminnville
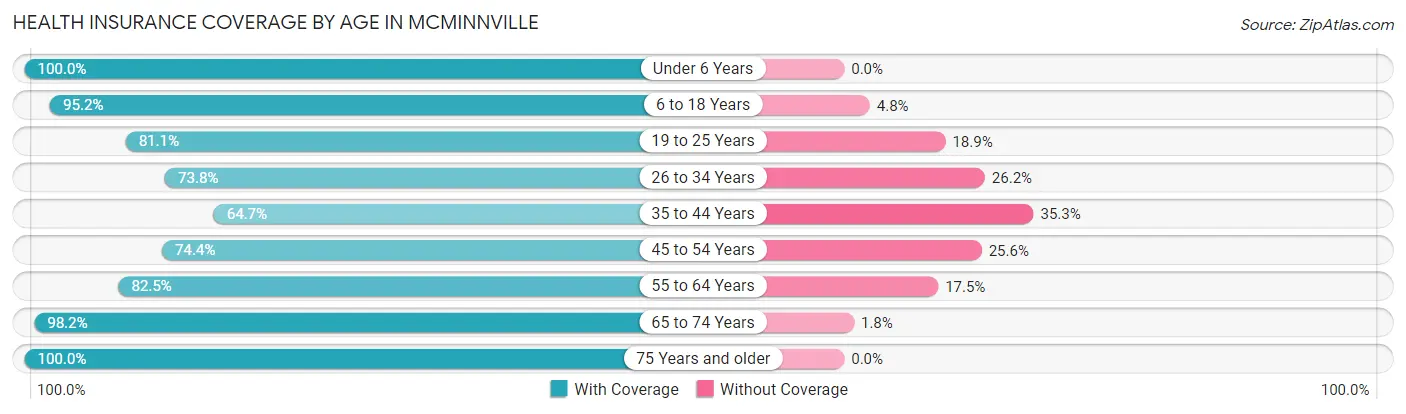
| Age Bracket | With Coverage | Without Coverage |
| Under 6 Years | 864 (100.0%) | 0 (0.0%) |
| 6 to 18 Years | 2,195 (95.2%) | 110 (4.8%) |
| 19 to 25 Years | 937 (81.1%) | 218 (18.9%) |
| 26 to 34 Years | 1,255 (73.8%) | 446 (26.2%) |
| 35 to 44 Years | 1,115 (64.7%) | 608 (35.3%) |
| 45 to 54 Years | 998 (74.4%) | 344 (25.6%) |
| 55 to 64 Years | 1,541 (82.5%) | 327 (17.5%) |
| 65 to 74 Years | 1,185 (98.2%) | 22 (1.8%) |
| 75 Years and older | 1,129 (100.0%) | 0 (0.0%) |
| Total | 11,219 (84.4%) | 2,075 (15.6%) |
Health Insurance Coverage by Citizenship Status in Mcminnville
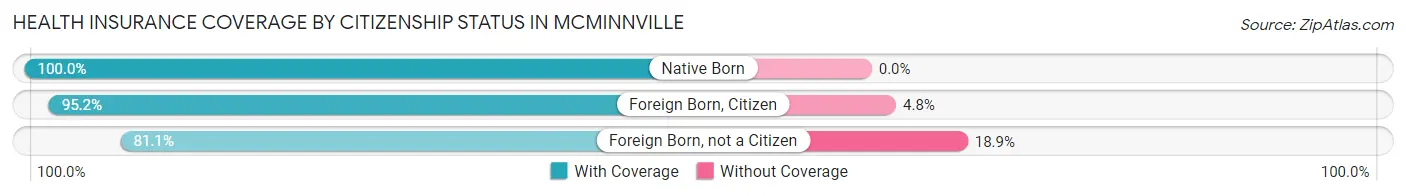
| Citizenship Status | With Coverage | Without Coverage |
| Native Born | 864 (100.0%) | 0 (0.0%) |
| Foreign Born, Citizen | 2,195 (95.2%) | 110 (4.8%) |
| Foreign Born, not a Citizen | 937 (81.1%) | 218 (18.9%) |
Health Insurance Coverage by Household Income in Mcminnville
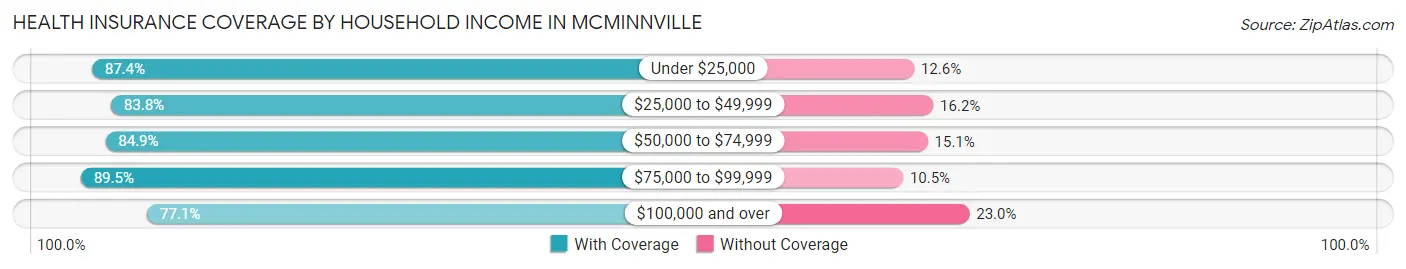
| Household Income | With Coverage | Without Coverage |
| Under $25,000 | 2,728 (87.4%) | 393 (12.6%) |
| $25,000 to $49,999 | 2,482 (83.8%) | 479 (16.2%) |
| $50,000 to $74,999 | 3,011 (84.9%) | 537 (15.1%) |
| $75,000 to $99,999 | 1,301 (89.5%) | 153 (10.5%) |
| $100,000 and over | 1,672 (77.0%) | 498 (23.0%) |
Public vs Private Health Insurance Coverage by Age in Mcminnville
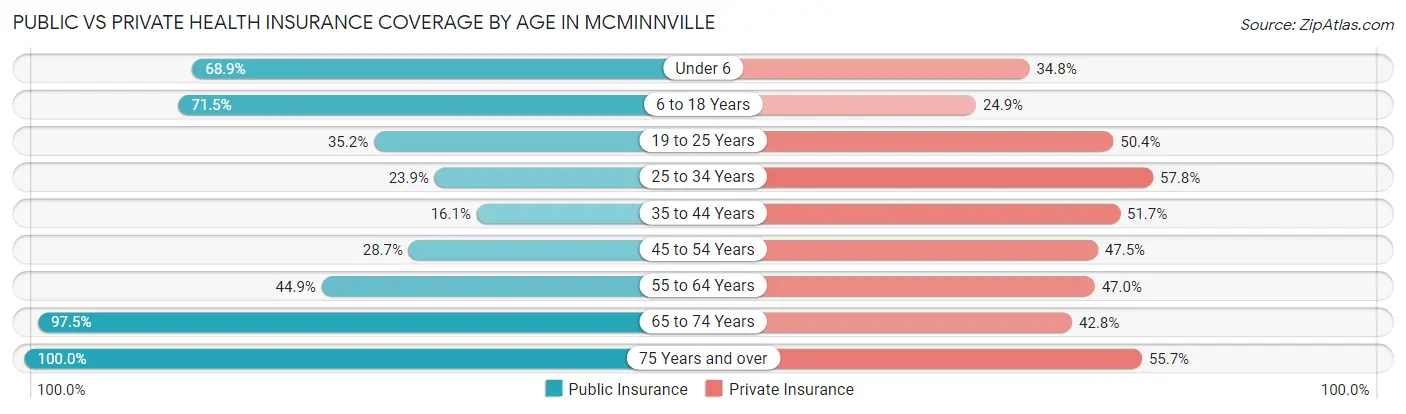
| Age Bracket | Public Insurance | Private Insurance |
| Under 6 | 595 (68.9%) | 301 (34.8%) |
| 6 to 18 Years | 1,647 (71.5%) | 574 (24.9%) |
| 19 to 25 Years | 406 (35.1%) | 582 (50.4%) |
| 25 to 34 Years | 406 (23.9%) | 983 (57.8%) |
| 35 to 44 Years | 277 (16.1%) | 890 (51.6%) |
| 45 to 54 Years | 385 (28.7%) | 638 (47.5%) |
| 55 to 64 Years | 838 (44.9%) | 877 (46.9%) |
| 65 to 74 Years | 1,177 (97.5%) | 516 (42.7%) |
| 75 Years and over | 1,129 (100.0%) | 629 (55.7%) |
| Total | 6,860 (51.6%) | 5,990 (45.1%) |
Disability Status by Sex by Age in Mcminnville
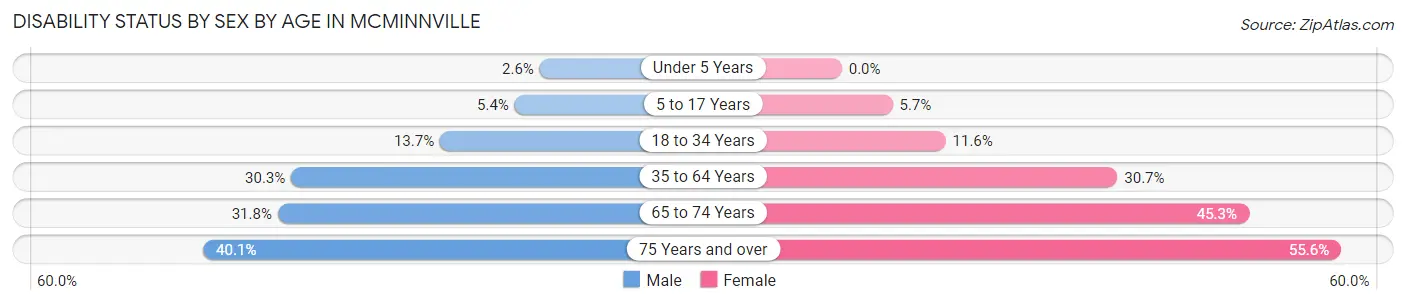
| Age Bracket | Male | Female |
| Under 5 Years | 9 (2.6%) | 0 (0.0%) |
| 5 to 17 Years | 58 (5.4%) | 76 (5.7%) |
| 18 to 34 Years | 229 (13.7%) | 160 (11.6%) |
| 35 to 64 Years | 731 (30.3%) | 774 (30.7%) |
| 65 to 74 Years | 153 (31.8%) | 329 (45.3%) |
| 75 Years and over | 152 (40.1%) | 417 (55.6%) |
Disability Class by Sex by Age in Mcminnville
Disability Class: Hearing Difficulty
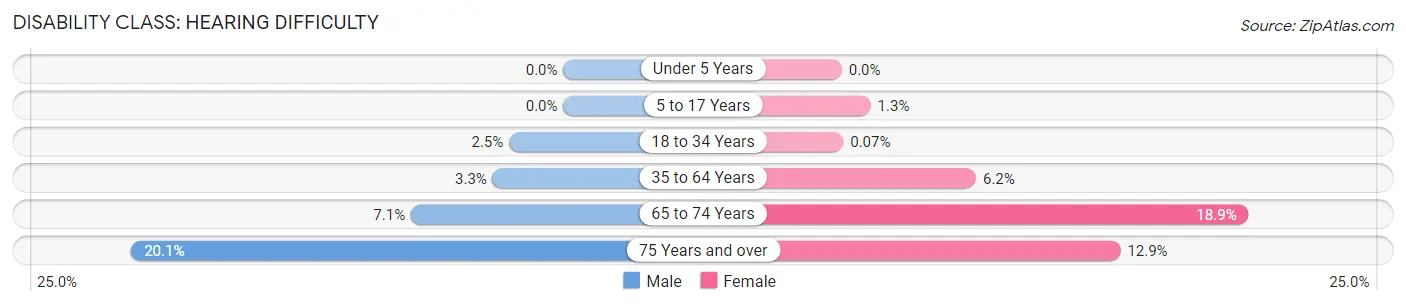
| Age Bracket | Male | Female |
| Under 5 Years | 0 (0.0%) | 0 (0.0%) |
| 5 to 17 Years | 0 (0.0%) | 18 (1.3%) |
| 18 to 34 Years | 42 (2.5%) | 1 (0.1%) |
| 35 to 64 Years | 79 (3.3%) | 157 (6.2%) |
| 65 to 74 Years | 34 (7.1%) | 137 (18.9%) |
| 75 Years and over | 76 (20.1%) | 97 (12.9%) |
Disability Class: Vision Difficulty
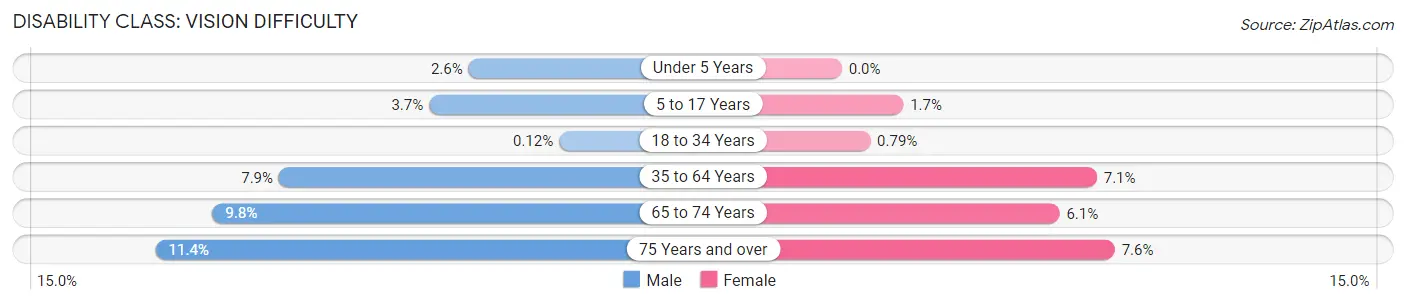
| Age Bracket | Male | Female |
| Under 5 Years | 9 (2.6%) | 0 (0.0%) |
| 5 to 17 Years | 40 (3.7%) | 23 (1.7%) |
| 18 to 34 Years | 2 (0.1%) | 11 (0.8%) |
| 35 to 64 Years | 191 (7.9%) | 179 (7.1%) |
| 65 to 74 Years | 47 (9.8%) | 44 (6.1%) |
| 75 Years and over | 43 (11.4%) | 57 (7.6%) |
Disability Class: Cognitive Difficulty
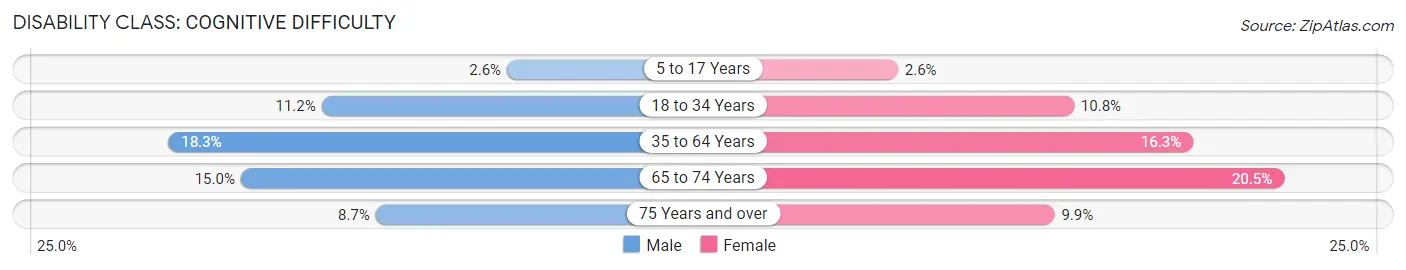
| Age Bracket | Male | Female |
| 5 to 17 Years | 28 (2.6%) | 35 (2.6%) |
| 18 to 34 Years | 187 (11.2%) | 149 (10.8%) |
| 35 to 64 Years | 442 (18.3%) | 411 (16.3%) |
| 65 to 74 Years | 72 (15.0%) | 149 (20.5%) |
| 75 Years and over | 33 (8.7%) | 74 (9.9%) |
Disability Class: Ambulatory Difficulty
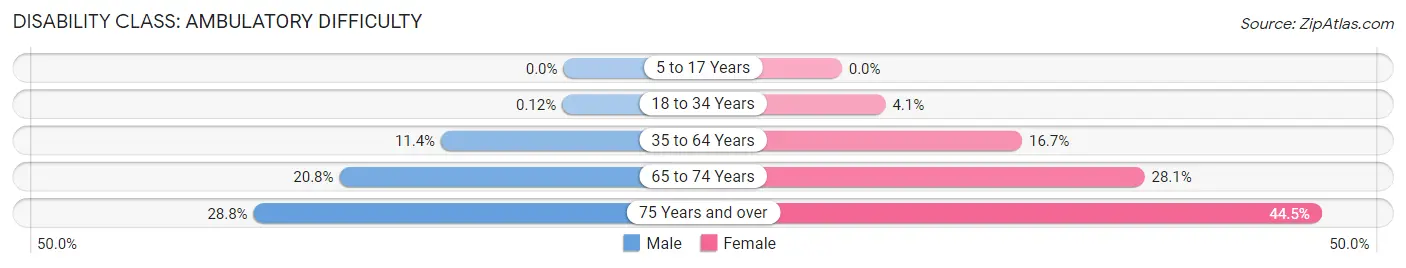
| Age Bracket | Male | Female |
| 5 to 17 Years | 0 (0.0%) | 0 (0.0%) |
| 18 to 34 Years | 2 (0.1%) | 56 (4.1%) |
| 35 to 64 Years | 274 (11.4%) | 422 (16.7%) |
| 65 to 74 Years | 100 (20.8%) | 204 (28.1%) |
| 75 Years and over | 109 (28.8%) | 334 (44.5%) |
Disability Class: Self-Care Difficulty
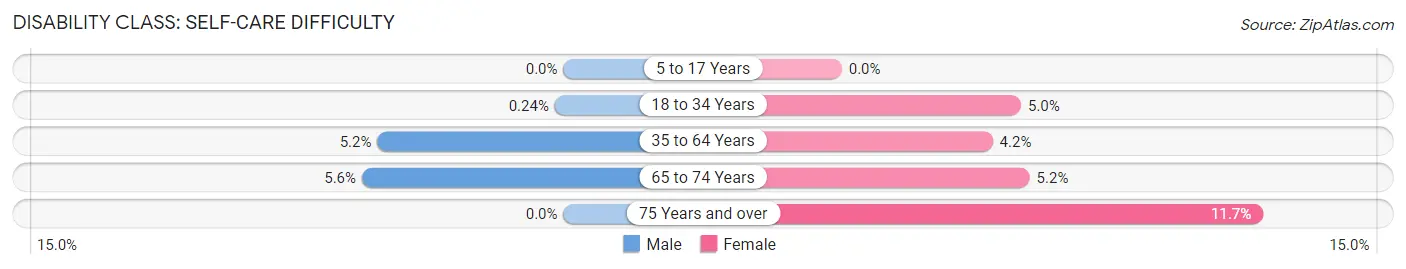
| Age Bracket | Male | Female |
| 5 to 17 Years | 0 (0.0%) | 0 (0.0%) |
| 18 to 34 Years | 4 (0.2%) | 69 (5.0%) |
| 35 to 64 Years | 125 (5.2%) | 106 (4.2%) |
| 65 to 74 Years | 27 (5.6%) | 38 (5.2%) |
| 75 Years and over | 0 (0.0%) | 88 (11.7%) |
Technology Access in Mcminnville
Computing Device Access in Mcminnville
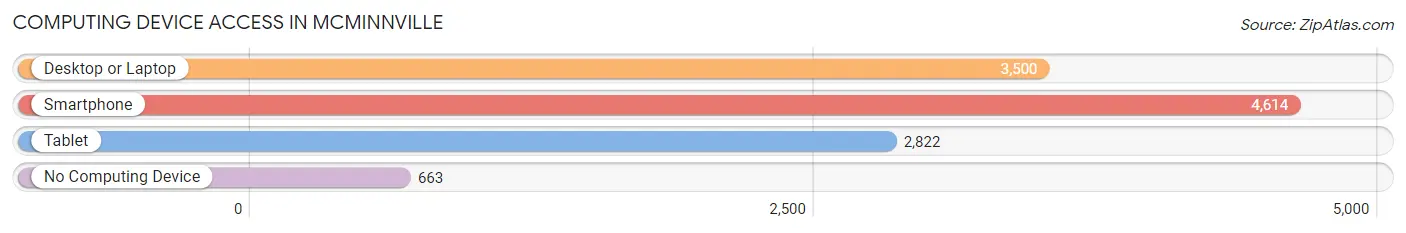
| Device Type | # Households | % Households |
| Desktop or Laptop | 3,500 | 62.8% |
| Smartphone | 4,614 | 82.8% |
| Tablet | 2,822 | 50.7% |
| No Computing Device | 663 | 11.9% |
| Total | 5,571 | 100.0% |
Internet Access in Mcminnville
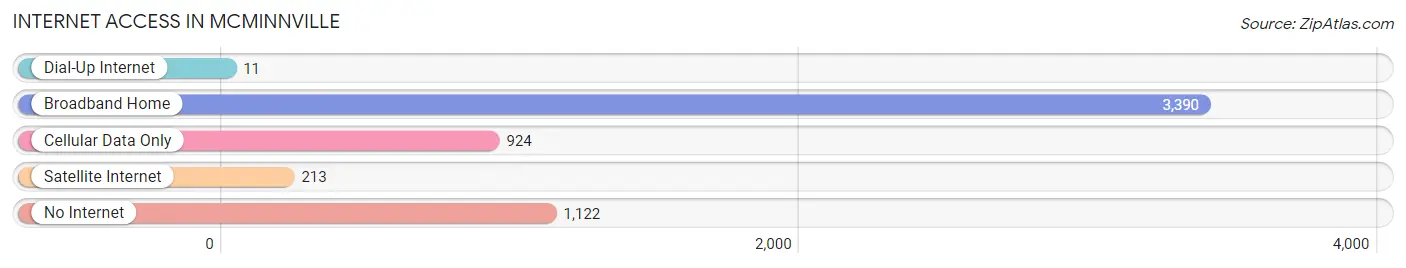
| Internet Type | # Households | % Households |
| Dial-Up Internet | 11 | 0.2% |
| Broadband Home | 3,390 | 60.9% |
| Cellular Data Only | 924 | 16.6% |
| Satellite Internet | 213 | 3.8% |
| No Internet | 1,122 | 20.1% |
| Total | 5,571 | 100.0% |
Mcminnville Summary
Mcminnville, Tennessee is a small town located in Warren County, Tennessee. It is the county seat of Warren County and is located about 50 miles southeast of Nashville. The population of Mcminnville was estimated to be 13,722 in 2019.
History
Mcminnville was founded in 1810 by Joseph McMinn, a Revolutionary War veteran. McMinn named the town after himself and it was incorporated in 1817. The town was originally a trading post and was known as the “Crossroads of the Cumberland” due to its location at the intersection of two major roads.
Mcminnville was an important stop on the stagecoach route between Nashville and Knoxville. It was also a major stop on the railroad line between Nashville and Chattanooga. The town was a major center for the production of cotton and tobacco and was home to several factories.
Geography
Mcminnville is located in the Cumberland Plateau region of Tennessee. The town is situated at the intersection of two major highways, US Highway 70 and State Route 55. The town is located in a valley surrounded by hills and mountains. The nearest major cities are Nashville, Chattanooga, and Knoxville.
The climate in Mcminnville is humid subtropical, with hot summers and mild winters. The average annual temperature is around 60 degrees Fahrenheit. The average annual precipitation is around 45 inches.
Economy
Mcminnville’s economy is largely based on agriculture and manufacturing. The town is home to several factories, including a paper mill, a furniture factory, and a plastics factory. The town is also home to several wineries and distilleries.
Mcminnville is also home to several retail stores, restaurants, and other businesses. The town is home to several educational institutions, including a community college and a technical school.
Demographics
Mcminnville’s population is estimated to be 13,722 in 2019. The population is predominantly white, with a small African American population. The median household income is around $37,000. The median age is around 40 years old. The town has a low unemployment rate and a high rate of homeownership.
Common Questions
What is the Total Population of Mcminnville?
Total Population of Mcminnville is 13,756.
What is the Total Male Population of Mcminnville?
Total Male Population of Mcminnville is 6,594.
What is the Total Female Population of Mcminnville?
Total Female Population of Mcminnville is 7,162.
What is the Ratio of Males per 100 Females in Mcminnville?
There are 92.07 Males per 100 Females in Mcminnville.
What is the Ratio of Females per 100 Males in Mcminnville?
There are 108.61 Females per 100 Males in Mcminnville.
What is the Median Population Age in Mcminnville?
Median Population Age in Mcminnville is 38.9 Years.
What is the Average Family Size in Mcminnville
Average Family Size in Mcminnville is 3.3 People.
What is the Average Household Size in Mcminnville
Average Household Size in Mcminnville is 2.4 People.
What is Per Capita Income in Mcminnville?
Per Capita income in Mcminnville is $26,300.
What is the Median Family Income in Mcminnville?
Median Family Income in Mcminnville is $54,040.
What is the Median Household income in Mcminnville?
Median Household Income in Mcminnville is $42,130.
What is Income or Wage Gap in Mcminnville?
Income or Wage Gap in Mcminnville is 18.8%.
Women in Mcminnville earn 81.2 cents for every dollar earned by a man.
What is Family Income Deficit in Mcminnville?
Family Income Deficit in Mcminnville is $7,459.
Families that are below poverty line in Mcminnville earn $7,459 less on average than the poverty threshold level.
What is Inequality or Gini Index in Mcminnville?
Inequality or Gini Index in Mcminnville is 0.50.
How Large is the Labor Force in Mcminnville?
There are 5,673 People in the Labor Forcein in Mcminnville.
What is the Percentage of People in the Labor Force in Mcminnville?
51.4% of People are in the Labor Force in Mcminnville.
What is the Unemployment Rate in Mcminnville?
Unemployment Rate in Mcminnville is 5.3%.