Braden, TN
Braden Map
Braden Overview
293
TOTAL POPULATION
170
MALE POPULATION
123
FEMALE POPULATION
138.21
MALES / 100 FEMALES
72.35
FEMALES / 100 MALES
47.9
MEDIAN AGE
3.3
AVG FAMILY SIZE
2.7
AVG HOUSEHOLD SIZE
$44,475
PER CAPITA INCOME
$76,806
AVG FAMILY INCOME
$76,597
AVG HOUSEHOLD INCOME
43.9%
WAGE / INCOME GAP [ % ]
56.1¢/ $1
WAGE / INCOME GAP [ $ ]
0.48
INEQUALITY / GINI INDEX
176
LABOR FORCE [ PEOPLE ]
63.3%
PERCENT IN LABOR FORCE
5.1%
UNEMPLOYMENT RATE
Braden Area Codes
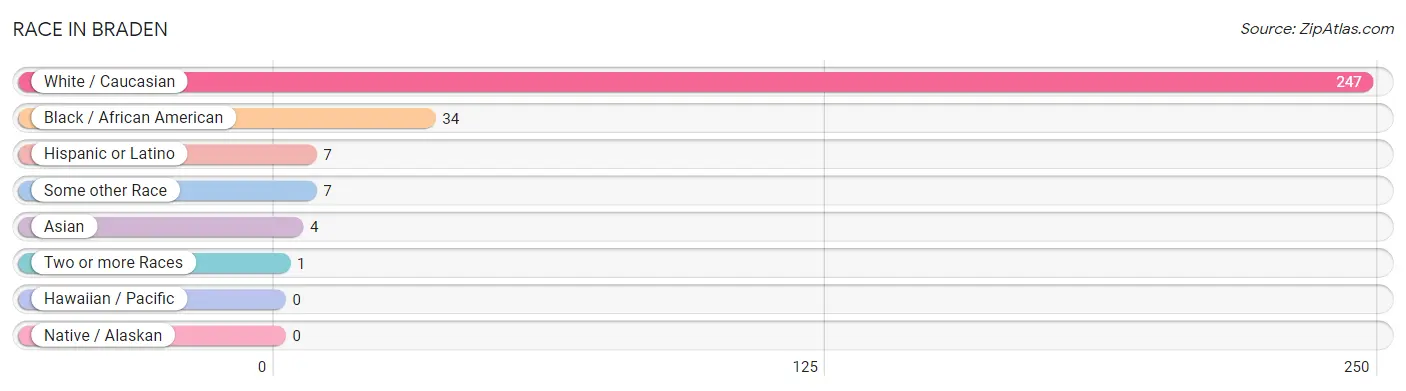
Race in Braden
The most populous races in Braden are White / Caucasian (247 | 84.3%), Black / African American (34 | 11.6%), and Hispanic or Latino (7 | 2.4%).
| Race | # Population | % Population |
| Asian | 4 | 1.4% |
| Black / African American | 34 | 11.6% |
| Hawaiian / Pacific | 0 | 0.0% |
| Hispanic or Latino | 7 | 2.4% |
| Native / Alaskan | 0 | 0.0% |
| White / Caucasian | 247 | 84.3% |
| Two or more Races | 1 | 0.3% |
| Some other Race | 7 | 2.4% |
| Total | 293 | 100.0% |
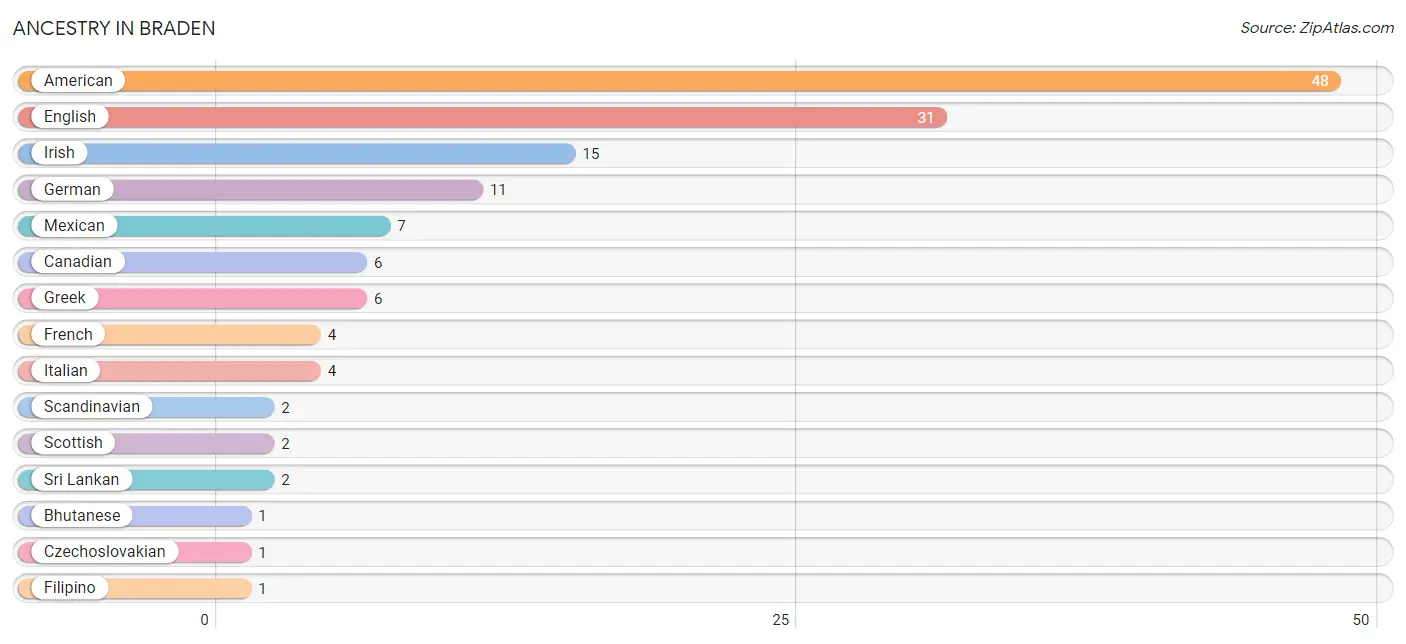
Ancestry in Braden
The most populous ancestries reported in Braden are American (48 | 16.4%), English (31 | 10.6%), Irish (15 | 5.1%), German (11 | 3.7%), and Mexican (7 | 2.4%), together accounting for 38.2% of all Braden residents.
| Ancestry | # Population | % Population |
| American | 48 | 16.4% |
| Bhutanese | 1 | 0.3% |
| Canadian | 6 | 2.1% |
| Czechoslovakian | 1 | 0.3% |
| English | 31 | 10.6% |
| Filipino | 1 | 0.3% |
| French | 4 | 1.4% |
| French Canadian | 1 | 0.3% |
| German | 11 | 3.7% |
| Greek | 6 | 2.1% |
| Irish | 15 | 5.1% |
| Italian | 4 | 1.4% |
| Korean | 1 | 0.3% |
| Mexican | 7 | 2.4% |
| Norwegian | 1 | 0.3% |
| Russian | 1 | 0.3% |
| Scandinavian | 2 | 0.7% |
| Scottish | 2 | 0.7% |
| Sri Lankan | 2 | 0.7% | View All 19 Rows |
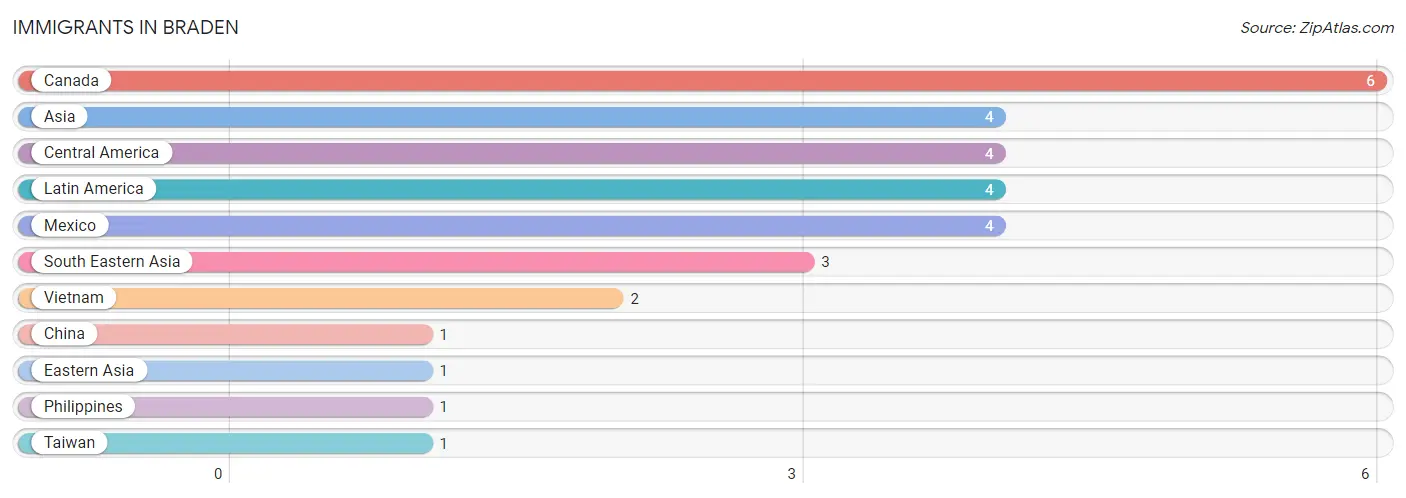
Immigrants in Braden
The most numerous immigrant groups reported in Braden came from Canada (6 | 2.1%), Asia (4 | 1.4%), Central America (4 | 1.4%), Latin America (4 | 1.4%), and Mexico (4 | 1.4%), together accounting for 7.5% of all Braden residents.
| Immigration Origin | # Population | % Population |
| Asia | 4 | 1.4% |
| Canada | 6 | 2.1% |
| Central America | 4 | 1.4% |
| China | 1 | 0.3% |
| Eastern Asia | 1 | 0.3% |
| Latin America | 4 | 1.4% |
| Mexico | 4 | 1.4% |
| Philippines | 1 | 0.3% |
| South Eastern Asia | 3 | 1.0% |
| Taiwan | 1 | 0.3% |
| Vietnam | 2 | 0.7% | View All 11 Rows |
Sex and Age in Braden
Sex and Age in Braden
The most populous age groups in Braden are 55 to 59 Years (30 | 17.6%) for men and 45 to 49 Years (33 | 26.8%) for women.

| Age Bracket | Male | Female |
| Under 5 Years | 3 (1.8%) | 4 (3.3%) |
| 5 to 9 Years | 4 (2.4%) | 0 (0.0%) |
| 10 to 14 Years | 2 (1.2%) | 1 (0.8%) |
| 15 to 19 Years | 9 (5.3%) | 15 (12.2%) |
| 20 to 24 Years | 23 (13.5%) | 0 (0.0%) |
| 25 to 29 Years | 25 (14.7%) | 7 (5.7%) |
| 30 to 34 Years | 7 (4.1%) | 6 (4.9%) |
| 35 to 39 Years | 0 (0.0%) | 5 (4.1%) |
| 40 to 44 Years | 2 (1.2%) | 5 (4.1%) |
| 45 to 49 Years | 2 (1.2%) | 33 (26.8%) |
| 50 to 54 Years | 27 (15.9%) | 15 (12.2%) |
| 55 to 59 Years | 30 (17.6%) | 4 (3.3%) |
| 60 to 64 Years | 7 (4.1%) | 9 (7.3%) |
| 65 to 69 Years | 9 (5.3%) | 4 (3.3%) |
| 70 to 74 Years | 4 (2.4%) | 5 (4.1%) |
| 75 to 79 Years | 11 (6.5%) | 5 (4.1%) |
| 80 to 84 Years | 3 (1.8%) | 3 (2.4%) |
| 85 Years and over | 2 (1.2%) | 2 (1.6%) |
| Total | 170 (100.0%) | 123 (100.0%) |
Families and Households in Braden
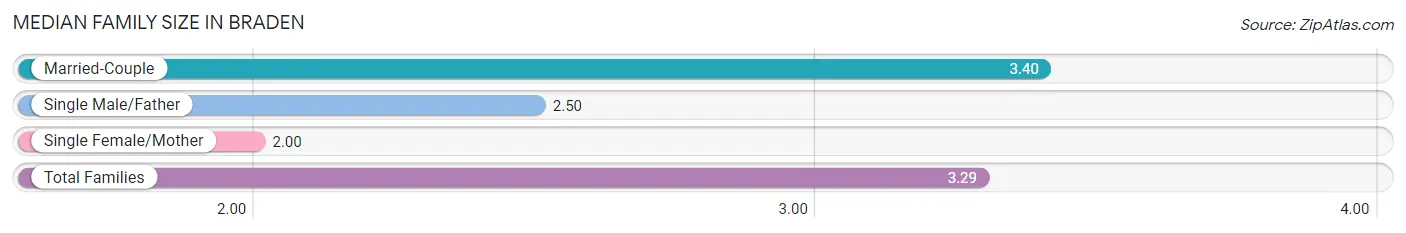
Median Family Size in Braden
The median family size in Braden is 3.29 persons per family, with married-couple families (70 | 89.7%) accounting for the largest median family size of 3.4 persons per family. On the other hand, single female/mother families (2 | 2.6%) represent the smallest median family size with 2.00 persons per family.
| Family Type | # Families | Family Size |
| Married-Couple | 70 (89.7%) | 3.40 |
| Single Male/Father | 6 (7.7%) | 2.50 |
| Single Female/Mother | 2 (2.6%) | 2.00 |
| Total Families | 78 (100.0%) | 3.29 |
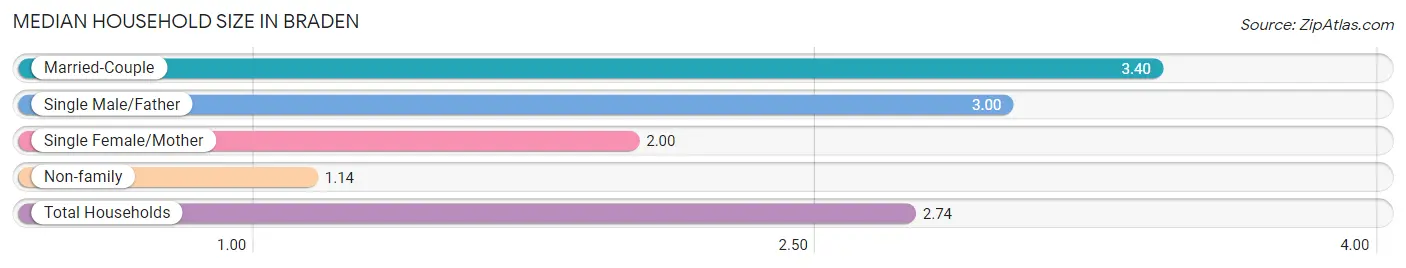
Median Household Size in Braden
The median household size in Braden is 2.74 persons per household, with married-couple households (70 | 65.4%) accounting for the largest median household size of 3.4 persons per household. non-family households (29 | 27.1%) represent the smallest median household size with 1.14 persons per household.
| Household Type | # Households | Household Size |
| Married-Couple | 70 (65.4%) | 3.40 |
| Single Male/Father | 6 (5.6%) | 3.00 |
| Single Female/Mother | 2 (1.9%) | 2.00 |
| Non-family | 29 (27.1%) | 1.14 |
| Total Households | 107 (100.0%) | 2.74 |
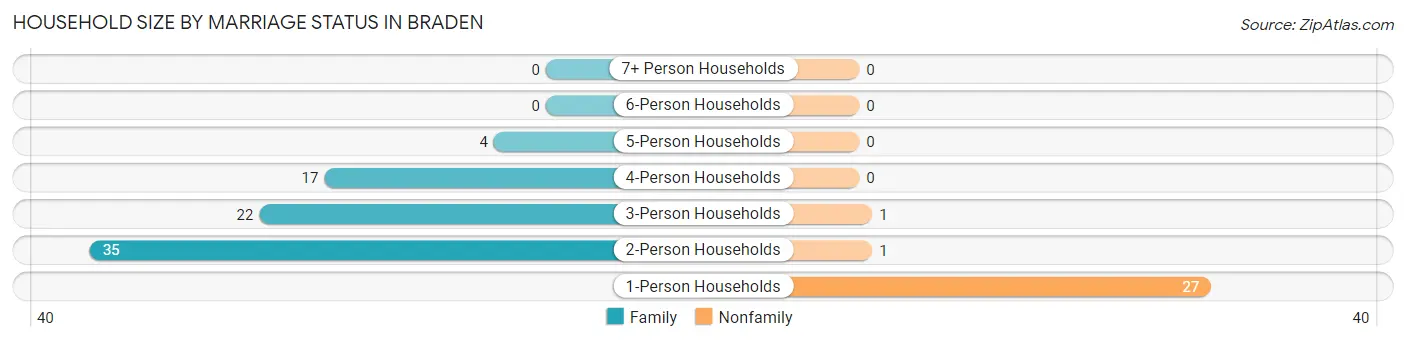
Household Size by Marriage Status in Braden
Out of a total of 107 households in Braden, 78 (72.9%) are family households, while 29 (27.1%) are nonfamily households. The most numerous type of family households are 2-person households, comprising 35, and the most common type of nonfamily households are 1-person households, comprising 27.
| Household Size | Family Households | Nonfamily Households |
| 1-Person Households | - | 27 (25.2%) |
| 2-Person Households | 35 (32.7%) | 1 (0.9%) |
| 3-Person Households | 22 (20.6%) | 1 (0.9%) |
| 4-Person Households | 17 (15.9%) | 0 (0.0%) |
| 5-Person Households | 4 (3.7%) | 0 (0.0%) |
| 6-Person Households | 0 (0.0%) | 0 (0.0%) |
| 7+ Person Households | 0 (0.0%) | 0 (0.0%) |
| Total | 78 (72.9%) | 29 (27.1%) |
Female Fertility in Braden
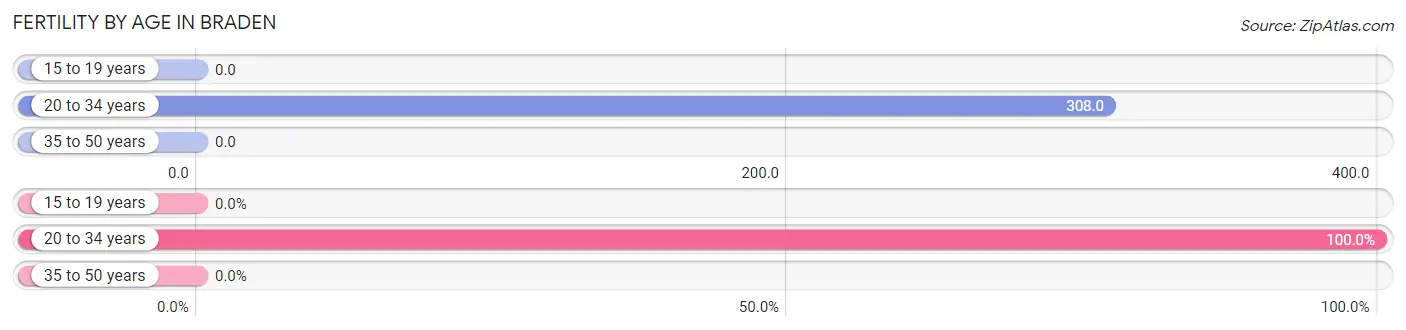
Fertility by Age in Braden
Average fertility rate in Braden is 56.0 births per 1,000 women. Women in the age bracket of 20 to 34 years have the highest fertility rate with 308.0 births per 1,000 women. Women in the age bracket of 20 to 34 years acount for 100.0% of all women with births.
| Age Bracket | Women with Births | Births / 1,000 Women |
| 15 to 19 years | 0 (0.0%) | 0.0 |
| 20 to 34 years | 4 (100.0%) | 308.0 |
| 35 to 50 years | 0 (0.0%) | 0.0 |
| Total | 4 (100.0%) | 56.0 |
Fertility by Age by Marriage Status in Braden
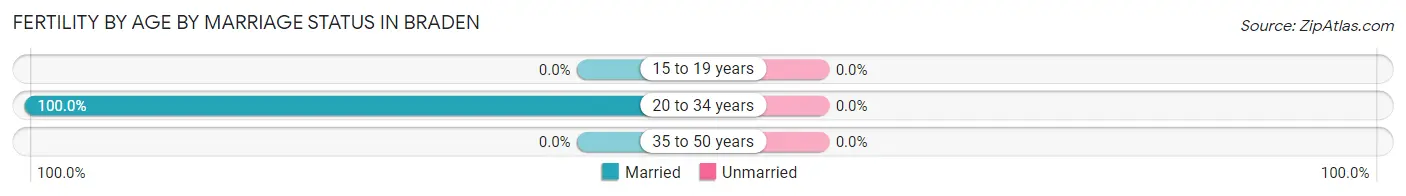
| Age Bracket | Married | Unmarried |
| 15 to 19 years | 0 (0.0%) | 0 (0.0%) |
| 20 to 34 years | 4 (100.0%) | 0 (0.0%) |
| 35 to 50 years | 0 (0.0%) | 0 (0.0%) |
| Total | 4 (100.0%) | 0 (0.0%) |
Fertility by Education in Braden
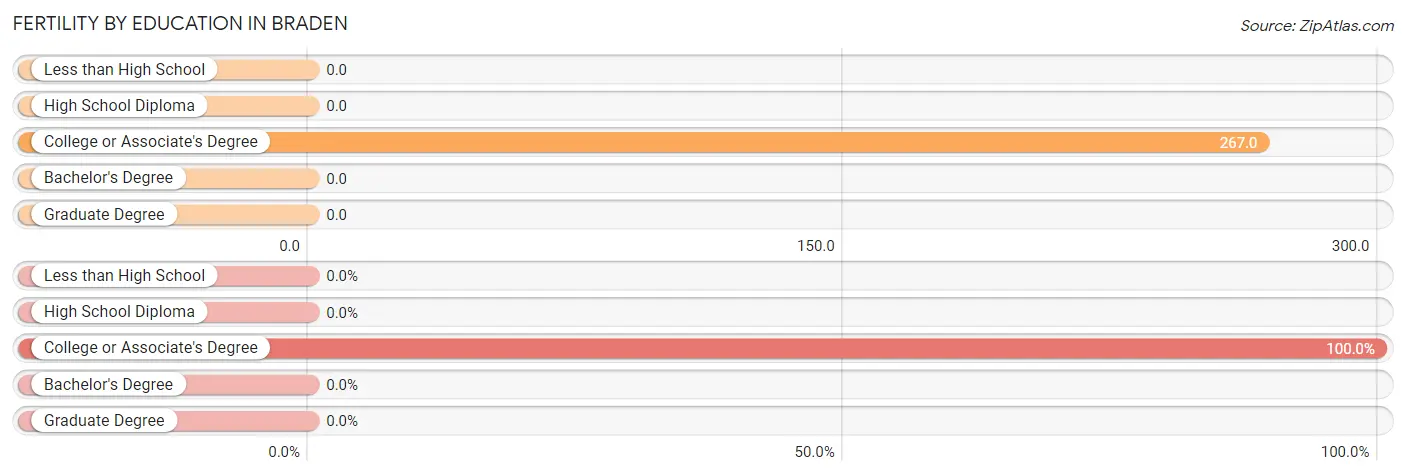
| Educational Attainment | Women with Births | Births / 1,000 Women |
| Less than High School | 0 (0.0%) | 0.0 |
| High School Diploma | 0 (0.0%) | 0.0 |
| College or Associate's Degree | 4 (100.0%) | 267.0 |
| Bachelor's Degree | 0 (0.0%) | 0.0 |
| Graduate Degree | 0 (0.0%) | 0.0 |
| Total | 4 (100.0%) | 56.0 |
Fertility by Education by Marriage Status in Braden
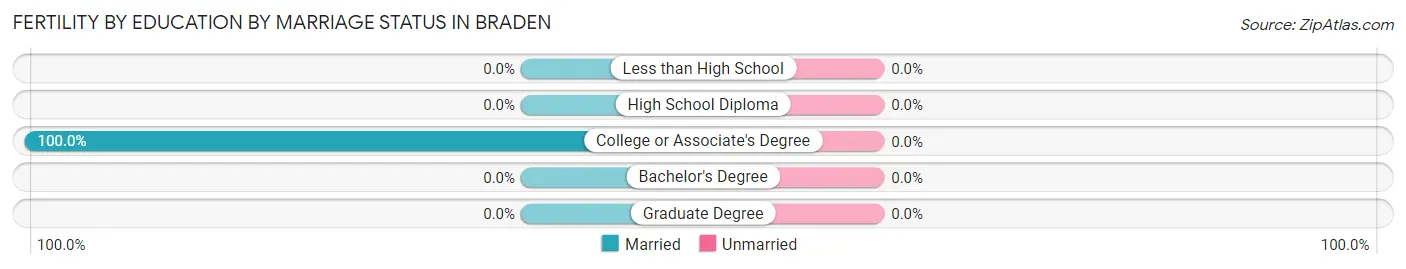
| Educational Attainment | Married | Unmarried |
| Less than High School | 0 (0.0%) | 0 (0.0%) |
| High School Diploma | 0 (0.0%) | 0 (0.0%) |
| College or Associate's Degree | 4 (100.0%) | 0 (0.0%) |
| Bachelor's Degree | 0 (0.0%) | 0 (0.0%) |
| Graduate Degree | 0 (0.0%) | 0 (0.0%) |
| Total | 4 (100.0%) | 0 (0.0%) |
Income in Braden
Income Overview in Braden
Per Capita Income in Braden is $44,475, while median incomes of families and households are $76,806 and $76,597 respectively.
| Characteristic | Number | Measure |
| Per Capita Income | 293 | $44,475 |
| Median Family Income | 78 | $76,806 |
| Mean Family Income | 78 | $134,900 |
| Median Household Income | 107 | $76,597 |
| Mean Household Income | 107 | $115,185 |
| Income Deficit | 78 | $0 |
| Wage / Income Gap (%) | 293 | 43.94% |
| Wage / Income Gap ($) | 293 | 56.06¢ per $1 |
| Gini / Inequality Index | 293 | 0.48 |
Earnings by Sex in Braden
Average Earnings in Braden are $40,365, $41,250 for men and $23,125 for women, a difference of 43.9%.
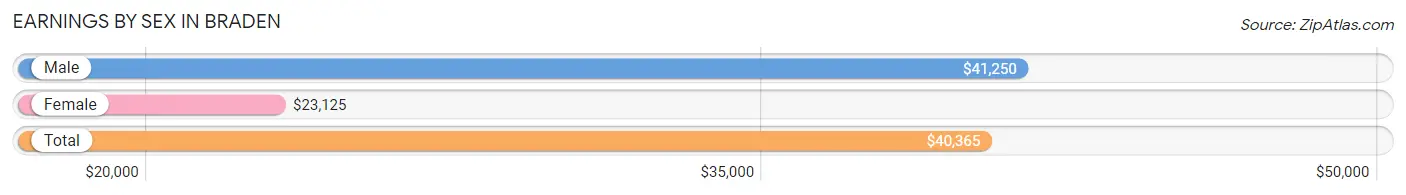
| Sex | Number | Average Earnings |
| Male | 130 (71.8%) | $41,250 |
| Female | 51 (28.2%) | $23,125 |
| Total | 181 (100.0%) | $40,365 |
Earnings by Sex by Income Bracket in Braden
The most common earnings brackets in Braden are $25,000 to $29,999 for men (27 | 20.8%) and $65,000 to $74,999 for women (9 | 17.6%).
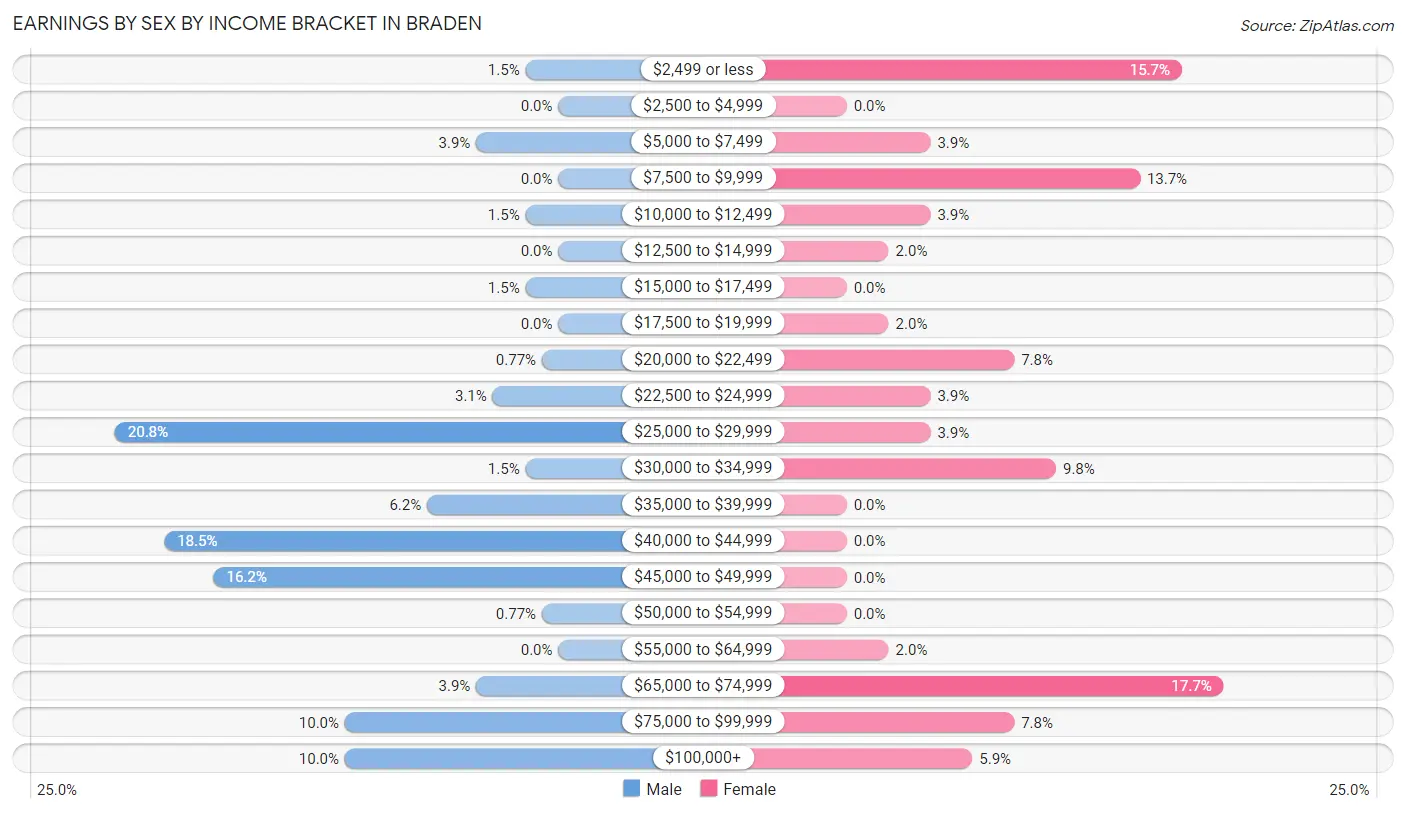
| Income | Male | Female |
| $2,499 or less | 2 (1.5%) | 8 (15.7%) |
| $2,500 to $4,999 | 0 (0.0%) | 0 (0.0%) |
| $5,000 to $7,499 | 5 (3.8%) | 2 (3.9%) |
| $7,500 to $9,999 | 0 (0.0%) | 7 (13.7%) |
| $10,000 to $12,499 | 2 (1.5%) | 2 (3.9%) |
| $12,500 to $14,999 | 0 (0.0%) | 1 (2.0%) |
| $15,000 to $17,499 | 2 (1.5%) | 0 (0.0%) |
| $17,500 to $19,999 | 0 (0.0%) | 1 (2.0%) |
| $20,000 to $22,499 | 1 (0.8%) | 4 (7.8%) |
| $22,500 to $24,999 | 4 (3.1%) | 2 (3.9%) |
| $25,000 to $29,999 | 27 (20.8%) | 2 (3.9%) |
| $30,000 to $34,999 | 2 (1.5%) | 5 (9.8%) |
| $35,000 to $39,999 | 8 (6.1%) | 0 (0.0%) |
| $40,000 to $44,999 | 24 (18.5%) | 0 (0.0%) |
| $45,000 to $49,999 | 21 (16.2%) | 0 (0.0%) |
| $50,000 to $54,999 | 1 (0.8%) | 0 (0.0%) |
| $55,000 to $64,999 | 0 (0.0%) | 1 (2.0%) |
| $65,000 to $74,999 | 5 (3.8%) | 9 (17.6%) |
| $75,000 to $99,999 | 13 (10.0%) | 4 (7.8%) |
| $100,000+ | 13 (10.0%) | 3 (5.9%) |
| Total | 130 (100.0%) | 51 (100.0%) |
Earnings by Sex by Educational Attainment in Braden
Average earnings in Braden are $45,714 for men and $23,125 for women, a difference of 49.4%. Men with an educational attainment of high school diploma enjoy the highest average annual earnings of $48,571, while those with college or associate's degree education earn the least with $41,688. Women with an educational attainment of graduate degree earn the most with the average annual earnings of $69,375, while those with graduate degree education have the smallest earnings of $69,375.
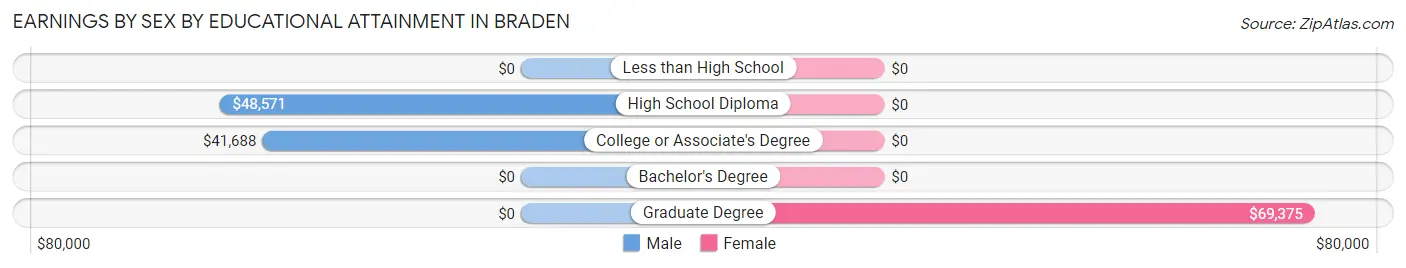
| Educational Attainment | Male Income | Female Income |
| Less than High School | - | - |
| High School Diploma | $48,571 | $0 |
| College or Associate's Degree | $41,688 | $0 |
| Bachelor's Degree | - | - |
| Graduate Degree | - | - |
| Total | $45,714 | $23,125 |
Family Income in Braden
Family Income Brackets in Braden
According to the Braden family income data, there are 25 families falling into the $75,000 to $99,999 income range, which is the most common income bracket and makes up 32.1% of all families.
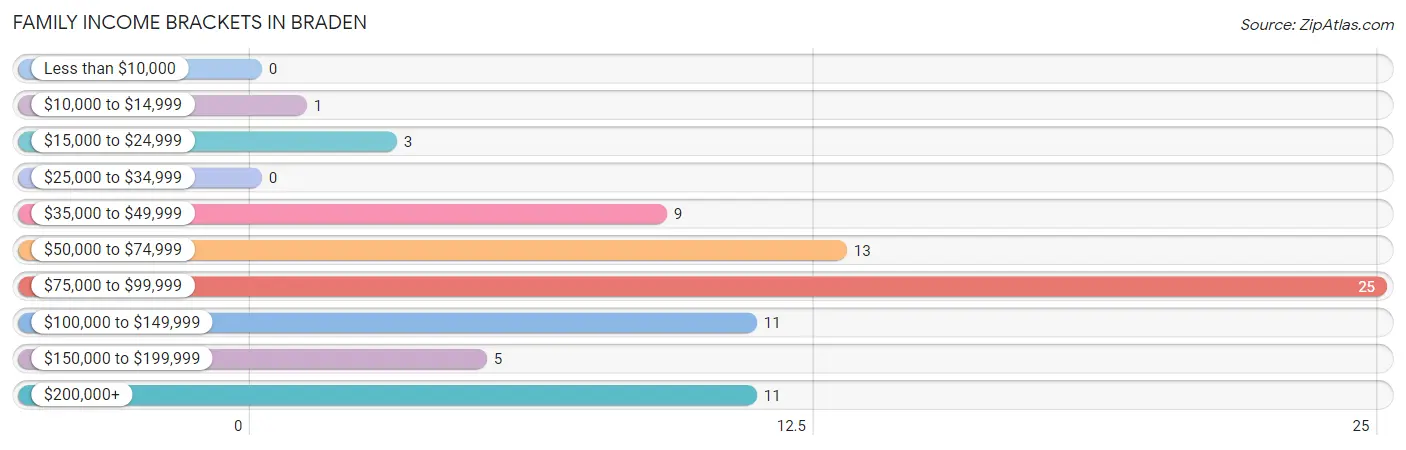
| Income Bracket | # Families | % Families |
| Less than $10,000 | 0 | 0.0% |
| $10,000 to $14,999 | 1 | 1.3% |
| $15,000 to $24,999 | 3 | 3.8% |
| $25,000 to $34,999 | 0 | 0.0% |
| $35,000 to $49,999 | 9 | 11.5% |
| $50,000 to $74,999 | 13 | 16.7% |
| $75,000 to $99,999 | 25 | 32.1% |
| $100,000 to $149,999 | 11 | 14.1% |
| $150,000 to $199,999 | 5 | 6.4% |
| $200,000+ | 11 | 14.1% |
Family Income by Famaliy Size in Braden
3-person families (23 | 29.5%) account for the highest median family income in Braden with $118,125 per family, while 3-person families (23 | 29.5%) have the highest median income of $39,375 per family member.
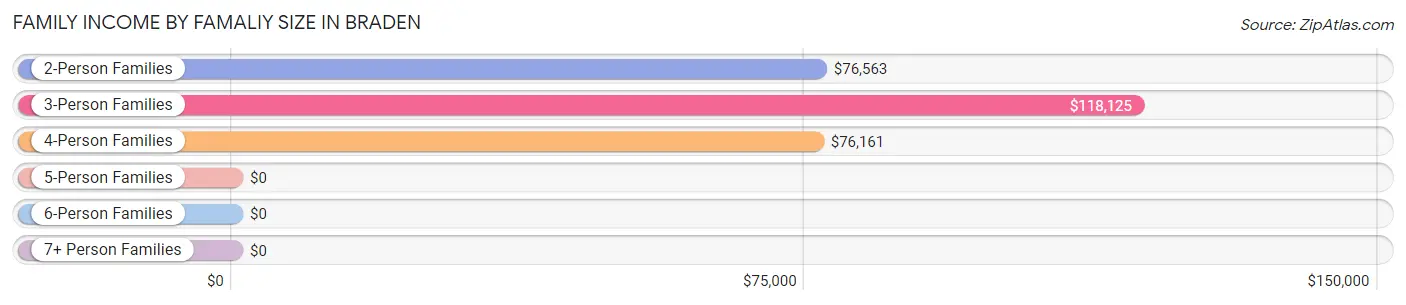
| Income Bracket | # Families | Median Income |
| 2-Person Families | 35 (44.9%) | $76,563 |
| 3-Person Families | 23 (29.5%) | $118,125 |
| 4-Person Families | 17 (21.8%) | $76,161 |
| 5-Person Families | 3 (3.8%) | $0 |
| 6-Person Families | 0 (0.0%) | $0 |
| 7+ Person Families | 0 (0.0%) | $0 |
| Total | 78 (100.0%) | $76,806 |
Family Income by Number of Earners in Braden
The median family income in Braden is $76,806, with families comprising 3+ earners (9) having the highest median family income of $250,001, while families with 1 earner (15) have the lowest median family income of $42,188, accounting for 11.5% and 19.2% of families, respectively.
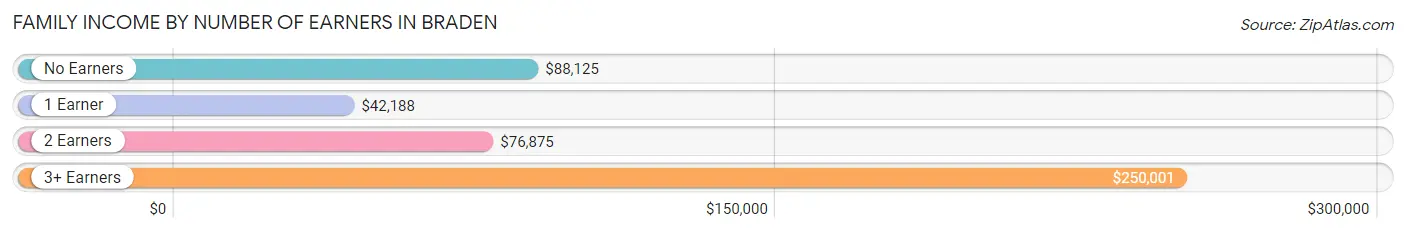
| Number of Earners | # Families | Median Income |
| No Earners | 9 (11.5%) | $88,125 |
| 1 Earner | 15 (19.2%) | $42,188 |
| 2 Earners | 45 (57.7%) | $76,875 |
| 3+ Earners | 9 (11.5%) | $250,001 |
| Total | 78 (100.0%) | $76,806 |
Household Income in Braden
Household Income Brackets in Braden
With 34 households falling in the category, the $75,000 to $99,999 income range is the most frequent in Braden, accounting for 31.8% of all households. In contrast, only 2 households (1.9%) fall into the $10,000 to $14,999 income bracket, making it the least populous group.

| Income Bracket | # Households | % Households |
| Less than $10,000 | 4 | 3.7% |
| $10,000 to $14,999 | 2 | 1.9% |
| $15,000 to $24,999 | 5 | 4.7% |
| $25,000 to $34,999 | 2 | 1.9% |
| $35,000 to $49,999 | 14 | 13.1% |
| $50,000 to $74,999 | 15 | 14.0% |
| $75,000 to $99,999 | 34 | 31.8% |
| $100,000 to $149,999 | 13 | 12.1% |
| $150,000 to $199,999 | 7 | 6.5% |
| $200,000+ | 11 | 10.3% |
Household Income by Householder Age in Braden
The median household income in Braden is $76,597, with the highest median household income of $77,083 found in the 45 to 64 years age bracket for the primary householder. A total of 56 households (52.3%) fall into this category.
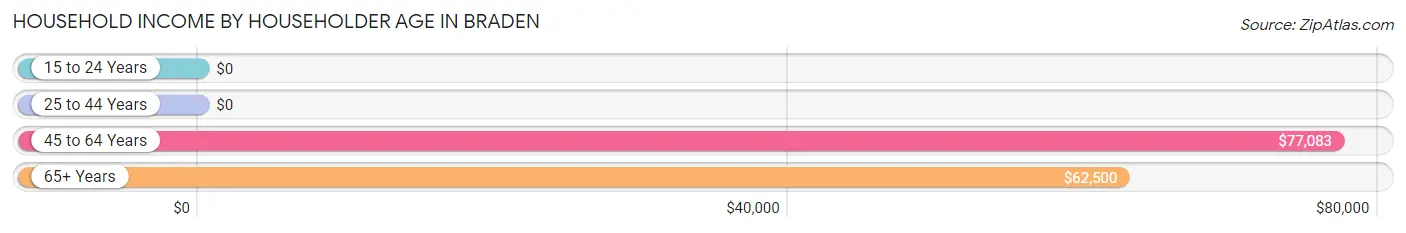
| Income Bracket | # Households | Median Income |
| 15 to 24 Years | 0 (0.0%) | $0 |
| 25 to 44 Years | 15 (14.0%) | $0 |
| 45 to 64 Years | 56 (52.3%) | $77,083 |
| 65+ Years | 36 (33.6%) | $62,500 |
| Total | 107 (100.0%) | $76,597 |
Poverty in Braden
Income Below Poverty by Sex and Age in Braden
With 3.5% poverty level for males and 4.9% for females among the residents of Braden, 12 to 14 year old males and 65 to 74 year old females are the most vulnerable to poverty, with 1 males (50.0%) and 4 females (44.4%) in their respective age groups living below the poverty level.
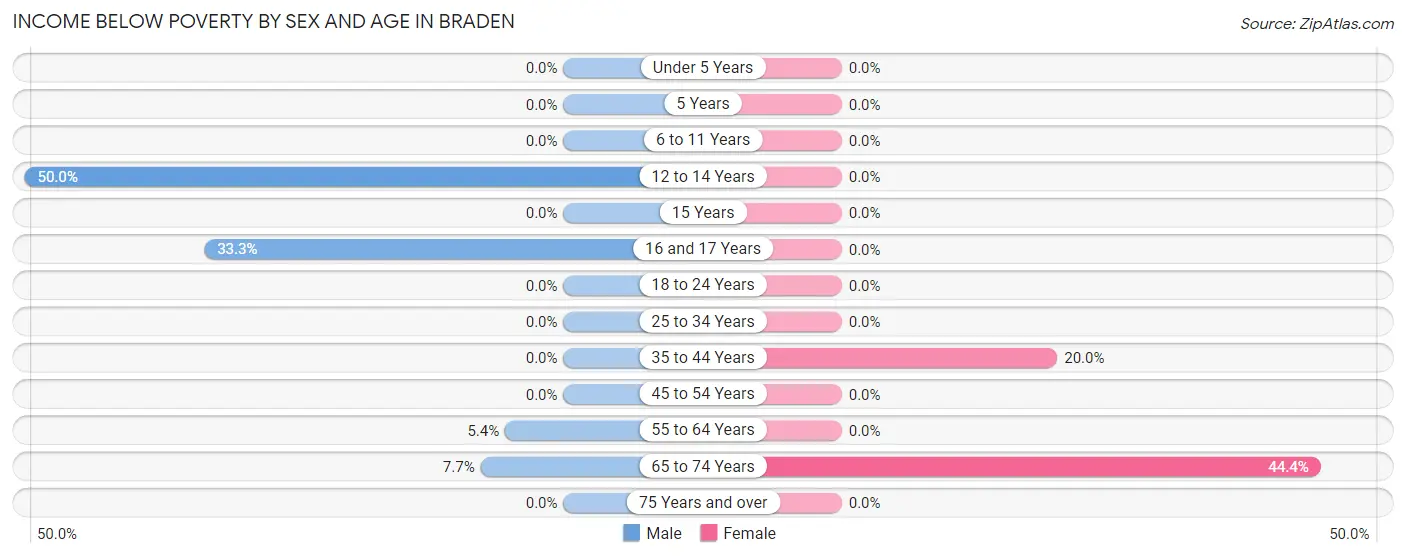
| Age Bracket | Male | Female |
| Under 5 Years | 0 (0.0%) | 0 (0.0%) |
| 5 Years | 0 (0.0%) | 0 (0.0%) |
| 6 to 11 Years | 0 (0.0%) | 0 (0.0%) |
| 12 to 14 Years | 1 (50.0%) | 0 (0.0%) |
| 15 Years | 0 (0.0%) | 0 (0.0%) |
| 16 and 17 Years | 2 (33.3%) | 0 (0.0%) |
| 18 to 24 Years | 0 (0.0%) | 0 (0.0%) |
| 25 to 34 Years | 0 (0.0%) | 0 (0.0%) |
| 35 to 44 Years | 0 (0.0%) | 2 (20.0%) |
| 45 to 54 Years | 0 (0.0%) | 0 (0.0%) |
| 55 to 64 Years | 2 (5.4%) | 0 (0.0%) |
| 65 to 74 Years | 1 (7.7%) | 4 (44.4%) |
| 75 Years and over | 0 (0.0%) | 0 (0.0%) |
| Total | 6 (3.5%) | 6 (4.9%) |
Income Above Poverty by Sex and Age in Braden
According to the poverty statistics in Braden, males aged under 5 years and females aged under 5 years are the age groups that are most secure financially, with 100.0% of males and 100.0% of females in these age groups living above the poverty line.
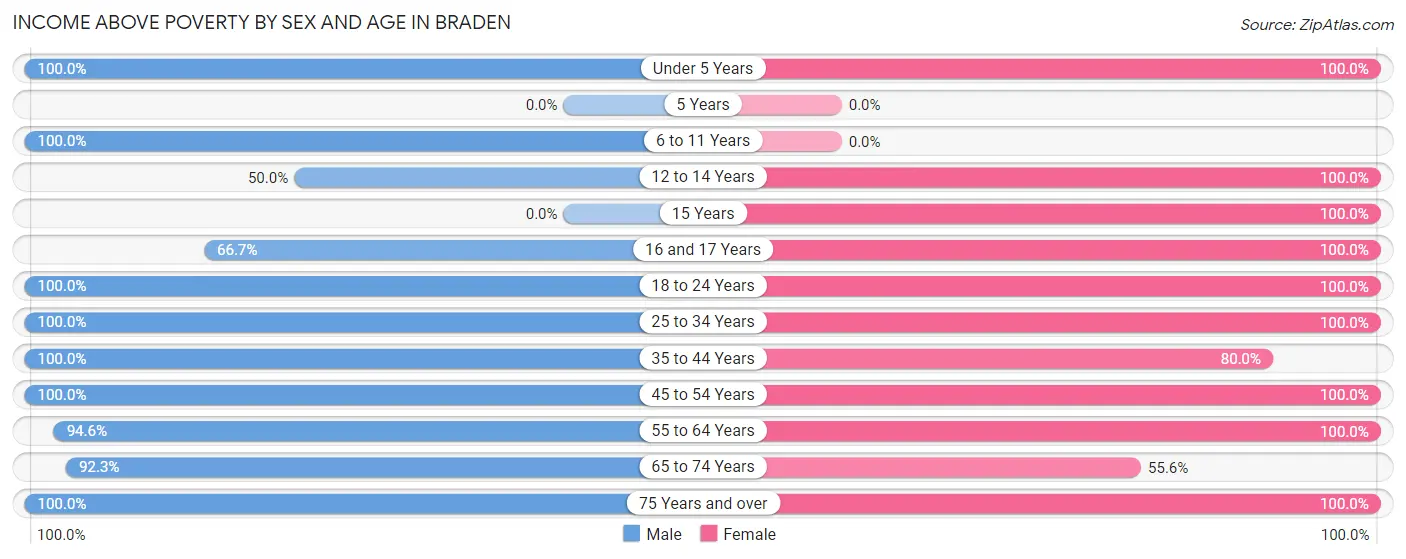
| Age Bracket | Male | Female |
| Under 5 Years | 3 (100.0%) | 4 (100.0%) |
| 5 Years | 0 (0.0%) | 0 (0.0%) |
| 6 to 11 Years | 3 (100.0%) | 0 (0.0%) |
| 12 to 14 Years | 1 (50.0%) | 1 (100.0%) |
| 15 Years | 0 (0.0%) | 1 (100.0%) |
| 16 and 17 Years | 4 (66.7%) | 3 (100.0%) |
| 18 to 24 Years | 26 (100.0%) | 11 (100.0%) |
| 25 to 34 Years | 32 (100.0%) | 13 (100.0%) |
| 35 to 44 Years | 2 (100.0%) | 8 (80.0%) |
| 45 to 54 Years | 29 (100.0%) | 48 (100.0%) |
| 55 to 64 Years | 35 (94.6%) | 13 (100.0%) |
| 65 to 74 Years | 12 (92.3%) | 5 (55.6%) |
| 75 Years and over | 16 (100.0%) | 10 (100.0%) |
| Total | 163 (96.5%) | 117 (95.1%) |
Income Below Poverty Among Married-Couple Families in Braden
The poverty statistics for married-couple families in Braden show that 1.4% or 1 of the total 70 families live below the poverty line. Families with 1 or 2 children have the highest poverty rate of 9.1%, comprising of 1 families. On the other hand, families with no children have the lowest poverty rate of 0.0%, which includes 0 families.
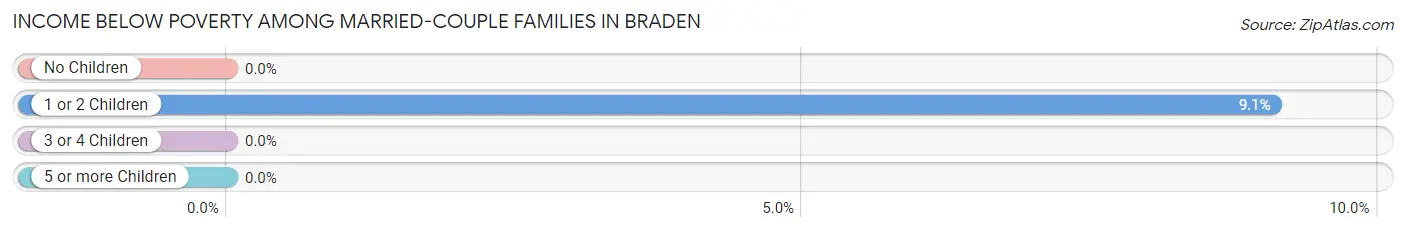
| Children | Above Poverty | Below Poverty |
| No Children | 58 (100.0%) | 0 (0.0%) |
| 1 or 2 Children | 10 (90.9%) | 1 (9.1%) |
| 3 or 4 Children | 1 (100.0%) | 0 (0.0%) |
| 5 or more Children | 0 (0.0%) | 0 (0.0%) |
| Total | 69 (98.6%) | 1 (1.4%) |
Income Below Poverty Among Single-Parent Households in Braden
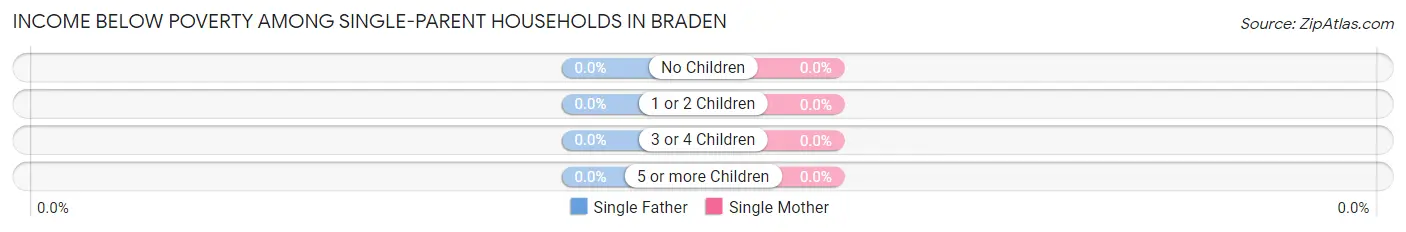
| Children | Single Father | Single Mother |
| No Children | 0 (0.0%) | 0 (0.0%) |
| 1 or 2 Children | 0 (0.0%) | 0 (0.0%) |
| 3 or 4 Children | 0 (0.0%) | 0 (0.0%) |
| 5 or more Children | 0 (0.0%) | 0 (0.0%) |
| Total | 0 (0.0%) | 0 (0.0%) |
Income Below Poverty Among Married-Couple vs Single-Parent Households in Braden
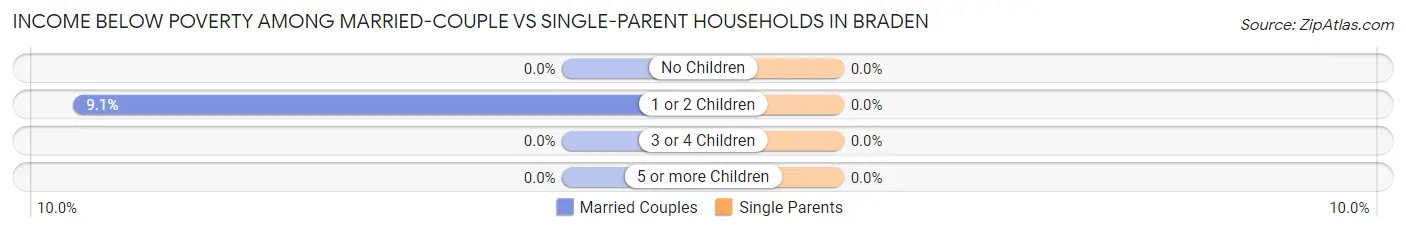
| Children | Married-Couple Families | Single-Parent Households |
| No Children | 0 (0.0%) | 0 (0.0%) |
| 1 or 2 Children | 1 (9.1%) | 0 (0.0%) |
| 3 or 4 Children | 0 (0.0%) | 0 (0.0%) |
| 5 or more Children | 0 (0.0%) | 0 (0.0%) |
| Total | 1 (1.4%) | 0 (0.0%) |
Employment Characteristics in Braden
Employment by Class of Employer in Braden
Among the 157 employed individuals in Braden, private company employees (114 | 72.6%), self-employed (not incorporated) (12 | 7.6%), and local government employees (9 | 5.7%) make up the most common classes of employment.
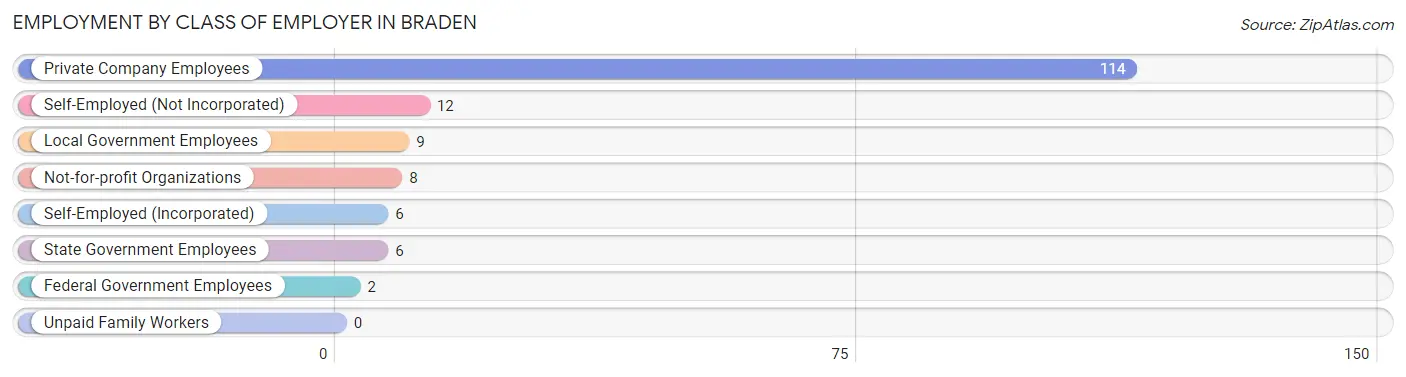
| Employer Class | # Employees | % Employees |
| Private Company Employees | 114 | 72.6% |
| Self-Employed (Incorporated) | 6 | 3.8% |
| Self-Employed (Not Incorporated) | 12 | 7.6% |
| Not-for-profit Organizations | 8 | 5.1% |
| Local Government Employees | 9 | 5.7% |
| State Government Employees | 6 | 3.8% |
| Federal Government Employees | 2 | 1.3% |
| Unpaid Family Workers | 0 | 0.0% |
| Total | 157 | 100.0% |
Employment Status by Age in Braden
According to the labor force statistics for Braden, out of the total population over 16 years of age (278), 63.3% or 176 individuals are in the labor force, with 5.1% or 9 of them unemployed. The age group with the highest labor force participation rate is 20 to 24 years, with 100.0% or 23 individuals in the labor force. Within the labor force, the 35 to 44 years age range has the highest percentage of unemployed individuals, with 25.0% or 2 of them being unemployed.
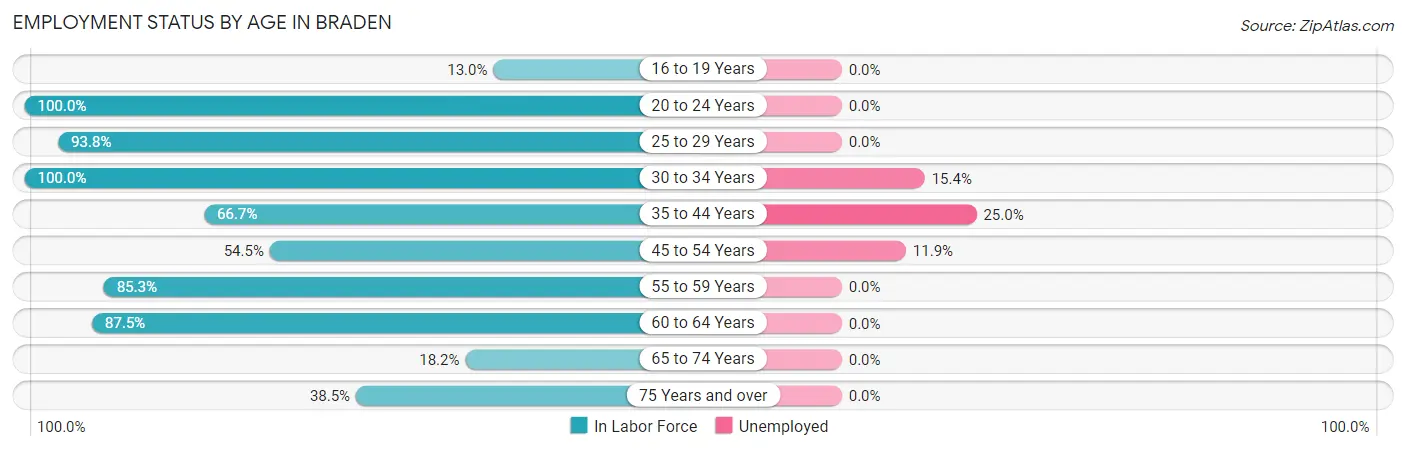
| Age Bracket | In Labor Force | Unemployed |
| 16 to 19 Years | 3 (13.0%) | 0 (0.0%) |
| 20 to 24 Years | 23 (100.0%) | 0 (0.0%) |
| 25 to 29 Years | 30 (93.8%) | 0 (0.0%) |
| 30 to 34 Years | 13 (100.0%) | 2 (15.4%) |
| 35 to 44 Years | 8 (66.7%) | 2 (25.0%) |
| 45 to 54 Years | 42 (54.5%) | 5 (11.9%) |
| 55 to 59 Years | 29 (85.3%) | 0 (0.0%) |
| 60 to 64 Years | 14 (87.5%) | 0 (0.0%) |
| 65 to 74 Years | 4 (18.2%) | 0 (0.0%) |
| 75 Years and over | 10 (38.5%) | 0 (0.0%) |
| Total | 176 (63.3%) | 9 (5.1%) |
Employment Status by Educational Attainment in Braden
According to labor force statistics for Braden, 73.9% of individuals (136) out of the total population between 25 and 64 years of age (184) are in the labor force, with 6.6% or 9 of them being unemployed. The group with the highest labor force participation rate are those with the educational attainment of college / associate degree, with 85.1% or 57 individuals in the labor force. Within the labor force, individuals with college / associate degree education have the highest percentage of unemployment, with 8.8% or 5 of them being unemployed.
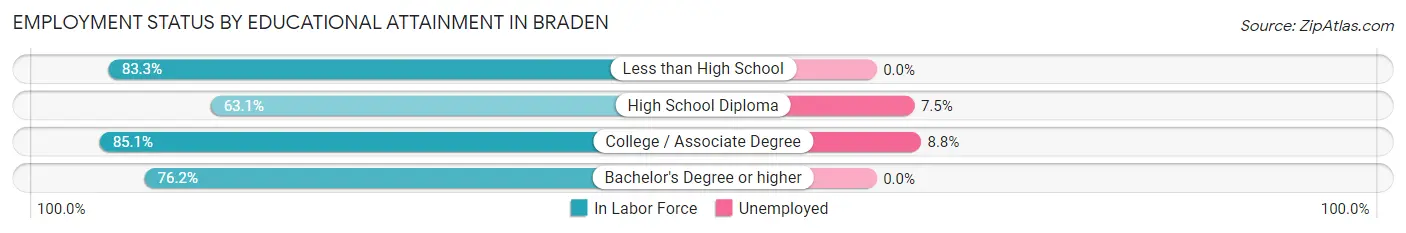
| Educational Attainment | In Labor Force | Unemployed |
| Less than High School | 10 (83.3%) | 0 (0.0%) |
| High School Diploma | 53 (63.1%) | 6 (7.5%) |
| College / Associate Degree | 57 (85.1%) | 6 (8.8%) |
| Bachelor's Degree or higher | 16 (76.2%) | 0 (0.0%) |
| Total | 136 (73.9%) | 12 (6.6%) |
Employment Occupations by Sex in Braden
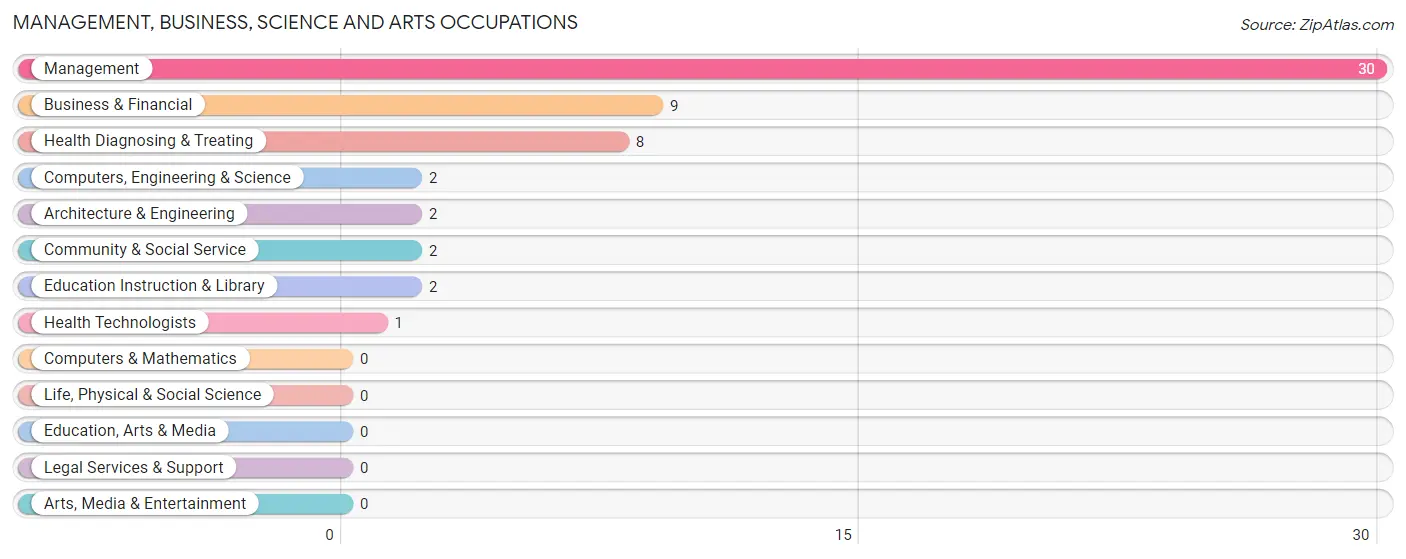
Management, Business, Science and Arts Occupations
The most common Management, Business, Science and Arts occupations in Braden are Management (30 | 18.0%), Business & Financial (9 | 5.4%), Health Diagnosing & Treating (8 | 4.8%), Computers, Engineering & Science (2 | 1.2%), and Architecture & Engineering (2 | 1.2%).
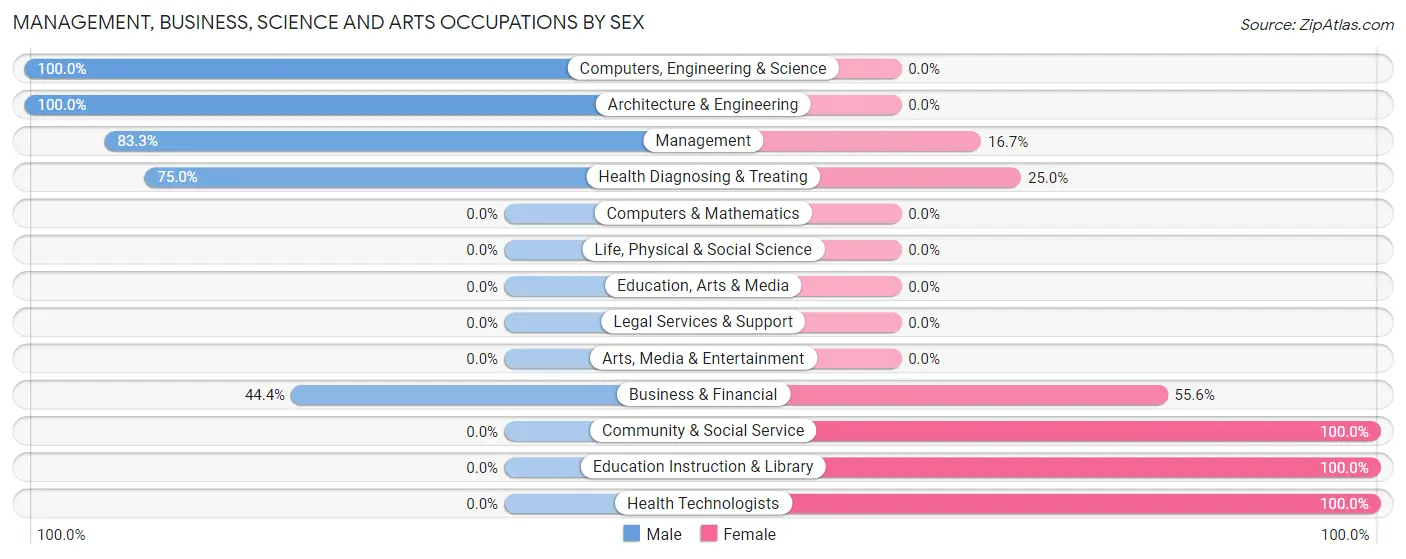
Management, Business, Science and Arts Occupations by Sex
Within the Management, Business, Science and Arts occupations in Braden, the most male-oriented occupations are Computers, Engineering & Science (100.0%), Architecture & Engineering (100.0%), and Management (83.3%), while the most female-oriented occupations are Community & Social Service (100.0%), Education Instruction & Library (100.0%), and Health Technologists (100.0%).
| Occupation | Male | Female |
| Management | 25 (83.3%) | 5 (16.7%) |
| Business & Financial | 4 (44.4%) | 5 (55.6%) |
| Computers, Engineering & Science | 2 (100.0%) | 0 (0.0%) |
| Computers & Mathematics | 0 (0.0%) | 0 (0.0%) |
| Architecture & Engineering | 2 (100.0%) | 0 (0.0%) |
| Life, Physical & Social Science | 0 (0.0%) | 0 (0.0%) |
| Community & Social Service | 0 (0.0%) | 2 (100.0%) |
| Education, Arts & Media | 0 (0.0%) | 0 (0.0%) |
| Legal Services & Support | 0 (0.0%) | 0 (0.0%) |
| Education Instruction & Library | 0 (0.0%) | 2 (100.0%) |
| Arts, Media & Entertainment | 0 (0.0%) | 0 (0.0%) |
| Health Diagnosing & Treating | 6 (75.0%) | 2 (25.0%) |
| Health Technologists | 0 (0.0%) | 1 (100.0%) |
| Total (Category) | 37 (72.6%) | 14 (27.5%) |
| Total (Overall) | 124 (74.3%) | 43 (25.8%) |
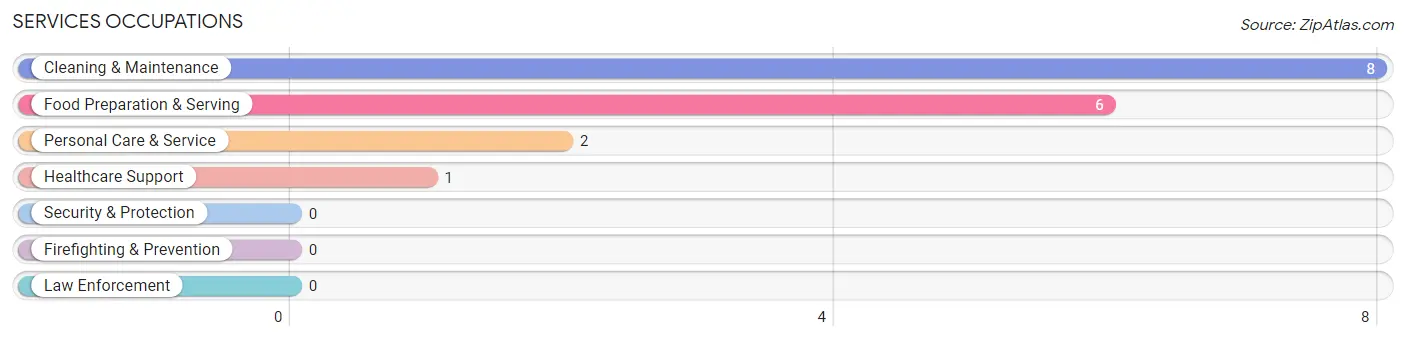
Services Occupations
The most common Services occupations in Braden are Cleaning & Maintenance (8 | 4.8%), Food Preparation & Serving (6 | 3.6%), Personal Care & Service (2 | 1.2%), and Healthcare Support (1 | 0.6%).
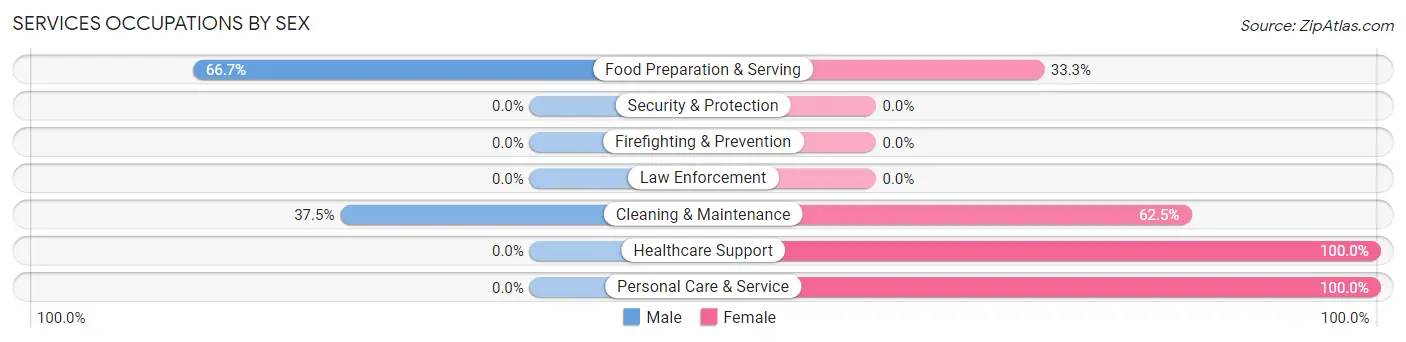
Services Occupations by Sex
Within the Services occupations in Braden, the most male-oriented occupations are Food Preparation & Serving (66.7%), and Cleaning & Maintenance (37.5%), while the most female-oriented occupations are Healthcare Support (100.0%), Personal Care & Service (100.0%), and Cleaning & Maintenance (62.5%).
| Occupation | Male | Female |
| Healthcare Support | 0 (0.0%) | 1 (100.0%) |
| Security & Protection | 0 (0.0%) | 0 (0.0%) |
| Firefighting & Prevention | 0 (0.0%) | 0 (0.0%) |
| Law Enforcement | 0 (0.0%) | 0 (0.0%) |
| Food Preparation & Serving | 4 (66.7%) | 2 (33.3%) |
| Cleaning & Maintenance | 3 (37.5%) | 5 (62.5%) |
| Personal Care & Service | 0 (0.0%) | 2 (100.0%) |
| Total (Category) | 7 (41.2%) | 10 (58.8%) |
| Total (Overall) | 124 (74.3%) | 43 (25.8%) |
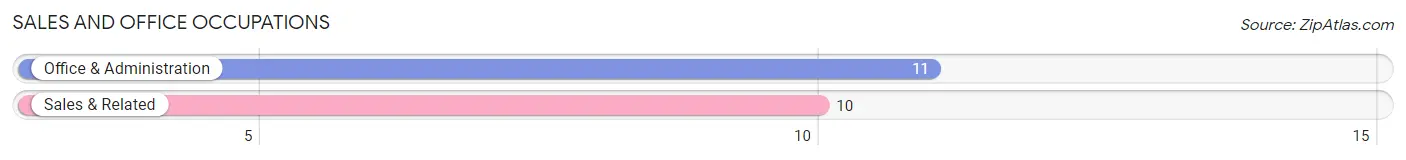
Sales and Office Occupations
The most common Sales and Office occupations in Braden are Office & Administration (11 | 6.6%), and Sales & Related (10 | 6.0%).
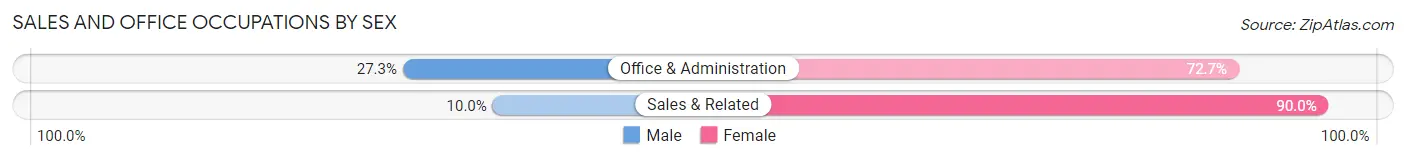
Sales and Office Occupations by Sex
| Occupation | Male | Female |
| Sales & Related | 1 (10.0%) | 9 (90.0%) |
| Office & Administration | 3 (27.3%) | 8 (72.7%) |
| Total (Category) | 4 (19.1%) | 17 (80.9%) |
| Total (Overall) | 124 (74.3%) | 43 (25.8%) |
Natural Resources, Construction and Maintenance Occupations
The most common Natural Resources, Construction and Maintenance occupations in Braden are Construction & Extraction (6 | 3.6%), and Installation, Maintenance & Repair (2 | 1.2%).
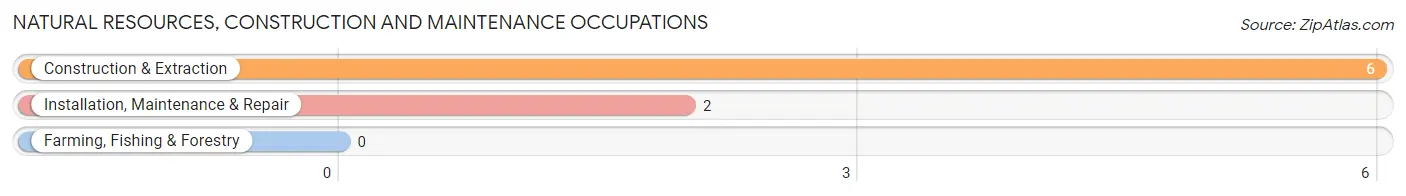
Natural Resources, Construction and Maintenance Occupations by Sex
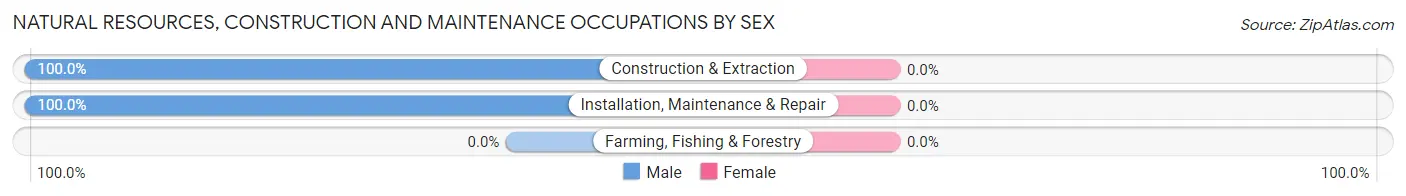
| Occupation | Male | Female |
| Farming, Fishing & Forestry | 0 (0.0%) | 0 (0.0%) |
| Construction & Extraction | 6 (100.0%) | 0 (0.0%) |
| Installation, Maintenance & Repair | 2 (100.0%) | 0 (0.0%) |
| Total (Category) | 8 (100.0%) | 0 (0.0%) |
| Total (Overall) | 124 (74.3%) | 43 (25.8%) |
Production, Transportation and Moving Occupations
The most common Production, Transportation and Moving occupations in Braden are Transportation (36 | 21.6%), Production (30 | 18.0%), and Material Moving (4 | 2.4%).
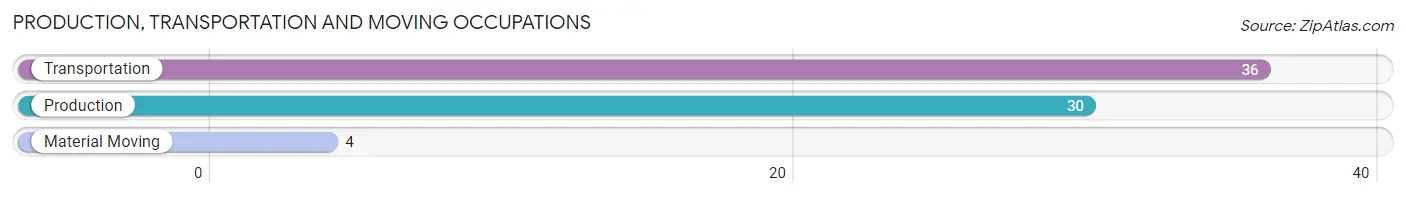
Production, Transportation and Moving Occupations by Sex
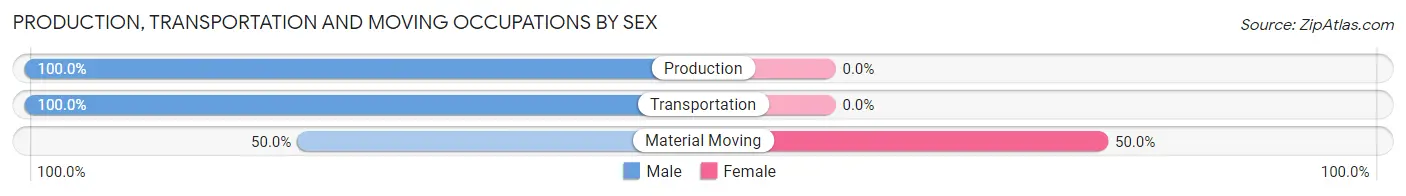
| Occupation | Male | Female |
| Production | 30 (100.0%) | 0 (0.0%) |
| Transportation | 36 (100.0%) | 0 (0.0%) |
| Material Moving | 2 (50.0%) | 2 (50.0%) |
| Total (Category) | 68 (97.1%) | 2 (2.9%) |
| Total (Overall) | 124 (74.3%) | 43 (25.8%) |
Employment Industries by Sex in Braden
Employment Industries in Braden
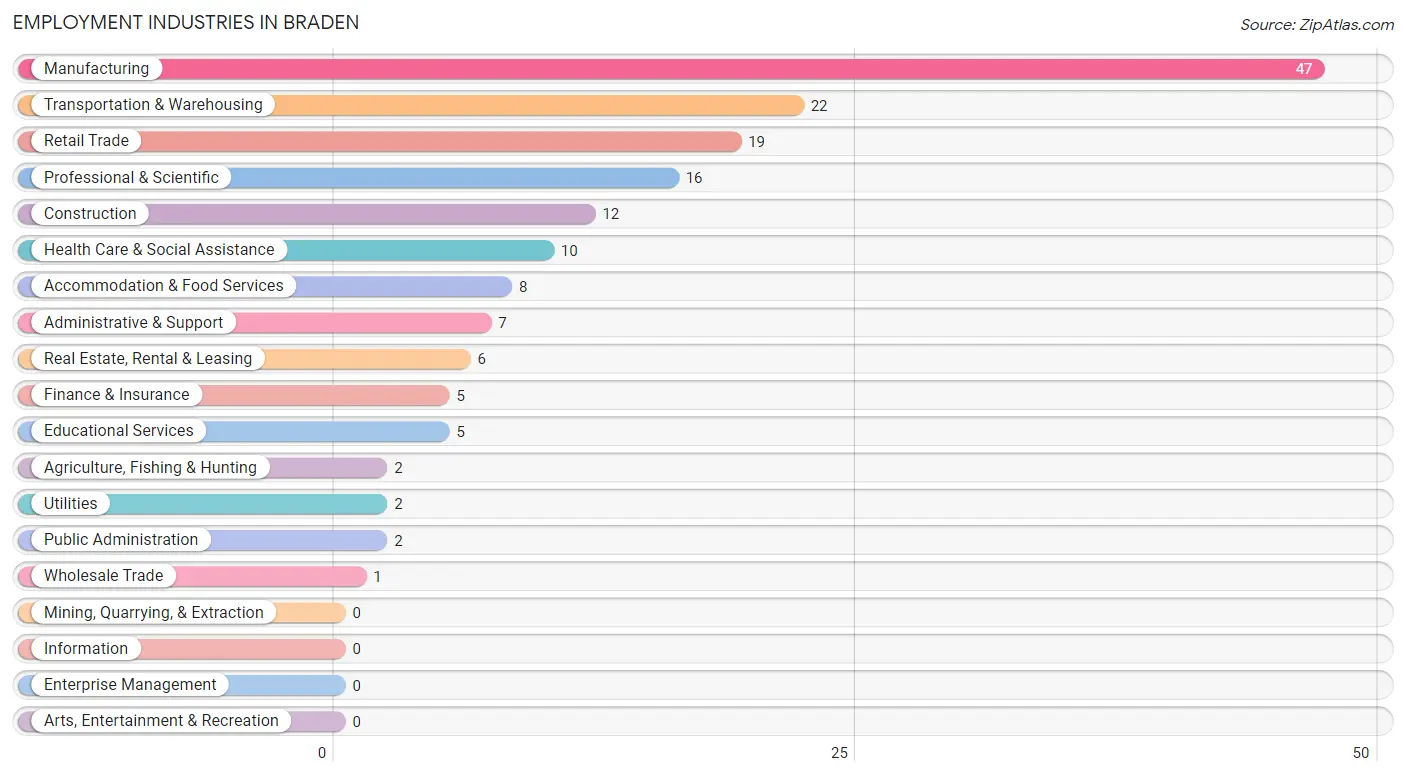
The major employment industries in Braden include Manufacturing (47 | 28.1%), Transportation & Warehousing (22 | 13.2%), Retail Trade (19 | 11.4%), Professional & Scientific (16 | 9.6%), and Construction (12 | 7.2%).
Employment Industries by Sex in Braden
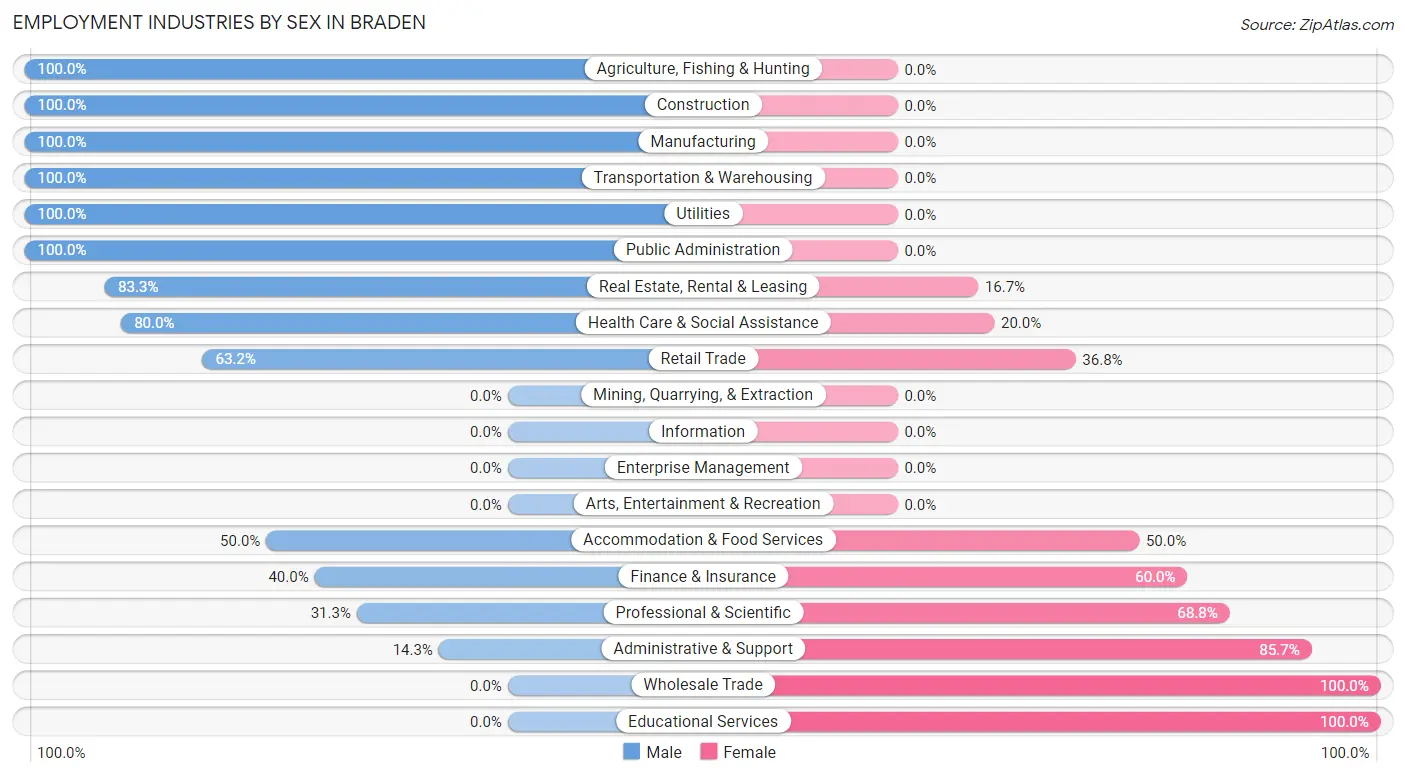
The Braden industries that see more men than women are Agriculture, Fishing & Hunting (100.0%), Construction (100.0%), and Manufacturing (100.0%), whereas the industries that tend to have a higher number of women are Wholesale Trade (100.0%), Educational Services (100.0%), and Administrative & Support (85.7%).
| Industry | Male | Female |
| Agriculture, Fishing & Hunting | 2 (100.0%) | 0 (0.0%) |
| Mining, Quarrying, & Extraction | 0 (0.0%) | 0 (0.0%) |
| Construction | 12 (100.0%) | 0 (0.0%) |
| Manufacturing | 47 (100.0%) | 0 (0.0%) |
| Wholesale Trade | 0 (0.0%) | 1 (100.0%) |
| Retail Trade | 12 (63.2%) | 7 (36.8%) |
| Transportation & Warehousing | 22 (100.0%) | 0 (0.0%) |
| Utilities | 2 (100.0%) | 0 (0.0%) |
| Information | 0 (0.0%) | 0 (0.0%) |
| Finance & Insurance | 2 (40.0%) | 3 (60.0%) |
| Real Estate, Rental & Leasing | 5 (83.3%) | 1 (16.7%) |
| Professional & Scientific | 5 (31.2%) | 11 (68.8%) |
| Enterprise Management | 0 (0.0%) | 0 (0.0%) |
| Administrative & Support | 1 (14.3%) | 6 (85.7%) |
| Educational Services | 0 (0.0%) | 5 (100.0%) |
| Health Care & Social Assistance | 8 (80.0%) | 2 (20.0%) |
| Arts, Entertainment & Recreation | 0 (0.0%) | 0 (0.0%) |
| Accommodation & Food Services | 4 (50.0%) | 4 (50.0%) |
| Public Administration | 2 (100.0%) | 0 (0.0%) |
| Total | 124 (74.3%) | 43 (25.8%) |
Education in Braden
School Enrollment in Braden
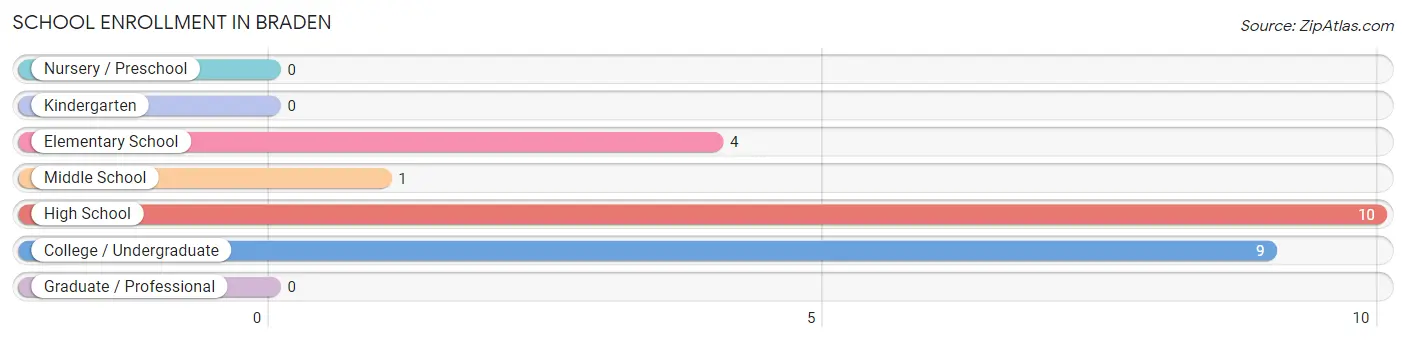
The most common levels of schooling among the 24 students in Braden are high school (10 | 41.7%), college / undergraduate (9 | 37.5%), and elementary school (4 | 16.7%).
| School Level | # Students | % Students |
| Nursery / Preschool | 0 | 0.0% |
| Kindergarten | 0 | 0.0% |
| Elementary School | 4 | 16.7% |
| Middle School | 1 | 4.2% |
| High School | 10 | 41.7% |
| College / Undergraduate | 9 | 37.5% |
| Graduate / Professional | 0 | 0.0% |
| Total | 24 | 100.0% |
School Enrollment by Age by Funding Source in Braden
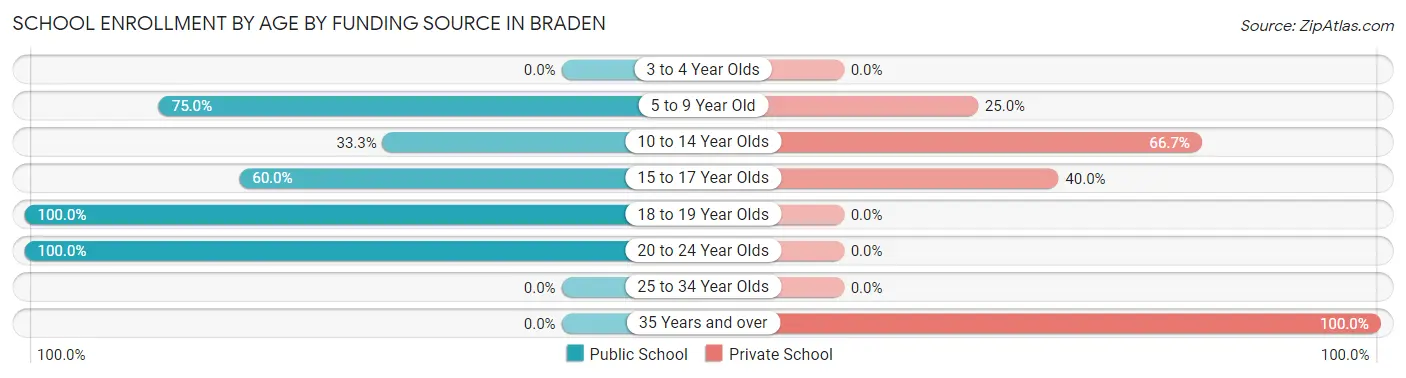
Out of a total of 24 students who are enrolled in schools in Braden, 9 (37.5%) attend a private institution, while the remaining 15 (62.5%) are enrolled in public schools. The age group of 35 years and over has the highest likelihood of being enrolled in private schools, with 2 (100.0% in the age bracket) enrolled. Conversely, the age group of 18 to 19 year olds has the lowest likelihood of being enrolled in a private school, with 3 (100.0% in the age bracket) attending a public institution.
| Age Bracket | Public School | Private School |
| 3 to 4 Year Olds | 0 (0.0%) | 0 (0.0%) |
| 5 to 9 Year Old | 3 (75.0%) | 1 (25.0%) |
| 10 to 14 Year Olds | 1 (33.3%) | 2 (66.7%) |
| 15 to 17 Year Olds | 6 (60.0%) | 4 (40.0%) |
| 18 to 19 Year Olds | 3 (100.0%) | 0 (0.0%) |
| 20 to 24 Year Olds | 2 (100.0%) | 0 (0.0%) |
| 25 to 34 Year Olds | 0 (0.0%) | 0 (0.0%) |
| 35 Years and over | 0 (0.0%) | 2 (100.0%) |
| Total | 15 (62.5%) | 9 (37.5%) |
Educational Attainment by Field of Study in Braden
Business (10 | 33.3%), computers & mathematics (6 | 20.0%), arts & humanities (6 | 20.0%), education (4 | 13.3%), and engineering (2 | 6.7%) are the most common fields of study among 30 individuals in Braden who have obtained a bachelor's degree or higher.
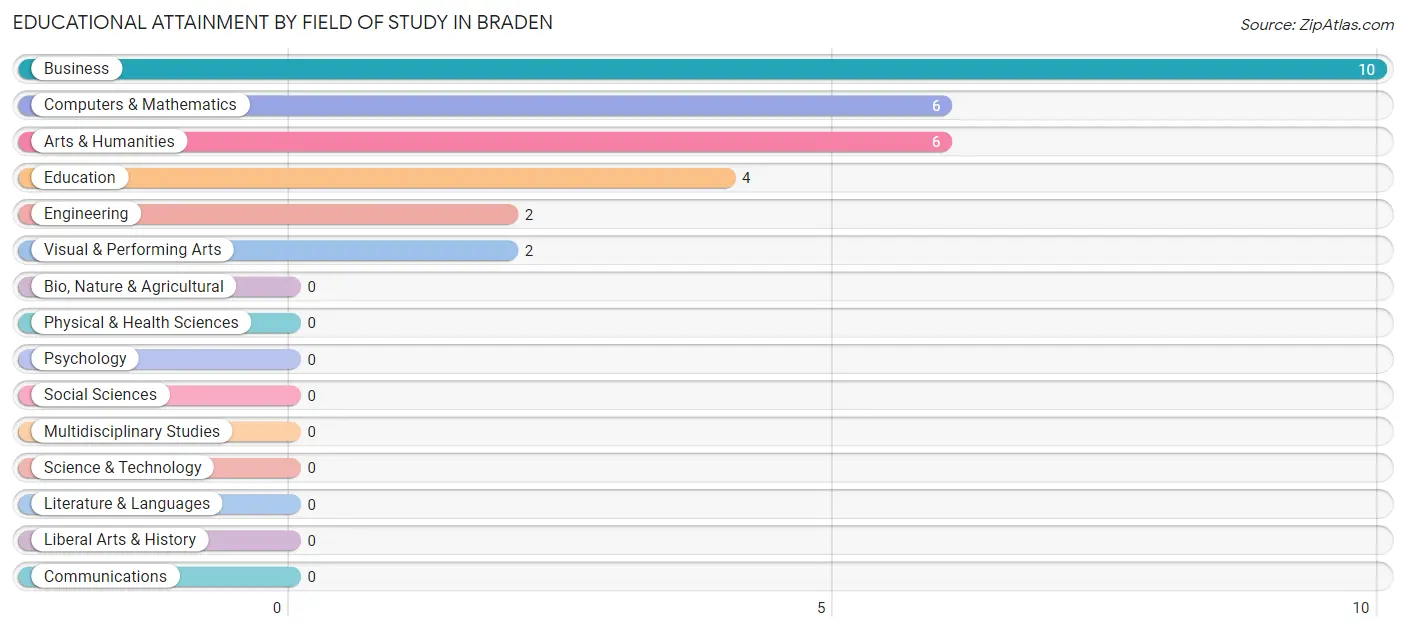
| Field of Study | # Graduates | % Graduates |
| Computers & Mathematics | 6 | 20.0% |
| Bio, Nature & Agricultural | 0 | 0.0% |
| Physical & Health Sciences | 0 | 0.0% |
| Psychology | 0 | 0.0% |
| Social Sciences | 0 | 0.0% |
| Engineering | 2 | 6.7% |
| Multidisciplinary Studies | 0 | 0.0% |
| Science & Technology | 0 | 0.0% |
| Business | 10 | 33.3% |
| Education | 4 | 13.3% |
| Literature & Languages | 0 | 0.0% |
| Liberal Arts & History | 0 | 0.0% |
| Visual & Performing Arts | 2 | 6.7% |
| Communications | 0 | 0.0% |
| Arts & Humanities | 6 | 20.0% |
| Total | 30 | 100.0% |
Transportation & Commute in Braden
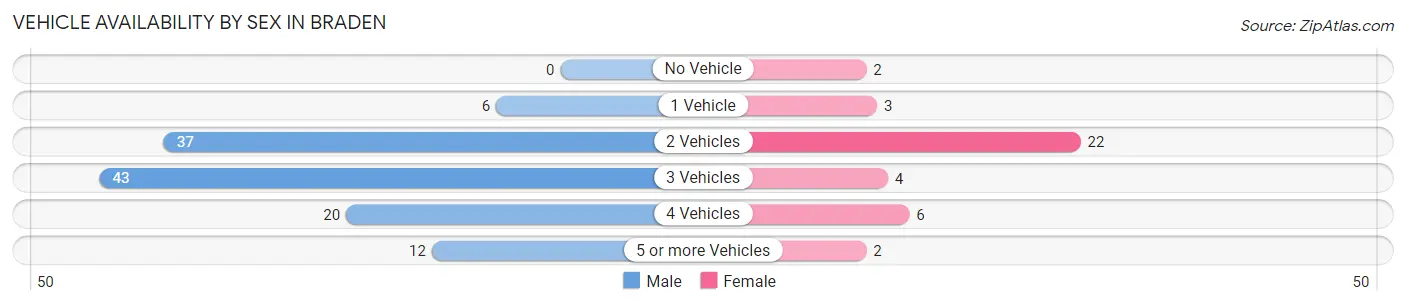
Vehicle Availability by Sex in Braden
The most prevalent vehicle ownership categories in Braden are males with 3 vehicles (43, accounting for 36.4%) and females with 3 vehicles (4, making up 110.3%).
| Vehicles Available | Male | Female |
| No Vehicle | 0 (0.0%) | 2 (5.1%) |
| 1 Vehicle | 6 (5.1%) | 3 (7.7%) |
| 2 Vehicles | 37 (31.4%) | 22 (56.4%) |
| 3 Vehicles | 43 (36.4%) | 4 (10.3%) |
| 4 Vehicles | 20 (17.0%) | 6 (15.4%) |
| 5 or more Vehicles | 12 (10.2%) | 2 (5.1%) |
| Total | 118 (100.0%) | 39 (100.0%) |
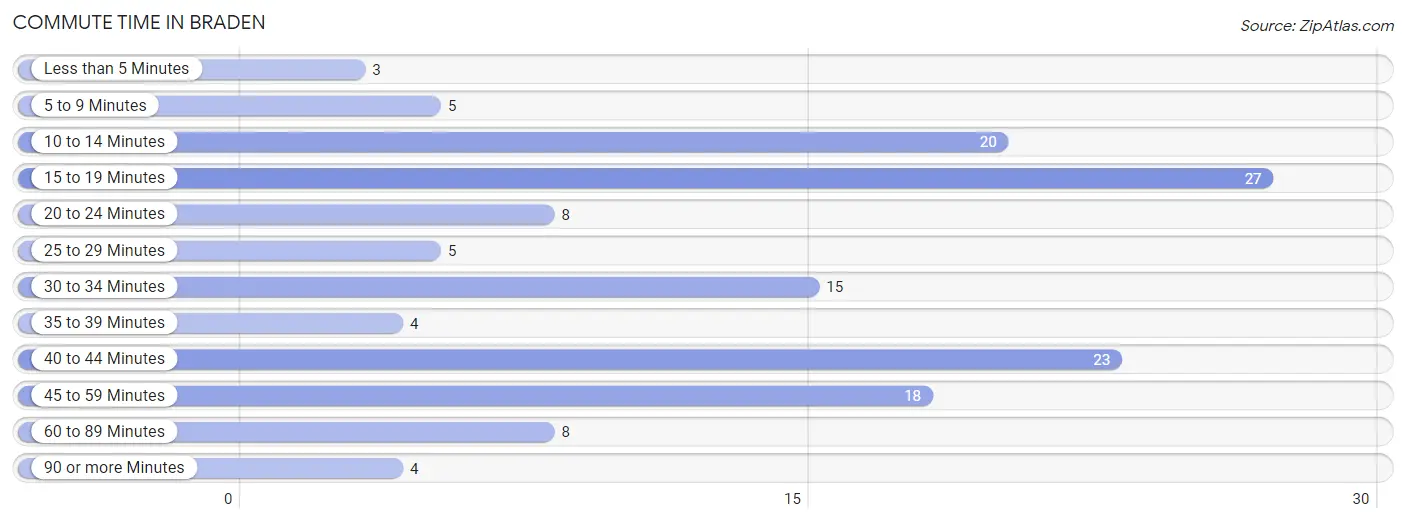
Commute Time in Braden
The most frequently occuring commute durations in Braden are 15 to 19 minutes (27 commuters, 19.3%), 40 to 44 minutes (23 commuters, 16.4%), and 10 to 14 minutes (20 commuters, 14.3%).
| Commute Time | # Commuters | % Commuters |
| Less than 5 Minutes | 3 | 2.1% |
| 5 to 9 Minutes | 5 | 3.6% |
| 10 to 14 Minutes | 20 | 14.3% |
| 15 to 19 Minutes | 27 | 19.3% |
| 20 to 24 Minutes | 8 | 5.7% |
| 25 to 29 Minutes | 5 | 3.6% |
| 30 to 34 Minutes | 15 | 10.7% |
| 35 to 39 Minutes | 4 | 2.9% |
| 40 to 44 Minutes | 23 | 16.4% |
| 45 to 59 Minutes | 18 | 12.9% |
| 60 to 89 Minutes | 8 | 5.7% |
| 90 or more Minutes | 4 | 2.9% |
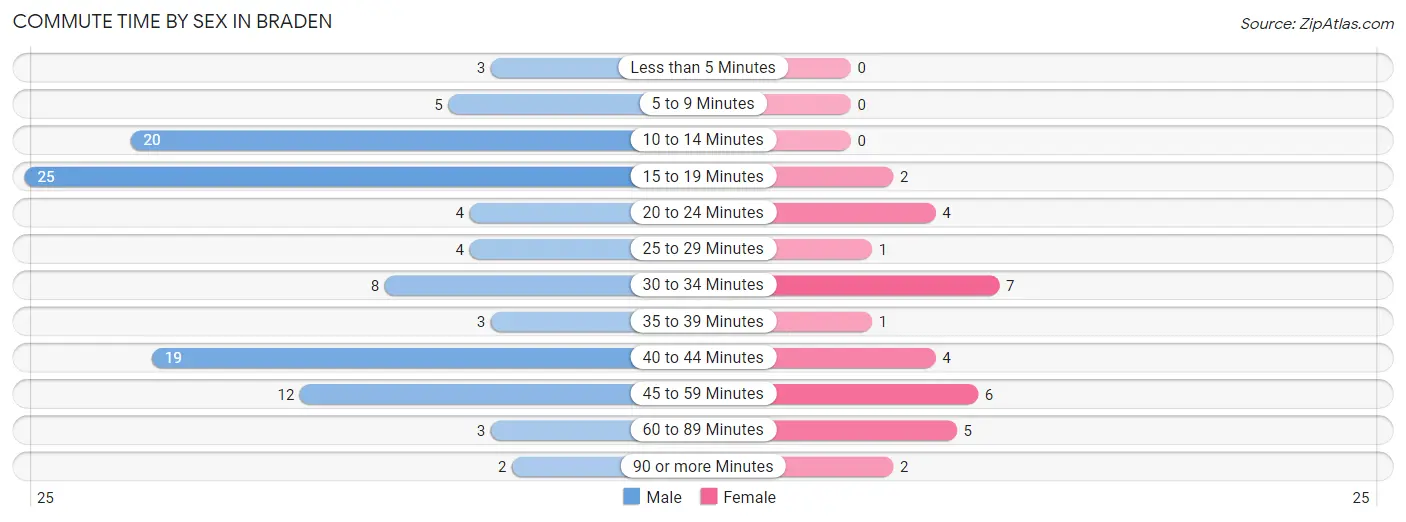
Commute Time by Sex in Braden
The most common commute times in Braden are 15 to 19 minutes (25 commuters, 23.2%) for males and 30 to 34 minutes (7 commuters, 21.9%) for females.
| Commute Time | Male | Female |
| Less than 5 Minutes | 3 (2.8%) | 0 (0.0%) |
| 5 to 9 Minutes | 5 (4.6%) | 0 (0.0%) |
| 10 to 14 Minutes | 20 (18.5%) | 0 (0.0%) |
| 15 to 19 Minutes | 25 (23.2%) | 2 (6.2%) |
| 20 to 24 Minutes | 4 (3.7%) | 4 (12.5%) |
| 25 to 29 Minutes | 4 (3.7%) | 1 (3.1%) |
| 30 to 34 Minutes | 8 (7.4%) | 7 (21.9%) |
| 35 to 39 Minutes | 3 (2.8%) | 1 (3.1%) |
| 40 to 44 Minutes | 19 (17.6%) | 4 (12.5%) |
| 45 to 59 Minutes | 12 (11.1%) | 6 (18.8%) |
| 60 to 89 Minutes | 3 (2.8%) | 5 (15.6%) |
| 90 or more Minutes | 2 (1.8%) | 2 (6.2%) |
Time of Departure to Work by Sex in Braden
The most frequent times of departure to work in Braden are 12:00 PM to 3:59 PM (32, 29.6%) for males and 6:00 AM to 6:29 AM (6, 18.8%) for females.
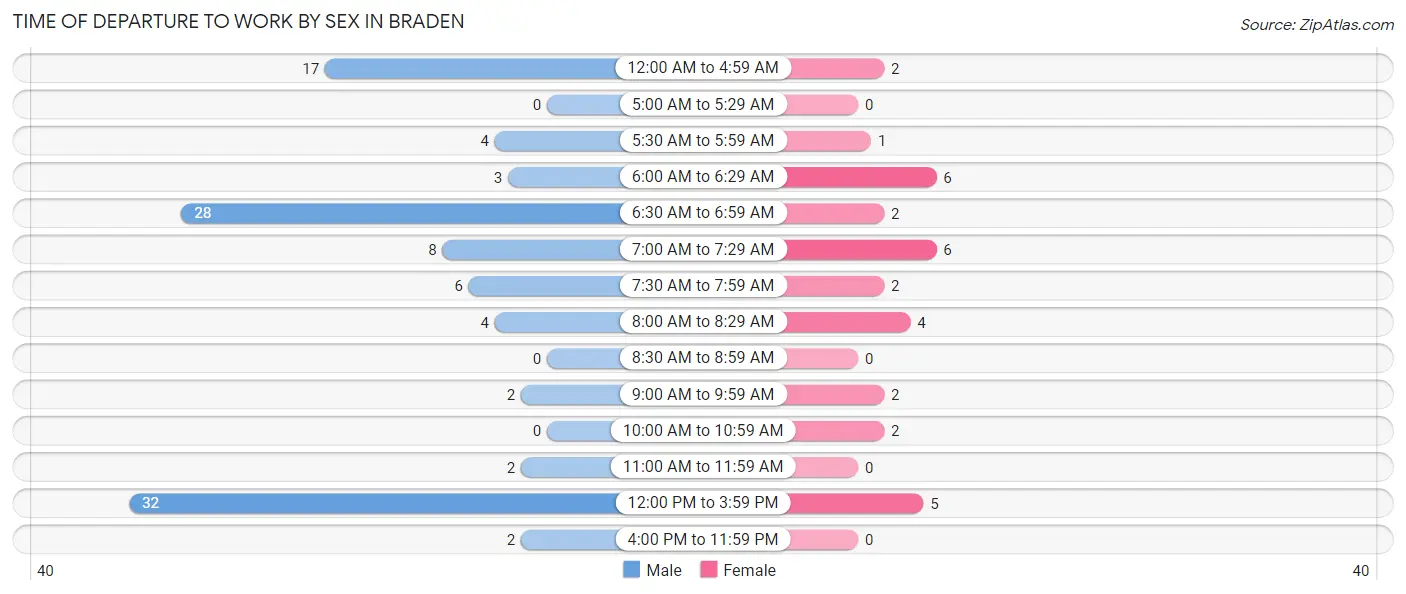
| Time of Departure | Male | Female |
| 12:00 AM to 4:59 AM | 17 (15.7%) | 2 (6.2%) |
| 5:00 AM to 5:29 AM | 0 (0.0%) | 0 (0.0%) |
| 5:30 AM to 5:59 AM | 4 (3.7%) | 1 (3.1%) |
| 6:00 AM to 6:29 AM | 3 (2.8%) | 6 (18.8%) |
| 6:30 AM to 6:59 AM | 28 (25.9%) | 2 (6.2%) |
| 7:00 AM to 7:29 AM | 8 (7.4%) | 6 (18.8%) |
| 7:30 AM to 7:59 AM | 6 (5.6%) | 2 (6.2%) |
| 8:00 AM to 8:29 AM | 4 (3.7%) | 4 (12.5%) |
| 8:30 AM to 8:59 AM | 0 (0.0%) | 0 (0.0%) |
| 9:00 AM to 9:59 AM | 2 (1.8%) | 2 (6.2%) |
| 10:00 AM to 10:59 AM | 0 (0.0%) | 2 (6.2%) |
| 11:00 AM to 11:59 AM | 2 (1.8%) | 0 (0.0%) |
| 12:00 PM to 3:59 PM | 32 (29.6%) | 5 (15.6%) |
| 4:00 PM to 11:59 PM | 2 (1.8%) | 0 (0.0%) |
| Total | 108 (100.0%) | 32 (100.0%) |
Housing Occupancy in Braden
Occupancy by Ownership in Braden
Of the total 107 dwellings in Braden, owner-occupied units account for 91 (85.1%), while renter-occupied units make up 16 (14.9%).
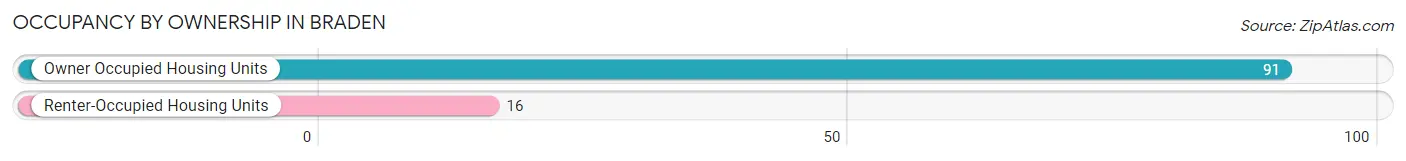
| Occupancy | # Housing Units | % Housing Units |
| Owner Occupied Housing Units | 91 | 85.1% |
| Renter-Occupied Housing Units | 16 | 14.9% |
| Total Occupied Housing Units | 107 | 100.0% |
Occupancy by Household Size in Braden
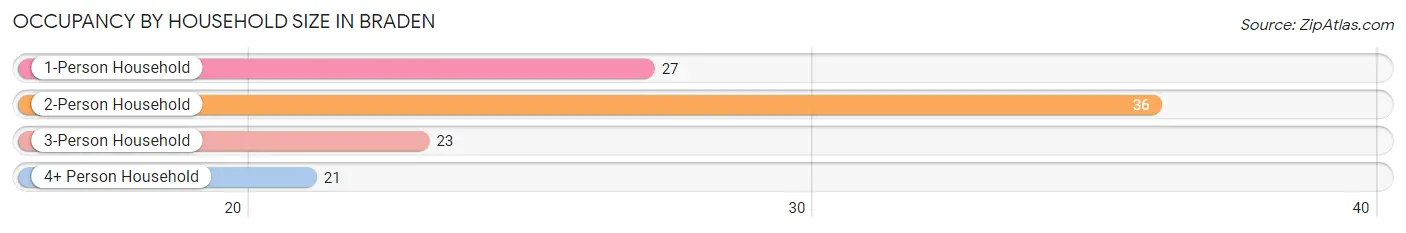
| Household Size | # Housing Units | % Housing Units |
| 1-Person Household | 27 | 25.2% |
| 2-Person Household | 36 | 33.6% |
| 3-Person Household | 23 | 21.5% |
| 4+ Person Household | 21 | 19.6% |
| Total Housing Units | 107 | 100.0% |
Occupancy by Ownership by Household Size in Braden
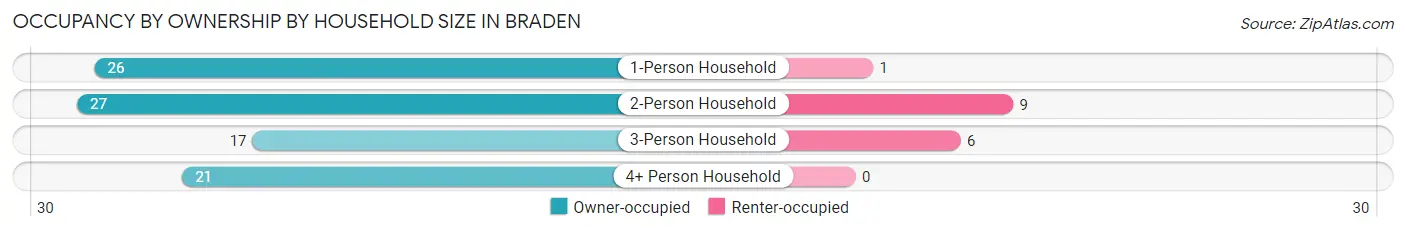
| Household Size | Owner-occupied | Renter-occupied |
| 1-Person Household | 26 (96.3%) | 1 (3.7%) |
| 2-Person Household | 27 (75.0%) | 9 (25.0%) |
| 3-Person Household | 17 (73.9%) | 6 (26.1%) |
| 4+ Person Household | 21 (100.0%) | 0 (0.0%) |
| Total Housing Units | 91 (85.1%) | 16 (14.9%) |
Occupancy by Educational Attainment in Braden
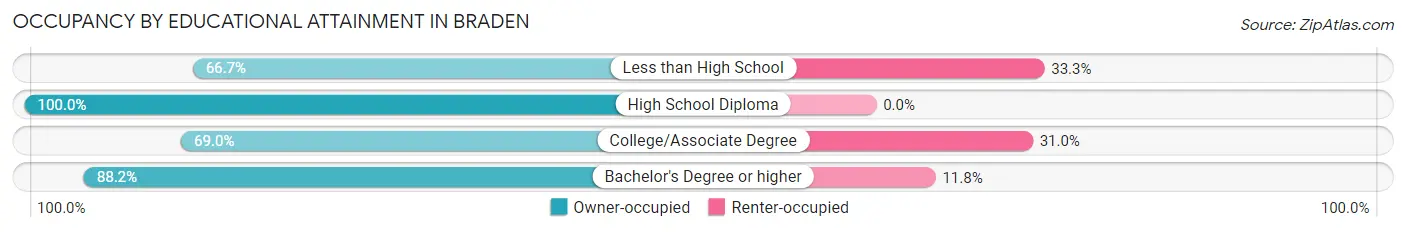
| Household Size | Owner-occupied | Renter-occupied |
| Less than High School | 10 (66.7%) | 5 (33.3%) |
| High School Diploma | 46 (100.0%) | 0 (0.0%) |
| College/Associate Degree | 20 (69.0%) | 9 (31.0%) |
| Bachelor's Degree or higher | 15 (88.2%) | 2 (11.8%) |
Occupancy by Age of Householder in Braden
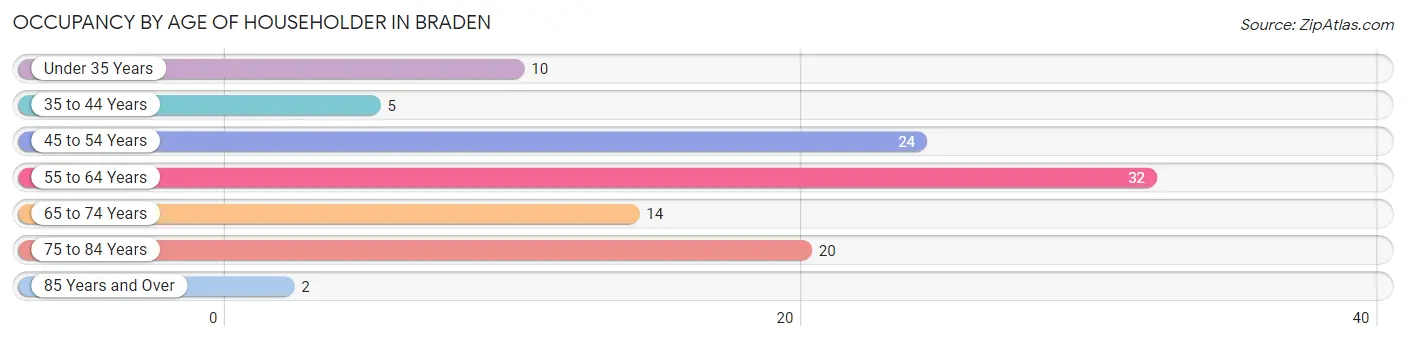
| Age Bracket | # Households | % Households |
| Under 35 Years | 10 | 9.3% |
| 35 to 44 Years | 5 | 4.7% |
| 45 to 54 Years | 24 | 22.4% |
| 55 to 64 Years | 32 | 29.9% |
| 65 to 74 Years | 14 | 13.1% |
| 75 to 84 Years | 20 | 18.7% |
| 85 Years and Over | 2 | 1.9% |
| Total | 107 | 100.0% |
Housing Finances in Braden
Median Income by Occupancy in Braden
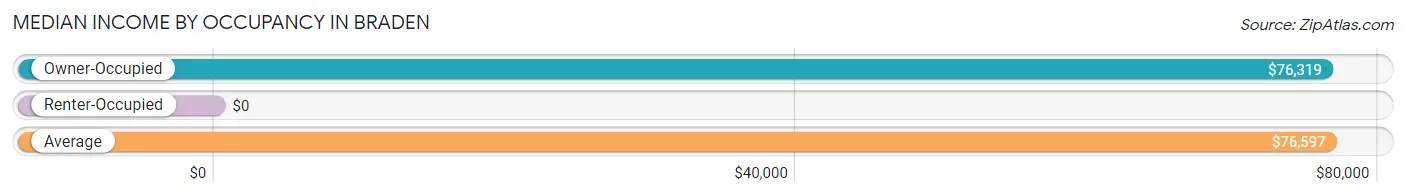
| Occupancy Type | # Households | Median Income |
| Owner-Occupied | 91 (85.1%) | $76,319 |
| Renter-Occupied | 16 (14.9%) | $0 |
| Average | 107 (100.0%) | $76,597 |
Occupancy by Householder Income Bracket in Braden
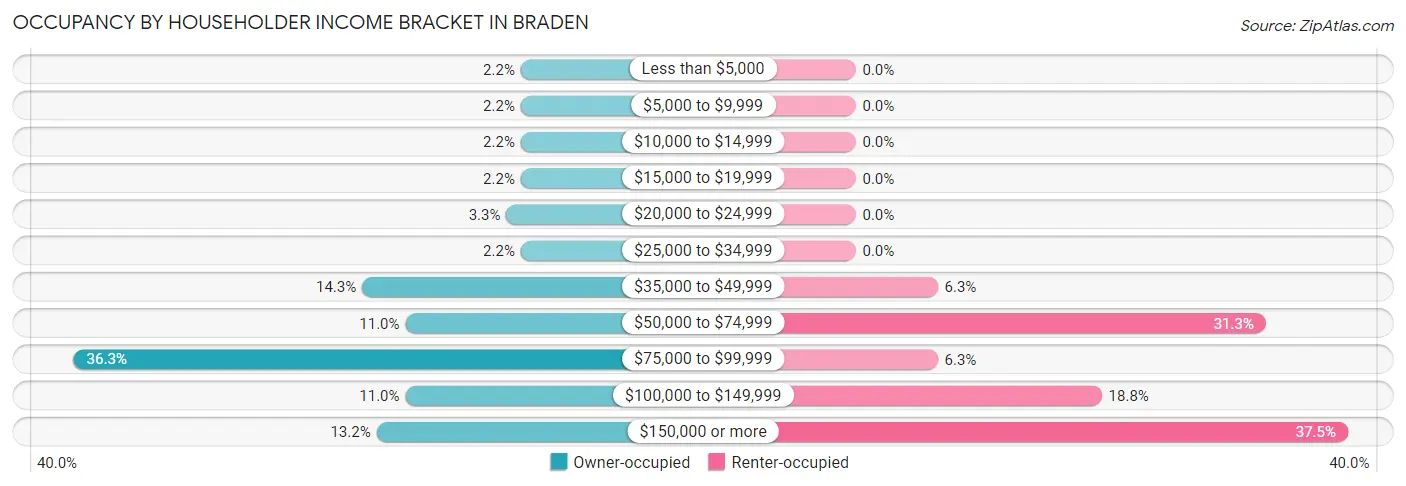
| Income Bracket | Owner-occupied | Renter-occupied |
| Less than $5,000 | 2 (2.2%) | 0 (0.0%) |
| $5,000 to $9,999 | 2 (2.2%) | 0 (0.0%) |
| $10,000 to $14,999 | 2 (2.2%) | 0 (0.0%) |
| $15,000 to $19,999 | 2 (2.2%) | 0 (0.0%) |
| $20,000 to $24,999 | 3 (3.3%) | 0 (0.0%) |
| $25,000 to $34,999 | 2 (2.2%) | 0 (0.0%) |
| $35,000 to $49,999 | 13 (14.3%) | 1 (6.2%) |
| $50,000 to $74,999 | 10 (11.0%) | 5 (31.2%) |
| $75,000 to $99,999 | 33 (36.3%) | 1 (6.2%) |
| $100,000 to $149,999 | 10 (11.0%) | 3 (18.8%) |
| $150,000 or more | 12 (13.2%) | 6 (37.5%) |
| Total | 91 (100.0%) | 16 (100.0%) |
Monthly Housing Cost Tiers in Braden
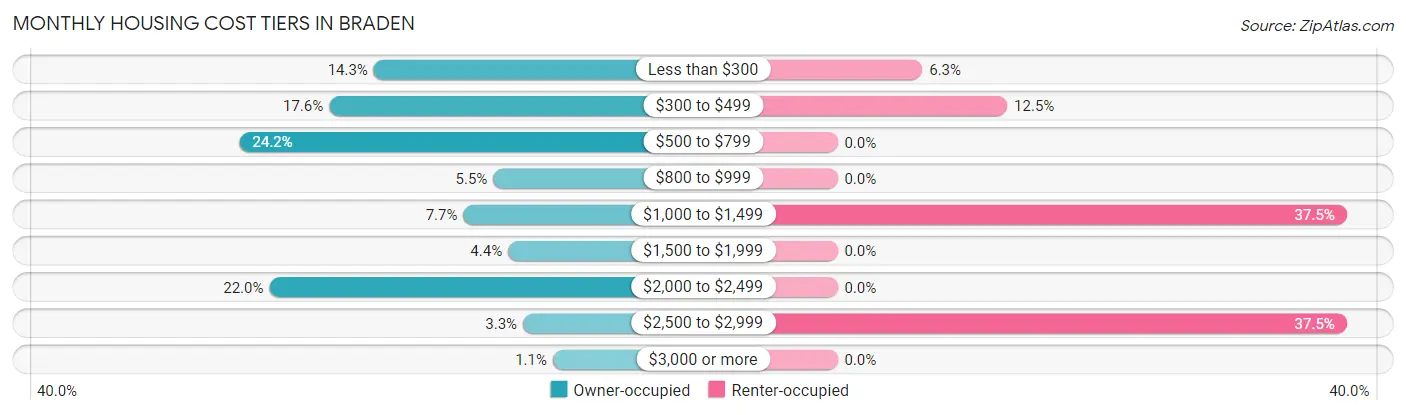
| Monthly Cost | Owner-occupied | Renter-occupied |
| Less than $300 | 13 (14.3%) | 1 (6.2%) |
| $300 to $499 | 16 (17.6%) | 2 (12.5%) |
| $500 to $799 | 22 (24.2%) | 0 (0.0%) |
| $800 to $999 | 5 (5.5%) | 0 (0.0%) |
| $1,000 to $1,499 | 7 (7.7%) | 6 (37.5%) |
| $1,500 to $1,999 | 4 (4.4%) | 0 (0.0%) |
| $2,000 to $2,499 | 20 (22.0%) | 0 (0.0%) |
| $2,500 to $2,999 | 3 (3.3%) | 6 (37.5%) |
| $3,000 or more | 1 (1.1%) | 0 (0.0%) |
| Total | 91 (100.0%) | 16 (100.0%) |
Physical Housing Characteristics in Braden
Housing Structures in Braden
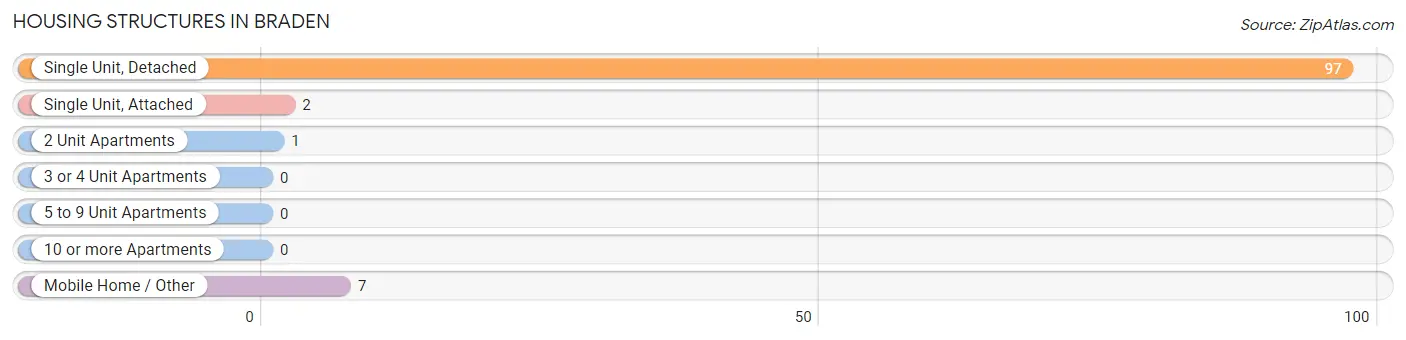
| Structure Type | # Housing Units | % Housing Units |
| Single Unit, Detached | 97 | 90.6% |
| Single Unit, Attached | 2 | 1.9% |
| 2 Unit Apartments | 1 | 0.9% |
| 3 or 4 Unit Apartments | 0 | 0.0% |
| 5 to 9 Unit Apartments | 0 | 0.0% |
| 10 or more Apartments | 0 | 0.0% |
| Mobile Home / Other | 7 | 6.5% |
| Total | 107 | 100.0% |
Housing Structures by Occupancy in Braden
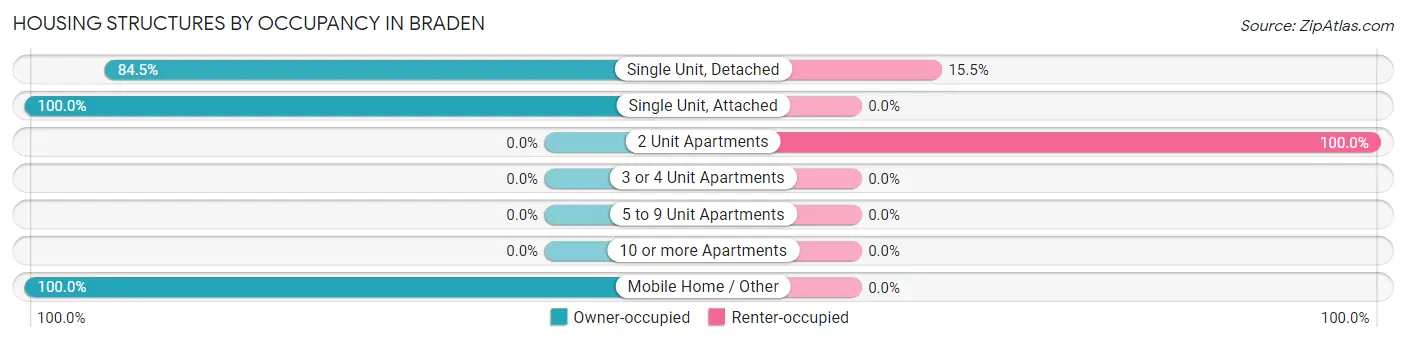
| Structure Type | Owner-occupied | Renter-occupied |
| Single Unit, Detached | 82 (84.5%) | 15 (15.5%) |
| Single Unit, Attached | 2 (100.0%) | 0 (0.0%) |
| 2 Unit Apartments | 0 (0.0%) | 1 (100.0%) |
| 3 or 4 Unit Apartments | 0 (0.0%) | 0 (0.0%) |
| 5 to 9 Unit Apartments | 0 (0.0%) | 0 (0.0%) |
| 10 or more Apartments | 0 (0.0%) | 0 (0.0%) |
| Mobile Home / Other | 7 (100.0%) | 0 (0.0%) |
| Total | 91 (85.1%) | 16 (14.9%) |
Housing Structures by Number of Rooms in Braden
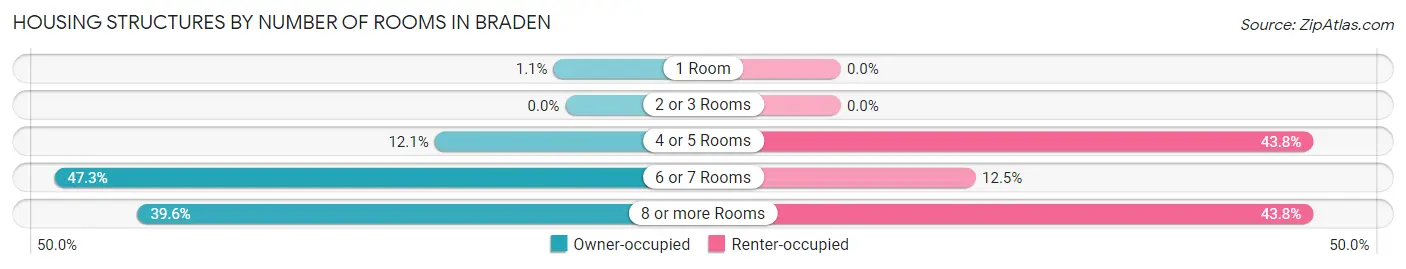
| Number of Rooms | Owner-occupied | Renter-occupied |
| 1 Room | 1 (1.1%) | 0 (0.0%) |
| 2 or 3 Rooms | 0 (0.0%) | 0 (0.0%) |
| 4 or 5 Rooms | 11 (12.1%) | 7 (43.8%) |
| 6 or 7 Rooms | 43 (47.2%) | 2 (12.5%) |
| 8 or more Rooms | 36 (39.6%) | 7 (43.8%) |
| Total | 91 (100.0%) | 16 (100.0%) |
Housing Structure by Heating Type in Braden
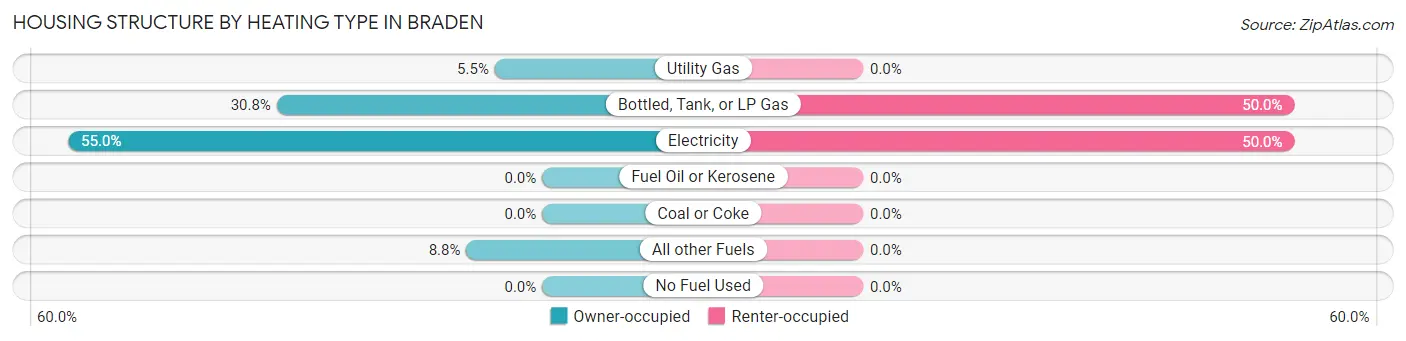
| Heating Type | Owner-occupied | Renter-occupied |
| Utility Gas | 5 (5.5%) | 0 (0.0%) |
| Bottled, Tank, or LP Gas | 28 (30.8%) | 8 (50.0%) |
| Electricity | 50 (54.9%) | 8 (50.0%) |
| Fuel Oil or Kerosene | 0 (0.0%) | 0 (0.0%) |
| Coal or Coke | 0 (0.0%) | 0 (0.0%) |
| All other Fuels | 8 (8.8%) | 0 (0.0%) |
| No Fuel Used | 0 (0.0%) | 0 (0.0%) |
| Total | 91 (100.0%) | 16 (100.0%) |
Household Vehicle Usage in Braden
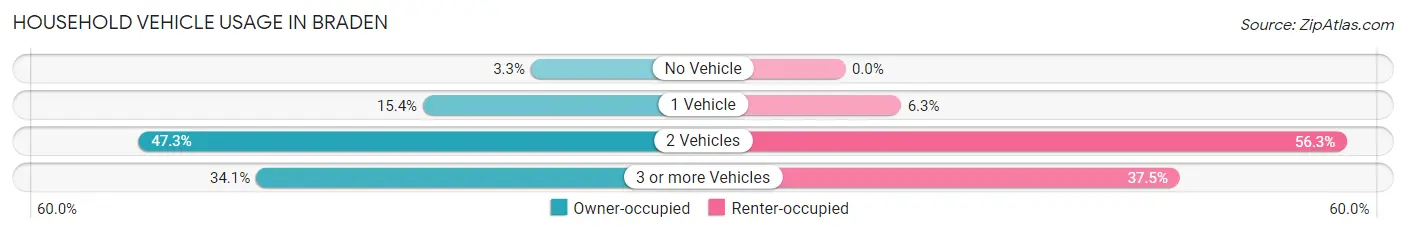
| Vehicles per Household | Owner-occupied | Renter-occupied |
| No Vehicle | 3 (3.3%) | 0 (0.0%) |
| 1 Vehicle | 14 (15.4%) | 1 (6.2%) |
| 2 Vehicles | 43 (47.2%) | 9 (56.2%) |
| 3 or more Vehicles | 31 (34.1%) | 6 (37.5%) |
| Total | 91 (100.0%) | 16 (100.0%) |
Real Estate & Mortgages in Braden
Real Estate and Mortgage Overview in Braden
| Characteristic | Without Mortgage | With Mortgage |
| Housing Units | 44 | 47 |
| Median Property Value | $187,500 | $258,300 |
| Median Household Income | $76,250 | $8 |
| Monthly Housing Costs | $414 | $1 |
| Real Estate Taxes | $714 | $3 |
Property Value by Mortgage Status in Braden
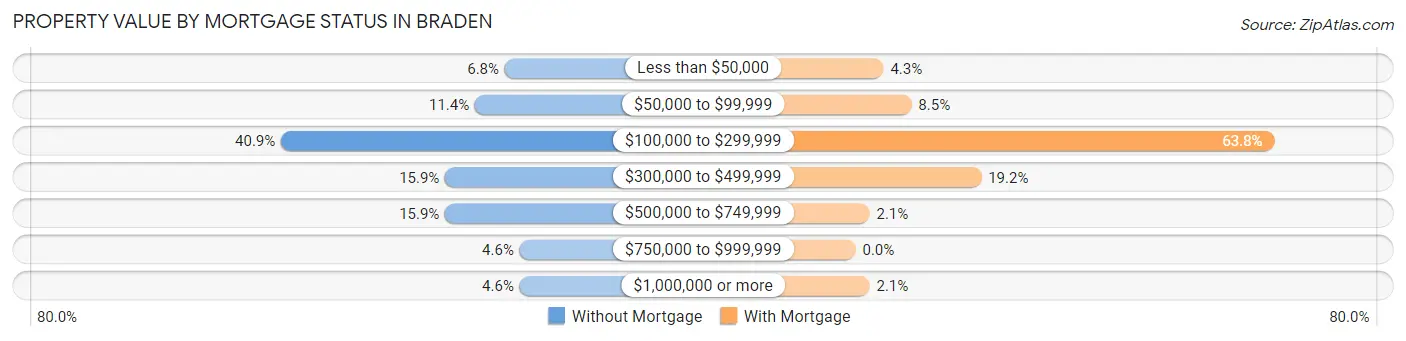
| Property Value | Without Mortgage | With Mortgage |
| Less than $50,000 | 3 (6.8%) | 2 (4.3%) |
| $50,000 to $99,999 | 5 (11.4%) | 4 (8.5%) |
| $100,000 to $299,999 | 18 (40.9%) | 30 (63.8%) |
| $300,000 to $499,999 | 7 (15.9%) | 9 (19.2%) |
| $500,000 to $749,999 | 7 (15.9%) | 1 (2.1%) |
| $750,000 to $999,999 | 2 (4.5%) | 0 (0.0%) |
| $1,000,000 or more | 2 (4.5%) | 1 (2.1%) |
| Total | 44 (100.0%) | 47 (100.0%) |
Household Income by Mortgage Status in Braden
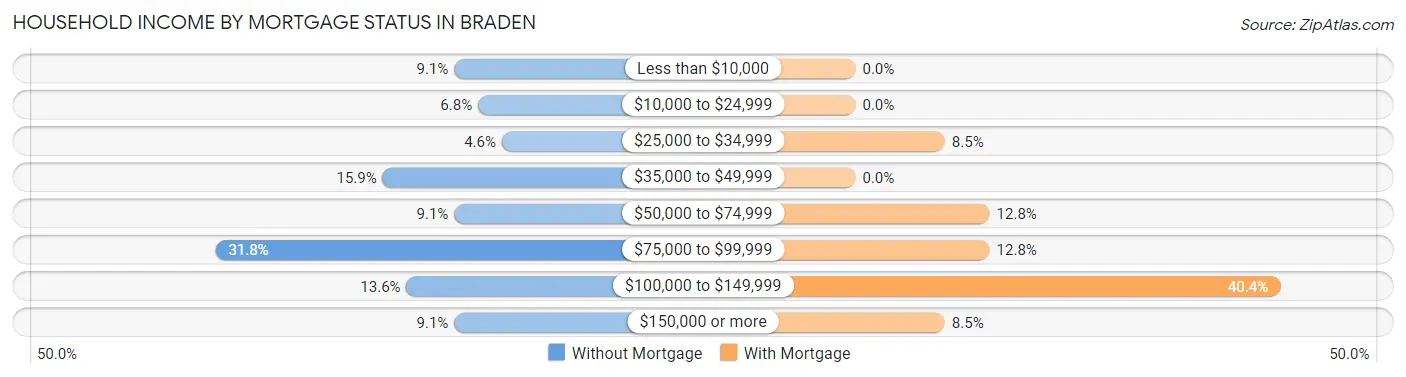
| Household Income | Without Mortgage | With Mortgage |
| Less than $10,000 | 4 (9.1%) | 0 (0.0%) |
| $10,000 to $24,999 | 3 (6.8%) | 0 (0.0%) |
| $25,000 to $34,999 | 2 (4.5%) | 4 (8.5%) |
| $35,000 to $49,999 | 7 (15.9%) | 0 (0.0%) |
| $50,000 to $74,999 | 4 (9.1%) | 6 (12.8%) |
| $75,000 to $99,999 | 14 (31.8%) | 6 (12.8%) |
| $100,000 to $149,999 | 6 (13.6%) | 19 (40.4%) |
| $150,000 or more | 4 (9.1%) | 4 (8.5%) |
| Total | 44 (100.0%) | 47 (100.0%) |
Property Value to Household Income Ratio in Braden
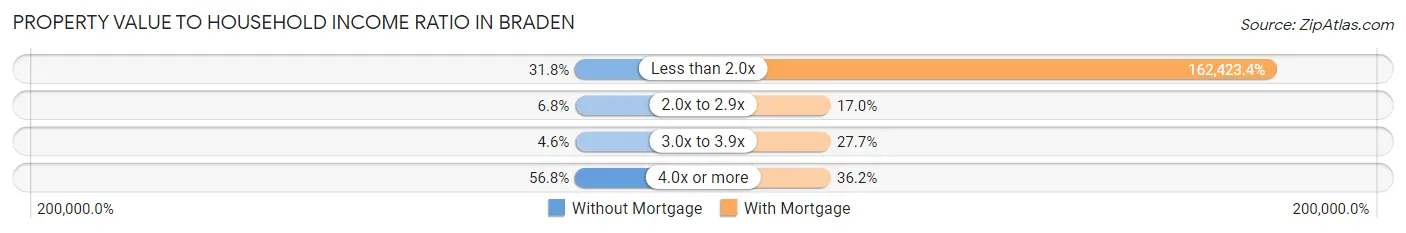
| Value-to-Income Ratio | Without Mortgage | With Mortgage |
| Less than 2.0x | 14 (31.8%) | 76,339 (162,423.4%) |
| 2.0x to 2.9x | 3 (6.8%) | 8 (17.0%) |
| 3.0x to 3.9x | 2 (4.5%) | 13 (27.7%) |
| 4.0x or more | 25 (56.8%) | 17 (36.2%) |
| Total | 44 (100.0%) | 47 (100.0%) |
Real Estate Taxes by Mortgage Status in Braden
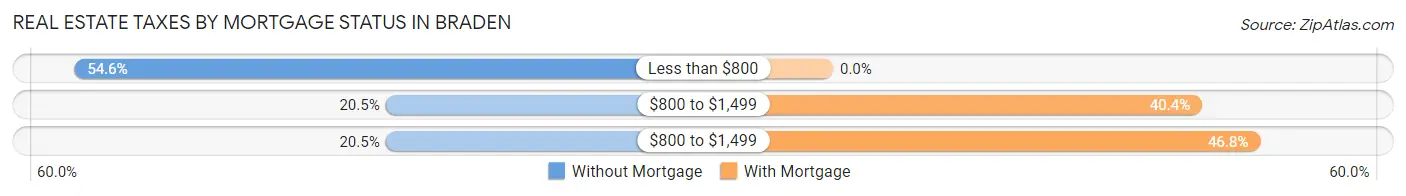
| Property Taxes | Without Mortgage | With Mortgage |
| Less than $800 | 24 (54.5%) | 0 (0.0%) |
| $800 to $1,499 | 9 (20.4%) | 19 (40.4%) |
| $800 to $1,499 | 9 (20.4%) | 22 (46.8%) |
| Total | 44 (100.0%) | 47 (100.0%) |
Health & Disability in Braden
Health Insurance Coverage by Age in Braden
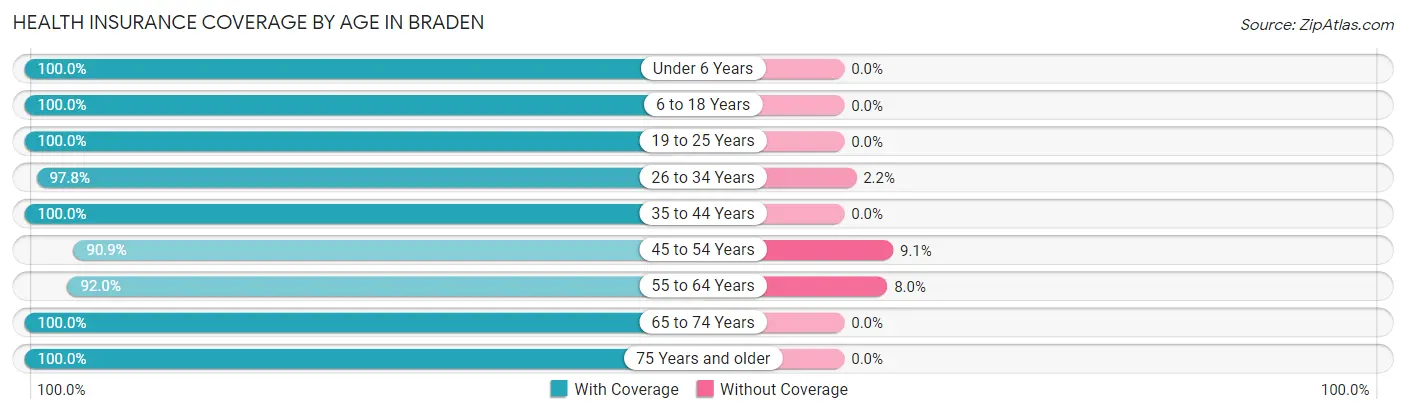
| Age Bracket | With Coverage | Without Coverage |
| Under 6 Years | 7 (100.0%) | 0 (0.0%) |
| 6 to 18 Years | 20 (100.0%) | 0 (0.0%) |
| 19 to 25 Years | 34 (100.0%) | 0 (0.0%) |
| 26 to 34 Years | 44 (97.8%) | 1 (2.2%) |
| 35 to 44 Years | 12 (100.0%) | 0 (0.0%) |
| 45 to 54 Years | 70 (90.9%) | 7 (9.1%) |
| 55 to 64 Years | 46 (92.0%) | 4 (8.0%) |
| 65 to 74 Years | 22 (100.0%) | 0 (0.0%) |
| 75 Years and older | 26 (100.0%) | 0 (0.0%) |
| Total | 281 (95.9%) | 12 (4.1%) |
Health Insurance Coverage by Citizenship Status in Braden
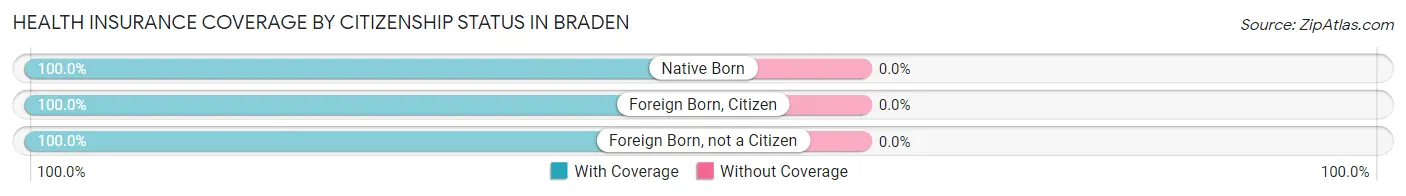
| Citizenship Status | With Coverage | Without Coverage |
| Native Born | 7 (100.0%) | 0 (0.0%) |
| Foreign Born, Citizen | 20 (100.0%) | 0 (0.0%) |
| Foreign Born, not a Citizen | 34 (100.0%) | 0 (0.0%) |
Health Insurance Coverage by Household Income in Braden
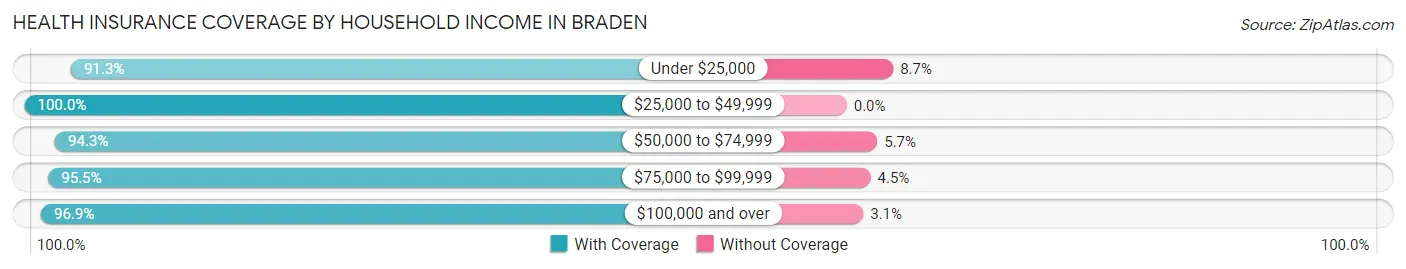
| Household Income | With Coverage | Without Coverage |
| Under $25,000 | 21 (91.3%) | 2 (8.7%) |
| $25,000 to $49,999 | 26 (100.0%) | 0 (0.0%) |
| $50,000 to $74,999 | 33 (94.3%) | 2 (5.7%) |
| $75,000 to $99,999 | 107 (95.5%) | 5 (4.5%) |
| $100,000 and over | 94 (96.9%) | 3 (3.1%) |
Public vs Private Health Insurance Coverage by Age in Braden
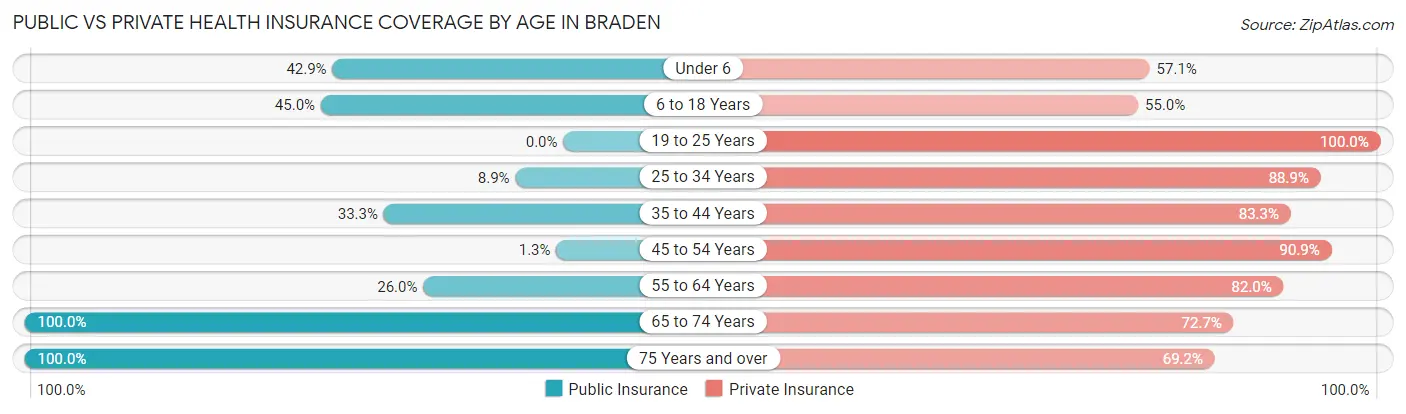
| Age Bracket | Public Insurance | Private Insurance |
| Under 6 | 3 (42.9%) | 4 (57.1%) |
| 6 to 18 Years | 9 (45.0%) | 11 (55.0%) |
| 19 to 25 Years | 0 (0.0%) | 34 (100.0%) |
| 25 to 34 Years | 4 (8.9%) | 40 (88.9%) |
| 35 to 44 Years | 4 (33.3%) | 10 (83.3%) |
| 45 to 54 Years | 1 (1.3%) | 70 (90.9%) |
| 55 to 64 Years | 13 (26.0%) | 41 (82.0%) |
| 65 to 74 Years | 22 (100.0%) | 16 (72.7%) |
| 75 Years and over | 26 (100.0%) | 18 (69.2%) |
| Total | 82 (28.0%) | 244 (83.3%) |
Disability Status by Sex by Age in Braden
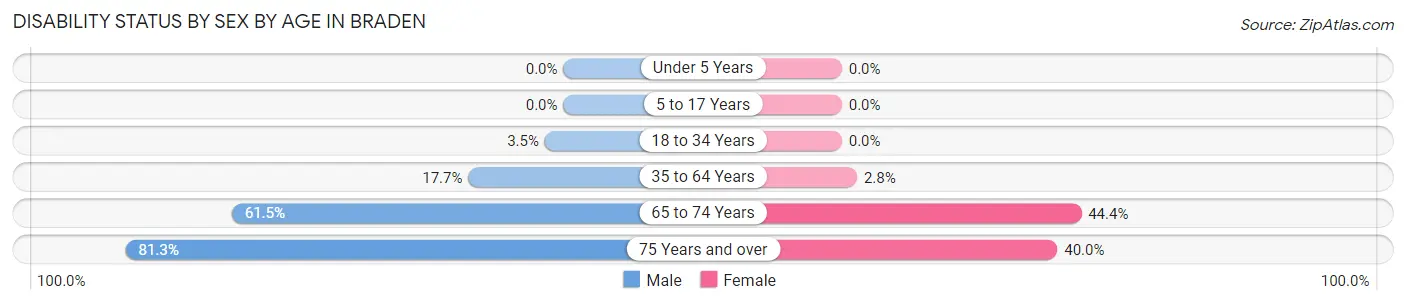
| Age Bracket | Male | Female |
| Under 5 Years | 0 (0.0%) | 0 (0.0%) |
| 5 to 17 Years | 0 (0.0%) | 0 (0.0%) |
| 18 to 34 Years | 2 (3.5%) | 0 (0.0%) |
| 35 to 64 Years | 12 (17.6%) | 2 (2.8%) |
| 65 to 74 Years | 8 (61.5%) | 4 (44.4%) |
| 75 Years and over | 13 (81.2%) | 4 (40.0%) |
Disability Class by Sex by Age in Braden
Disability Class: Hearing Difficulty
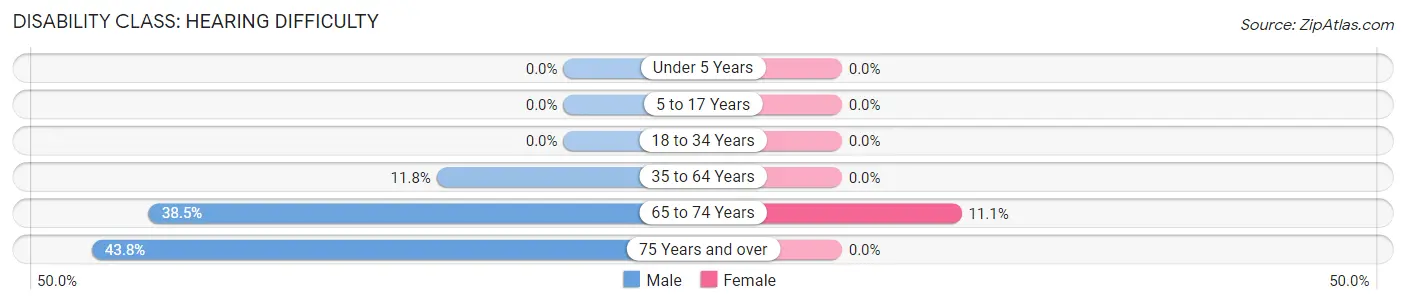
| Age Bracket | Male | Female |
| Under 5 Years | 0 (0.0%) | 0 (0.0%) |
| 5 to 17 Years | 0 (0.0%) | 0 (0.0%) |
| 18 to 34 Years | 0 (0.0%) | 0 (0.0%) |
| 35 to 64 Years | 8 (11.8%) | 0 (0.0%) |
| 65 to 74 Years | 5 (38.5%) | 1 (11.1%) |
| 75 Years and over | 7 (43.8%) | 0 (0.0%) |
Disability Class: Vision Difficulty
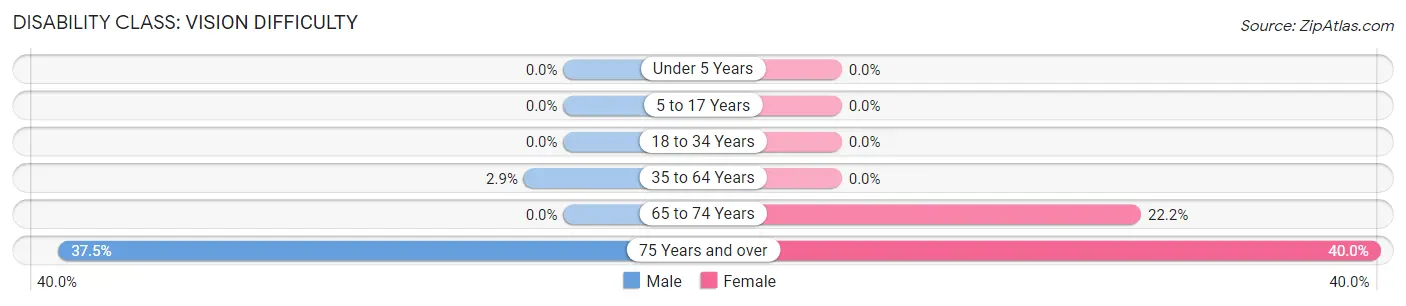
| Age Bracket | Male | Female |
| Under 5 Years | 0 (0.0%) | 0 (0.0%) |
| 5 to 17 Years | 0 (0.0%) | 0 (0.0%) |
| 18 to 34 Years | 0 (0.0%) | 0 (0.0%) |
| 35 to 64 Years | 2 (2.9%) | 0 (0.0%) |
| 65 to 74 Years | 0 (0.0%) | 2 (22.2%) |
| 75 Years and over | 6 (37.5%) | 4 (40.0%) |
Disability Class: Cognitive Difficulty
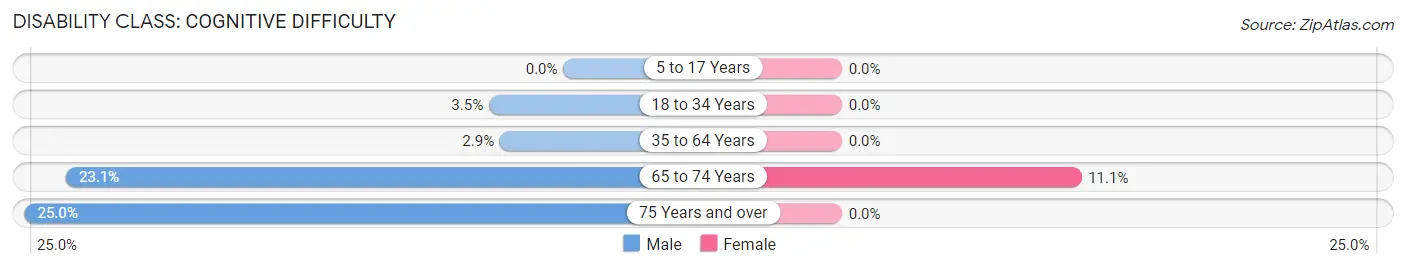
| Age Bracket | Male | Female |
| 5 to 17 Years | 0 (0.0%) | 0 (0.0%) |
| 18 to 34 Years | 2 (3.5%) | 0 (0.0%) |
| 35 to 64 Years | 2 (2.9%) | 0 (0.0%) |
| 65 to 74 Years | 3 (23.1%) | 1 (11.1%) |
| 75 Years and over | 4 (25.0%) | 0 (0.0%) |
Disability Class: Ambulatory Difficulty
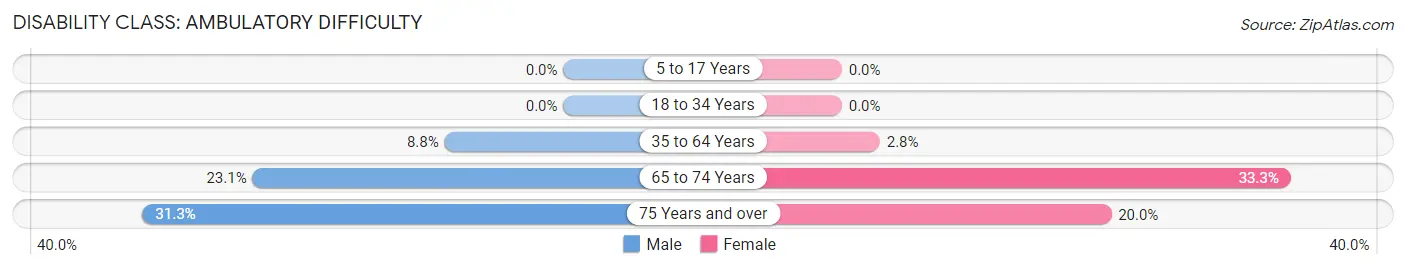
| Age Bracket | Male | Female |
| 5 to 17 Years | 0 (0.0%) | 0 (0.0%) |
| 18 to 34 Years | 0 (0.0%) | 0 (0.0%) |
| 35 to 64 Years | 6 (8.8%) | 2 (2.8%) |
| 65 to 74 Years | 3 (23.1%) | 3 (33.3%) |
| 75 Years and over | 5 (31.2%) | 2 (20.0%) |
Disability Class: Self-Care Difficulty
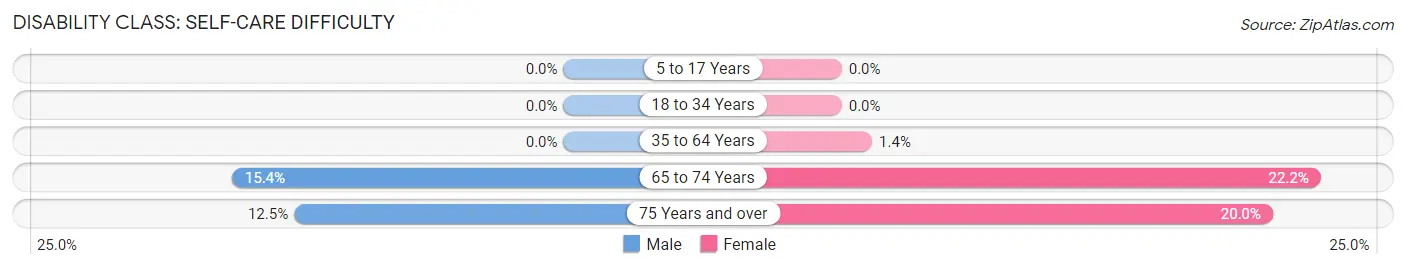
| Age Bracket | Male | Female |
| 5 to 17 Years | 0 (0.0%) | 0 (0.0%) |
| 18 to 34 Years | 0 (0.0%) | 0 (0.0%) |
| 35 to 64 Years | 0 (0.0%) | 1 (1.4%) |
| 65 to 74 Years | 2 (15.4%) | 2 (22.2%) |
| 75 Years and over | 2 (12.5%) | 2 (20.0%) |
Technology Access in Braden
Computing Device Access in Braden
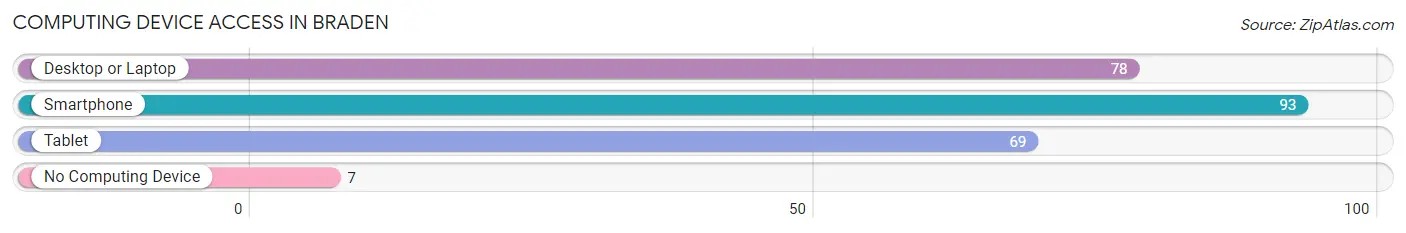
| Device Type | # Households | % Households |
| Desktop or Laptop | 78 | 72.9% |
| Smartphone | 93 | 86.9% |
| Tablet | 69 | 64.5% |
| No Computing Device | 7 | 6.5% |
| Total | 107 | 100.0% |
Internet Access in Braden
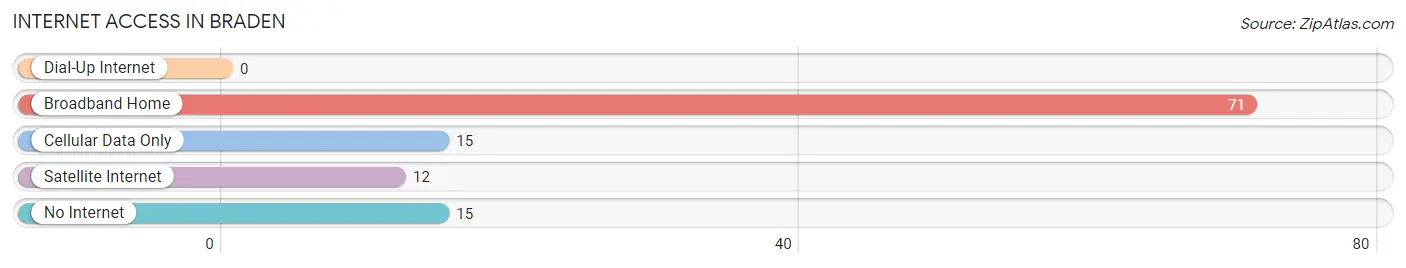
| Internet Type | # Households | % Households |
| Dial-Up Internet | 0 | 0.0% |
| Broadband Home | 71 | 66.4% |
| Cellular Data Only | 15 | 14.0% |
| Satellite Internet | 12 | 11.2% |
| No Internet | 15 | 14.0% |
| Total | 107 | 100.0% |
Braden Summary
Braden, Tennessee is a small town located in the northwest corner of the state, in the foothills of the Appalachian Mountains. It is situated in the county of Hardin, and is part of the Jackson metropolitan area. The town has a population of just over 1,000 people, and is known for its rural charm and friendly atmosphere.
History
Braden was founded in 1820 by a group of settlers from North Carolina. The town was named after the nearby Braden Creek, which was named after a local family. The town was originally a farming community, and the main crops were cotton and tobacco. In the late 19th century, the town began to grow as a result of the railroad, which connected it to the larger cities of Jackson and Memphis.
In the early 20th century, the town experienced a period of growth and prosperity. The population increased, and new businesses were established. The town also became a popular tourist destination, as it was located near several popular attractions, such as the Great Smoky Mountains National Park.
Geography
Braden is located in the northwest corner of Tennessee, in the foothills of the Appalachian Mountains. The town is situated in Hardin County, and is part of the Jackson metropolitan area. The town is located at an elevation of 890 feet above sea level.
The town is surrounded by rolling hills and forests, and is located near several popular attractions, such as the Great Smoky Mountains National Park. The town is also located near several rivers, including the Tennessee River, the Obion River, and the Hatchie River.
Economy
The economy of Braden is largely based on agriculture and tourism. The town is home to several farms, which produce a variety of crops, including cotton, tobacco, corn, and soybeans. The town is also home to several tourist attractions, such as the Great Smoky Mountains National Park, which attracts thousands of visitors each year.
In addition to agriculture and tourism, the town is also home to several small businesses, including restaurants, shops, and other services. The town is also home to several manufacturing companies, which produce a variety of products, including furniture, clothing, and electronics.
Demographics
As of the 2010 census, the population of Braden was 1,072. The racial makeup of the town was 95.3% White, 1.2% African American, 0.3% Native American, 0.2% Asian, 0.1% Pacific Islander, and 2.9% from other races. The median household income was $31,250, and the median family income was $37,500.
The town is home to several churches, including the First Baptist Church, the Church of Christ, and the Church of God. The town is also home to several schools, including the Braden Elementary School, the Braden Middle School, and the Braden High School.
Conclusion
Braden, Tennessee is a small town located in the northwest corner of the state, in the foothills of the Appalachian Mountains. The town has a population of just over 1,000 people, and is known for its rural charm and friendly atmosphere. The town is largely based on agriculture and tourism, and is home to several farms, tourist attractions, and small businesses. The town is also home to several churches and schools. The population of Braden is largely White, with a small percentage of African American, Native American, Asian, and Pacific Islander residents. The median household income is $31,250, and the median family income is $37,500.
Common Questions
What is the Total Population of Braden?
Total Population of Braden is 293.
What is the Total Male Population of Braden?
Total Male Population of Braden is 170.
What is the Total Female Population of Braden?
Total Female Population of Braden is 123.
What is the Ratio of Males per 100 Females in Braden?
There are 138.21 Males per 100 Females in Braden.
What is the Ratio of Females per 100 Males in Braden?
There are 72.35 Females per 100 Males in Braden.
What is the Median Population Age in Braden?
Median Population Age in Braden is 47.9 Years.
What is the Average Family Size in Braden
Average Family Size in Braden is 3.3 People.
What is the Average Household Size in Braden
Average Household Size in Braden is 2.7 People.
What is Per Capita Income in Braden?
Per Capita income in Braden is $44,475.
What is the Median Family Income in Braden?
Median Family Income in Braden is $76,806.
What is the Median Household income in Braden?
Median Household Income in Braden is $76,597.
What is Income or Wage Gap in Braden?
Income or Wage Gap in Braden is 43.9%.
Women in Braden earn 56.1 cents for every dollar earned by a man.
What is Inequality or Gini Index in Braden?
Inequality or Gini Index in Braden is 0.48.
How Large is the Labor Force in Braden?
There are 176 People in the Labor Forcein in Braden.
What is the Percentage of People in the Labor Force in Braden?
63.3% of People are in the Labor Force in Braden.
What is the Unemployment Rate in Braden?
Unemployment Rate in Braden is 5.1%.