Zip Codes with the Highest Percentage of Immigrants from Asia in Crossville, TN
RELATED REPORTS & OPTIONS
Asia
Crossville
Compare Zip Codes
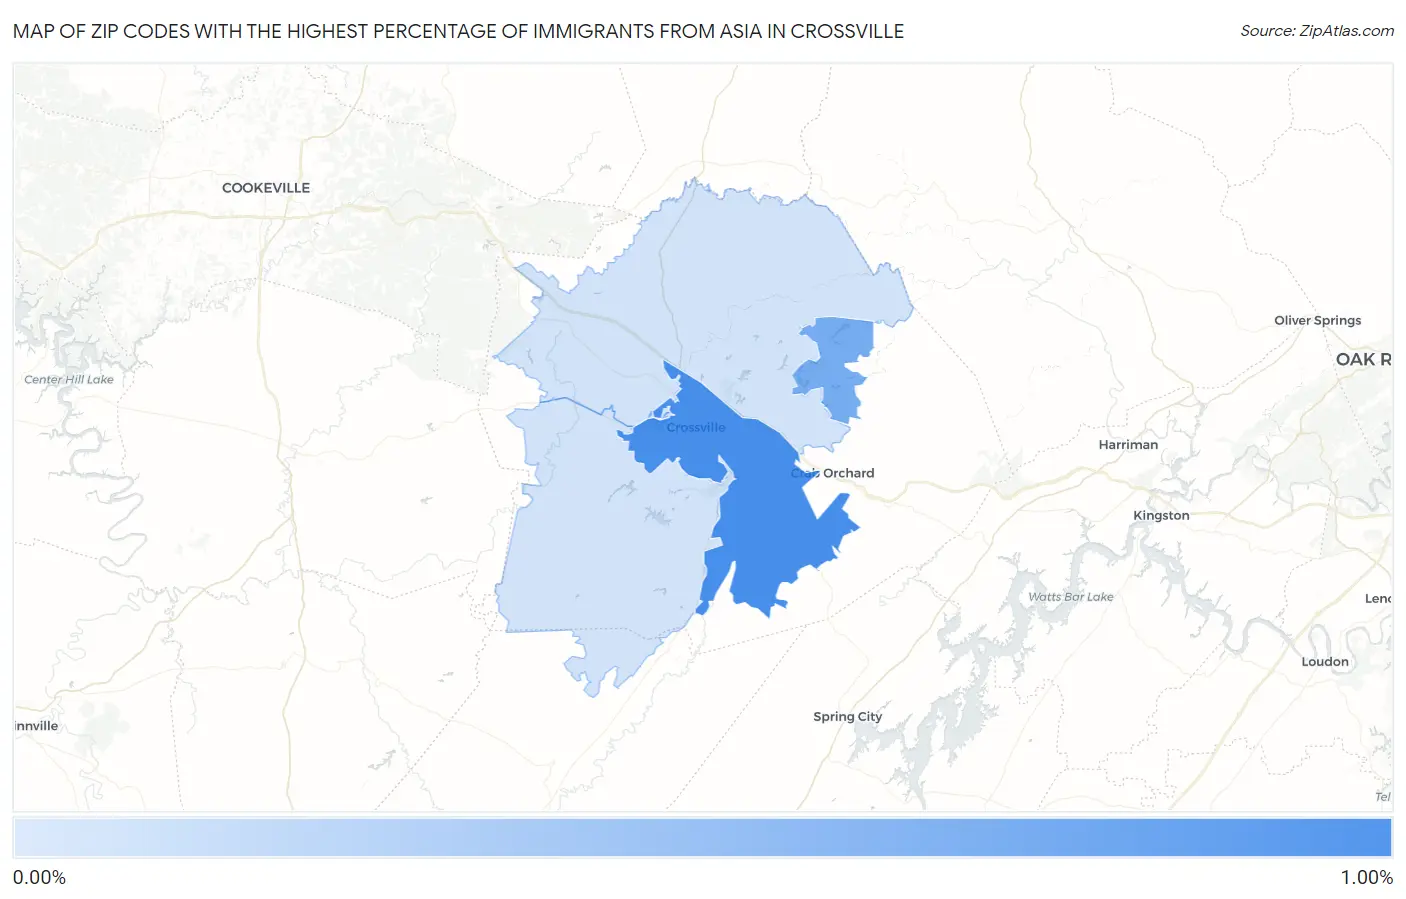
Map of Zip Codes with the Highest Percentage of Immigrants from Asia in Crossville
0.00%
1.00%
Zip Codes with the Highest Percentage of Immigrants from Asia in Crossville, TN
| Zip Code | Asia | vs State | vs National | |
| 1. | 38555 | 0.98% | 1.58%(-0.598)#153 | 4.26%(-3.28)#10,450 |
| 2. | 38558 | 0.68% | 1.58%(-0.902)#196 | 4.26%(-3.58)#12,370 |
| 3. | 38571 | 0.077% | 1.58%(-1.50)#357 | 4.26%(-4.18)#18,654 |
| 4. | 38572 | 0.069% | 1.58%(-1.51)#359 | 4.26%(-4.19)#18,738 |
1
Common Questions
What are the Top 3 Zip Codes with the Highest Percentage of Immigrants from Asia in Crossville, TN?
Top 3 Zip Codes with the Highest Percentage of Immigrants from Asia in Crossville, TN are:
What zip code has the Highest Percentage of Immigrants from Asia in Crossville, TN?
38555 has the Highest Percentage of Immigrants from Asia in Crossville, TN with 0.98%.
What is the Percentage of Immigrants from Asia in Crossville, TN?
Percentage of Immigrants from Asia in Crossville is 0.36%.
What is the Percentage of Immigrants from Asia in Tennessee?
Percentage of Immigrants from Asia in Tennessee is 1.58%.
What is the Percentage of Immigrants from Asia in the United States?
Percentage of Immigrants from Asia in the United States is 4.26%.