Middle Valley, TN
Middle Valley Map
Middle Valley Overview
11,619
TOTAL POPULATION
5,992
MALE POPULATION
5,627
FEMALE POPULATION
106.49
MALES / 100 FEMALES
93.91
FEMALES / 100 MALES
41.0
MEDIAN AGE
3.0
AVG FAMILY SIZE
2.7
AVG HOUSEHOLD SIZE
$44,189
PER CAPITA INCOME
$96,530
AVG FAMILY INCOME
$88,173
AVG HOUSEHOLD INCOME
8.0%
WAGE / INCOME GAP [ % ]
92.0¢/ $1
WAGE / INCOME GAP [ $ ]
0.44
INEQUALITY / GINI INDEX
6,299
LABOR FORCE [ PEOPLE ]
66.9%
PERCENT IN LABOR FORCE
2.9%
UNEMPLOYMENT RATE
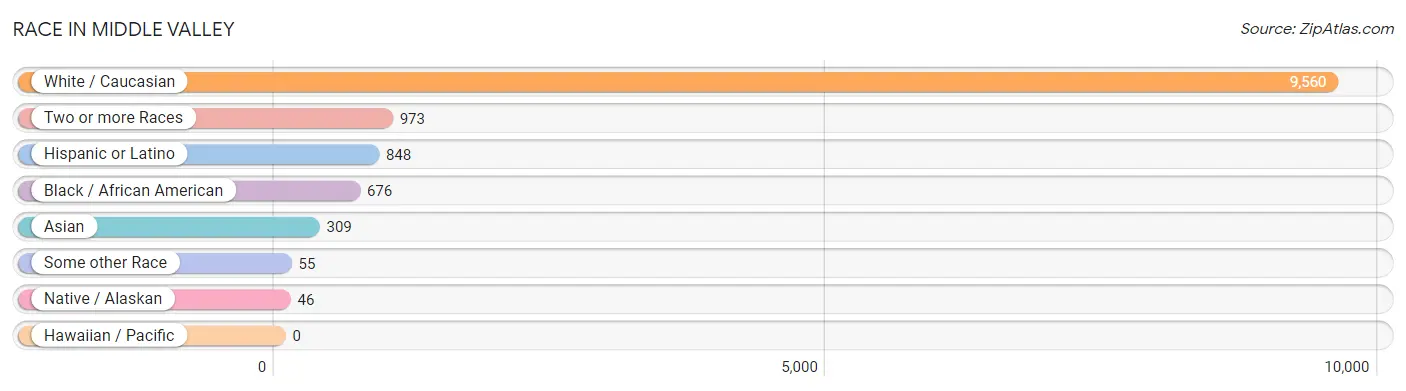
Race in Middle Valley
The most populous races in Middle Valley are White / Caucasian (9,560 | 82.3%), Two or more Races (973 | 8.4%), and Hispanic or Latino (848 | 7.3%).
| Race | # Population | % Population |
| Asian | 309 | 2.7% |
| Black / African American | 676 | 5.8% |
| Hawaiian / Pacific | 0 | 0.0% |
| Hispanic or Latino | 848 | 7.3% |
| Native / Alaskan | 46 | 0.4% |
| White / Caucasian | 9,560 | 82.3% |
| Two or more Races | 973 | 8.4% |
| Some other Race | 55 | 0.5% |
| Total | 11,619 | 100.0% |
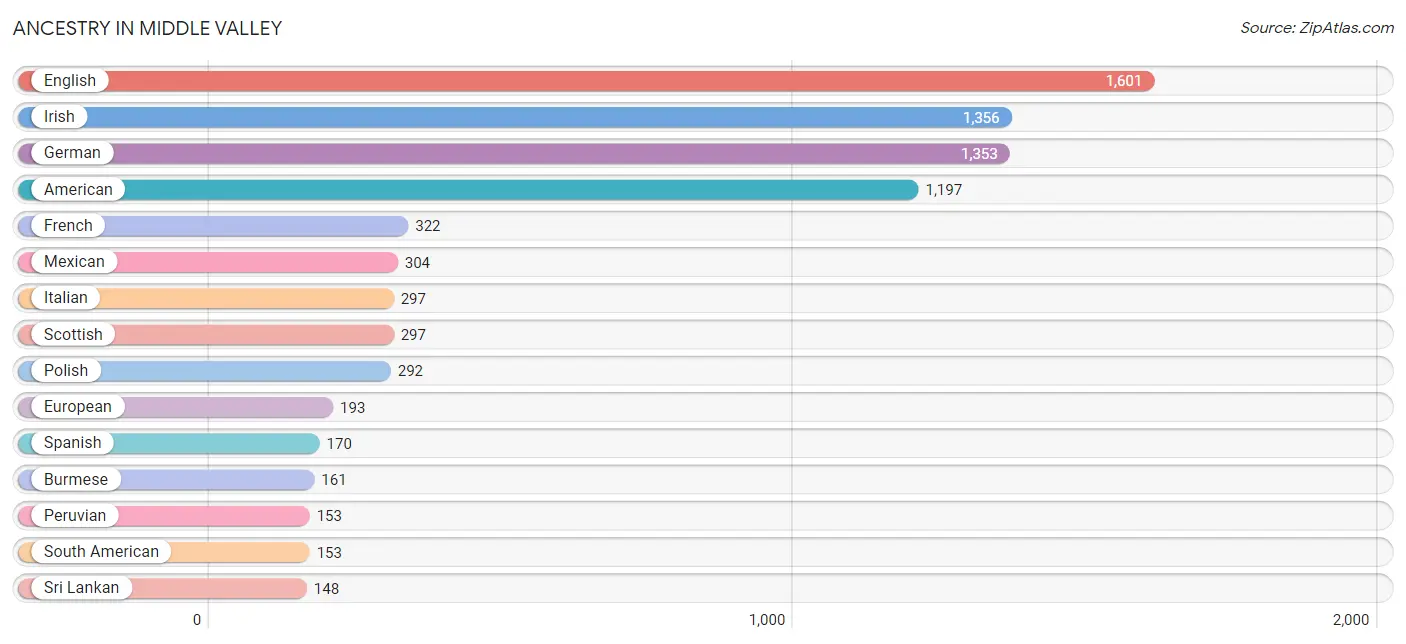
Ancestry in Middle Valley
The most populous ancestries reported in Middle Valley are English (1,601 | 13.8%), Irish (1,356 | 11.7%), German (1,353 | 11.6%), American (1,197 | 10.3%), and French (322 | 2.8%), together accounting for 50.2% of all Middle Valley residents.
| Ancestry | # Population | % Population |
| African | 17 | 0.2% |
| American | 1,197 | 10.3% |
| Arab | 56 | 0.5% |
| Armenian | 13 | 0.1% |
| Austrian | 84 | 0.7% |
| British | 80 | 0.7% |
| Burmese | 161 | 1.4% |
| Cajun | 32 | 0.3% |
| Cherokee | 6 | 0.1% |
| Cuban | 100 | 0.9% |
| Czech | 31 | 0.3% |
| Danish | 9 | 0.1% |
| Dutch | 70 | 0.6% |
| English | 1,601 | 13.8% |
| European | 193 | 1.7% |
| French | 322 | 2.8% |
| French Canadian | 39 | 0.3% |
| German | 1,353 | 11.6% |
| Icelander | 19 | 0.2% |
| Indian (Asian) | 2 | 0.0% |
| Irish | 1,356 | 11.7% |
| Italian | 297 | 2.6% |
| Jamaican | 57 | 0.5% |
| Mexican | 304 | 2.6% |
| Navajo | 16 | 0.1% |
| Norwegian | 51 | 0.4% |
| Peruvian | 153 | 1.3% |
| Polish | 292 | 2.5% |
| Portuguese | 46 | 0.4% |
| Puerto Rican | 27 | 0.2% |
| Scandinavian | 114 | 1.0% |
| Scotch-Irish | 50 | 0.4% |
| Scottish | 297 | 2.6% |
| Serbian | 13 | 0.1% |
| South American | 153 | 1.3% |
| South American Indian | 130 | 1.1% |
| Spaniard | 76 | 0.6% |
| Spanish | 170 | 1.5% |
| Sri Lankan | 148 | 1.3% |
| Subsaharan African | 17 | 0.2% |
| Swedish | 36 | 0.3% |
| Swiss | 21 | 0.2% |
| Welsh | 138 | 1.2% |
| Yugoslavian | 43 | 0.4% | View All 44 Rows |
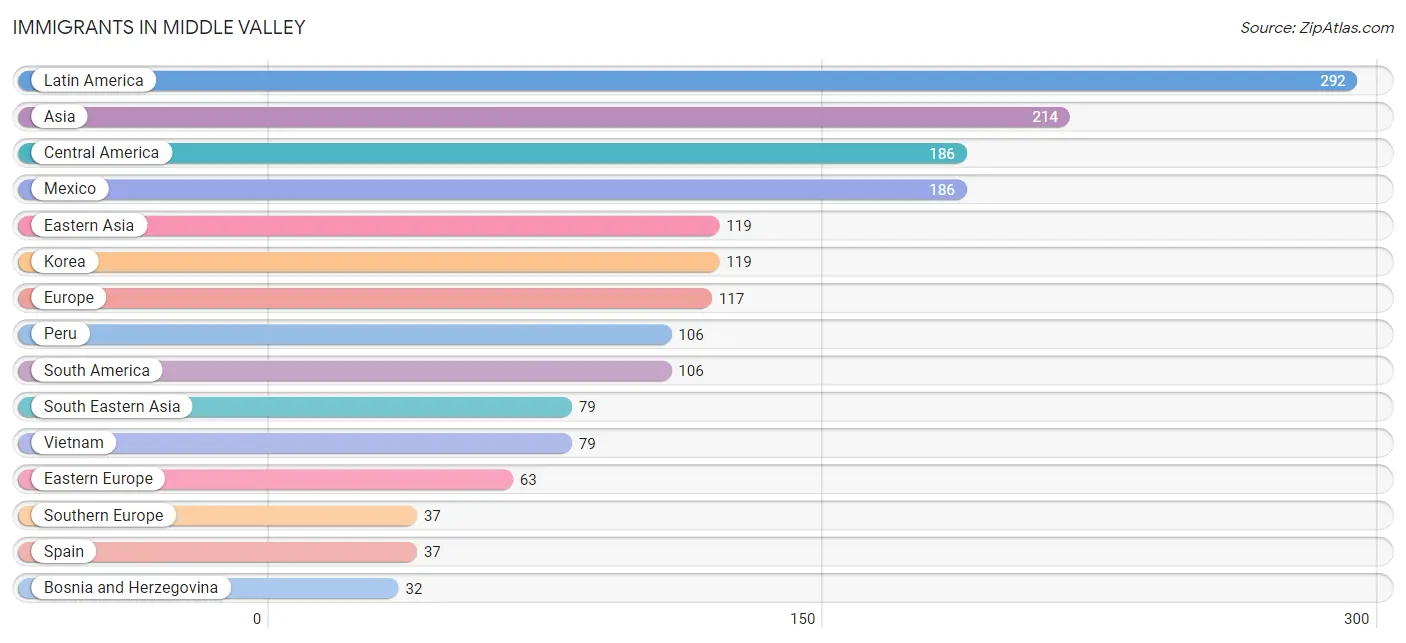
Immigrants in Middle Valley
The most numerous immigrant groups reported in Middle Valley came from Latin America (292 | 2.5%), Asia (214 | 1.8%), Central America (186 | 1.6%), Mexico (186 | 1.6%), and Eastern Asia (119 | 1.0%), together accounting for 8.6% of all Middle Valley residents.
| Immigration Origin | # Population | % Population |
| Asia | 214 | 1.8% |
| Bosnia and Herzegovina | 32 | 0.3% |
| Canada | 19 | 0.2% |
| Central America | 186 | 1.6% |
| Eastern Asia | 119 | 1.0% |
| Eastern Europe | 63 | 0.5% |
| Europe | 117 | 1.0% |
| Germany | 11 | 0.1% |
| Korea | 119 | 1.0% |
| Latin America | 292 | 2.5% |
| Mexico | 186 | 1.6% |
| Northern Europe | 6 | 0.1% |
| Peru | 106 | 0.9% |
| Poland | 31 | 0.3% |
| Saudi Arabia | 16 | 0.1% |
| South America | 106 | 0.9% |
| South Eastern Asia | 79 | 0.7% |
| Southern Europe | 37 | 0.3% |
| Spain | 37 | 0.3% |
| Vietnam | 79 | 0.7% |
| Western Asia | 16 | 0.1% |
| Western Europe | 11 | 0.1% | View All 22 Rows |
Sex and Age in Middle Valley
Sex and Age in Middle Valley
The most populous age groups in Middle Valley are 5 to 9 Years (537 | 9.0%) for men and 50 to 54 Years (572 | 10.2%) for women.
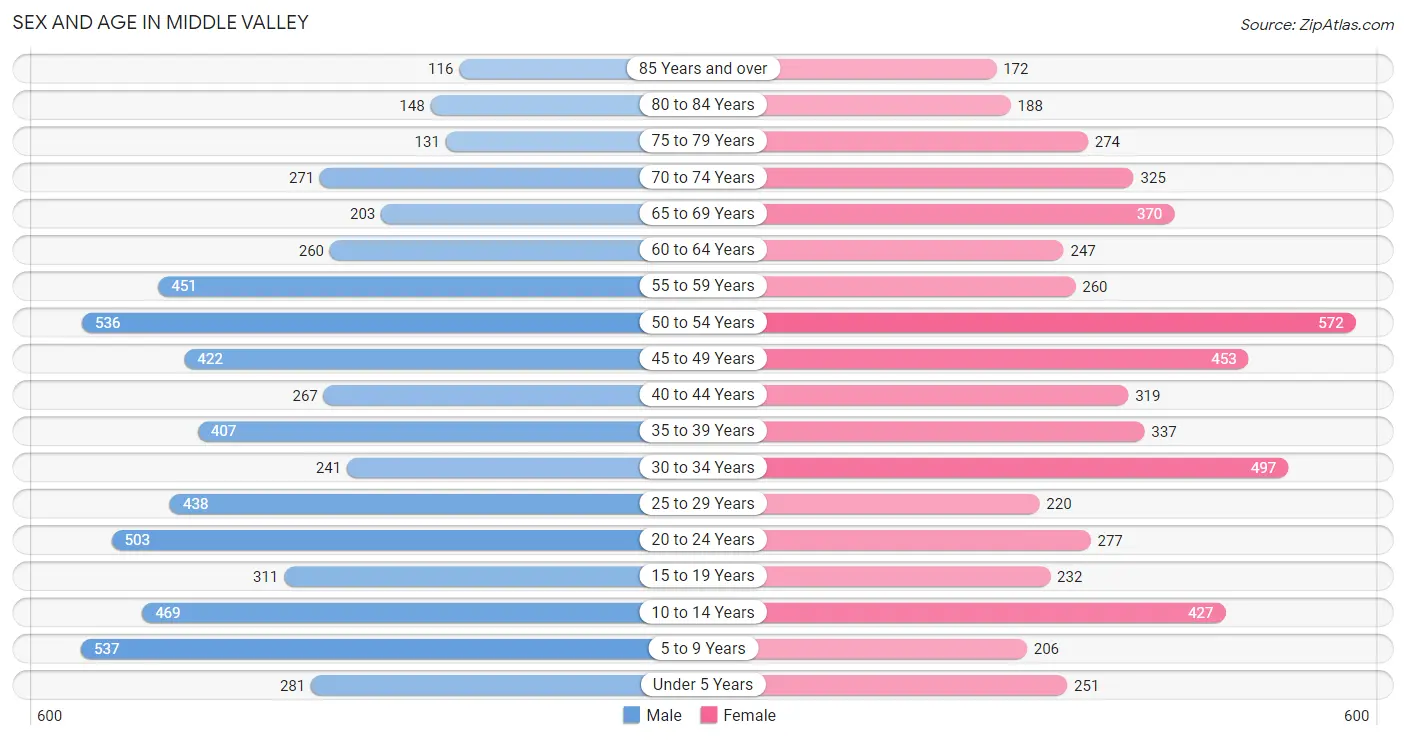
| Age Bracket | Male | Female |
| Under 5 Years | 281 (4.7%) | 251 (4.5%) |
| 5 to 9 Years | 537 (9.0%) | 206 (3.7%) |
| 10 to 14 Years | 469 (7.8%) | 427 (7.6%) |
| 15 to 19 Years | 311 (5.2%) | 232 (4.1%) |
| 20 to 24 Years | 503 (8.4%) | 277 (4.9%) |
| 25 to 29 Years | 438 (7.3%) | 220 (3.9%) |
| 30 to 34 Years | 241 (4.0%) | 497 (8.8%) |
| 35 to 39 Years | 407 (6.8%) | 337 (6.0%) |
| 40 to 44 Years | 267 (4.5%) | 319 (5.7%) |
| 45 to 49 Years | 422 (7.0%) | 453 (8.1%) |
| 50 to 54 Years | 536 (8.9%) | 572 (10.2%) |
| 55 to 59 Years | 451 (7.5%) | 260 (4.6%) |
| 60 to 64 Years | 260 (4.3%) | 247 (4.4%) |
| 65 to 69 Years | 203 (3.4%) | 370 (6.6%) |
| 70 to 74 Years | 271 (4.5%) | 325 (5.8%) |
| 75 to 79 Years | 131 (2.2%) | 274 (4.9%) |
| 80 to 84 Years | 148 (2.5%) | 188 (3.3%) |
| 85 Years and over | 116 (1.9%) | 172 (3.1%) |
| Total | 5,992 (100.0%) | 5,627 (100.0%) |
Families and Households in Middle Valley
Median Family Size in Middle Valley
The median family size in Middle Valley is 3.02 persons per family, with single female/mother families (581 | 17.8%) accounting for the largest median family size of 3.15 persons per family. On the other hand, single male/father families (212 | 6.5%) represent the smallest median family size with 2.53 persons per family.
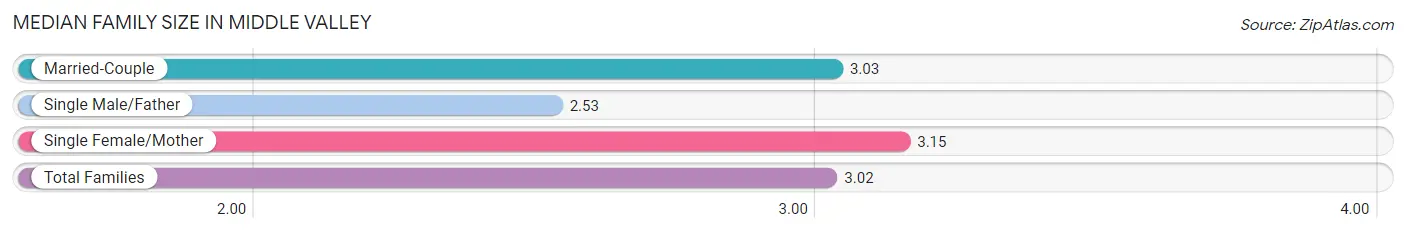
| Family Type | # Families | Family Size |
| Married-Couple | 2,468 (75.7%) | 3.03 |
| Single Male/Father | 212 (6.5%) | 2.53 |
| Single Female/Mother | 581 (17.8%) | 3.15 |
| Total Families | 3,261 (100.0%) | 3.02 |
Median Household Size in Middle Valley
The median household size in Middle Valley is 2.67 persons per household, with single female/mother households (581 | 13.4%) accounting for the largest median household size of 3.53 persons per household. non-family households (1,088 | 25.0%) represent the smallest median household size with 1.29 persons per household.
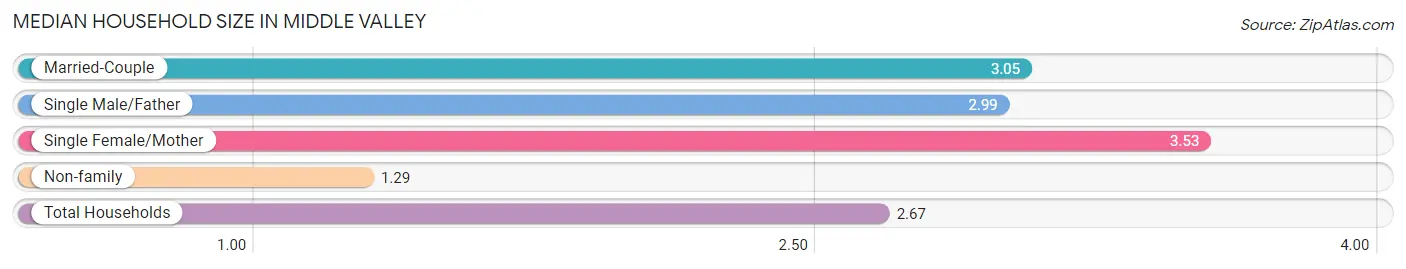
| Household Type | # Households | Household Size |
| Married-Couple | 2,468 (56.8%) | 3.05 |
| Single Male/Father | 212 (4.9%) | 2.99 |
| Single Female/Mother | 581 (13.4%) | 3.53 |
| Non-family | 1,088 (25.0%) | 1.29 |
| Total Households | 4,349 (100.0%) | 2.67 |
Household Size by Marriage Status in Middle Valley
Out of a total of 4,349 households in Middle Valley, 3,261 (75.0%) are family households, while 1,088 (25.0%) are nonfamily households. The most numerous type of family households are 2-person households, comprising 1,557, and the most common type of nonfamily households are 1-person households, comprising 841.
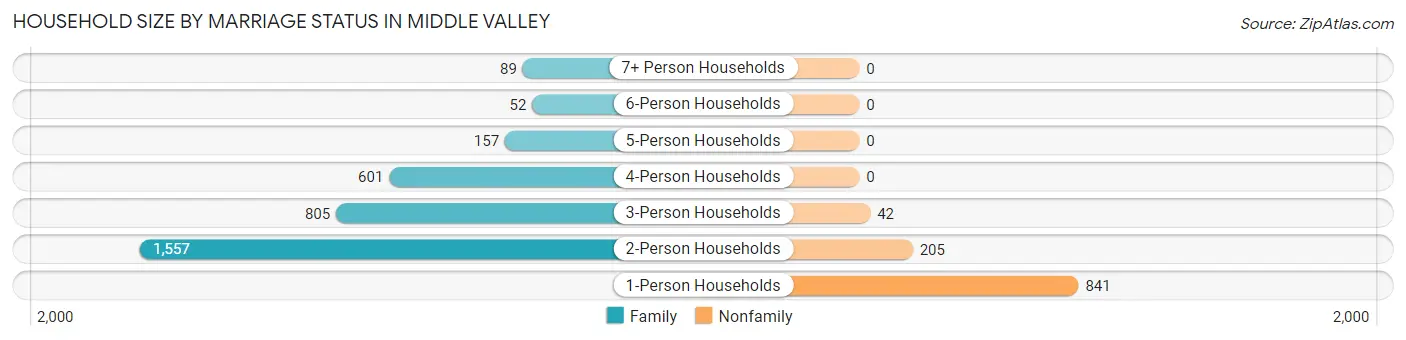
| Household Size | Family Households | Nonfamily Households |
| 1-Person Households | - | 841 (19.3%) |
| 2-Person Households | 1,557 (35.8%) | 205 (4.7%) |
| 3-Person Households | 805 (18.5%) | 42 (1.0%) |
| 4-Person Households | 601 (13.8%) | 0 (0.0%) |
| 5-Person Households | 157 (3.6%) | 0 (0.0%) |
| 6-Person Households | 52 (1.2%) | 0 (0.0%) |
| 7+ Person Households | 89 (2.1%) | 0 (0.0%) |
| Total | 3,261 (75.0%) | 1,088 (25.0%) |
Female Fertility in Middle Valley
Fertility by Age in Middle Valley
Average fertility rate in Middle Valley is 63.0 births per 1,000 women. Women in the age bracket of 20 to 34 years have the highest fertility rate with 137.0 births per 1,000 women. Women in the age bracket of 20 to 34 years acount for 90.1% of all women with births.
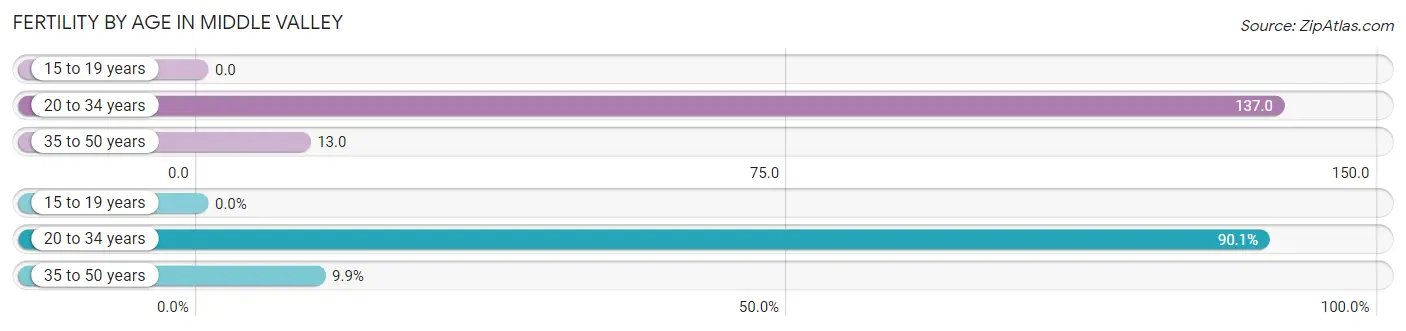
| Age Bracket | Women with Births | Births / 1,000 Women |
| 15 to 19 years | 0 (0.0%) | 0.0 |
| 20 to 34 years | 136 (90.1%) | 137.0 |
| 35 to 50 years | 15 (9.9%) | 13.0 |
| Total | 151 (100.0%) | 63.0 |
Fertility by Age by Marriage Status in Middle Valley
80.1% of women with births (151) in Middle Valley are married. The highest percentage of unmarried women with births falls into 35 to 50 years age bracket with 100.0% of them unmarried at the time of birth, while the lowest percentage of unmarried women with births belong to 20 to 34 years age bracket with 11.0% of them unmarried.
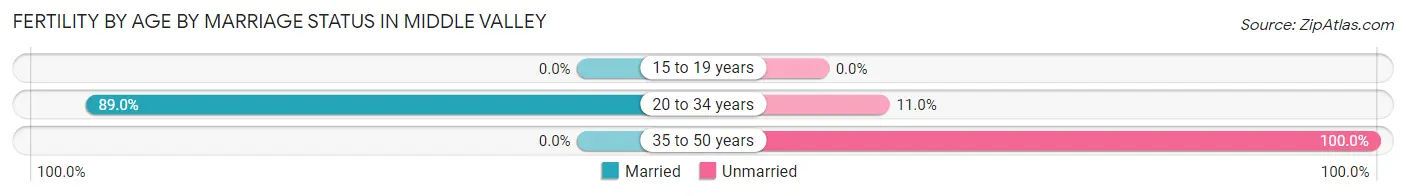
| Age Bracket | Married | Unmarried |
| 15 to 19 years | 0 (0.0%) | 0 (0.0%) |
| 20 to 34 years | 121 (89.0%) | 15 (11.0%) |
| 35 to 50 years | 0 (0.0%) | 15 (100.0%) |
| Total | 121 (80.1%) | 30 (19.9%) |
Fertility by Education in Middle Valley
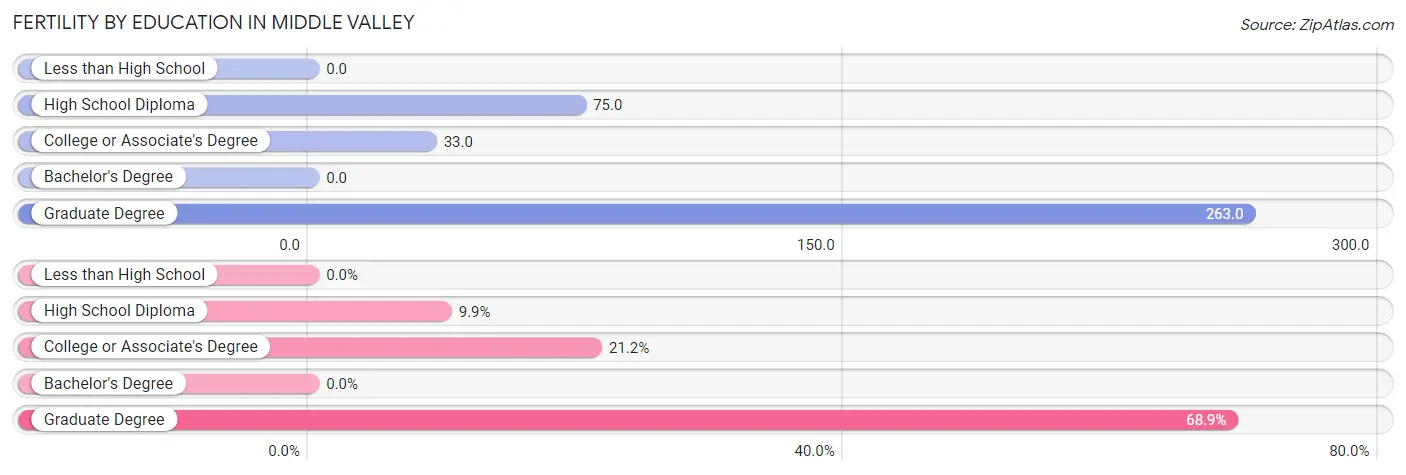
| Educational Attainment | Women with Births | Births / 1,000 Women |
| Less than High School | 0 (0.0%) | 0.0 |
| High School Diploma | 15 (9.9%) | 75.0 |
| College or Associate's Degree | 32 (21.2%) | 33.0 |
| Bachelor's Degree | 0 (0.0%) | 0.0 |
| Graduate Degree | 104 (68.9%) | 263.0 |
| Total | 151 (100.0%) | 63.0 |
Fertility by Education by Marriage Status in Middle Valley
19.9% of women with births in Middle Valley are unmarried. Women with the educational attainment of graduate degree are most likely to be married with 100.0% of them married at childbirth, while women with the educational attainment of high school diploma are least likely to be married with 100.0% of them unmarried at childbirth.
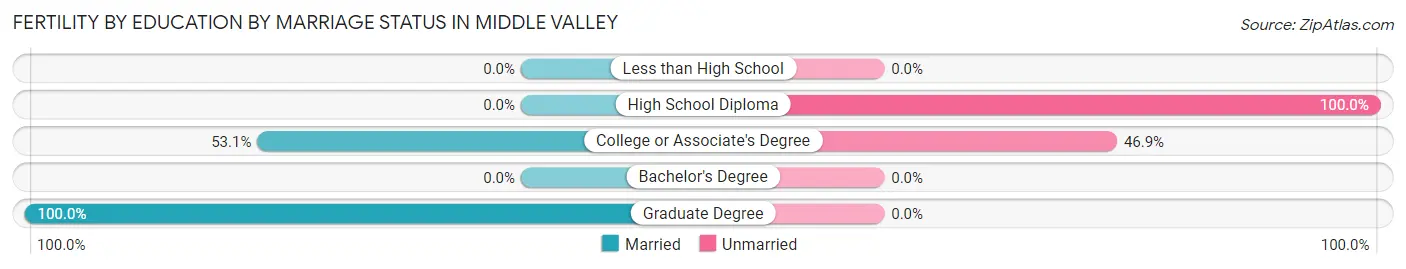
| Educational Attainment | Married | Unmarried |
| Less than High School | 0 (0.0%) | 0 (0.0%) |
| High School Diploma | 0 (0.0%) | 15 (100.0%) |
| College or Associate's Degree | 17 (53.1%) | 15 (46.9%) |
| Bachelor's Degree | 0 (0.0%) | 0 (0.0%) |
| Graduate Degree | 104 (100.0%) | 0 (0.0%) |
| Total | 121 (80.1%) | 30 (19.9%) |
Income in Middle Valley
Income Overview in Middle Valley
Per Capita Income in Middle Valley is $44,189, while median incomes of families and households are $96,530 and $88,173 respectively.
| Characteristic | Number | Measure |
| Per Capita Income | 11,619 | $44,189 |
| Median Family Income | 3,261 | $96,530 |
| Mean Family Income | 3,261 | $129,710 |
| Median Household Income | 4,349 | $88,173 |
| Mean Household Income | 4,349 | $115,716 |
| Income Deficit | 3,261 | $0 |
| Wage / Income Gap (%) | 11,619 | 7.96% |
| Wage / Income Gap ($) | 11,619 | 92.04¢ per $1 |
| Gini / Inequality Index | 11,619 | 0.44 |
Earnings by Sex in Middle Valley
Average Earnings in Middle Valley are $48,557, $50,543 for men and $46,518 for women, a difference of 8.0%.
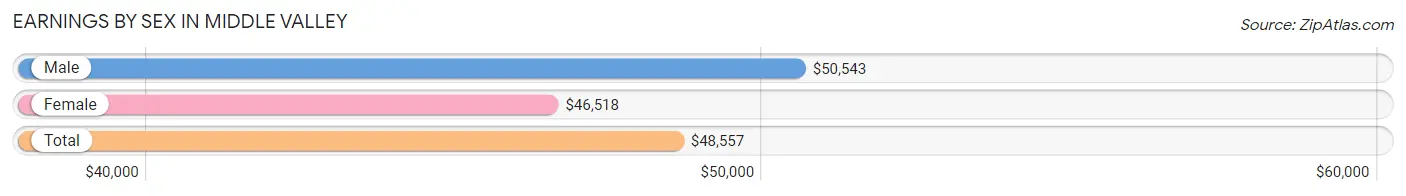
| Sex | Number | Average Earnings |
| Male | 3,603 (56.4%) | $50,543 |
| Female | 2,786 (43.6%) | $46,518 |
| Total | 6,389 (100.0%) | $48,557 |
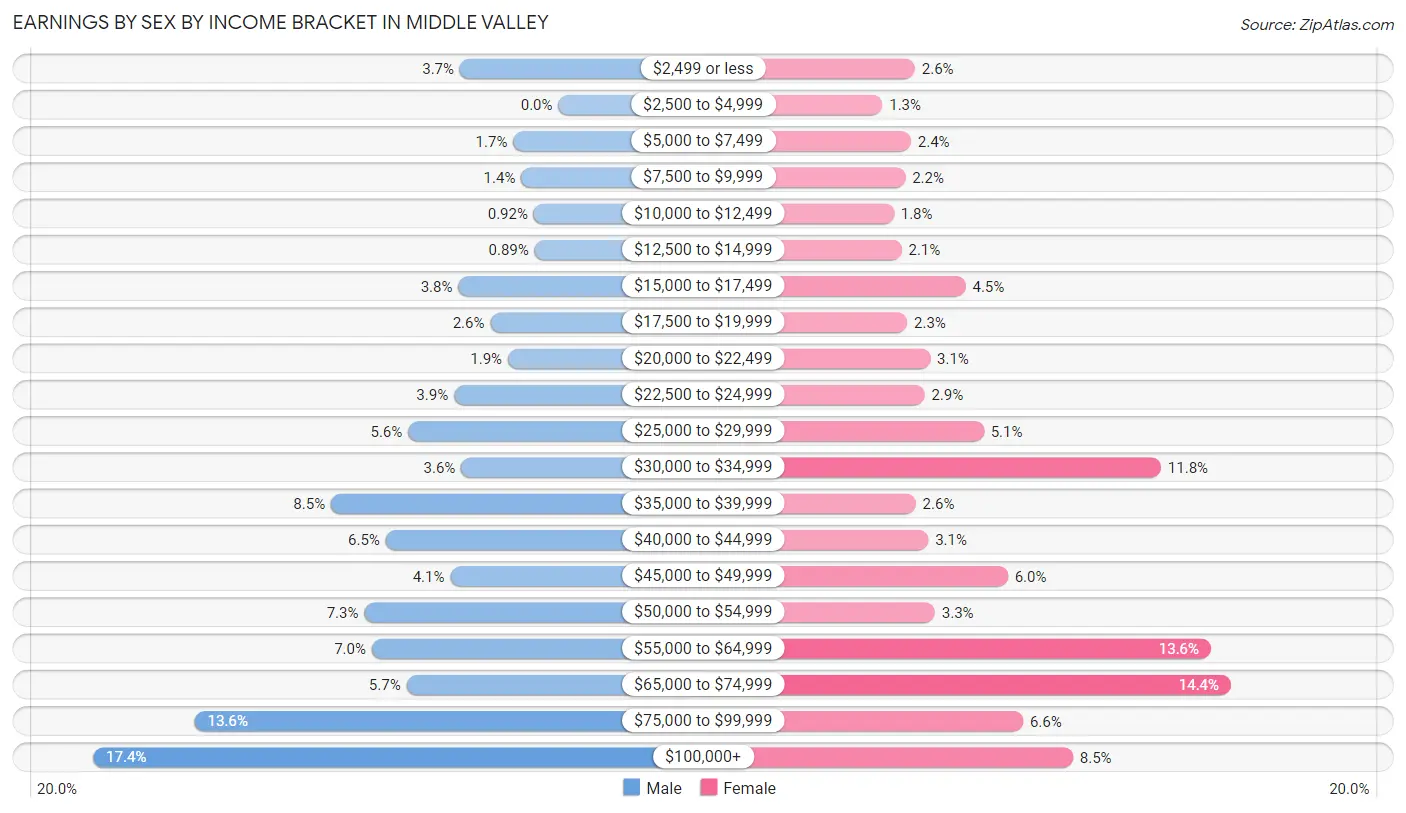
Earnings by Sex by Income Bracket in Middle Valley
The most common earnings brackets in Middle Valley are $100,000+ for men (628 | 17.4%) and $65,000 to $74,999 for women (401 | 14.4%).
| Income | Male | Female |
| $2,499 or less | 133 (3.7%) | 71 (2.5%) |
| $2,500 to $4,999 | 0 (0.0%) | 37 (1.3%) |
| $5,000 to $7,499 | 61 (1.7%) | 67 (2.4%) |
| $7,500 to $9,999 | 50 (1.4%) | 61 (2.2%) |
| $10,000 to $12,499 | 33 (0.9%) | 49 (1.8%) |
| $12,500 to $14,999 | 32 (0.9%) | 57 (2.1%) |
| $15,000 to $17,499 | 135 (3.7%) | 124 (4.4%) |
| $17,500 to $19,999 | 92 (2.5%) | 63 (2.3%) |
| $20,000 to $22,499 | 68 (1.9%) | 87 (3.1%) |
| $22,500 to $24,999 | 141 (3.9%) | 81 (2.9%) |
| $25,000 to $29,999 | 203 (5.6%) | 143 (5.1%) |
| $30,000 to $34,999 | 131 (3.6%) | 328 (11.8%) |
| $35,000 to $39,999 | 307 (8.5%) | 72 (2.6%) |
| $40,000 to $44,999 | 233 (6.5%) | 85 (3.0%) |
| $45,000 to $49,999 | 146 (4.1%) | 168 (6.0%) |
| $50,000 to $54,999 | 262 (7.3%) | 92 (3.3%) |
| $55,000 to $64,999 | 252 (7.0%) | 380 (13.6%) |
| $65,000 to $74,999 | 205 (5.7%) | 401 (14.4%) |
| $75,000 to $99,999 | 491 (13.6%) | 184 (6.6%) |
| $100,000+ | 628 (17.4%) | 236 (8.5%) |
| Total | 3,603 (100.0%) | 2,786 (100.0%) |
Earnings by Sex by Educational Attainment in Middle Valley
Average earnings in Middle Valley are $54,628 for men and $51,118 for women, a difference of 6.4%. Men with an educational attainment of graduate degree enjoy the highest average annual earnings of $93,867, while those with high school diploma education earn the least with $43,237. Women with an educational attainment of graduate degree earn the most with the average annual earnings of $75,833, while those with high school diploma education have the smallest earnings of $29,192.
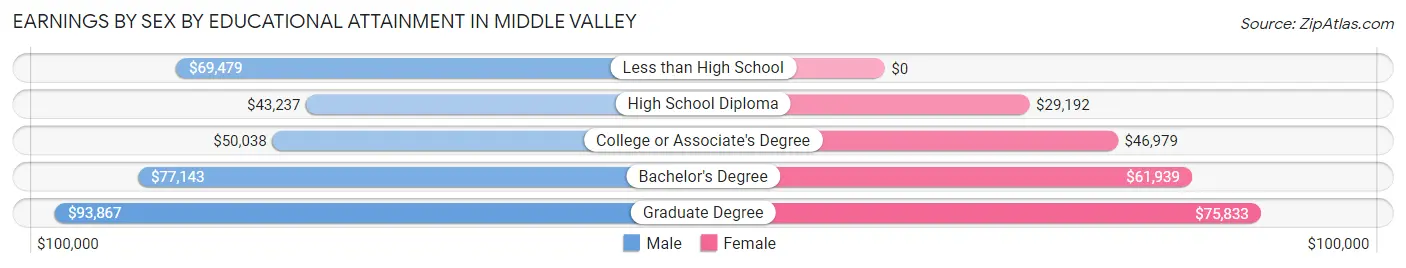
| Educational Attainment | Male Income | Female Income |
| Less than High School | $69,479 | $0 |
| High School Diploma | $43,237 | $29,192 |
| College or Associate's Degree | $50,038 | $46,979 |
| Bachelor's Degree | $77,143 | $61,939 |
| Graduate Degree | $93,867 | $75,833 |
| Total | $54,628 | $51,118 |
Family Income in Middle Valley
Family Income Brackets in Middle Valley
According to the Middle Valley family income data, there are 721 families falling into the $100,000 to $149,999 income range, which is the most common income bracket and makes up 22.1% of all families. Conversely, the $10,000 to $14,999 income bracket is the least frequent group with only 26 families (0.8%) belonging to this category.
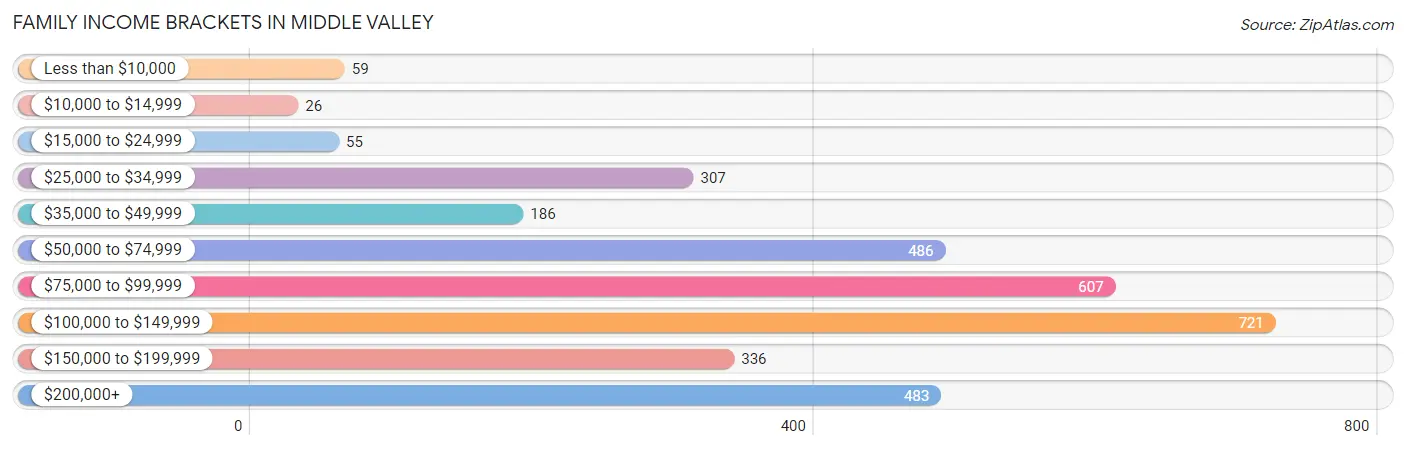
| Income Bracket | # Families | % Families |
| Less than $10,000 | 59 | 1.8% |
| $10,000 to $14,999 | 26 | 0.8% |
| $15,000 to $24,999 | 55 | 1.7% |
| $25,000 to $34,999 | 307 | 9.4% |
| $35,000 to $49,999 | 186 | 5.7% |
| $50,000 to $74,999 | 486 | 14.9% |
| $75,000 to $99,999 | 607 | 18.6% |
| $100,000 to $149,999 | 721 | 22.1% |
| $150,000 to $199,999 | 336 | 10.3% |
| $200,000+ | 483 | 14.8% |
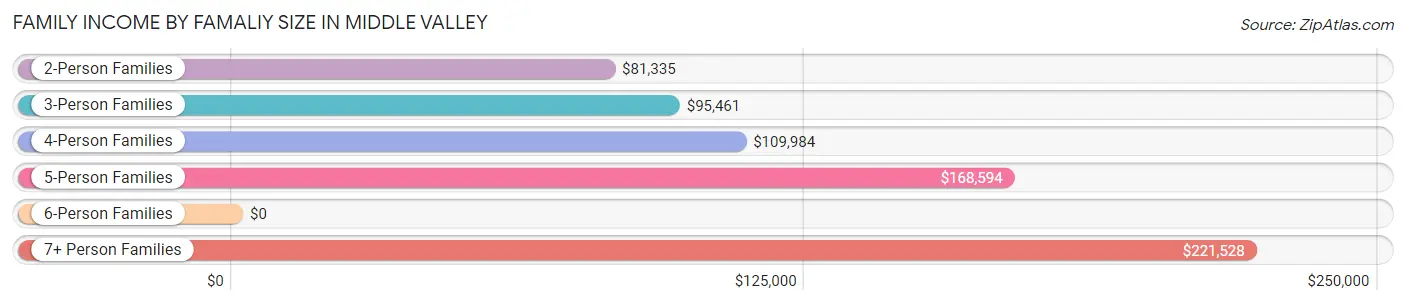
Family Income by Famaliy Size in Middle Valley
7+ person families (89 | 2.7%) account for the highest median family income in Middle Valley with $221,528 per family, while 2-person families (1,611 | 49.4%) have the highest median income of $40,668 per family member.
| Income Bracket | # Families | Median Income |
| 2-Person Families | 1,611 (49.4%) | $81,335 |
| 3-Person Families | 952 (29.2%) | $95,461 |
| 4-Person Families | 447 (13.7%) | $109,984 |
| 5-Person Families | 123 (3.8%) | $168,594 |
| 6-Person Families | 39 (1.2%) | $0 |
| 7+ Person Families | 89 (2.7%) | $221,528 |
| Total | 3,261 (100.0%) | $96,530 |
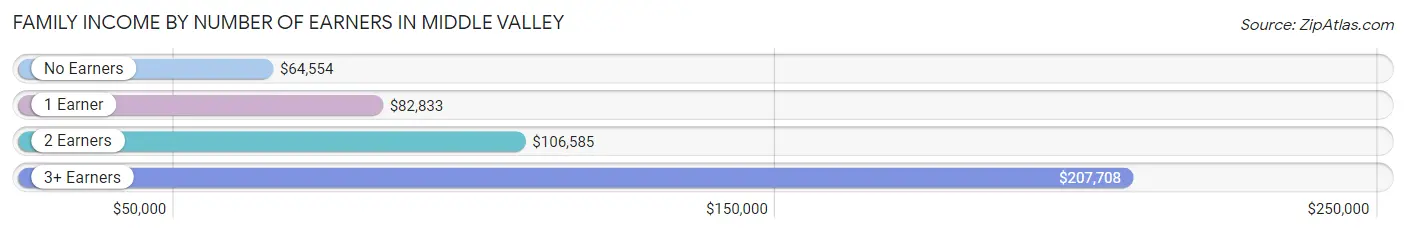
Family Income by Number of Earners in Middle Valley
The median family income in Middle Valley is $96,530, with families comprising 3+ earners (339) having the highest median family income of $207,708, while families with no earners (475) have the lowest median family income of $64,554, accounting for 10.4% and 14.6% of families, respectively.
| Number of Earners | # Families | Median Income |
| No Earners | 475 (14.6%) | $64,554 |
| 1 Earner | 844 (25.9%) | $82,833 |
| 2 Earners | 1,603 (49.2%) | $106,585 |
| 3+ Earners | 339 (10.4%) | $207,708 |
| Total | 3,261 (100.0%) | $96,530 |
Household Income in Middle Valley
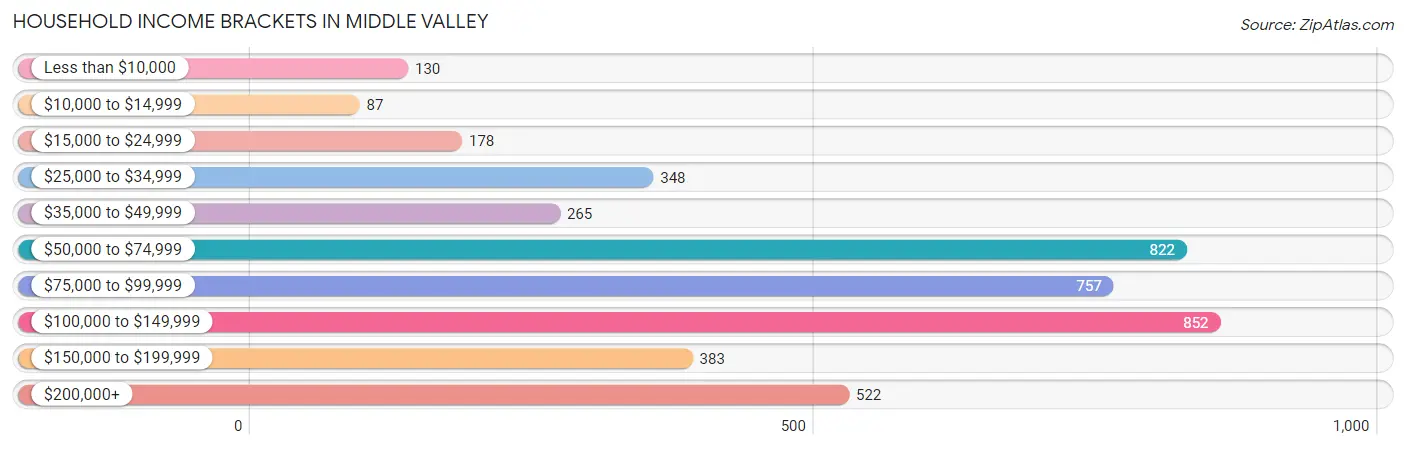
Household Income Brackets in Middle Valley
With 852 households falling in the category, the $100,000 to $149,999 income range is the most frequent in Middle Valley, accounting for 19.6% of all households. In contrast, only 87 households (2.0%) fall into the $10,000 to $14,999 income bracket, making it the least populous group.
| Income Bracket | # Households | % Households |
| Less than $10,000 | 130 | 3.0% |
| $10,000 to $14,999 | 87 | 2.0% |
| $15,000 to $24,999 | 178 | 4.1% |
| $25,000 to $34,999 | 348 | 8.0% |
| $35,000 to $49,999 | 265 | 6.1% |
| $50,000 to $74,999 | 822 | 18.9% |
| $75,000 to $99,999 | 757 | 17.4% |
| $100,000 to $149,999 | 852 | 19.6% |
| $150,000 to $199,999 | 383 | 8.8% |
| $200,000+ | 522 | 12.0% |
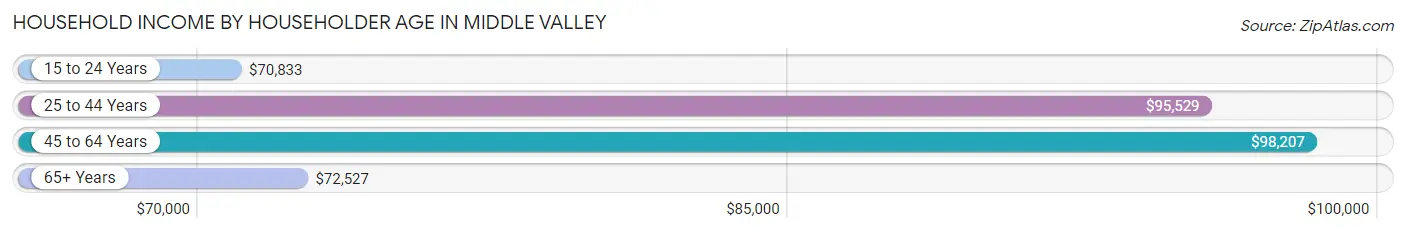
Household Income by Householder Age in Middle Valley
The median household income in Middle Valley is $88,173, with the highest median household income of $98,207 found in the 45 to 64 years age bracket for the primary householder. A total of 1,731 households (39.8%) fall into this category. Meanwhile, the 15 to 24 years age bracket for the primary householder has the lowest median household income of $70,833, with 126 households (2.9%) in this group.
| Income Bracket | # Households | Median Income |
| 15 to 24 Years | 126 (2.9%) | $70,833 |
| 25 to 44 Years | 1,192 (27.4%) | $95,529 |
| 45 to 64 Years | 1,731 (39.8%) | $98,207 |
| 65+ Years | 1,300 (29.9%) | $72,527 |
| Total | 4,349 (100.0%) | $88,173 |
Poverty in Middle Valley
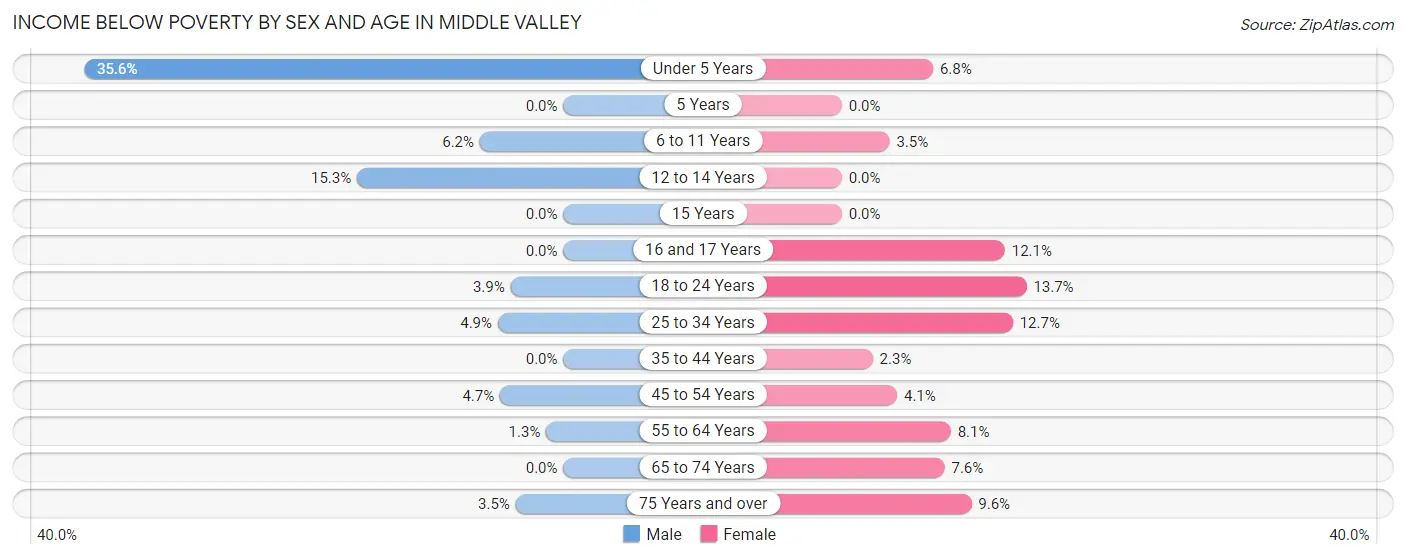
Income Below Poverty by Sex and Age in Middle Valley
With 5.1% poverty level for males and 7.1% for females among the residents of Middle Valley, under 5 year old males and 18 to 24 year old females are the most vulnerable to poverty, with 100 males (35.6%) and 44 females (13.7%) in their respective age groups living below the poverty level.
| Age Bracket | Male | Female |
| Under 5 Years | 100 (35.6%) | 17 (6.8%) |
| 5 Years | 0 (0.0%) | 0 (0.0%) |
| 6 to 11 Years | 44 (6.2%) | 14 (3.5%) |
| 12 to 14 Years | 36 (15.3%) | 0 (0.0%) |
| 15 Years | 0 (0.0%) | 0 (0.0%) |
| 16 and 17 Years | 0 (0.0%) | 19 (12.1%) |
| 18 to 24 Years | 22 (3.9%) | 44 (13.7%) |
| 25 to 34 Years | 33 (4.9%) | 91 (12.7%) |
| 35 to 44 Years | 0 (0.0%) | 15 (2.3%) |
| 45 to 54 Years | 45 (4.7%) | 42 (4.1%) |
| 55 to 64 Years | 9 (1.3%) | 41 (8.1%) |
| 65 to 74 Years | 0 (0.0%) | 53 (7.6%) |
| 75 Years and over | 14 (3.5%) | 61 (9.6%) |
| Total | 303 (5.1%) | 397 (7.1%) |
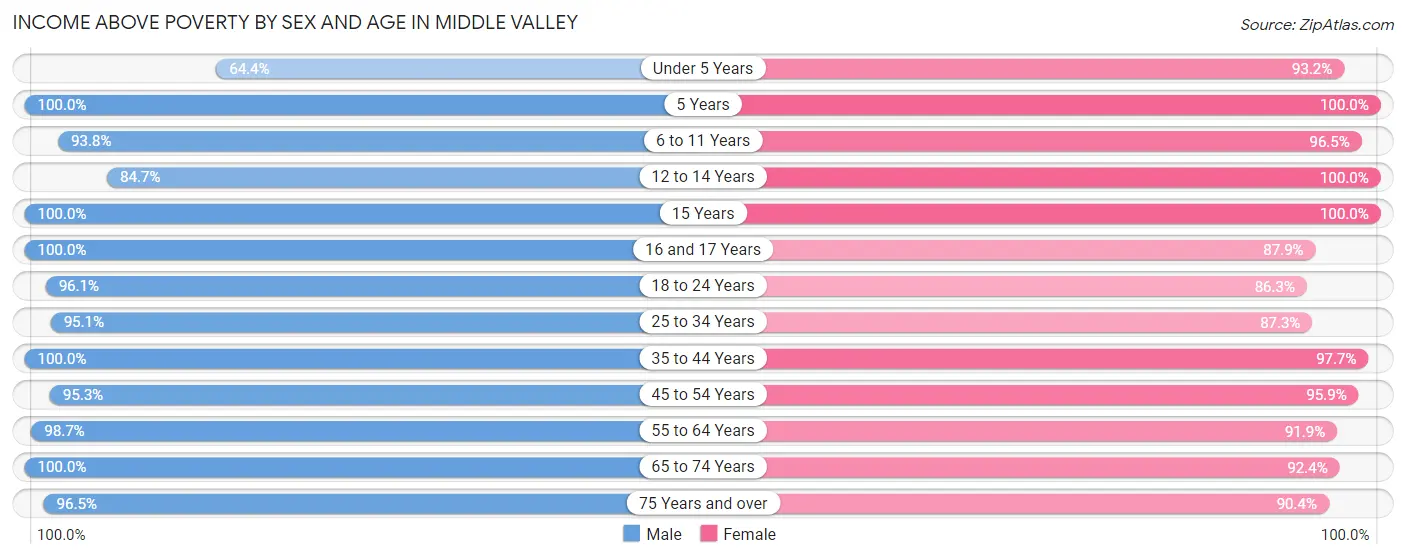
Income Above Poverty by Sex and Age in Middle Valley
According to the poverty statistics in Middle Valley, males aged 5 years and females aged 5 years are the age groups that are most secure financially, with 100.0% of males and 100.0% of females in these age groups living above the poverty line.
| Age Bracket | Male | Female |
| Under 5 Years | 181 (64.4%) | 234 (93.2%) |
| 5 Years | 61 (100.0%) | 35 (100.0%) |
| 6 to 11 Years | 666 (93.8%) | 382 (96.5%) |
| 12 to 14 Years | 199 (84.7%) | 156 (100.0%) |
| 15 Years | 2 (100.0%) | 31 (100.0%) |
| 16 and 17 Years | 251 (100.0%) | 138 (87.9%) |
| 18 to 24 Years | 539 (96.1%) | 277 (86.3%) |
| 25 to 34 Years | 646 (95.1%) | 626 (87.3%) |
| 35 to 44 Years | 674 (100.0%) | 641 (97.7%) |
| 45 to 54 Years | 913 (95.3%) | 983 (95.9%) |
| 55 to 64 Years | 702 (98.7%) | 466 (91.9%) |
| 65 to 74 Years | 474 (100.0%) | 642 (92.4%) |
| 75 Years and over | 381 (96.5%) | 573 (90.4%) |
| Total | 5,689 (94.9%) | 5,184 (92.9%) |
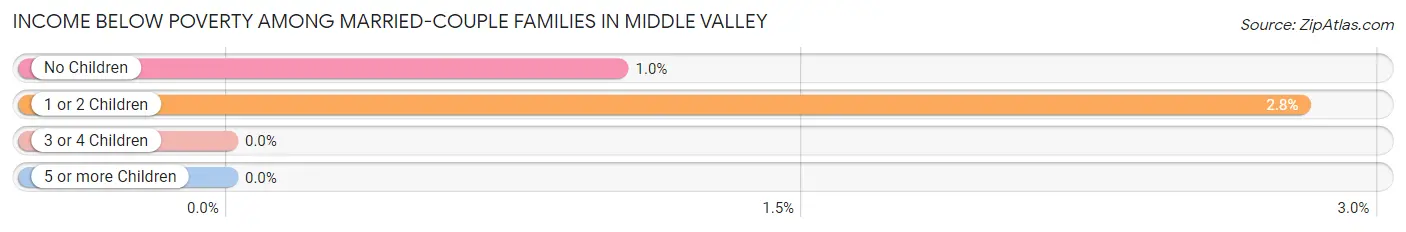
Income Below Poverty Among Married-Couple Families in Middle Valley
The poverty statistics for married-couple families in Middle Valley show that 1.5% or 36 of the total 2,468 families live below the poverty line. Families with 1 or 2 children have the highest poverty rate of 2.8%, comprising of 20 families. On the other hand, families with 3 or 4 children have the lowest poverty rate of 0.0%, which includes 0 families.
| Children | Above Poverty | Below Poverty |
| No Children | 1,558 (99.0%) | 16 (1.0%) |
| 1 or 2 Children | 694 (97.2%) | 20 (2.8%) |
| 3 or 4 Children | 167 (100.0%) | 0 (0.0%) |
| 5 or more Children | 13 (100.0%) | 0 (0.0%) |
| Total | 2,432 (98.5%) | 36 (1.5%) |
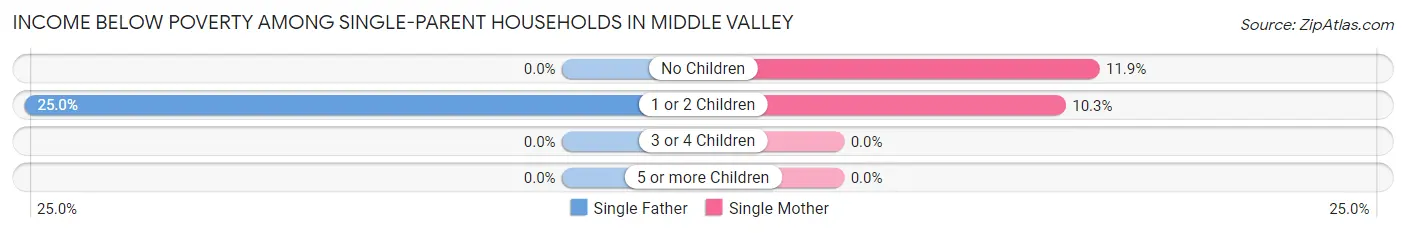
Income Below Poverty Among Single-Parent Households in Middle Valley
According to the poverty data in Middle Valley, 11.8% or 25 single-father households and 10.5% or 61 single-mother households are living below the poverty line. Among single-father households, those with 1 or 2 children have the highest poverty rate, with 25 households (25.0%) experiencing poverty. Likewise, among single-mother households, those with no children have the highest poverty rate, with 29 households (11.9%) falling below the poverty line.
| Children | Single Father | Single Mother |
| No Children | 0 (0.0%) | 29 (11.9%) |
| 1 or 2 Children | 25 (25.0%) | 32 (10.3%) |
| 3 or 4 Children | 0 (0.0%) | 0 (0.0%) |
| 5 or more Children | 0 (0.0%) | 0 (0.0%) |
| Total | 25 (11.8%) | 61 (10.5%) |
Income Below Poverty Among Married-Couple vs Single-Parent Households in Middle Valley
The poverty data for Middle Valley shows that 36 of the married-couple family households (1.5%) and 86 of the single-parent households (10.8%) are living below the poverty level. Within the married-couple family households, those with 1 or 2 children have the highest poverty rate, with 20 households (2.8%) falling below the poverty line. Among the single-parent households, those with 1 or 2 children have the highest poverty rate, with 57 household (13.9%) living below poverty.
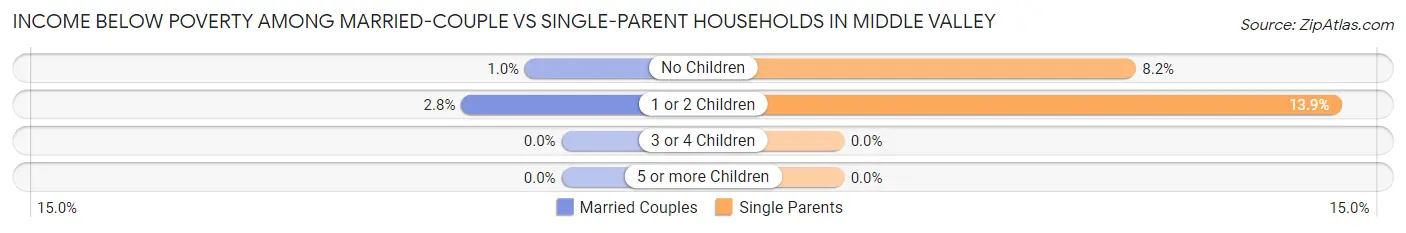
| Children | Married-Couple Families | Single-Parent Households |
| No Children | 16 (1.0%) | 29 (8.2%) |
| 1 or 2 Children | 20 (2.8%) | 57 (13.9%) |
| 3 or 4 Children | 0 (0.0%) | 0 (0.0%) |
| 5 or more Children | 0 (0.0%) | 0 (0.0%) |
| Total | 36 (1.5%) | 86 (10.8%) |
Employment Characteristics in Middle Valley
Employment by Class of Employer in Middle Valley
Among the 5,886 employed individuals in Middle Valley, private company employees (3,967 | 67.4%), not-for-profit organizations (461 | 7.8%), and self-employed (not incorporated) (378 | 6.4%) make up the most common classes of employment.
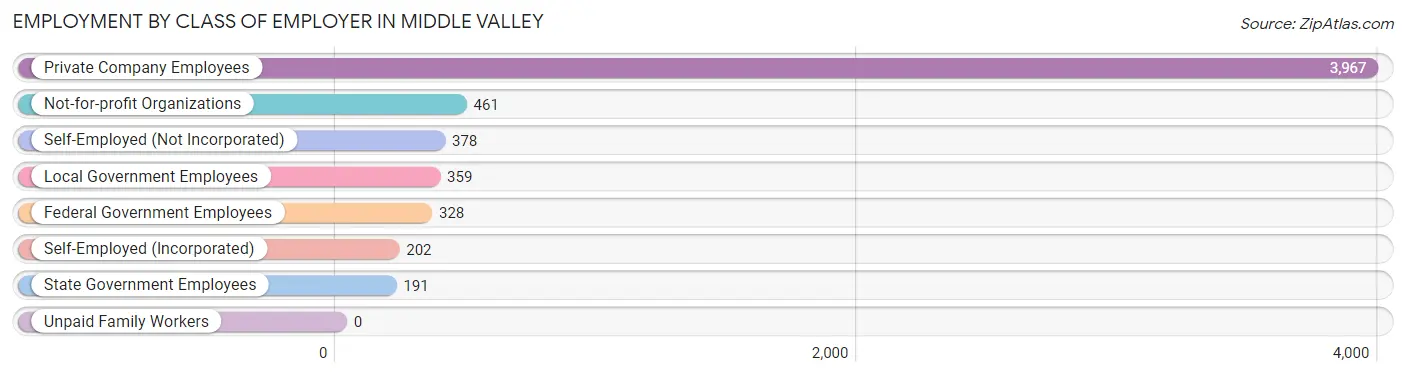
| Employer Class | # Employees | % Employees |
| Private Company Employees | 3,967 | 67.4% |
| Self-Employed (Incorporated) | 202 | 3.4% |
| Self-Employed (Not Incorporated) | 378 | 6.4% |
| Not-for-profit Organizations | 461 | 7.8% |
| Local Government Employees | 359 | 6.1% |
| State Government Employees | 191 | 3.2% |
| Federal Government Employees | 328 | 5.6% |
| Unpaid Family Workers | 0 | 0.0% |
| Total | 5,886 | 100.0% |
Employment Status by Age in Middle Valley
According to the labor force statistics for Middle Valley, out of the total population over 16 years of age (9,415), 66.9% or 6,299 individuals are in the labor force, with 2.9% or 183 of them unemployed. The age group with the highest labor force participation rate is 30 to 34 years, with 92.5% or 683 individuals in the labor force. Within the labor force, the 30 to 34 years age range has the highest percentage of unemployed individuals, with 8.2% or 56 of them being unemployed.
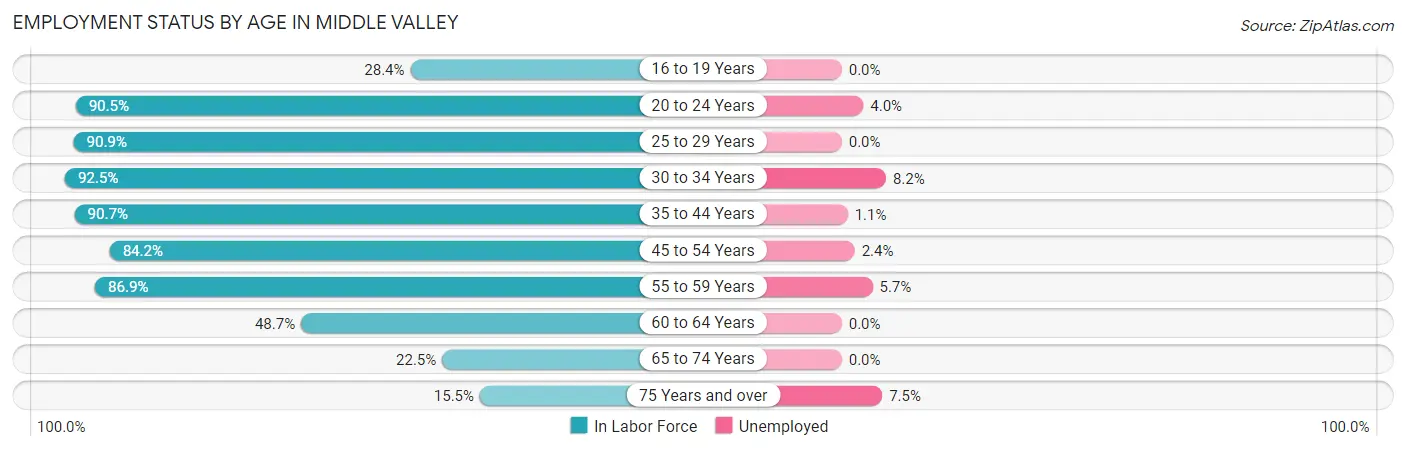
| Age Bracket | In Labor Force | Unemployed |
| 16 to 19 Years | 145 (28.4%) | 0 (0.0%) |
| 20 to 24 Years | 706 (90.5%) | 28 (4.0%) |
| 25 to 29 Years | 598 (90.9%) | 0 (0.0%) |
| 30 to 34 Years | 683 (92.5%) | 56 (8.2%) |
| 35 to 44 Years | 1,206 (90.7%) | 13 (1.1%) |
| 45 to 54 Years | 1,670 (84.2%) | 40 (2.4%) |
| 55 to 59 Years | 618 (86.9%) | 35 (5.7%) |
| 60 to 64 Years | 247 (48.7%) | 0 (0.0%) |
| 65 to 74 Years | 263 (22.5%) | 0 (0.0%) |
| 75 Years and over | 159 (15.5%) | 12 (7.5%) |
| Total | 6,299 (66.9%) | 183 (2.9%) |
Employment Status by Educational Attainment in Middle Valley
According to labor force statistics for Middle Valley, 84.7% of individuals (5,020) out of the total population between 25 and 64 years of age (5,927) are in the labor force, with 2.9% or 146 of them being unemployed. The group with the highest labor force participation rate are those with the educational attainment of bachelor's degree or higher, with 87.9% or 1,890 individuals in the labor force. Within the labor force, individuals with less than high school education have the highest percentage of unemployment, with 17.0% or 46 of them being unemployed.
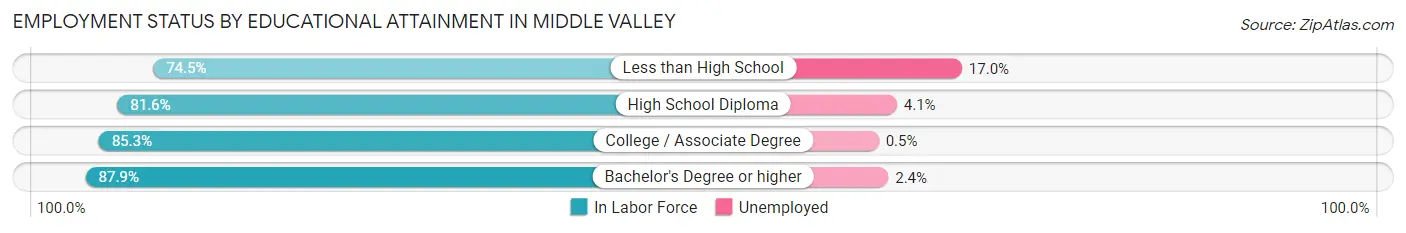
| Educational Attainment | In Labor Force | Unemployed |
| Less than High School | 271 (74.5%) | 62 (17.0%) |
| High School Diploma | 1,095 (81.6%) | 55 (4.1%) |
| College / Associate Degree | 1,767 (85.3%) | 10 (0.5%) |
| Bachelor's Degree or higher | 1,890 (87.9%) | 52 (2.4%) |
| Total | 5,020 (84.7%) | 172 (2.9%) |
Employment Occupations by Sex in Middle Valley
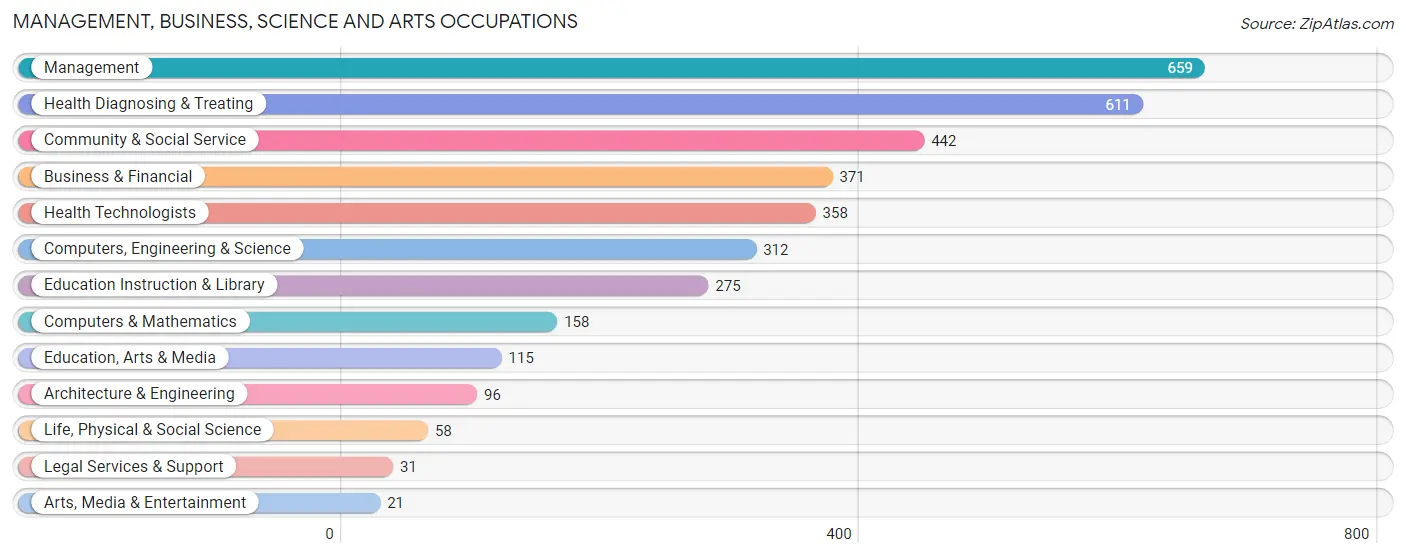
Management, Business, Science and Arts Occupations
The most common Management, Business, Science and Arts occupations in Middle Valley are Management (659 | 10.8%), Health Diagnosing & Treating (611 | 10.0%), Community & Social Service (442 | 7.2%), Business & Financial (371 | 6.1%), and Health Technologists (358 | 5.9%).
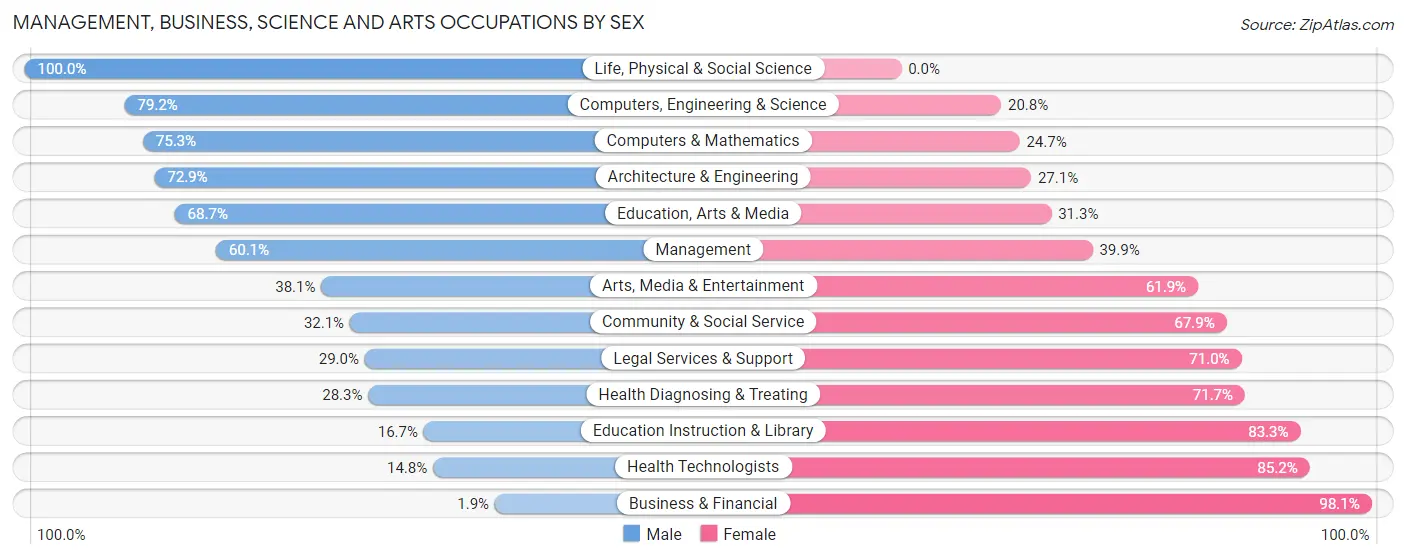
Management, Business, Science and Arts Occupations by Sex
Within the Management, Business, Science and Arts occupations in Middle Valley, the most male-oriented occupations are Life, Physical & Social Science (100.0%), Computers, Engineering & Science (79.2%), and Computers & Mathematics (75.3%), while the most female-oriented occupations are Business & Financial (98.1%), Health Technologists (85.2%), and Education Instruction & Library (83.3%).
| Occupation | Male | Female |
| Management | 396 (60.1%) | 263 (39.9%) |
| Business & Financial | 7 (1.9%) | 364 (98.1%) |
| Computers, Engineering & Science | 247 (79.2%) | 65 (20.8%) |
| Computers & Mathematics | 119 (75.3%) | 39 (24.7%) |
| Architecture & Engineering | 70 (72.9%) | 26 (27.1%) |
| Life, Physical & Social Science | 58 (100.0%) | 0 (0.0%) |
| Community & Social Service | 142 (32.1%) | 300 (67.9%) |
| Education, Arts & Media | 79 (68.7%) | 36 (31.3%) |
| Legal Services & Support | 9 (29.0%) | 22 (71.0%) |
| Education Instruction & Library | 46 (16.7%) | 229 (83.3%) |
| Arts, Media & Entertainment | 8 (38.1%) | 13 (61.9%) |
| Health Diagnosing & Treating | 173 (28.3%) | 438 (71.7%) |
| Health Technologists | 53 (14.8%) | 305 (85.2%) |
| Total (Category) | 965 (40.3%) | 1,430 (59.7%) |
| Total (Overall) | 3,511 (57.5%) | 2,600 (42.5%) |
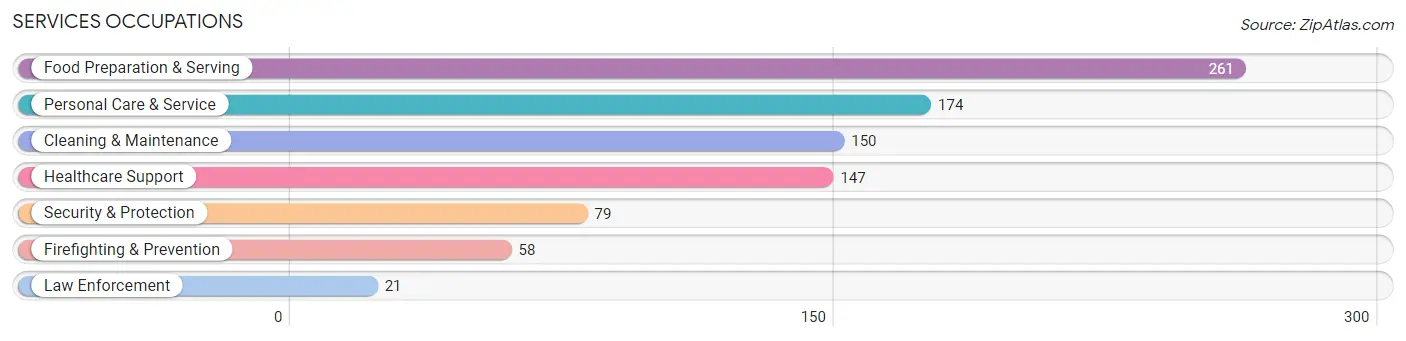
Services Occupations
The most common Services occupations in Middle Valley are Food Preparation & Serving (261 | 4.3%), Personal Care & Service (174 | 2.9%), Cleaning & Maintenance (150 | 2.5%), Healthcare Support (147 | 2.4%), and Security & Protection (79 | 1.3%).
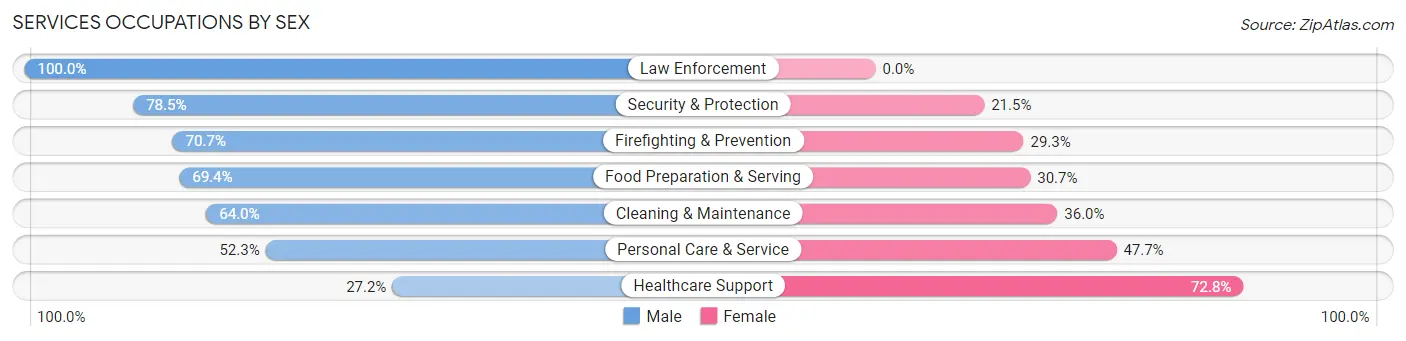
Services Occupations by Sex
Within the Services occupations in Middle Valley, the most male-oriented occupations are Law Enforcement (100.0%), Security & Protection (78.5%), and Firefighting & Prevention (70.7%), while the most female-oriented occupations are Healthcare Support (72.8%), Personal Care & Service (47.7%), and Cleaning & Maintenance (36.0%).
| Occupation | Male | Female |
| Healthcare Support | 40 (27.2%) | 107 (72.8%) |
| Security & Protection | 62 (78.5%) | 17 (21.5%) |
| Firefighting & Prevention | 41 (70.7%) | 17 (29.3%) |
| Law Enforcement | 21 (100.0%) | 0 (0.0%) |
| Food Preparation & Serving | 181 (69.4%) | 80 (30.6%) |
| Cleaning & Maintenance | 96 (64.0%) | 54 (36.0%) |
| Personal Care & Service | 91 (52.3%) | 83 (47.7%) |
| Total (Category) | 470 (58.0%) | 341 (42.0%) |
| Total (Overall) | 3,511 (57.5%) | 2,600 (42.5%) |
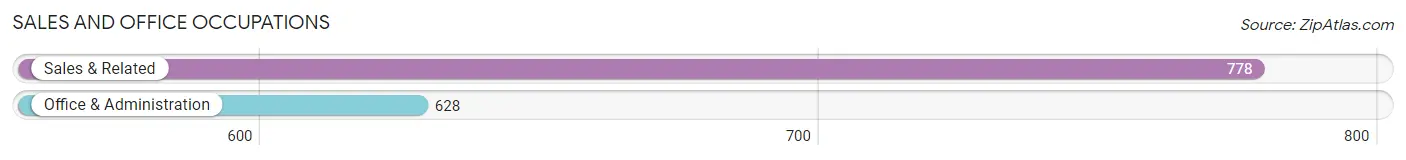
Sales and Office Occupations
The most common Sales and Office occupations in Middle Valley are Sales & Related (778 | 12.7%), and Office & Administration (628 | 10.3%).
Sales and Office Occupations by Sex
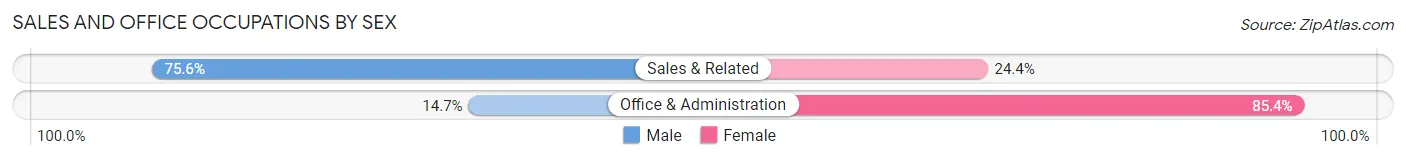
| Occupation | Male | Female |
| Sales & Related | 588 (75.6%) | 190 (24.4%) |
| Office & Administration | 92 (14.6%) | 536 (85.4%) |
| Total (Category) | 680 (48.4%) | 726 (51.6%) |
| Total (Overall) | 3,511 (57.5%) | 2,600 (42.5%) |
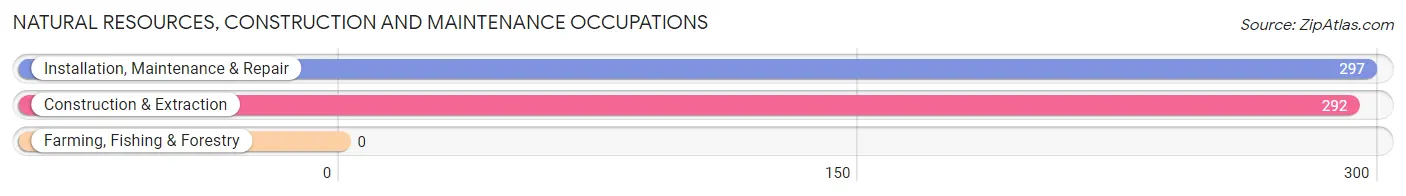
Natural Resources, Construction and Maintenance Occupations
The most common Natural Resources, Construction and Maintenance occupations in Middle Valley are Installation, Maintenance & Repair (297 | 4.9%), and Construction & Extraction (292 | 4.8%).
Natural Resources, Construction and Maintenance Occupations by Sex
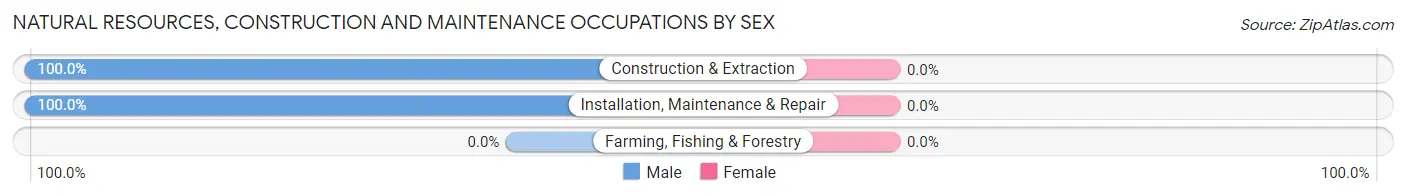
| Occupation | Male | Female |
| Farming, Fishing & Forestry | 0 (0.0%) | 0 (0.0%) |
| Construction & Extraction | 292 (100.0%) | 0 (0.0%) |
| Installation, Maintenance & Repair | 297 (100.0%) | 0 (0.0%) |
| Total (Category) | 589 (100.0%) | 0 (0.0%) |
| Total (Overall) | 3,511 (57.5%) | 2,600 (42.5%) |
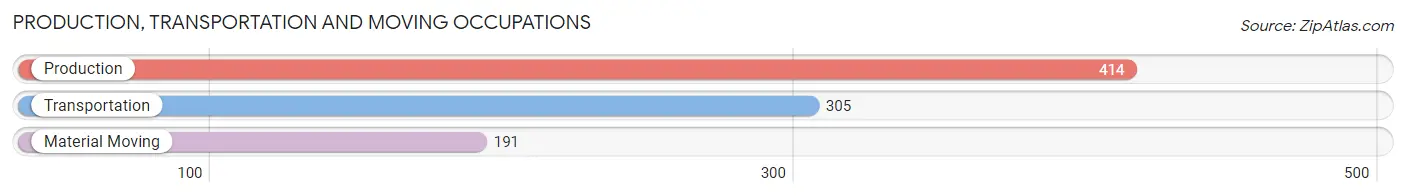
Production, Transportation and Moving Occupations
The most common Production, Transportation and Moving occupations in Middle Valley are Production (414 | 6.8%), Transportation (305 | 5.0%), and Material Moving (191 | 3.1%).
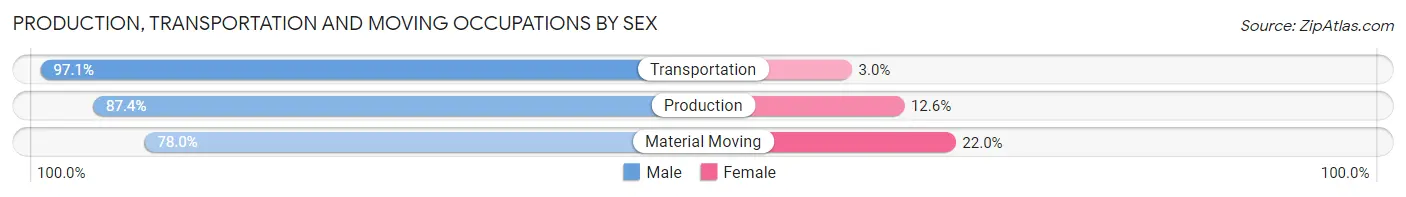
Production, Transportation and Moving Occupations by Sex
| Occupation | Male | Female |
| Production | 362 (87.4%) | 52 (12.6%) |
| Transportation | 296 (97.1%) | 9 (2.9%) |
| Material Moving | 149 (78.0%) | 42 (22.0%) |
| Total (Category) | 807 (88.7%) | 103 (11.3%) |
| Total (Overall) | 3,511 (57.5%) | 2,600 (42.5%) |
Employment Industries by Sex in Middle Valley
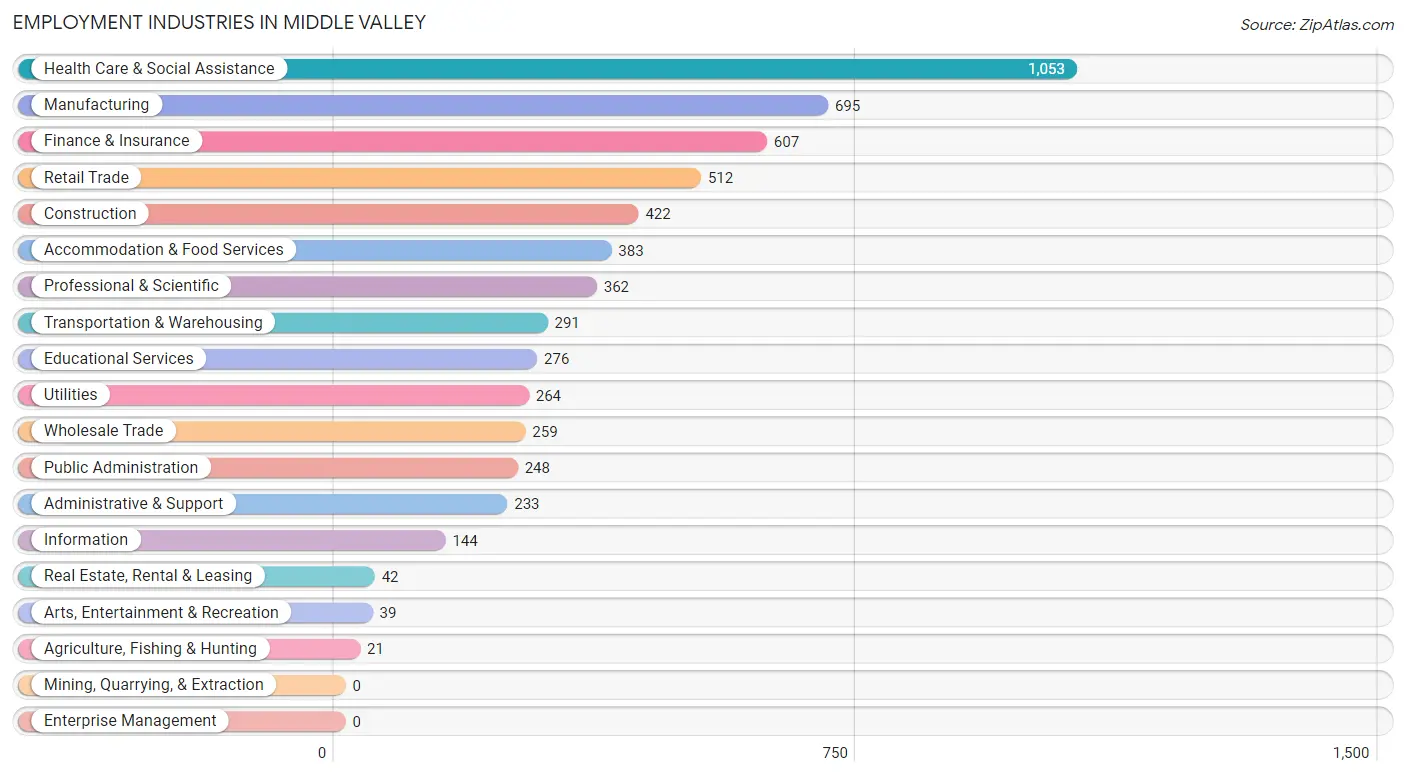
Employment Industries in Middle Valley
The major employment industries in Middle Valley include Health Care & Social Assistance (1,053 | 17.2%), Manufacturing (695 | 11.4%), Finance & Insurance (607 | 9.9%), Retail Trade (512 | 8.4%), and Construction (422 | 6.9%).
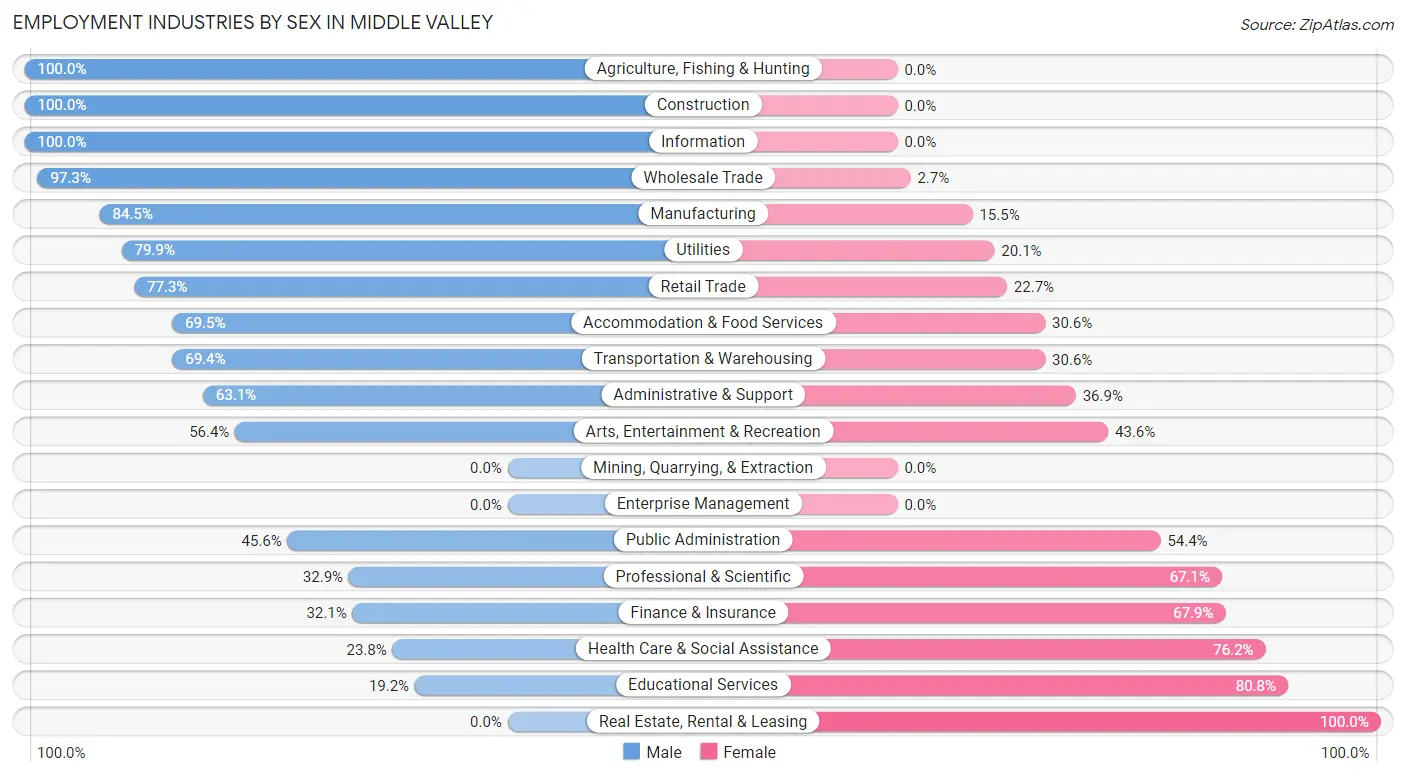
Employment Industries by Sex in Middle Valley
The Middle Valley industries that see more men than women are Agriculture, Fishing & Hunting (100.0%), Construction (100.0%), and Information (100.0%), whereas the industries that tend to have a higher number of women are Real Estate, Rental & Leasing (100.0%), Educational Services (80.8%), and Health Care & Social Assistance (76.2%).
| Industry | Male | Female |
| Agriculture, Fishing & Hunting | 21 (100.0%) | 0 (0.0%) |
| Mining, Quarrying, & Extraction | 0 (0.0%) | 0 (0.0%) |
| Construction | 422 (100.0%) | 0 (0.0%) |
| Manufacturing | 587 (84.5%) | 108 (15.5%) |
| Wholesale Trade | 252 (97.3%) | 7 (2.7%) |
| Retail Trade | 396 (77.3%) | 116 (22.7%) |
| Transportation & Warehousing | 202 (69.4%) | 89 (30.6%) |
| Utilities | 211 (79.9%) | 53 (20.1%) |
| Information | 144 (100.0%) | 0 (0.0%) |
| Finance & Insurance | 195 (32.1%) | 412 (67.9%) |
| Real Estate, Rental & Leasing | 0 (0.0%) | 42 (100.0%) |
| Professional & Scientific | 119 (32.9%) | 243 (67.1%) |
| Enterprise Management | 0 (0.0%) | 0 (0.0%) |
| Administrative & Support | 147 (63.1%) | 86 (36.9%) |
| Educational Services | 53 (19.2%) | 223 (80.8%) |
| Health Care & Social Assistance | 251 (23.8%) | 802 (76.2%) |
| Arts, Entertainment & Recreation | 22 (56.4%) | 17 (43.6%) |
| Accommodation & Food Services | 266 (69.5%) | 117 (30.5%) |
| Public Administration | 113 (45.6%) | 135 (54.4%) |
| Total | 3,511 (57.5%) | 2,600 (42.5%) |
Education in Middle Valley
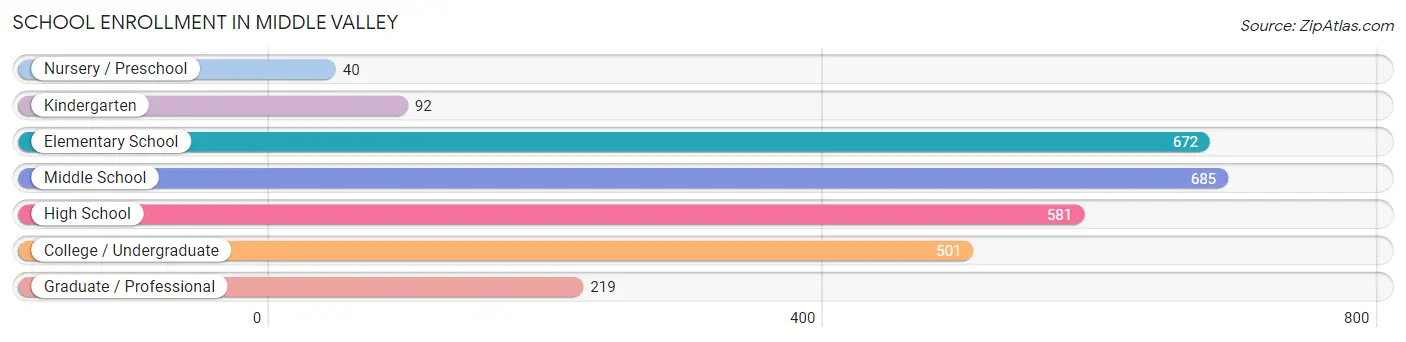
School Enrollment in Middle Valley
The most common levels of schooling among the 2,790 students in Middle Valley are middle school (685 | 24.5%), elementary school (672 | 24.1%), and high school (581 | 20.8%).
| School Level | # Students | % Students |
| Nursery / Preschool | 40 | 1.4% |
| Kindergarten | 92 | 3.3% |
| Elementary School | 672 | 24.1% |
| Middle School | 685 | 24.5% |
| High School | 581 | 20.8% |
| College / Undergraduate | 501 | 18.0% |
| Graduate / Professional | 219 | 7.9% |
| Total | 2,790 | 100.0% |
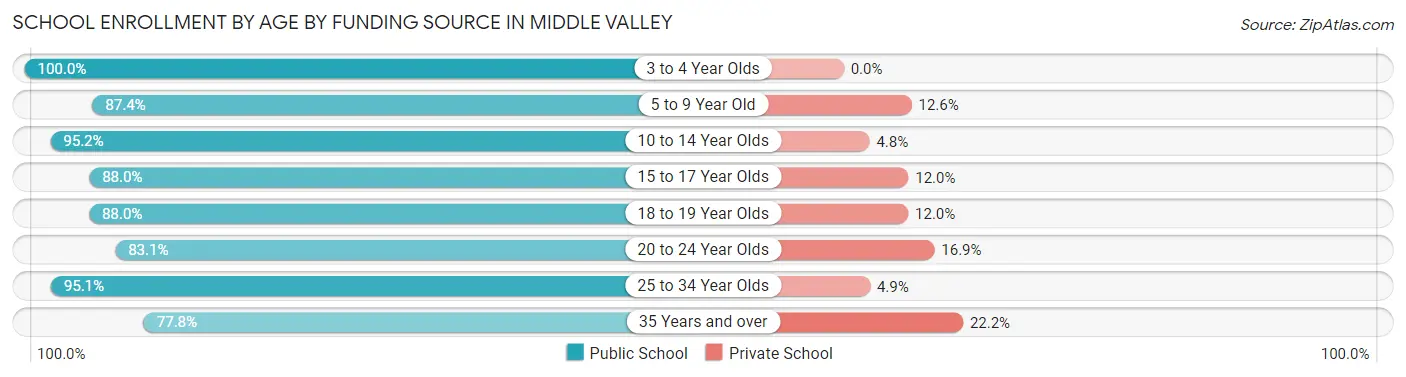
School Enrollment by Age by Funding Source in Middle Valley
Out of a total of 2,790 students who are enrolled in schools in Middle Valley, 282 (10.1%) attend a private institution, while the remaining 2,508 (89.9%) are enrolled in public schools. The age group of 35 years and over has the highest likelihood of being enrolled in private schools, with 30 (22.2% in the age bracket) enrolled. Conversely, the age group of 3 to 4 year olds has the lowest likelihood of being enrolled in a private school, with 40 (100.0% in the age bracket) attending a public institution.
| Age Bracket | Public School | Private School |
| 3 to 4 Year Olds | 40 (100.0%) | 0 (0.0%) |
| 5 to 9 Year Old | 608 (87.4%) | 88 (12.6%) |
| 10 to 14 Year Olds | 853 (95.2%) | 43 (4.8%) |
| 15 to 17 Year Olds | 380 (88.0%) | 52 (12.0%) |
| 18 to 19 Year Olds | 44 (88.0%) | 6 (12.0%) |
| 20 to 24 Year Olds | 246 (83.1%) | 50 (16.9%) |
| 25 to 34 Year Olds | 233 (95.1%) | 12 (4.9%) |
| 35 Years and over | 105 (77.8%) | 30 (22.2%) |
| Total | 2,508 (89.9%) | 282 (10.1%) |
Educational Attainment by Field of Study in Middle Valley
Business (827 | 28.5%), education (340 | 11.7%), engineering (300 | 10.3%), arts & humanities (288 | 9.9%), and science & technology (287 | 9.9%) are the most common fields of study among 2,904 individuals in Middle Valley who have obtained a bachelor's degree or higher.
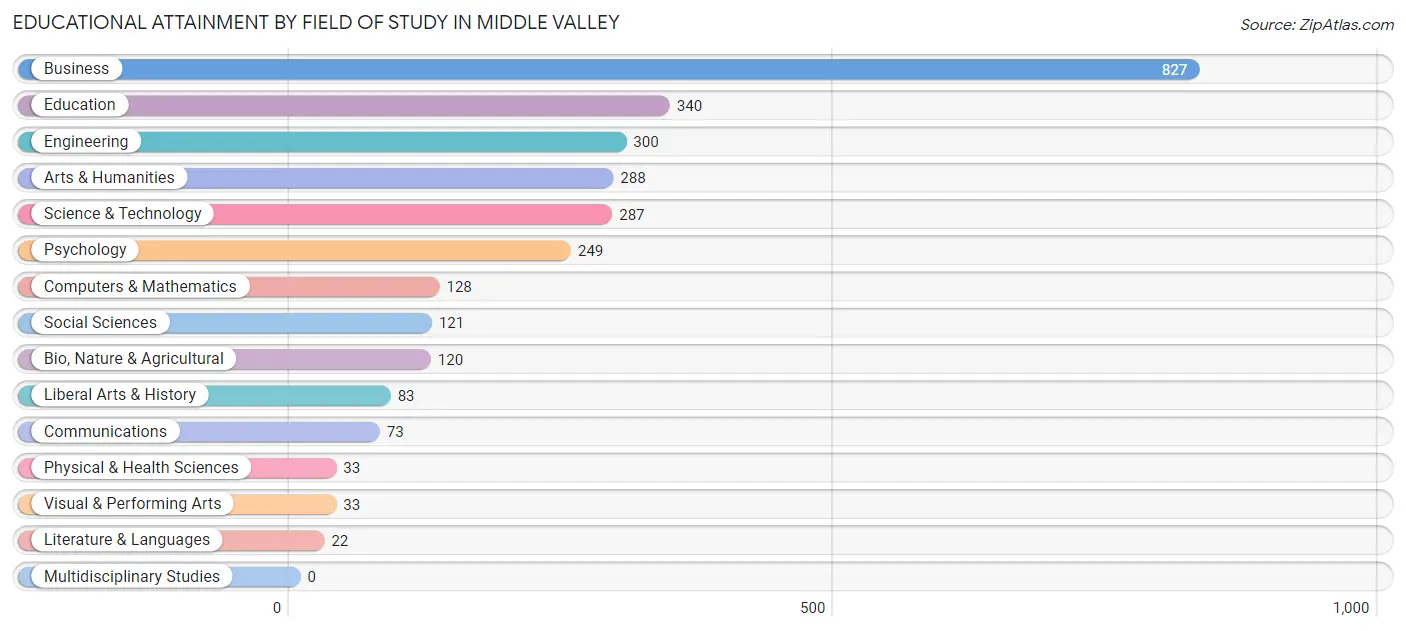
| Field of Study | # Graduates | % Graduates |
| Computers & Mathematics | 128 | 4.4% |
| Bio, Nature & Agricultural | 120 | 4.1% |
| Physical & Health Sciences | 33 | 1.1% |
| Psychology | 249 | 8.6% |
| Social Sciences | 121 | 4.2% |
| Engineering | 300 | 10.3% |
| Multidisciplinary Studies | 0 | 0.0% |
| Science & Technology | 287 | 9.9% |
| Business | 827 | 28.5% |
| Education | 340 | 11.7% |
| Literature & Languages | 22 | 0.8% |
| Liberal Arts & History | 83 | 2.9% |
| Visual & Performing Arts | 33 | 1.1% |
| Communications | 73 | 2.5% |
| Arts & Humanities | 288 | 9.9% |
| Total | 2,904 | 100.0% |
Transportation & Commute in Middle Valley
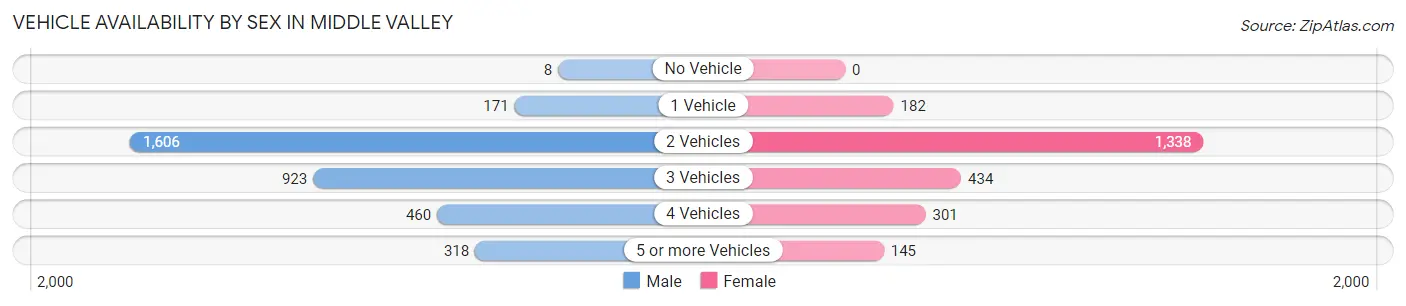
Vehicle Availability by Sex in Middle Valley
The most prevalent vehicle ownership categories in Middle Valley are males with 2 vehicles (1,606, accounting for 46.1%) and females with 2 vehicles (1,338, making up 66.9%).
| Vehicles Available | Male | Female |
| No Vehicle | 8 (0.2%) | 0 (0.0%) |
| 1 Vehicle | 171 (4.9%) | 182 (7.6%) |
| 2 Vehicles | 1,606 (46.1%) | 1,338 (55.7%) |
| 3 Vehicles | 923 (26.5%) | 434 (18.1%) |
| 4 Vehicles | 460 (13.2%) | 301 (12.5%) |
| 5 or more Vehicles | 318 (9.1%) | 145 (6.0%) |
| Total | 3,486 (100.0%) | 2,400 (100.0%) |
Commute Time in Middle Valley
The most frequently occuring commute durations in Middle Valley are 30 to 34 minutes (1,103 commuters, 21.6%), 20 to 24 minutes (905 commuters, 17.7%), and 15 to 19 minutes (806 commuters, 15.8%).
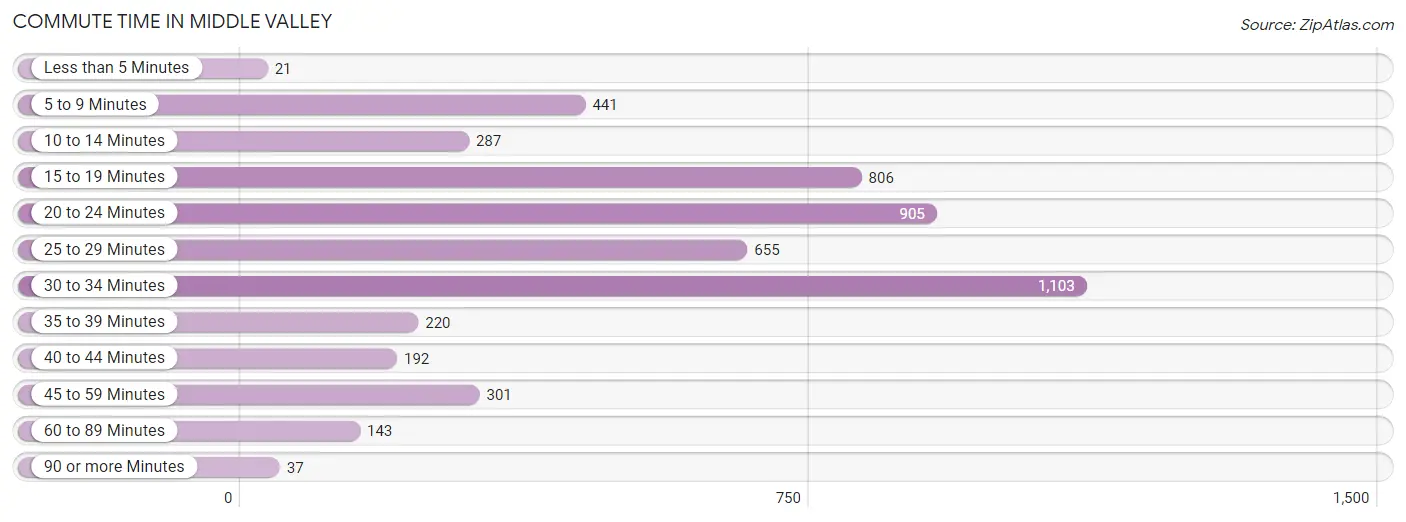
| Commute Time | # Commuters | % Commuters |
| Less than 5 Minutes | 21 | 0.4% |
| 5 to 9 Minutes | 441 | 8.6% |
| 10 to 14 Minutes | 287 | 5.6% |
| 15 to 19 Minutes | 806 | 15.8% |
| 20 to 24 Minutes | 905 | 17.7% |
| 25 to 29 Minutes | 655 | 12.8% |
| 30 to 34 Minutes | 1,103 | 21.6% |
| 35 to 39 Minutes | 220 | 4.3% |
| 40 to 44 Minutes | 192 | 3.8% |
| 45 to 59 Minutes | 301 | 5.9% |
| 60 to 89 Minutes | 143 | 2.8% |
| 90 or more Minutes | 37 | 0.7% |
Commute Time by Sex in Middle Valley
The most common commute times in Middle Valley are 20 to 24 minutes (575 commuters, 17.9%) for males and 30 to 34 minutes (582 commuters, 30.7%) for females.
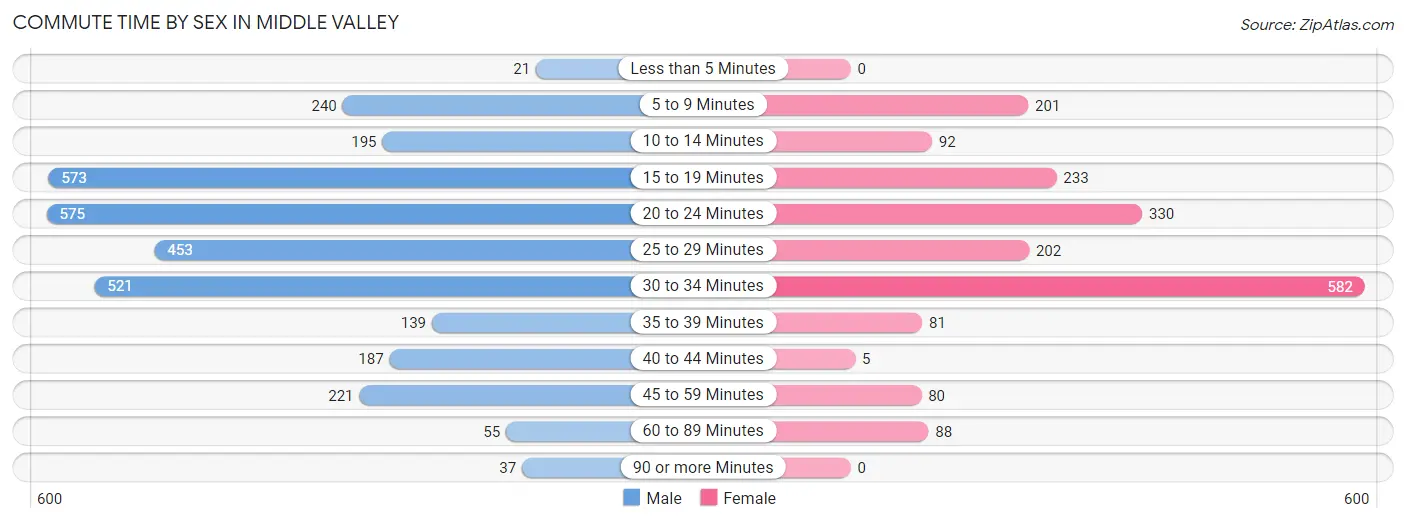
| Commute Time | Male | Female |
| Less than 5 Minutes | 21 (0.6%) | 0 (0.0%) |
| 5 to 9 Minutes | 240 (7.5%) | 201 (10.6%) |
| 10 to 14 Minutes | 195 (6.1%) | 92 (4.9%) |
| 15 to 19 Minutes | 573 (17.8%) | 233 (12.3%) |
| 20 to 24 Minutes | 575 (17.9%) | 330 (17.4%) |
| 25 to 29 Minutes | 453 (14.1%) | 202 (10.7%) |
| 30 to 34 Minutes | 521 (16.2%) | 582 (30.7%) |
| 35 to 39 Minutes | 139 (4.3%) | 81 (4.3%) |
| 40 to 44 Minutes | 187 (5.8%) | 5 (0.3%) |
| 45 to 59 Minutes | 221 (6.9%) | 80 (4.2%) |
| 60 to 89 Minutes | 55 (1.7%) | 88 (4.6%) |
| 90 or more Minutes | 37 (1.1%) | 0 (0.0%) |
Time of Departure to Work by Sex in Middle Valley
The most frequent times of departure to work in Middle Valley are 7:00 AM to 7:29 AM (510, 15.9%) for males and 7:00 AM to 7:29 AM (332, 17.5%) for females.
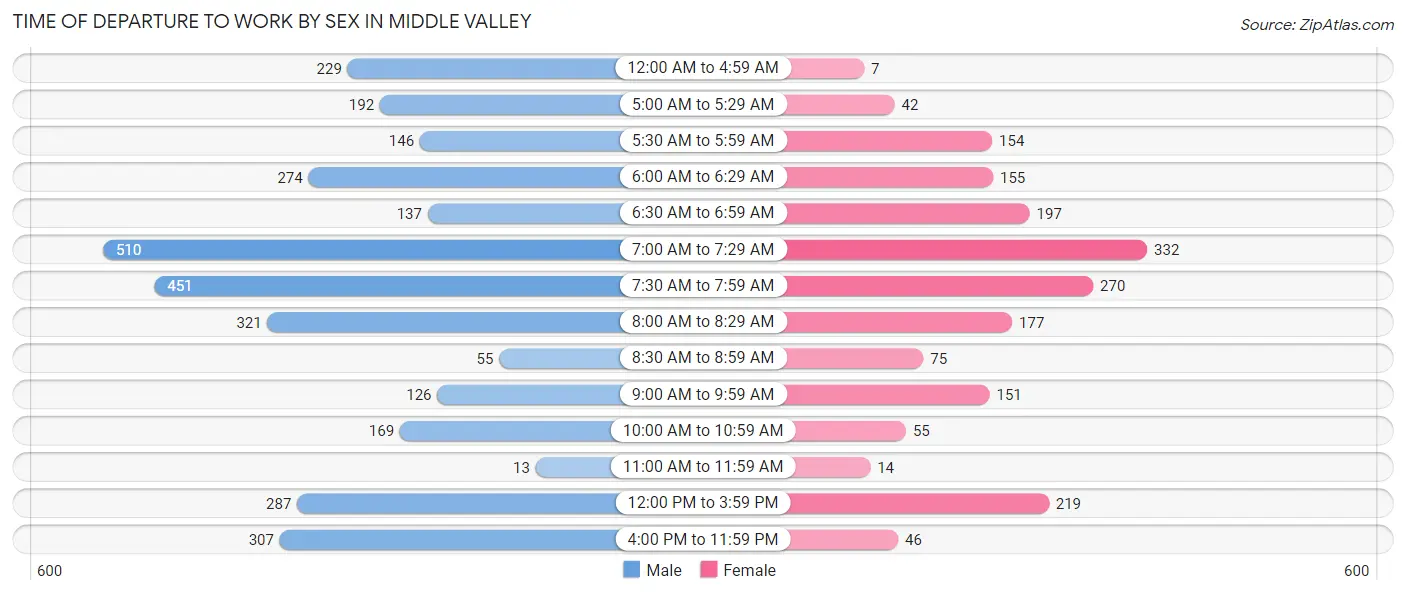
| Time of Departure | Male | Female |
| 12:00 AM to 4:59 AM | 229 (7.1%) | 7 (0.4%) |
| 5:00 AM to 5:29 AM | 192 (6.0%) | 42 (2.2%) |
| 5:30 AM to 5:59 AM | 146 (4.5%) | 154 (8.1%) |
| 6:00 AM to 6:29 AM | 274 (8.5%) | 155 (8.2%) |
| 6:30 AM to 6:59 AM | 137 (4.3%) | 197 (10.4%) |
| 7:00 AM to 7:29 AM | 510 (15.9%) | 332 (17.5%) |
| 7:30 AM to 7:59 AM | 451 (14.0%) | 270 (14.3%) |
| 8:00 AM to 8:29 AM | 321 (10.0%) | 177 (9.3%) |
| 8:30 AM to 8:59 AM | 55 (1.7%) | 75 (4.0%) |
| 9:00 AM to 9:59 AM | 126 (3.9%) | 151 (8.0%) |
| 10:00 AM to 10:59 AM | 169 (5.2%) | 55 (2.9%) |
| 11:00 AM to 11:59 AM | 13 (0.4%) | 14 (0.7%) |
| 12:00 PM to 3:59 PM | 287 (8.9%) | 219 (11.6%) |
| 4:00 PM to 11:59 PM | 307 (9.5%) | 46 (2.4%) |
| Total | 3,217 (100.0%) | 1,894 (100.0%) |
Housing Occupancy in Middle Valley
Occupancy by Ownership in Middle Valley
Of the total 4,349 dwellings in Middle Valley, owner-occupied units account for 3,564 (82.0%), while renter-occupied units make up 785 (18.0%).
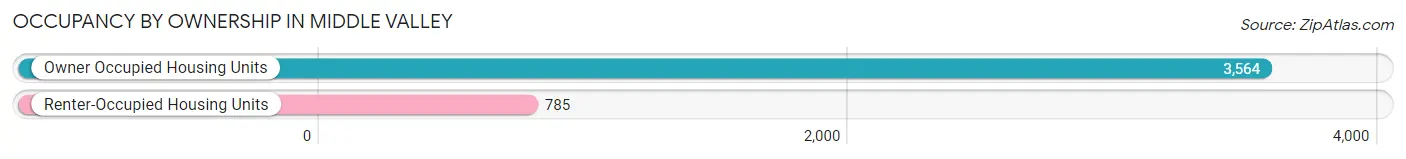
| Occupancy | # Housing Units | % Housing Units |
| Owner Occupied Housing Units | 3,564 | 82.0% |
| Renter-Occupied Housing Units | 785 | 18.0% |
| Total Occupied Housing Units | 4,349 | 100.0% |
Occupancy by Household Size in Middle Valley
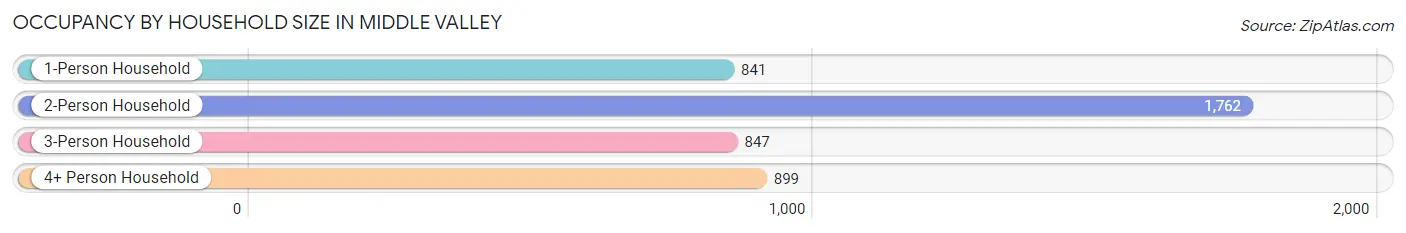
| Household Size | # Housing Units | % Housing Units |
| 1-Person Household | 841 | 19.3% |
| 2-Person Household | 1,762 | 40.5% |
| 3-Person Household | 847 | 19.5% |
| 4+ Person Household | 899 | 20.7% |
| Total Housing Units | 4,349 | 100.0% |
Occupancy by Ownership by Household Size in Middle Valley
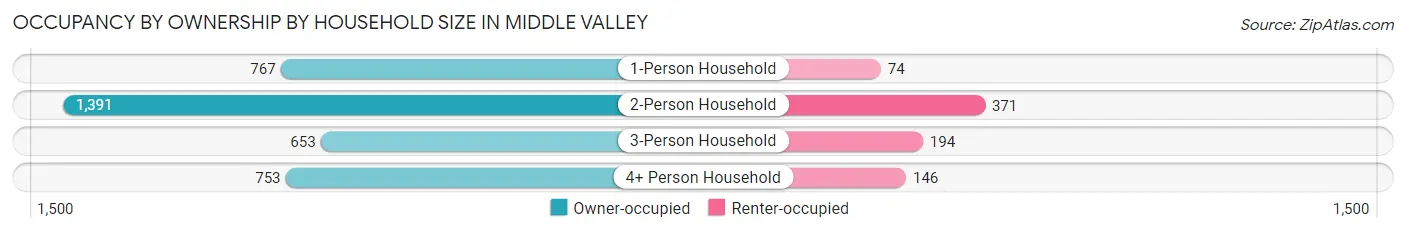
| Household Size | Owner-occupied | Renter-occupied |
| 1-Person Household | 767 (91.2%) | 74 (8.8%) |
| 2-Person Household | 1,391 (78.9%) | 371 (21.1%) |
| 3-Person Household | 653 (77.1%) | 194 (22.9%) |
| 4+ Person Household | 753 (83.8%) | 146 (16.2%) |
| Total Housing Units | 3,564 (82.0%) | 785 (18.0%) |
Occupancy by Educational Attainment in Middle Valley
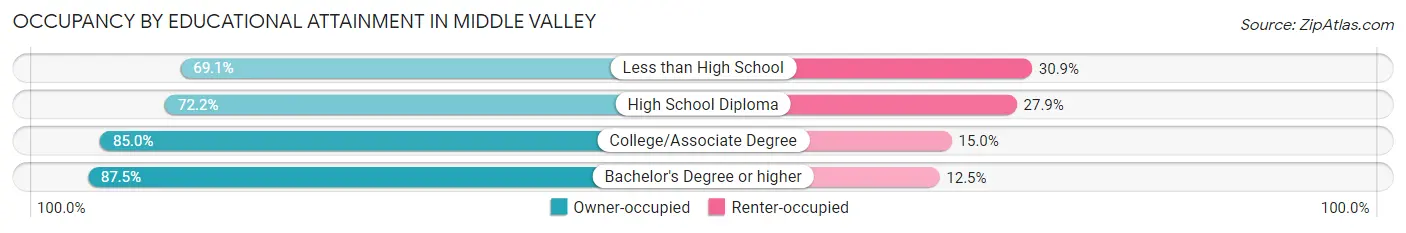
| Household Size | Owner-occupied | Renter-occupied |
| Less than High School | 206 (69.1%) | 92 (30.9%) |
| High School Diploma | 697 (72.2%) | 269 (27.9%) |
| College/Associate Degree | 1,307 (85.0%) | 230 (15.0%) |
| Bachelor's Degree or higher | 1,354 (87.5%) | 194 (12.5%) |
Occupancy by Age of Householder in Middle Valley
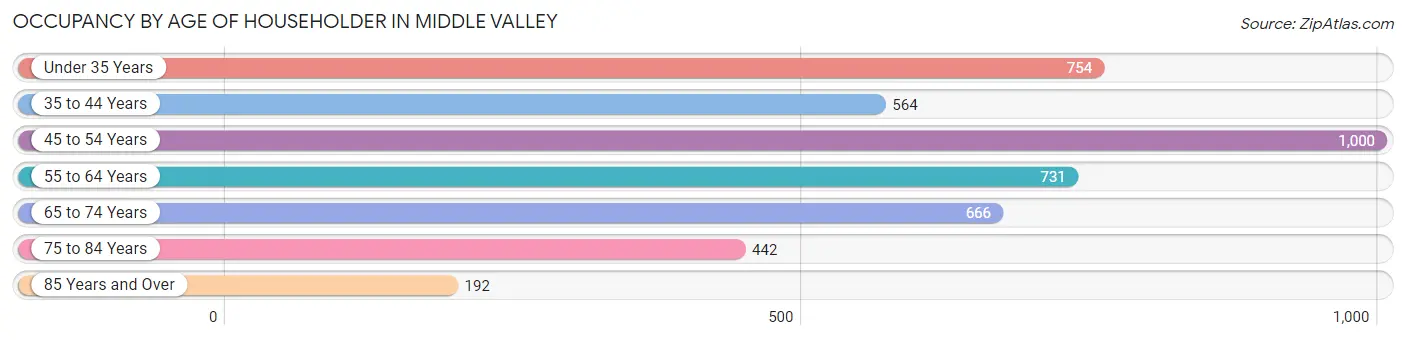
| Age Bracket | # Households | % Households |
| Under 35 Years | 754 | 17.3% |
| 35 to 44 Years | 564 | 13.0% |
| 45 to 54 Years | 1,000 | 23.0% |
| 55 to 64 Years | 731 | 16.8% |
| 65 to 74 Years | 666 | 15.3% |
| 75 to 84 Years | 442 | 10.2% |
| 85 Years and Over | 192 | 4.4% |
| Total | 4,349 | 100.0% |
Housing Finances in Middle Valley
Median Income by Occupancy in Middle Valley
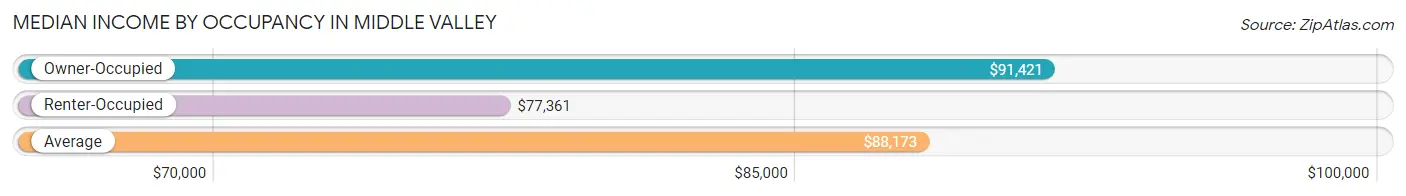
| Occupancy Type | # Households | Median Income |
| Owner-Occupied | 3,564 (82.0%) | $91,421 |
| Renter-Occupied | 785 (18.0%) | $77,361 |
| Average | 4,349 (100.0%) | $88,173 |
Occupancy by Householder Income Bracket in Middle Valley
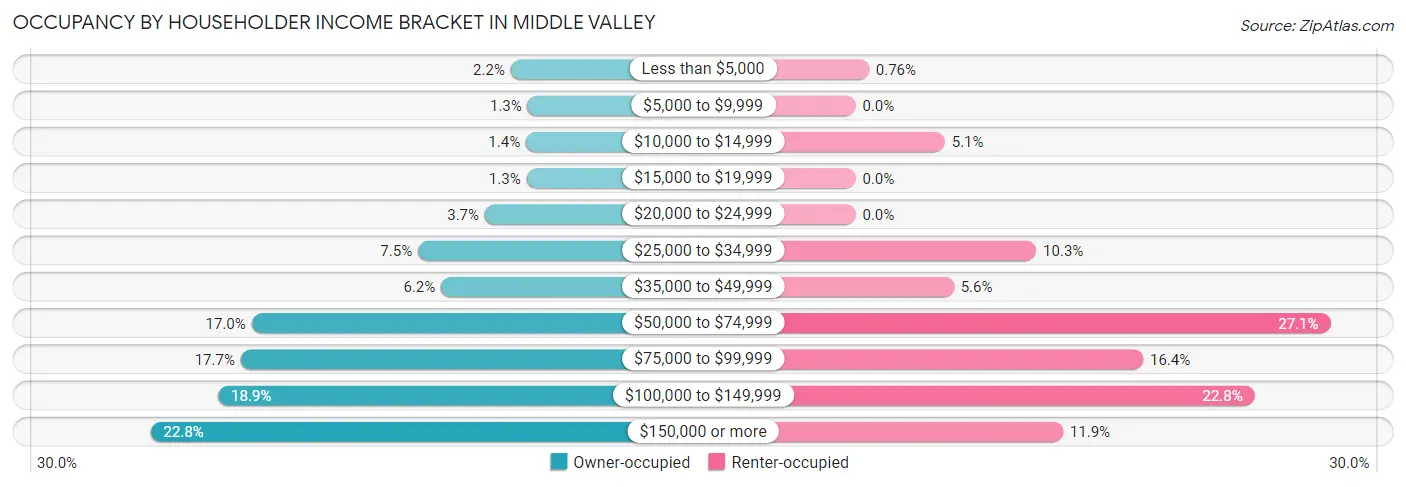
| Income Bracket | Owner-occupied | Renter-occupied |
| Less than $5,000 | 79 (2.2%) | 6 (0.8%) |
| $5,000 to $9,999 | 45 (1.3%) | 0 (0.0%) |
| $10,000 to $14,999 | 48 (1.3%) | 40 (5.1%) |
| $15,000 to $19,999 | 47 (1.3%) | 0 (0.0%) |
| $20,000 to $24,999 | 132 (3.7%) | 0 (0.0%) |
| $25,000 to $34,999 | 268 (7.5%) | 81 (10.3%) |
| $35,000 to $49,999 | 221 (6.2%) | 44 (5.6%) |
| $50,000 to $74,999 | 607 (17.0%) | 213 (27.1%) |
| $75,000 to $99,999 | 629 (17.6%) | 129 (16.4%) |
| $100,000 to $149,999 | 675 (18.9%) | 179 (22.8%) |
| $150,000 or more | 813 (22.8%) | 93 (11.8%) |
| Total | 3,564 (100.0%) | 785 (100.0%) |
Monthly Housing Cost Tiers in Middle Valley
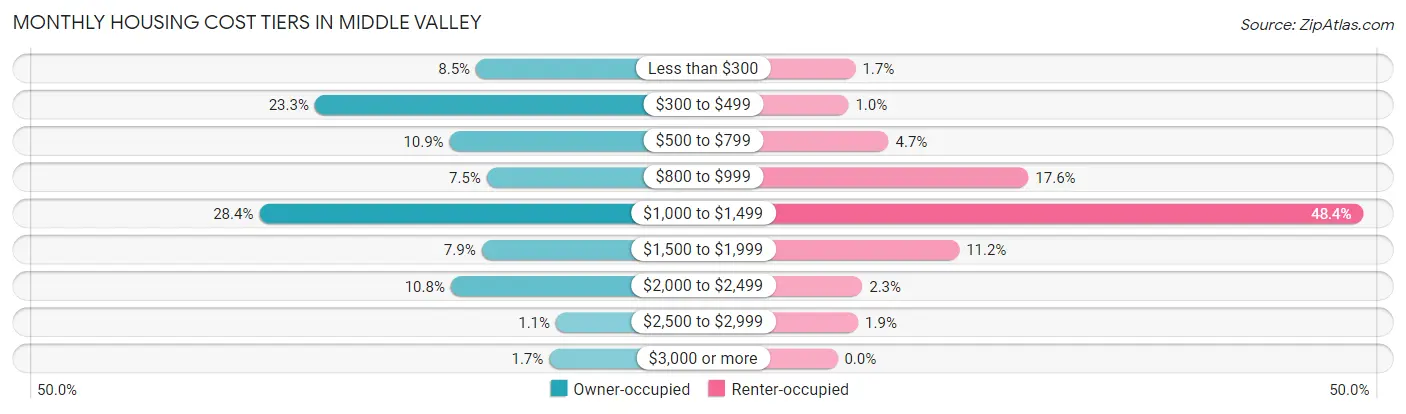
| Monthly Cost | Owner-occupied | Renter-occupied |
| Less than $300 | 301 (8.5%) | 13 (1.7%) |
| $300 to $499 | 830 (23.3%) | 8 (1.0%) |
| $500 to $799 | 388 (10.9%) | 37 (4.7%) |
| $800 to $999 | 266 (7.5%) | 138 (17.6%) |
| $1,000 to $1,499 | 1,012 (28.4%) | 380 (48.4%) |
| $1,500 to $1,999 | 283 (7.9%) | 88 (11.2%) |
| $2,000 to $2,499 | 384 (10.8%) | 18 (2.3%) |
| $2,500 to $2,999 | 39 (1.1%) | 15 (1.9%) |
| $3,000 or more | 61 (1.7%) | 0 (0.0%) |
| Total | 3,564 (100.0%) | 785 (100.0%) |
Physical Housing Characteristics in Middle Valley
Housing Structures in Middle Valley
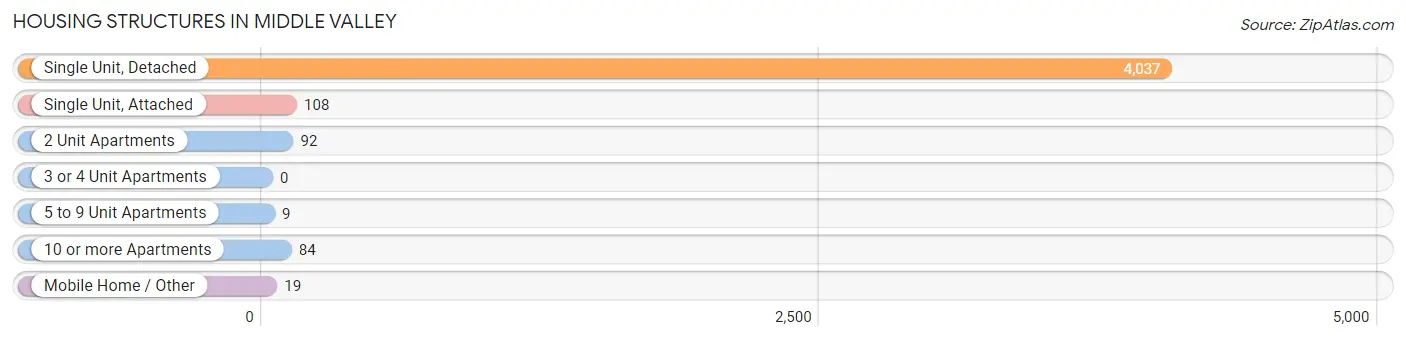
| Structure Type | # Housing Units | % Housing Units |
| Single Unit, Detached | 4,037 | 92.8% |
| Single Unit, Attached | 108 | 2.5% |
| 2 Unit Apartments | 92 | 2.1% |
| 3 or 4 Unit Apartments | 0 | 0.0% |
| 5 to 9 Unit Apartments | 9 | 0.2% |
| 10 or more Apartments | 84 | 1.9% |
| Mobile Home / Other | 19 | 0.4% |
| Total | 4,349 | 100.0% |
Housing Structures by Occupancy in Middle Valley
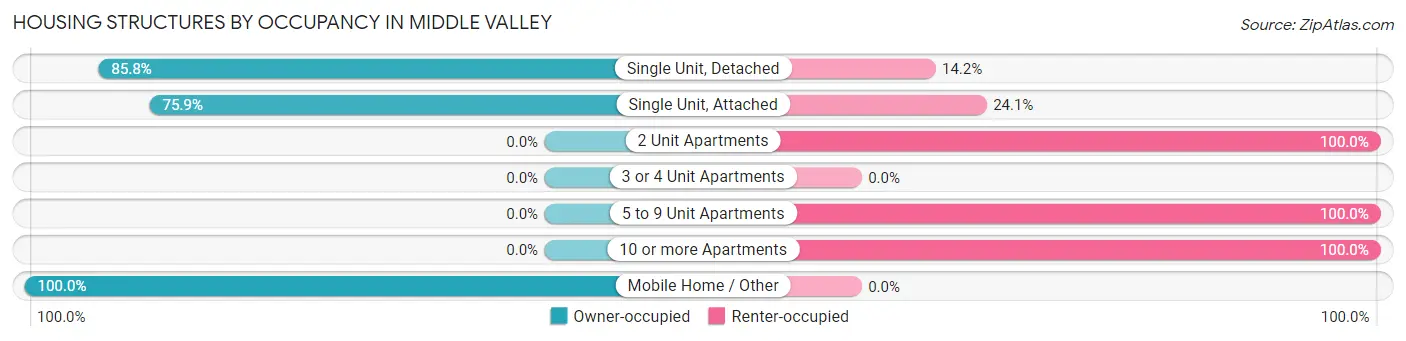
| Structure Type | Owner-occupied | Renter-occupied |
| Single Unit, Detached | 3,463 (85.8%) | 574 (14.2%) |
| Single Unit, Attached | 82 (75.9%) | 26 (24.1%) |
| 2 Unit Apartments | 0 (0.0%) | 92 (100.0%) |
| 3 or 4 Unit Apartments | 0 (0.0%) | 0 (0.0%) |
| 5 to 9 Unit Apartments | 0 (0.0%) | 9 (100.0%) |
| 10 or more Apartments | 0 (0.0%) | 84 (100.0%) |
| Mobile Home / Other | 19 (100.0%) | 0 (0.0%) |
| Total | 3,564 (82.0%) | 785 (18.0%) |
Housing Structures by Number of Rooms in Middle Valley
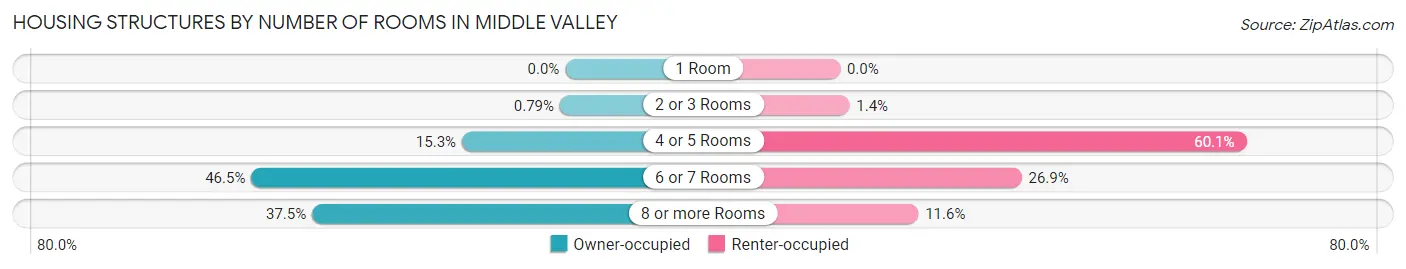
| Number of Rooms | Owner-occupied | Renter-occupied |
| 1 Room | 0 (0.0%) | 0 (0.0%) |
| 2 or 3 Rooms | 28 (0.8%) | 11 (1.4%) |
| 4 or 5 Rooms | 545 (15.3%) | 472 (60.1%) |
| 6 or 7 Rooms | 1,656 (46.5%) | 211 (26.9%) |
| 8 or more Rooms | 1,335 (37.5%) | 91 (11.6%) |
| Total | 3,564 (100.0%) | 785 (100.0%) |
Housing Structure by Heating Type in Middle Valley
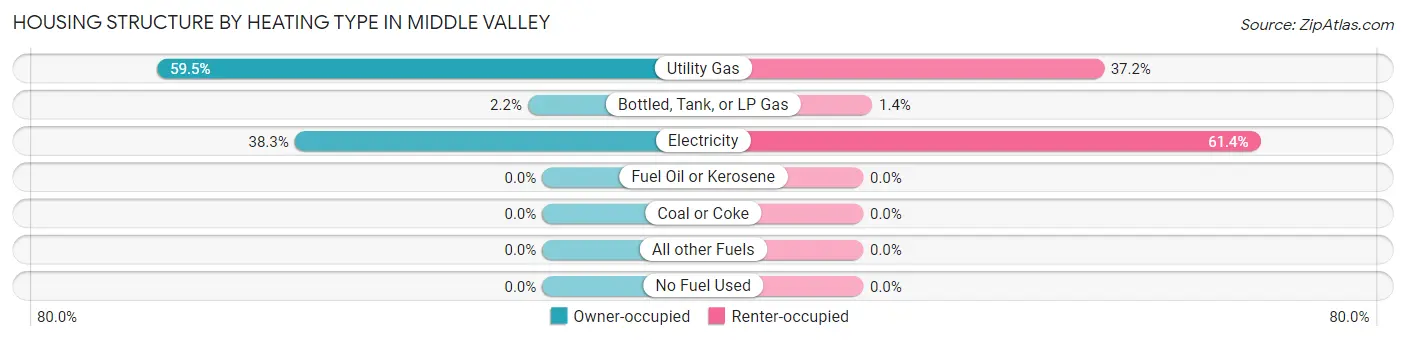
| Heating Type | Owner-occupied | Renter-occupied |
| Utility Gas | 2,121 (59.5%) | 292 (37.2%) |
| Bottled, Tank, or LP Gas | 79 (2.2%) | 11 (1.4%) |
| Electricity | 1,364 (38.3%) | 482 (61.4%) |
| Fuel Oil or Kerosene | 0 (0.0%) | 0 (0.0%) |
| Coal or Coke | 0 (0.0%) | 0 (0.0%) |
| All other Fuels | 0 (0.0%) | 0 (0.0%) |
| No Fuel Used | 0 (0.0%) | 0 (0.0%) |
| Total | 3,564 (100.0%) | 785 (100.0%) |
Household Vehicle Usage in Middle Valley
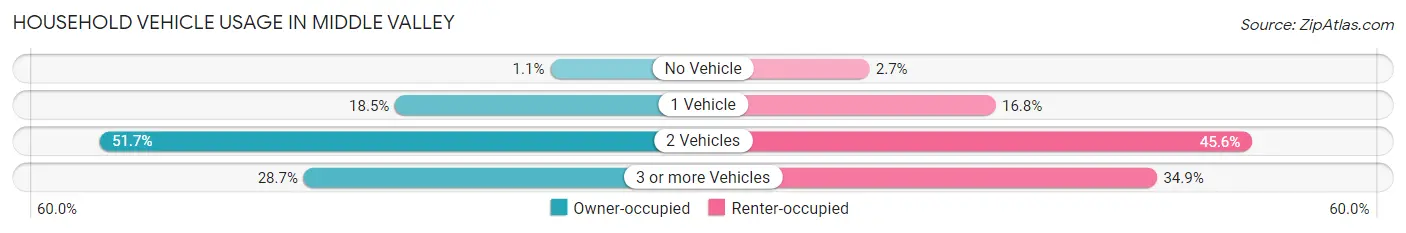
| Vehicles per Household | Owner-occupied | Renter-occupied |
| No Vehicle | 40 (1.1%) | 21 (2.7%) |
| 1 Vehicle | 659 (18.5%) | 132 (16.8%) |
| 2 Vehicles | 1,841 (51.7%) | 358 (45.6%) |
| 3 or more Vehicles | 1,024 (28.7%) | 274 (34.9%) |
| Total | 3,564 (100.0%) | 785 (100.0%) |
Real Estate & Mortgages in Middle Valley
Real Estate and Mortgage Overview in Middle Valley
| Characteristic | Without Mortgage | With Mortgage |
| Housing Units | 1,431 | 2,133 |
| Median Property Value | $233,600 | $247,500 |
| Median Household Income | $88,125 | $583 |
| Monthly Housing Costs | $411 | $61 |
| Real Estate Taxes | $1,264 | $32 |
Property Value by Mortgage Status in Middle Valley
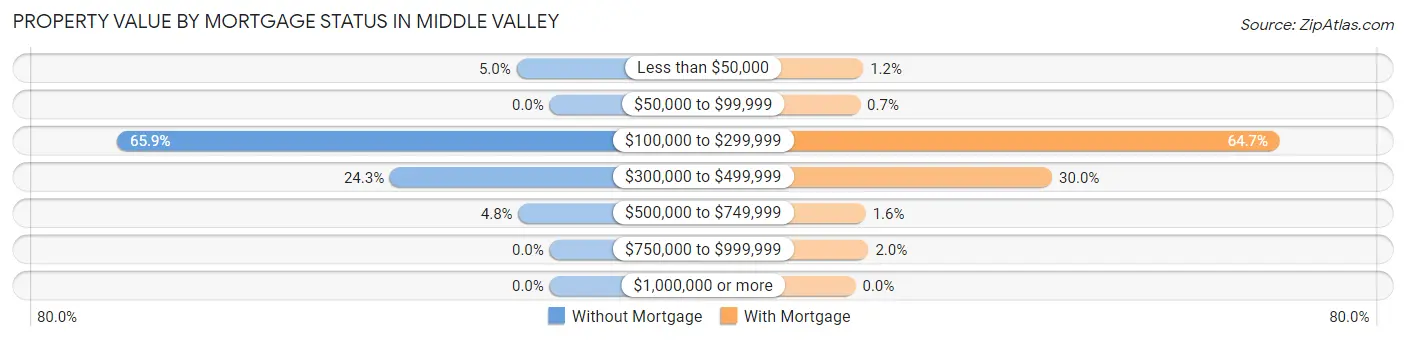
| Property Value | Without Mortgage | With Mortgage |
| Less than $50,000 | 72 (5.0%) | 25 (1.2%) |
| $50,000 to $99,999 | 0 (0.0%) | 15 (0.7%) |
| $100,000 to $299,999 | 943 (65.9%) | 1,379 (64.6%) |
| $300,000 to $499,999 | 348 (24.3%) | 639 (30.0%) |
| $500,000 to $749,999 | 68 (4.8%) | 33 (1.5%) |
| $750,000 to $999,999 | 0 (0.0%) | 42 (2.0%) |
| $1,000,000 or more | 0 (0.0%) | 0 (0.0%) |
| Total | 1,431 (100.0%) | 2,133 (100.0%) |
Household Income by Mortgage Status in Middle Valley
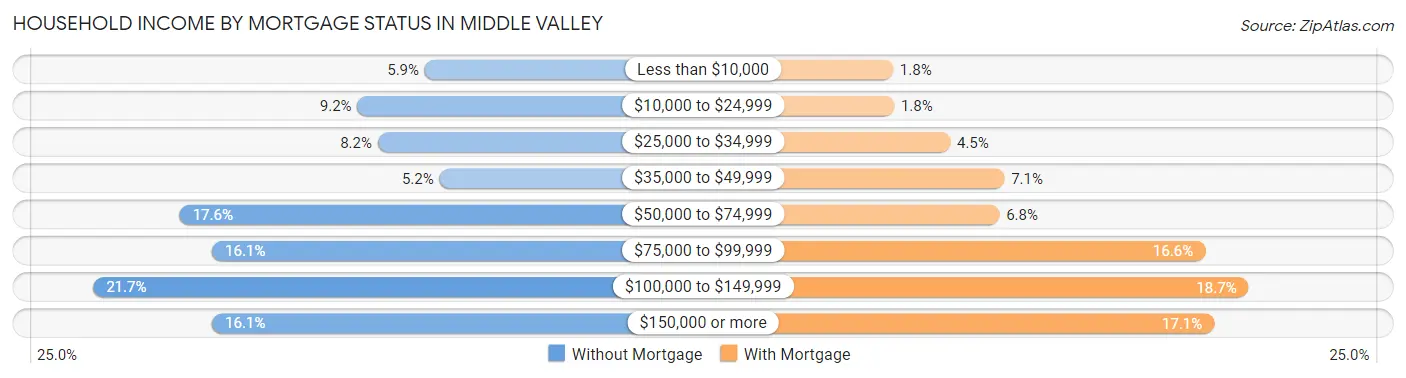
| Household Income | Without Mortgage | With Mortgage |
| Less than $10,000 | 85 (5.9%) | 38 (1.8%) |
| $10,000 to $24,999 | 131 (9.1%) | 39 (1.8%) |
| $25,000 to $34,999 | 117 (8.2%) | 96 (4.5%) |
| $35,000 to $49,999 | 75 (5.2%) | 151 (7.1%) |
| $50,000 to $74,999 | 252 (17.6%) | 146 (6.8%) |
| $75,000 to $99,999 | 230 (16.1%) | 355 (16.6%) |
| $100,000 to $149,999 | 311 (21.7%) | 399 (18.7%) |
| $150,000 or more | 230 (16.1%) | 364 (17.1%) |
| Total | 1,431 (100.0%) | 2,133 (100.0%) |
Property Value to Household Income Ratio in Middle Valley
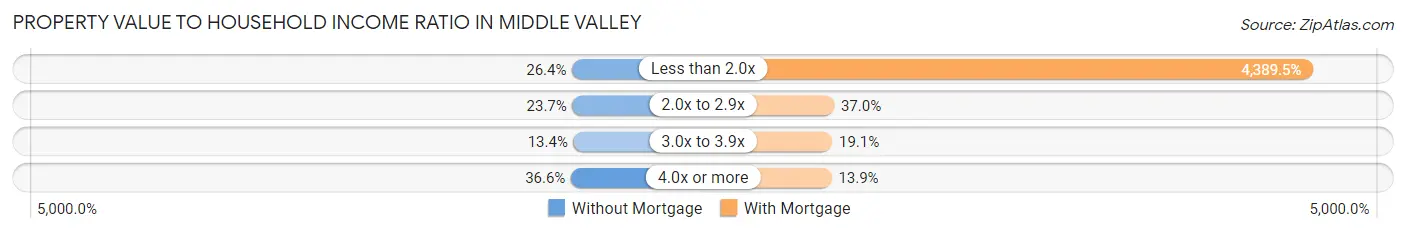
| Value-to-Income Ratio | Without Mortgage | With Mortgage |
| Less than 2.0x | 377 (26.4%) | 93,627 (4,389.5%) |
| 2.0x to 2.9x | 339 (23.7%) | 790 (37.0%) |
| 3.0x to 3.9x | 192 (13.4%) | 407 (19.1%) |
| 4.0x or more | 523 (36.5%) | 296 (13.9%) |
| Total | 1,431 (100.0%) | 2,133 (100.0%) |
Real Estate Taxes by Mortgage Status in Middle Valley
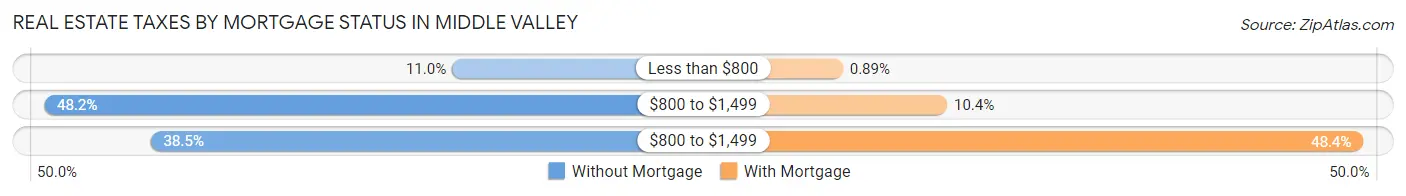
| Property Taxes | Without Mortgage | With Mortgage |
| Less than $800 | 157 (11.0%) | 19 (0.9%) |
| $800 to $1,499 | 690 (48.2%) | 222 (10.4%) |
| $800 to $1,499 | 551 (38.5%) | 1,033 (48.4%) |
| Total | 1,431 (100.0%) | 2,133 (100.0%) |
Health & Disability in Middle Valley
Health Insurance Coverage by Age in Middle Valley
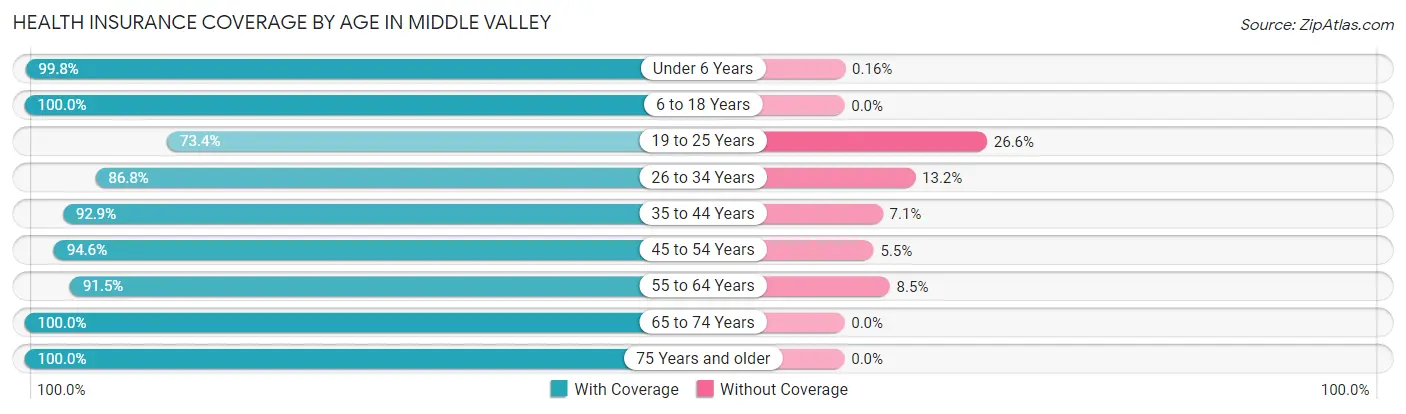
| Age Bracket | With Coverage | Without Coverage |
| Under 6 Years | 627 (99.8%) | 1 (0.2%) |
| 6 to 18 Years | 2,076 (100.0%) | 0 (0.0%) |
| 19 to 25 Years | 671 (73.4%) | 243 (26.6%) |
| 26 to 34 Years | 1,104 (86.8%) | 168 (13.2%) |
| 35 to 44 Years | 1,235 (92.9%) | 95 (7.1%) |
| 45 to 54 Years | 1,875 (94.6%) | 108 (5.4%) |
| 55 to 64 Years | 1,115 (91.5%) | 103 (8.5%) |
| 65 to 74 Years | 1,169 (100.0%) | 0 (0.0%) |
| 75 Years and older | 1,029 (100.0%) | 0 (0.0%) |
| Total | 10,901 (93.8%) | 718 (6.2%) |
Health Insurance Coverage by Citizenship Status in Middle Valley
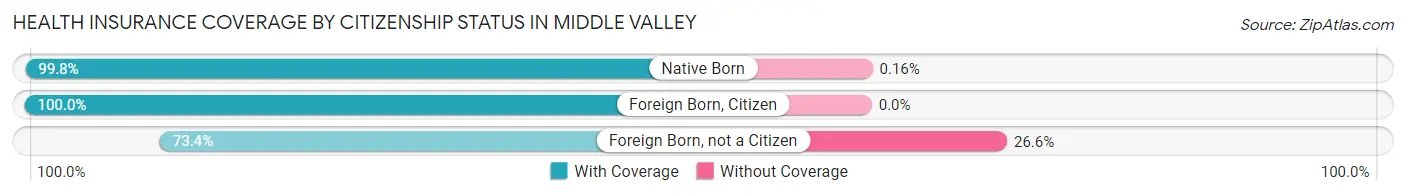
| Citizenship Status | With Coverage | Without Coverage |
| Native Born | 627 (99.8%) | 1 (0.2%) |
| Foreign Born, Citizen | 2,076 (100.0%) | 0 (0.0%) |
| Foreign Born, not a Citizen | 671 (73.4%) | 243 (26.6%) |
Health Insurance Coverage by Household Income in Middle Valley
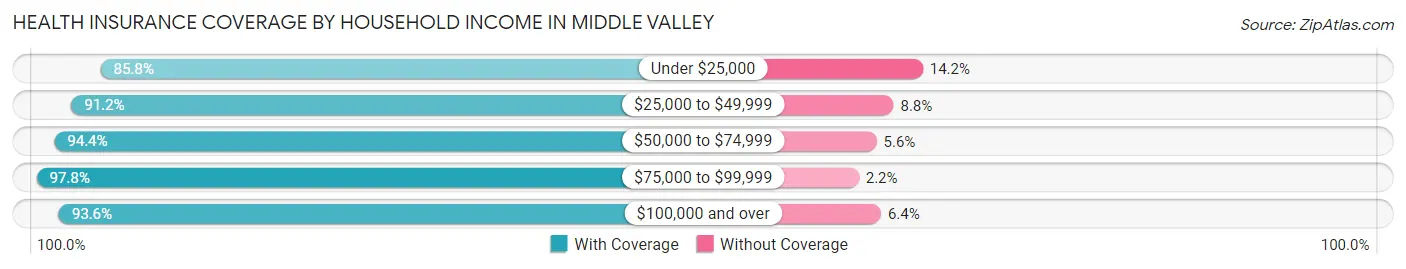
| Household Income | With Coverage | Without Coverage |
| Under $25,000 | 488 (85.8%) | 81 (14.2%) |
| $25,000 to $49,999 | 1,104 (91.2%) | 106 (8.8%) |
| $50,000 to $74,999 | 2,013 (94.4%) | 119 (5.6%) |
| $75,000 to $99,999 | 1,921 (97.8%) | 44 (2.2%) |
| $100,000 and over | 5,375 (93.6%) | 368 (6.4%) |
Public vs Private Health Insurance Coverage by Age in Middle Valley
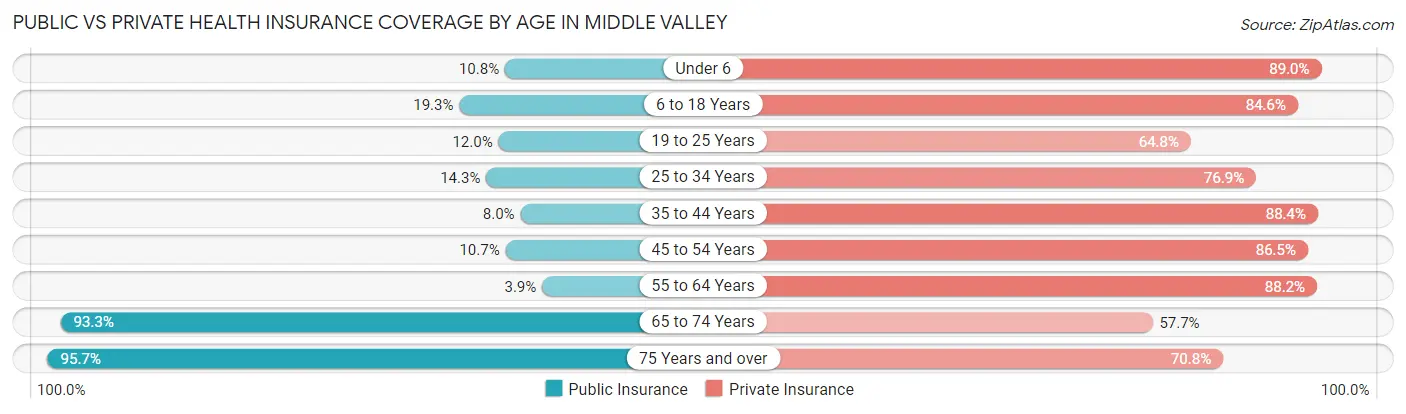
| Age Bracket | Public Insurance | Private Insurance |
| Under 6 | 68 (10.8%) | 559 (89.0%) |
| 6 to 18 Years | 401 (19.3%) | 1,757 (84.6%) |
| 19 to 25 Years | 110 (12.0%) | 592 (64.8%) |
| 25 to 34 Years | 182 (14.3%) | 978 (76.9%) |
| 35 to 44 Years | 106 (8.0%) | 1,175 (88.3%) |
| 45 to 54 Years | 213 (10.7%) | 1,715 (86.5%) |
| 55 to 64 Years | 48 (3.9%) | 1,074 (88.2%) |
| 65 to 74 Years | 1,091 (93.3%) | 674 (57.7%) |
| 75 Years and over | 985 (95.7%) | 728 (70.8%) |
| Total | 3,204 (27.6%) | 9,252 (79.6%) |
Disability Status by Sex by Age in Middle Valley
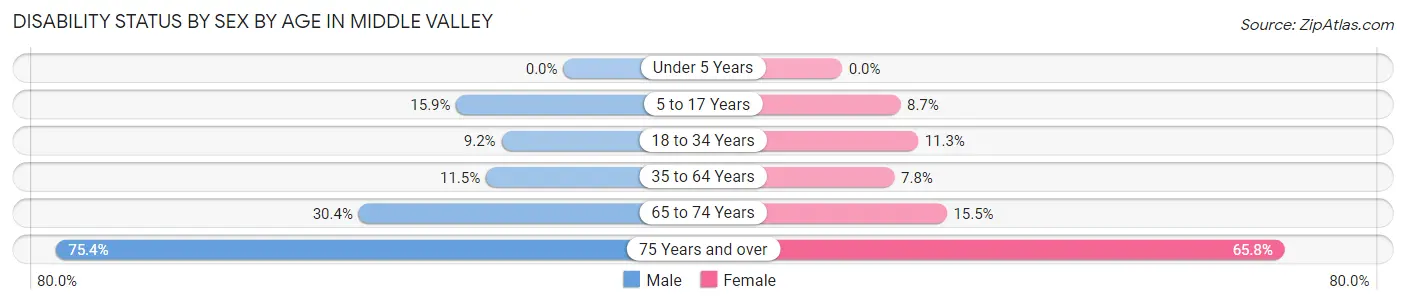
| Age Bracket | Male | Female |
| Under 5 Years | 0 (0.0%) | 0 (0.0%) |
| 5 to 17 Years | 200 (15.9%) | 71 (8.6%) |
| 18 to 34 Years | 114 (9.2%) | 117 (11.3%) |
| 35 to 64 Years | 269 (11.5%) | 170 (7.8%) |
| 65 to 74 Years | 144 (30.4%) | 108 (15.5%) |
| 75 Years and over | 298 (75.4%) | 417 (65.8%) |
Disability Class by Sex by Age in Middle Valley
Disability Class: Hearing Difficulty
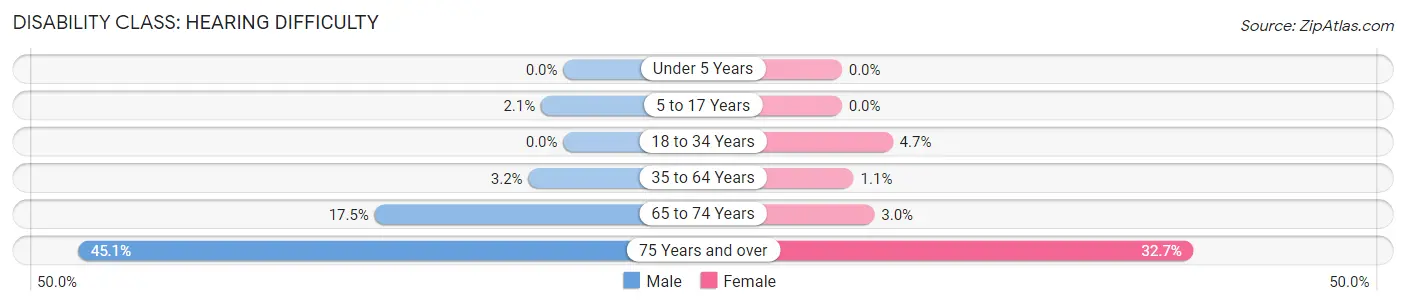
| Age Bracket | Male | Female |
| Under 5 Years | 0 (0.0%) | 0 (0.0%) |
| 5 to 17 Years | 26 (2.1%) | 0 (0.0%) |
| 18 to 34 Years | 0 (0.0%) | 49 (4.7%) |
| 35 to 64 Years | 76 (3.2%) | 24 (1.1%) |
| 65 to 74 Years | 83 (17.5%) | 21 (3.0%) |
| 75 Years and over | 178 (45.1%) | 207 (32.7%) |
Disability Class: Vision Difficulty
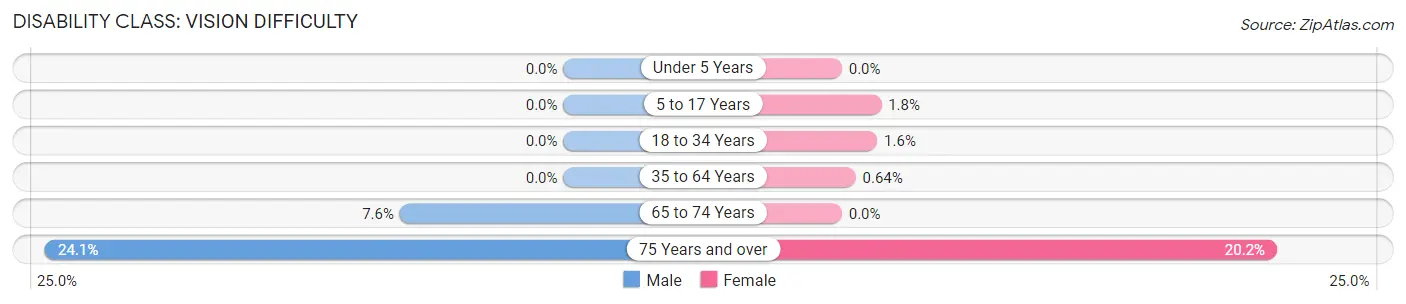
| Age Bracket | Male | Female |
| Under 5 Years | 0 (0.0%) | 0 (0.0%) |
| 5 to 17 Years | 0 (0.0%) | 15 (1.8%) |
| 18 to 34 Years | 0 (0.0%) | 17 (1.6%) |
| 35 to 64 Years | 0 (0.0%) | 14 (0.6%) |
| 65 to 74 Years | 36 (7.6%) | 0 (0.0%) |
| 75 Years and over | 95 (24.0%) | 128 (20.2%) |
Disability Class: Cognitive Difficulty
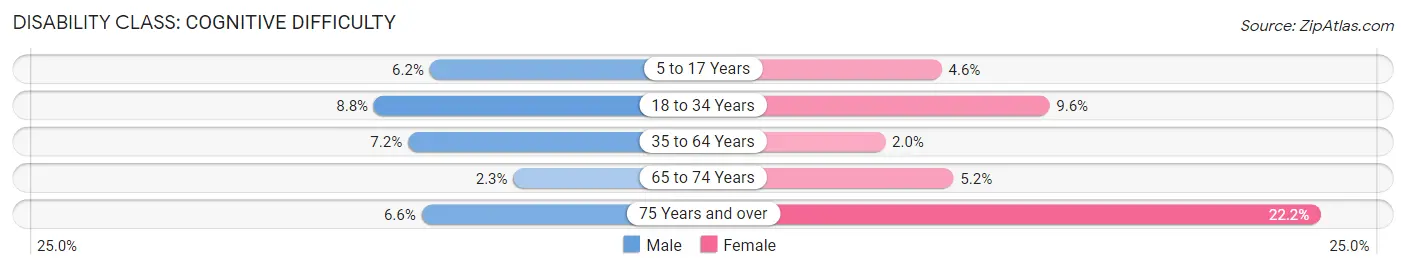
| Age Bracket | Male | Female |
| 5 to 17 Years | 78 (6.2%) | 38 (4.6%) |
| 18 to 34 Years | 109 (8.8%) | 100 (9.6%) |
| 35 to 64 Years | 169 (7.2%) | 44 (2.0%) |
| 65 to 74 Years | 11 (2.3%) | 36 (5.2%) |
| 75 Years and over | 26 (6.6%) | 141 (22.2%) |
Disability Class: Ambulatory Difficulty
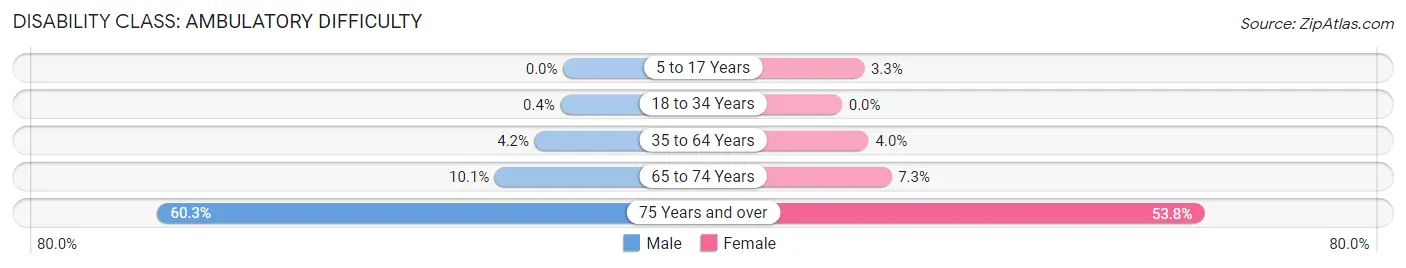
| Age Bracket | Male | Female |
| 5 to 17 Years | 0 (0.0%) | 27 (3.3%) |
| 18 to 34 Years | 5 (0.4%) | 0 (0.0%) |
| 35 to 64 Years | 99 (4.2%) | 87 (4.0%) |
| 65 to 74 Years | 48 (10.1%) | 51 (7.3%) |
| 75 Years and over | 238 (60.3%) | 341 (53.8%) |
Disability Class: Self-Care Difficulty
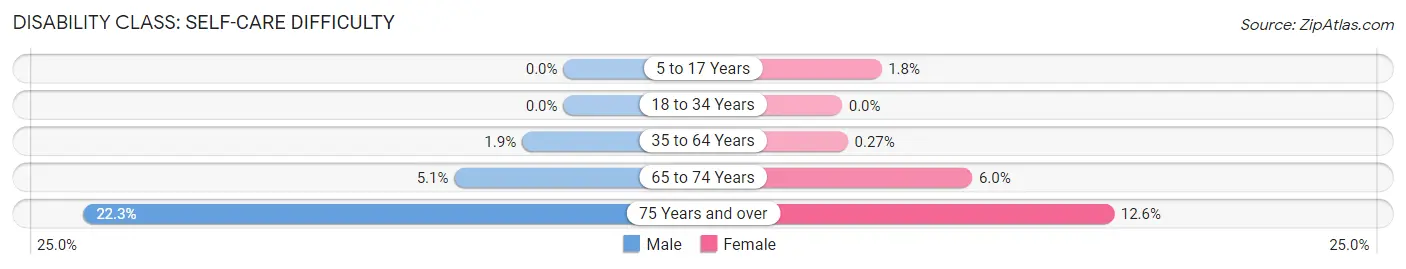
| Age Bracket | Male | Female |
| 5 to 17 Years | 0 (0.0%) | 15 (1.8%) |
| 18 to 34 Years | 0 (0.0%) | 0 (0.0%) |
| 35 to 64 Years | 45 (1.9%) | 6 (0.3%) |
| 65 to 74 Years | 24 (5.1%) | 42 (6.0%) |
| 75 Years and over | 88 (22.3%) | 80 (12.6%) |
Technology Access in Middle Valley
Computing Device Access in Middle Valley
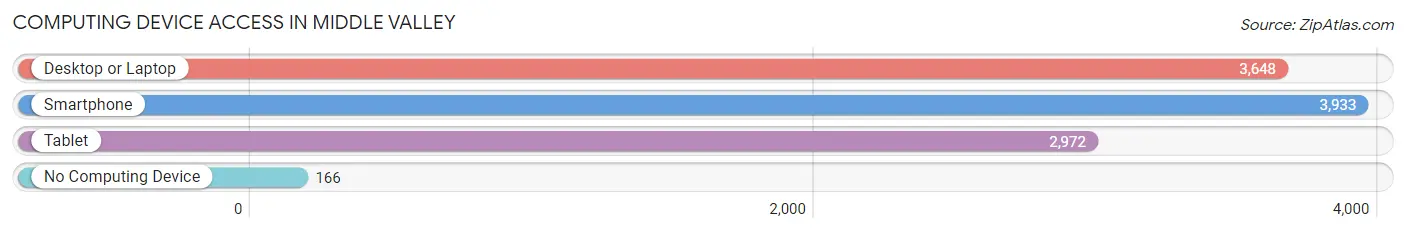
| Device Type | # Households | % Households |
| Desktop or Laptop | 3,648 | 83.9% |
| Smartphone | 3,933 | 90.4% |
| Tablet | 2,972 | 68.3% |
| No Computing Device | 166 | 3.8% |
| Total | 4,349 | 100.0% |
Internet Access in Middle Valley
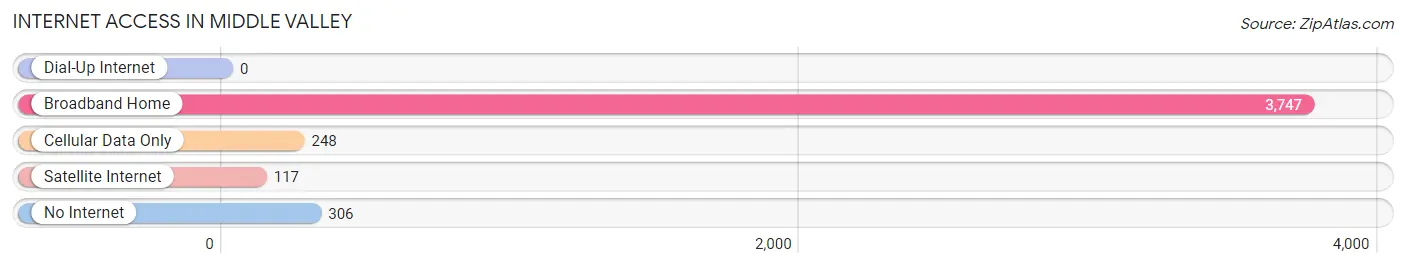
| Internet Type | # Households | % Households |
| Dial-Up Internet | 0 | 0.0% |
| Broadband Home | 3,747 | 86.2% |
| Cellular Data Only | 248 | 5.7% |
| Satellite Internet | 117 | 2.7% |
| No Internet | 306 | 7.0% |
| Total | 4,349 | 100.0% |
Middle Valley Summary
Middle Valley is a small unincorporated community located in Hamilton County, Tennessee. It is situated in the southeastern part of the county, approximately 10 miles northeast of Chattanooga. The community is bordered by the cities of Red Bank, East Ridge, and Chattanooga. The population of Middle Valley was estimated to be 8,845 in 2019.
History
Middle Valley was first settled in the early 1800s by a group of settlers from North Carolina. The community was originally known as "Middle Valley Station" due to its location between two other settlements, Red Bank and East Ridge. The name was later shortened to "Middle Valley". The community was officially incorporated in 1887.
In the late 1800s, the community was a popular stop for travelers on the Nashville and Chattanooga Railroad. The railroad provided a convenient way for people to travel between Chattanooga and Nashville. The railroad also brought new businesses to the area, including a sawmill, a gristmill, and a cotton gin.
Geography
Middle Valley is located in southeastern Hamilton County, approximately 10 miles northeast of Chattanooga. The community is bordered by the cities of Red Bank, East Ridge, and Chattanooga. The terrain of Middle Valley is mostly flat, with some rolling hills. The area is mostly wooded, with some open fields.
The climate of Middle Valley is humid subtropical, with hot summers and mild winters. The average annual temperature is around 60 degrees Fahrenheit. The average annual precipitation is around 50 inches.
Economy
The economy of Middle Valley is largely based on agriculture and manufacturing. The area is home to several farms, which produce a variety of crops, including corn, soybeans, and hay. The area is also home to several manufacturing companies, which produce a variety of products, including furniture, clothing, and automotive parts.
The area is also home to several retail stores, restaurants, and other businesses. The community is served by several major highways, including Interstate 75 and US Highway 27.
Demographics
The population of Middle Valley was estimated to be 8,845 in 2019. The population is mostly white (90.3%), with small percentages of African American (4.3%), Hispanic (2.7%), and Asian (1.7%) residents. The median household income is $50,945, and the median home value is $179,400.
The majority of the population (90.3%) is over the age of 18, and the median age is 38. The population is mostly married (54.3%), with a small percentage of single people (45.7%). The majority of the population (90.3%) is employed, with a small percentage of unemployed people (9.7%).
Conclusion
Middle Valley is a small unincorporated community located in Hamilton County, Tennessee. It is situated in the southeastern part of the county, approximately 10 miles northeast of Chattanooga. The community was first settled in the early 1800s and was officially incorporated in 1887. The economy of Middle Valley is largely based on agriculture and manufacturing, and the population was estimated to be 8,845 in 2019. The population is mostly white, with small percentages of African American, Hispanic, and Asian residents. The median household income is $50,945, and the median home value is $179,400.
Common Questions
What is the Total Population of Middle Valley?
Total Population of Middle Valley is 11,619.
What is the Total Male Population of Middle Valley?
Total Male Population of Middle Valley is 5,992.
What is the Total Female Population of Middle Valley?
Total Female Population of Middle Valley is 5,627.
What is the Ratio of Males per 100 Females in Middle Valley?
There are 106.49 Males per 100 Females in Middle Valley.
What is the Ratio of Females per 100 Males in Middle Valley?
There are 93.91 Females per 100 Males in Middle Valley.
What is the Median Population Age in Middle Valley?
Median Population Age in Middle Valley is 41.0 Years.
What is the Average Family Size in Middle Valley
Average Family Size in Middle Valley is 3.0 People.
What is the Average Household Size in Middle Valley
Average Household Size in Middle Valley is 2.7 People.
What is Per Capita Income in Middle Valley?
Per Capita income in Middle Valley is $44,189.
What is the Median Family Income in Middle Valley?
Median Family Income in Middle Valley is $96,530.
What is the Median Household income in Middle Valley?
Median Household Income in Middle Valley is $88,173.
What is Income or Wage Gap in Middle Valley?
Income or Wage Gap in Middle Valley is 8.0%.
Women in Middle Valley earn 92.0 cents for every dollar earned by a man.
What is Inequality or Gini Index in Middle Valley?
Inequality or Gini Index in Middle Valley is 0.44.
How Large is the Labor Force in Middle Valley?
There are 6,299 People in the Labor Forcein in Middle Valley.
What is the Percentage of People in the Labor Force in Middle Valley?
66.9% of People are in the Labor Force in Middle Valley.
What is the Unemployment Rate in Middle Valley?
Unemployment Rate in Middle Valley is 2.9%.