Oak Grove CDP Washington County, TN
Oak Grove CDP Washington County Overview
4,422
TOTAL POPULATION
2,053
MALE POPULATION
2,369
FEMALE POPULATION
86.66
MALES / 100 FEMALES
115.39
FEMALES / 100 MALES
47.1
MEDIAN AGE
2.9
AVG FAMILY SIZE
2.3
AVG HOUSEHOLD SIZE
$43,352
PER CAPITA INCOME
$84,784
AVG FAMILY INCOME
$66,518
AVG HOUSEHOLD INCOME
64.8%
WAGE / INCOME GAP [ % ]
35.2¢/ $1
WAGE / INCOME GAP [ $ ]
0.51
INEQUALITY / GINI INDEX
2,161
LABOR FORCE [ PEOPLE ]
58.8%
PERCENT IN LABOR FORCE
9.9%
UNEMPLOYMENT RATE
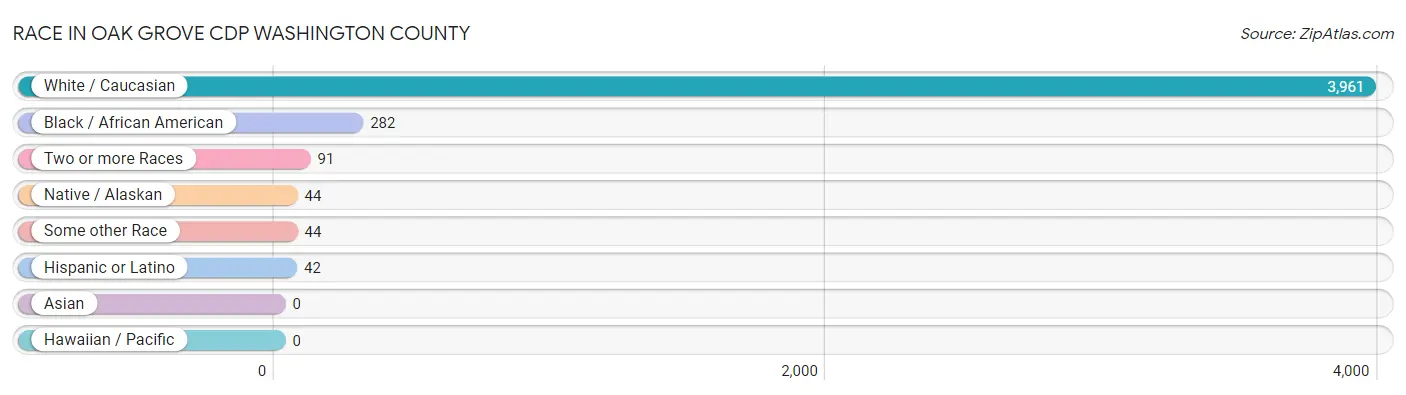
Race in Oak Grove CDP Washington County
The most populous races in Oak Grove CDP Washington County are White / Caucasian (3,961 | 89.6%), Black / African American (282 | 6.4%), and Two or more Races (91 | 2.1%).
| Race | # Population | % Population |
| Asian | 0 | 0.0% |
| Black / African American | 282 | 6.4% |
| Hawaiian / Pacific | 0 | 0.0% |
| Hispanic or Latino | 42 | 0.9% |
| Native / Alaskan | 44 | 1.0% |
| White / Caucasian | 3,961 | 89.6% |
| Two or more Races | 91 | 2.1% |
| Some other Race | 44 | 1.0% |
| Total | 4,422 | 100.0% |
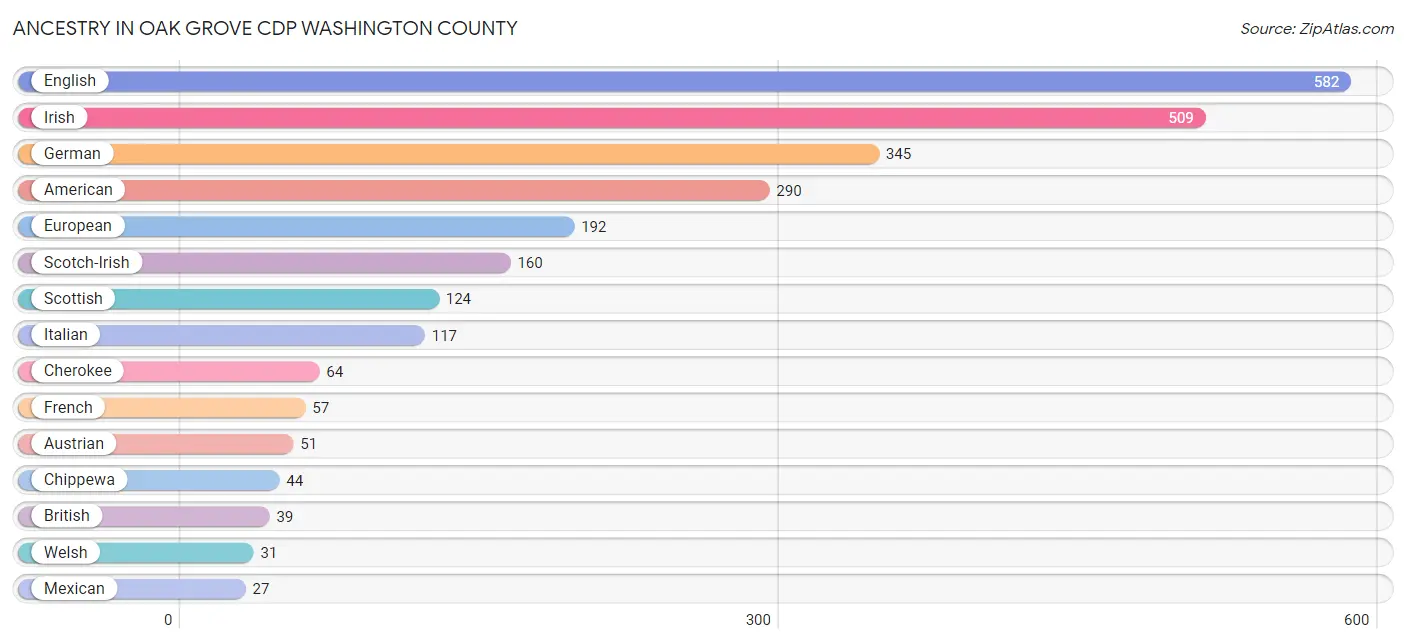
Ancestry in Oak Grove CDP Washington County
The most populous ancestries reported in Oak Grove CDP Washington County are English (582 | 13.2%), Irish (509 | 11.5%), German (345 | 7.8%), American (290 | 6.6%), and European (192 | 4.3%), together accounting for 43.4% of all Oak Grove CDP Washington County residents.
| Ancestry | # Population | % Population |
| American | 290 | 6.6% |
| Austrian | 51 | 1.1% |
| Blackfeet | 1 | 0.0% |
| British | 39 | 0.9% |
| Cherokee | 64 | 1.5% |
| Chippewa | 44 | 1.0% |
| Cuban | 15 | 0.3% |
| Danish | 15 | 0.3% |
| Dutch | 16 | 0.4% |
| English | 582 | 13.2% |
| European | 192 | 4.3% |
| French | 57 | 1.3% |
| German | 345 | 7.8% |
| Irish | 509 | 11.5% |
| Italian | 117 | 2.6% |
| Mexican | 27 | 0.6% |
| Norwegian | 13 | 0.3% |
| Polish | 9 | 0.2% |
| Scotch-Irish | 160 | 3.6% |
| Scottish | 124 | 2.8% |
| Swedish | 17 | 0.4% |
| Welsh | 31 | 0.7% | View All 22 Rows |
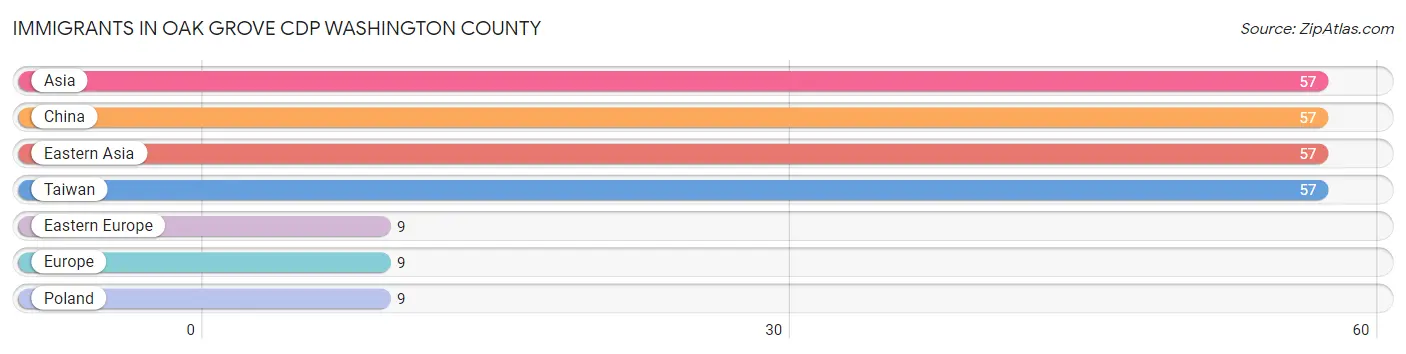
Immigrants in Oak Grove CDP Washington County
The most numerous immigrant groups reported in Oak Grove CDP Washington County came from Asia (57 | 1.3%), China (57 | 1.3%), Eastern Asia (57 | 1.3%), Taiwan (57 | 1.3%), and Eastern Europe (9 | 0.2%), together accounting for 5.4% of all Oak Grove CDP Washington County residents.
| Immigration Origin | # Population | % Population |
| Asia | 57 | 1.3% |
| China | 57 | 1.3% |
| Eastern Asia | 57 | 1.3% |
| Eastern Europe | 9 | 0.2% |
| Europe | 9 | 0.2% |
| Poland | 9 | 0.2% |
| Taiwan | 57 | 1.3% | View All 7 Rows |
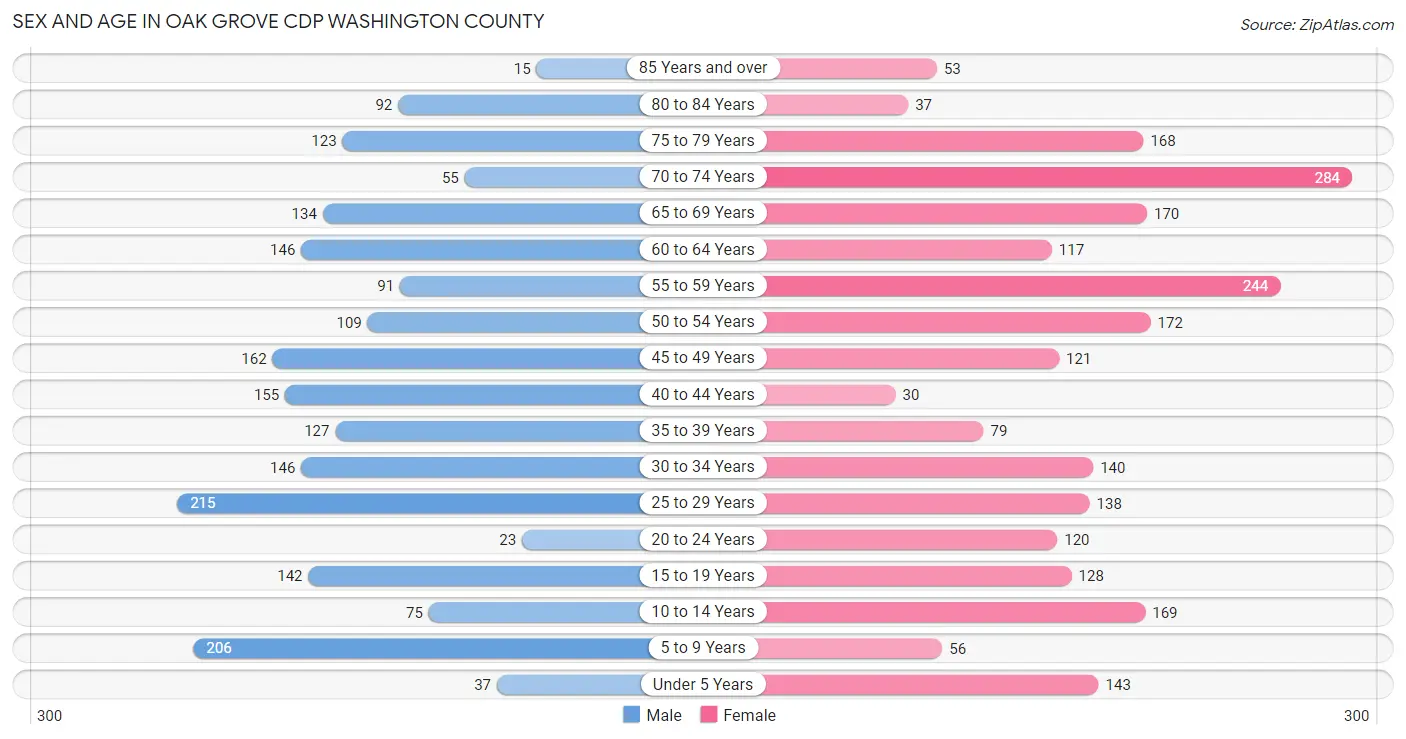
Sex and Age in Oak Grove CDP Washington County
Sex and Age in Oak Grove CDP Washington County
The most populous age groups in Oak Grove CDP Washington County are 25 to 29 Years (215 | 10.5%) for men and 70 to 74 Years (284 | 12.0%) for women.
| Age Bracket | Male | Female |
| Under 5 Years | 37 (1.8%) | 143 (6.0%) |
| 5 to 9 Years | 206 (10.0%) | 56 (2.4%) |
| 10 to 14 Years | 75 (3.6%) | 169 (7.1%) |
| 15 to 19 Years | 142 (6.9%) | 128 (5.4%) |
| 20 to 24 Years | 23 (1.1%) | 120 (5.1%) |
| 25 to 29 Years | 215 (10.5%) | 138 (5.8%) |
| 30 to 34 Years | 146 (7.1%) | 140 (5.9%) |
| 35 to 39 Years | 127 (6.2%) | 79 (3.3%) |
| 40 to 44 Years | 155 (7.5%) | 30 (1.3%) |
| 45 to 49 Years | 162 (7.9%) | 121 (5.1%) |
| 50 to 54 Years | 109 (5.3%) | 172 (7.3%) |
| 55 to 59 Years | 91 (4.4%) | 244 (10.3%) |
| 60 to 64 Years | 146 (7.1%) | 117 (4.9%) |
| 65 to 69 Years | 134 (6.5%) | 170 (7.2%) |
| 70 to 74 Years | 55 (2.7%) | 284 (12.0%) |
| 75 to 79 Years | 123 (6.0%) | 168 (7.1%) |
| 80 to 84 Years | 92 (4.5%) | 37 (1.6%) |
| 85 Years and over | 15 (0.7%) | 53 (2.2%) |
| Total | 2,053 (100.0%) | 2,369 (100.0%) |
Families and Households in Oak Grove CDP Washington County
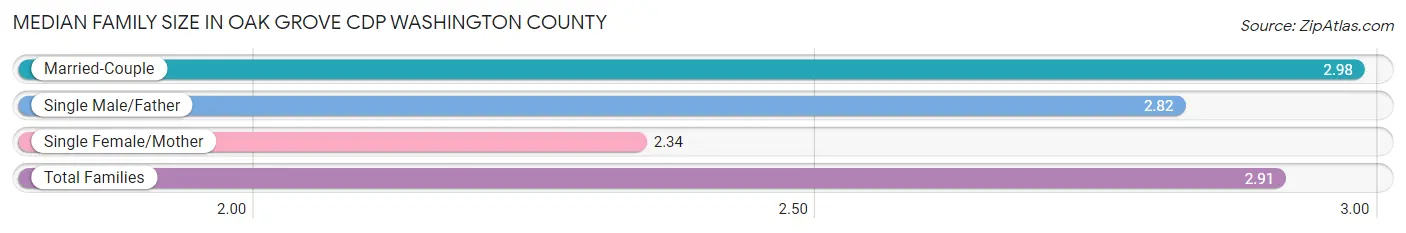
Median Family Size in Oak Grove CDP Washington County
The median family size in Oak Grove CDP Washington County is 2.91 persons per family, with married-couple families (1,025 | 84.8%) accounting for the largest median family size of 2.98 persons per family. On the other hand, single female/mother families (113 | 9.3%) represent the smallest median family size with 2.34 persons per family.
| Family Type | # Families | Family Size |
| Married-Couple | 1,025 (84.8%) | 2.98 |
| Single Male/Father | 71 (5.9%) | 2.82 |
| Single Female/Mother | 113 (9.3%) | 2.34 |
| Total Families | 1,209 (100.0%) | 2.91 |
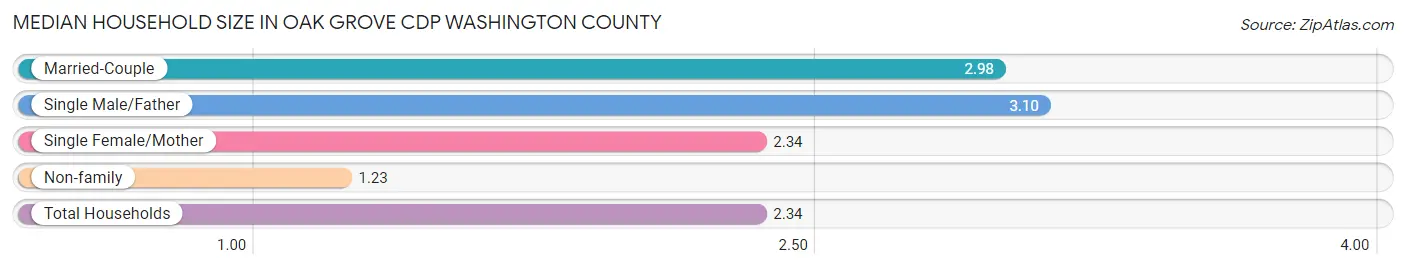
Median Household Size in Oak Grove CDP Washington County
The median household size in Oak Grove CDP Washington County is 2.34 persons per household, with single male/father households (71 | 3.8%) accounting for the largest median household size of 3.1 persons per household. non-family households (637 | 34.5%) represent the smallest median household size with 1.23 persons per household.
| Household Type | # Households | Household Size |
| Married-Couple | 1,025 (55.5%) | 2.98 |
| Single Male/Father | 71 (3.8%) | 3.10 |
| Single Female/Mother | 113 (6.1%) | 2.34 |
| Non-family | 637 (34.5%) | 1.23 |
| Total Households | 1,846 (100.0%) | 2.34 |
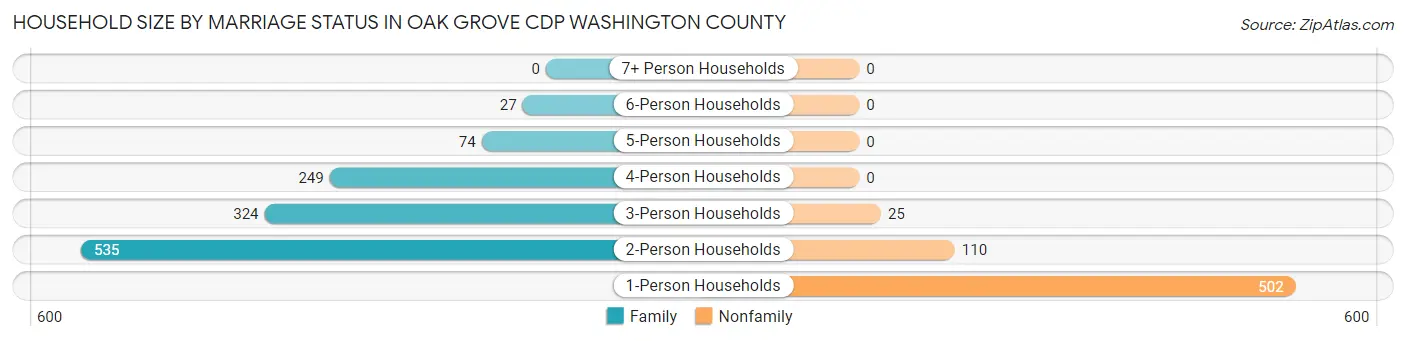
Household Size by Marriage Status in Oak Grove CDP Washington County
Out of a total of 1,846 households in Oak Grove CDP Washington County, 1,209 (65.5%) are family households, while 637 (34.5%) are nonfamily households. The most numerous type of family households are 2-person households, comprising 535, and the most common type of nonfamily households are 1-person households, comprising 502.
| Household Size | Family Households | Nonfamily Households |
| 1-Person Households | - | 502 (27.2%) |
| 2-Person Households | 535 (29.0%) | 110 (6.0%) |
| 3-Person Households | 324 (17.5%) | 25 (1.3%) |
| 4-Person Households | 249 (13.5%) | 0 (0.0%) |
| 5-Person Households | 74 (4.0%) | 0 (0.0%) |
| 6-Person Households | 27 (1.5%) | 0 (0.0%) |
| 7+ Person Households | 0 (0.0%) | 0 (0.0%) |
| Total | 1,209 (65.5%) | 637 (34.5%) |
Female Fertility in Oak Grove CDP Washington County
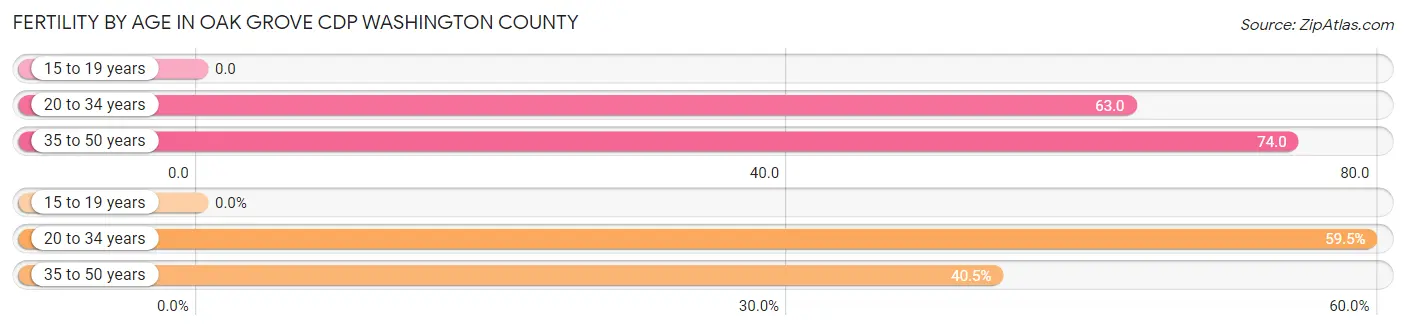
Fertility by Age in Oak Grove CDP Washington County
Average fertility rate in Oak Grove CDP Washington County is 56.0 births per 1,000 women. Women in the age bracket of 35 to 50 years have the highest fertility rate with 74.0 births per 1,000 women. Women in the age bracket of 20 to 34 years acount for 59.5% of all women with births.
| Age Bracket | Women with Births | Births / 1,000 Women |
| 15 to 19 years | 0 (0.0%) | 0.0 |
| 20 to 34 years | 25 (59.5%) | 63.0 |
| 35 to 50 years | 17 (40.5%) | 74.0 |
| Total | 42 (100.0%) | 56.0 |
Fertility by Age by Marriage Status in Oak Grove CDP Washington County
88.1% of women with births (42) in Oak Grove CDP Washington County are married. The highest percentage of unmarried women with births falls into 20 to 34 years age bracket with 20.0% of them unmarried at the time of birth, while the lowest percentage of unmarried women with births belong to 35 to 50 years age bracket with 0.0% of them unmarried.
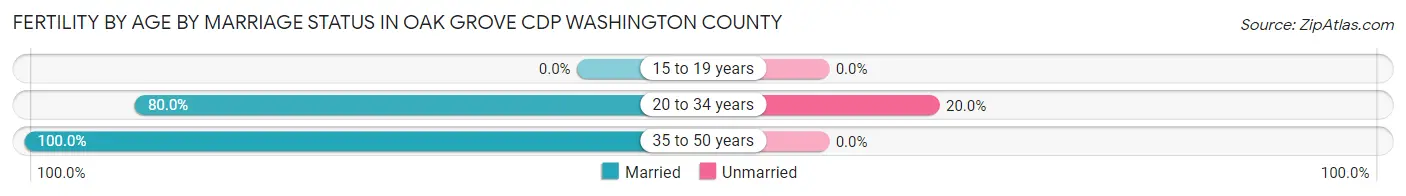
| Age Bracket | Married | Unmarried |
| 15 to 19 years | 0 (0.0%) | 0 (0.0%) |
| 20 to 34 years | 20 (80.0%) | 5 (20.0%) |
| 35 to 50 years | 17 (100.0%) | 0 (0.0%) |
| Total | 37 (88.1%) | 5 (11.9%) |
Fertility by Education in Oak Grove CDP Washington County
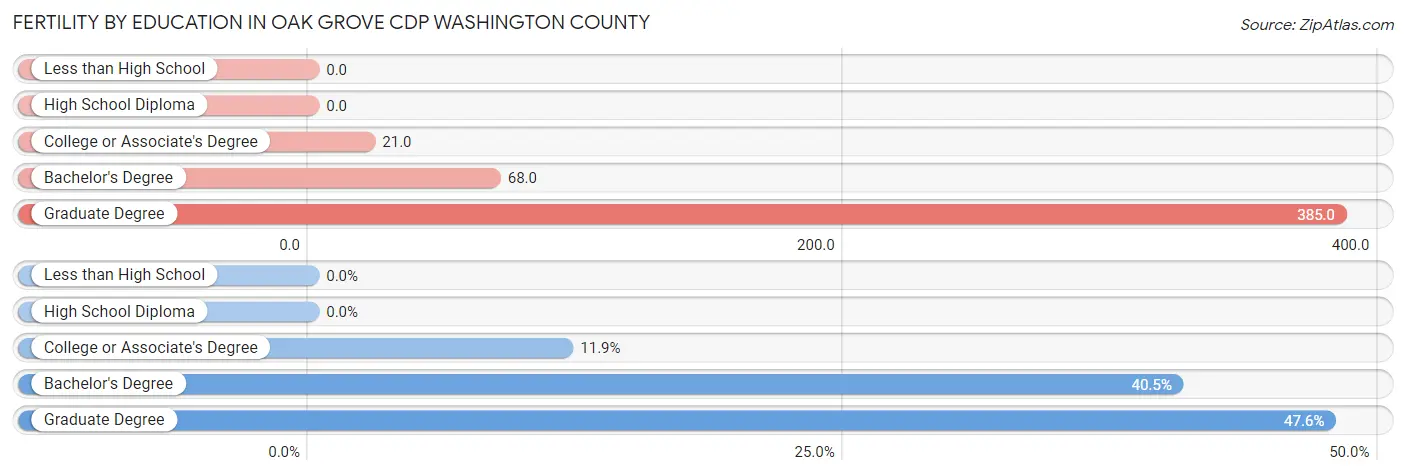
| Educational Attainment | Women with Births | Births / 1,000 Women |
| Less than High School | 0 (0.0%) | 0.0 |
| High School Diploma | 0 (0.0%) | 0.0 |
| College or Associate's Degree | 5 (11.9%) | 21.0 |
| Bachelor's Degree | 17 (40.5%) | 68.0 |
| Graduate Degree | 20 (47.6%) | 385.0 |
| Total | 42 (100.0%) | 56.0 |
Fertility by Education by Marriage Status in Oak Grove CDP Washington County
11.9% of women with births in Oak Grove CDP Washington County are unmarried. Women with the educational attainment of bachelor's degree are most likely to be married with 100.0% of them married at childbirth, while women with the educational attainment of college or associate's degree are least likely to be married with 100.0% of them unmarried at childbirth.
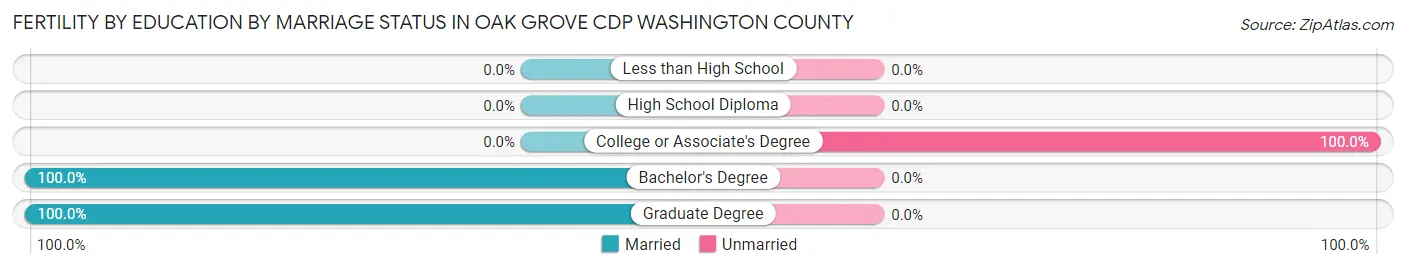
| Educational Attainment | Married | Unmarried |
| Less than High School | 0 (0.0%) | 0 (0.0%) |
| High School Diploma | 0 (0.0%) | 0 (0.0%) |
| College or Associate's Degree | 0 (0.0%) | 5 (100.0%) |
| Bachelor's Degree | 17 (100.0%) | 0 (0.0%) |
| Graduate Degree | 20 (100.0%) | 0 (0.0%) |
| Total | 37 (88.1%) | 5 (11.9%) |
Income in Oak Grove CDP Washington County
Income Overview in Oak Grove CDP Washington County
Per Capita Income in Oak Grove CDP Washington County is $43,352, while median incomes of families and households are $84,784 and $66,518 respectively.
| Characteristic | Number | Measure |
| Per Capita Income | 4,422 | $43,352 |
| Median Family Income | 1,209 | $84,784 |
| Mean Family Income | 1,209 | $124,232 |
| Median Household Income | 1,846 | $66,518 |
| Mean Household Income | 1,846 | $102,091 |
| Income Deficit | 1,209 | $0 |
| Wage / Income Gap (%) | 4,422 | 64.80% |
| Wage / Income Gap ($) | 4,422 | 35.20¢ per $1 |
| Gini / Inequality Index | 4,422 | 0.51 |
Earnings by Sex in Oak Grove CDP Washington County
Average Earnings in Oak Grove CDP Washington County are $31,898, $67,697 for men and $23,826 for women, a difference of 64.8%.
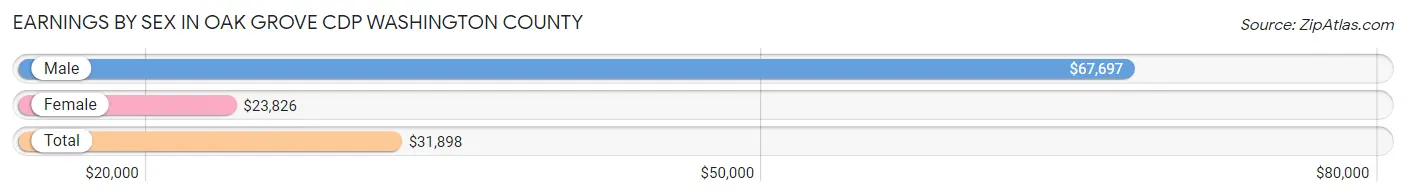
| Sex | Number | Average Earnings |
| Male | 1,036 (47.9%) | $67,697 |
| Female | 1,127 (52.1%) | $23,826 |
| Total | 2,163 (100.0%) | $31,898 |
Earnings by Sex by Income Bracket in Oak Grove CDP Washington County
The most common earnings brackets in Oak Grove CDP Washington County are $100,000+ for men (282 | 27.2%) and $15,000 to $17,499 for women (161 | 14.3%).
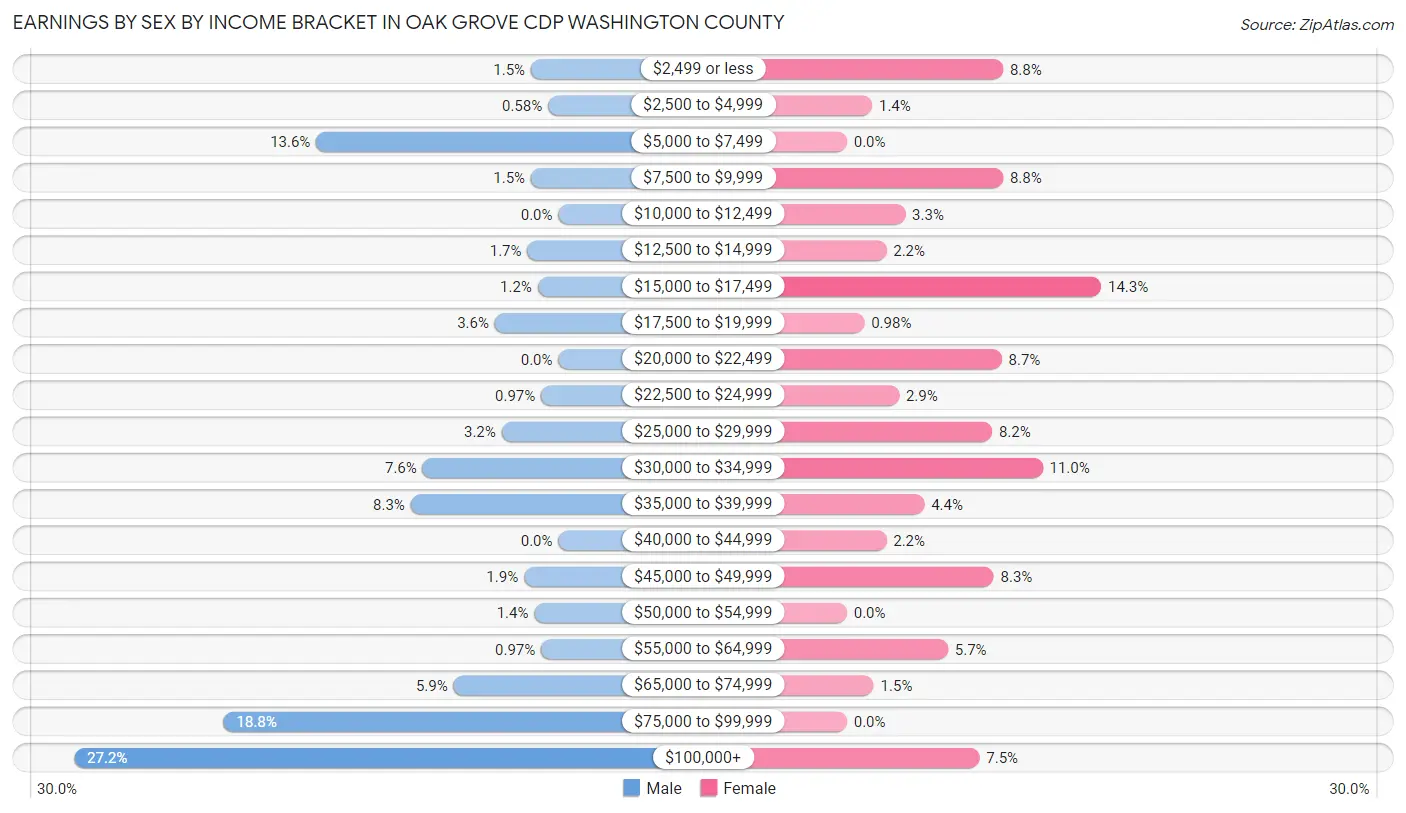
| Income | Male | Female |
| $2,499 or less | 16 (1.5%) | 99 (8.8%) |
| $2,500 to $4,999 | 6 (0.6%) | 16 (1.4%) |
| $5,000 to $7,499 | 141 (13.6%) | 0 (0.0%) |
| $7,500 to $9,999 | 16 (1.5%) | 99 (8.8%) |
| $10,000 to $12,499 | 0 (0.0%) | 37 (3.3%) |
| $12,500 to $14,999 | 18 (1.7%) | 25 (2.2%) |
| $15,000 to $17,499 | 12 (1.2%) | 161 (14.3%) |
| $17,500 to $19,999 | 37 (3.6%) | 11 (1.0%) |
| $20,000 to $22,499 | 0 (0.0%) | 98 (8.7%) |
| $22,500 to $24,999 | 10 (1.0%) | 33 (2.9%) |
| $25,000 to $29,999 | 33 (3.2%) | 92 (8.2%) |
| $30,000 to $34,999 | 79 (7.6%) | 124 (11.0%) |
| $35,000 to $39,999 | 86 (8.3%) | 49 (4.3%) |
| $40,000 to $44,999 | 0 (0.0%) | 25 (2.2%) |
| $45,000 to $49,999 | 20 (1.9%) | 93 (8.3%) |
| $50,000 to $54,999 | 14 (1.3%) | 0 (0.0%) |
| $55,000 to $64,999 | 10 (1.0%) | 64 (5.7%) |
| $65,000 to $74,999 | 61 (5.9%) | 17 (1.5%) |
| $75,000 to $99,999 | 195 (18.8%) | 0 (0.0%) |
| $100,000+ | 282 (27.2%) | 84 (7.4%) |
| Total | 1,036 (100.0%) | 1,127 (100.0%) |
Earnings by Sex by Educational Attainment in Oak Grove CDP Washington County
Average earnings in Oak Grove CDP Washington County are $73,750 for men and $25,955 for women, a difference of 64.8%. Men with an educational attainment of bachelor's degree enjoy the highest average annual earnings of $178,631, while those with high school diploma education earn the least with $31,899. Women with an educational attainment of graduate degree earn the most with the average annual earnings of $63,875, while those with college or associate's degree education have the smallest earnings of $16,957.
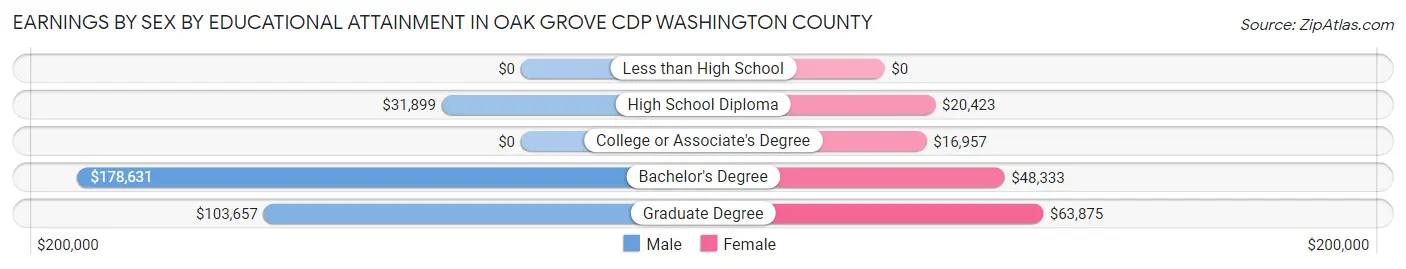
| Educational Attainment | Male Income | Female Income |
| Less than High School | - | - |
| High School Diploma | $31,899 | $20,423 |
| College or Associate's Degree | - | - |
| Bachelor's Degree | $178,631 | $48,333 |
| Graduate Degree | $103,657 | $63,875 |
| Total | $73,750 | $25,955 |
Family Income in Oak Grove CDP Washington County
Family Income Brackets in Oak Grove CDP Washington County
According to the Oak Grove CDP Washington County family income data, there are 346 families falling into the $100,000 to $149,999 income range, which is the most common income bracket and makes up 28.6% of all families. Conversely, the $10,000 to $14,999 income bracket is the least frequent group with only 13 families (1.1%) belonging to this category.
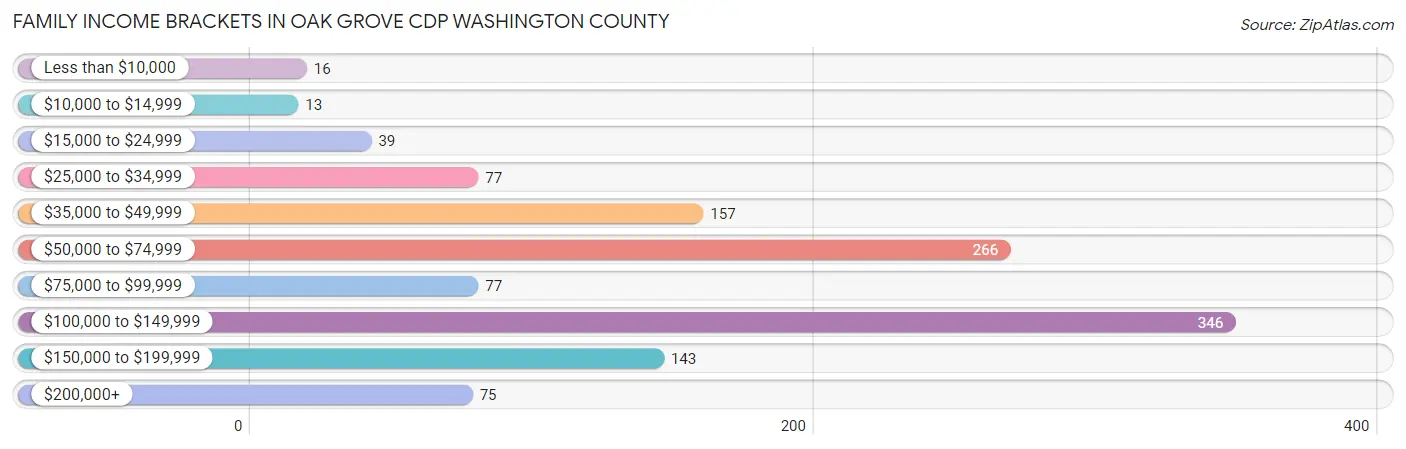
| Income Bracket | # Families | % Families |
| Less than $10,000 | 16 | 1.3% |
| $10,000 to $14,999 | 13 | 1.1% |
| $15,000 to $24,999 | 39 | 3.2% |
| $25,000 to $34,999 | 77 | 6.4% |
| $35,000 to $49,999 | 157 | 13.0% |
| $50,000 to $74,999 | 266 | 22.0% |
| $75,000 to $99,999 | 77 | 6.4% |
| $100,000 to $149,999 | 346 | 28.6% |
| $150,000 to $199,999 | 143 | 11.8% |
| $200,000+ | 75 | 6.2% |
Family Income by Famaliy Size in Oak Grove CDP Washington County
5-person families (74 | 6.1%) account for the highest median family income in Oak Grove CDP Washington County with $145,278 per family, while 2-person families (551 | 45.6%) have the highest median income of $33,703 per family member.
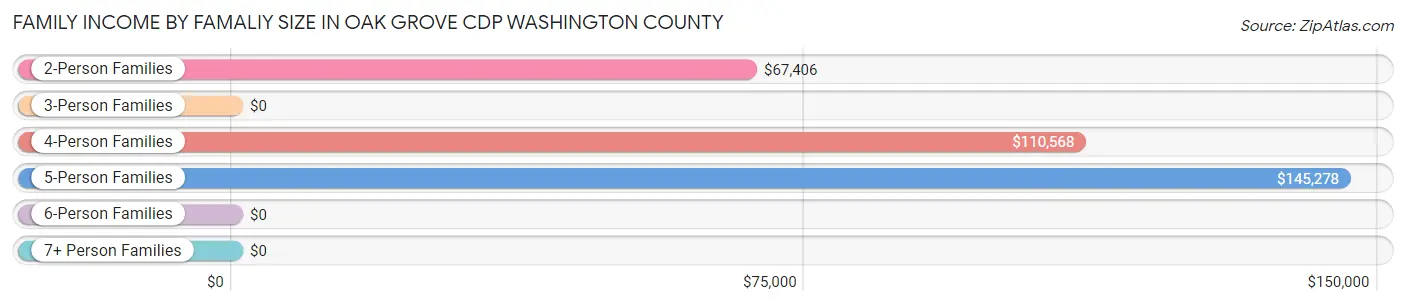
| Income Bracket | # Families | Median Income |
| 2-Person Families | 551 (45.6%) | $67,406 |
| 3-Person Families | 308 (25.5%) | $0 |
| 4-Person Families | 249 (20.6%) | $110,568 |
| 5-Person Families | 74 (6.1%) | $145,278 |
| 6-Person Families | 27 (2.2%) | $0 |
| 7+ Person Families | 0 (0.0%) | $0 |
| Total | 1,209 (100.0%) | $84,784 |
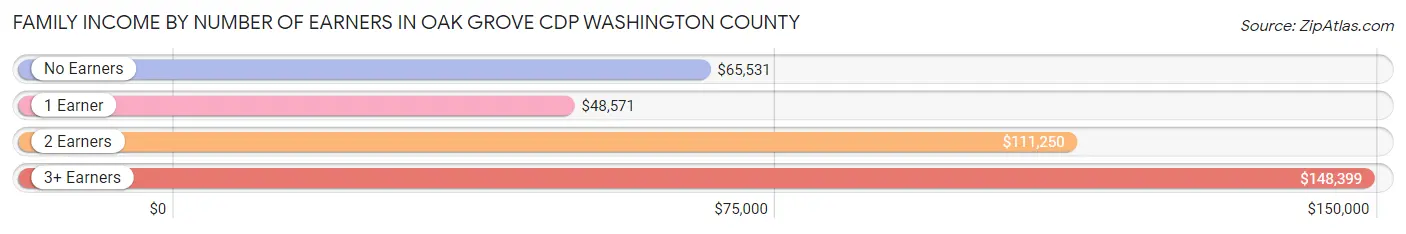
Family Income by Number of Earners in Oak Grove CDP Washington County
The median family income in Oak Grove CDP Washington County is $84,784, with families comprising 3+ earners (123) having the highest median family income of $148,399, while families with 1 earner (192) have the lowest median family income of $48,571, accounting for 10.2% and 15.9% of families, respectively.
| Number of Earners | # Families | Median Income |
| No Earners | 367 (30.4%) | $65,531 |
| 1 Earner | 192 (15.9%) | $48,571 |
| 2 Earners | 527 (43.6%) | $111,250 |
| 3+ Earners | 123 (10.2%) | $148,399 |
| Total | 1,209 (100.0%) | $84,784 |
Household Income in Oak Grove CDP Washington County
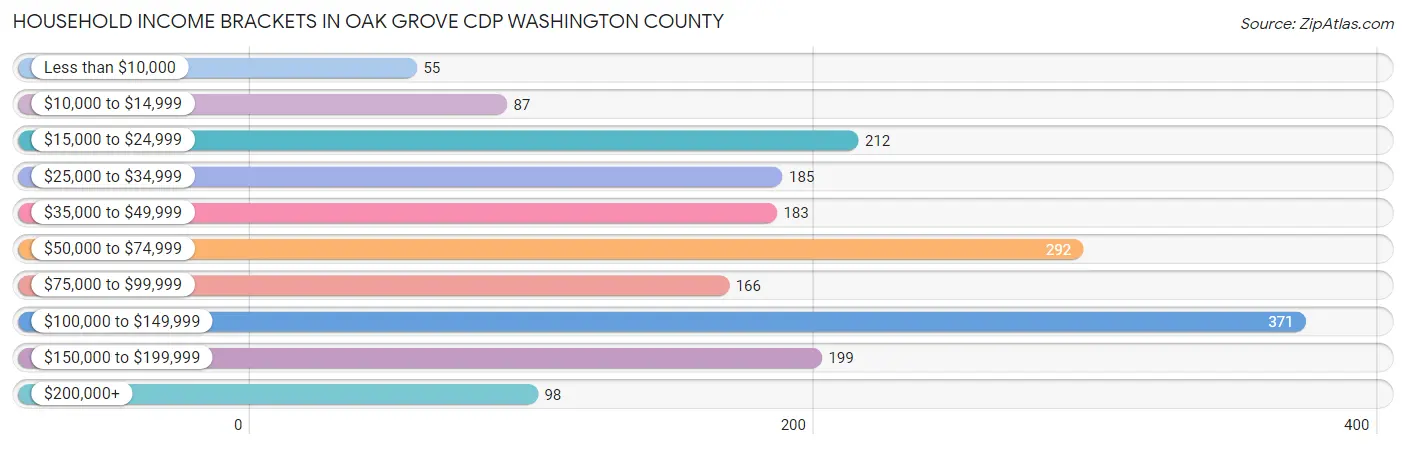
Household Income Brackets in Oak Grove CDP Washington County
With 371 households falling in the category, the $100,000 to $149,999 income range is the most frequent in Oak Grove CDP Washington County, accounting for 20.1% of all households. In contrast, only 55 households (3.0%) fall into the less than $10,000 income bracket, making it the least populous group.
| Income Bracket | # Households | % Households |
| Less than $10,000 | 55 | 3.0% |
| $10,000 to $14,999 | 87 | 4.7% |
| $15,000 to $24,999 | 212 | 11.5% |
| $25,000 to $34,999 | 185 | 10.0% |
| $35,000 to $49,999 | 183 | 9.9% |
| $50,000 to $74,999 | 292 | 15.8% |
| $75,000 to $99,999 | 166 | 9.0% |
| $100,000 to $149,999 | 371 | 20.1% |
| $150,000 to $199,999 | 199 | 10.8% |
| $200,000+ | 98 | 5.3% |
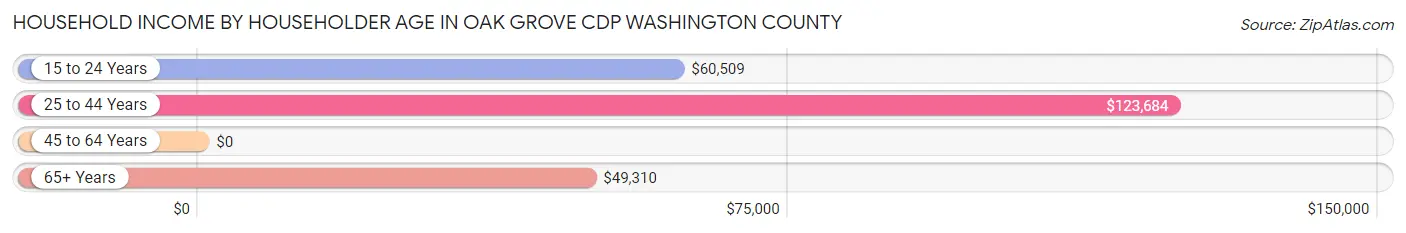
Household Income by Householder Age in Oak Grove CDP Washington County
The median household income in Oak Grove CDP Washington County is $66,518, with the highest median household income of $123,684 found in the 25 to 44 years age bracket for the primary householder. A total of 454 households (24.6%) fall into this category. Meanwhile, the 45 to 64 years age bracket for the primary householder has the lowest median household income of $0, with 569 households (30.8%) in this group.
| Income Bracket | # Households | Median Income |
| 15 to 24 Years | 129 (7.0%) | $60,509 |
| 25 to 44 Years | 454 (24.6%) | $123,684 |
| 45 to 64 Years | 569 (30.8%) | $0 |
| 65+ Years | 694 (37.6%) | $49,310 |
| Total | 1,846 (100.0%) | $66,518 |
Poverty in Oak Grove CDP Washington County
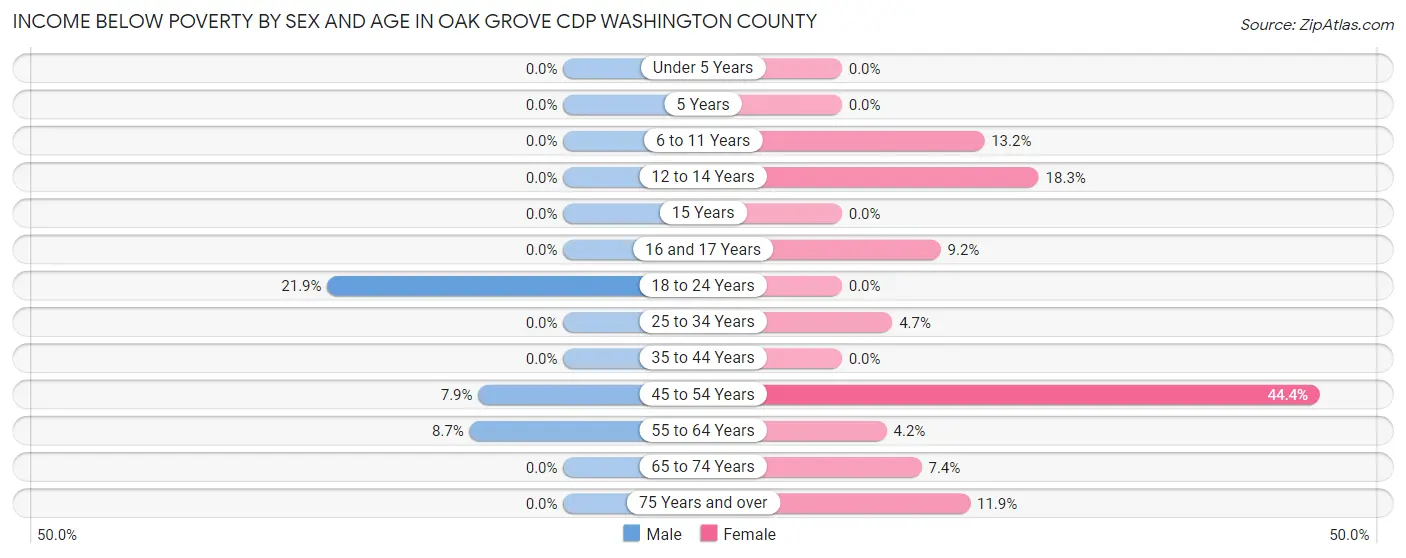
Income Below Poverty by Sex and Age in Oak Grove CDP Washington County
With 3.2% poverty level for males and 11.3% for females among the residents of Oak Grove CDP Washington County, 18 to 24 year old males and 45 to 54 year old females are the most vulnerable to poverty, with 23 males (21.9%) and 130 females (44.4%) in their respective age groups living below the poverty level.
| Age Bracket | Male | Female |
| Under 5 Years | 0 (0.0%) | 0 (0.0%) |
| 5 Years | 0 (0.0%) | 0 (0.0%) |
| 6 to 11 Years | 0 (0.0%) | 16 (13.2%) |
| 12 to 14 Years | 0 (0.0%) | 19 (18.3%) |
| 15 Years | 0 (0.0%) | 0 (0.0%) |
| 16 and 17 Years | 0 (0.0%) | 10 (9.2%) |
| 18 to 24 Years | 23 (21.9%) | 0 (0.0%) |
| 25 to 34 Years | 0 (0.0%) | 13 (4.7%) |
| 35 to 44 Years | 0 (0.0%) | 0 (0.0%) |
| 45 to 54 Years | 21 (7.9%) | 130 (44.4%) |
| 55 to 64 Years | 20 (8.7%) | 15 (4.2%) |
| 65 to 74 Years | 0 (0.0%) | 33 (7.4%) |
| 75 Years and over | 0 (0.0%) | 25 (11.9%) |
| Total | 64 (3.2%) | 261 (11.3%) |
Income Above Poverty by Sex and Age in Oak Grove CDP Washington County
According to the poverty statistics in Oak Grove CDP Washington County, males aged under 5 years and females aged under 5 years are the age groups that are most secure financially, with 100.0% of males and 100.0% of females in these age groups living above the poverty line.
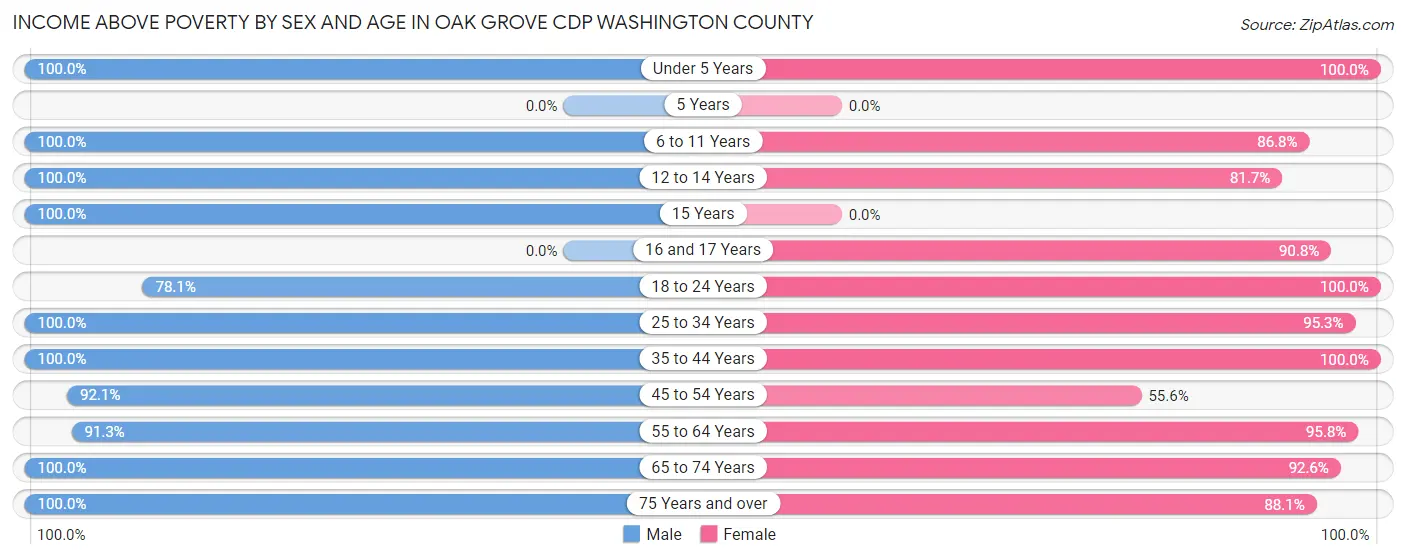
| Age Bracket | Male | Female |
| Under 5 Years | 37 (100.0%) | 143 (100.0%) |
| 5 Years | 0 (0.0%) | 0 (0.0%) |
| 6 to 11 Years | 229 (100.0%) | 105 (86.8%) |
| 12 to 14 Years | 52 (100.0%) | 85 (81.7%) |
| 15 Years | 60 (100.0%) | 0 (0.0%) |
| 16 and 17 Years | 0 (0.0%) | 99 (90.8%) |
| 18 to 24 Years | 82 (78.1%) | 139 (100.0%) |
| 25 to 34 Years | 361 (100.0%) | 265 (95.3%) |
| 35 to 44 Years | 282 (100.0%) | 109 (100.0%) |
| 45 to 54 Years | 245 (92.1%) | 163 (55.6%) |
| 55 to 64 Years | 210 (91.3%) | 346 (95.8%) |
| 65 to 74 Years | 189 (100.0%) | 413 (92.6%) |
| 75 Years and over | 200 (100.0%) | 185 (88.1%) |
| Total | 1,947 (96.8%) | 2,052 (88.7%) |
Income Below Poverty Among Married-Couple Families in Oak Grove CDP Washington County
The poverty statistics for married-couple families in Oak Grove CDP Washington County show that 0.5% or 5 of the total 1,025 families live below the poverty line. Families with 1 or 2 children have the highest poverty rate of 1.2%, comprising of 5 families. On the other hand, families with no children have the lowest poverty rate of 0.0%, which includes 0 families.
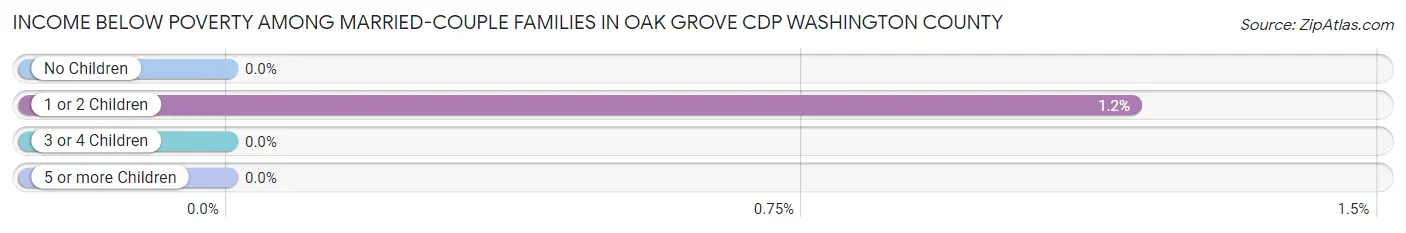
| Children | Above Poverty | Below Poverty |
| No Children | 547 (100.0%) | 0 (0.0%) |
| 1 or 2 Children | 417 (98.8%) | 5 (1.2%) |
| 3 or 4 Children | 56 (100.0%) | 0 (0.0%) |
| 5 or more Children | 0 (0.0%) | 0 (0.0%) |
| Total | 1,020 (99.5%) | 5 (0.5%) |
Income Below Poverty Among Single-Parent Households in Oak Grove CDP Washington County
According to the poverty data in Oak Grove CDP Washington County, 22.5% or 16 single-father households and 11.5% or 13 single-mother households are living below the poverty line. Among single-father households, those with no children have the highest poverty rate, with 16 households (100.0%) experiencing poverty. Likewise, among single-mother households, those with 1 or 2 children have the highest poverty rate, with 13 households (54.2%) falling below the poverty line.
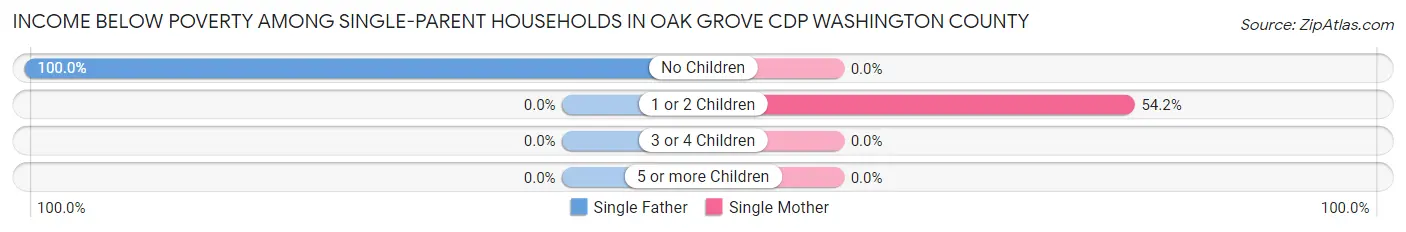
| Children | Single Father | Single Mother |
| No Children | 16 (100.0%) | 0 (0.0%) |
| 1 or 2 Children | 0 (0.0%) | 13 (54.2%) |
| 3 or 4 Children | 0 (0.0%) | 0 (0.0%) |
| 5 or more Children | 0 (0.0%) | 0 (0.0%) |
| Total | 16 (22.5%) | 13 (11.5%) |
Income Below Poverty Among Married-Couple vs Single-Parent Households in Oak Grove CDP Washington County
The poverty data for Oak Grove CDP Washington County shows that 5 of the married-couple family households (0.5%) and 29 of the single-parent households (15.8%) are living below the poverty level. Within the married-couple family households, those with 1 or 2 children have the highest poverty rate, with 5 households (1.2%) falling below the poverty line. Among the single-parent households, those with 1 or 2 children have the highest poverty rate, with 13 household (16.5%) living below poverty.
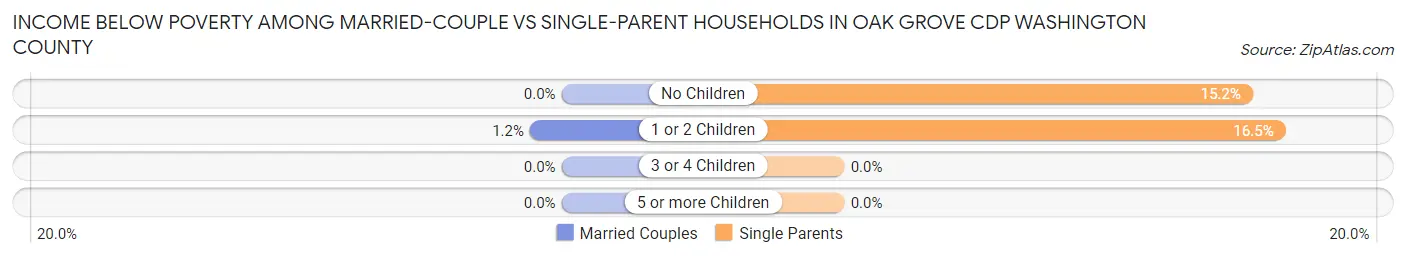
| Children | Married-Couple Families | Single-Parent Households |
| No Children | 0 (0.0%) | 16 (15.2%) |
| 1 or 2 Children | 5 (1.2%) | 13 (16.5%) |
| 3 or 4 Children | 0 (0.0%) | 0 (0.0%) |
| 5 or more Children | 0 (0.0%) | 0 (0.0%) |
| Total | 5 (0.5%) | 29 (15.8%) |
Employment Characteristics in Oak Grove CDP Washington County
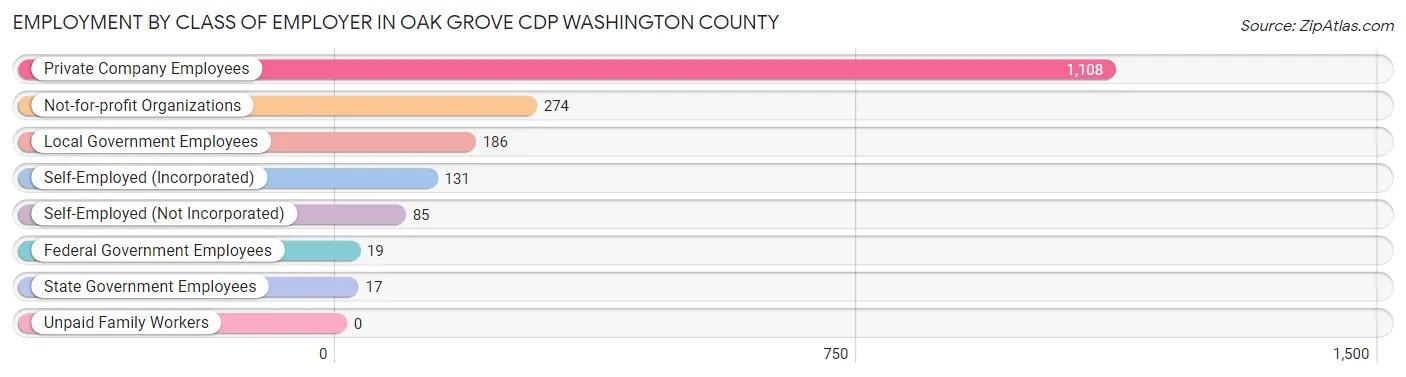
Employment by Class of Employer in Oak Grove CDP Washington County
Among the 1,820 employed individuals in Oak Grove CDP Washington County, private company employees (1,108 | 60.9%), not-for-profit organizations (274 | 15.0%), and local government employees (186 | 10.2%) make up the most common classes of employment.
| Employer Class | # Employees | % Employees |
| Private Company Employees | 1,108 | 60.9% |
| Self-Employed (Incorporated) | 131 | 7.2% |
| Self-Employed (Not Incorporated) | 85 | 4.7% |
| Not-for-profit Organizations | 274 | 15.0% |
| Local Government Employees | 186 | 10.2% |
| State Government Employees | 17 | 0.9% |
| Federal Government Employees | 19 | 1.0% |
| Unpaid Family Workers | 0 | 0.0% |
| Total | 1,820 | 100.0% |
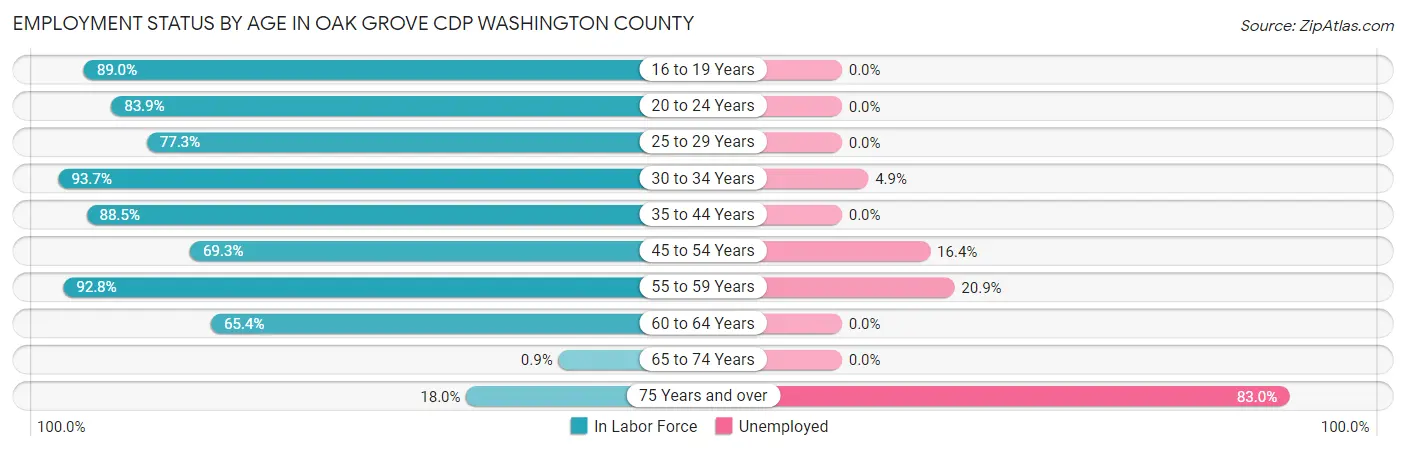
Employment Status by Age in Oak Grove CDP Washington County
According to the labor force statistics for Oak Grove CDP Washington County, out of the total population over 16 years of age (3,676), 58.8% or 2,161 individuals are in the labor force, with 9.9% or 214 of them unemployed. The age group with the highest labor force participation rate is 30 to 34 years, with 93.7% or 268 individuals in the labor force. Within the labor force, the 75 years and over age range has the highest percentage of unemployed individuals, with 83.0% or 73 of them being unemployed.
| Age Bracket | In Labor Force | Unemployed |
| 16 to 19 Years | 187 (89.0%) | 0 (0.0%) |
| 20 to 24 Years | 120 (83.9%) | 0 (0.0%) |
| 25 to 29 Years | 273 (77.3%) | 0 (0.0%) |
| 30 to 34 Years | 268 (93.7%) | 13 (4.9%) |
| 35 to 44 Years | 346 (88.5%) | 0 (0.0%) |
| 45 to 54 Years | 391 (69.3%) | 64 (16.4%) |
| 55 to 59 Years | 311 (92.8%) | 65 (20.9%) |
| 60 to 64 Years | 172 (65.4%) | 0 (0.0%) |
| 65 to 74 Years | 6 (0.9%) | 0 (0.0%) |
| 75 Years and over | 88 (18.0%) | 73 (83.0%) |
| Total | 2,161 (58.8%) | 214 (9.9%) |
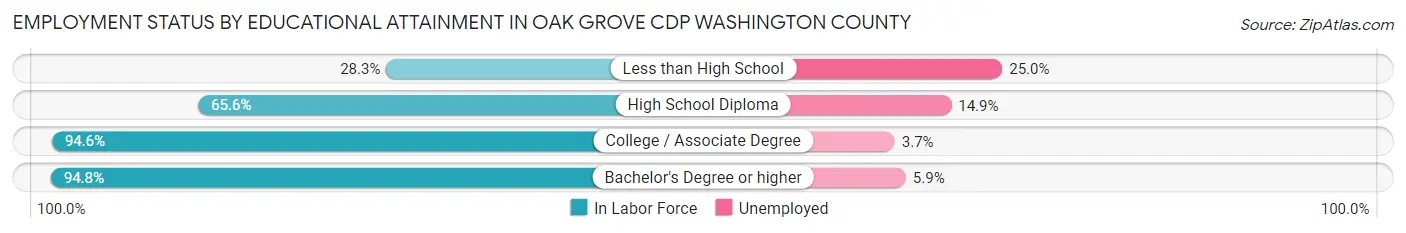
Employment Status by Educational Attainment in Oak Grove CDP Washington County
According to labor force statistics for Oak Grove CDP Washington County, 80.3% of individuals (1,760) out of the total population between 25 and 64 years of age (2,192) are in the labor force, with 8.1% or 143 of them being unemployed. The group with the highest labor force participation rate are those with the educational attainment of bachelor's degree or higher, with 94.8% or 766 individuals in the labor force. Within the labor force, individuals with less than high school education have the highest percentage of unemployment, with 25.0% or 13 of them being unemployed.
| Educational Attainment | In Labor Force | Unemployed |
| Less than High School | 52 (28.3%) | 46 (25.0%) |
| High School Diploma | 435 (65.6%) | 99 (14.9%) |
| College / Associate Degree | 508 (94.6%) | 20 (3.7%) |
| Bachelor's Degree or higher | 766 (94.8%) | 48 (5.9%) |
| Total | 1,760 (80.3%) | 178 (8.1%) |
Employment Occupations by Sex in Oak Grove CDP Washington County
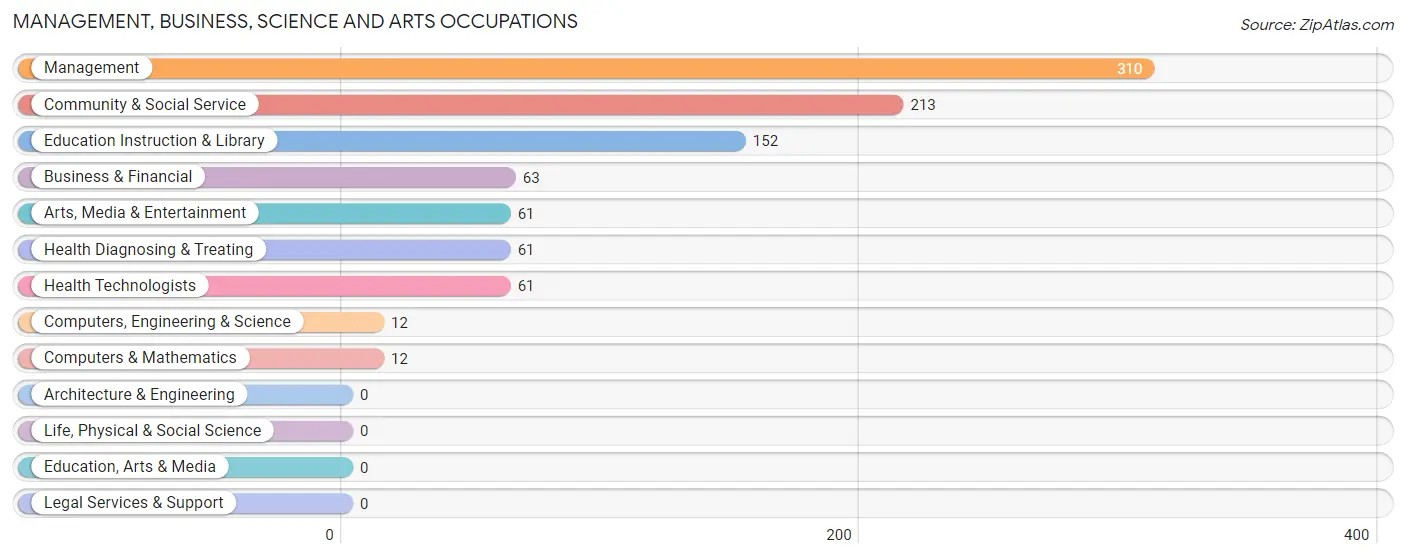
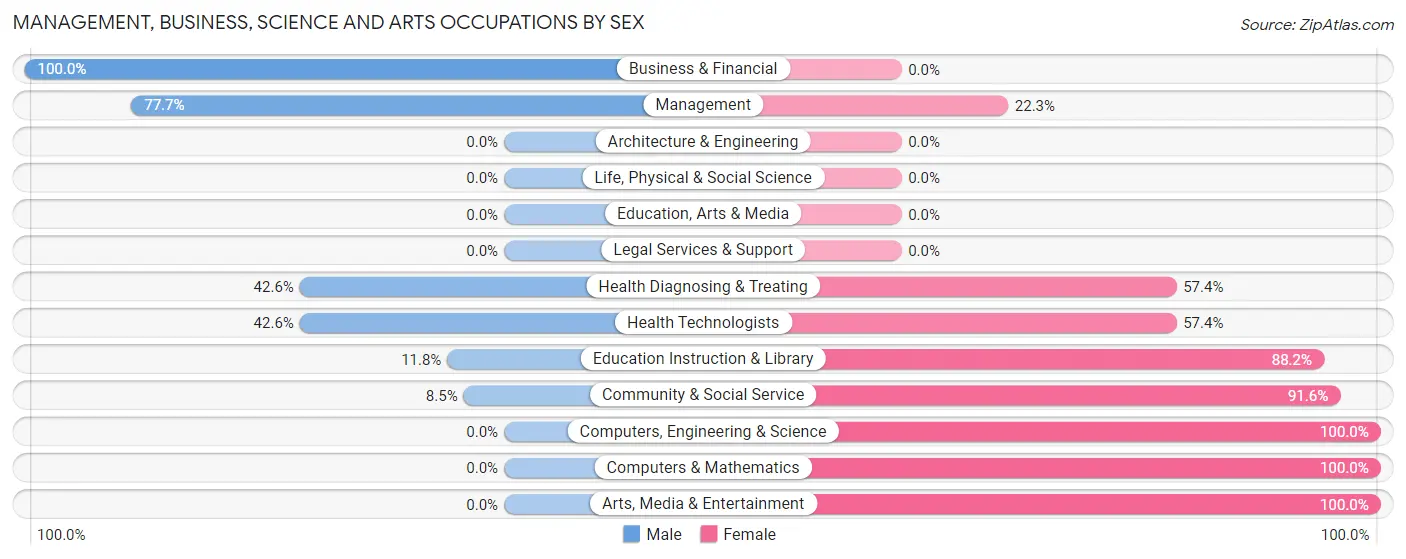
Management, Business, Science and Arts Occupations
The most common Management, Business, Science and Arts occupations in Oak Grove CDP Washington County are Management (310 | 15.9%), Community & Social Service (213 | 10.9%), Education Instruction & Library (152 | 7.8%), Business & Financial (63 | 3.2%), and Arts, Media & Entertainment (61 | 3.1%).
Management, Business, Science and Arts Occupations by Sex
Within the Management, Business, Science and Arts occupations in Oak Grove CDP Washington County, the most male-oriented occupations are Business & Financial (100.0%), Management (77.7%), and Health Diagnosing & Treating (42.6%), while the most female-oriented occupations are Computers, Engineering & Science (100.0%), Computers & Mathematics (100.0%), and Arts, Media & Entertainment (100.0%).
| Occupation | Male | Female |
| Management | 241 (77.7%) | 69 (22.3%) |
| Business & Financial | 63 (100.0%) | 0 (0.0%) |
| Computers, Engineering & Science | 0 (0.0%) | 12 (100.0%) |
| Computers & Mathematics | 0 (0.0%) | 12 (100.0%) |
| Architecture & Engineering | 0 (0.0%) | 0 (0.0%) |
| Life, Physical & Social Science | 0 (0.0%) | 0 (0.0%) |
| Community & Social Service | 18 (8.5%) | 195 (91.5%) |
| Education, Arts & Media | 0 (0.0%) | 0 (0.0%) |
| Legal Services & Support | 0 (0.0%) | 0 (0.0%) |
| Education Instruction & Library | 18 (11.8%) | 134 (88.2%) |
| Arts, Media & Entertainment | 0 (0.0%) | 61 (100.0%) |
| Health Diagnosing & Treating | 26 (42.6%) | 35 (57.4%) |
| Health Technologists | 26 (42.6%) | 35 (57.4%) |
| Total (Category) | 348 (52.8%) | 311 (47.2%) |
| Total (Overall) | 1,010 (51.9%) | 937 (48.1%) |
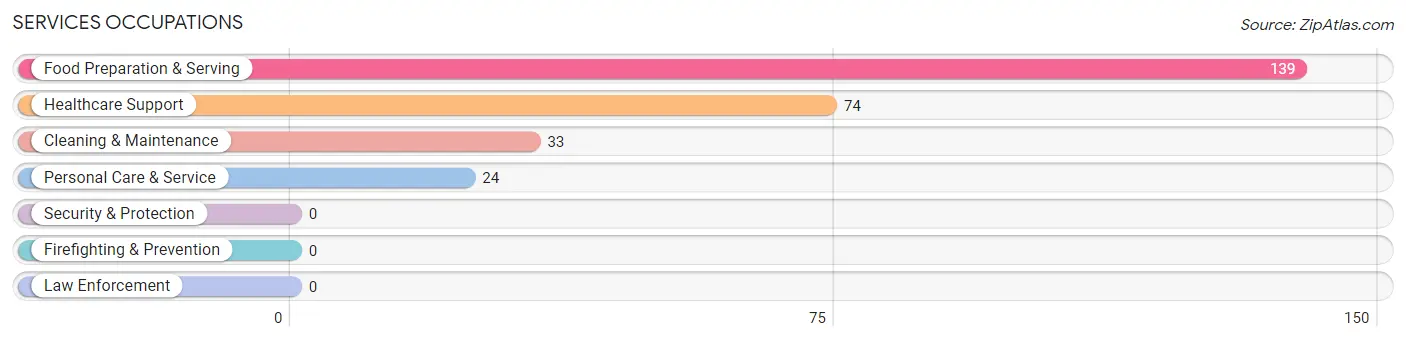
Services Occupations
The most common Services occupations in Oak Grove CDP Washington County are Food Preparation & Serving (139 | 7.1%), Healthcare Support (74 | 3.8%), Cleaning & Maintenance (33 | 1.7%), and Personal Care & Service (24 | 1.2%).
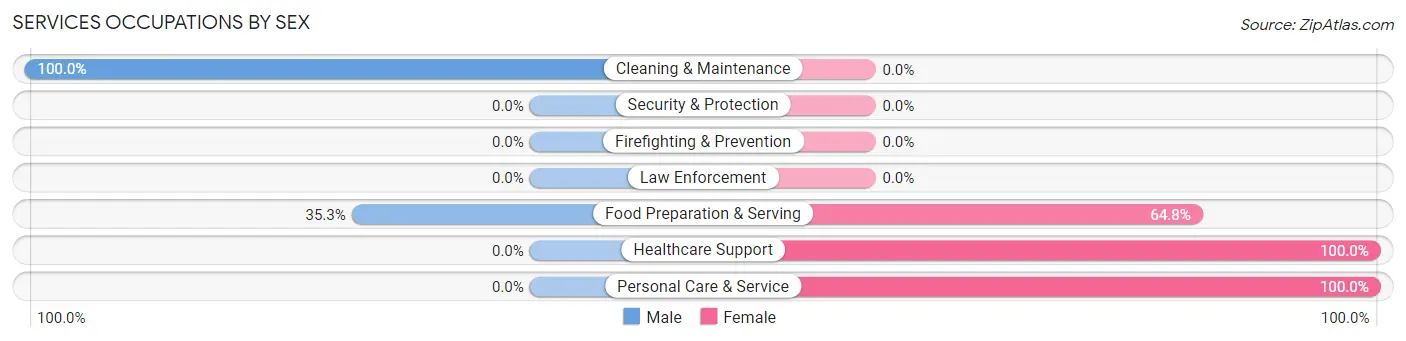
Services Occupations by Sex
Within the Services occupations in Oak Grove CDP Washington County, the most male-oriented occupations are Cleaning & Maintenance (100.0%), and Food Preparation & Serving (35.2%), while the most female-oriented occupations are Healthcare Support (100.0%), Personal Care & Service (100.0%), and Food Preparation & Serving (64.7%).
| Occupation | Male | Female |
| Healthcare Support | 0 (0.0%) | 74 (100.0%) |
| Security & Protection | 0 (0.0%) | 0 (0.0%) |
| Firefighting & Prevention | 0 (0.0%) | 0 (0.0%) |
| Law Enforcement | 0 (0.0%) | 0 (0.0%) |
| Food Preparation & Serving | 49 (35.2%) | 90 (64.7%) |
| Cleaning & Maintenance | 33 (100.0%) | 0 (0.0%) |
| Personal Care & Service | 0 (0.0%) | 24 (100.0%) |
| Total (Category) | 82 (30.4%) | 188 (69.6%) |
| Total (Overall) | 1,010 (51.9%) | 937 (48.1%) |
Sales and Office Occupations
The most common Sales and Office occupations in Oak Grove CDP Washington County are Sales & Related (466 | 23.9%), and Office & Administration (188 | 9.7%).

Sales and Office Occupations by Sex

| Occupation | Male | Female |
| Sales & Related | 299 (64.2%) | 167 (35.8%) |
| Office & Administration | 37 (19.7%) | 151 (80.3%) |
| Total (Category) | 336 (51.4%) | 318 (48.6%) |
| Total (Overall) | 1,010 (51.9%) | 937 (48.1%) |
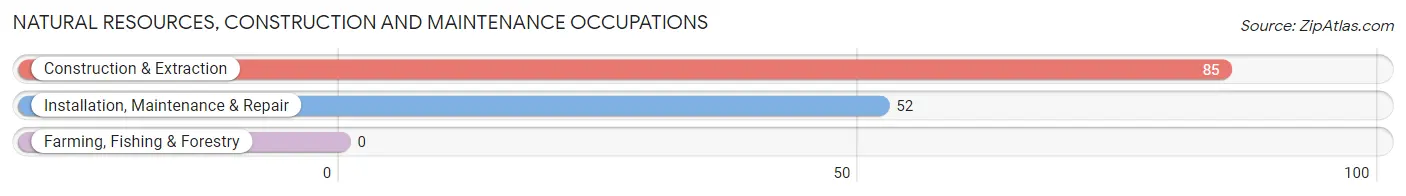
Natural Resources, Construction and Maintenance Occupations
The most common Natural Resources, Construction and Maintenance occupations in Oak Grove CDP Washington County are Construction & Extraction (85 | 4.4%), and Installation, Maintenance & Repair (52 | 2.7%).
Natural Resources, Construction and Maintenance Occupations by Sex

| Occupation | Male | Female |
| Farming, Fishing & Forestry | 0 (0.0%) | 0 (0.0%) |
| Construction & Extraction | 85 (100.0%) | 0 (0.0%) |
| Installation, Maintenance & Repair | 52 (100.0%) | 0 (0.0%) |
| Total (Category) | 137 (100.0%) | 0 (0.0%) |
| Total (Overall) | 1,010 (51.9%) | 937 (48.1%) |
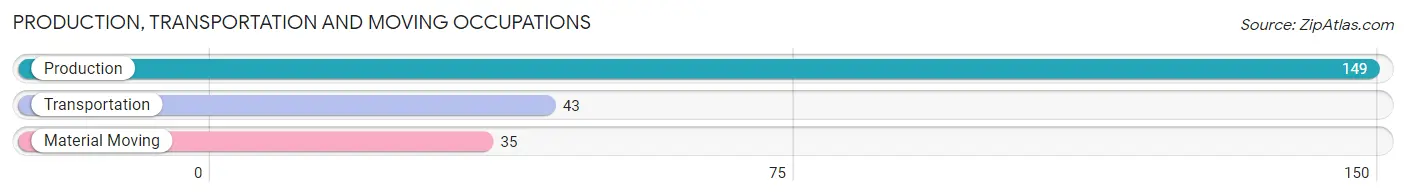
Production, Transportation and Moving Occupations
The most common Production, Transportation and Moving occupations in Oak Grove CDP Washington County are Production (149 | 7.6%), Transportation (43 | 2.2%), and Material Moving (35 | 1.8%).
Production, Transportation and Moving Occupations by Sex
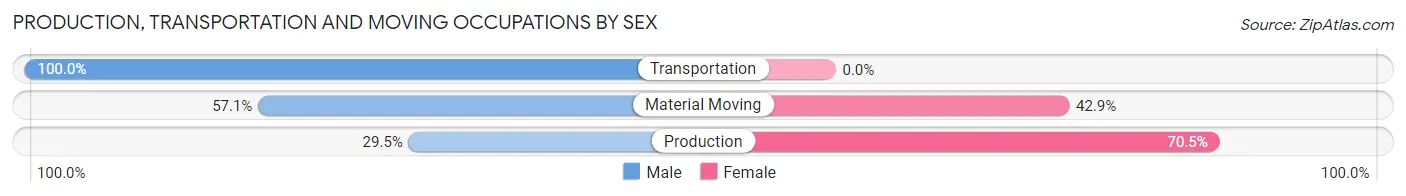
| Occupation | Male | Female |
| Production | 44 (29.5%) | 105 (70.5%) |
| Transportation | 43 (100.0%) | 0 (0.0%) |
| Material Moving | 20 (57.1%) | 15 (42.9%) |
| Total (Category) | 107 (47.1%) | 120 (52.9%) |
| Total (Overall) | 1,010 (51.9%) | 937 (48.1%) |
Employment Industries by Sex in Oak Grove CDP Washington County
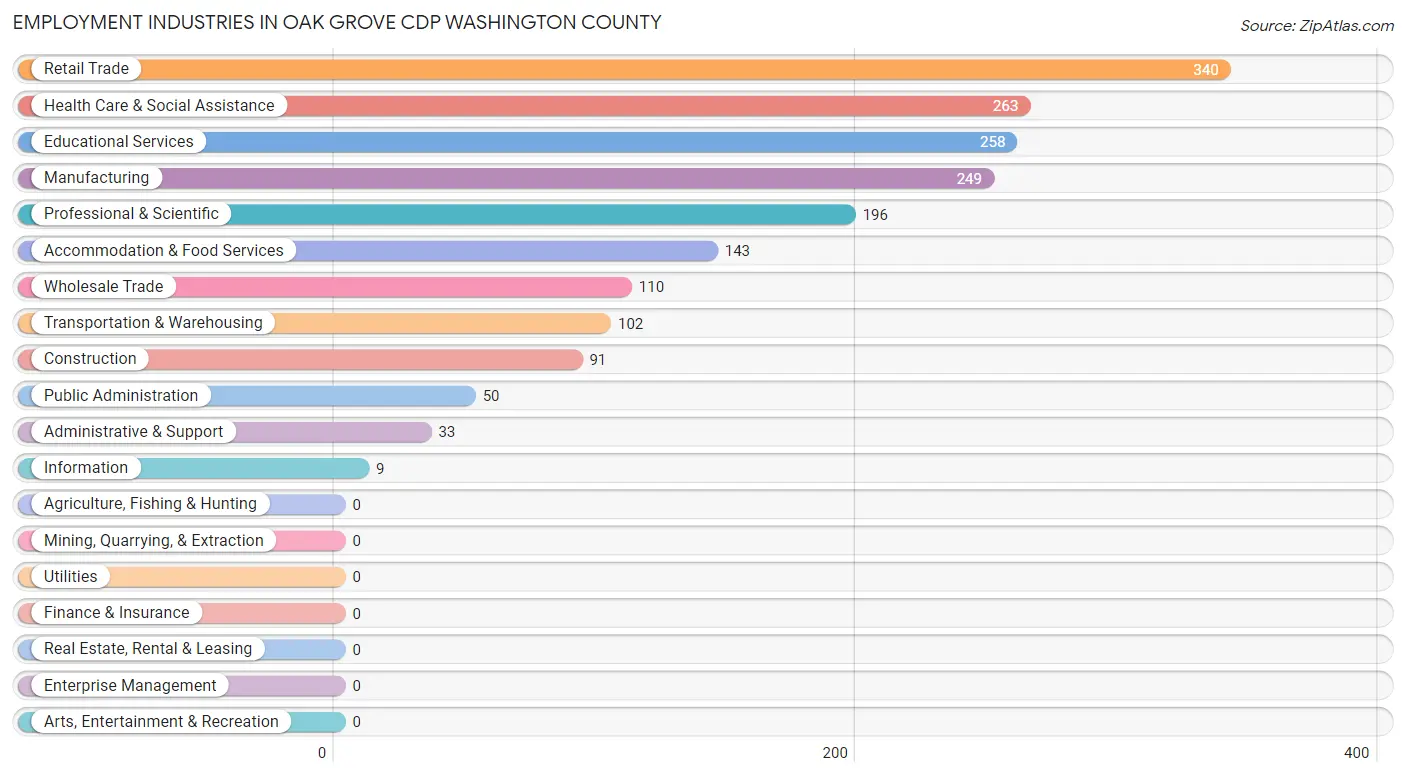
Employment Industries in Oak Grove CDP Washington County
The major employment industries in Oak Grove CDP Washington County include Retail Trade (340 | 17.5%), Health Care & Social Assistance (263 | 13.5%), Educational Services (258 | 13.3%), Manufacturing (249 | 12.8%), and Professional & Scientific (196 | 10.1%).
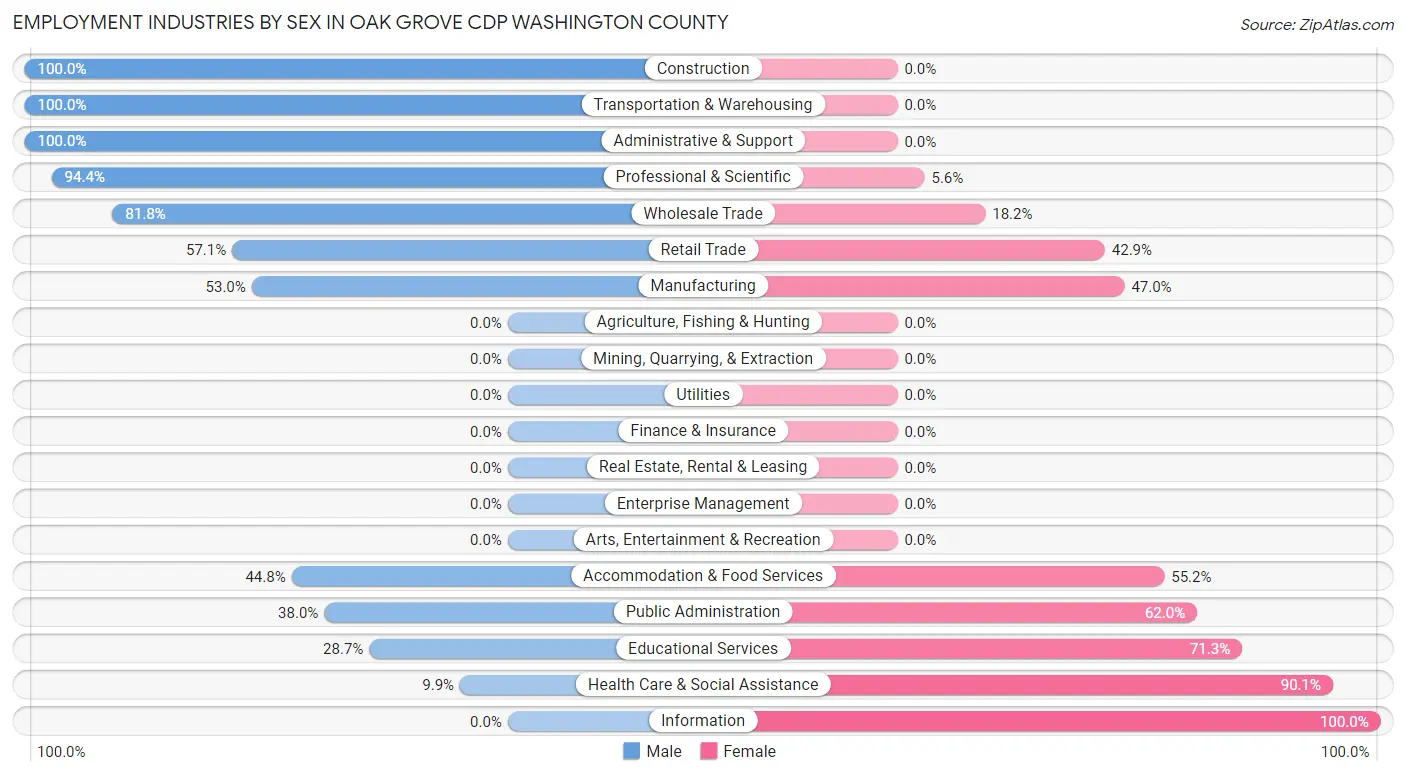
Employment Industries by Sex in Oak Grove CDP Washington County
The Oak Grove CDP Washington County industries that see more men than women are Construction (100.0%), Transportation & Warehousing (100.0%), and Administrative & Support (100.0%), whereas the industries that tend to have a higher number of women are Information (100.0%), Health Care & Social Assistance (90.1%), and Educational Services (71.3%).
| Industry | Male | Female |
| Agriculture, Fishing & Hunting | 0 (0.0%) | 0 (0.0%) |
| Mining, Quarrying, & Extraction | 0 (0.0%) | 0 (0.0%) |
| Construction | 91 (100.0%) | 0 (0.0%) |
| Manufacturing | 132 (53.0%) | 117 (47.0%) |
| Wholesale Trade | 90 (81.8%) | 20 (18.2%) |
| Retail Trade | 194 (57.1%) | 146 (42.9%) |
| Transportation & Warehousing | 102 (100.0%) | 0 (0.0%) |
| Utilities | 0 (0.0%) | 0 (0.0%) |
| Information | 0 (0.0%) | 9 (100.0%) |
| Finance & Insurance | 0 (0.0%) | 0 (0.0%) |
| Real Estate, Rental & Leasing | 0 (0.0%) | 0 (0.0%) |
| Professional & Scientific | 185 (94.4%) | 11 (5.6%) |
| Enterprise Management | 0 (0.0%) | 0 (0.0%) |
| Administrative & Support | 33 (100.0%) | 0 (0.0%) |
| Educational Services | 74 (28.7%) | 184 (71.3%) |
| Health Care & Social Assistance | 26 (9.9%) | 237 (90.1%) |
| Arts, Entertainment & Recreation | 0 (0.0%) | 0 (0.0%) |
| Accommodation & Food Services | 64 (44.8%) | 79 (55.2%) |
| Public Administration | 19 (38.0%) | 31 (62.0%) |
| Total | 1,010 (51.9%) | 937 (48.1%) |
Education in Oak Grove CDP Washington County
School Enrollment in Oak Grove CDP Washington County
The most common levels of schooling among the 748 students in Oak Grove CDP Washington County are elementary school (235 | 31.4%), high school (190 | 25.4%), and middle school (178 | 23.8%).
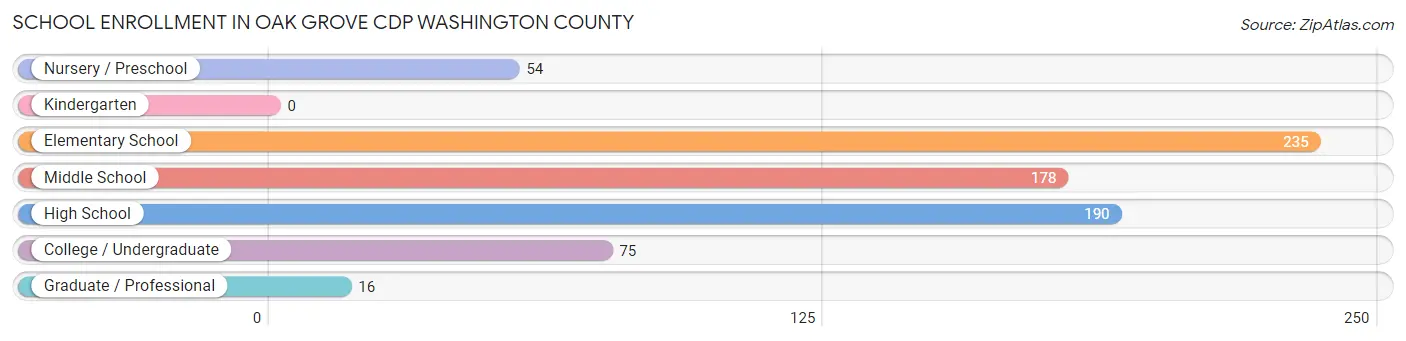
| School Level | # Students | % Students |
| Nursery / Preschool | 54 | 7.2% |
| Kindergarten | 0 | 0.0% |
| Elementary School | 235 | 31.4% |
| Middle School | 178 | 23.8% |
| High School | 190 | 25.4% |
| College / Undergraduate | 75 | 10.0% |
| Graduate / Professional | 16 | 2.1% |
| Total | 748 | 100.0% |
School Enrollment by Age by Funding Source in Oak Grove CDP Washington County
Out of a total of 748 students who are enrolled in schools in Oak Grove CDP Washington County, 124 (16.6%) attend a private institution, while the remaining 624 (83.4%) are enrolled in public schools. The age group of 25 to 34 year olds has the highest likelihood of being enrolled in private schools, with 8 (50.0% in the age bracket) enrolled. Conversely, the age group of 18 to 19 year olds has the lowest likelihood of being enrolled in a private school, with 56 (100.0% in the age bracket) attending a public institution.
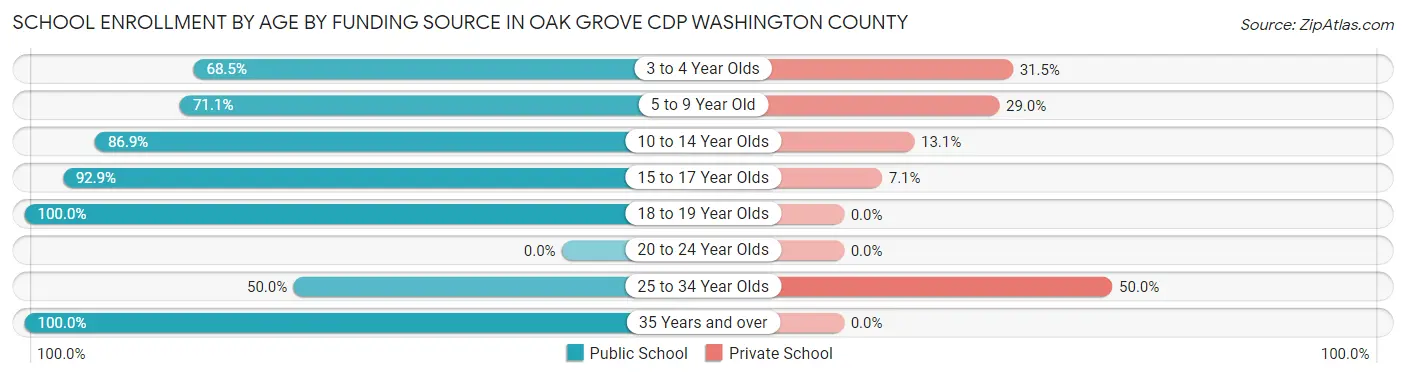
| Age Bracket | Public School | Private School |
| 3 to 4 Year Olds | 37 (68.5%) | 17 (31.5%) |
| 5 to 9 Year Old | 135 (71.1%) | 55 (28.9%) |
| 10 to 14 Year Olds | 212 (86.9%) | 32 (13.1%) |
| 15 to 17 Year Olds | 157 (92.9%) | 12 (7.1%) |
| 18 to 19 Year Olds | 56 (100.0%) | 0 (0.0%) |
| 20 to 24 Year Olds | 0 (0.0%) | 0 (0.0%) |
| 25 to 34 Year Olds | 8 (50.0%) | 8 (50.0%) |
| 35 Years and over | 19 (100.0%) | 0 (0.0%) |
| Total | 624 (83.4%) | 124 (16.6%) |
Educational Attainment by Field of Study in Oak Grove CDP Washington County
Education (308 | 25.4%), business (307 | 25.3%), science & technology (118 | 9.7%), arts & humanities (107 | 8.8%), and engineering (98 | 8.1%) are the most common fields of study among 1,213 individuals in Oak Grove CDP Washington County who have obtained a bachelor's degree or higher.
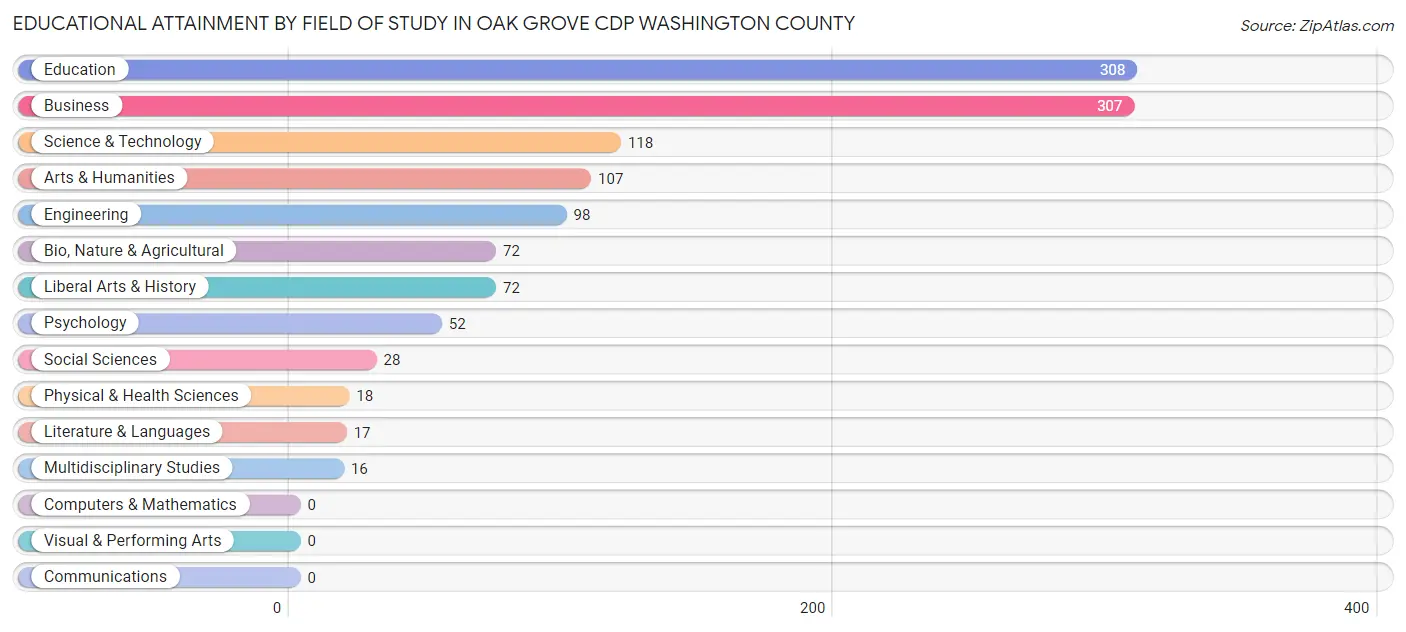
| Field of Study | # Graduates | % Graduates |
| Computers & Mathematics | 0 | 0.0% |
| Bio, Nature & Agricultural | 72 | 5.9% |
| Physical & Health Sciences | 18 | 1.5% |
| Psychology | 52 | 4.3% |
| Social Sciences | 28 | 2.3% |
| Engineering | 98 | 8.1% |
| Multidisciplinary Studies | 16 | 1.3% |
| Science & Technology | 118 | 9.7% |
| Business | 307 | 25.3% |
| Education | 308 | 25.4% |
| Literature & Languages | 17 | 1.4% |
| Liberal Arts & History | 72 | 5.9% |
| Visual & Performing Arts | 0 | 0.0% |
| Communications | 0 | 0.0% |
| Arts & Humanities | 107 | 8.8% |
| Total | 1,213 | 100.0% |
Transportation & Commute in Oak Grove CDP Washington County
Vehicle Availability by Sex in Oak Grove CDP Washington County
The most prevalent vehicle ownership categories in Oak Grove CDP Washington County are males with 2 vehicles (360, accounting for 40.8%) and females with 2 vehicles (378, making up 38.4%).
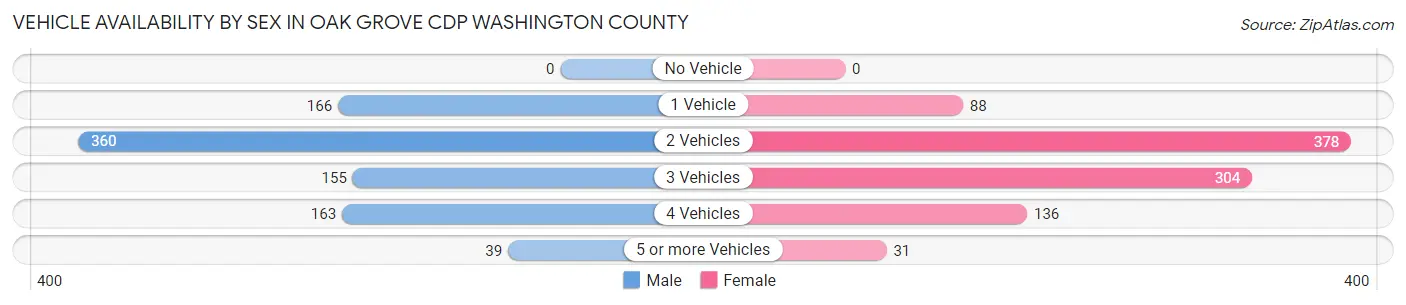
| Vehicles Available | Male | Female |
| No Vehicle | 0 (0.0%) | 0 (0.0%) |
| 1 Vehicle | 166 (18.8%) | 88 (9.4%) |
| 2 Vehicles | 360 (40.8%) | 378 (40.3%) |
| 3 Vehicles | 155 (17.5%) | 304 (32.4%) |
| 4 Vehicles | 163 (18.5%) | 136 (14.5%) |
| 5 or more Vehicles | 39 (4.4%) | 31 (3.3%) |
| Total | 883 (100.0%) | 937 (100.0%) |
Commute Time in Oak Grove CDP Washington County
The most frequently occuring commute durations in Oak Grove CDP Washington County are 15 to 19 minutes (612 commuters, 35.3%), 20 to 24 minutes (331 commuters, 19.1%), and 10 to 14 minutes (218 commuters, 12.6%).
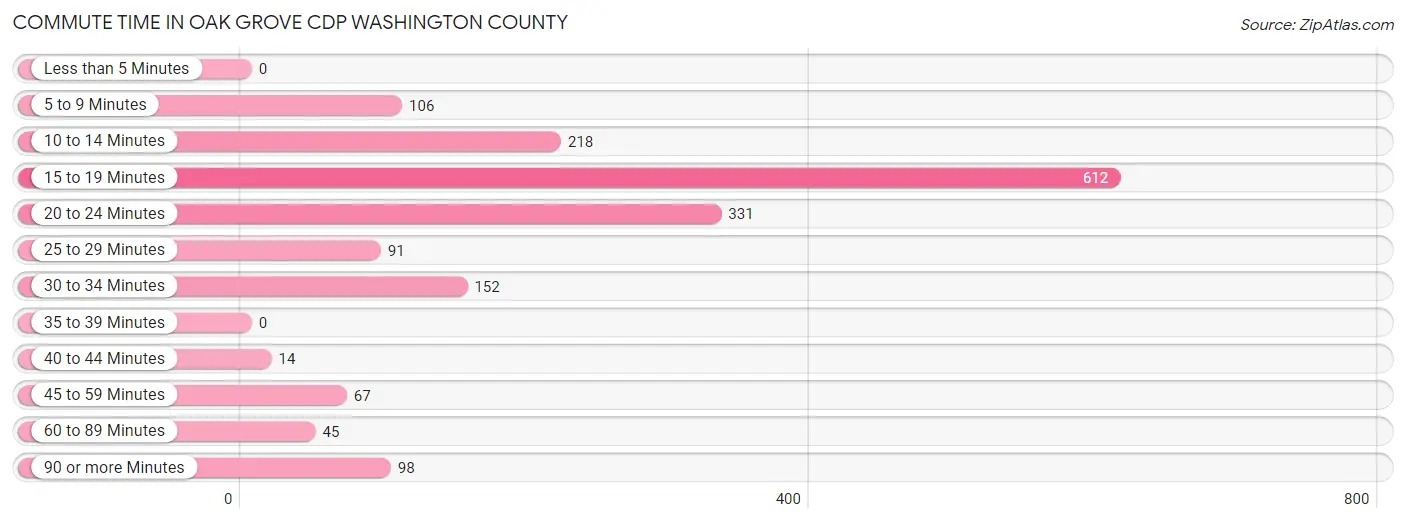
| Commute Time | # Commuters | % Commuters |
| Less than 5 Minutes | 0 | 0.0% |
| 5 to 9 Minutes | 106 | 6.1% |
| 10 to 14 Minutes | 218 | 12.6% |
| 15 to 19 Minutes | 612 | 35.3% |
| 20 to 24 Minutes | 331 | 19.1% |
| 25 to 29 Minutes | 91 | 5.2% |
| 30 to 34 Minutes | 152 | 8.8% |
| 35 to 39 Minutes | 0 | 0.0% |
| 40 to 44 Minutes | 14 | 0.8% |
| 45 to 59 Minutes | 67 | 3.9% |
| 60 to 89 Minutes | 45 | 2.6% |
| 90 or more Minutes | 98 | 5.7% |
Commute Time by Sex in Oak Grove CDP Washington County
The most common commute times in Oak Grove CDP Washington County are 15 to 19 minutes (335 commuters, 41.4%) for males and 15 to 19 minutes (277 commuters, 29.9%) for females.
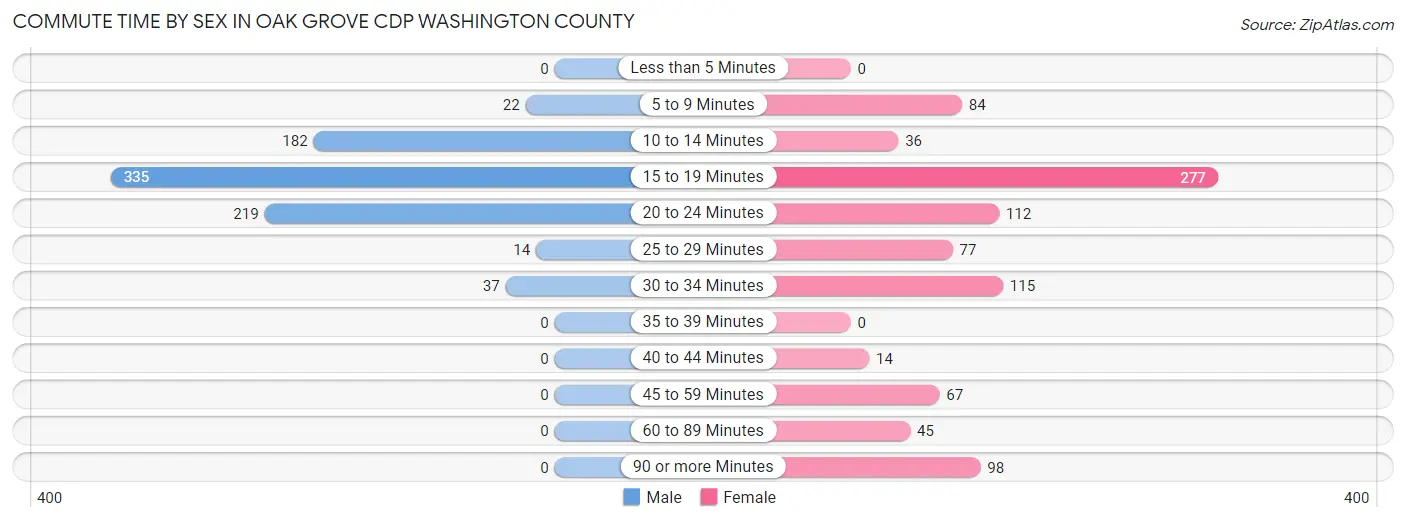
| Commute Time | Male | Female |
| Less than 5 Minutes | 0 (0.0%) | 0 (0.0%) |
| 5 to 9 Minutes | 22 (2.7%) | 84 (9.1%) |
| 10 to 14 Minutes | 182 (22.5%) | 36 (3.9%) |
| 15 to 19 Minutes | 335 (41.4%) | 277 (29.9%) |
| 20 to 24 Minutes | 219 (27.1%) | 112 (12.1%) |
| 25 to 29 Minutes | 14 (1.7%) | 77 (8.3%) |
| 30 to 34 Minutes | 37 (4.6%) | 115 (12.4%) |
| 35 to 39 Minutes | 0 (0.0%) | 0 (0.0%) |
| 40 to 44 Minutes | 0 (0.0%) | 14 (1.5%) |
| 45 to 59 Minutes | 0 (0.0%) | 67 (7.2%) |
| 60 to 89 Minutes | 0 (0.0%) | 45 (4.9%) |
| 90 or more Minutes | 0 (0.0%) | 98 (10.6%) |
Time of Departure to Work by Sex in Oak Grove CDP Washington County
The most frequent times of departure to work in Oak Grove CDP Washington County are 8:00 AM to 8:29 AM (176, 21.8%) for males and 7:00 AM to 7:29 AM (153, 16.5%) for females.
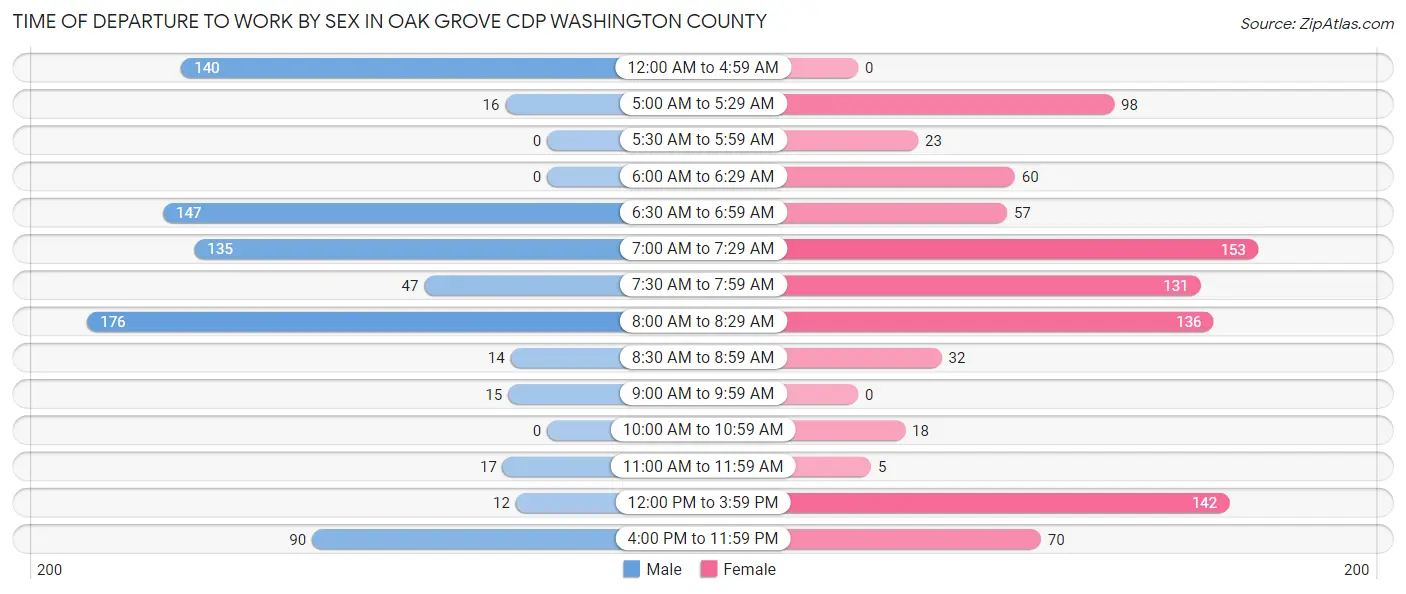
| Time of Departure | Male | Female |
| 12:00 AM to 4:59 AM | 140 (17.3%) | 0 (0.0%) |
| 5:00 AM to 5:29 AM | 16 (2.0%) | 98 (10.6%) |
| 5:30 AM to 5:59 AM | 0 (0.0%) | 23 (2.5%) |
| 6:00 AM to 6:29 AM | 0 (0.0%) | 60 (6.5%) |
| 6:30 AM to 6:59 AM | 147 (18.2%) | 57 (6.2%) |
| 7:00 AM to 7:29 AM | 135 (16.7%) | 153 (16.5%) |
| 7:30 AM to 7:59 AM | 47 (5.8%) | 131 (14.2%) |
| 8:00 AM to 8:29 AM | 176 (21.8%) | 136 (14.7%) |
| 8:30 AM to 8:59 AM | 14 (1.7%) | 32 (3.5%) |
| 9:00 AM to 9:59 AM | 15 (1.8%) | 0 (0.0%) |
| 10:00 AM to 10:59 AM | 0 (0.0%) | 18 (1.9%) |
| 11:00 AM to 11:59 AM | 17 (2.1%) | 5 (0.5%) |
| 12:00 PM to 3:59 PM | 12 (1.5%) | 142 (15.3%) |
| 4:00 PM to 11:59 PM | 90 (11.1%) | 70 (7.6%) |
| Total | 809 (100.0%) | 925 (100.0%) |
Housing Occupancy in Oak Grove CDP Washington County
Occupancy by Ownership in Oak Grove CDP Washington County
Of the total 1,846 dwellings in Oak Grove CDP Washington County, owner-occupied units account for 1,405 (76.1%), while renter-occupied units make up 441 (23.9%).
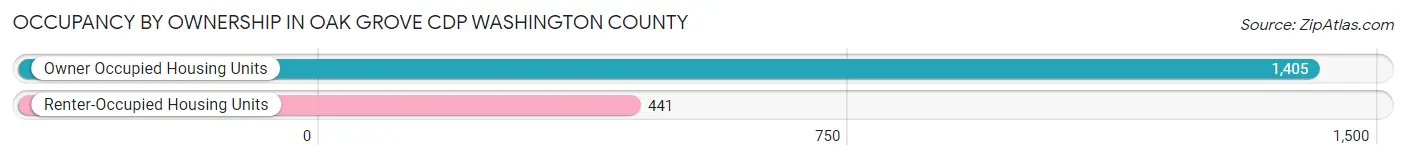
| Occupancy | # Housing Units | % Housing Units |
| Owner Occupied Housing Units | 1,405 | 76.1% |
| Renter-Occupied Housing Units | 441 | 23.9% |
| Total Occupied Housing Units | 1,846 | 100.0% |
Occupancy by Household Size in Oak Grove CDP Washington County
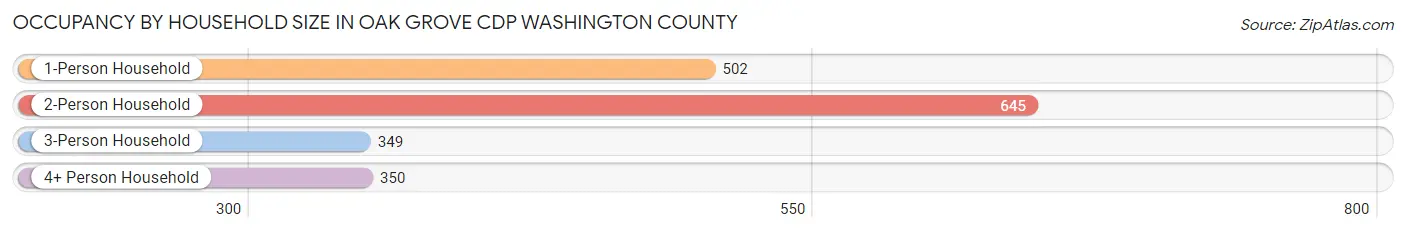
| Household Size | # Housing Units | % Housing Units |
| 1-Person Household | 502 | 27.2% |
| 2-Person Household | 645 | 34.9% |
| 3-Person Household | 349 | 18.9% |
| 4+ Person Household | 350 | 19.0% |
| Total Housing Units | 1,846 | 100.0% |
Occupancy by Ownership by Household Size in Oak Grove CDP Washington County
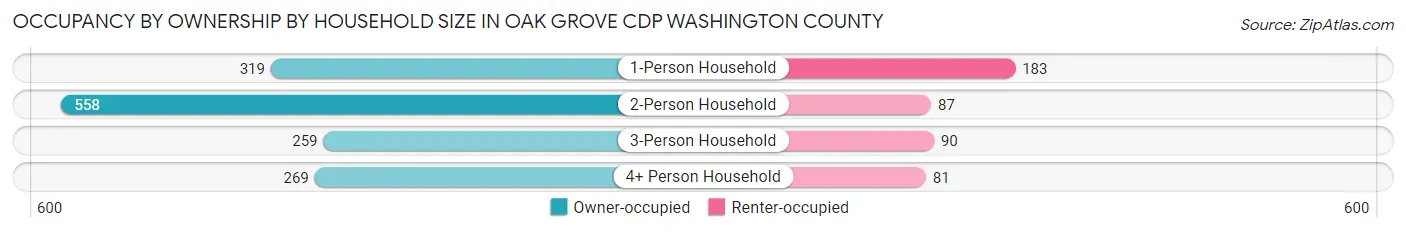
| Household Size | Owner-occupied | Renter-occupied |
| 1-Person Household | 319 (63.5%) | 183 (36.4%) |
| 2-Person Household | 558 (86.5%) | 87 (13.5%) |
| 3-Person Household | 259 (74.2%) | 90 (25.8%) |
| 4+ Person Household | 269 (76.9%) | 81 (23.1%) |
| Total Housing Units | 1,405 (76.1%) | 441 (23.9%) |
Occupancy by Educational Attainment in Oak Grove CDP Washington County
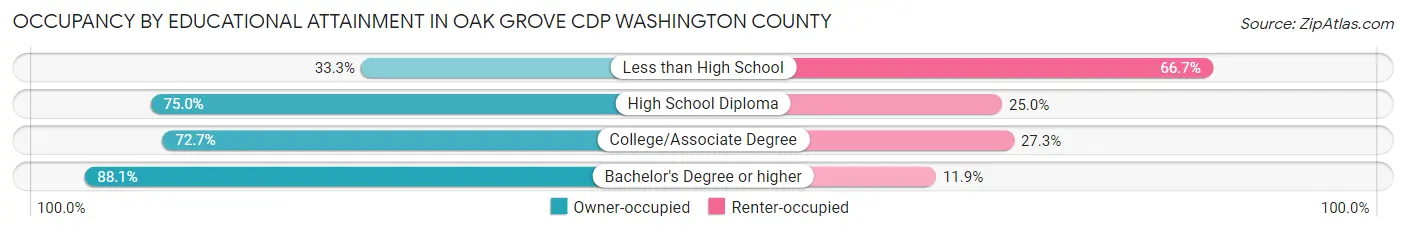
| Household Size | Owner-occupied | Renter-occupied |
| Less than High School | 30 (33.3%) | 60 (66.7%) |
| High School Diploma | 445 (75.0%) | 148 (25.0%) |
| College/Associate Degree | 447 (72.7%) | 168 (27.3%) |
| Bachelor's Degree or higher | 483 (88.1%) | 65 (11.9%) |
Occupancy by Age of Householder in Oak Grove CDP Washington County
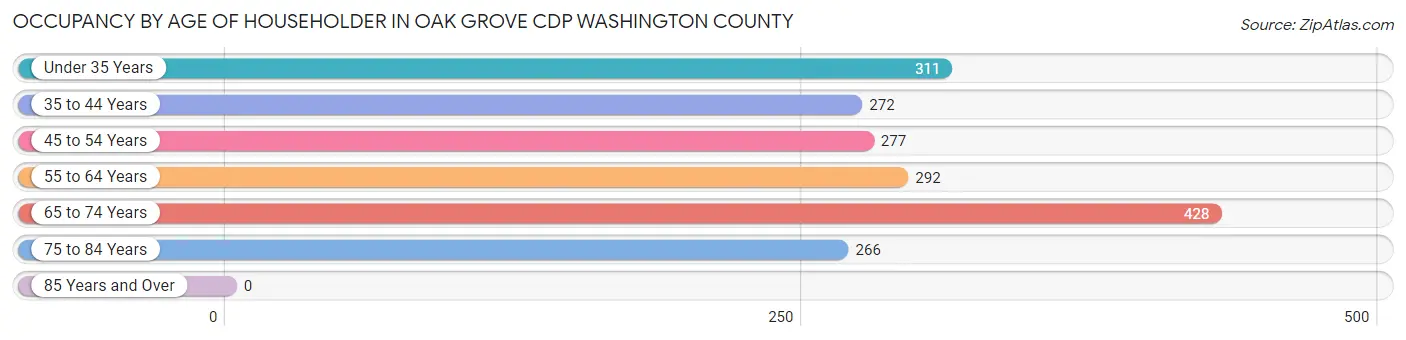
| Age Bracket | # Households | % Households |
| Under 35 Years | 311 | 16.9% |
| 35 to 44 Years | 272 | 14.7% |
| 45 to 54 Years | 277 | 15.0% |
| 55 to 64 Years | 292 | 15.8% |
| 65 to 74 Years | 428 | 23.2% |
| 75 to 84 Years | 266 | 14.4% |
| 85 Years and Over | 0 | 0.0% |
| Total | 1,846 | 100.0% |
Housing Finances in Oak Grove CDP Washington County
Median Income by Occupancy in Oak Grove CDP Washington County
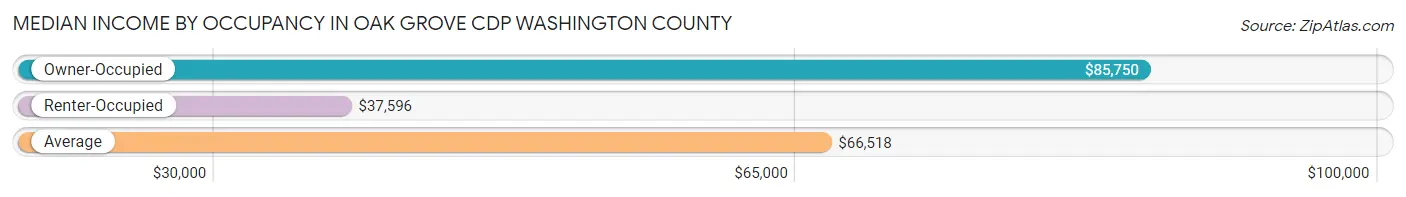
| Occupancy Type | # Households | Median Income |
| Owner-Occupied | 1,405 (76.1%) | $85,750 |
| Renter-Occupied | 441 (23.9%) | $37,596 |
| Average | 1,846 (100.0%) | $66,518 |
Occupancy by Householder Income Bracket in Oak Grove CDP Washington County
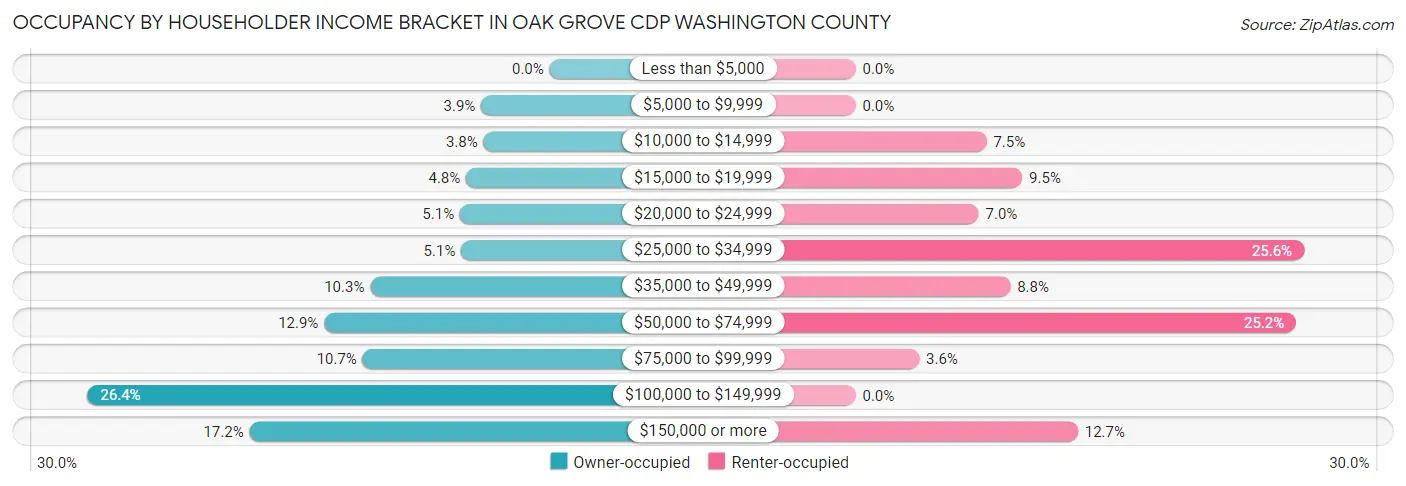
| Income Bracket | Owner-occupied | Renter-occupied |
| Less than $5,000 | 0 (0.0%) | 0 (0.0%) |
| $5,000 to $9,999 | 55 (3.9%) | 0 (0.0%) |
| $10,000 to $14,999 | 53 (3.8%) | 33 (7.5%) |
| $15,000 to $19,999 | 67 (4.8%) | 42 (9.5%) |
| $20,000 to $24,999 | 72 (5.1%) | 31 (7.0%) |
| $25,000 to $34,999 | 71 (5.1%) | 113 (25.6%) |
| $35,000 to $49,999 | 144 (10.2%) | 39 (8.8%) |
| $50,000 to $74,999 | 181 (12.9%) | 111 (25.2%) |
| $75,000 to $99,999 | 150 (10.7%) | 16 (3.6%) |
| $100,000 to $149,999 | 371 (26.4%) | 0 (0.0%) |
| $150,000 or more | 241 (17.2%) | 56 (12.7%) |
| Total | 1,405 (100.0%) | 441 (100.0%) |
Monthly Housing Cost Tiers in Oak Grove CDP Washington County
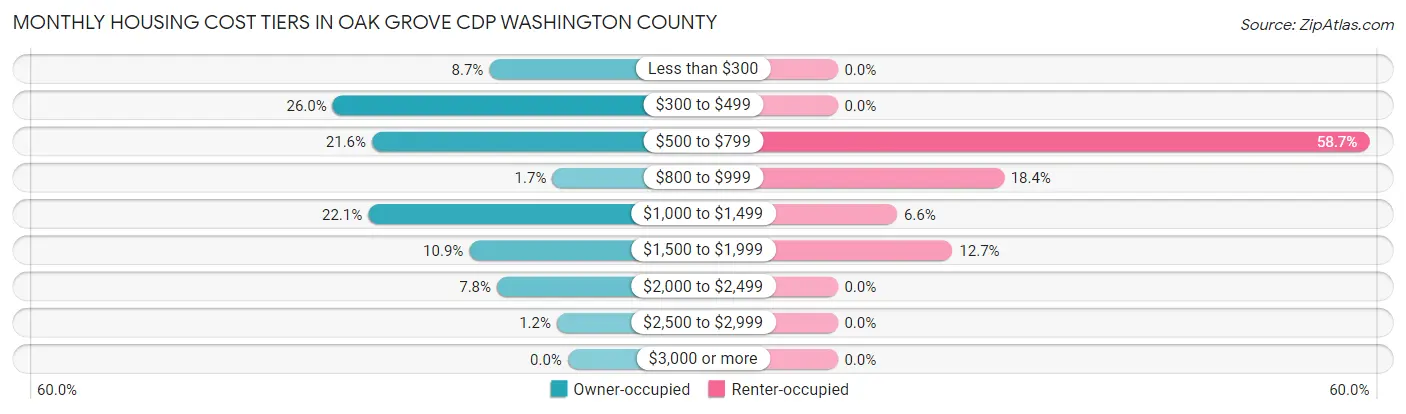
| Monthly Cost | Owner-occupied | Renter-occupied |
| Less than $300 | 122 (8.7%) | 0 (0.0%) |
| $300 to $499 | 365 (26.0%) | 0 (0.0%) |
| $500 to $799 | 304 (21.6%) | 259 (58.7%) |
| $800 to $999 | 24 (1.7%) | 81 (18.4%) |
| $1,000 to $1,499 | 310 (22.1%) | 29 (6.6%) |
| $1,500 to $1,999 | 153 (10.9%) | 56 (12.7%) |
| $2,000 to $2,499 | 110 (7.8%) | 0 (0.0%) |
| $2,500 to $2,999 | 17 (1.2%) | 0 (0.0%) |
| $3,000 or more | 0 (0.0%) | 0 (0.0%) |
| Total | 1,405 (100.0%) | 441 (100.0%) |
Physical Housing Characteristics in Oak Grove CDP Washington County
Housing Structures in Oak Grove CDP Washington County
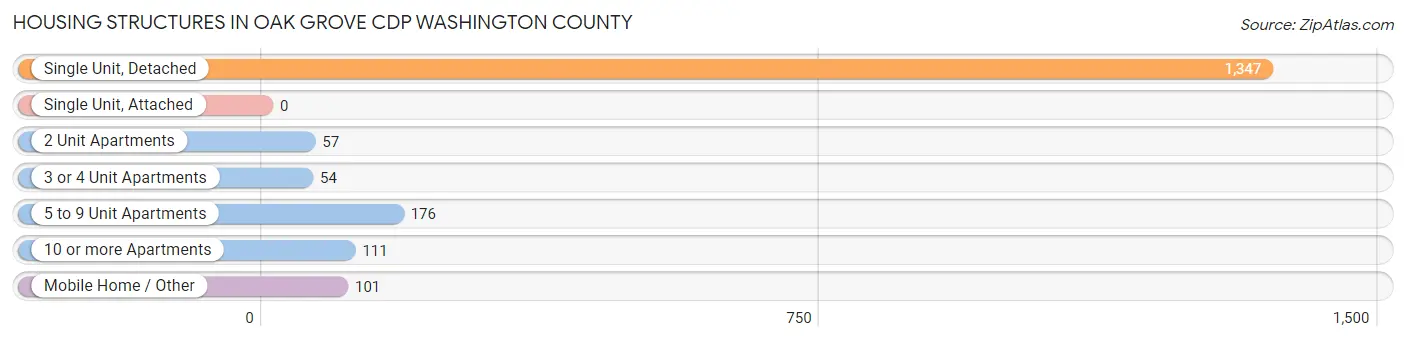
| Structure Type | # Housing Units | % Housing Units |
| Single Unit, Detached | 1,347 | 73.0% |
| Single Unit, Attached | 0 | 0.0% |
| 2 Unit Apartments | 57 | 3.1% |
| 3 or 4 Unit Apartments | 54 | 2.9% |
| 5 to 9 Unit Apartments | 176 | 9.5% |
| 10 or more Apartments | 111 | 6.0% |
| Mobile Home / Other | 101 | 5.5% |
| Total | 1,846 | 100.0% |
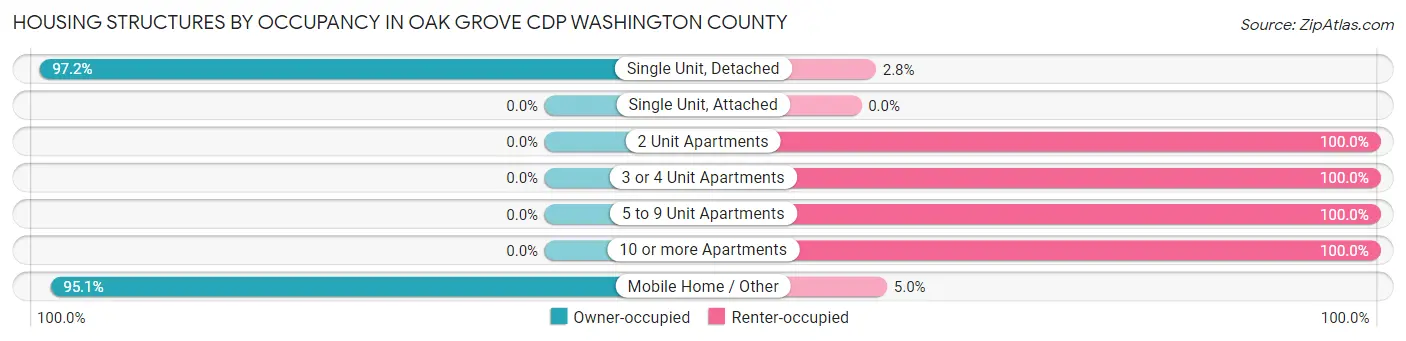
Housing Structures by Occupancy in Oak Grove CDP Washington County
| Structure Type | Owner-occupied | Renter-occupied |
| Single Unit, Detached | 1,309 (97.2%) | 38 (2.8%) |
| Single Unit, Attached | 0 (0.0%) | 0 (0.0%) |
| 2 Unit Apartments | 0 (0.0%) | 57 (100.0%) |
| 3 or 4 Unit Apartments | 0 (0.0%) | 54 (100.0%) |
| 5 to 9 Unit Apartments | 0 (0.0%) | 176 (100.0%) |
| 10 or more Apartments | 0 (0.0%) | 111 (100.0%) |
| Mobile Home / Other | 96 (95.1%) | 5 (5.0%) |
| Total | 1,405 (76.1%) | 441 (23.9%) |
Housing Structures by Number of Rooms in Oak Grove CDP Washington County
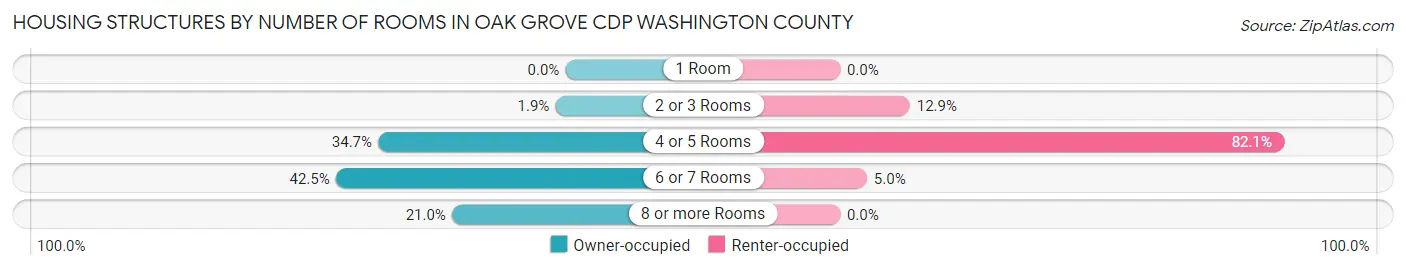
| Number of Rooms | Owner-occupied | Renter-occupied |
| 1 Room | 0 (0.0%) | 0 (0.0%) |
| 2 or 3 Rooms | 26 (1.8%) | 57 (12.9%) |
| 4 or 5 Rooms | 487 (34.7%) | 362 (82.1%) |
| 6 or 7 Rooms | 597 (42.5%) | 22 (5.0%) |
| 8 or more Rooms | 295 (21.0%) | 0 (0.0%) |
| Total | 1,405 (100.0%) | 441 (100.0%) |
Housing Structure by Heating Type in Oak Grove CDP Washington County
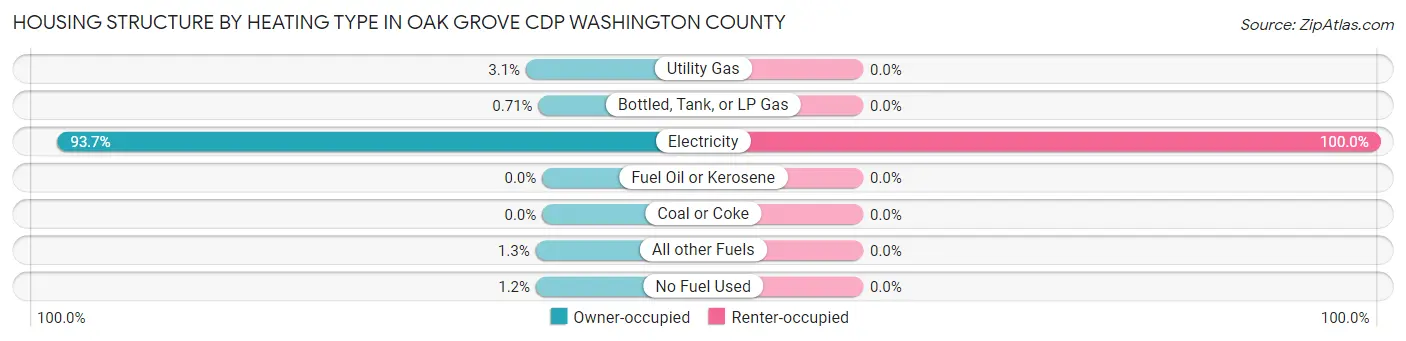
| Heating Type | Owner-occupied | Renter-occupied |
| Utility Gas | 44 (3.1%) | 0 (0.0%) |
| Bottled, Tank, or LP Gas | 10 (0.7%) | 0 (0.0%) |
| Electricity | 1,316 (93.7%) | 441 (100.0%) |
| Fuel Oil or Kerosene | 0 (0.0%) | 0 (0.0%) |
| Coal or Coke | 0 (0.0%) | 0 (0.0%) |
| All other Fuels | 18 (1.3%) | 0 (0.0%) |
| No Fuel Used | 17 (1.2%) | 0 (0.0%) |
| Total | 1,405 (100.0%) | 441 (100.0%) |
Household Vehicle Usage in Oak Grove CDP Washington County
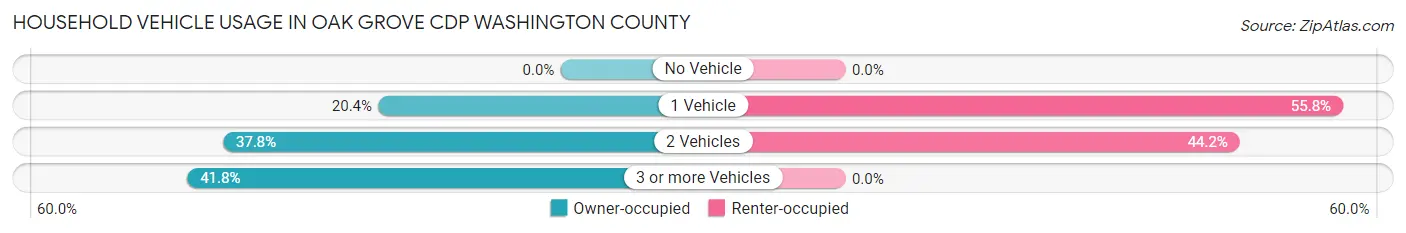
| Vehicles per Household | Owner-occupied | Renter-occupied |
| No Vehicle | 0 (0.0%) | 0 (0.0%) |
| 1 Vehicle | 287 (20.4%) | 246 (55.8%) |
| 2 Vehicles | 531 (37.8%) | 195 (44.2%) |
| 3 or more Vehicles | 587 (41.8%) | 0 (0.0%) |
| Total | 1,405 (100.0%) | 441 (100.0%) |
Real Estate & Mortgages in Oak Grove CDP Washington County
Real Estate and Mortgage Overview in Oak Grove CDP Washington County
| Characteristic | Without Mortgage | With Mortgage |
| Housing Units | 681 | 724 |
| Median Property Value | $222,100 | $247,300 |
| Median Household Income | $52,841 | $202 |
| Monthly Housing Costs | $450 | $0 |
| Real Estate Taxes | $1,135 | $0 |
Property Value by Mortgage Status in Oak Grove CDP Washington County
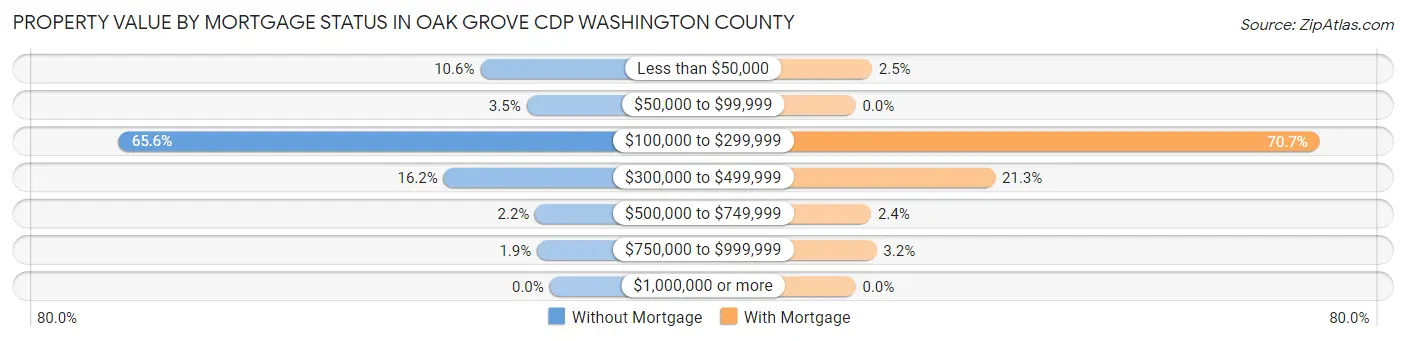
| Property Value | Without Mortgage | With Mortgage |
| Less than $50,000 | 72 (10.6%) | 18 (2.5%) |
| $50,000 to $99,999 | 24 (3.5%) | 0 (0.0%) |
| $100,000 to $299,999 | 447 (65.6%) | 512 (70.7%) |
| $300,000 to $499,999 | 110 (16.2%) | 154 (21.3%) |
| $500,000 to $749,999 | 15 (2.2%) | 17 (2.4%) |
| $750,000 to $999,999 | 13 (1.9%) | 23 (3.2%) |
| $1,000,000 or more | 0 (0.0%) | 0 (0.0%) |
| Total | 681 (100.0%) | 724 (100.0%) |
Household Income by Mortgage Status in Oak Grove CDP Washington County
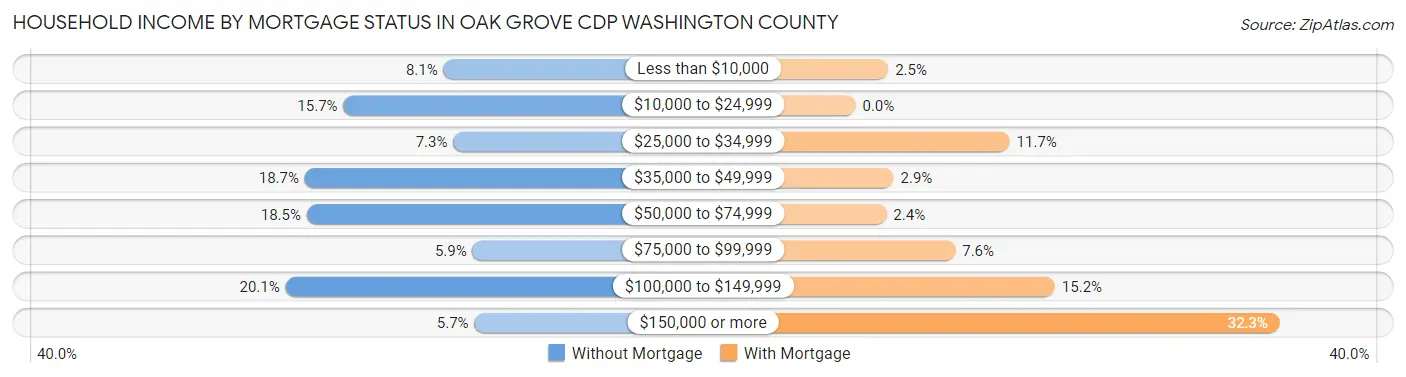
| Household Income | Without Mortgage | With Mortgage |
| Less than $10,000 | 55 (8.1%) | 18 (2.5%) |
| $10,000 to $24,999 | 107 (15.7%) | 0 (0.0%) |
| $25,000 to $34,999 | 50 (7.3%) | 85 (11.7%) |
| $35,000 to $49,999 | 127 (18.6%) | 21 (2.9%) |
| $50,000 to $74,999 | 126 (18.5%) | 17 (2.4%) |
| $75,000 to $99,999 | 40 (5.9%) | 55 (7.6%) |
| $100,000 to $149,999 | 137 (20.1%) | 110 (15.2%) |
| $150,000 or more | 39 (5.7%) | 234 (32.3%) |
| Total | 681 (100.0%) | 724 (100.0%) |
Property Value to Household Income Ratio in Oak Grove CDP Washington County
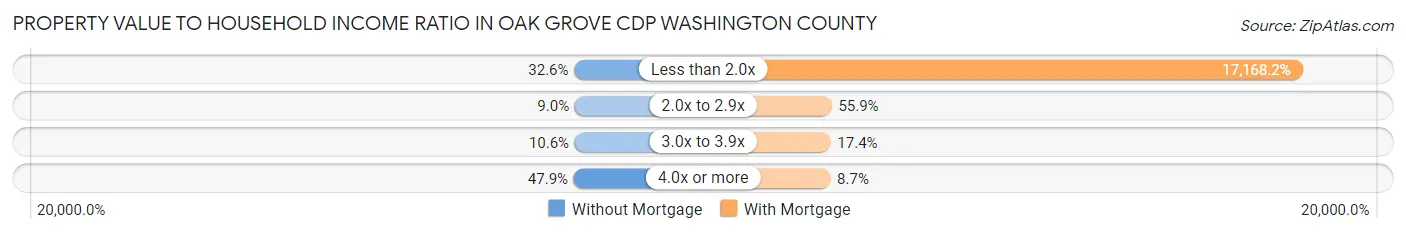
| Value-to-Income Ratio | Without Mortgage | With Mortgage |
| Less than 2.0x | 222 (32.6%) | 124,298 (17,168.2%) |
| 2.0x to 2.9x | 61 (9.0%) | 405 (55.9%) |
| 3.0x to 3.9x | 72 (10.6%) | 126 (17.4%) |
| 4.0x or more | 326 (47.9%) | 63 (8.7%) |
| Total | 681 (100.0%) | 724 (100.0%) |
Real Estate Taxes by Mortgage Status in Oak Grove CDP Washington County
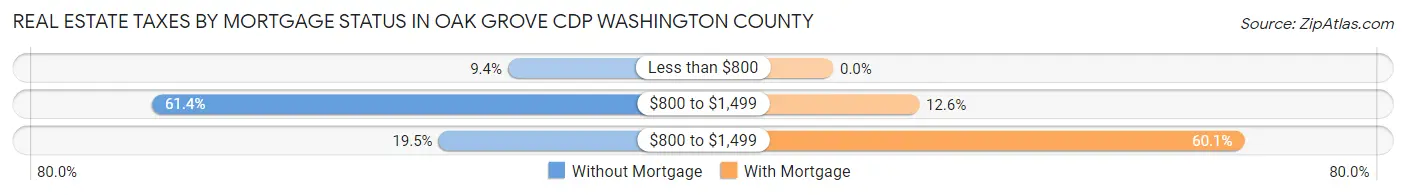
| Property Taxes | Without Mortgage | With Mortgage |
| Less than $800 | 64 (9.4%) | 0 (0.0%) |
| $800 to $1,499 | 418 (61.4%) | 91 (12.6%) |
| $800 to $1,499 | 133 (19.5%) | 435 (60.1%) |
| Total | 681 (100.0%) | 724 (100.0%) |
Health & Disability in Oak Grove CDP Washington County
Health Insurance Coverage by Age in Oak Grove CDP Washington County
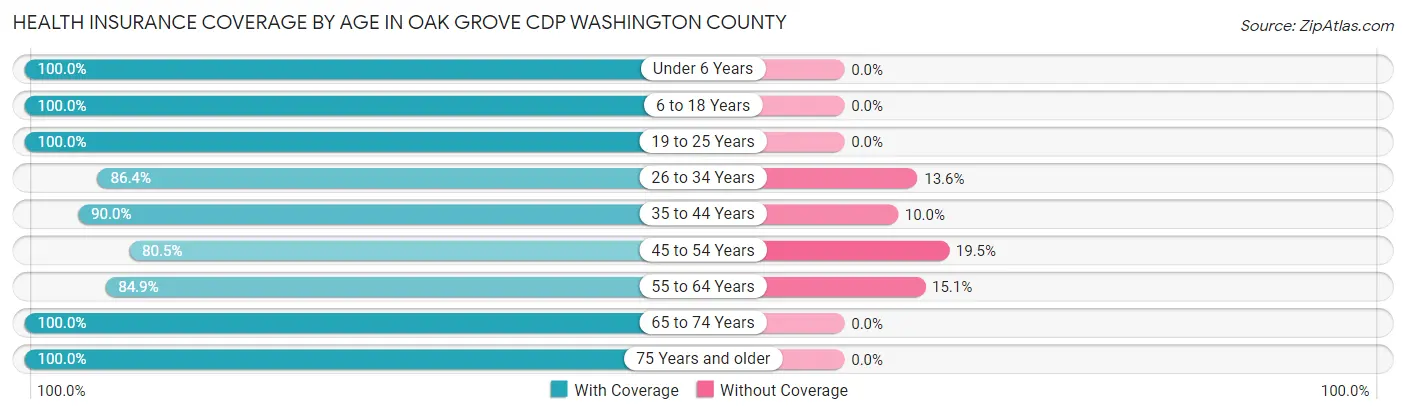
| Age Bracket | With Coverage | Without Coverage |
| Under 6 Years | 180 (100.0%) | 0 (0.0%) |
| 6 to 18 Years | 727 (100.0%) | 0 (0.0%) |
| 19 to 25 Years | 192 (100.0%) | 0 (0.0%) |
| 26 to 34 Years | 552 (86.4%) | 87 (13.6%) |
| 35 to 44 Years | 352 (90.0%) | 39 (10.0%) |
| 45 to 54 Years | 450 (80.5%) | 109 (19.5%) |
| 55 to 64 Years | 502 (84.9%) | 89 (15.1%) |
| 65 to 74 Years | 635 (100.0%) | 0 (0.0%) |
| 75 Years and older | 410 (100.0%) | 0 (0.0%) |
| Total | 4,000 (92.5%) | 324 (7.5%) |
Health Insurance Coverage by Citizenship Status in Oak Grove CDP Washington County

| Citizenship Status | With Coverage | Without Coverage |
| Native Born | 180 (100.0%) | 0 (0.0%) |
| Foreign Born, Citizen | 727 (100.0%) | 0 (0.0%) |
| Foreign Born, not a Citizen | 192 (100.0%) | 0 (0.0%) |
Health Insurance Coverage by Household Income in Oak Grove CDP Washington County
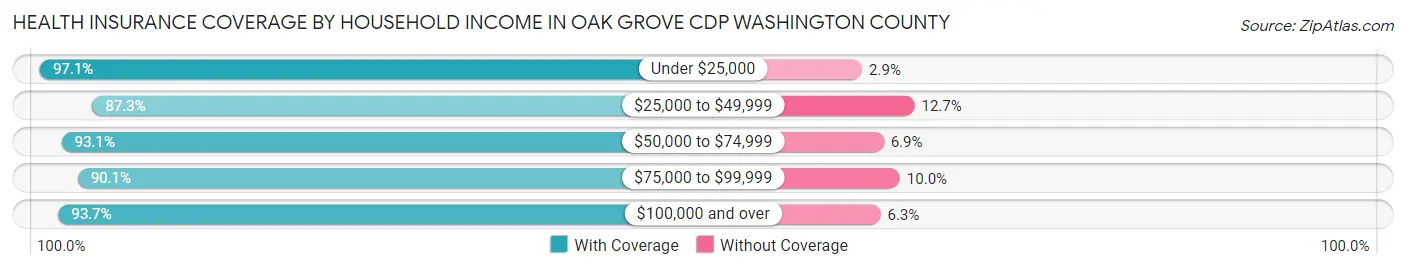
| Household Income | With Coverage | Without Coverage |
| Under $25,000 | 438 (97.1%) | 13 (2.9%) |
| $25,000 to $49,999 | 653 (87.3%) | 95 (12.7%) |
| $50,000 to $74,999 | 780 (93.1%) | 58 (6.9%) |
| $75,000 to $99,999 | 335 (90.0%) | 37 (10.0%) |
| $100,000 and over | 1,794 (93.7%) | 121 (6.3%) |
Public vs Private Health Insurance Coverage by Age in Oak Grove CDP Washington County
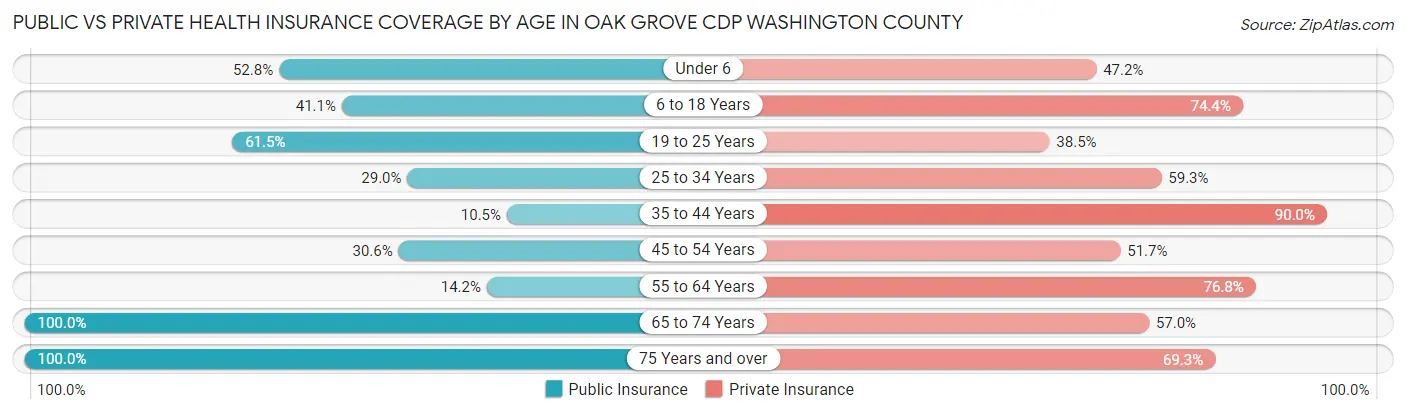
| Age Bracket | Public Insurance | Private Insurance |
| Under 6 | 95 (52.8%) | 85 (47.2%) |
| 6 to 18 Years | 299 (41.1%) | 541 (74.4%) |
| 19 to 25 Years | 118 (61.5%) | 74 (38.5%) |
| 25 to 34 Years | 185 (28.9%) | 379 (59.3%) |
| 35 to 44 Years | 41 (10.5%) | 352 (90.0%) |
| 45 to 54 Years | 171 (30.6%) | 289 (51.7%) |
| 55 to 64 Years | 84 (14.2%) | 454 (76.8%) |
| 65 to 74 Years | 635 (100.0%) | 362 (57.0%) |
| 75 Years and over | 410 (100.0%) | 284 (69.3%) |
| Total | 2,038 (47.1%) | 2,820 (65.2%) |
Disability Status by Sex by Age in Oak Grove CDP Washington County
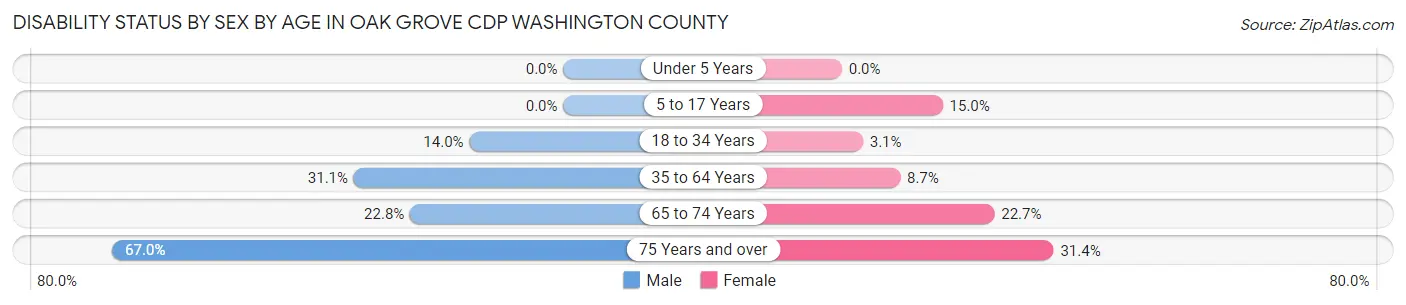
| Age Bracket | Male | Female |
| Under 5 Years | 0 (0.0%) | 0 (0.0%) |
| 5 to 17 Years | 0 (0.0%) | 50 (15.0%) |
| 18 to 34 Years | 65 (14.0%) | 13 (3.1%) |
| 35 to 64 Years | 242 (31.1%) | 66 (8.6%) |
| 65 to 74 Years | 43 (22.8%) | 101 (22.7%) |
| 75 Years and over | 134 (67.0%) | 66 (31.4%) |
Disability Class by Sex by Age in Oak Grove CDP Washington County
Disability Class: Hearing Difficulty
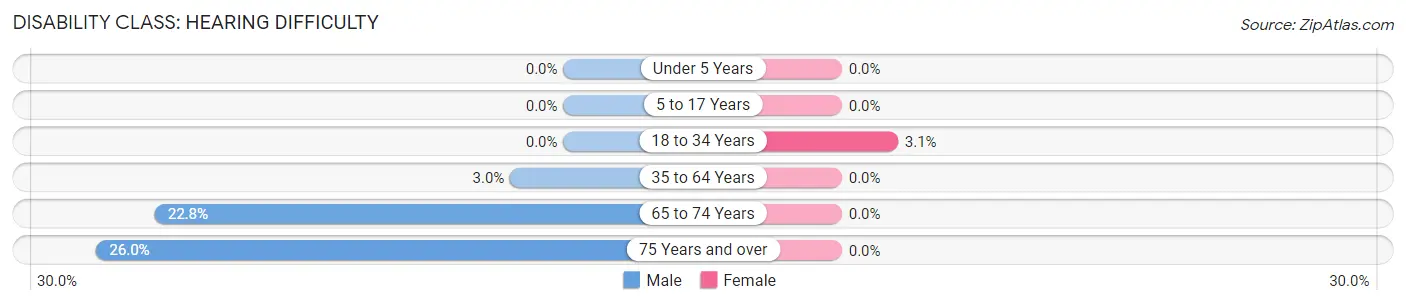
| Age Bracket | Male | Female |
| Under 5 Years | 0 (0.0%) | 0 (0.0%) |
| 5 to 17 Years | 0 (0.0%) | 0 (0.0%) |
| 18 to 34 Years | 0 (0.0%) | 13 (3.1%) |
| 35 to 64 Years | 23 (3.0%) | 0 (0.0%) |
| 65 to 74 Years | 43 (22.8%) | 0 (0.0%) |
| 75 Years and over | 52 (26.0%) | 0 (0.0%) |
Disability Class: Vision Difficulty
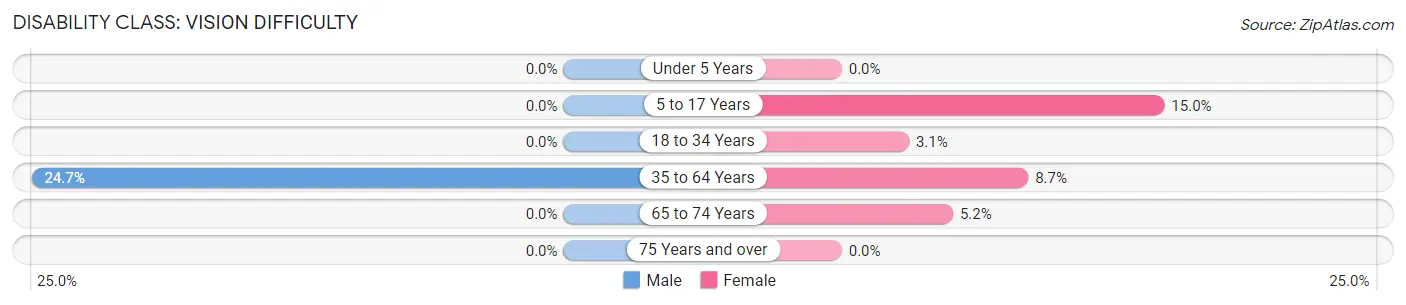
| Age Bracket | Male | Female |
| Under 5 Years | 0 (0.0%) | 0 (0.0%) |
| 5 to 17 Years | 0 (0.0%) | 50 (15.0%) |
| 18 to 34 Years | 0 (0.0%) | 13 (3.1%) |
| 35 to 64 Years | 192 (24.7%) | 66 (8.6%) |
| 65 to 74 Years | 0 (0.0%) | 23 (5.2%) |
| 75 Years and over | 0 (0.0%) | 0 (0.0%) |
Disability Class: Cognitive Difficulty
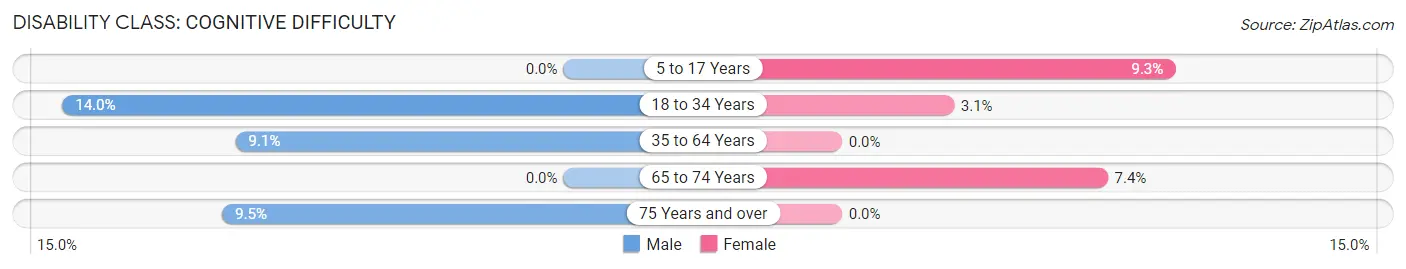
| Age Bracket | Male | Female |
| 5 to 17 Years | 0 (0.0%) | 31 (9.3%) |
| 18 to 34 Years | 65 (14.0%) | 13 (3.1%) |
| 35 to 64 Years | 71 (9.1%) | 0 (0.0%) |
| 65 to 74 Years | 0 (0.0%) | 33 (7.4%) |
| 75 Years and over | 19 (9.5%) | 0 (0.0%) |
Disability Class: Ambulatory Difficulty
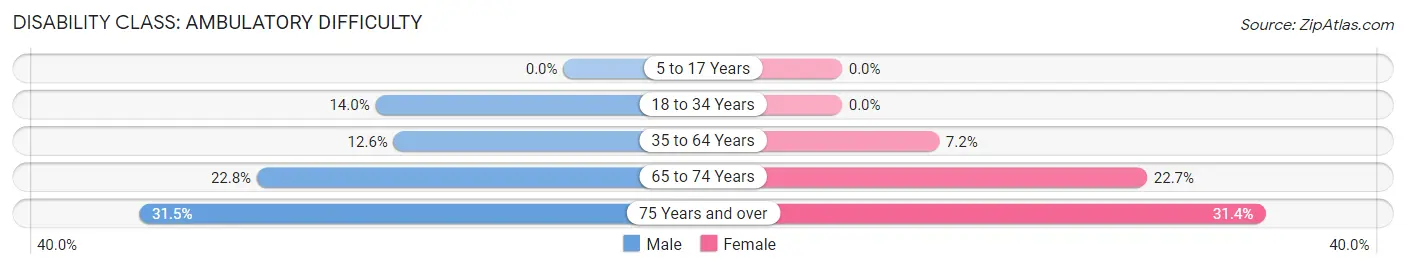
| Age Bracket | Male | Female |
| 5 to 17 Years | 0 (0.0%) | 0 (0.0%) |
| 18 to 34 Years | 65 (14.0%) | 0 (0.0%) |
| 35 to 64 Years | 98 (12.6%) | 55 (7.2%) |
| 65 to 74 Years | 43 (22.8%) | 101 (22.7%) |
| 75 Years and over | 63 (31.5%) | 66 (31.4%) |
Disability Class: Self-Care Difficulty
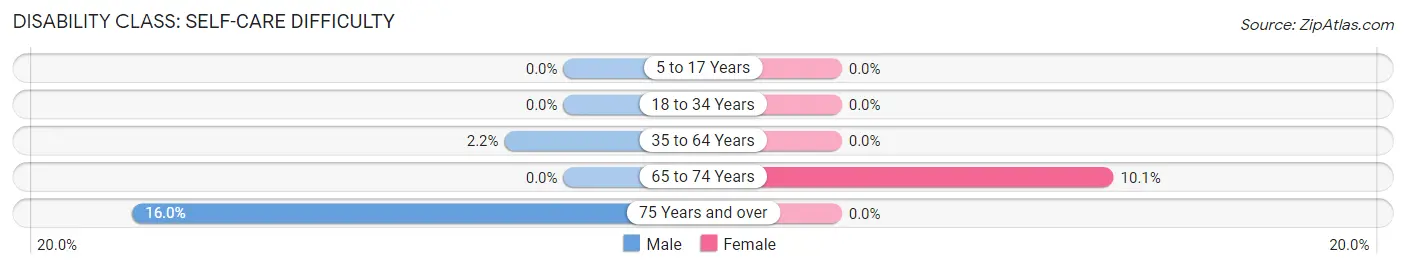
| Age Bracket | Male | Female |
| 5 to 17 Years | 0 (0.0%) | 0 (0.0%) |
| 18 to 34 Years | 0 (0.0%) | 0 (0.0%) |
| 35 to 64 Years | 17 (2.2%) | 0 (0.0%) |
| 65 to 74 Years | 0 (0.0%) | 45 (10.1%) |
| 75 Years and over | 32 (16.0%) | 0 (0.0%) |
Technology Access in Oak Grove CDP Washington County
Computing Device Access in Oak Grove CDP Washington County
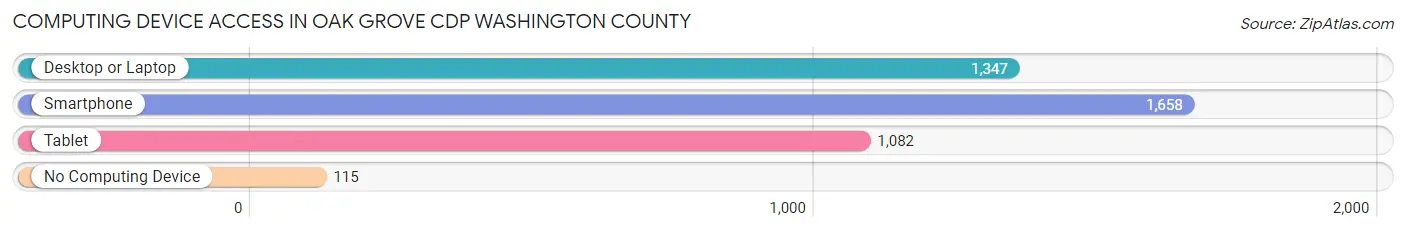
| Device Type | # Households | % Households |
| Desktop or Laptop | 1,347 | 73.0% |
| Smartphone | 1,658 | 89.8% |
| Tablet | 1,082 | 58.6% |
| No Computing Device | 115 | 6.2% |
| Total | 1,846 | 100.0% |
Internet Access in Oak Grove CDP Washington County
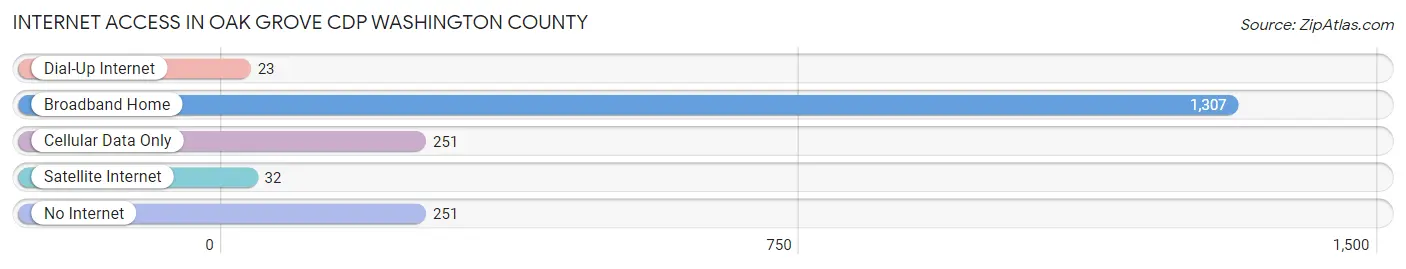
| Internet Type | # Households | % Households |
| Dial-Up Internet | 23 | 1.3% |
| Broadband Home | 1,307 | 70.8% |
| Cellular Data Only | 251 | 13.6% |
| Satellite Internet | 32 | 1.7% |
| No Internet | 251 | 13.6% |
| Total | 1,846 | 100.0% |
Oak Grove CDP Washington County Summary
Oak Grove Cdp is a census-designated place (CDP) located in Washington County, Tennessee. It is located in the northeastern part of the state, about 10 miles south of Johnson City. The population of Oak Grove Cdp was 1,845 at the 2010 census.
Geography
Oak Grove Cdp is located at 36°20'25"N 82°25'45"W (36.340278, -82.429167). According to the United States Census Bureau, the CDP has a total area of 2.2 square miles (5.7 km2), all of it land.
History
Oak Grove Cdp was first settled in the early 1800s by settlers from North Carolina. The area was originally known as "Oak Grove" due to the abundance of oak trees in the area. The first post office was established in 1845 and the town was officially incorporated in 1871.
The town grew steadily throughout the 19th century, and by the early 20th century, it had become a popular tourist destination. The town was home to several resorts, including the Oak Grove Hotel, which was built in 1891 and was one of the largest hotels in the area.
The town was also home to several factories, including a cotton mill, a furniture factory, and a canning factory. The town also had a railroad station, which was used to transport goods and passengers.
Economy
The economy of Oak Grove Cdp is largely based on tourism and manufacturing. The town is home to several resorts, including the Oak Grove Hotel, which is still in operation today. The town also has several factories, including a cotton mill, a furniture factory, and a canning factory.
Demographics
As of the 2010 census, there were 1,845 people, 745 households, and 486 families residing in the CDP. The population density was 830.2 people per square mile (319.9/km2). There were 845 housing units at an average density of 382.2 per square mile (147.3/km2). The racial makeup of the CDP was 97.2% White, 0.7% African American, 0.2% Native American, 0.4% Asian, 0.1% Pacific Islander, 0.4% from other races, and 1.0% from two or more races. Hispanic or Latino of any race were 1.2% of the population.
There were 745 households, out of which 28.2% had children under the age of 18 living with them, 48.2% were married couples living together, 12.2% had a female householder with no husband present, and 34.2% were non-families. 28.7% of all households were made up of individuals, and 11.7% had someone living alone who was 65 years of age or older. The average household size was 2.45 and the average family size was 2.99.
In the CDP, the population was spread out, with 24.2% under the age of 18, 8.2% from 18 to 24, 28.2% from 25 to 44, 24.2% from 45 to 64, and 15.2% who were 65 years of age or older. The median age was 38 years. For every 100 females, there were 94.2 males. For every 100 females age 18 and over, there were 91.2 males.
The median income for a household in the CDP was $30,938, and the median income for a family was $37,500. Males had a median income of $30,000 versus $21,250 for females. The per capita income for the CDP was $15,945. About 11.2% of families and 14.2% of the population were below the poverty line, including 19.2% of those under age 18 and 8.2% of those age 65 or over.
Common Questions
What is the Total Population of Oak Grove CDP Washington County?
Total Population of Oak Grove CDP Washington County is 4,422.
What is the Total Male Population of Oak Grove CDP Washington County?
Total Male Population of Oak Grove CDP Washington County is 2,053.
What is the Total Female Population of Oak Grove CDP Washington County?
Total Female Population of Oak Grove CDP Washington County is 2,369.
What is the Ratio of Males per 100 Females in Oak Grove CDP Washington County?
There are 86.66 Males per 100 Females in Oak Grove CDP Washington County.
What is the Ratio of Females per 100 Males in Oak Grove CDP Washington County?
There are 115.39 Females per 100 Males in Oak Grove CDP Washington County.
What is the Median Population Age in Oak Grove CDP Washington County?
Median Population Age in Oak Grove CDP Washington County is 47.1 Years.
What is the Average Family Size in Oak Grove CDP Washington County
Average Family Size in Oak Grove CDP Washington County is 2.9 People.
What is the Average Household Size in Oak Grove CDP Washington County
Average Household Size in Oak Grove CDP Washington County is 2.3 People.
What is Per Capita Income in Oak Grove CDP Washington County?
Per Capita income in Oak Grove CDP Washington County is $43,352.
What is the Median Family Income in Oak Grove CDP Washington County?
Median Family Income in Oak Grove CDP Washington County is $84,784.
What is the Median Household income in Oak Grove CDP Washington County?
Median Household Income in Oak Grove CDP Washington County is $66,518.
What is Income or Wage Gap in Oak Grove CDP Washington County?
Income or Wage Gap in Oak Grove CDP Washington County is 64.8%.
Women in Oak Grove CDP Washington County earn 35.2 cents for every dollar earned by a man.
What is Inequality or Gini Index in Oak Grove CDP Washington County?
Inequality or Gini Index in Oak Grove CDP Washington County is 0.51.
How Large is the Labor Force in Oak Grove CDP Washington County?
There are 2,161 People in the Labor Forcein in Oak Grove CDP Washington County.
What is the Percentage of People in the Labor Force in Oak Grove CDP Washington County?
58.8% of People are in the Labor Force in Oak Grove CDP Washington County.
What is the Unemployment Rate in Oak Grove CDP Washington County?
Unemployment Rate in Oak Grove CDP Washington County is 9.9%.