Meggett, SC
Meggett Map
Meggett Overview
1,348
TOTAL POPULATION
652
MALE POPULATION
696
FEMALE POPULATION
93.68
MALES / 100 FEMALES
106.75
FEMALES / 100 MALES
49.9
MEDIAN AGE
2.8
AVG FAMILY SIZE
2.2
AVG HOUSEHOLD SIZE
$57,321
PER CAPITA INCOME
$106,806
AVG FAMILY INCOME
$91,472
AVG HOUSEHOLD INCOME
18.0%
WAGE / INCOME GAP [ % ]
82.0¢/ $1
WAGE / INCOME GAP [ $ ]
$7,386
FAMILY INCOME DEFICIT
0.52
INEQUALITY / GINI INDEX
704
LABOR FORCE [ PEOPLE ]
64.5%
PERCENT IN LABOR FORCE
0.9%
UNEMPLOYMENT RATE
Meggett Area Codes
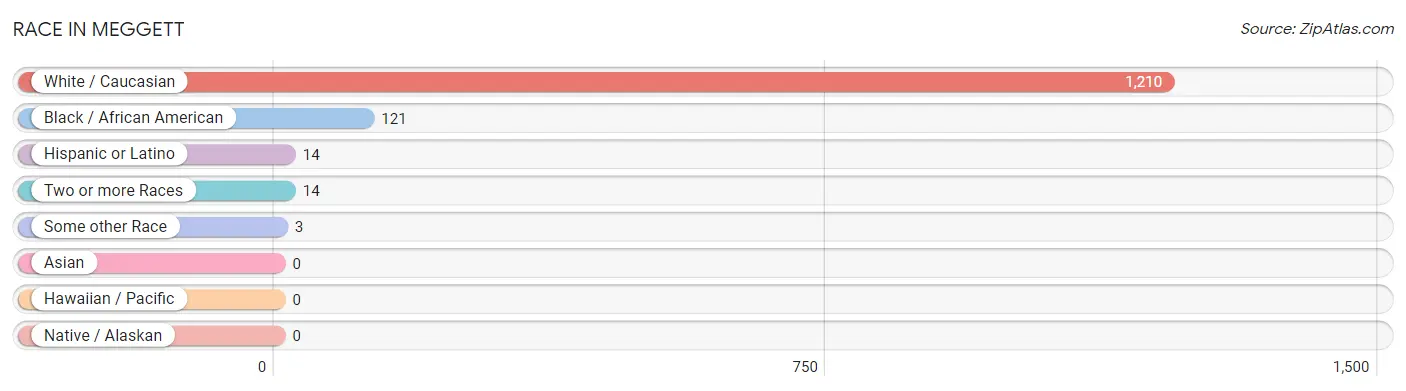
Race in Meggett
The most populous races in Meggett are White / Caucasian (1,210 | 89.8%), Black / African American (121 | 9.0%), and Hispanic or Latino (14 | 1.0%).
| Race | # Population | % Population |
| Asian | 0 | 0.0% |
| Black / African American | 121 | 9.0% |
| Hawaiian / Pacific | 0 | 0.0% |
| Hispanic or Latino | 14 | 1.0% |
| Native / Alaskan | 0 | 0.0% |
| White / Caucasian | 1,210 | 89.8% |
| Two or more Races | 14 | 1.0% |
| Some other Race | 3 | 0.2% |
| Total | 1,348 | 100.0% |
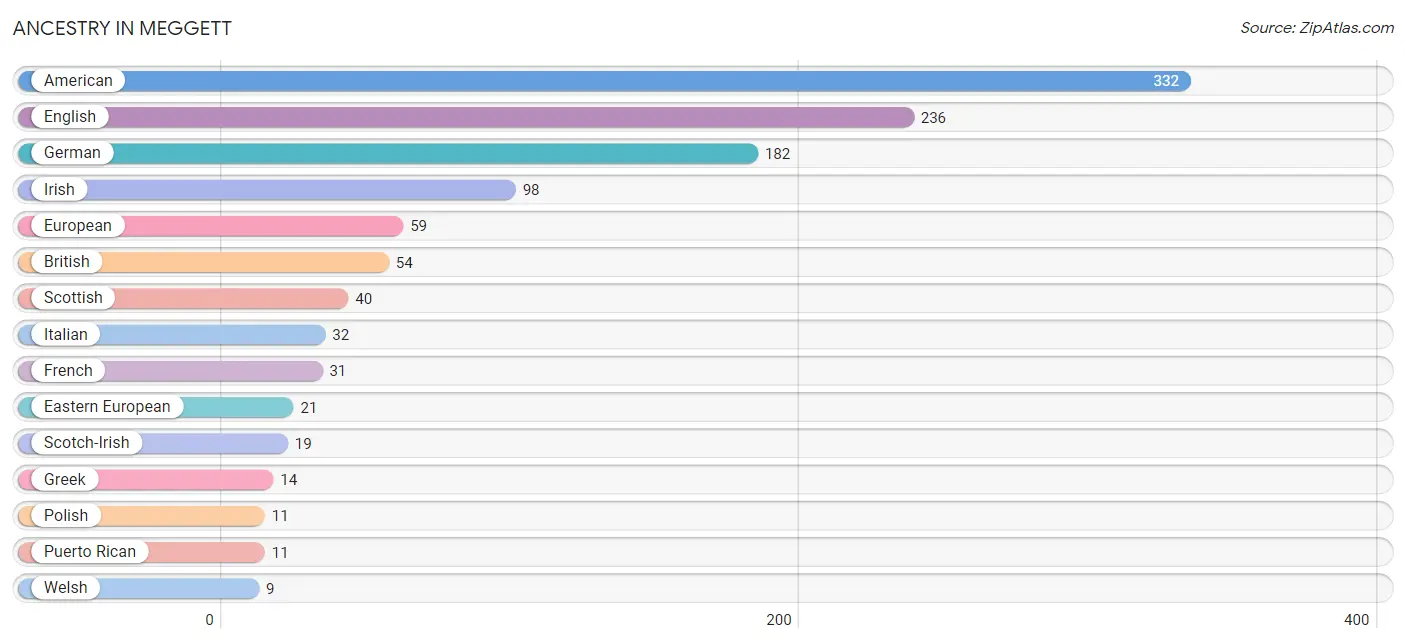
Ancestry in Meggett
The most populous ancestries reported in Meggett are American (332 | 24.6%), English (236 | 17.5%), German (182 | 13.5%), Irish (98 | 7.3%), and European (59 | 4.4%), together accounting for 67.3% of all Meggett residents.
| Ancestry | # Population | % Population |
| American | 332 | 24.6% |
| Arab | 2 | 0.2% |
| British | 54 | 4.0% |
| Cuban | 3 | 0.2% |
| Danish | 6 | 0.4% |
| Eastern European | 21 | 1.6% |
| English | 236 | 17.5% |
| European | 59 | 4.4% |
| French | 31 | 2.3% |
| French Canadian | 4 | 0.3% |
| German | 182 | 13.5% |
| Greek | 14 | 1.0% |
| Hungarian | 2 | 0.2% |
| Irish | 98 | 7.3% |
| Italian | 32 | 2.4% |
| Jamaican | 4 | 0.3% |
| Lithuanian | 4 | 0.3% |
| Northern European | 2 | 0.2% |
| Norwegian | 2 | 0.2% |
| Polish | 11 | 0.8% |
| Portuguese | 4 | 0.3% |
| Puerto Rican | 11 | 0.8% |
| Russian | 4 | 0.3% |
| Scotch-Irish | 19 | 1.4% |
| Scottish | 40 | 3.0% |
| Swiss | 4 | 0.3% |
| Syrian | 2 | 0.2% |
| Ukrainian | 3 | 0.2% |
| Welsh | 9 | 0.7% | View All 29 Rows |
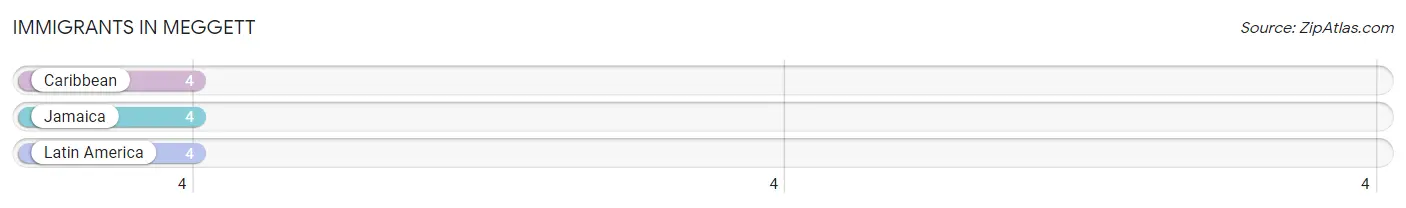
Immigrants in Meggett
The most numerous immigrant groups reported in Meggett came from Caribbean (4 | 0.3%), Jamaica (4 | 0.3%), and Latin America (4 | 0.3%), together accounting for 0.9% of all Meggett residents.
| Immigration Origin | # Population | % Population |
| Caribbean | 4 | 0.3% |
| Jamaica | 4 | 0.3% |
| Latin America | 4 | 0.3% | View All 3 Rows |
Sex and Age in Meggett
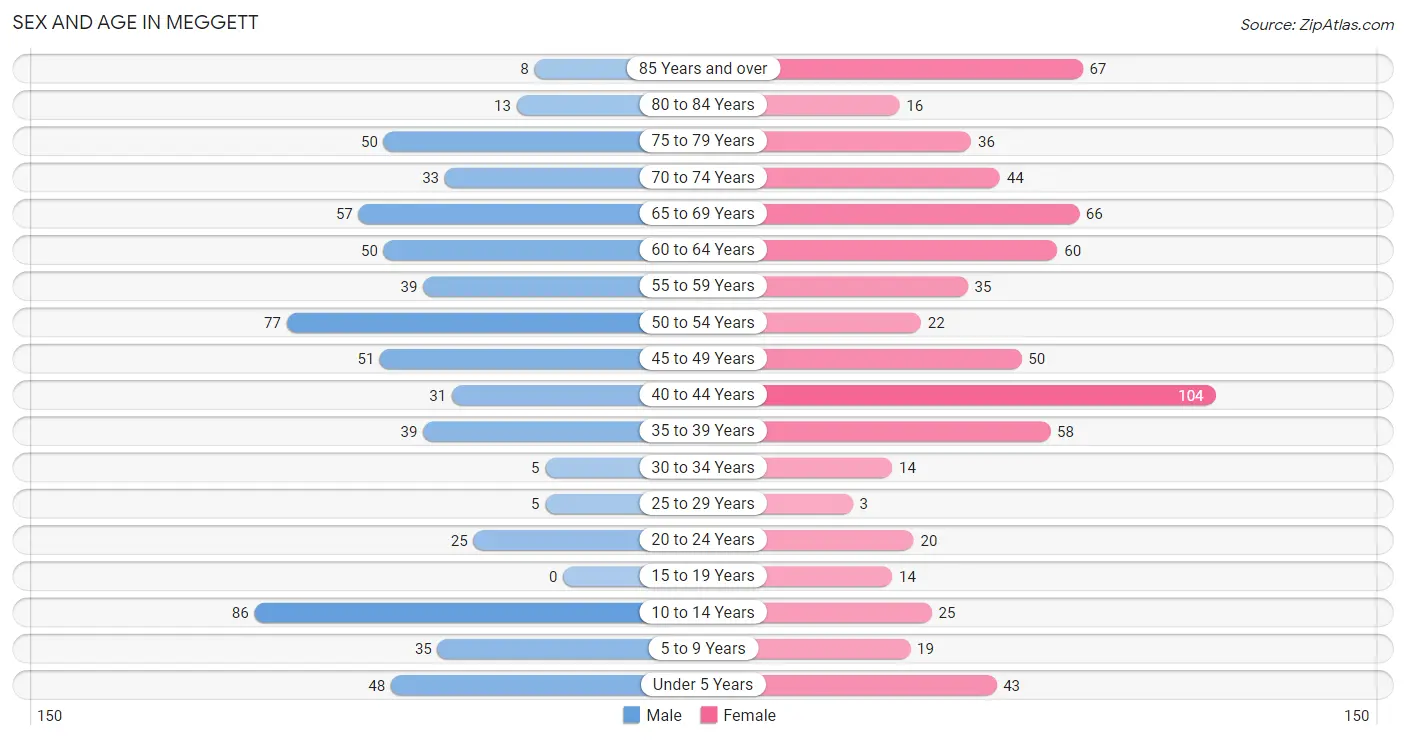
Sex and Age in Meggett
The most populous age groups in Meggett are 10 to 14 Years (86 | 13.2%) for men and 40 to 44 Years (104 | 14.9%) for women.
| Age Bracket | Male | Female |
| Under 5 Years | 48 (7.4%) | 43 (6.2%) |
| 5 to 9 Years | 35 (5.4%) | 19 (2.7%) |
| 10 to 14 Years | 86 (13.2%) | 25 (3.6%) |
| 15 to 19 Years | 0 (0.0%) | 14 (2.0%) |
| 20 to 24 Years | 25 (3.8%) | 20 (2.9%) |
| 25 to 29 Years | 5 (0.8%) | 3 (0.4%) |
| 30 to 34 Years | 5 (0.8%) | 14 (2.0%) |
| 35 to 39 Years | 39 (6.0%) | 58 (8.3%) |
| 40 to 44 Years | 31 (4.8%) | 104 (14.9%) |
| 45 to 49 Years | 51 (7.8%) | 50 (7.2%) |
| 50 to 54 Years | 77 (11.8%) | 22 (3.2%) |
| 55 to 59 Years | 39 (6.0%) | 35 (5.0%) |
| 60 to 64 Years | 50 (7.7%) | 60 (8.6%) |
| 65 to 69 Years | 57 (8.7%) | 66 (9.5%) |
| 70 to 74 Years | 33 (5.1%) | 44 (6.3%) |
| 75 to 79 Years | 50 (7.7%) | 36 (5.2%) |
| 80 to 84 Years | 13 (2.0%) | 16 (2.3%) |
| 85 Years and over | 8 (1.2%) | 67 (9.6%) |
| Total | 652 (100.0%) | 696 (100.0%) |
Families and Households in Meggett
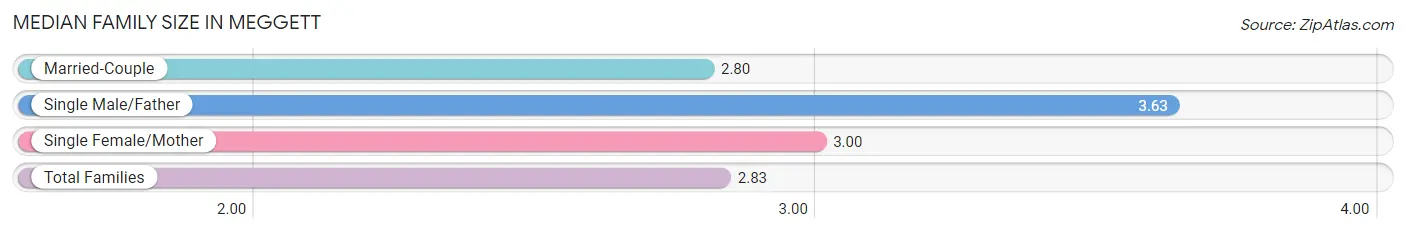
Median Family Size in Meggett
The median family size in Meggett is 2.83 persons per family, with single male/father families (8 | 2.0%) accounting for the largest median family size of 3.63 persons per family. On the other hand, married-couple families (368 | 93.6%) represent the smallest median family size with 2.80 persons per family.
| Family Type | # Families | Family Size |
| Married-Couple | 368 (93.6%) | 2.80 |
| Single Male/Father | 8 (2.0%) | 3.63 |
| Single Female/Mother | 17 (4.3%) | 3.00 |
| Total Families | 393 (100.0%) | 2.83 |
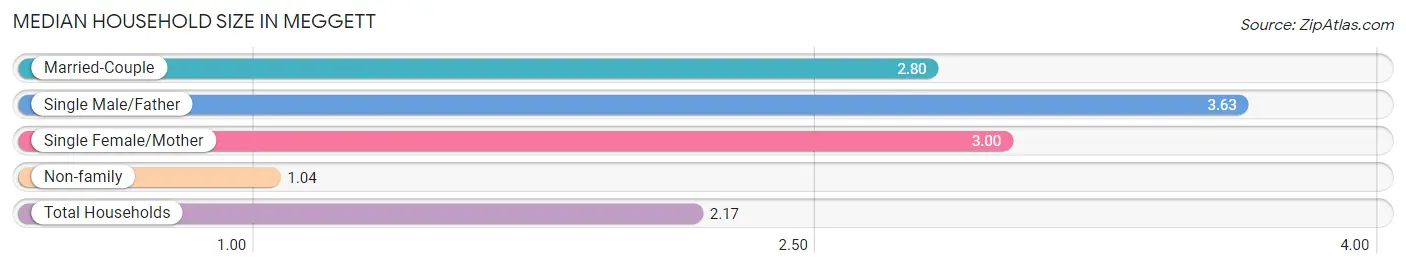
Median Household Size in Meggett
The median household size in Meggett is 2.17 persons per household, with single male/father households (8 | 1.3%) accounting for the largest median household size of 3.63 persons per household. non-family households (228 | 36.7%) represent the smallest median household size with 1.04 persons per household.
| Household Type | # Households | Household Size |
| Married-Couple | 368 (59.3%) | 2.80 |
| Single Male/Father | 8 (1.3%) | 3.63 |
| Single Female/Mother | 17 (2.7%) | 3.00 |
| Non-family | 228 (36.7%) | 1.04 |
| Total Households | 621 (100.0%) | 2.17 |
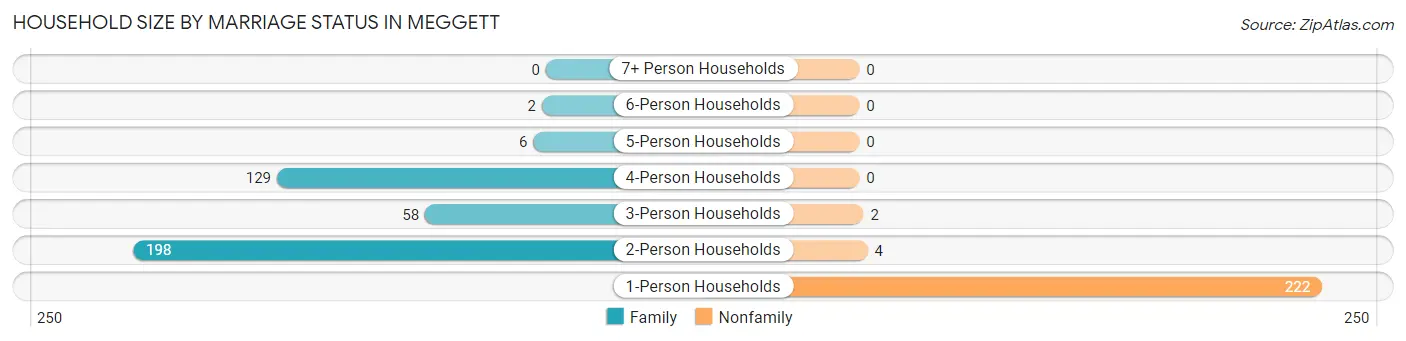
Household Size by Marriage Status in Meggett
Out of a total of 621 households in Meggett, 393 (63.3%) are family households, while 228 (36.7%) are nonfamily households. The most numerous type of family households are 2-person households, comprising 198, and the most common type of nonfamily households are 1-person households, comprising 222.
| Household Size | Family Households | Nonfamily Households |
| 1-Person Households | - | 222 (35.7%) |
| 2-Person Households | 198 (31.9%) | 4 (0.6%) |
| 3-Person Households | 58 (9.3%) | 2 (0.3%) |
| 4-Person Households | 129 (20.8%) | 0 (0.0%) |
| 5-Person Households | 6 (1.0%) | 0 (0.0%) |
| 6-Person Households | 2 (0.3%) | 0 (0.0%) |
| 7+ Person Households | 0 (0.0%) | 0 (0.0%) |
| Total | 393 (63.3%) | 228 (36.7%) |
Female Fertility in Meggett
Fertility by Age in Meggett
Average fertility rate in Meggett is 60.0 births per 1,000 women. Women in the age bracket of 35 to 50 years have the highest fertility rate with 74.0 births per 1,000 women. Women in the age bracket of 35 to 50 years acount for 100.0% of all women with births.
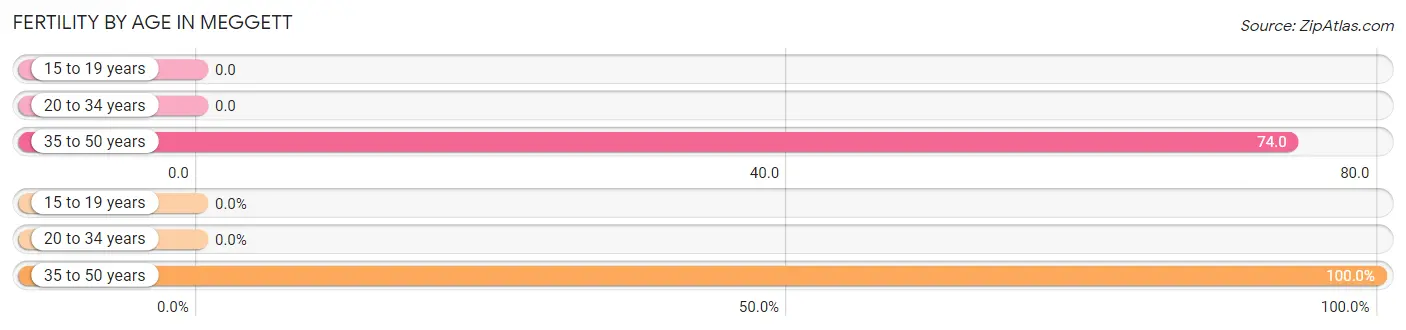
| Age Bracket | Women with Births | Births / 1,000 Women |
| 15 to 19 years | 0 (0.0%) | 0.0 |
| 20 to 34 years | 0 (0.0%) | 0.0 |
| 35 to 50 years | 16 (100.0%) | 74.0 |
| Total | 16 (100.0%) | 60.0 |
Fertility by Age by Marriage Status in Meggett
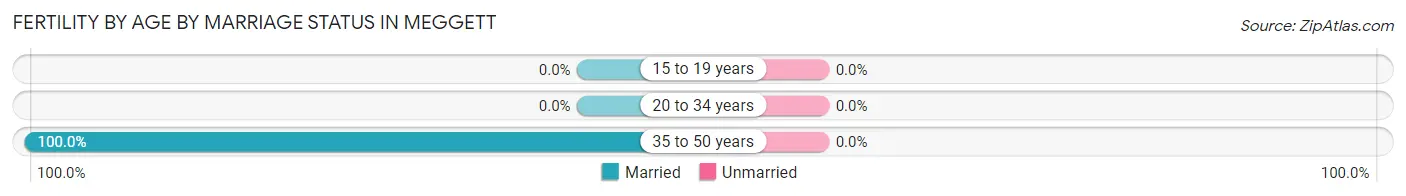
| Age Bracket | Married | Unmarried |
| 15 to 19 years | 0 (0.0%) | 0 (0.0%) |
| 20 to 34 years | 0 (0.0%) | 0 (0.0%) |
| 35 to 50 years | 16 (100.0%) | 0 (0.0%) |
| Total | 16 (100.0%) | 0 (0.0%) |
Fertility by Education in Meggett
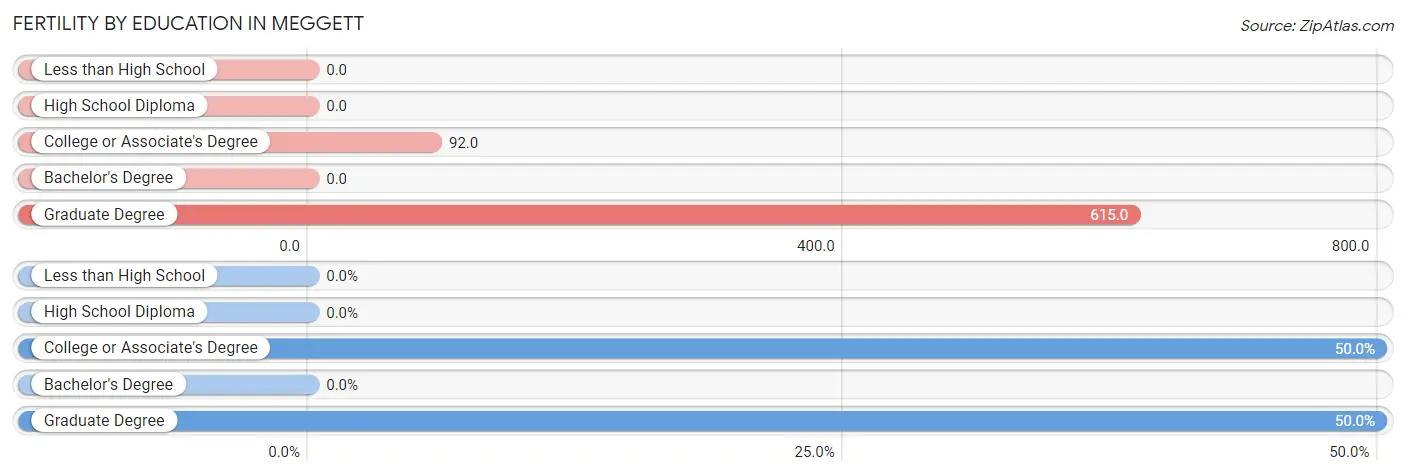
| Educational Attainment | Women with Births | Births / 1,000 Women |
| Less than High School | 0 (0.0%) | 0.0 |
| High School Diploma | 0 (0.0%) | 0.0 |
| College or Associate's Degree | 8 (50.0%) | 92.0 |
| Bachelor's Degree | 0 (0.0%) | 0.0 |
| Graduate Degree | 8 (50.0%) | 615.0 |
| Total | 16 (100.0%) | 60.0 |
Fertility by Education by Marriage Status in Meggett
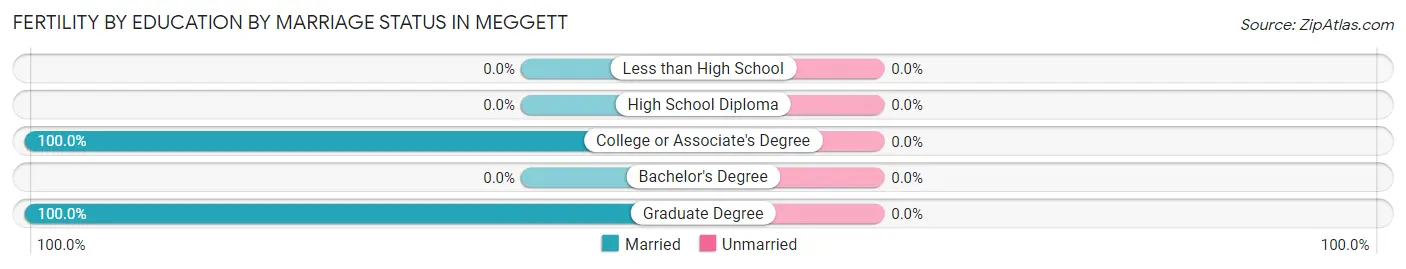
| Educational Attainment | Married | Unmarried |
| Less than High School | 0 (0.0%) | 0 (0.0%) |
| High School Diploma | 0 (0.0%) | 0 (0.0%) |
| College or Associate's Degree | 8 (100.0%) | 0 (0.0%) |
| Bachelor's Degree | 0 (0.0%) | 0 (0.0%) |
| Graduate Degree | 8 (100.0%) | 0 (0.0%) |
| Total | 16 (100.0%) | 0 (0.0%) |
Income in Meggett
Income Overview in Meggett
Per Capita Income in Meggett is $57,321, while median incomes of families and households are $106,806 and $91,472 respectively.
| Characteristic | Number | Measure |
| Per Capita Income | 1,348 | $57,321 |
| Median Family Income | 393 | $106,806 |
| Mean Family Income | 393 | $168,584 |
| Median Household Income | 621 | $91,472 |
| Mean Household Income | 621 | $127,402 |
| Income Deficit | 393 | $7,386 |
| Wage / Income Gap (%) | 1,348 | 17.95% |
| Wage / Income Gap ($) | 1,348 | 82.05¢ per $1 |
| Gini / Inequality Index | 1,348 | 0.52 |
Earnings by Sex in Meggett
Average Earnings in Meggett are $47,396, $56,587 for men and $46,429 for women, a difference of 17.9%.
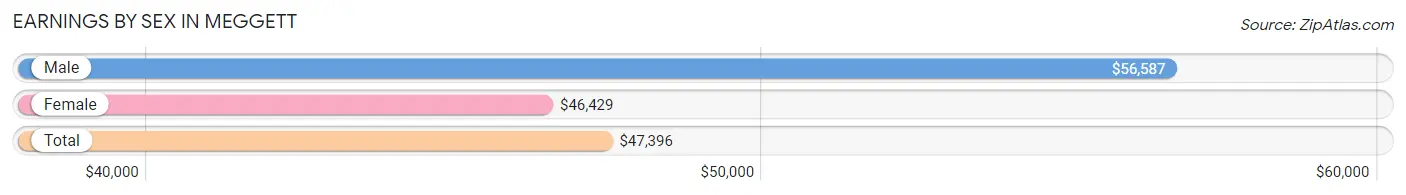
| Sex | Number | Average Earnings |
| Male | 363 (49.1%) | $56,587 |
| Female | 376 (50.9%) | $46,429 |
| Total | 739 (100.0%) | $47,396 |
Earnings by Sex by Income Bracket in Meggett
The most common earnings brackets in Meggett are $100,000+ for men (94 | 25.9%) and $45,000 to $49,999 for women (97 | 25.8%).
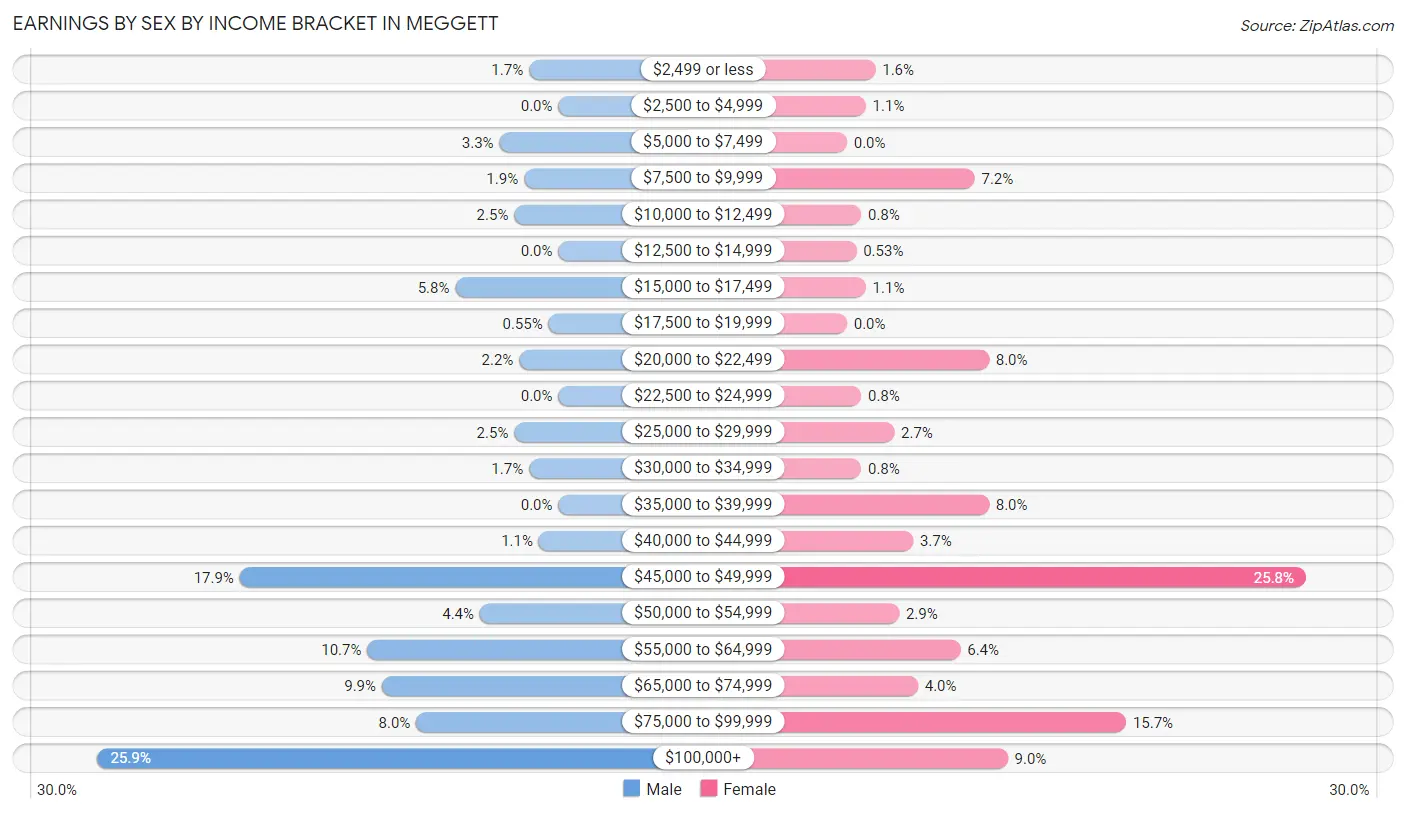
| Income | Male | Female |
| $2,499 or less | 6 (1.7%) | 6 (1.6%) |
| $2,500 to $4,999 | 0 (0.0%) | 4 (1.1%) |
| $5,000 to $7,499 | 12 (3.3%) | 0 (0.0%) |
| $7,500 to $9,999 | 7 (1.9%) | 27 (7.2%) |
| $10,000 to $12,499 | 9 (2.5%) | 3 (0.8%) |
| $12,500 to $14,999 | 0 (0.0%) | 2 (0.5%) |
| $15,000 to $17,499 | 21 (5.8%) | 4 (1.1%) |
| $17,500 to $19,999 | 2 (0.5%) | 0 (0.0%) |
| $20,000 to $22,499 | 8 (2.2%) | 30 (8.0%) |
| $22,500 to $24,999 | 0 (0.0%) | 3 (0.8%) |
| $25,000 to $29,999 | 9 (2.5%) | 10 (2.7%) |
| $30,000 to $34,999 | 6 (1.7%) | 3 (0.8%) |
| $35,000 to $39,999 | 0 (0.0%) | 30 (8.0%) |
| $40,000 to $44,999 | 4 (1.1%) | 14 (3.7%) |
| $45,000 to $49,999 | 65 (17.9%) | 97 (25.8%) |
| $50,000 to $54,999 | 16 (4.4%) | 11 (2.9%) |
| $55,000 to $64,999 | 39 (10.7%) | 24 (6.4%) |
| $65,000 to $74,999 | 36 (9.9%) | 15 (4.0%) |
| $75,000 to $99,999 | 29 (8.0%) | 59 (15.7%) |
| $100,000+ | 94 (25.9%) | 34 (9.0%) |
| Total | 363 (100.0%) | 376 (100.0%) |
Earnings by Sex by Educational Attainment in Meggett
Average earnings in Meggett are $60,000 for men and $46,758 for women, a difference of 22.1%. Men with an educational attainment of less than high school enjoy the highest average annual earnings of $121,500, while those with college or associate's degree education earn the least with $63,438. Women with an educational attainment of graduate degree earn the most with the average annual earnings of $72,679, while those with bachelor's degree education have the smallest earnings of $46,892.
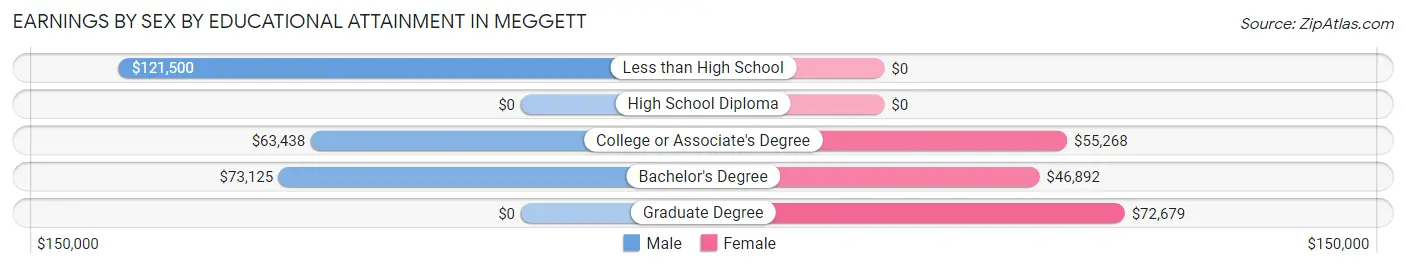
| Educational Attainment | Male Income | Female Income |
| Less than High School | $121,500 | $0 |
| High School Diploma | - | - |
| College or Associate's Degree | $63,438 | $55,268 |
| Bachelor's Degree | $73,125 | $46,892 |
| Graduate Degree | - | - |
| Total | $60,000 | $46,758 |
Family Income in Meggett
Family Income Brackets in Meggett
According to the Meggett family income data, there are 101 families falling into the $75,000 to $99,999 income range, which is the most common income bracket and makes up 25.7% of all families.
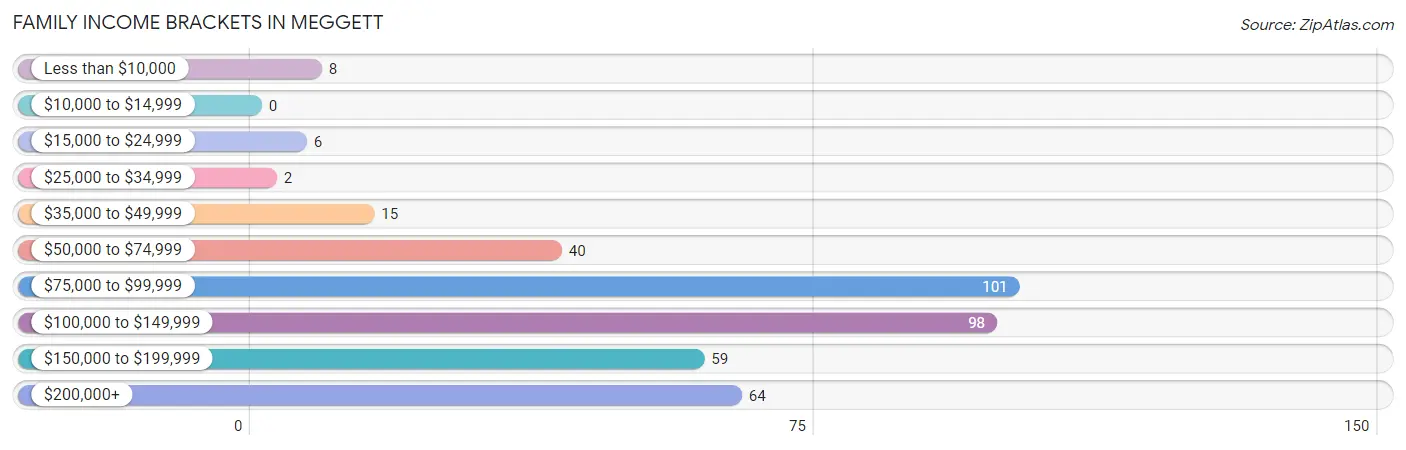
| Income Bracket | # Families | % Families |
| Less than $10,000 | 8 | 2.0% |
| $10,000 to $14,999 | 0 | 0.0% |
| $15,000 to $24,999 | 6 | 1.5% |
| $25,000 to $34,999 | 2 | 0.5% |
| $35,000 to $49,999 | 15 | 3.8% |
| $50,000 to $74,999 | 40 | 10.2% |
| $75,000 to $99,999 | 101 | 25.7% |
| $100,000 to $149,999 | 98 | 24.9% |
| $150,000 to $199,999 | 59 | 15.0% |
| $200,000+ | 64 | 16.3% |
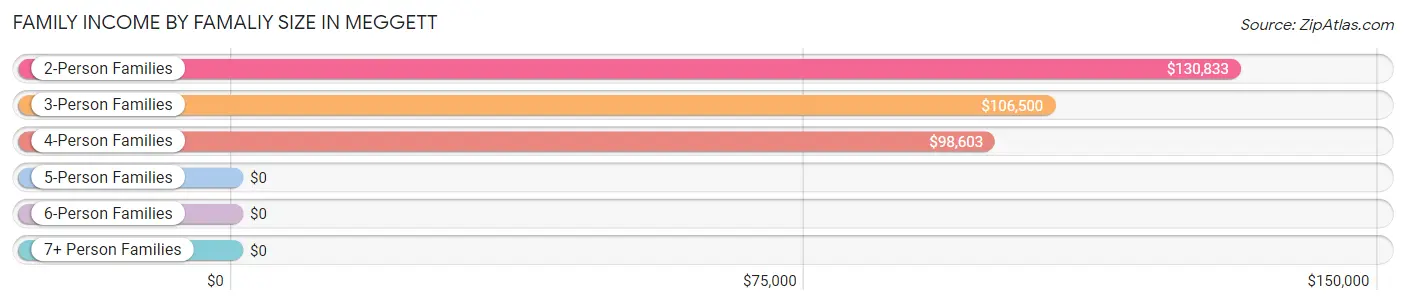
Family Income by Famaliy Size in Meggett
2-person families (198 | 50.4%) account for the highest median family income in Meggett with $130,833 per family, while 2-person families (198 | 50.4%) have the highest median income of $65,416 per family member.
| Income Bracket | # Families | Median Income |
| 2-Person Families | 198 (50.4%) | $130,833 |
| 3-Person Families | 58 (14.8%) | $106,500 |
| 4-Person Families | 129 (32.8%) | $98,603 |
| 5-Person Families | 6 (1.5%) | $0 |
| 6-Person Families | 2 (0.5%) | $0 |
| 7+ Person Families | 0 (0.0%) | $0 |
| Total | 393 (100.0%) | $106,806 |
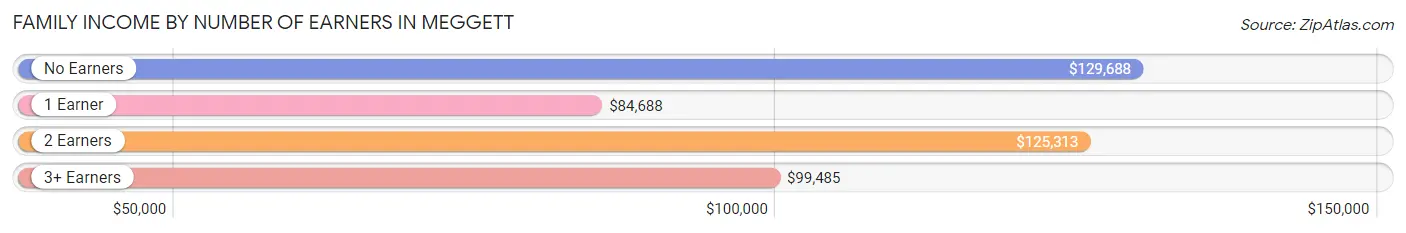
Family Income by Number of Earners in Meggett
The median family income in Meggett is $106,806, with families comprising no earners (73) having the highest median family income of $129,688, while families with 1 earner (79) have the lowest median family income of $84,688, accounting for 18.6% and 20.1% of families, respectively.
| Number of Earners | # Families | Median Income |
| No Earners | 73 (18.6%) | $129,688 |
| 1 Earner | 79 (20.1%) | $84,688 |
| 2 Earners | 214 (54.4%) | $125,313 |
| 3+ Earners | 27 (6.9%) | $99,485 |
| Total | 393 (100.0%) | $106,806 |
Household Income in Meggett
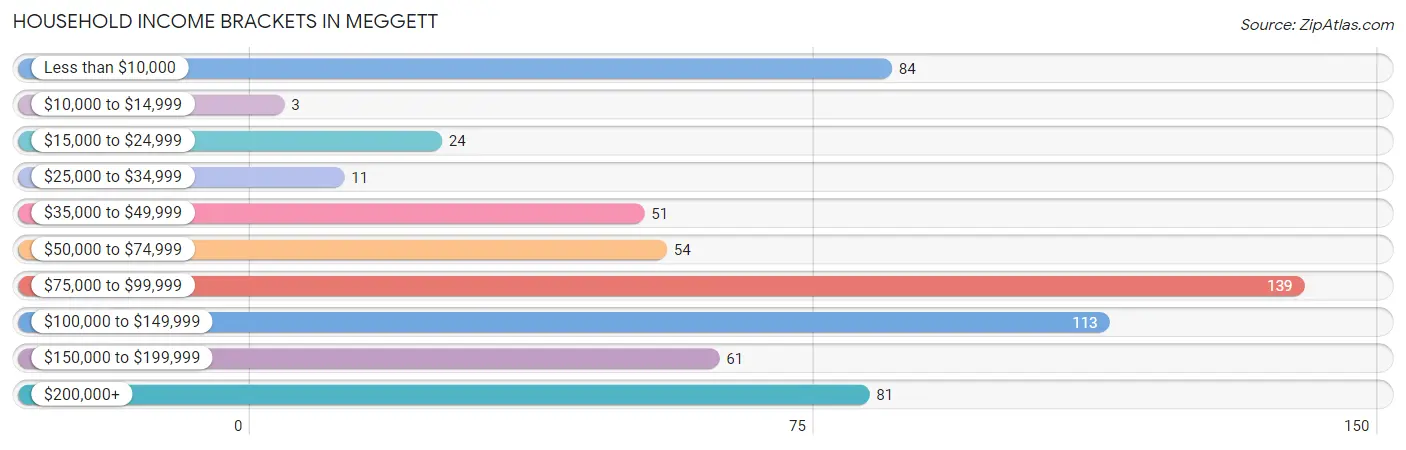
Household Income Brackets in Meggett
With 139 households falling in the category, the $75,000 to $99,999 income range is the most frequent in Meggett, accounting for 22.4% of all households. In contrast, only 3 households (0.5%) fall into the $10,000 to $14,999 income bracket, making it the least populous group.
| Income Bracket | # Households | % Households |
| Less than $10,000 | 84 | 13.5% |
| $10,000 to $14,999 | 3 | 0.5% |
| $15,000 to $24,999 | 24 | 3.9% |
| $25,000 to $34,999 | 11 | 1.8% |
| $35,000 to $49,999 | 51 | 8.2% |
| $50,000 to $74,999 | 54 | 8.7% |
| $75,000 to $99,999 | 139 | 22.4% |
| $100,000 to $149,999 | 113 | 18.2% |
| $150,000 to $199,999 | 61 | 9.8% |
| $200,000+ | 81 | 13.0% |
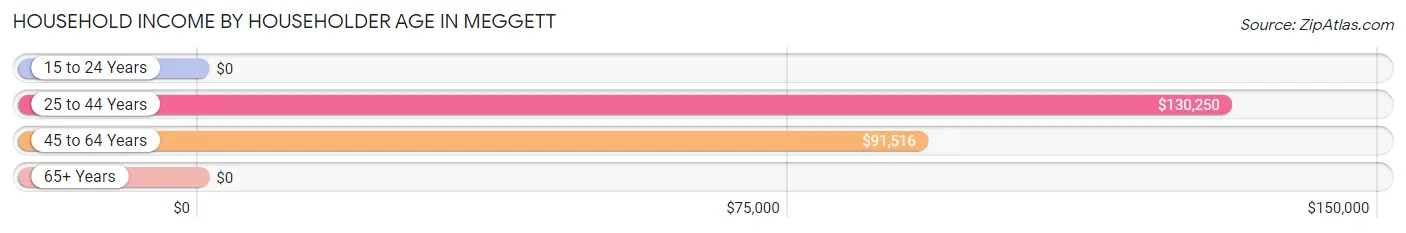
Household Income by Householder Age in Meggett
The median household income in Meggett is $91,472, with the highest median household income of $130,250 found in the 25 to 44 years age bracket for the primary householder. A total of 93 households (15.0%) fall into this category. Meanwhile, the 15 to 24 years age bracket for the primary householder has the lowest median household income of $0, with 8 households (1.3%) in this group.
| Income Bracket | # Households | Median Income |
| 15 to 24 Years | 8 (1.3%) | $0 |
| 25 to 44 Years | 93 (15.0%) | $130,250 |
| 45 to 64 Years | 262 (42.2%) | $91,516 |
| 65+ Years | 258 (41.5%) | $0 |
| Total | 621 (100.0%) | $91,472 |
Poverty in Meggett
Income Below Poverty by Sex and Age in Meggett
With 3.8% poverty level for males and 12.1% for females among the residents of Meggett, 75 year old and over males and 75 year old and over females are the most vulnerable to poverty, with 16 males (22.5%) and 58 females (48.7%) in their respective age groups living below the poverty level.
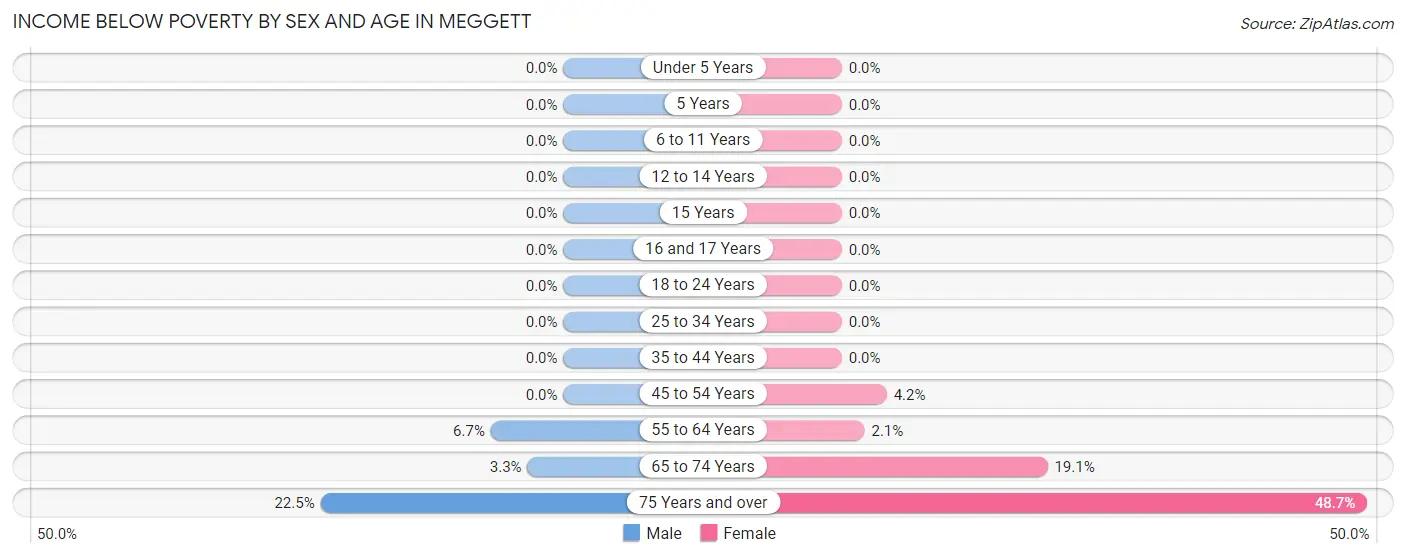
| Age Bracket | Male | Female |
| Under 5 Years | 0 (0.0%) | 0 (0.0%) |
| 5 Years | 0 (0.0%) | 0 (0.0%) |
| 6 to 11 Years | 0 (0.0%) | 0 (0.0%) |
| 12 to 14 Years | 0 (0.0%) | 0 (0.0%) |
| 15 Years | 0 (0.0%) | 0 (0.0%) |
| 16 and 17 Years | 0 (0.0%) | 0 (0.0%) |
| 18 to 24 Years | 0 (0.0%) | 0 (0.0%) |
| 25 to 34 Years | 0 (0.0%) | 0 (0.0%) |
| 35 to 44 Years | 0 (0.0%) | 0 (0.0%) |
| 45 to 54 Years | 0 (0.0%) | 3 (4.2%) |
| 55 to 64 Years | 6 (6.7%) | 2 (2.1%) |
| 65 to 74 Years | 3 (3.3%) | 21 (19.1%) |
| 75 Years and over | 16 (22.5%) | 58 (48.7%) |
| Total | 25 (3.8%) | 84 (12.1%) |
Income Above Poverty by Sex and Age in Meggett
According to the poverty statistics in Meggett, males aged under 5 years and females aged under 5 years are the age groups that are most secure financially, with 100.0% of males and 100.0% of females in these age groups living above the poverty line.
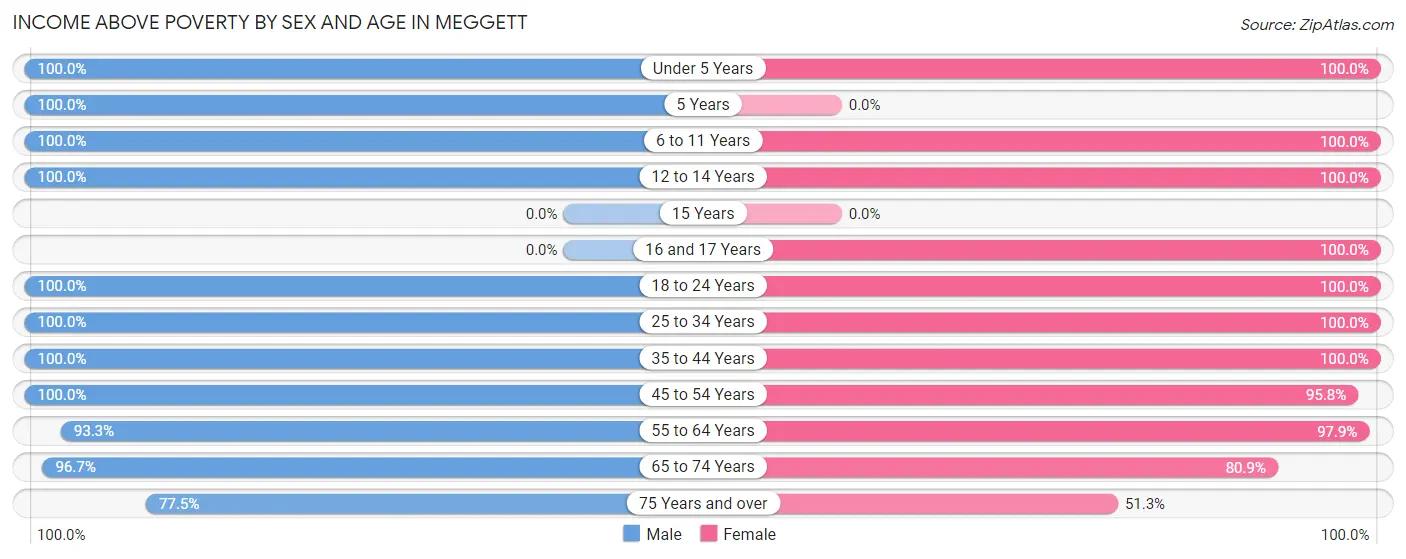
| Age Bracket | Male | Female |
| Under 5 Years | 48 (100.0%) | 43 (100.0%) |
| 5 Years | 2 (100.0%) | 0 (0.0%) |
| 6 to 11 Years | 37 (100.0%) | 29 (100.0%) |
| 12 to 14 Years | 82 (100.0%) | 15 (100.0%) |
| 15 Years | 0 (0.0%) | 0 (0.0%) |
| 16 and 17 Years | 0 (0.0%) | 14 (100.0%) |
| 18 to 24 Years | 25 (100.0%) | 20 (100.0%) |
| 25 to 34 Years | 10 (100.0%) | 17 (100.0%) |
| 35 to 44 Years | 70 (100.0%) | 162 (100.0%) |
| 45 to 54 Years | 128 (100.0%) | 69 (95.8%) |
| 55 to 64 Years | 83 (93.3%) | 93 (97.9%) |
| 65 to 74 Years | 87 (96.7%) | 89 (80.9%) |
| 75 Years and over | 55 (77.5%) | 61 (51.3%) |
| Total | 627 (96.2%) | 612 (87.9%) |
Income Below Poverty Among Married-Couple Families in Meggett
The poverty statistics for married-couple families in Meggett show that 3.8% or 14 of the total 368 families live below the poverty line. Families with no children have the highest poverty rate of 6.4%, comprising of 14 families. On the other hand, families with 1 or 2 children have the lowest poverty rate of 0.0%, which includes 0 families.
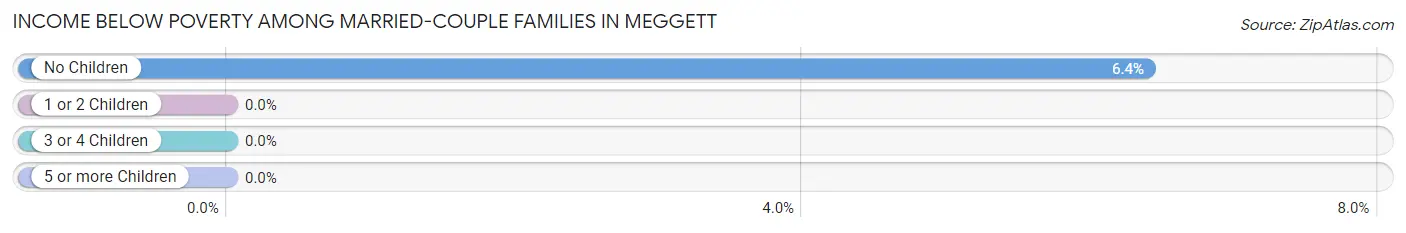
| Children | Above Poverty | Below Poverty |
| No Children | 205 (93.6%) | 14 (6.4%) |
| 1 or 2 Children | 145 (100.0%) | 0 (0.0%) |
| 3 or 4 Children | 4 (100.0%) | 0 (0.0%) |
| 5 or more Children | 0 (0.0%) | 0 (0.0%) |
| Total | 354 (96.2%) | 14 (3.8%) |
Income Below Poverty Among Single-Parent Households in Meggett
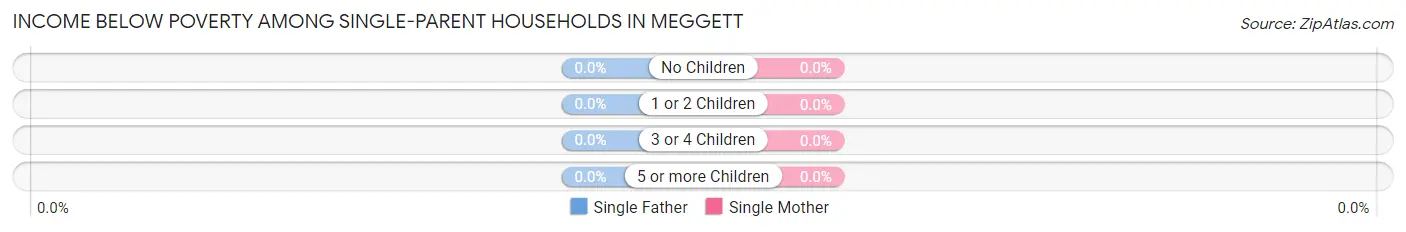
| Children | Single Father | Single Mother |
| No Children | 0 (0.0%) | 0 (0.0%) |
| 1 or 2 Children | 0 (0.0%) | 0 (0.0%) |
| 3 or 4 Children | 0 (0.0%) | 0 (0.0%) |
| 5 or more Children | 0 (0.0%) | 0 (0.0%) |
| Total | 0 (0.0%) | 0 (0.0%) |
Income Below Poverty Among Married-Couple vs Single-Parent Households in Meggett
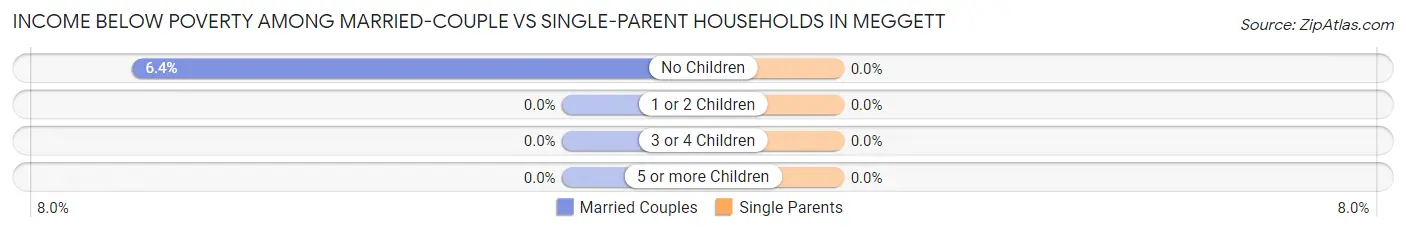
| Children | Married-Couple Families | Single-Parent Households |
| No Children | 14 (6.4%) | 0 (0.0%) |
| 1 or 2 Children | 0 (0.0%) | 0 (0.0%) |
| 3 or 4 Children | 0 (0.0%) | 0 (0.0%) |
| 5 or more Children | 0 (0.0%) | 0 (0.0%) |
| Total | 14 (3.8%) | 0 (0.0%) |
Employment Characteristics in Meggett
Employment by Class of Employer in Meggett
Among the 695 employed individuals in Meggett, private company employees (472 | 67.9%), self-employed (not incorporated) (135 | 19.4%), and self-employed (incorporated) (44 | 6.3%) make up the most common classes of employment.

| Employer Class | # Employees | % Employees |
| Private Company Employees | 472 | 67.9% |
| Self-Employed (Incorporated) | 44 | 6.3% |
| Self-Employed (Not Incorporated) | 135 | 19.4% |
| Not-for-profit Organizations | 2 | 0.3% |
| Local Government Employees | 17 | 2.5% |
| State Government Employees | 19 | 2.7% |
| Federal Government Employees | 6 | 0.9% |
| Unpaid Family Workers | 0 | 0.0% |
| Total | 695 | 100.0% |
Employment Status by Age in Meggett
According to the labor force statistics for Meggett, out of the total population over 16 years of age (1,092), 64.5% or 704 individuals are in the labor force, with 0.9% or 6 of them unemployed. The age group with the highest labor force participation rate is 20 to 24 years, with 100.0% or 45 individuals in the labor force. Within the labor force, the 45 to 54 years age range has the highest percentage of unemployed individuals, with 2.2% or 4 of them being unemployed.
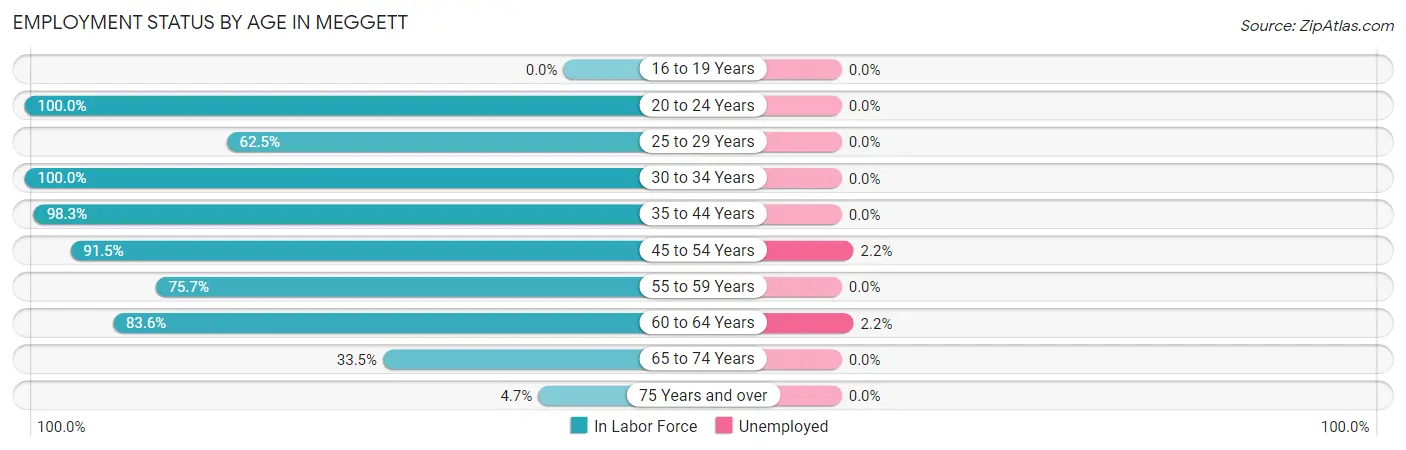
| Age Bracket | In Labor Force | Unemployed |
| 16 to 19 Years | 0 (0.0%) | 0 (0.0%) |
| 20 to 24 Years | 45 (100.0%) | 0 (0.0%) |
| 25 to 29 Years | 5 (62.5%) | 0 (0.0%) |
| 30 to 34 Years | 19 (100.0%) | 0 (0.0%) |
| 35 to 44 Years | 228 (98.3%) | 0 (0.0%) |
| 45 to 54 Years | 183 (91.5%) | 4 (2.2%) |
| 55 to 59 Years | 56 (75.7%) | 0 (0.0%) |
| 60 to 64 Years | 92 (83.6%) | 2 (2.2%) |
| 65 to 74 Years | 67 (33.5%) | 0 (0.0%) |
| 75 Years and over | 9 (4.7%) | 0 (0.0%) |
| Total | 704 (64.5%) | 6 (0.9%) |
Employment Status by Educational Attainment in Meggett
According to labor force statistics for Meggett, 90.7% of individuals (583) out of the total population between 25 and 64 years of age (643) are in the labor force, with 1.0% or 6 of them being unemployed. The group with the highest labor force participation rate are those with the educational attainment of college / associate degree, with 94.4% or 203 individuals in the labor force. Within the labor force, individuals with high school diploma education have the highest percentage of unemployment, with 3.3% or 4 of them being unemployed.
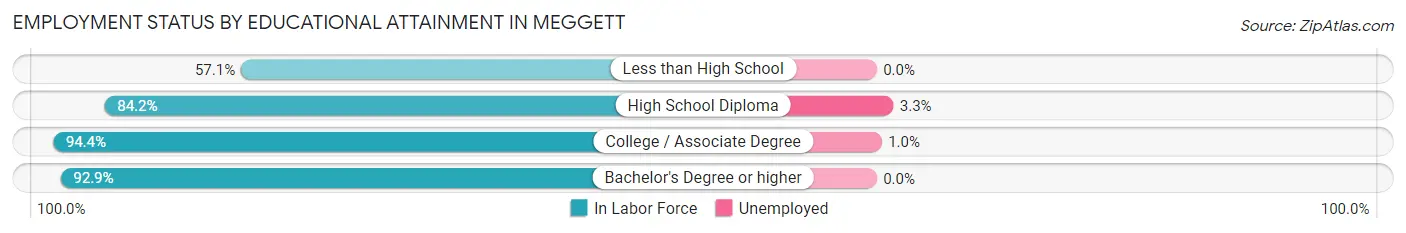
| Educational Attainment | In Labor Force | Unemployed |
| Less than High School | 8 (57.1%) | 0 (0.0%) |
| High School Diploma | 123 (84.2%) | 5 (3.3%) |
| College / Associate Degree | 203 (94.4%) | 2 (1.0%) |
| Bachelor's Degree or higher | 249 (92.9%) | 0 (0.0%) |
| Total | 583 (90.7%) | 6 (1.0%) |
Employment Occupations by Sex in Meggett
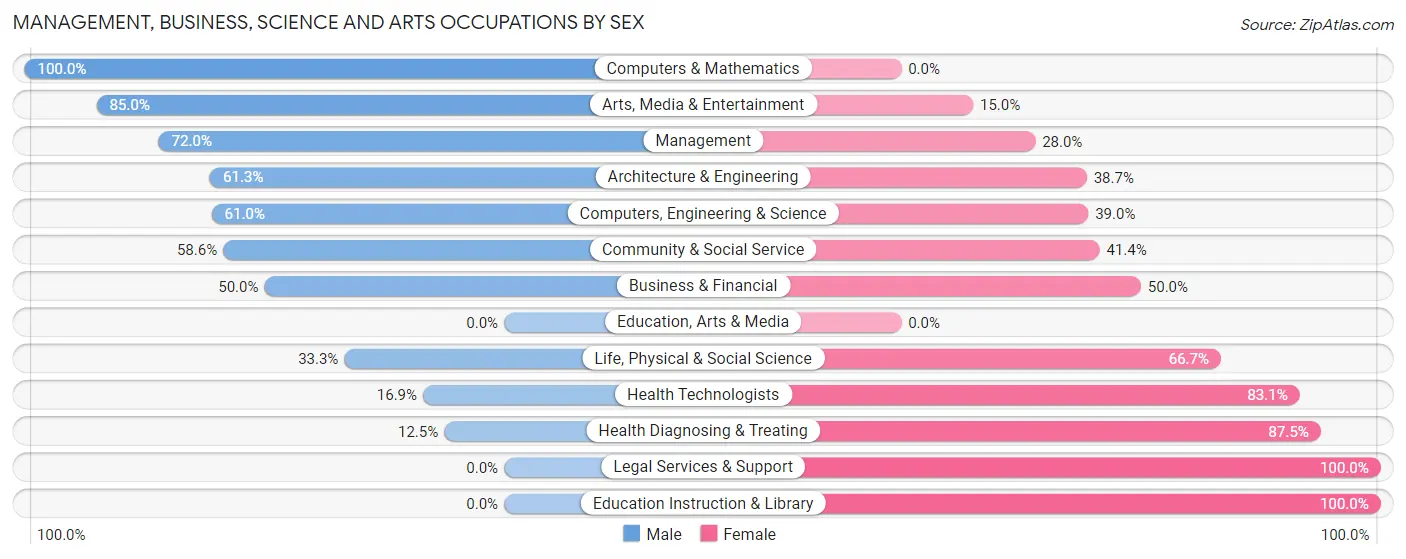
Management, Business, Science and Arts Occupations
The most common Management, Business, Science and Arts occupations in Meggett are Management (93 | 13.3%), Health Diagnosing & Treating (88 | 12.6%), Health Technologists (65 | 9.3%), Business & Financial (46 | 6.6%), and Computers, Engineering & Science (41 | 5.9%).
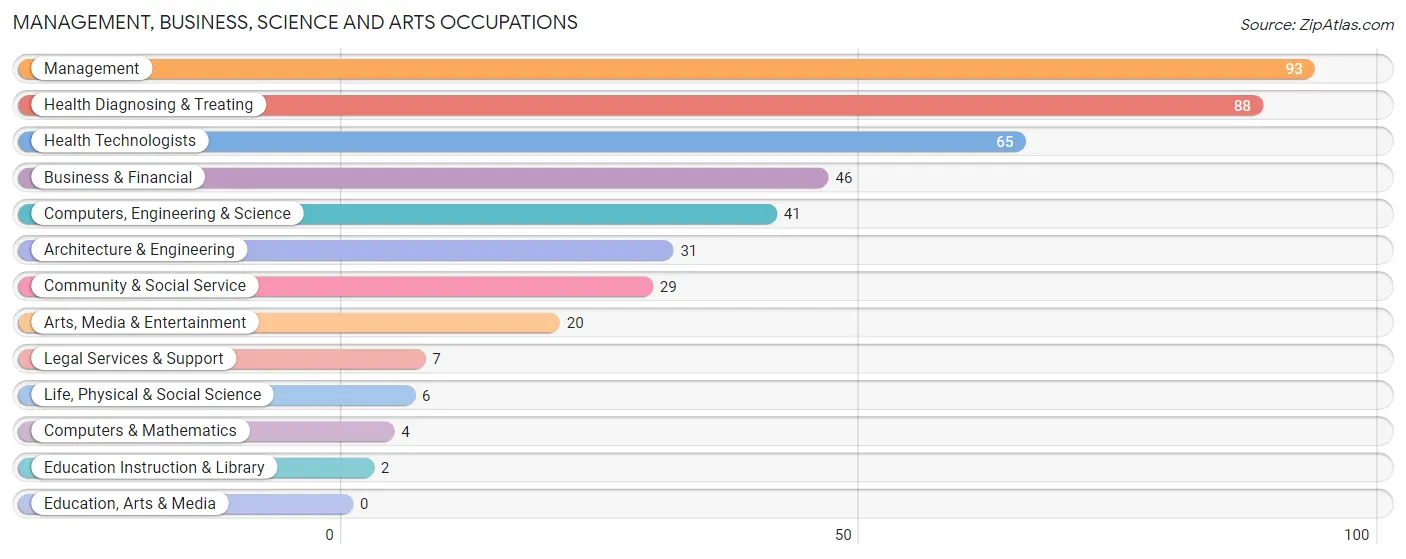
Management, Business, Science and Arts Occupations by Sex
Within the Management, Business, Science and Arts occupations in Meggett, the most male-oriented occupations are Computers & Mathematics (100.0%), Arts, Media & Entertainment (85.0%), and Management (72.0%), while the most female-oriented occupations are Legal Services & Support (100.0%), Education Instruction & Library (100.0%), and Health Diagnosing & Treating (87.5%).
| Occupation | Male | Female |
| Management | 67 (72.0%) | 26 (28.0%) |
| Business & Financial | 23 (50.0%) | 23 (50.0%) |
| Computers, Engineering & Science | 25 (61.0%) | 16 (39.0%) |
| Computers & Mathematics | 4 (100.0%) | 0 (0.0%) |
| Architecture & Engineering | 19 (61.3%) | 12 (38.7%) |
| Life, Physical & Social Science | 2 (33.3%) | 4 (66.7%) |
| Community & Social Service | 17 (58.6%) | 12 (41.4%) |
| Education, Arts & Media | 0 (0.0%) | 0 (0.0%) |
| Legal Services & Support | 0 (0.0%) | 7 (100.0%) |
| Education Instruction & Library | 0 (0.0%) | 2 (100.0%) |
| Arts, Media & Entertainment | 17 (85.0%) | 3 (15.0%) |
| Health Diagnosing & Treating | 11 (12.5%) | 77 (87.5%) |
| Health Technologists | 11 (16.9%) | 54 (83.1%) |
| Total (Category) | 143 (48.1%) | 154 (51.8%) |
| Total (Overall) | 340 (48.7%) | 358 (51.3%) |
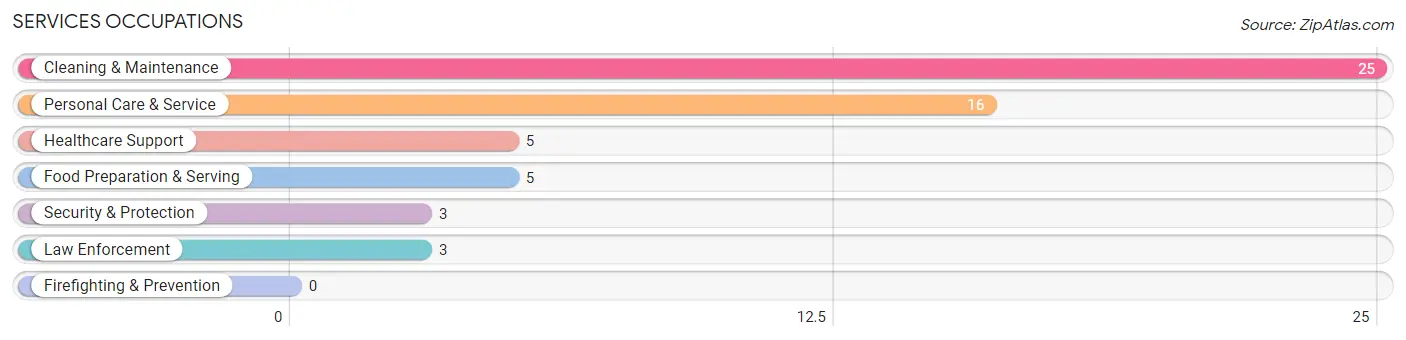
Services Occupations
The most common Services occupations in Meggett are Cleaning & Maintenance (25 | 3.6%), Personal Care & Service (16 | 2.3%), Healthcare Support (5 | 0.7%), Food Preparation & Serving (5 | 0.7%), and Security & Protection (3 | 0.4%).
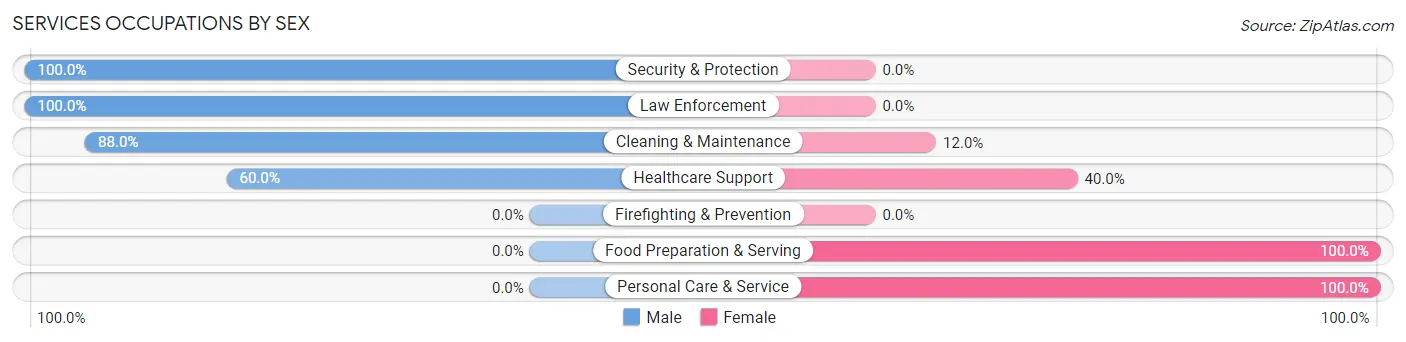
Services Occupations by Sex
Within the Services occupations in Meggett, the most male-oriented occupations are Security & Protection (100.0%), Law Enforcement (100.0%), and Cleaning & Maintenance (88.0%), while the most female-oriented occupations are Food Preparation & Serving (100.0%), Personal Care & Service (100.0%), and Healthcare Support (40.0%).
| Occupation | Male | Female |
| Healthcare Support | 3 (60.0%) | 2 (40.0%) |
| Security & Protection | 3 (100.0%) | 0 (0.0%) |
| Firefighting & Prevention | 0 (0.0%) | 0 (0.0%) |
| Law Enforcement | 3 (100.0%) | 0 (0.0%) |
| Food Preparation & Serving | 0 (0.0%) | 5 (100.0%) |
| Cleaning & Maintenance | 22 (88.0%) | 3 (12.0%) |
| Personal Care & Service | 0 (0.0%) | 16 (100.0%) |
| Total (Category) | 28 (51.8%) | 26 (48.1%) |
| Total (Overall) | 340 (48.7%) | 358 (51.3%) |
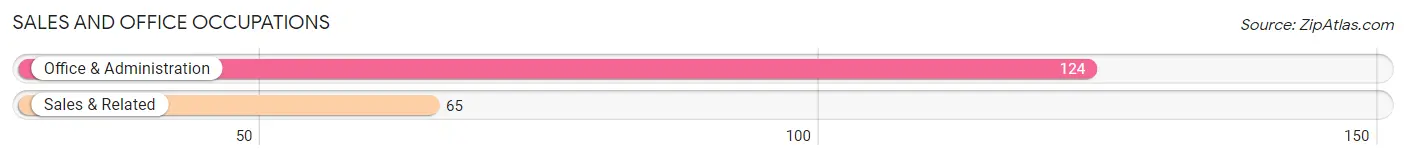
Sales and Office Occupations
The most common Sales and Office occupations in Meggett are Office & Administration (124 | 17.8%), and Sales & Related (65 | 9.3%).
Sales and Office Occupations by Sex
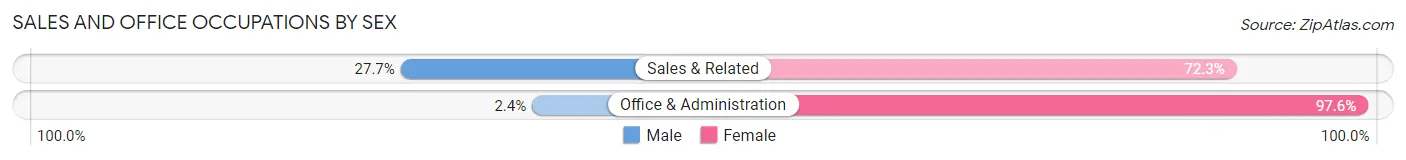
| Occupation | Male | Female |
| Sales & Related | 18 (27.7%) | 47 (72.3%) |
| Office & Administration | 3 (2.4%) | 121 (97.6%) |
| Total (Category) | 21 (11.1%) | 168 (88.9%) |
| Total (Overall) | 340 (48.7%) | 358 (51.3%) |
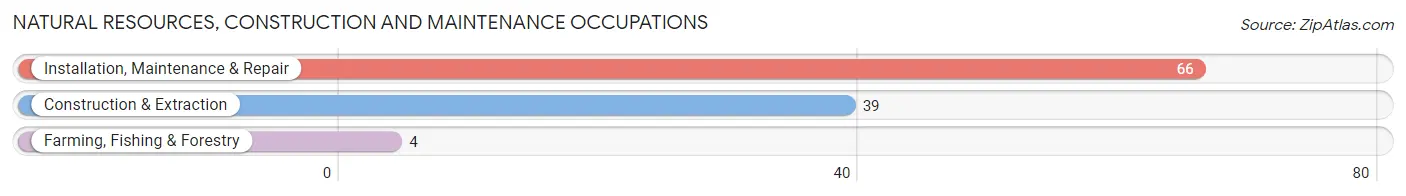
Natural Resources, Construction and Maintenance Occupations
The most common Natural Resources, Construction and Maintenance occupations in Meggett are Installation, Maintenance & Repair (66 | 9.5%), Construction & Extraction (39 | 5.6%), and Farming, Fishing & Forestry (4 | 0.6%).
Natural Resources, Construction and Maintenance Occupations by Sex
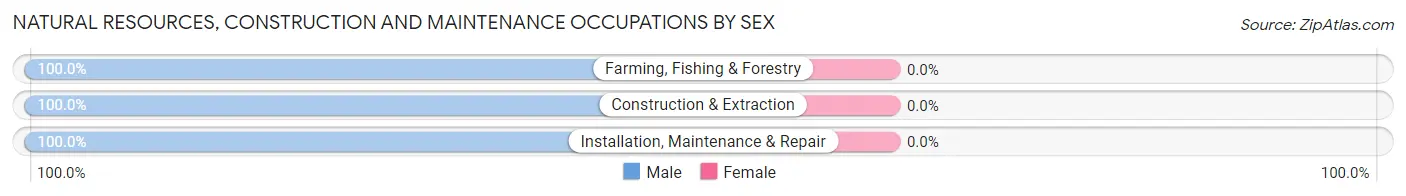
| Occupation | Male | Female |
| Farming, Fishing & Forestry | 4 (100.0%) | 0 (0.0%) |
| Construction & Extraction | 39 (100.0%) | 0 (0.0%) |
| Installation, Maintenance & Repair | 66 (100.0%) | 0 (0.0%) |
| Total (Category) | 109 (100.0%) | 0 (0.0%) |
| Total (Overall) | 340 (48.7%) | 358 (51.3%) |
Production, Transportation and Moving Occupations
The most common Production, Transportation and Moving occupations in Meggett are Production (23 | 3.3%), Material Moving (17 | 2.4%), and Transportation (9 | 1.3%).
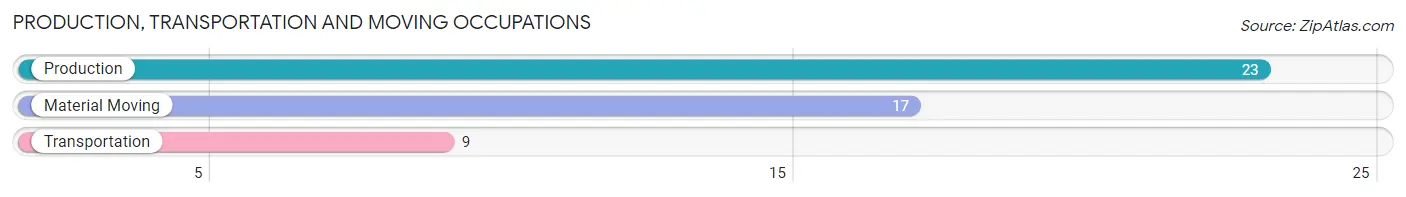
Production, Transportation and Moving Occupations by Sex
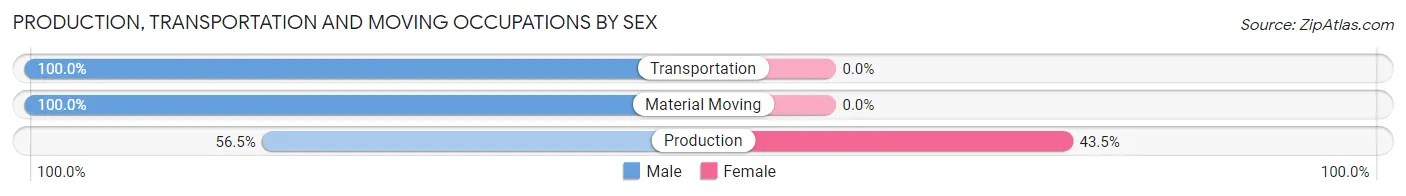
| Occupation | Male | Female |
| Production | 13 (56.5%) | 10 (43.5%) |
| Transportation | 9 (100.0%) | 0 (0.0%) |
| Material Moving | 17 (100.0%) | 0 (0.0%) |
| Total (Category) | 39 (79.6%) | 10 (20.4%) |
| Total (Overall) | 340 (48.7%) | 358 (51.3%) |
Employment Industries by Sex in Meggett
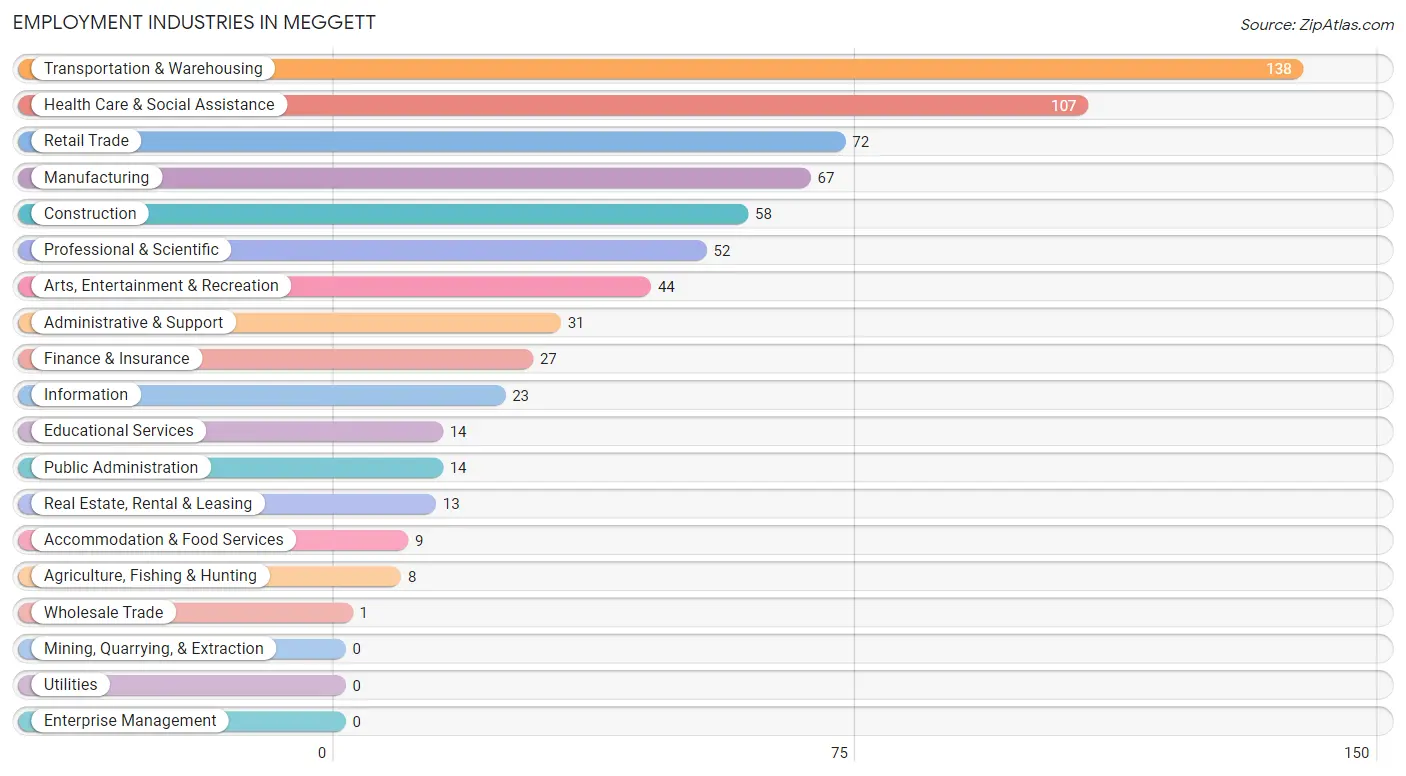
Employment Industries in Meggett
The major employment industries in Meggett include Transportation & Warehousing (138 | 19.8%), Health Care & Social Assistance (107 | 15.3%), Retail Trade (72 | 10.3%), Manufacturing (67 | 9.6%), and Construction (58 | 8.3%).
Employment Industries by Sex in Meggett
The Meggett industries that see more men than women are Agriculture, Fishing & Hunting (100.0%), Wholesale Trade (100.0%), and Arts, Entertainment & Recreation (95.5%), whereas the industries that tend to have a higher number of women are Information (100.0%), Health Care & Social Assistance (89.7%), and Educational Services (78.6%).
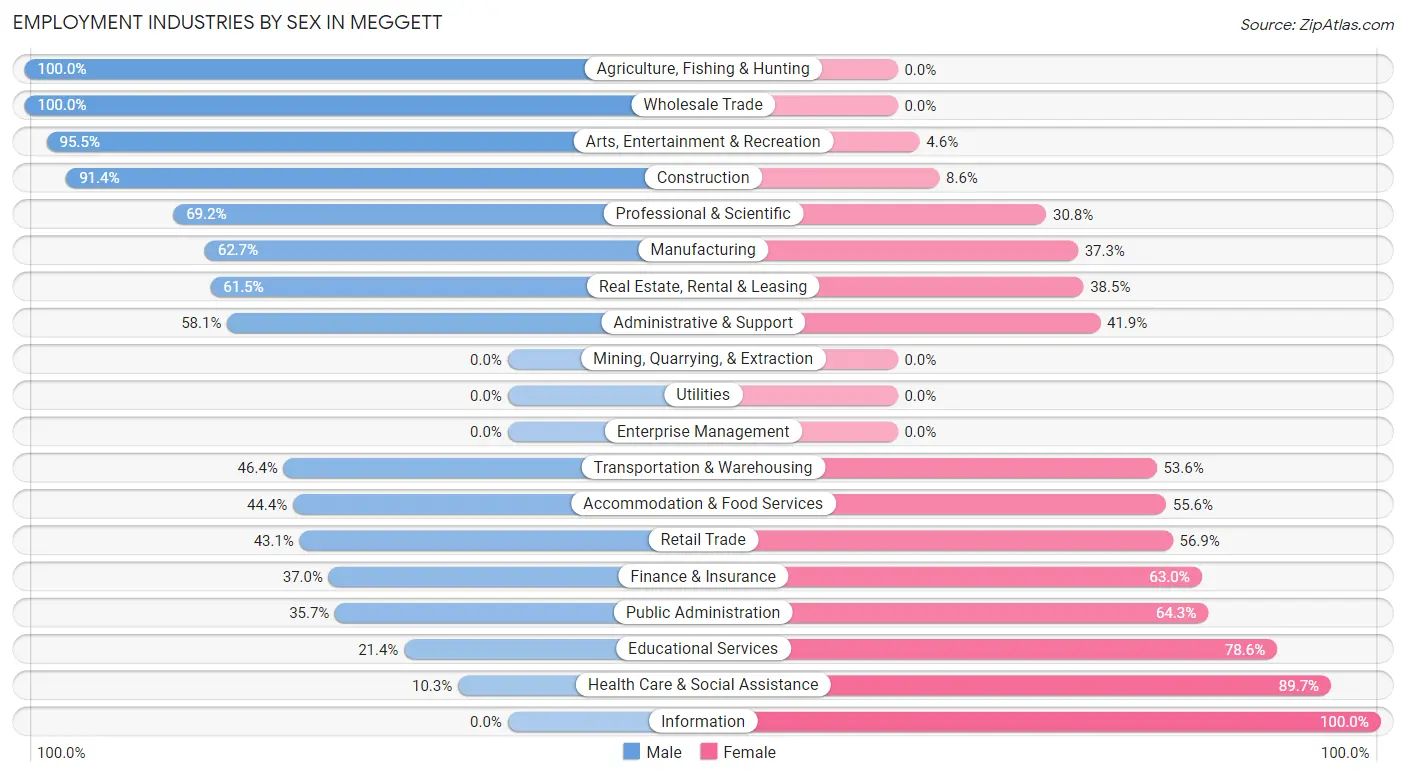
| Industry | Male | Female |
| Agriculture, Fishing & Hunting | 8 (100.0%) | 0 (0.0%) |
| Mining, Quarrying, & Extraction | 0 (0.0%) | 0 (0.0%) |
| Construction | 53 (91.4%) | 5 (8.6%) |
| Manufacturing | 42 (62.7%) | 25 (37.3%) |
| Wholesale Trade | 1 (100.0%) | 0 (0.0%) |
| Retail Trade | 31 (43.1%) | 41 (56.9%) |
| Transportation & Warehousing | 64 (46.4%) | 74 (53.6%) |
| Utilities | 0 (0.0%) | 0 (0.0%) |
| Information | 0 (0.0%) | 23 (100.0%) |
| Finance & Insurance | 10 (37.0%) | 17 (63.0%) |
| Real Estate, Rental & Leasing | 8 (61.5%) | 5 (38.5%) |
| Professional & Scientific | 36 (69.2%) | 16 (30.8%) |
| Enterprise Management | 0 (0.0%) | 0 (0.0%) |
| Administrative & Support | 18 (58.1%) | 13 (41.9%) |
| Educational Services | 3 (21.4%) | 11 (78.6%) |
| Health Care & Social Assistance | 11 (10.3%) | 96 (89.7%) |
| Arts, Entertainment & Recreation | 42 (95.5%) | 2 (4.5%) |
| Accommodation & Food Services | 4 (44.4%) | 5 (55.6%) |
| Public Administration | 5 (35.7%) | 9 (64.3%) |
| Total | 340 (48.7%) | 358 (51.3%) |
Education in Meggett
School Enrollment in Meggett
The most common levels of schooling among the 277 students in Meggett are middle school (108 | 39.0%), elementary school (55 | 19.9%), and nursery / preschool (40 | 14.4%).
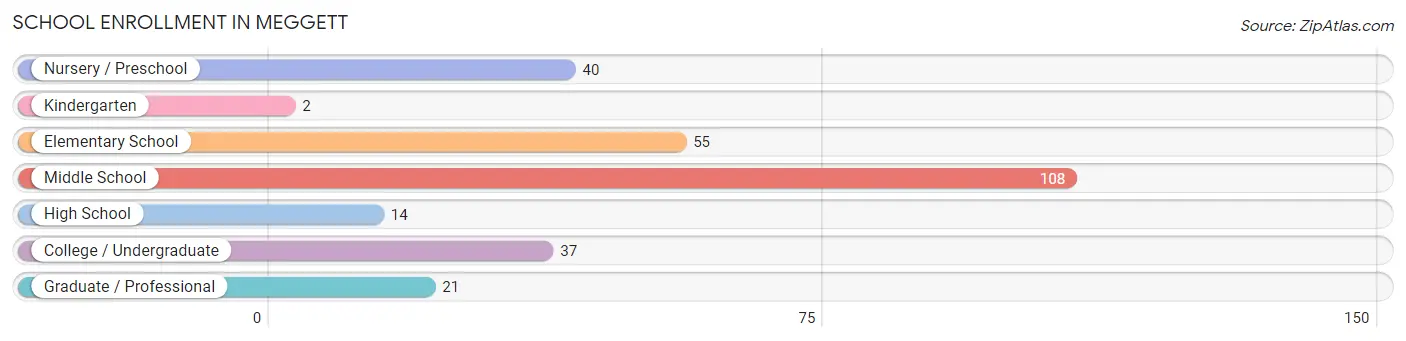
| School Level | # Students | % Students |
| Nursery / Preschool | 40 | 14.4% |
| Kindergarten | 2 | 0.7% |
| Elementary School | 55 | 19.9% |
| Middle School | 108 | 39.0% |
| High School | 14 | 5.1% |
| College / Undergraduate | 37 | 13.4% |
| Graduate / Professional | 21 | 7.6% |
| Total | 277 | 100.0% |
School Enrollment by Age by Funding Source in Meggett
Out of a total of 277 students who are enrolled in schools in Meggett, 24 (8.7%) attend a private institution, while the remaining 253 (91.3%) are enrolled in public schools. The age group of 20 to 24 year olds has the highest likelihood of being enrolled in private schools, with 17 (46.0% in the age bracket) enrolled. Conversely, the age group of 3 to 4 year olds has the lowest likelihood of being enrolled in a private school, with 40 (100.0% in the age bracket) attending a public institution.
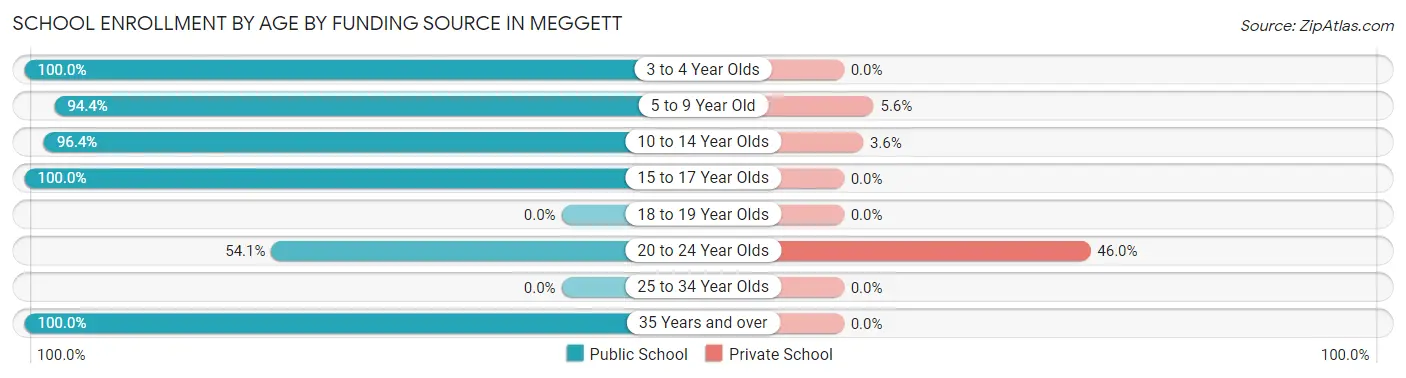
| Age Bracket | Public School | Private School |
| 3 to 4 Year Olds | 40 (100.0%) | 0 (0.0%) |
| 5 to 9 Year Old | 51 (94.4%) | 3 (5.6%) |
| 10 to 14 Year Olds | 107 (96.4%) | 4 (3.6%) |
| 15 to 17 Year Olds | 14 (100.0%) | 0 (0.0%) |
| 18 to 19 Year Olds | 0 (0.0%) | 0 (0.0%) |
| 20 to 24 Year Olds | 20 (54.0%) | 17 (46.0%) |
| 25 to 34 Year Olds | 0 (0.0%) | 0 (0.0%) |
| 35 Years and over | 21 (100.0%) | 0 (0.0%) |
| Total | 253 (91.3%) | 24 (8.7%) |
Educational Attainment by Field of Study in Meggett
Business (154 | 32.0%), bio, nature & agricultural (70 | 14.5%), science & technology (45 | 9.3%), psychology (32 | 6.6%), and engineering (29 | 6.0%) are the most common fields of study among 482 individuals in Meggett who have obtained a bachelor's degree or higher.
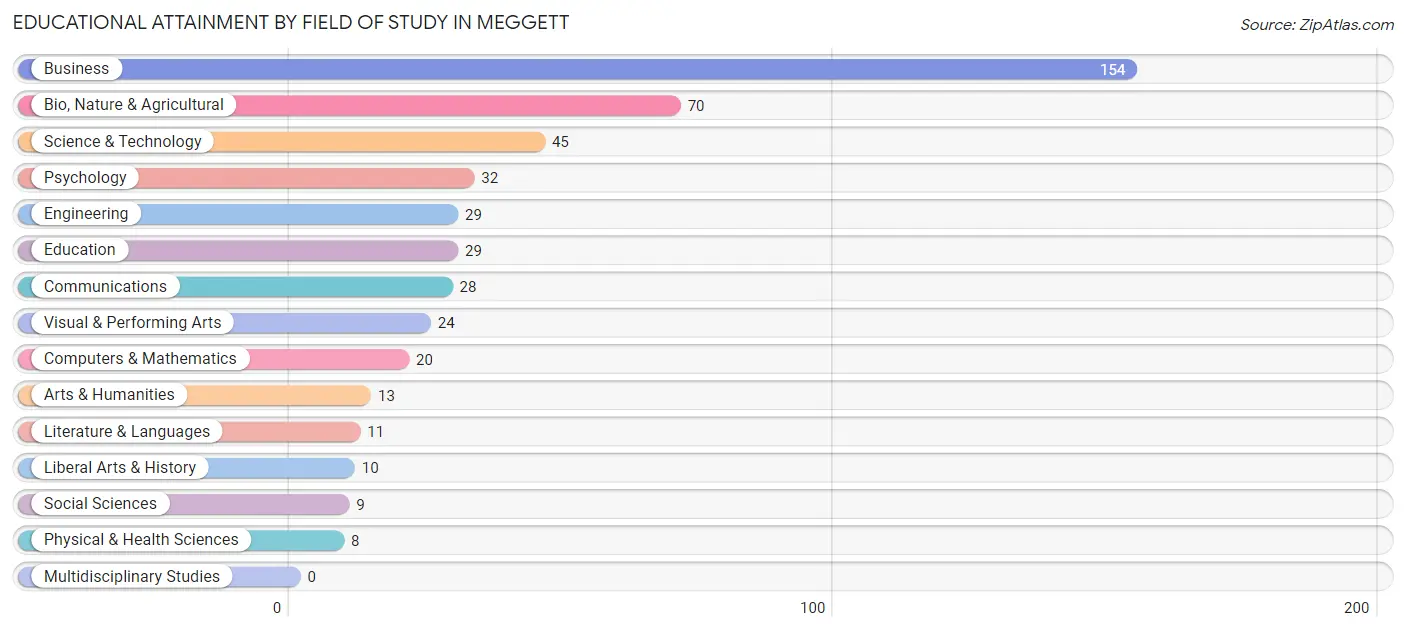
| Field of Study | # Graduates | % Graduates |
| Computers & Mathematics | 20 | 4.2% |
| Bio, Nature & Agricultural | 70 | 14.5% |
| Physical & Health Sciences | 8 | 1.7% |
| Psychology | 32 | 6.6% |
| Social Sciences | 9 | 1.9% |
| Engineering | 29 | 6.0% |
| Multidisciplinary Studies | 0 | 0.0% |
| Science & Technology | 45 | 9.3% |
| Business | 154 | 32.0% |
| Education | 29 | 6.0% |
| Literature & Languages | 11 | 2.3% |
| Liberal Arts & History | 10 | 2.1% |
| Visual & Performing Arts | 24 | 5.0% |
| Communications | 28 | 5.8% |
| Arts & Humanities | 13 | 2.7% |
| Total | 482 | 100.0% |
Transportation & Commute in Meggett
Vehicle Availability by Sex in Meggett
The most prevalent vehicle ownership categories in Meggett are males with 2 vehicles (153, accounting for 45.4%) and females with 2 vehicles (175, making up 42.7%).
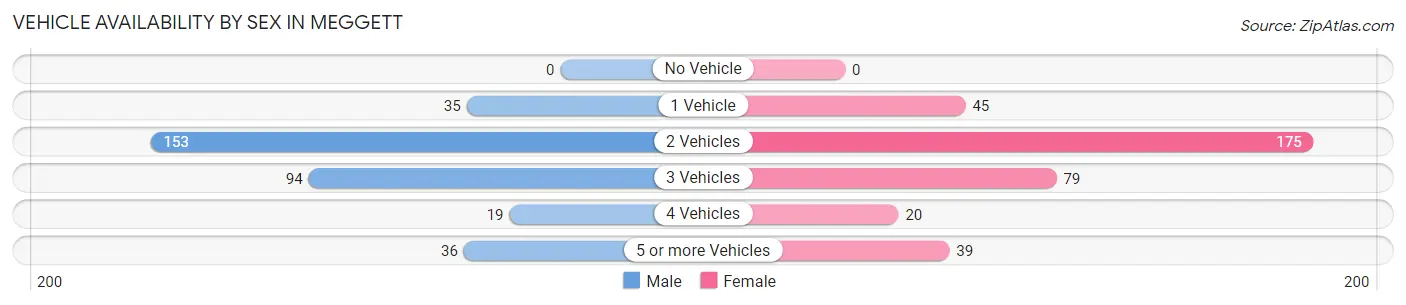
| Vehicles Available | Male | Female |
| No Vehicle | 0 (0.0%) | 0 (0.0%) |
| 1 Vehicle | 35 (10.4%) | 45 (12.6%) |
| 2 Vehicles | 153 (45.4%) | 175 (48.9%) |
| 3 Vehicles | 94 (27.9%) | 79 (22.1%) |
| 4 Vehicles | 19 (5.6%) | 20 (5.6%) |
| 5 or more Vehicles | 36 (10.7%) | 39 (10.9%) |
| Total | 337 (100.0%) | 358 (100.0%) |
Commute Time in Meggett
The most frequently occuring commute durations in Meggett are 30 to 34 minutes (260 commuters, 43.5%), 60 to 89 minutes (85 commuters, 14.2%), and 45 to 59 minutes (79 commuters, 13.2%).
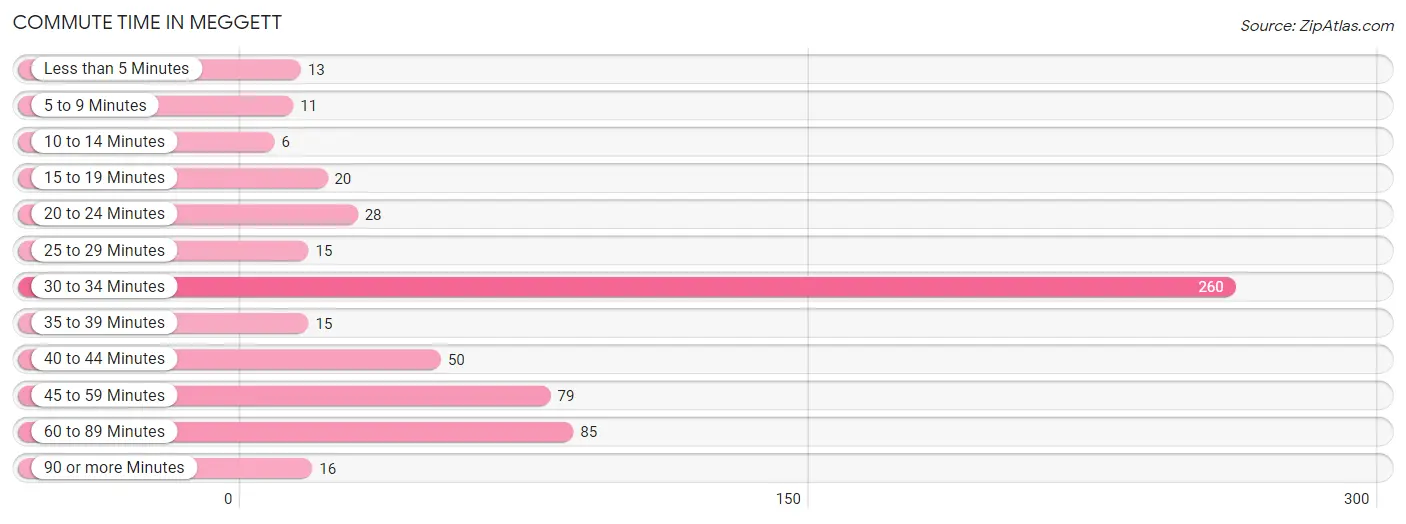
| Commute Time | # Commuters | % Commuters |
| Less than 5 Minutes | 13 | 2.2% |
| 5 to 9 Minutes | 11 | 1.8% |
| 10 to 14 Minutes | 6 | 1.0% |
| 15 to 19 Minutes | 20 | 3.3% |
| 20 to 24 Minutes | 28 | 4.7% |
| 25 to 29 Minutes | 15 | 2.5% |
| 30 to 34 Minutes | 260 | 43.5% |
| 35 to 39 Minutes | 15 | 2.5% |
| 40 to 44 Minutes | 50 | 8.4% |
| 45 to 59 Minutes | 79 | 13.2% |
| 60 to 89 Minutes | 85 | 14.2% |
| 90 or more Minutes | 16 | 2.7% |
Commute Time by Sex in Meggett
The most common commute times in Meggett are 30 to 34 minutes (137 commuters, 47.4%) for males and 30 to 34 minutes (123 commuters, 39.8%) for females.
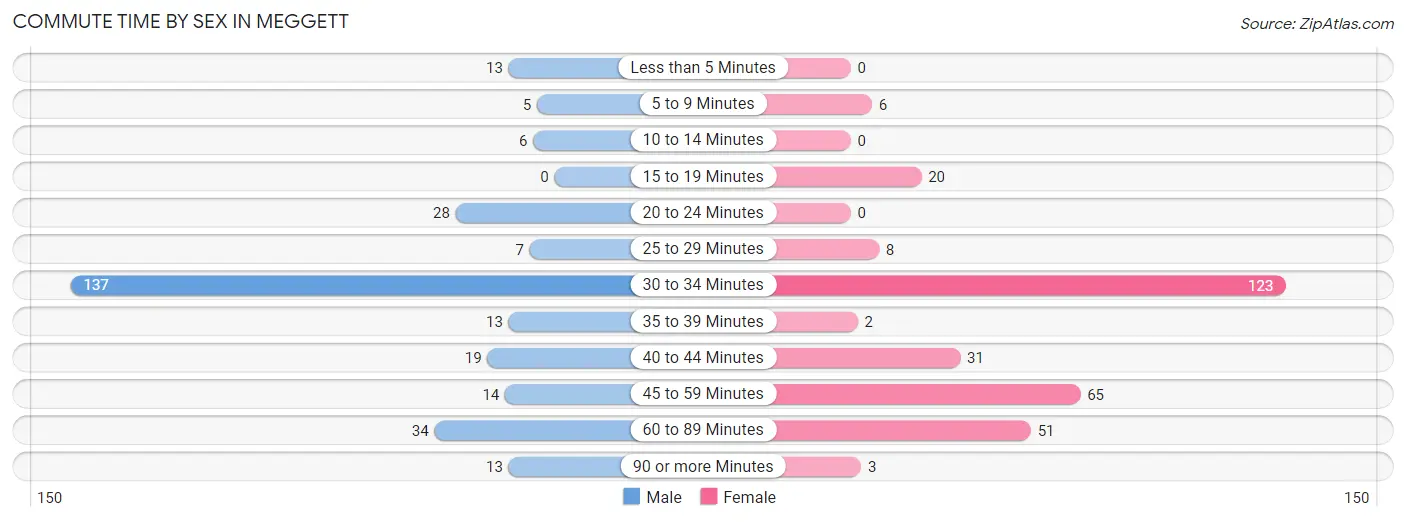
| Commute Time | Male | Female |
| Less than 5 Minutes | 13 (4.5%) | 0 (0.0%) |
| 5 to 9 Minutes | 5 (1.7%) | 6 (1.9%) |
| 10 to 14 Minutes | 6 (2.1%) | 0 (0.0%) |
| 15 to 19 Minutes | 0 (0.0%) | 20 (6.5%) |
| 20 to 24 Minutes | 28 (9.7%) | 0 (0.0%) |
| 25 to 29 Minutes | 7 (2.4%) | 8 (2.6%) |
| 30 to 34 Minutes | 137 (47.4%) | 123 (39.8%) |
| 35 to 39 Minutes | 13 (4.5%) | 2 (0.6%) |
| 40 to 44 Minutes | 19 (6.6%) | 31 (10.0%) |
| 45 to 59 Minutes | 14 (4.8%) | 65 (21.0%) |
| 60 to 89 Minutes | 34 (11.8%) | 51 (16.5%) |
| 90 or more Minutes | 13 (4.5%) | 3 (1.0%) |
Time of Departure to Work by Sex in Meggett
The most frequent times of departure to work in Meggett are 7:00 AM to 7:29 AM (66, 22.8%) for males and 8:00 AM to 8:29 AM (118, 38.2%) for females.
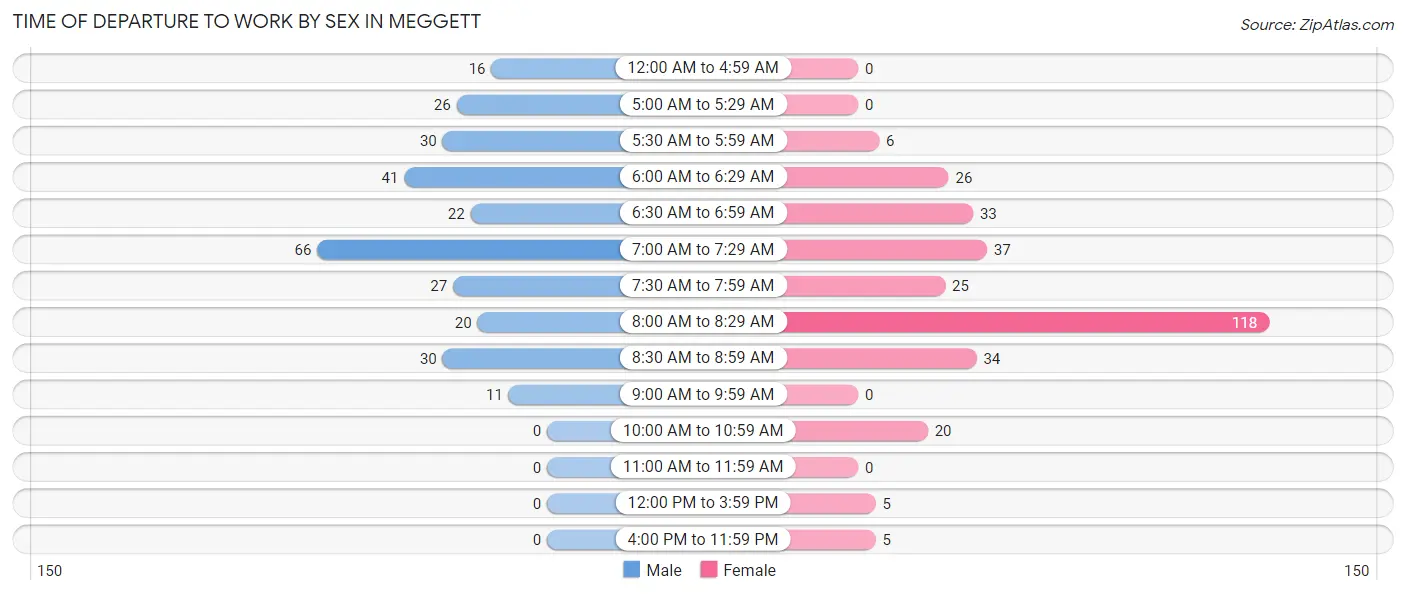
| Time of Departure | Male | Female |
| 12:00 AM to 4:59 AM | 16 (5.5%) | 0 (0.0%) |
| 5:00 AM to 5:29 AM | 26 (9.0%) | 0 (0.0%) |
| 5:30 AM to 5:59 AM | 30 (10.4%) | 6 (1.9%) |
| 6:00 AM to 6:29 AM | 41 (14.2%) | 26 (8.4%) |
| 6:30 AM to 6:59 AM | 22 (7.6%) | 33 (10.7%) |
| 7:00 AM to 7:29 AM | 66 (22.8%) | 37 (12.0%) |
| 7:30 AM to 7:59 AM | 27 (9.3%) | 25 (8.1%) |
| 8:00 AM to 8:29 AM | 20 (6.9%) | 118 (38.2%) |
| 8:30 AM to 8:59 AM | 30 (10.4%) | 34 (11.0%) |
| 9:00 AM to 9:59 AM | 11 (3.8%) | 0 (0.0%) |
| 10:00 AM to 10:59 AM | 0 (0.0%) | 20 (6.5%) |
| 11:00 AM to 11:59 AM | 0 (0.0%) | 0 (0.0%) |
| 12:00 PM to 3:59 PM | 0 (0.0%) | 5 (1.6%) |
| 4:00 PM to 11:59 PM | 0 (0.0%) | 5 (1.6%) |
| Total | 289 (100.0%) | 309 (100.0%) |
Housing Occupancy in Meggett
Occupancy by Ownership in Meggett
Of the total 621 dwellings in Meggett, owner-occupied units account for 606 (97.6%), while renter-occupied units make up 15 (2.4%).
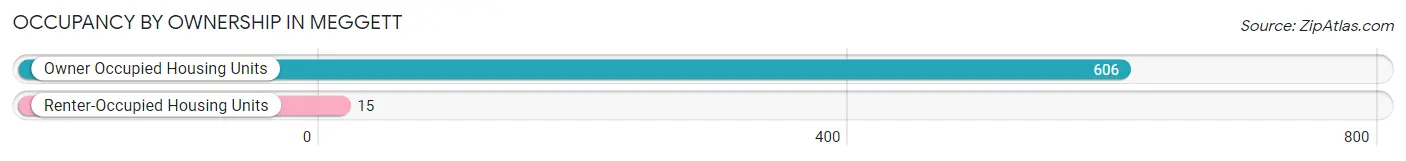
| Occupancy | # Housing Units | % Housing Units |
| Owner Occupied Housing Units | 606 | 97.6% |
| Renter-Occupied Housing Units | 15 | 2.4% |
| Total Occupied Housing Units | 621 | 100.0% |
Occupancy by Household Size in Meggett
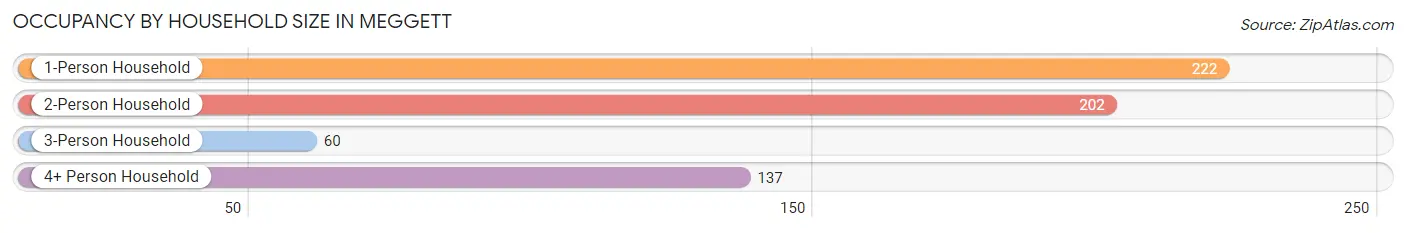
| Household Size | # Housing Units | % Housing Units |
| 1-Person Household | 222 | 35.7% |
| 2-Person Household | 202 | 32.5% |
| 3-Person Household | 60 | 9.7% |
| 4+ Person Household | 137 | 22.1% |
| Total Housing Units | 621 | 100.0% |
Occupancy by Ownership by Household Size in Meggett
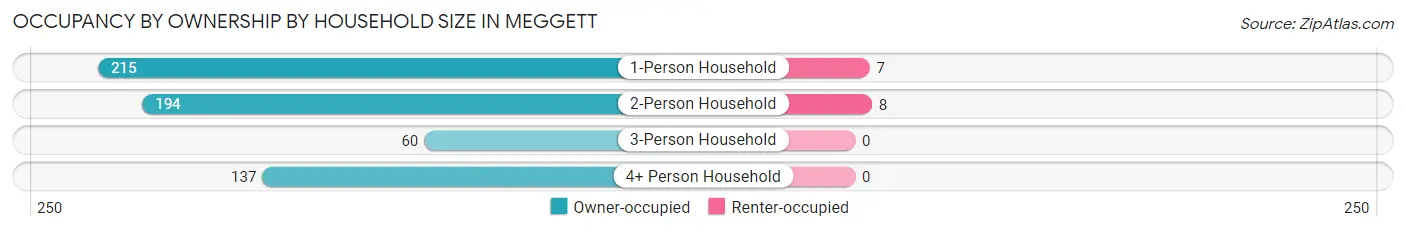
| Household Size | Owner-occupied | Renter-occupied |
| 1-Person Household | 215 (96.9%) | 7 (3.2%) |
| 2-Person Household | 194 (96.0%) | 8 (4.0%) |
| 3-Person Household | 60 (100.0%) | 0 (0.0%) |
| 4+ Person Household | 137 (100.0%) | 0 (0.0%) |
| Total Housing Units | 606 (97.6%) | 15 (2.4%) |
Occupancy by Educational Attainment in Meggett
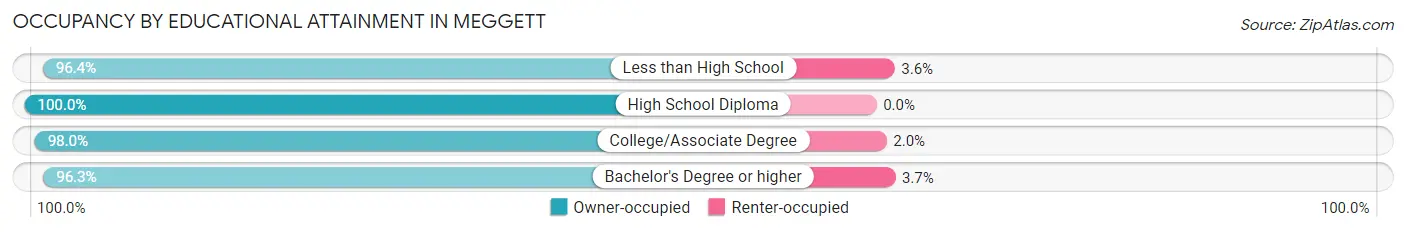
| Household Size | Owner-occupied | Renter-occupied |
| Less than High School | 80 (96.4%) | 3 (3.6%) |
| High School Diploma | 125 (100.0%) | 0 (0.0%) |
| College/Associate Degree | 194 (98.0%) | 4 (2.0%) |
| Bachelor's Degree or higher | 207 (96.3%) | 8 (3.7%) |
Occupancy by Age of Householder in Meggett
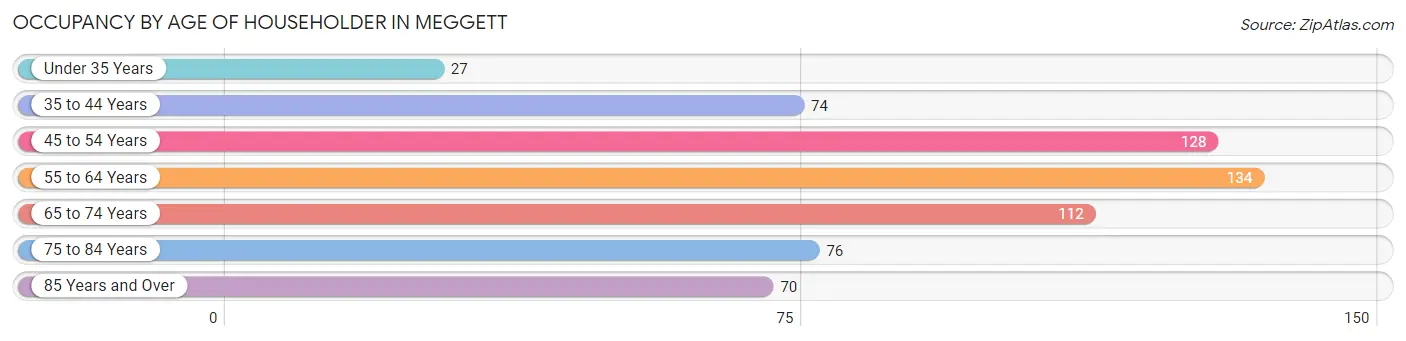
| Age Bracket | # Households | % Households |
| Under 35 Years | 27 | 4.3% |
| 35 to 44 Years | 74 | 11.9% |
| 45 to 54 Years | 128 | 20.6% |
| 55 to 64 Years | 134 | 21.6% |
| 65 to 74 Years | 112 | 18.0% |
| 75 to 84 Years | 76 | 12.2% |
| 85 Years and Over | 70 | 11.3% |
| Total | 621 | 100.0% |
Housing Finances in Meggett
Median Income by Occupancy in Meggett
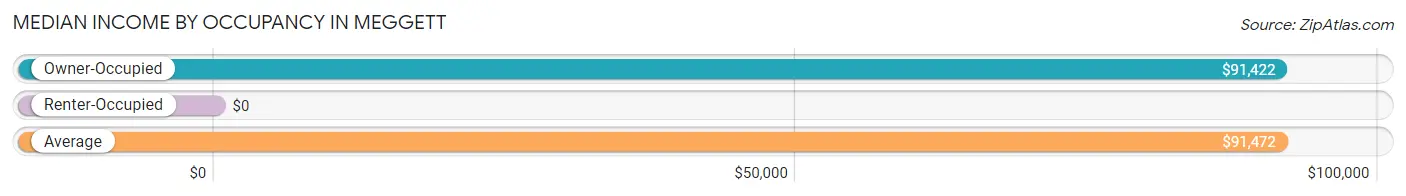
| Occupancy Type | # Households | Median Income |
| Owner-Occupied | 606 (97.6%) | $91,422 |
| Renter-Occupied | 15 (2.4%) | $0 |
| Average | 621 (100.0%) | $91,472 |
Occupancy by Householder Income Bracket in Meggett
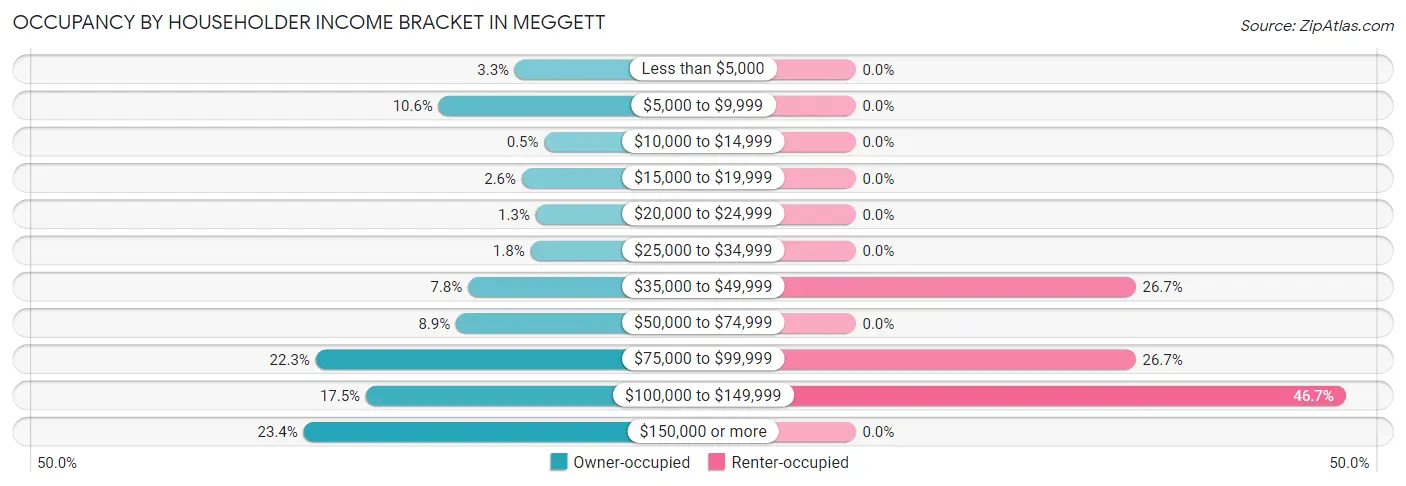
| Income Bracket | Owner-occupied | Renter-occupied |
| Less than $5,000 | 20 (3.3%) | 0 (0.0%) |
| $5,000 to $9,999 | 64 (10.6%) | 0 (0.0%) |
| $10,000 to $14,999 | 3 (0.5%) | 0 (0.0%) |
| $15,000 to $19,999 | 16 (2.6%) | 0 (0.0%) |
| $20,000 to $24,999 | 8 (1.3%) | 0 (0.0%) |
| $25,000 to $34,999 | 11 (1.8%) | 0 (0.0%) |
| $35,000 to $49,999 | 47 (7.8%) | 4 (26.7%) |
| $50,000 to $74,999 | 54 (8.9%) | 0 (0.0%) |
| $75,000 to $99,999 | 135 (22.3%) | 4 (26.7%) |
| $100,000 to $149,999 | 106 (17.5%) | 7 (46.7%) |
| $150,000 or more | 142 (23.4%) | 0 (0.0%) |
| Total | 606 (100.0%) | 15 (100.0%) |
Monthly Housing Cost Tiers in Meggett
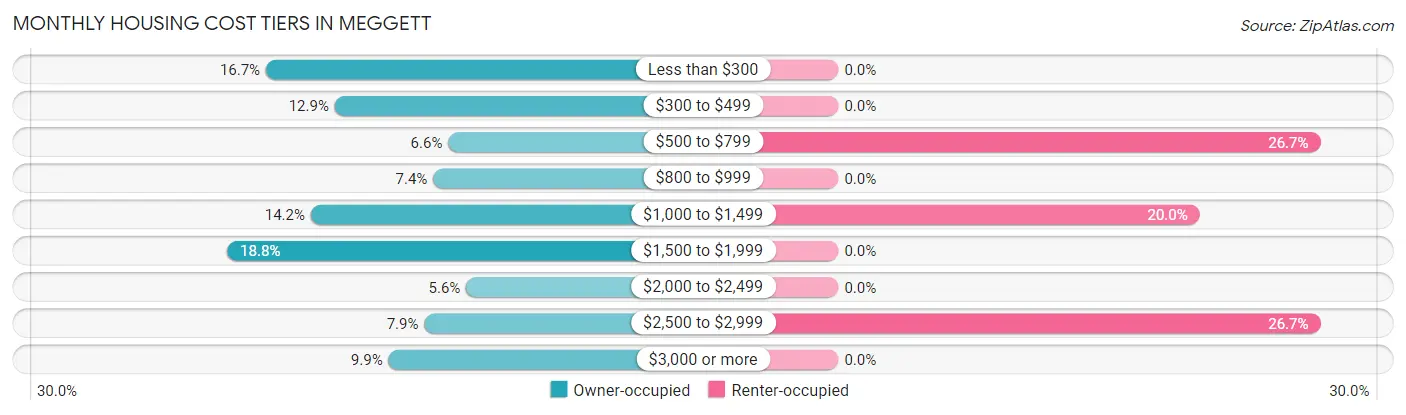
| Monthly Cost | Owner-occupied | Renter-occupied |
| Less than $300 | 101 (16.7%) | 0 (0.0%) |
| $300 to $499 | 78 (12.9%) | 0 (0.0%) |
| $500 to $799 | 40 (6.6%) | 4 (26.7%) |
| $800 to $999 | 45 (7.4%) | 0 (0.0%) |
| $1,000 to $1,499 | 86 (14.2%) | 3 (20.0%) |
| $1,500 to $1,999 | 114 (18.8%) | 0 (0.0%) |
| $2,000 to $2,499 | 34 (5.6%) | 0 (0.0%) |
| $2,500 to $2,999 | 48 (7.9%) | 4 (26.7%) |
| $3,000 or more | 60 (9.9%) | 0 (0.0%) |
| Total | 606 (100.0%) | 15 (100.0%) |
Physical Housing Characteristics in Meggett
Housing Structures in Meggett
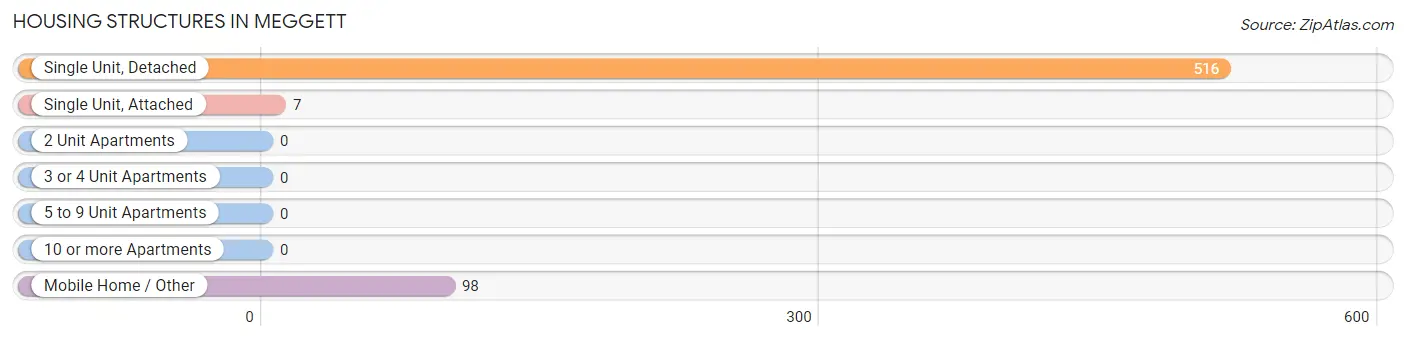
| Structure Type | # Housing Units | % Housing Units |
| Single Unit, Detached | 516 | 83.1% |
| Single Unit, Attached | 7 | 1.1% |
| 2 Unit Apartments | 0 | 0.0% |
| 3 or 4 Unit Apartments | 0 | 0.0% |
| 5 to 9 Unit Apartments | 0 | 0.0% |
| 10 or more Apartments | 0 | 0.0% |
| Mobile Home / Other | 98 | 15.8% |
| Total | 621 | 100.0% |
Housing Structures by Occupancy in Meggett
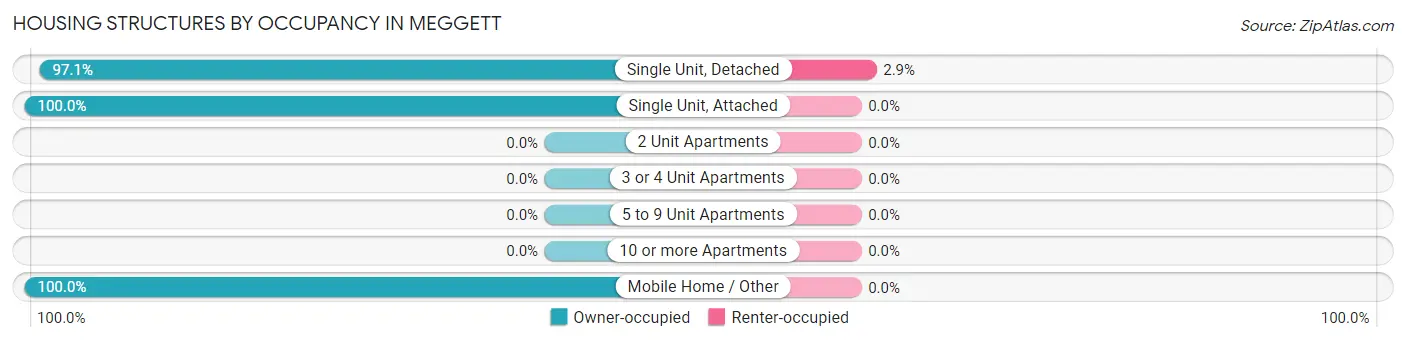
| Structure Type | Owner-occupied | Renter-occupied |
| Single Unit, Detached | 501 (97.1%) | 15 (2.9%) |
| Single Unit, Attached | 7 (100.0%) | 0 (0.0%) |
| 2 Unit Apartments | 0 (0.0%) | 0 (0.0%) |
| 3 or 4 Unit Apartments | 0 (0.0%) | 0 (0.0%) |
| 5 to 9 Unit Apartments | 0 (0.0%) | 0 (0.0%) |
| 10 or more Apartments | 0 (0.0%) | 0 (0.0%) |
| Mobile Home / Other | 98 (100.0%) | 0 (0.0%) |
| Total | 606 (97.6%) | 15 (2.4%) |
Housing Structures by Number of Rooms in Meggett
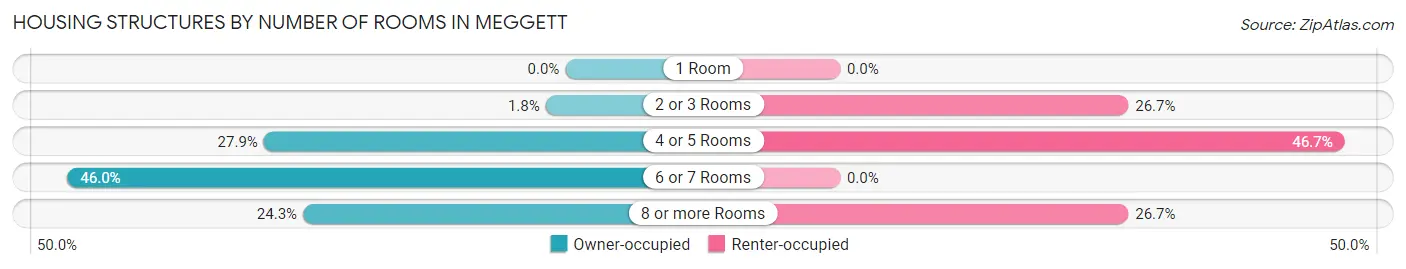
| Number of Rooms | Owner-occupied | Renter-occupied |
| 1 Room | 0 (0.0%) | 0 (0.0%) |
| 2 or 3 Rooms | 11 (1.8%) | 4 (26.7%) |
| 4 or 5 Rooms | 169 (27.9%) | 7 (46.7%) |
| 6 or 7 Rooms | 279 (46.0%) | 0 (0.0%) |
| 8 or more Rooms | 147 (24.3%) | 4 (26.7%) |
| Total | 606 (100.0%) | 15 (100.0%) |
Housing Structure by Heating Type in Meggett
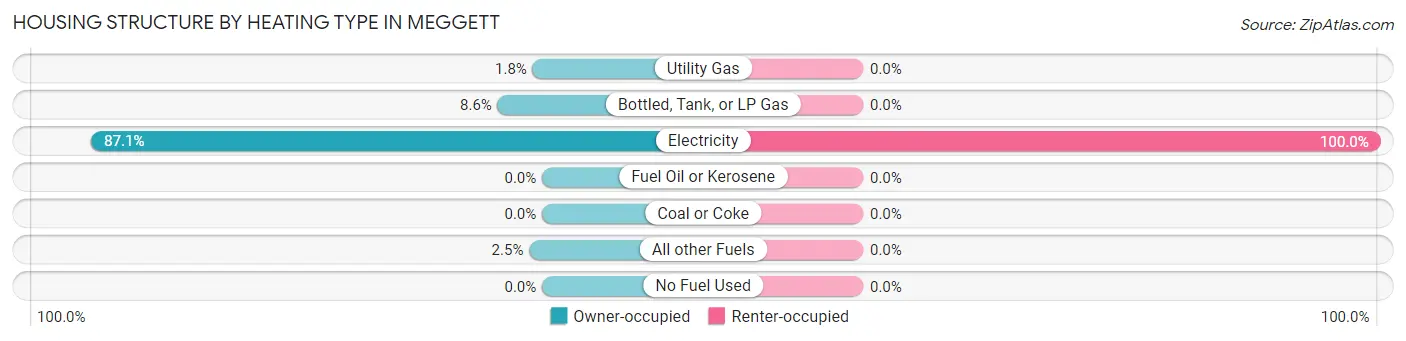
| Heating Type | Owner-occupied | Renter-occupied |
| Utility Gas | 11 (1.8%) | 0 (0.0%) |
| Bottled, Tank, or LP Gas | 52 (8.6%) | 0 (0.0%) |
| Electricity | 528 (87.1%) | 15 (100.0%) |
| Fuel Oil or Kerosene | 0 (0.0%) | 0 (0.0%) |
| Coal or Coke | 0 (0.0%) | 0 (0.0%) |
| All other Fuels | 15 (2.5%) | 0 (0.0%) |
| No Fuel Used | 0 (0.0%) | 0 (0.0%) |
| Total | 606 (100.0%) | 15 (100.0%) |
Household Vehicle Usage in Meggett
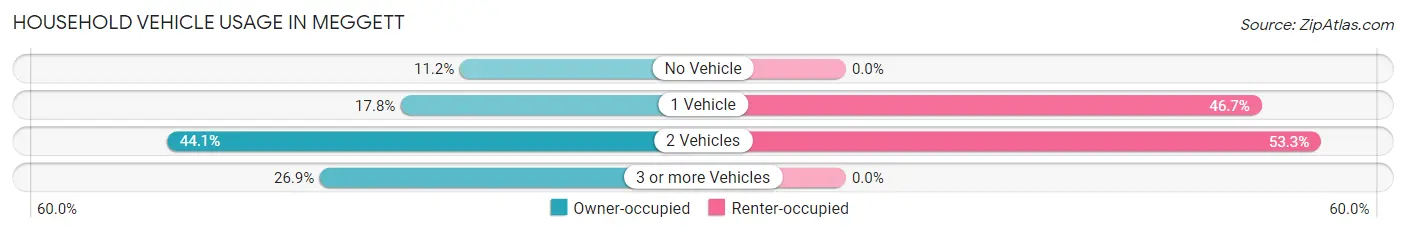
| Vehicles per Household | Owner-occupied | Renter-occupied |
| No Vehicle | 68 (11.2%) | 0 (0.0%) |
| 1 Vehicle | 108 (17.8%) | 7 (46.7%) |
| 2 Vehicles | 267 (44.1%) | 8 (53.3%) |
| 3 or more Vehicles | 163 (26.9%) | 0 (0.0%) |
| Total | 606 (100.0%) | 15 (100.0%) |
Real Estate & Mortgages in Meggett
Real Estate and Mortgage Overview in Meggett
| Characteristic | Without Mortgage | With Mortgage |
| Housing Units | 317 | 289 |
| Median Property Value | $320,600 | $687,500 |
| Median Household Income | $52,054 | $83 |
| Monthly Housing Costs | $399 | $60 |
| Real Estate Taxes | - | - |
Property Value by Mortgage Status in Meggett
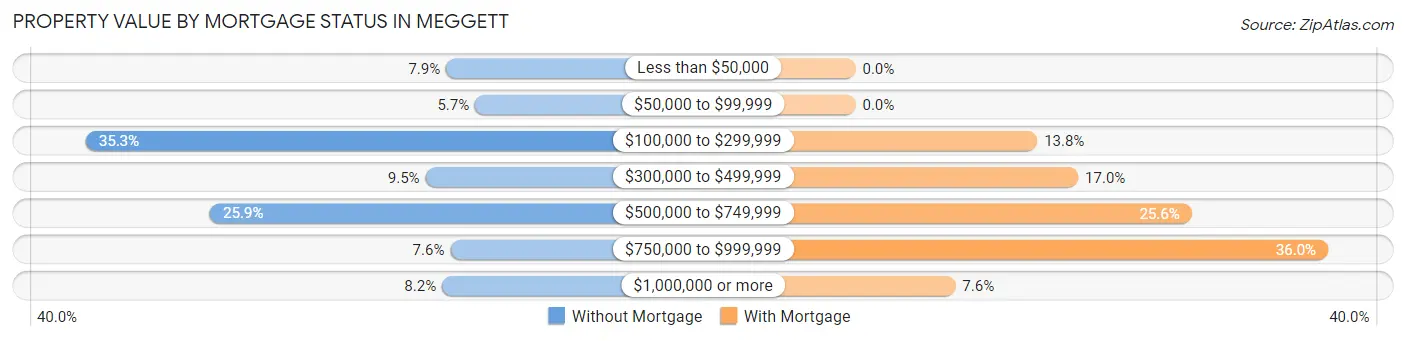
| Property Value | Without Mortgage | With Mortgage |
| Less than $50,000 | 25 (7.9%) | 0 (0.0%) |
| $50,000 to $99,999 | 18 (5.7%) | 0 (0.0%) |
| $100,000 to $299,999 | 112 (35.3%) | 40 (13.8%) |
| $300,000 to $499,999 | 30 (9.5%) | 49 (17.0%) |
| $500,000 to $749,999 | 82 (25.9%) | 74 (25.6%) |
| $750,000 to $999,999 | 24 (7.6%) | 104 (36.0%) |
| $1,000,000 or more | 26 (8.2%) | 22 (7.6%) |
| Total | 317 (100.0%) | 289 (100.0%) |
Household Income by Mortgage Status in Meggett
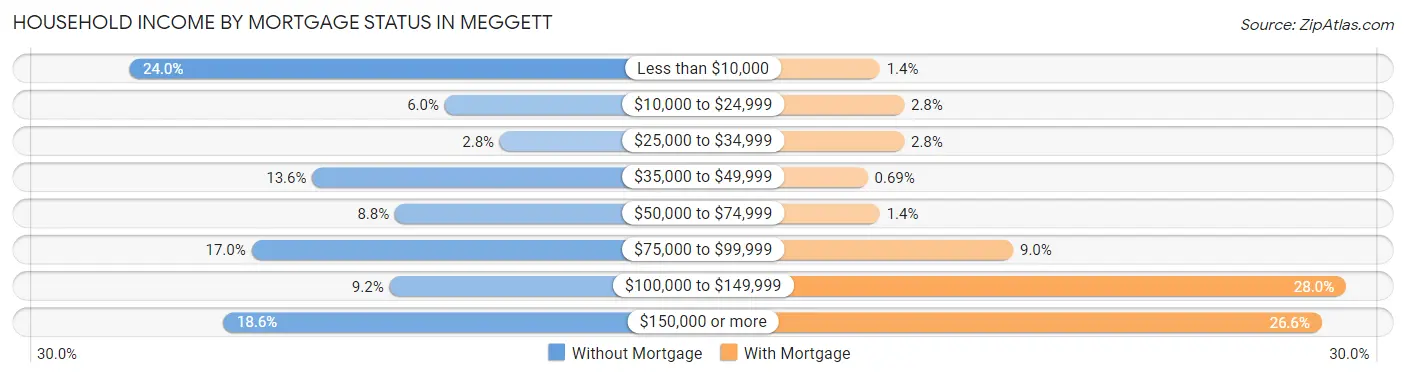
| Household Income | Without Mortgage | With Mortgage |
| Less than $10,000 | 76 (24.0%) | 4 (1.4%) |
| $10,000 to $24,999 | 19 (6.0%) | 8 (2.8%) |
| $25,000 to $34,999 | 9 (2.8%) | 8 (2.8%) |
| $35,000 to $49,999 | 43 (13.6%) | 2 (0.7%) |
| $50,000 to $74,999 | 28 (8.8%) | 4 (1.4%) |
| $75,000 to $99,999 | 54 (17.0%) | 26 (9.0%) |
| $100,000 to $149,999 | 29 (9.1%) | 81 (28.0%) |
| $150,000 or more | 59 (18.6%) | 77 (26.6%) |
| Total | 317 (100.0%) | 289 (100.0%) |
Property Value to Household Income Ratio in Meggett
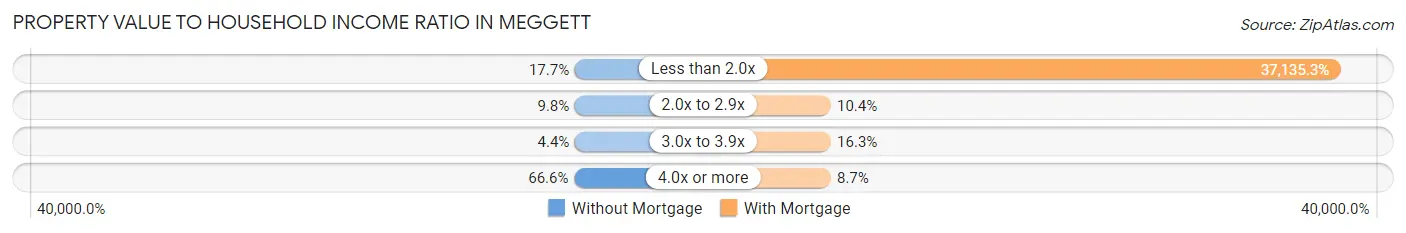
| Value-to-Income Ratio | Without Mortgage | With Mortgage |
| Less than 2.0x | 56 (17.7%) | 107,321 (37,135.3%) |
| 2.0x to 2.9x | 31 (9.8%) | 30 (10.4%) |
| 3.0x to 3.9x | 14 (4.4%) | 47 (16.3%) |
| 4.0x or more | 211 (66.6%) | 25 (8.6%) |
| Total | 317 (100.0%) | 289 (100.0%) |
Real Estate Taxes by Mortgage Status in Meggett
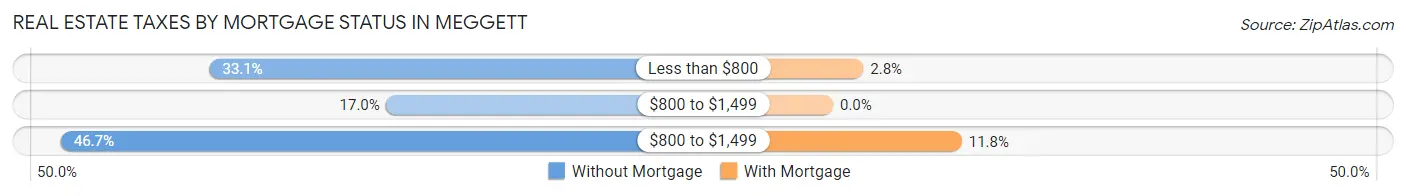
| Property Taxes | Without Mortgage | With Mortgage |
| Less than $800 | 105 (33.1%) | 8 (2.8%) |
| $800 to $1,499 | 54 (17.0%) | 0 (0.0%) |
| $800 to $1,499 | 148 (46.7%) | 34 (11.8%) |
| Total | 317 (100.0%) | 289 (100.0%) |
Health & Disability in Meggett
Health Insurance Coverage by Age in Meggett
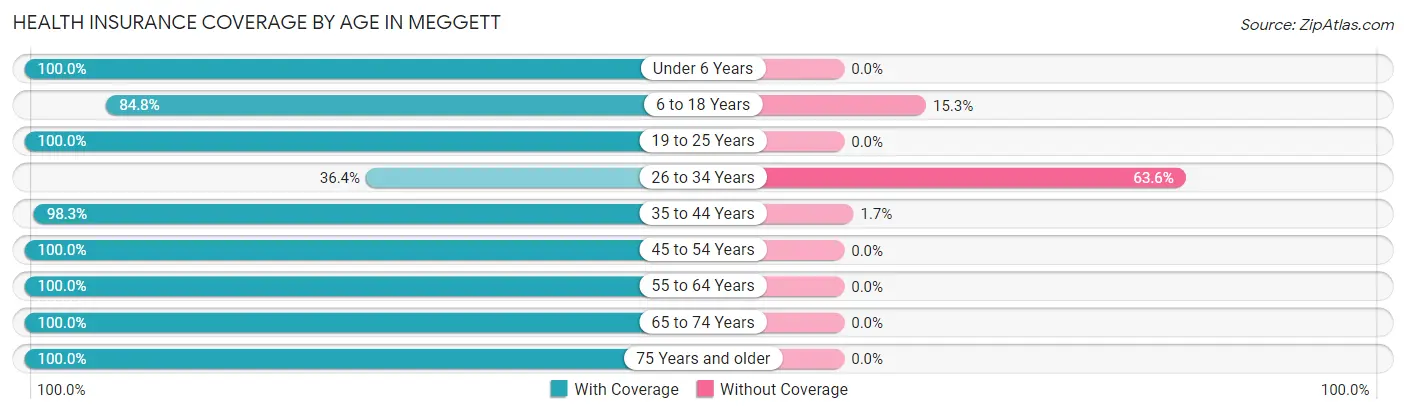
| Age Bracket | With Coverage | Without Coverage |
| Under 6 Years | 93 (100.0%) | 0 (0.0%) |
| 6 to 18 Years | 150 (84.8%) | 27 (15.2%) |
| 19 to 25 Years | 50 (100.0%) | 0 (0.0%) |
| 26 to 34 Years | 8 (36.4%) | 14 (63.6%) |
| 35 to 44 Years | 228 (98.3%) | 4 (1.7%) |
| 45 to 54 Years | 200 (100.0%) | 0 (0.0%) |
| 55 to 64 Years | 184 (100.0%) | 0 (0.0%) |
| 65 to 74 Years | 200 (100.0%) | 0 (0.0%) |
| 75 Years and older | 190 (100.0%) | 0 (0.0%) |
| Total | 1,303 (96.7%) | 45 (3.3%) |
Health Insurance Coverage by Citizenship Status in Meggett
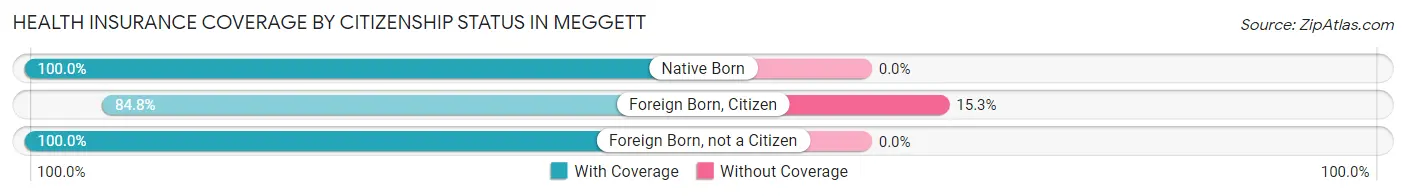
| Citizenship Status | With Coverage | Without Coverage |
| Native Born | 93 (100.0%) | 0 (0.0%) |
| Foreign Born, Citizen | 150 (84.8%) | 27 (15.2%) |
| Foreign Born, not a Citizen | 50 (100.0%) | 0 (0.0%) |
Health Insurance Coverage by Household Income in Meggett
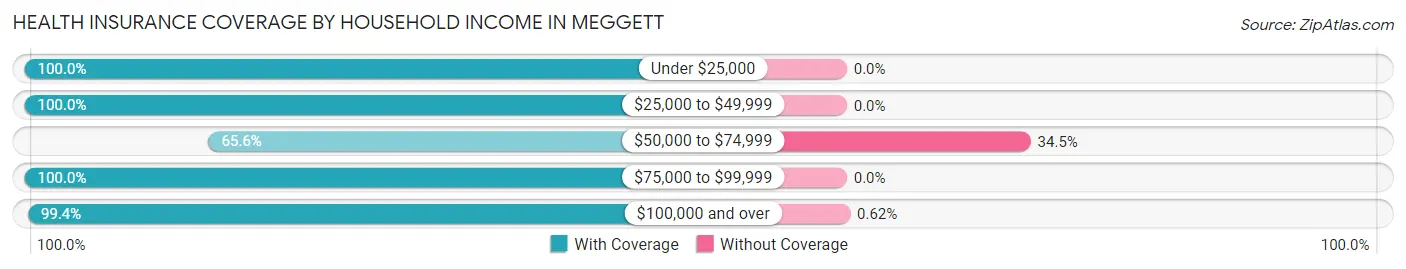
| Household Income | With Coverage | Without Coverage |
| Under $25,000 | 127 (100.0%) | 0 (0.0%) |
| $25,000 to $49,999 | 78 (100.0%) | 0 (0.0%) |
| $50,000 to $74,999 | 78 (65.5%) | 41 (34.4%) |
| $75,000 to $99,999 | 379 (100.0%) | 0 (0.0%) |
| $100,000 and over | 641 (99.4%) | 4 (0.6%) |
Public vs Private Health Insurance Coverage by Age in Meggett
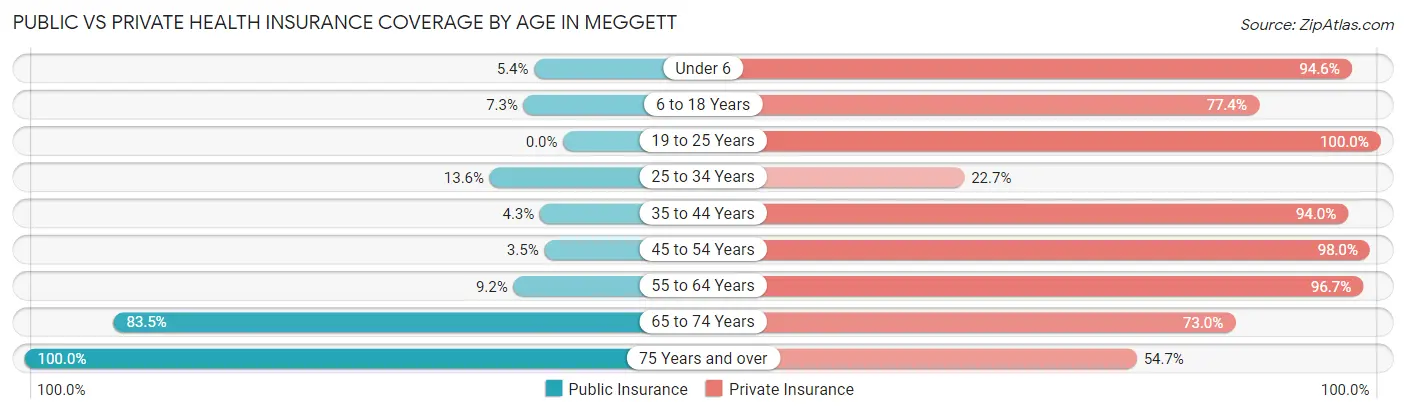
| Age Bracket | Public Insurance | Private Insurance |
| Under 6 | 5 (5.4%) | 88 (94.6%) |
| 6 to 18 Years | 13 (7.3%) | 137 (77.4%) |
| 19 to 25 Years | 0 (0.0%) | 50 (100.0%) |
| 25 to 34 Years | 3 (13.6%) | 5 (22.7%) |
| 35 to 44 Years | 10 (4.3%) | 218 (94.0%) |
| 45 to 54 Years | 7 (3.5%) | 196 (98.0%) |
| 55 to 64 Years | 17 (9.2%) | 178 (96.7%) |
| 65 to 74 Years | 167 (83.5%) | 146 (73.0%) |
| 75 Years and over | 190 (100.0%) | 104 (54.7%) |
| Total | 412 (30.6%) | 1,122 (83.2%) |
Disability Status by Sex by Age in Meggett
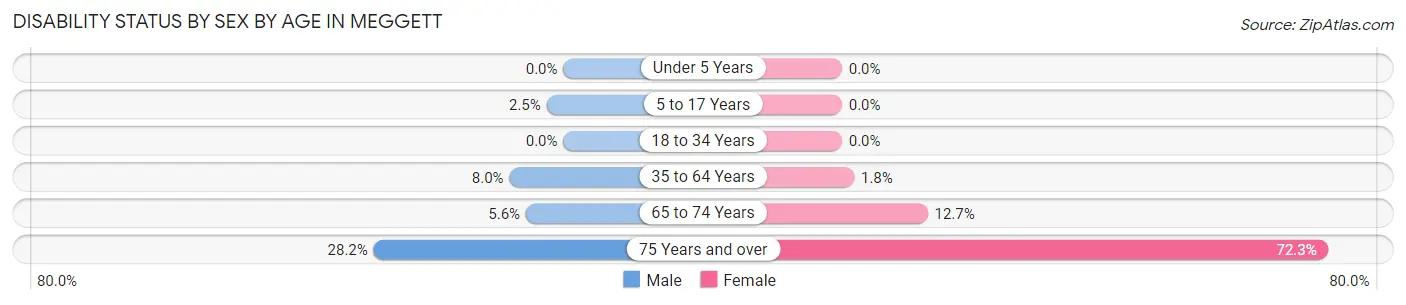
| Age Bracket | Male | Female |
| Under 5 Years | 0 (0.0%) | 0 (0.0%) |
| 5 to 17 Years | 3 (2.5%) | 0 (0.0%) |
| 18 to 34 Years | 0 (0.0%) | 0 (0.0%) |
| 35 to 64 Years | 23 (8.0%) | 6 (1.8%) |
| 65 to 74 Years | 5 (5.6%) | 14 (12.7%) |
| 75 Years and over | 20 (28.2%) | 86 (72.3%) |
Disability Class by Sex by Age in Meggett
Disability Class: Hearing Difficulty
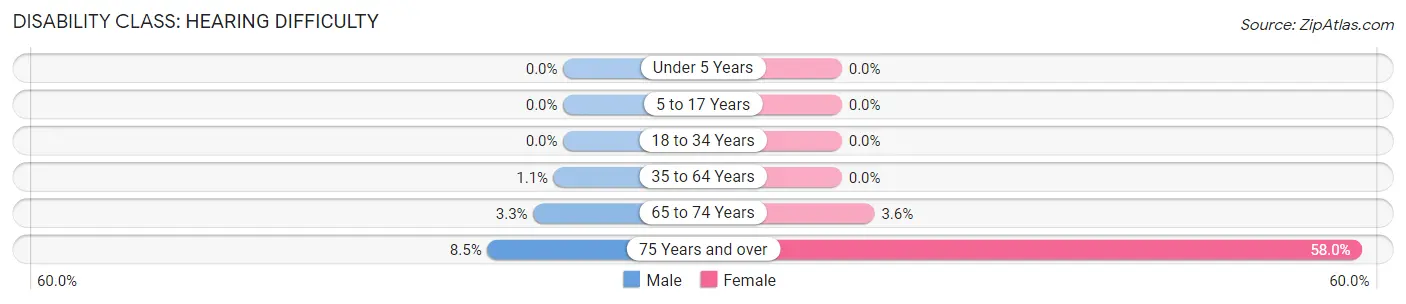
| Age Bracket | Male | Female |
| Under 5 Years | 0 (0.0%) | 0 (0.0%) |
| 5 to 17 Years | 0 (0.0%) | 0 (0.0%) |
| 18 to 34 Years | 0 (0.0%) | 0 (0.0%) |
| 35 to 64 Years | 3 (1.1%) | 0 (0.0%) |
| 65 to 74 Years | 3 (3.3%) | 4 (3.6%) |
| 75 Years and over | 6 (8.5%) | 69 (58.0%) |
Disability Class: Vision Difficulty
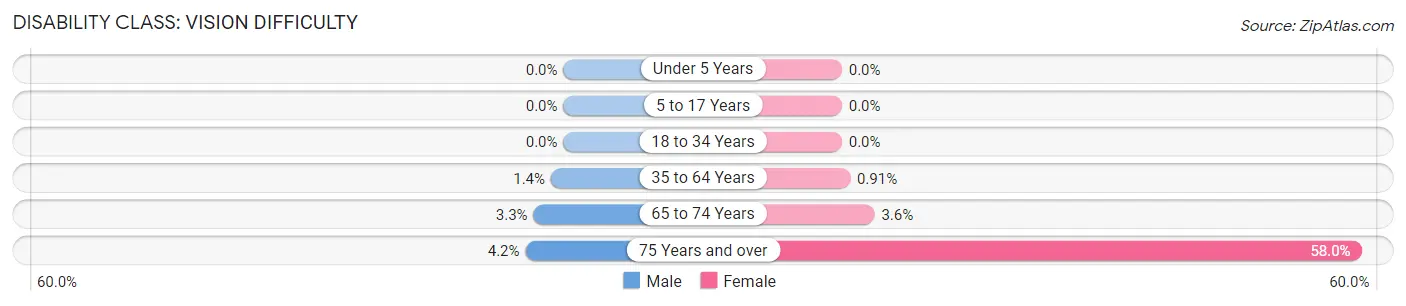
| Age Bracket | Male | Female |
| Under 5 Years | 0 (0.0%) | 0 (0.0%) |
| 5 to 17 Years | 0 (0.0%) | 0 (0.0%) |
| 18 to 34 Years | 0 (0.0%) | 0 (0.0%) |
| 35 to 64 Years | 4 (1.4%) | 3 (0.9%) |
| 65 to 74 Years | 3 (3.3%) | 4 (3.6%) |
| 75 Years and over | 3 (4.2%) | 69 (58.0%) |
Disability Class: Cognitive Difficulty
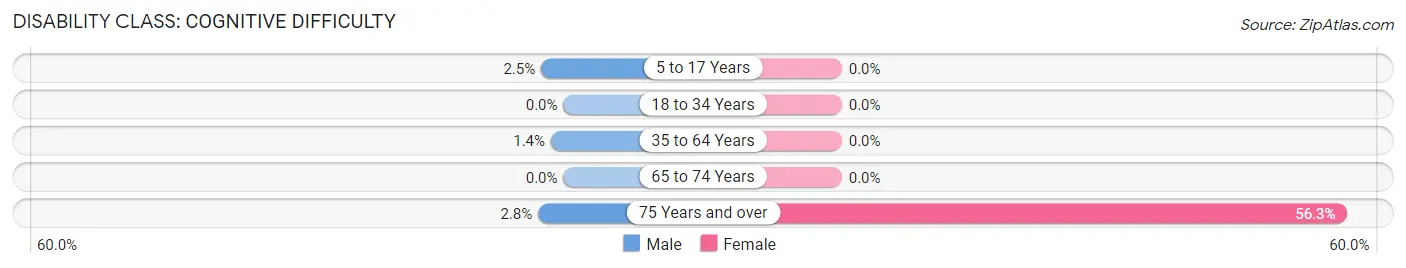
| Age Bracket | Male | Female |
| 5 to 17 Years | 3 (2.5%) | 0 (0.0%) |
| 18 to 34 Years | 0 (0.0%) | 0 (0.0%) |
| 35 to 64 Years | 4 (1.4%) | 0 (0.0%) |
| 65 to 74 Years | 0 (0.0%) | 0 (0.0%) |
| 75 Years and over | 2 (2.8%) | 67 (56.3%) |
Disability Class: Ambulatory Difficulty
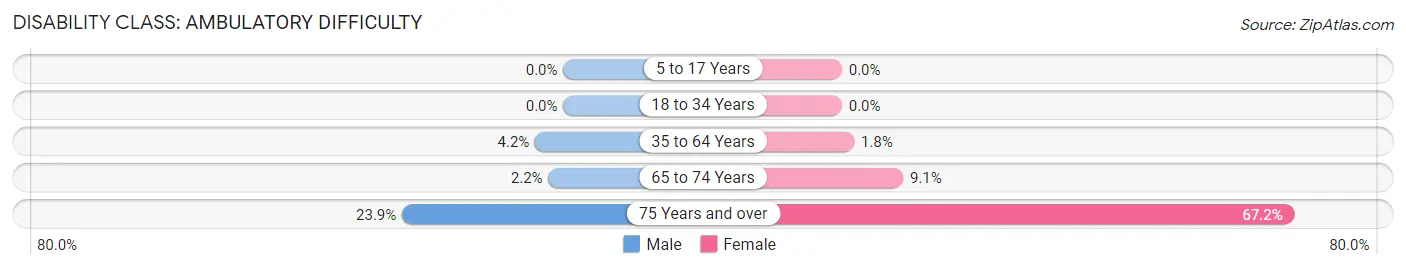
| Age Bracket | Male | Female |
| 5 to 17 Years | 0 (0.0%) | 0 (0.0%) |
| 18 to 34 Years | 0 (0.0%) | 0 (0.0%) |
| 35 to 64 Years | 12 (4.2%) | 6 (1.8%) |
| 65 to 74 Years | 2 (2.2%) | 10 (9.1%) |
| 75 Years and over | 17 (23.9%) | 80 (67.2%) |
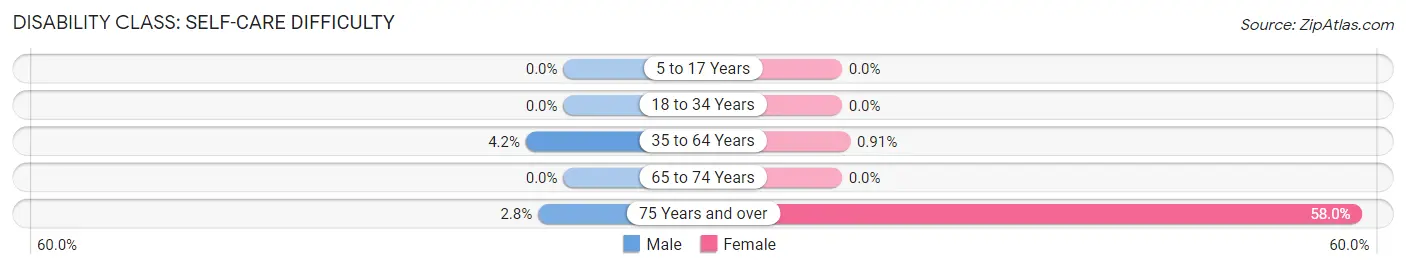
Disability Class: Self-Care Difficulty
| Age Bracket | Male | Female |
| 5 to 17 Years | 0 (0.0%) | 0 (0.0%) |
| 18 to 34 Years | 0 (0.0%) | 0 (0.0%) |
| 35 to 64 Years | 12 (4.2%) | 3 (0.9%) |
| 65 to 74 Years | 0 (0.0%) | 0 (0.0%) |
| 75 Years and over | 2 (2.8%) | 69 (58.0%) |
Technology Access in Meggett
Computing Device Access in Meggett
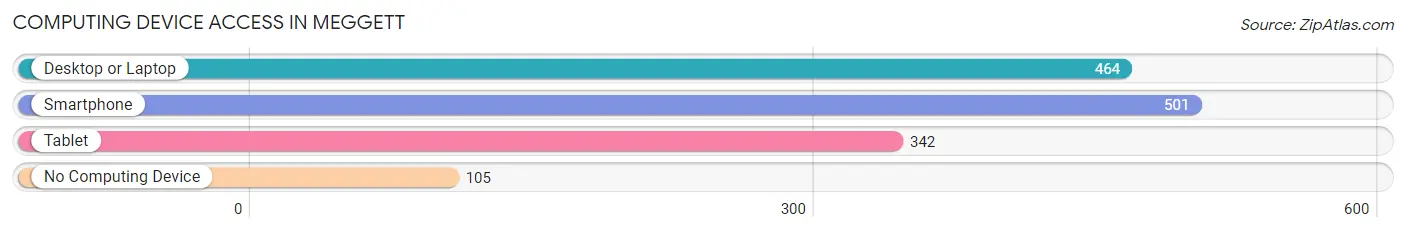
| Device Type | # Households | % Households |
| Desktop or Laptop | 464 | 74.7% |
| Smartphone | 501 | 80.7% |
| Tablet | 342 | 55.1% |
| No Computing Device | 105 | 16.9% |
| Total | 621 | 100.0% |
Internet Access in Meggett
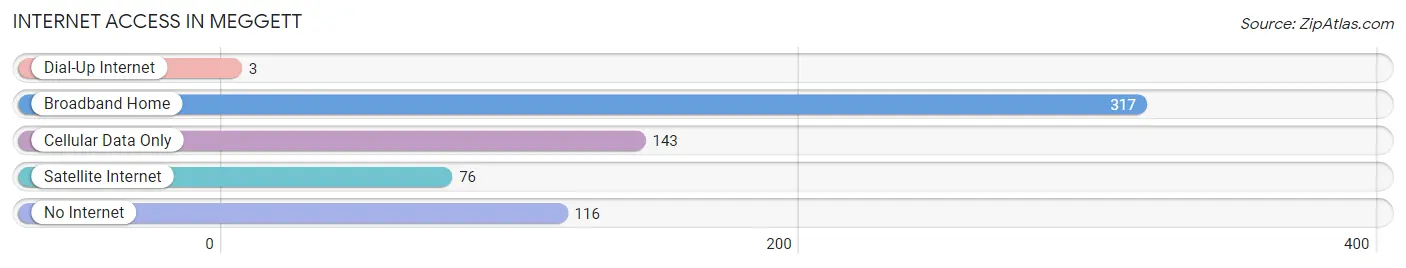
| Internet Type | # Households | % Households |
| Dial-Up Internet | 3 | 0.5% |
| Broadband Home | 317 | 51.0% |
| Cellular Data Only | 143 | 23.0% |
| Satellite Internet | 76 | 12.2% |
| No Internet | 116 | 18.7% |
| Total | 621 | 100.0% |
Meggett Summary
Meggett is a small unincorporated community located in Charleston County, South Carolina. It is situated along the banks of the North Edisto River, approximately 25 miles south of Charleston. The community is home to a population of approximately 1,000 people, and is known for its rural charm and close-knit community.
History
Meggett was first settled in the late 1700s by a group of French Huguenots who had fled religious persecution in their native France. The community was named after the Meggett family, who were among the first settlers. The Meggetts were prominent landowners in the area, and their descendants still live in the community today.
In the early 1800s, Meggett was a thriving agricultural community, with cotton, rice, and indigo being the primary crops. The community also had a thriving timber industry, with the North Edisto River providing access to the port of Charleston.
In the late 1800s, Meggett began to experience a decline in its agricultural industry. This was due to the introduction of new farming techniques and the development of new markets in the North. As a result, many of the residents of Meggett began to look for other sources of income.
In the early 1900s, Meggett began to experience a resurgence in its economy. This was due to the development of the nearby Santee Cooper hydroelectric plant, which provided jobs for many of the residents. The community also experienced a boom in its tourism industry, as the nearby beaches and waterways became popular destinations for vacationers.
Geography
Meggett is located in the Lowcountry region of South Carolina, approximately 25 miles south of Charleston. The community is situated along the banks of the North Edisto River, and is surrounded by a number of small creeks and marshes. The area is characterized by its flat terrain and sandy soil, which is ideal for growing crops such as cotton, rice, and indigo.
Economy
Meggett’s economy is largely based on agriculture and tourism. The community is home to a number of small farms, which produce a variety of crops such as cotton, rice, and indigo. The nearby Santee Cooper hydroelectric plant also provides jobs for many of the residents.
In addition, Meggett is a popular destination for tourists, due to its close proximity to the beaches and waterways of the Lowcountry. The community is home to a number of bed and breakfasts, as well as a number of restaurants and shops.
Demographics
As of the 2010 census, Meggett had a population of 1,000 people. The racial makeup of the community was 94.2% White, 3.2% African American, 0.7% Native American, 0.3% Asian, and 1.6% from other races. The median household income was $37,500, and the median age was 44.
Meggett is a close-knit community, with a strong sense of community pride. The residents of Meggett are proud of their rural heritage, and are committed to preserving the unique character of the community.
Common Questions
What is the Total Population of Meggett?
Total Population of Meggett is 1,348.
What is the Total Male Population of Meggett?
Total Male Population of Meggett is 652.
What is the Total Female Population of Meggett?
Total Female Population of Meggett is 696.
What is the Ratio of Males per 100 Females in Meggett?
There are 93.68 Males per 100 Females in Meggett.
What is the Ratio of Females per 100 Males in Meggett?
There are 106.75 Females per 100 Males in Meggett.
What is the Median Population Age in Meggett?
Median Population Age in Meggett is 49.9 Years.
What is the Average Family Size in Meggett
Average Family Size in Meggett is 2.8 People.
What is the Average Household Size in Meggett
Average Household Size in Meggett is 2.2 People.
What is Per Capita Income in Meggett?
Per Capita income in Meggett is $57,321.
What is the Median Family Income in Meggett?
Median Family Income in Meggett is $106,806.
What is the Median Household income in Meggett?
Median Household Income in Meggett is $91,472.
What is Income or Wage Gap in Meggett?
Income or Wage Gap in Meggett is 18.0%.
Women in Meggett earn 82.0 cents for every dollar earned by a man.
What is Family Income Deficit in Meggett?
Family Income Deficit in Meggett is $7,386.
Families that are below poverty line in Meggett earn $7,386 less on average than the poverty threshold level.
What is Inequality or Gini Index in Meggett?
Inequality or Gini Index in Meggett is 0.52.
How Large is the Labor Force in Meggett?
There are 704 People in the Labor Forcein in Meggett.
What is the Percentage of People in the Labor Force in Meggett?
64.5% of People are in the Labor Force in Meggett.
What is the Unemployment Rate in Meggett?
Unemployment Rate in Meggett is 0.9%.