Wilkinsburg borough, PA
Wilkinsburg borough Overview
14,340
TOTAL POPULATION
5,998
MALE POPULATION
8,342
FEMALE POPULATION
71.90
MALES / 100 FEMALES
139.08
FEMALES / 100 MALES
44.1
MEDIAN AGE
2.8
AVG FAMILY SIZE
1.8
AVG HOUSEHOLD SIZE
$35,482
PER CAPITA INCOME
$56,277
AVG FAMILY INCOME
$46,013
AVG HOUSEHOLD INCOME
18.3%
WAGE / INCOME GAP [ % ]
81.7¢/ $1
WAGE / INCOME GAP [ $ ]
0.48
INEQUALITY / GINI INDEX
7,404
LABOR FORCE [ PEOPLE ]
59.9%
PERCENT IN LABOR FORCE
8.5%
UNEMPLOYMENT RATE
Race in Wilkinsburg borough
The most populous races in Wilkinsburg borough are Black / African American (7,095 | 49.5%), White / Caucasian (5,492 | 38.3%), and Two or more Races (1,306 | 9.1%).
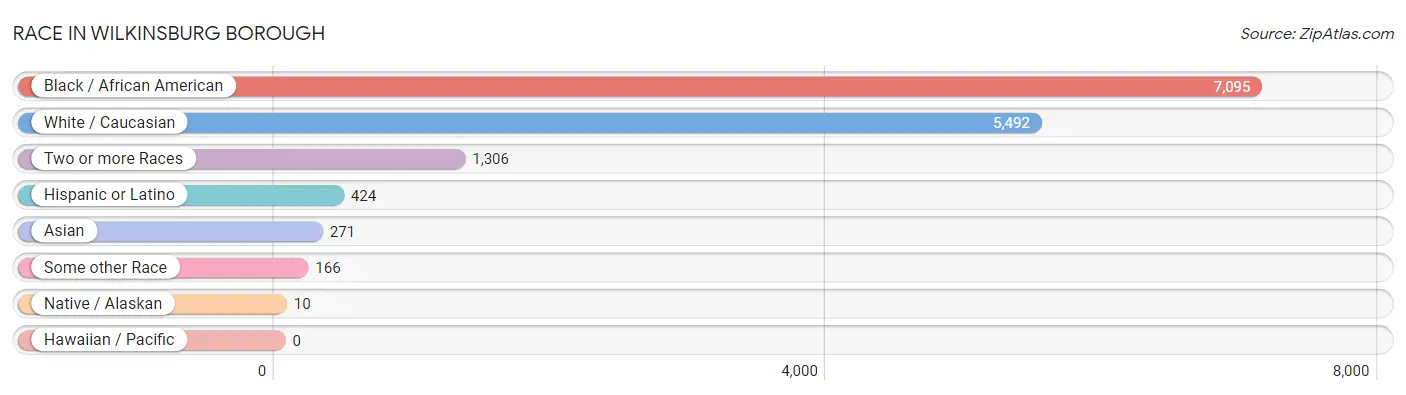
| Race | # Population | % Population |
| Asian | 271 | 1.9% |
| Black / African American | 7,095 | 49.5% |
| Hawaiian / Pacific | 0 | 0.0% |
| Hispanic or Latino | 424 | 3.0% |
| Native / Alaskan | 10 | 0.1% |
| White / Caucasian | 5,492 | 38.3% |
| Two or more Races | 1,306 | 9.1% |
| Some other Race | 166 | 1.2% |
| Total | 14,340 | 100.0% |
Ancestry in Wilkinsburg borough
The most populous ancestries reported in Wilkinsburg borough are German (1,442 | 10.1%), Irish (1,306 | 9.1%), English (833 | 5.8%), Italian (701 | 4.9%), and Polish (471 | 3.3%), together accounting for 33.1% of all Wilkinsburg borough residents.
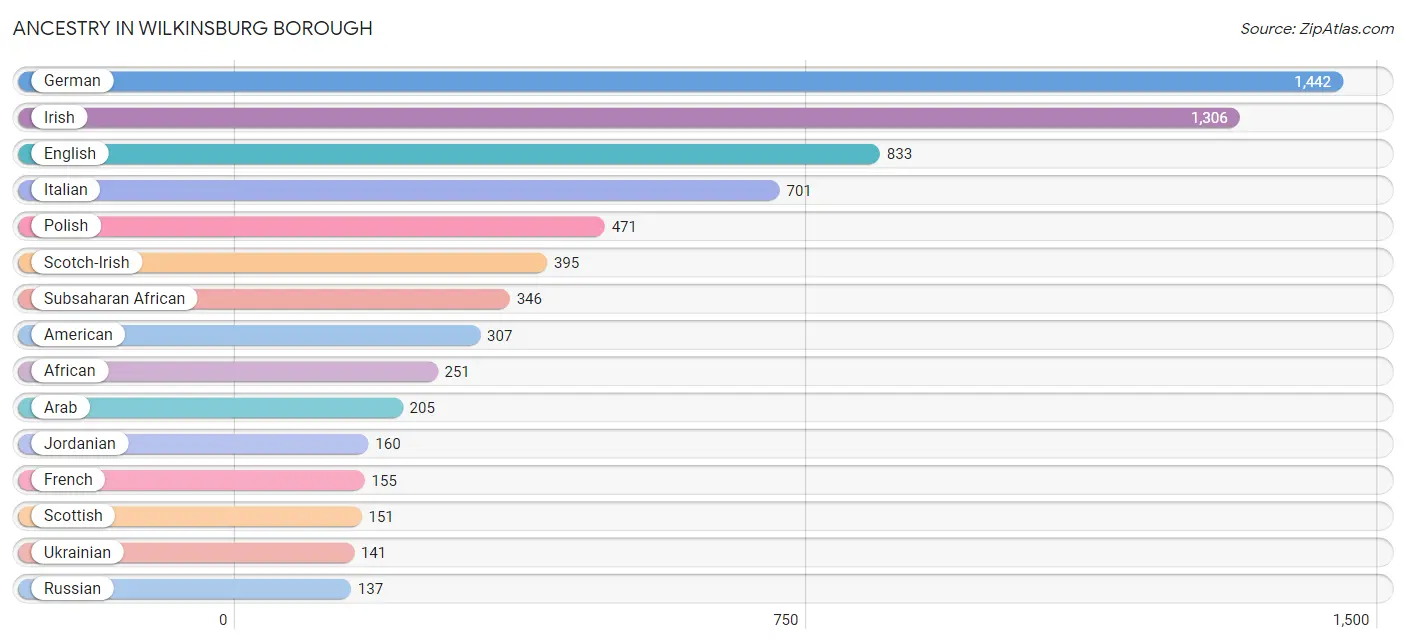
| Ancestry | # Population | % Population |
| African | 251 | 1.8% |
| American | 307 | 2.1% |
| Arab | 205 | 1.4% |
| Austrian | 30 | 0.2% |
| Belgian | 8 | 0.1% |
| Bhutanese | 17 | 0.1% |
| Blackfeet | 62 | 0.4% |
| British | 14 | 0.1% |
| Burmese | 126 | 0.9% |
| Cape Verdean | 9 | 0.1% |
| Carpatho Rusyn | 15 | 0.1% |
| Celtic | 8 | 0.1% |
| Central American | 21 | 0.2% |
| Cherokee | 71 | 0.5% |
| Chickasaw | 10 | 0.1% |
| Colombian | 39 | 0.3% |
| Creek | 30 | 0.2% |
| Croatian | 32 | 0.2% |
| Czech | 12 | 0.1% |
| Dutch | 11 | 0.1% |
| Eastern European | 51 | 0.4% |
| English | 833 | 5.8% |
| European | 132 | 0.9% |
| Filipino | 15 | 0.1% |
| Finnish | 6 | 0.0% |
| French | 155 | 1.1% |
| French Canadian | 6 | 0.0% |
| German | 1,442 | 10.1% |
| Greek | 7 | 0.1% |
| Guyanese | 69 | 0.5% |
| Haitian | 7 | 0.1% |
| Hungarian | 74 | 0.5% |
| Indian (Asian) | 97 | 0.7% |
| Iranian | 34 | 0.2% |
| Irish | 1,306 | 9.1% |
| Israeli | 87 | 0.6% |
| Italian | 701 | 4.9% |
| Jamaican | 27 | 0.2% |
| Jordanian | 160 | 1.1% |
| Korean | 21 | 0.2% |
| Latvian | 6 | 0.0% |
| Lebanese | 26 | 0.2% |
| Lithuanian | 19 | 0.1% |
| Mexican | 112 | 0.8% |
| Moroccan | 19 | 0.1% |
| Nicaraguan | 9 | 0.1% |
| Nigerian | 70 | 0.5% |
| Norwegian | 43 | 0.3% |
| Paraguayan | 6 | 0.0% |
| Pennsylvania German | 58 | 0.4% |
| Peruvian | 5 | 0.0% |
| Polish | 471 | 3.3% |
| Portuguese | 18 | 0.1% |
| Puerto Rican | 132 | 0.9% |
| Romanian | 4 | 0.0% |
| Russian | 137 | 1.0% |
| Salvadoran | 12 | 0.1% |
| Scotch-Irish | 395 | 2.8% |
| Scottish | 151 | 1.1% |
| Seminole | 78 | 0.5% |
| Serbian | 8 | 0.1% |
| Slavic | 33 | 0.2% |
| Slovak | 54 | 0.4% |
| Slovene | 8 | 0.1% |
| South American | 50 | 0.4% |
| Spanish | 18 | 0.1% |
| Subsaharan African | 346 | 2.4% |
| Sudanese | 7 | 0.1% |
| Swedish | 92 | 0.6% |
| Swiss | 12 | 0.1% |
| Thai | 54 | 0.4% |
| Ukrainian | 141 | 1.0% |
| Welsh | 122 | 0.9% |
| West Indian | 29 | 0.2% | View All 74 Rows |
Immigrants in Wilkinsburg borough
The most numerous immigrant groups reported in Wilkinsburg borough came from Asia (256 | 1.8%), Eastern Asia (189 | 1.3%), Latin America (139 | 1.0%), China (102 | 0.7%), and Europe (98 | 0.7%), together accounting for 5.5% of all Wilkinsburg borough residents.
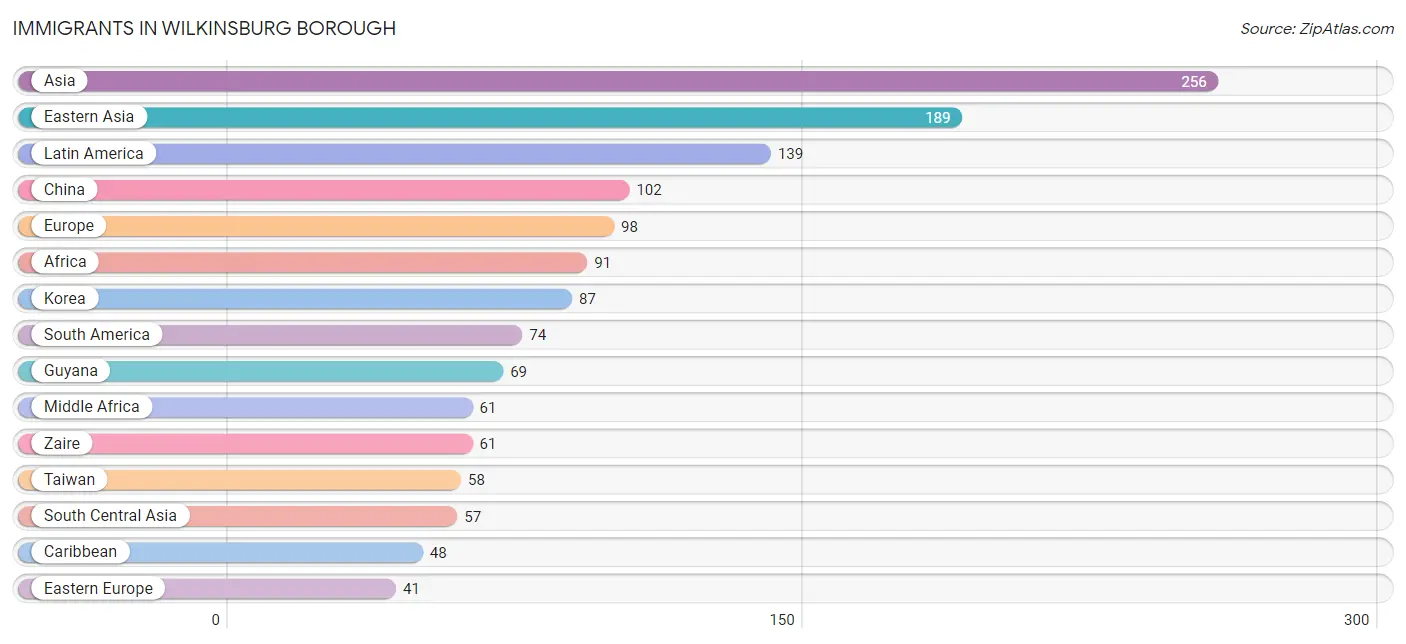
| Immigration Origin | # Population | % Population |
| Africa | 91 | 0.6% |
| Asia | 256 | 1.8% |
| Canada | 4 | 0.0% |
| Caribbean | 48 | 0.3% |
| Central America | 17 | 0.1% |
| China | 102 | 0.7% |
| Eastern Asia | 189 | 1.3% |
| Eastern Europe | 41 | 0.3% |
| El Salvador | 12 | 0.1% |
| Europe | 98 | 0.7% |
| Germany | 38 | 0.3% |
| Guyana | 69 | 0.5% |
| India | 29 | 0.2% |
| Iran | 22 | 0.2% |
| Ireland | 10 | 0.1% |
| Jamaica | 19 | 0.1% |
| Korea | 87 | 0.6% |
| Latin America | 139 | 1.0% |
| Mexico | 5 | 0.0% |
| Middle Africa | 61 | 0.4% |
| Nigeria | 30 | 0.2% |
| Northern Europe | 19 | 0.1% |
| Pakistan | 6 | 0.0% |
| Peru | 5 | 0.0% |
| Poland | 1 | 0.0% |
| Russia | 14 | 0.1% |
| South America | 74 | 0.5% |
| South Central Asia | 57 | 0.4% |
| Sweden | 9 | 0.1% |
| Taiwan | 58 | 0.4% |
| Ukraine | 26 | 0.2% |
| Western Africa | 30 | 0.2% |
| Western Asia | 10 | 0.1% |
| Western Europe | 38 | 0.3% |
| Zaire | 61 | 0.4% | View All 35 Rows |
Sex and Age in Wilkinsburg borough
Sex and Age in Wilkinsburg borough
The most populous age groups in Wilkinsburg borough are 30 to 34 Years (820 | 13.7%) for men and 65 to 69 Years (759 | 9.1%) for women.
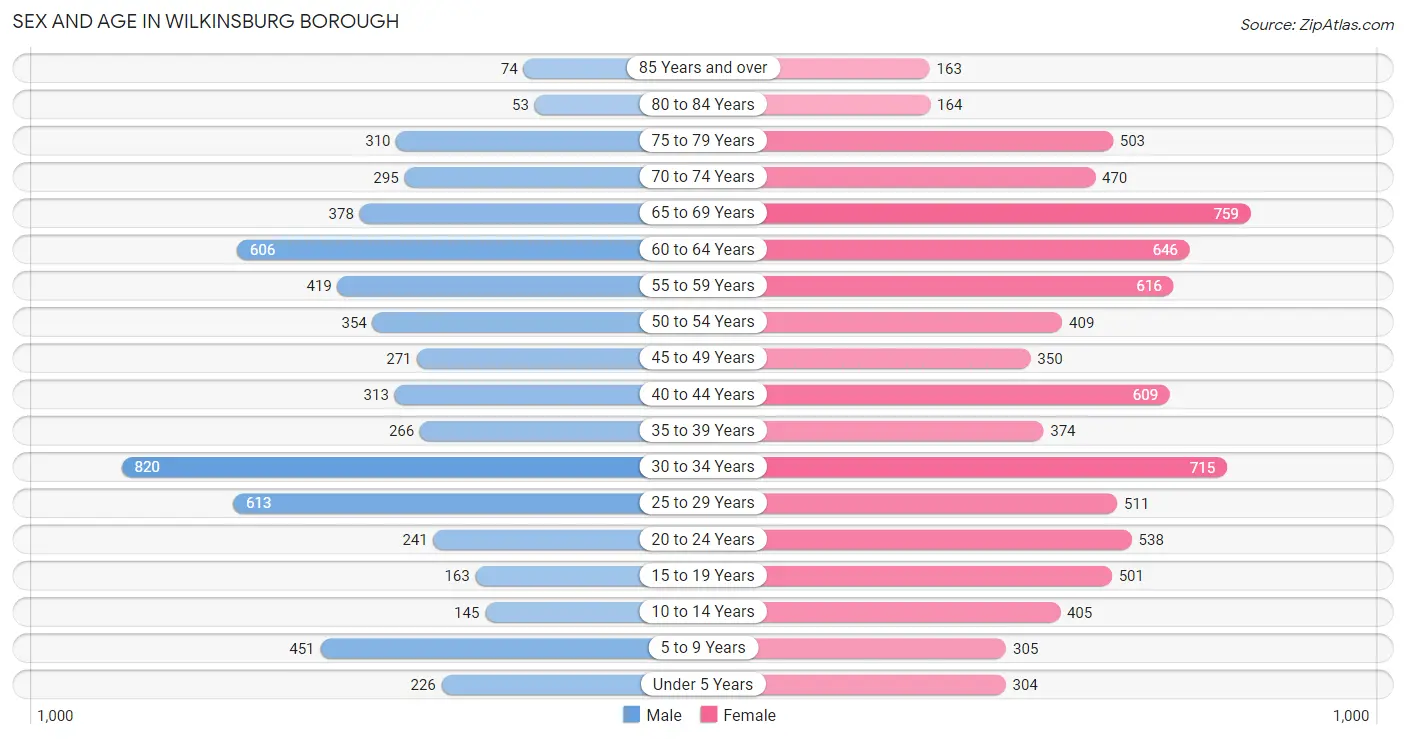
| Age Bracket | Male | Female |
| Under 5 Years | 226 (3.8%) | 304 (3.6%) |
| 5 to 9 Years | 451 (7.5%) | 305 (3.7%) |
| 10 to 14 Years | 145 (2.4%) | 405 (4.9%) |
| 15 to 19 Years | 163 (2.7%) | 501 (6.0%) |
| 20 to 24 Years | 241 (4.0%) | 538 (6.5%) |
| 25 to 29 Years | 613 (10.2%) | 511 (6.1%) |
| 30 to 34 Years | 820 (13.7%) | 715 (8.6%) |
| 35 to 39 Years | 266 (4.4%) | 374 (4.5%) |
| 40 to 44 Years | 313 (5.2%) | 609 (7.3%) |
| 45 to 49 Years | 271 (4.5%) | 350 (4.2%) |
| 50 to 54 Years | 354 (5.9%) | 409 (4.9%) |
| 55 to 59 Years | 419 (7.0%) | 616 (7.4%) |
| 60 to 64 Years | 606 (10.1%) | 646 (7.7%) |
| 65 to 69 Years | 378 (6.3%) | 759 (9.1%) |
| 70 to 74 Years | 295 (4.9%) | 470 (5.6%) |
| 75 to 79 Years | 310 (5.2%) | 503 (6.0%) |
| 80 to 84 Years | 53 (0.9%) | 164 (2.0%) |
| 85 Years and over | 74 (1.2%) | 163 (1.9%) |
| Total | 5,998 (100.0%) | 8,342 (100.0%) |
Families and Households in Wilkinsburg borough
Median Family Size in Wilkinsburg borough
The median family size in Wilkinsburg borough is 2.78 persons per family, with single male/father families (141 | 5.0%) accounting for the largest median family size of 3.33 persons per family. On the other hand, married-couple families (1,300 | 45.8%) represent the smallest median family size with 2.52 persons per family.
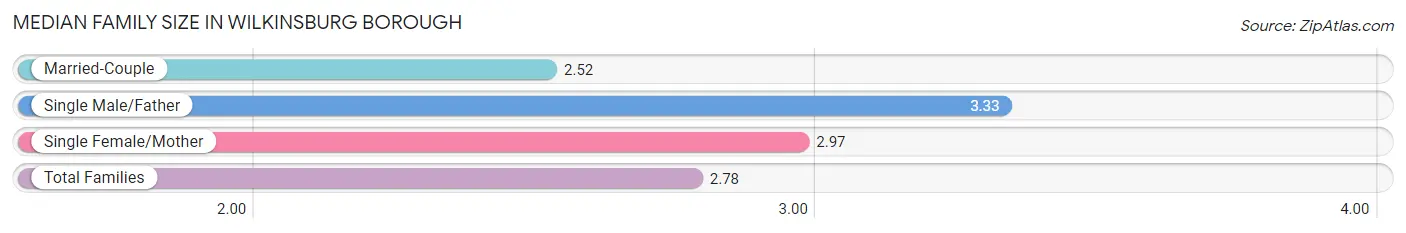
| Family Type | # Families | Family Size |
| Married-Couple | 1,300 (45.8%) | 2.52 |
| Single Male/Father | 141 (5.0%) | 3.33 |
| Single Female/Mother | 1,399 (49.3%) | 2.97 |
| Total Families | 2,840 (100.0%) | 2.78 |
Median Household Size in Wilkinsburg borough
The median household size in Wilkinsburg borough is 1.79 persons per household, with single male/father households (141 | 1.8%) accounting for the largest median household size of 3.72 persons per household. non-family households (5,067 | 64.1%) represent the smallest median household size with 1.20 persons per household.
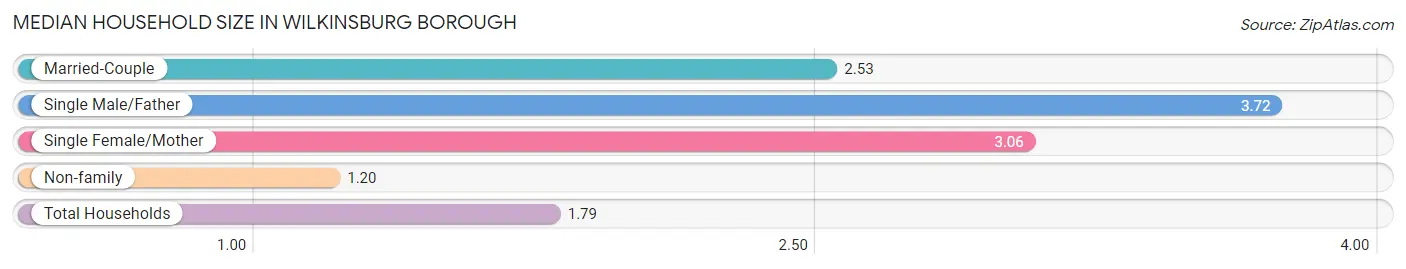
| Household Type | # Households | Household Size |
| Married-Couple | 1,300 (16.4%) | 2.53 |
| Single Male/Father | 141 (1.8%) | 3.72 |
| Single Female/Mother | 1,399 (17.7%) | 3.06 |
| Non-family | 5,067 (64.1%) | 1.20 |
| Total Households | 7,907 (100.0%) | 1.79 |
Household Size by Marriage Status in Wilkinsburg borough
Out of a total of 7,907 households in Wilkinsburg borough, 2,840 (35.9%) are family households, while 5,067 (64.1%) are nonfamily households. The most numerous type of family households are 2-person households, comprising 1,847, and the most common type of nonfamily households are 1-person households, comprising 4,212.
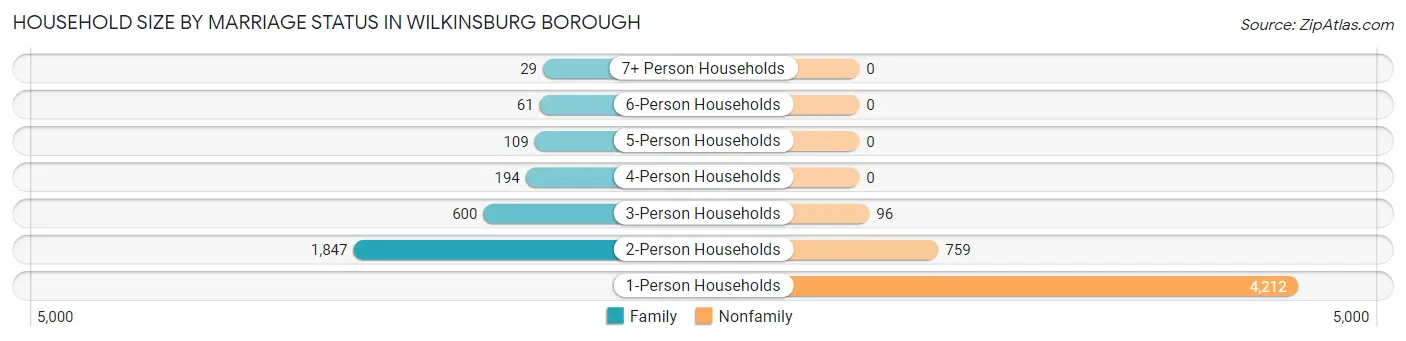
| Household Size | Family Households | Nonfamily Households |
| 1-Person Households | - | 4,212 (53.3%) |
| 2-Person Households | 1,847 (23.4%) | 759 (9.6%) |
| 3-Person Households | 600 (7.6%) | 96 (1.2%) |
| 4-Person Households | 194 (2.5%) | 0 (0.0%) |
| 5-Person Households | 109 (1.4%) | 0 (0.0%) |
| 6-Person Households | 61 (0.8%) | 0 (0.0%) |
| 7+ Person Households | 29 (0.4%) | 0 (0.0%) |
| Total | 2,840 (35.9%) | 5,067 (64.1%) |
Female Fertility in Wilkinsburg borough
Fertility by Age in Wilkinsburg borough
Average fertility rate in Wilkinsburg borough is 72.0 births per 1,000 women. Women in the age bracket of 20 to 34 years have the highest fertility rate with 126.0 births per 1,000 women. Women in the age bracket of 20 to 34 years acount for 85.8% of all women with births.
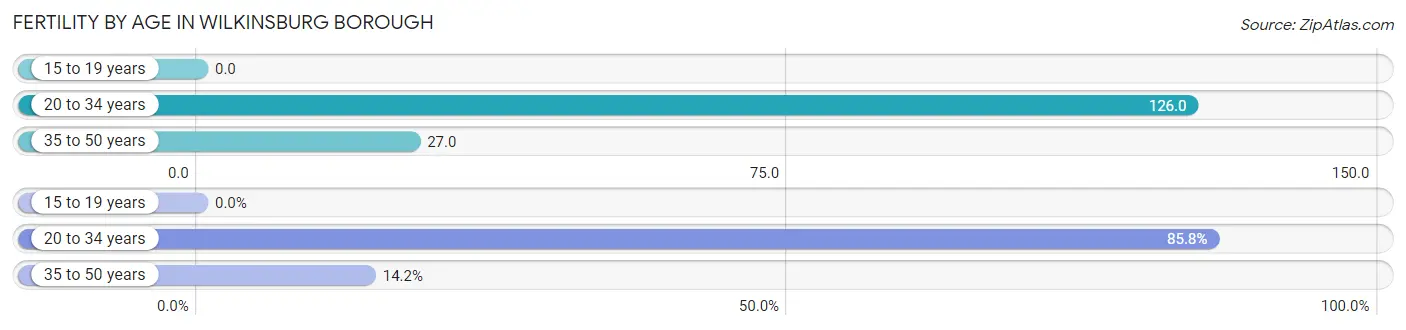
| Age Bracket | Women with Births | Births / 1,000 Women |
| 15 to 19 years | 0 (0.0%) | 0.0 |
| 20 to 34 years | 223 (85.8%) | 126.0 |
| 35 to 50 years | 37 (14.2%) | 27.0 |
| Total | 260 (100.0%) | 72.0 |
Fertility by Age by Marriage Status in Wilkinsburg borough
40.8% of women with births (260) in Wilkinsburg borough are married. The highest percentage of unmarried women with births falls into 20 to 34 years age bracket with 69.1% of them unmarried at the time of birth, while the lowest percentage of unmarried women with births belong to 35 to 50 years age bracket with 0.0% of them unmarried.
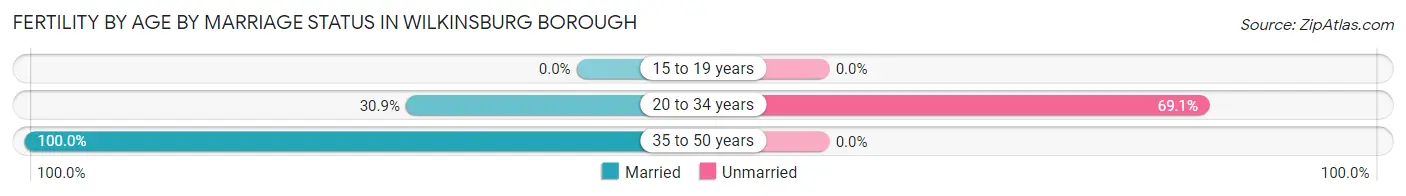
| Age Bracket | Married | Unmarried |
| 15 to 19 years | 0 (0.0%) | 0 (0.0%) |
| 20 to 34 years | 69 (30.9%) | 154 (69.1%) |
| 35 to 50 years | 37 (100.0%) | 0 (0.0%) |
| Total | 106 (40.8%) | 154 (59.2%) |
Fertility by Education in Wilkinsburg borough
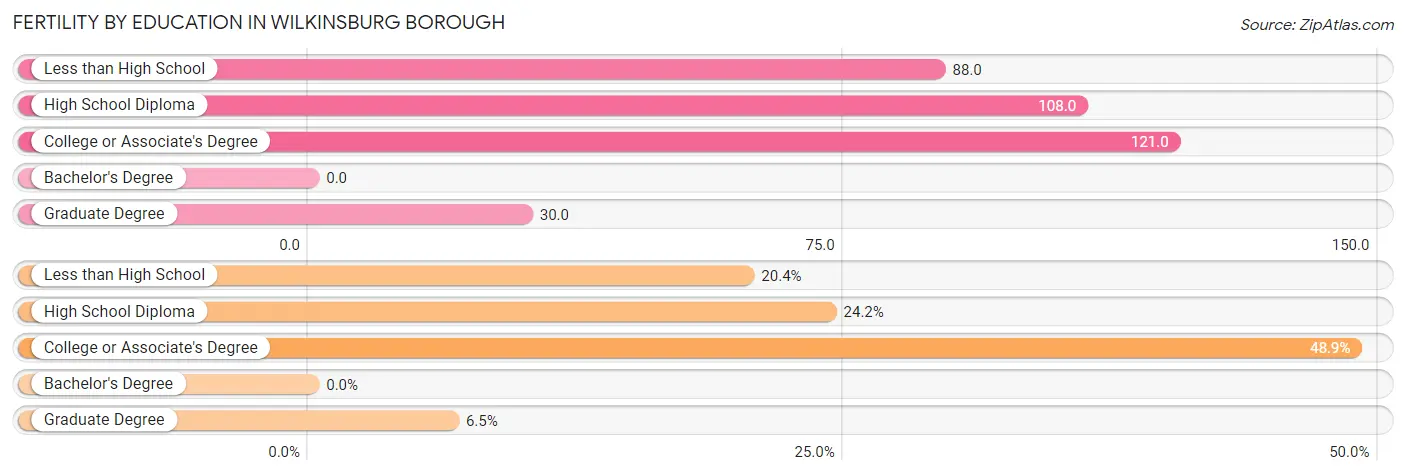
| Educational Attainment | Women with Births | Births / 1,000 Women |
| Less than High School | 53 (20.4%) | 88.0 |
| High School Diploma | 63 (24.2%) | 108.0 |
| College or Associate's Degree | 127 (48.8%) | 121.0 |
| Bachelor's Degree | 0 (0.0%) | 0.0 |
| Graduate Degree | 17 (6.5%) | 30.0 |
| Total | 260 (100.0%) | 72.0 |
Fertility by Education by Marriage Status in Wilkinsburg borough
59.2% of women with births in Wilkinsburg borough are unmarried. Women with the educational attainment of graduate degree are most likely to be married with 100.0% of them married at childbirth, while women with the educational attainment of less than high school are least likely to be married with 69.8% of them unmarried at childbirth.
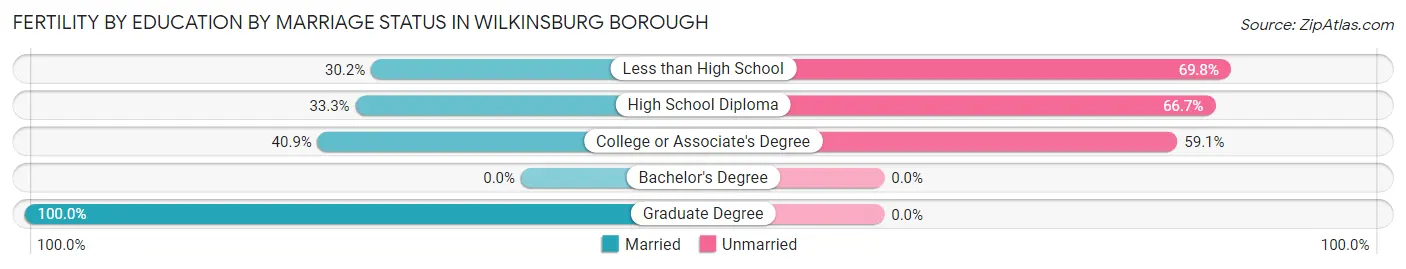
| Educational Attainment | Married | Unmarried |
| Less than High School | 16 (30.2%) | 37 (69.8%) |
| High School Diploma | 21 (33.3%) | 42 (66.7%) |
| College or Associate's Degree | 52 (40.9%) | 75 (59.1%) |
| Bachelor's Degree | 0 (0.0%) | 0 (0.0%) |
| Graduate Degree | 17 (100.0%) | 0 (0.0%) |
| Total | 106 (40.8%) | 154 (59.2%) |
Income in Wilkinsburg borough
Income Overview in Wilkinsburg borough
Per Capita Income in Wilkinsburg borough is $35,482, while median incomes of families and households are $56,277 and $46,013 respectively.
| Characteristic | Number | Measure |
| Per Capita Income | 14,340 | $35,482 |
| Median Family Income | 2,840 | $56,277 |
| Mean Family Income | 2,840 | $80,161 |
| Median Household Income | 7,907 | $46,013 |
| Mean Household Income | 7,907 | $62,037 |
| Income Deficit | 2,840 | $0 |
| Wage / Income Gap (%) | 14,340 | 18.34% |
| Wage / Income Gap ($) | 14,340 | 81.66¢ per $1 |
| Gini / Inequality Index | 14,340 | 0.48 |
Earnings by Sex in Wilkinsburg borough
Average Earnings in Wilkinsburg borough are $37,212, $41,756 for men and $34,096 for women, a difference of 18.3%.
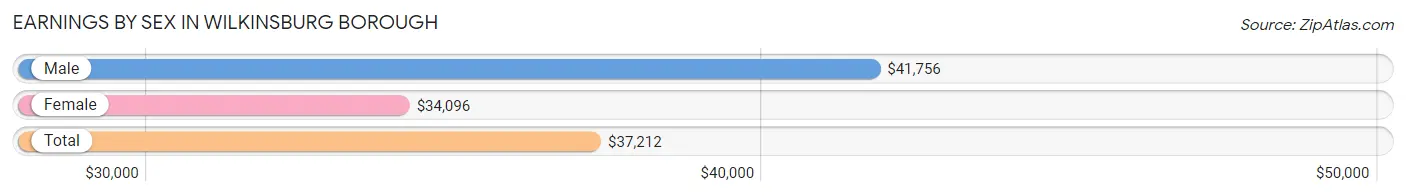
| Sex | Number | Average Earnings |
| Male | 3,453 (45.3%) | $41,756 |
| Female | 4,173 (54.7%) | $34,096 |
| Total | 7,626 (100.0%) | $37,212 |
Earnings by Sex by Income Bracket in Wilkinsburg borough
The most common earnings brackets in Wilkinsburg borough are $100,000+ for men (744 | 21.5%) and $55,000 to $64,999 for women (450 | 10.8%).
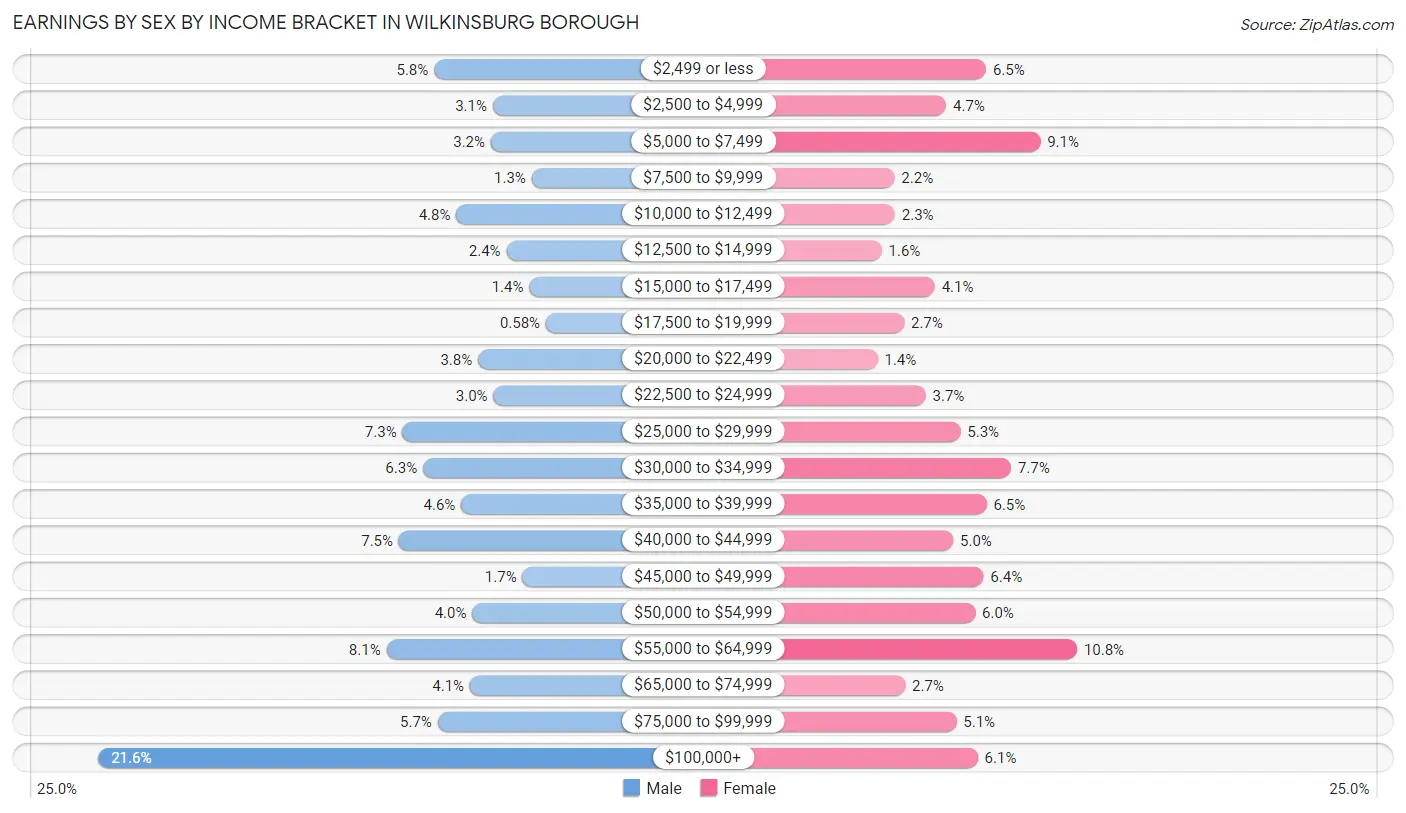
| Income | Male | Female |
| $2,499 or less | 201 (5.8%) | 272 (6.5%) |
| $2,500 to $4,999 | 106 (3.1%) | 194 (4.6%) |
| $5,000 to $7,499 | 109 (3.2%) | 378 (9.1%) |
| $7,500 to $9,999 | 43 (1.3%) | 93 (2.2%) |
| $10,000 to $12,499 | 165 (4.8%) | 94 (2.2%) |
| $12,500 to $14,999 | 84 (2.4%) | 68 (1.6%) |
| $15,000 to $17,499 | 47 (1.4%) | 172 (4.1%) |
| $17,500 to $19,999 | 20 (0.6%) | 112 (2.7%) |
| $20,000 to $22,499 | 130 (3.8%) | 60 (1.4%) |
| $22,500 to $24,999 | 105 (3.0%) | 154 (3.7%) |
| $25,000 to $29,999 | 252 (7.3%) | 222 (5.3%) |
| $30,000 to $34,999 | 219 (6.3%) | 321 (7.7%) |
| $35,000 to $39,999 | 157 (4.5%) | 273 (6.5%) |
| $40,000 to $44,999 | 258 (7.5%) | 208 (5.0%) |
| $45,000 to $49,999 | 58 (1.7%) | 267 (6.4%) |
| $50,000 to $54,999 | 139 (4.0%) | 251 (6.0%) |
| $55,000 to $64,999 | 278 (8.1%) | 450 (10.8%) |
| $65,000 to $74,999 | 143 (4.1%) | 114 (2.7%) |
| $75,000 to $99,999 | 195 (5.7%) | 214 (5.1%) |
| $100,000+ | 744 (21.5%) | 256 (6.1%) |
| Total | 3,453 (100.0%) | 4,173 (100.0%) |
Earnings by Sex by Educational Attainment in Wilkinsburg borough
Average earnings in Wilkinsburg borough are $43,873 for men and $38,460 for women, a difference of 12.3%. Men with an educational attainment of graduate degree enjoy the highest average annual earnings of $101,786, while those with high school diploma education earn the least with $33,958. Women with an educational attainment of graduate degree earn the most with the average annual earnings of $56,750, while those with high school diploma education have the smallest earnings of $30,089.
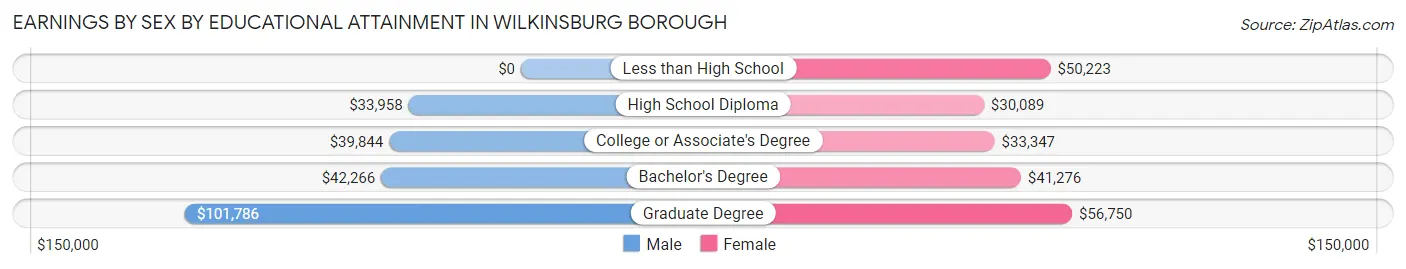
| Educational Attainment | Male Income | Female Income |
| Less than High School | - | - |
| High School Diploma | $33,958 | $30,089 |
| College or Associate's Degree | $39,844 | $33,347 |
| Bachelor's Degree | $42,266 | $41,276 |
| Graduate Degree | $101,786 | $56,750 |
| Total | $43,873 | $38,460 |
Family Income in Wilkinsburg borough
Family Income Brackets in Wilkinsburg borough
According to the Wilkinsburg borough family income data, there are 582 families falling into the $50,000 to $74,999 income range, which is the most common income bracket and makes up 20.5% of all families. Conversely, the $150,000 to $199,999 income bracket is the least frequent group with only 136 families (4.8%) belonging to this category.
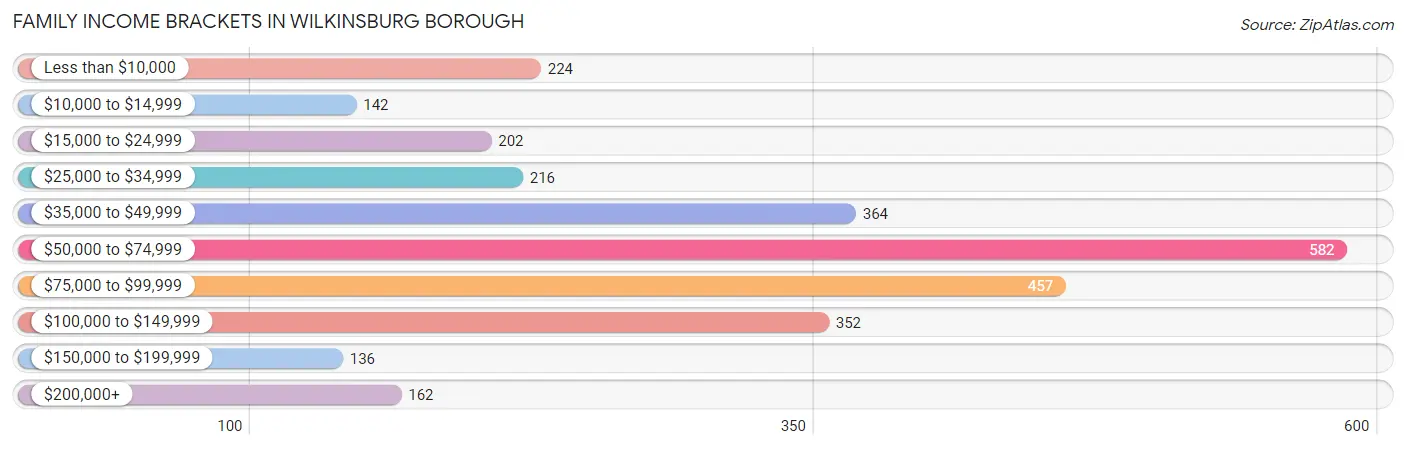
| Income Bracket | # Families | % Families |
| Less than $10,000 | 224 | 7.9% |
| $10,000 to $14,999 | 142 | 5.0% |
| $15,000 to $24,999 | 202 | 7.1% |
| $25,000 to $34,999 | 216 | 7.6% |
| $35,000 to $49,999 | 364 | 12.8% |
| $50,000 to $74,999 | 582 | 20.5% |
| $75,000 to $99,999 | 457 | 16.1% |
| $100,000 to $149,999 | 352 | 12.4% |
| $150,000 to $199,999 | 136 | 4.8% |
| $200,000+ | 162 | 5.7% |
Family Income by Famaliy Size in Wilkinsburg borough
3-person families (559 | 19.7%) account for the highest median family income in Wilkinsburg borough with $87,828 per family, while 3-person families (559 | 19.7%) have the highest median income of $29,276 per family member.
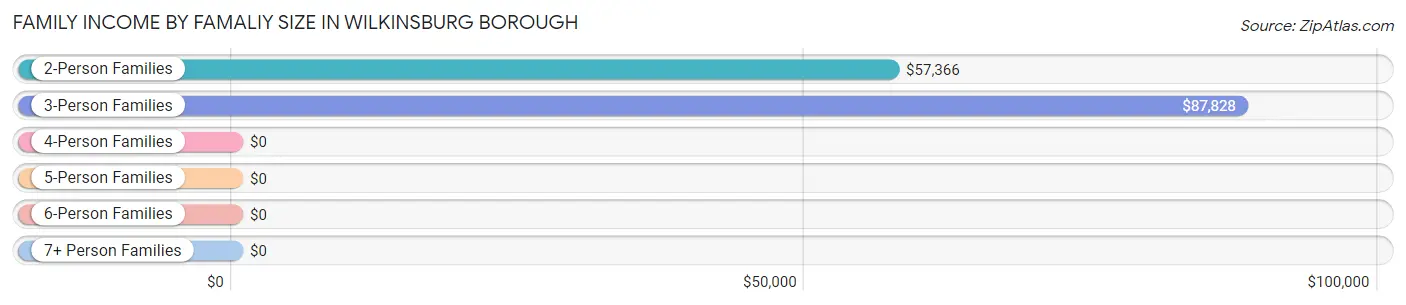
| Income Bracket | # Families | Median Income |
| 2-Person Families | 1,903 (67.0%) | $57,366 |
| 3-Person Families | 559 (19.7%) | $87,828 |
| 4-Person Families | 184 (6.5%) | $0 |
| 5-Person Families | 152 (5.3%) | $0 |
| 6-Person Families | 13 (0.5%) | $0 |
| 7+ Person Families | 29 (1.0%) | $0 |
| Total | 2,840 (100.0%) | $56,277 |
Family Income by Number of Earners in Wilkinsburg borough
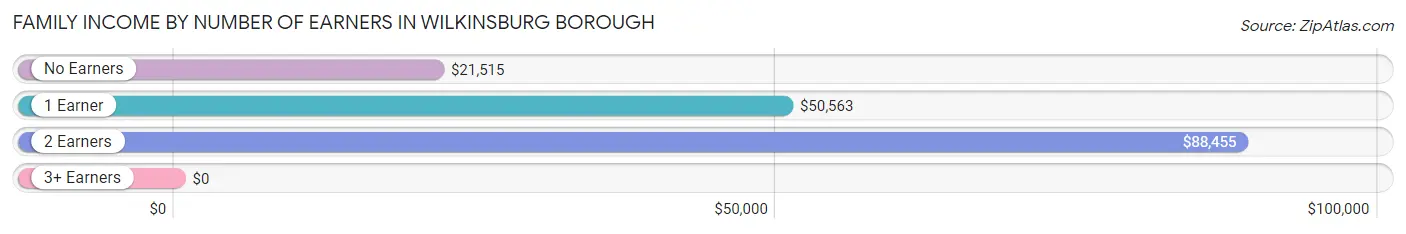
| Number of Earners | # Families | Median Income |
| No Earners | 462 (16.3%) | $21,515 |
| 1 Earner | 1,295 (45.6%) | $50,563 |
| 2 Earners | 1,049 (36.9%) | $88,455 |
| 3+ Earners | 34 (1.2%) | $0 |
| Total | 2,840 (100.0%) | $56,277 |
Household Income in Wilkinsburg borough
Household Income Brackets in Wilkinsburg borough
With 1,479 households falling in the category, the $50,000 to $74,999 income range is the most frequent in Wilkinsburg borough, accounting for 18.7% of all households. In contrast, only 229 households (2.9%) fall into the $200,000+ income bracket, making it the least populous group.
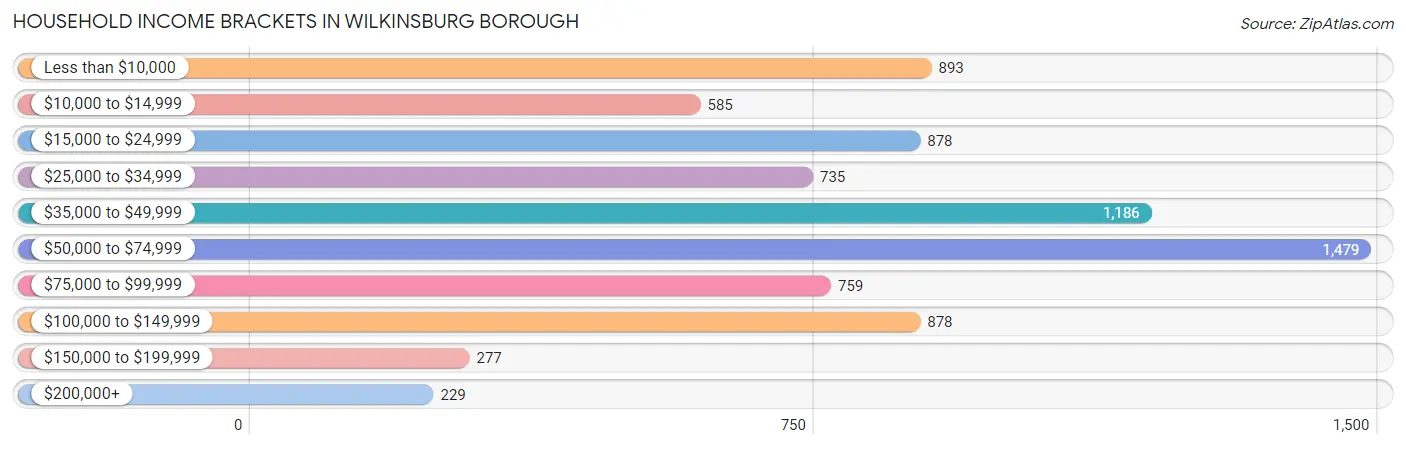
| Income Bracket | # Households | % Households |
| Less than $10,000 | 893 | 11.3% |
| $10,000 to $14,999 | 585 | 7.4% |
| $15,000 to $24,999 | 878 | 11.1% |
| $25,000 to $34,999 | 735 | 9.3% |
| $35,000 to $49,999 | 1,186 | 15.0% |
| $50,000 to $74,999 | 1,479 | 18.7% |
| $75,000 to $99,999 | 759 | 9.6% |
| $100,000 to $149,999 | 878 | 11.1% |
| $150,000 to $199,999 | 277 | 3.5% |
| $200,000+ | 229 | 2.9% |
Household Income by Householder Age in Wilkinsburg borough
The median household income in Wilkinsburg borough is $46,013, with the highest median household income of $51,392 found in the 45 to 64 years age bracket for the primary householder. A total of 2,504 households (31.7%) fall into this category. Meanwhile, the 65+ years age bracket for the primary householder has the lowest median household income of $40,168, with 2,445 households (30.9%) in this group.
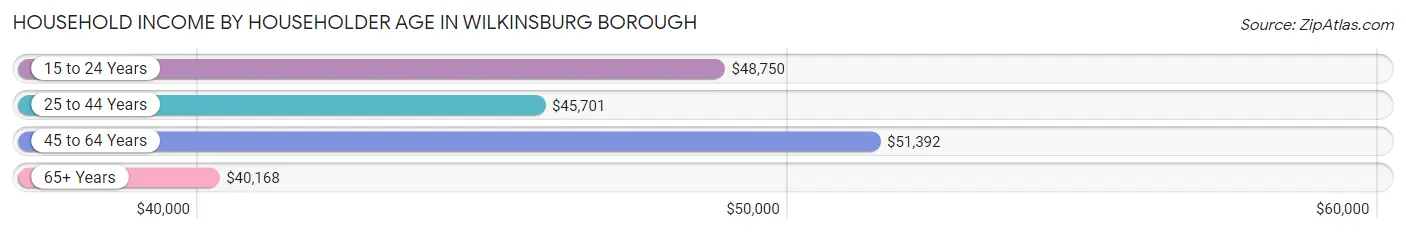
| Income Bracket | # Households | Median Income |
| 15 to 24 Years | 364 (4.6%) | $48,750 |
| 25 to 44 Years | 2,594 (32.8%) | $45,701 |
| 45 to 64 Years | 2,504 (31.7%) | $51,392 |
| 65+ Years | 2,445 (30.9%) | $40,168 |
| Total | 7,907 (100.0%) | $46,013 |
Poverty in Wilkinsburg borough
Income Below Poverty by Sex and Age in Wilkinsburg borough
With 21.0% poverty level for males and 24.4% for females among the residents of Wilkinsburg borough, 6 to 11 year old males and 5 year old females are the most vulnerable to poverty, with 288 males (61.0%) and 35 females (100.0%) in their respective age groups living below the poverty level.
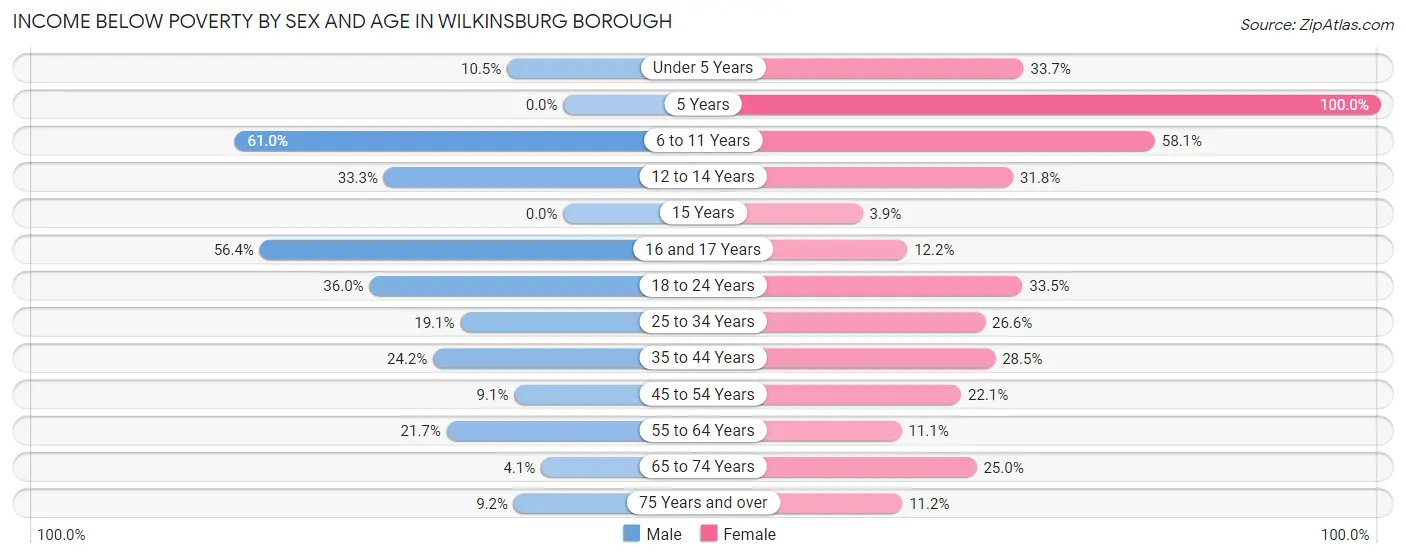
| Age Bracket | Male | Female |
| Under 5 Years | 23 (10.4%) | 83 (33.7%) |
| 5 Years | 0 (0.0%) | 35 (100.0%) |
| 6 to 11 Years | 288 (61.0%) | 215 (58.1%) |
| 12 to 14 Years | 33 (33.3%) | 97 (31.8%) |
| 15 Years | 0 (0.0%) | 5 (3.8%) |
| 16 and 17 Years | 31 (56.4%) | 22 (12.1%) |
| 18 to 24 Years | 117 (36.0%) | 243 (33.5%) |
| 25 to 34 Years | 273 (19.1%) | 326 (26.6%) |
| 35 to 44 Years | 140 (24.2%) | 280 (28.5%) |
| 45 to 54 Years | 57 (9.1%) | 168 (22.1%) |
| 55 to 64 Years | 220 (21.7%) | 140 (11.1%) |
| 65 to 74 Years | 27 (4.1%) | 306 (25.0%) |
| 75 Years and over | 39 (9.2%) | 91 (11.2%) |
| Total | 1,248 (21.0%) | 2,011 (24.4%) |
Income Above Poverty by Sex and Age in Wilkinsburg borough
According to the poverty statistics in Wilkinsburg borough, males aged 5 years and females aged 15 years are the age groups that are most secure financially, with 100.0% of males and 96.2% of females in these age groups living above the poverty line.
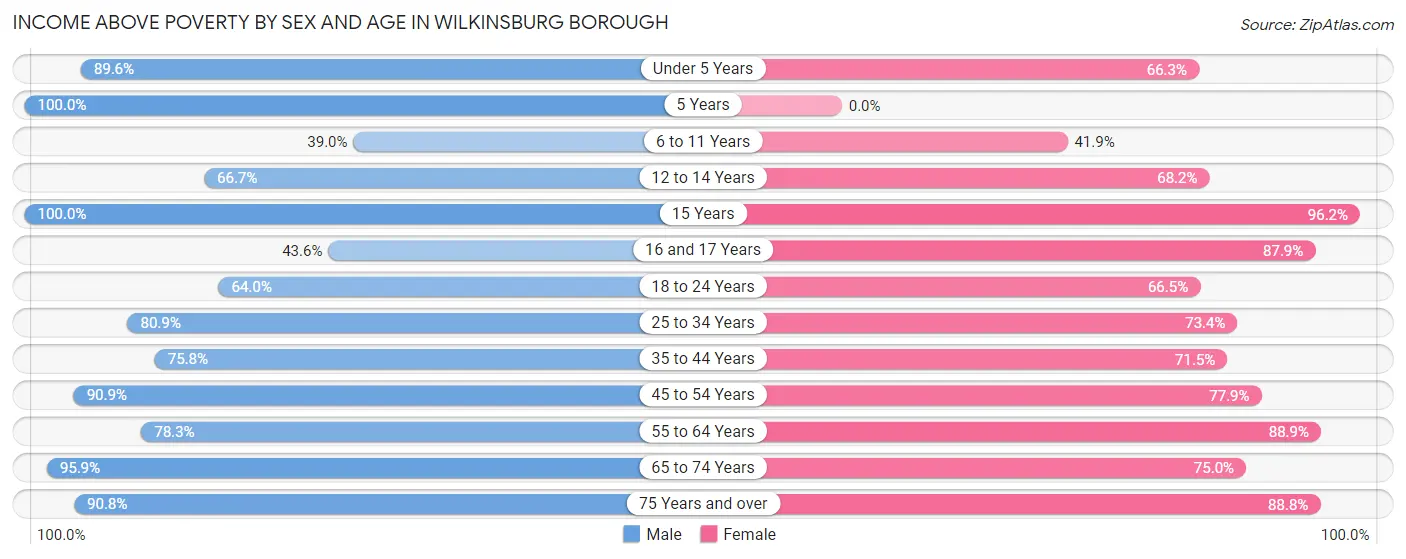
| Age Bracket | Male | Female |
| Under 5 Years | 197 (89.5%) | 163 (66.3%) |
| 5 Years | 24 (100.0%) | 0 (0.0%) |
| 6 to 11 Years | 184 (39.0%) | 155 (41.9%) |
| 12 to 14 Years | 66 (66.7%) | 208 (68.2%) |
| 15 Years | 14 (100.0%) | 125 (96.2%) |
| 16 and 17 Years | 24 (43.6%) | 159 (87.8%) |
| 18 to 24 Years | 208 (64.0%) | 482 (66.5%) |
| 25 to 34 Years | 1,155 (80.9%) | 900 (73.4%) |
| 35 to 44 Years | 439 (75.8%) | 703 (71.5%) |
| 45 to 54 Years | 568 (90.9%) | 591 (77.9%) |
| 55 to 64 Years | 795 (78.3%) | 1,122 (88.9%) |
| 65 to 74 Years | 625 (95.9%) | 918 (75.0%) |
| 75 Years and over | 385 (90.8%) | 720 (88.8%) |
| Total | 4,684 (79.0%) | 6,246 (75.6%) |
Income Below Poverty Among Married-Couple Families in Wilkinsburg borough
The poverty statistics for married-couple families in Wilkinsburg borough show that 6.4% or 83 of the total 1,300 families live below the poverty line. Families with no children have the highest poverty rate of 8.3%, comprising of 83 families. On the other hand, families with 1 or 2 children have the lowest poverty rate of 0.0%, which includes 0 families.
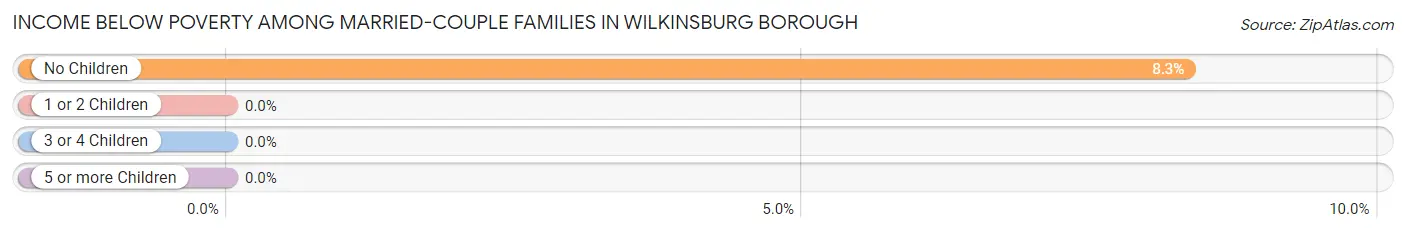
| Children | Above Poverty | Below Poverty |
| No Children | 912 (91.7%) | 83 (8.3%) |
| 1 or 2 Children | 266 (100.0%) | 0 (0.0%) |
| 3 or 4 Children | 39 (100.0%) | 0 (0.0%) |
| 5 or more Children | 0 (0.0%) | 0 (0.0%) |
| Total | 1,217 (93.6%) | 83 (6.4%) |
Income Below Poverty Among Single-Parent Households in Wilkinsburg borough
According to the poverty data in Wilkinsburg borough, 34.0% or 48 single-father households and 22.2% or 310 single-mother households are living below the poverty line. Among single-father households, those with 3 or 4 children have the highest poverty rate, with 48 households (100.0%) experiencing poverty. Likewise, among single-mother households, those with 5 or more children have the highest poverty rate, with 27 households (93.1%) falling below the poverty line.
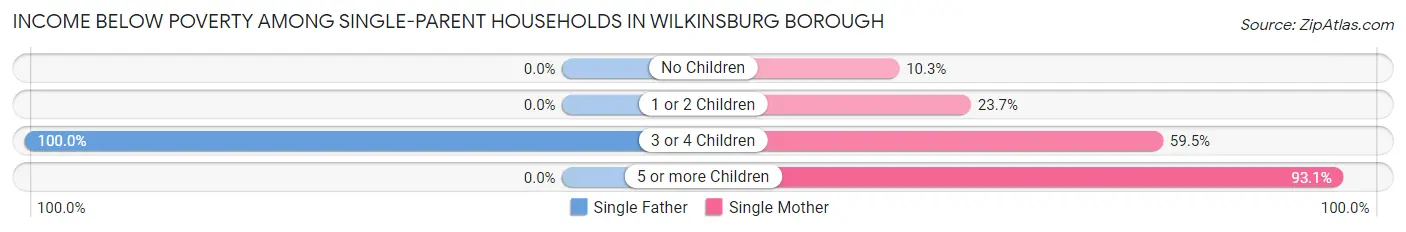
| Children | Single Father | Single Mother |
| No Children | 0 (0.0%) | 63 (10.3%) |
| 1 or 2 Children | 0 (0.0%) | 154 (23.7%) |
| 3 or 4 Children | 48 (100.0%) | 66 (59.5%) |
| 5 or more Children | 0 (0.0%) | 27 (93.1%) |
| Total | 48 (34.0%) | 310 (22.2%) |
Income Below Poverty Among Married-Couple vs Single-Parent Households in Wilkinsburg borough
The poverty data for Wilkinsburg borough shows that 83 of the married-couple family households (6.4%) and 358 of the single-parent households (23.3%) are living below the poverty level. Within the married-couple family households, those with no children have the highest poverty rate, with 83 households (8.3%) falling below the poverty line. Among the single-parent households, those with 5 or more children have the highest poverty rate, with 27 household (93.1%) living below poverty.
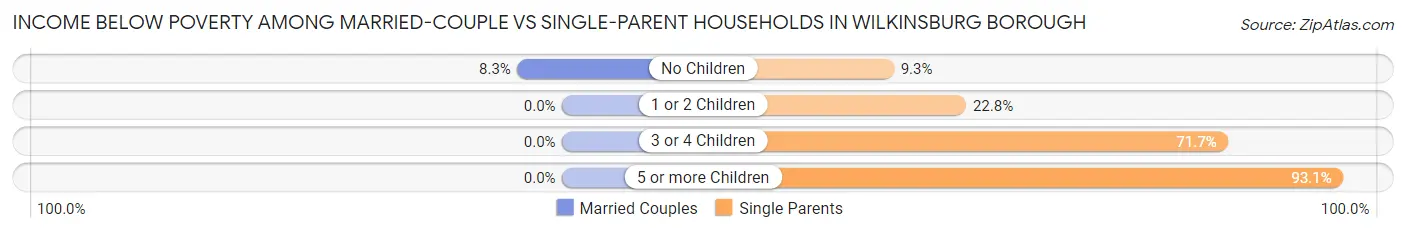
| Children | Married-Couple Families | Single-Parent Households |
| No Children | 83 (8.3%) | 63 (9.3%) |
| 1 or 2 Children | 0 (0.0%) | 154 (22.8%) |
| 3 or 4 Children | 0 (0.0%) | 114 (71.7%) |
| 5 or more Children | 0 (0.0%) | 27 (93.1%) |
| Total | 83 (6.4%) | 358 (23.3%) |
Employment Characteristics in Wilkinsburg borough
Employment by Class of Employer in Wilkinsburg borough
Among the 6,662 employed individuals in Wilkinsburg borough, private company employees (3,898 | 58.5%), not-for-profit organizations (1,605 | 24.1%), and self-employed (not incorporated) (375 | 5.6%) make up the most common classes of employment.
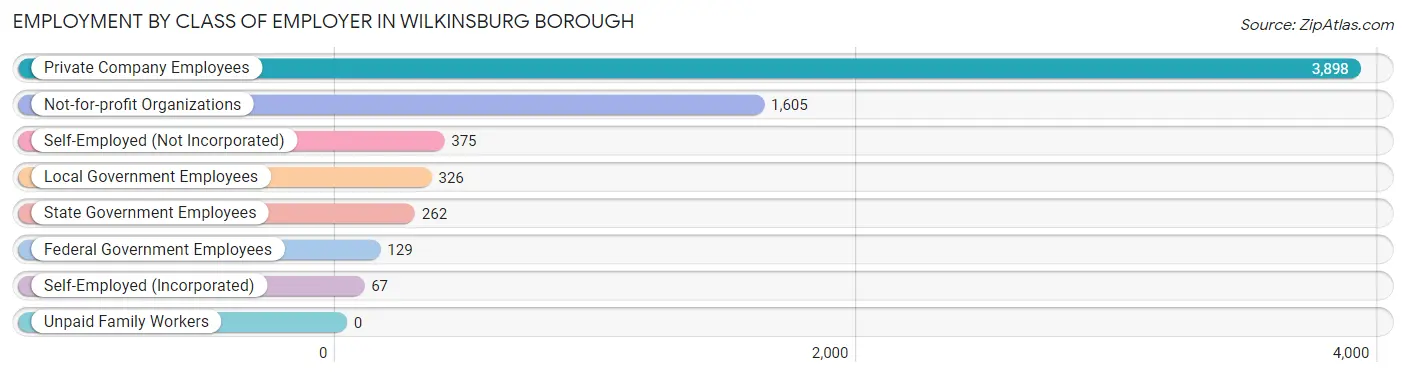
| Employer Class | # Employees | % Employees |
| Private Company Employees | 3,898 | 58.5% |
| Self-Employed (Incorporated) | 67 | 1.0% |
| Self-Employed (Not Incorporated) | 375 | 5.6% |
| Not-for-profit Organizations | 1,605 | 24.1% |
| Local Government Employees | 326 | 4.9% |
| State Government Employees | 262 | 3.9% |
| Federal Government Employees | 129 | 1.9% |
| Unpaid Family Workers | 0 | 0.0% |
| Total | 6,662 | 100.0% |
Employment Status by Age in Wilkinsburg borough
According to the labor force statistics for Wilkinsburg borough, out of the total population over 16 years of age (12,360), 59.9% or 7,404 individuals are in the labor force, with 8.5% or 629 of them unemployed. The age group with the highest labor force participation rate is 25 to 29 years, with 86.8% or 976 individuals in the labor force. Within the labor force, the 20 to 24 years age range has the highest percentage of unemployed individuals, with 16.4% or 100 of them being unemployed.
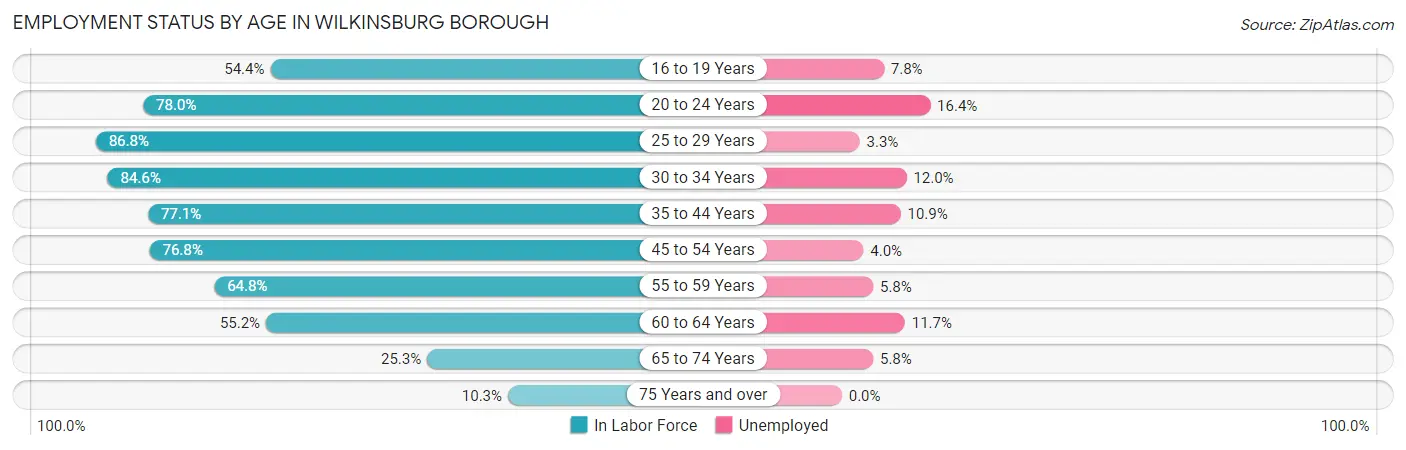
| Age Bracket | In Labor Force | Unemployed |
| 16 to 19 Years | 283 (54.4%) | 22 (7.8%) |
| 20 to 24 Years | 608 (78.0%) | 100 (16.4%) |
| 25 to 29 Years | 976 (86.8%) | 32 (3.3%) |
| 30 to 34 Years | 1,299 (84.6%) | 156 (12.0%) |
| 35 to 44 Years | 1,204 (77.1%) | 131 (10.9%) |
| 45 to 54 Years | 1,063 (76.8%) | 43 (4.0%) |
| 55 to 59 Years | 671 (64.8%) | 39 (5.8%) |
| 60 to 64 Years | 691 (55.2%) | 81 (11.7%) |
| 65 to 74 Years | 481 (25.3%) | 28 (5.8%) |
| 75 Years and over | 131 (10.3%) | 0 (0.0%) |
| Total | 7,404 (59.9%) | 629 (8.5%) |
Employment Status by Educational Attainment in Wilkinsburg borough
According to labor force statistics for Wilkinsburg borough, 74.8% of individuals (5,903) out of the total population between 25 and 64 years of age (7,892) are in the labor force, with 8.1% or 478 of them being unemployed. The group with the highest labor force participation rate are those with the educational attainment of bachelor's degree or higher, with 87.4% or 2,766 individuals in the labor force. Within the labor force, individuals with less than high school education have the highest percentage of unemployment, with 13.1% or 39 of them being unemployed.
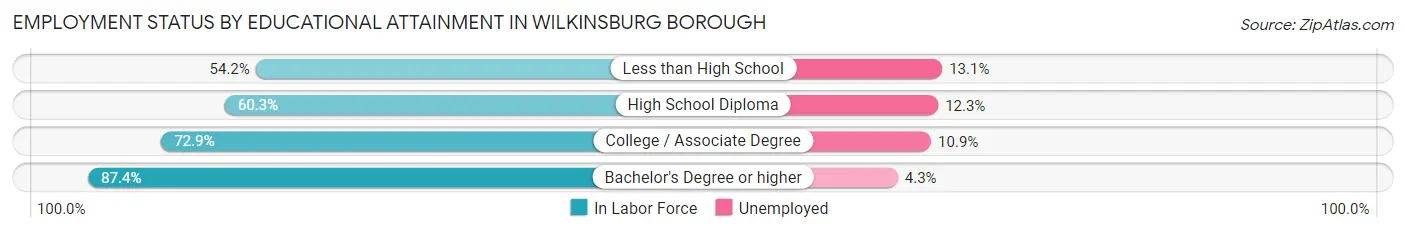
| Educational Attainment | In Labor Force | Unemployed |
| Less than High School | 298 (54.2%) | 72 (13.1%) |
| High School Diploma | 977 (60.3%) | 199 (12.3%) |
| College / Associate Degree | 1,863 (72.9%) | 279 (10.9%) |
| Bachelor's Degree or higher | 2,766 (87.4%) | 136 (4.3%) |
| Total | 5,903 (74.8%) | 639 (8.1%) |
Employment Occupations by Sex in Wilkinsburg borough
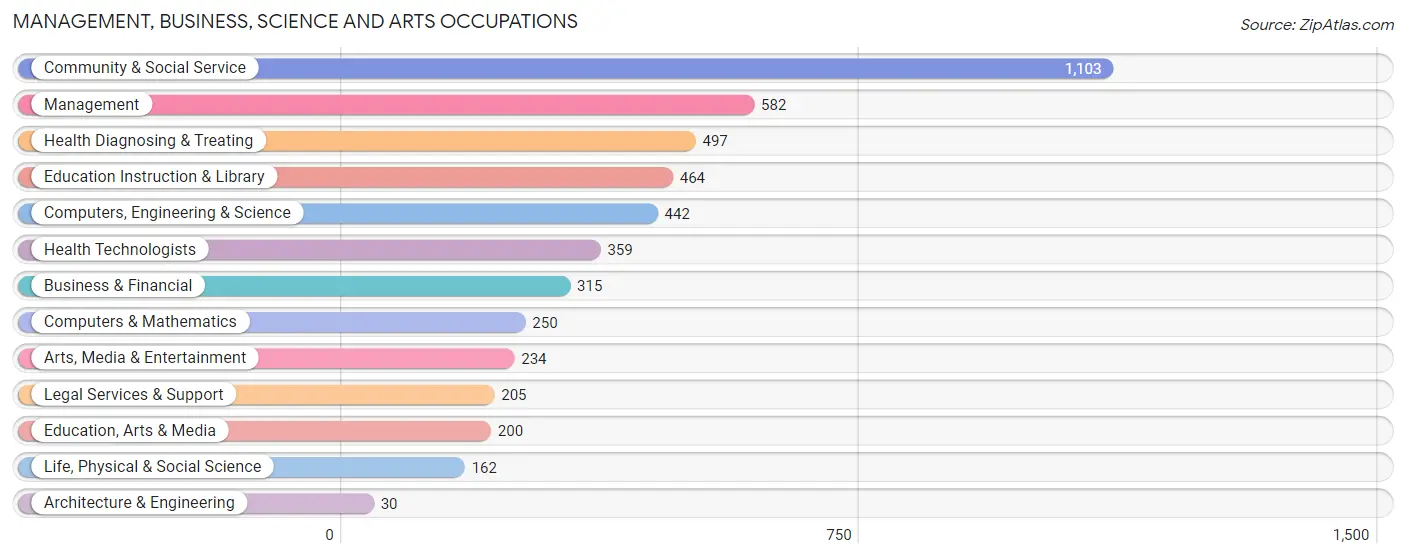
Management, Business, Science and Arts Occupations
The most common Management, Business, Science and Arts occupations in Wilkinsburg borough are Community & Social Service (1,103 | 16.3%), Management (582 | 8.6%), Health Diagnosing & Treating (497 | 7.3%), Education Instruction & Library (464 | 6.9%), and Computers, Engineering & Science (442 | 6.5%).
Management, Business, Science and Arts Occupations by Sex
Within the Management, Business, Science and Arts occupations in Wilkinsburg borough, the most male-oriented occupations are Arts, Media & Entertainment (74.4%), Legal Services & Support (69.3%), and Health Technologists (62.4%), while the most female-oriented occupations are Life, Physical & Social Science (96.3%), Education, Arts & Media (88.0%), and Business & Financial (78.1%).
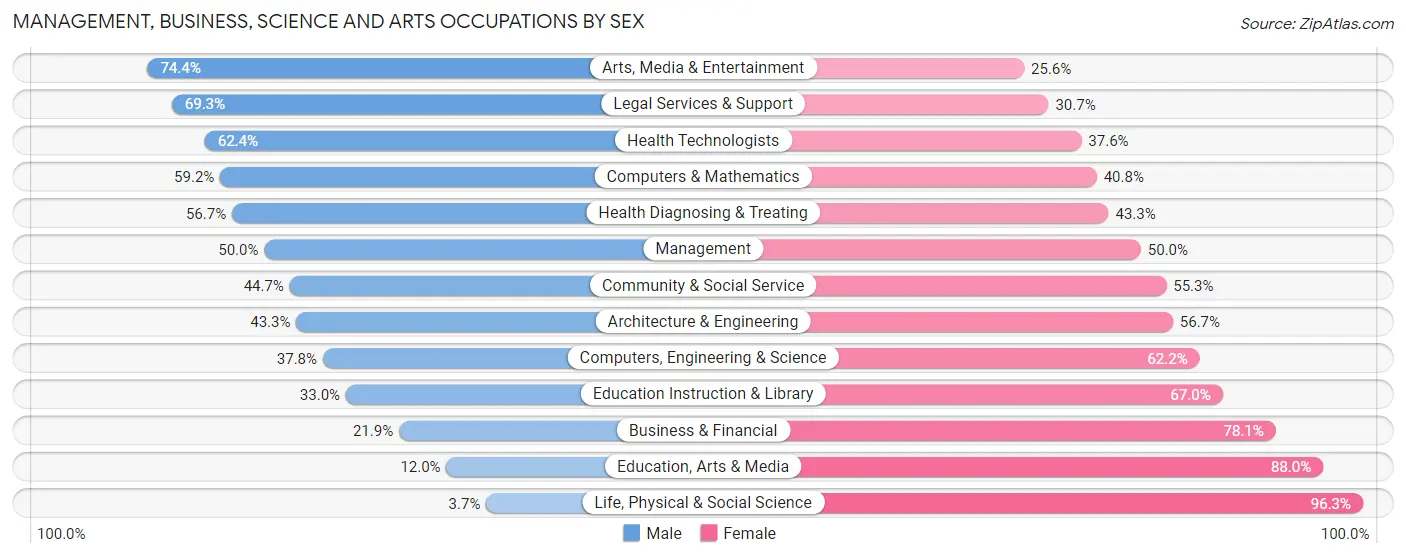
| Occupation | Male | Female |
| Management | 291 (50.0%) | 291 (50.0%) |
| Business & Financial | 69 (21.9%) | 246 (78.1%) |
| Computers, Engineering & Science | 167 (37.8%) | 275 (62.2%) |
| Computers & Mathematics | 148 (59.2%) | 102 (40.8%) |
| Architecture & Engineering | 13 (43.3%) | 17 (56.7%) |
| Life, Physical & Social Science | 6 (3.7%) | 156 (96.3%) |
| Community & Social Service | 493 (44.7%) | 610 (55.3%) |
| Education, Arts & Media | 24 (12.0%) | 176 (88.0%) |
| Legal Services & Support | 142 (69.3%) | 63 (30.7%) |
| Education Instruction & Library | 153 (33.0%) | 311 (67.0%) |
| Arts, Media & Entertainment | 174 (74.4%) | 60 (25.6%) |
| Health Diagnosing & Treating | 282 (56.7%) | 215 (43.3%) |
| Health Technologists | 224 (62.4%) | 135 (37.6%) |
| Total (Category) | 1,302 (44.3%) | 1,637 (55.7%) |
| Total (Overall) | 3,140 (46.3%) | 3,638 (53.7%) |
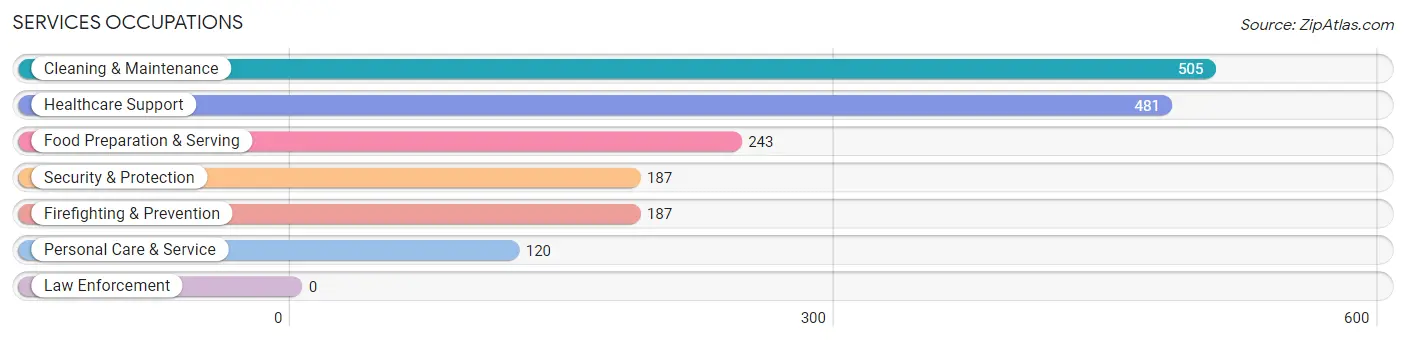
Services Occupations
The most common Services occupations in Wilkinsburg borough are Cleaning & Maintenance (505 | 7.4%), Healthcare Support (481 | 7.1%), Food Preparation & Serving (243 | 3.6%), Security & Protection (187 | 2.8%), and Firefighting & Prevention (187 | 2.8%).
Services Occupations by Sex
Within the Services occupations in Wilkinsburg borough, the most male-oriented occupations are Food Preparation & Serving (60.1%), Cleaning & Maintenance (52.3%), and Security & Protection (40.1%), while the most female-oriented occupations are Personal Care & Service (77.5%), Healthcare Support (77.3%), and Security & Protection (59.9%).
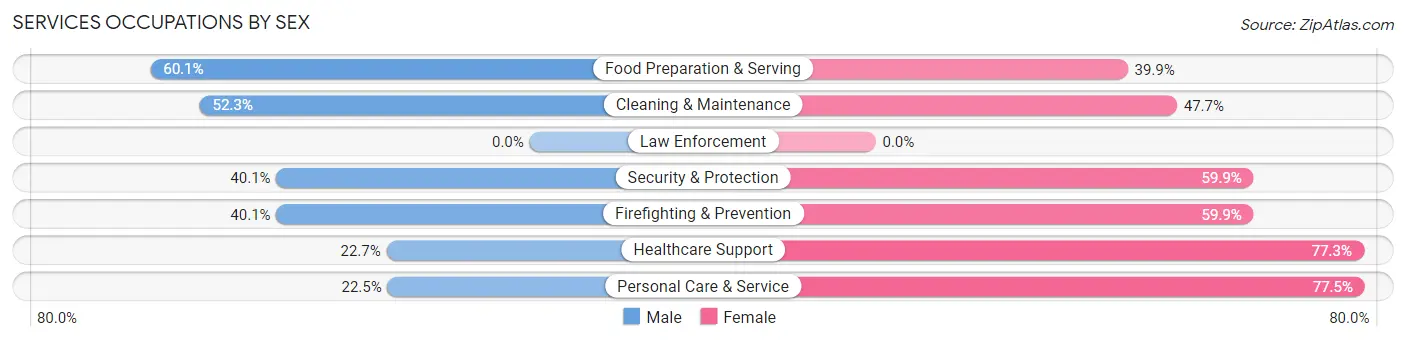
| Occupation | Male | Female |
| Healthcare Support | 109 (22.7%) | 372 (77.3%) |
| Security & Protection | 75 (40.1%) | 112 (59.9%) |
| Firefighting & Prevention | 75 (40.1%) | 112 (59.9%) |
| Law Enforcement | 0 (0.0%) | 0 (0.0%) |
| Food Preparation & Serving | 146 (60.1%) | 97 (39.9%) |
| Cleaning & Maintenance | 264 (52.3%) | 241 (47.7%) |
| Personal Care & Service | 27 (22.5%) | 93 (77.5%) |
| Total (Category) | 621 (40.4%) | 915 (59.6%) |
| Total (Overall) | 3,140 (46.3%) | 3,638 (53.7%) |
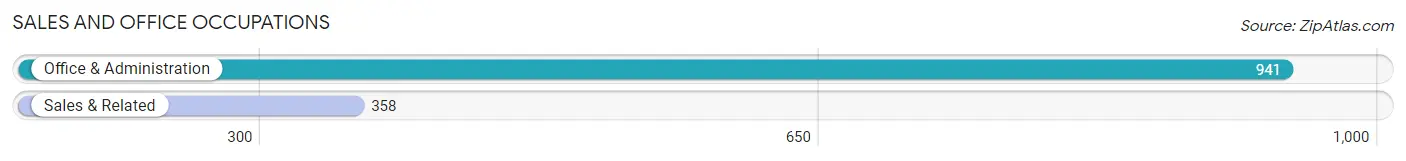
Sales and Office Occupations
The most common Sales and Office occupations in Wilkinsburg borough are Office & Administration (941 | 13.9%), and Sales & Related (358 | 5.3%).
Sales and Office Occupations by Sex
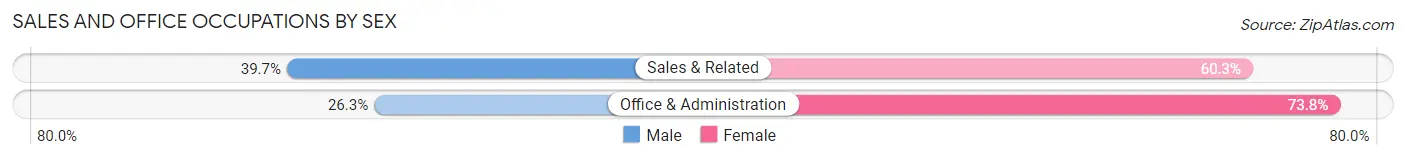
| Occupation | Male | Female |
| Sales & Related | 142 (39.7%) | 216 (60.3%) |
| Office & Administration | 247 (26.3%) | 694 (73.8%) |
| Total (Category) | 389 (29.9%) | 910 (70.1%) |
| Total (Overall) | 3,140 (46.3%) | 3,638 (53.7%) |
Natural Resources, Construction and Maintenance Occupations
The most common Natural Resources, Construction and Maintenance occupations in Wilkinsburg borough are Installation, Maintenance & Repair (185 | 2.7%), Construction & Extraction (99 | 1.5%), and Farming, Fishing & Forestry (9 | 0.1%).
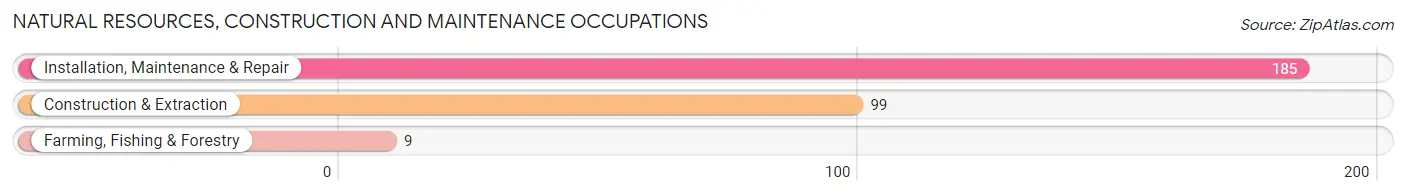
Natural Resources, Construction and Maintenance Occupations by Sex
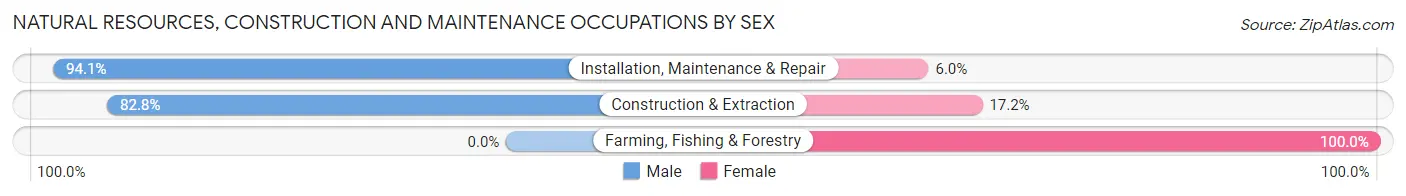
| Occupation | Male | Female |
| Farming, Fishing & Forestry | 0 (0.0%) | 9 (100.0%) |
| Construction & Extraction | 82 (82.8%) | 17 (17.2%) |
| Installation, Maintenance & Repair | 174 (94.1%) | 11 (5.9%) |
| Total (Category) | 256 (87.4%) | 37 (12.6%) |
| Total (Overall) | 3,140 (46.3%) | 3,638 (53.7%) |
Production, Transportation and Moving Occupations
The most common Production, Transportation and Moving occupations in Wilkinsburg borough are Transportation (296 | 4.4%), Material Moving (250 | 3.7%), and Production (165 | 2.4%).
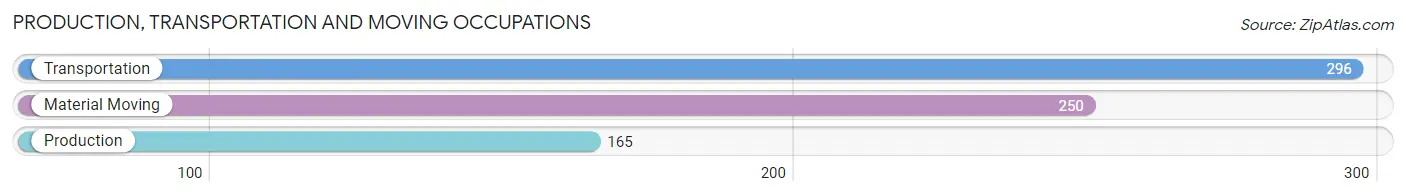
Production, Transportation and Moving Occupations by Sex
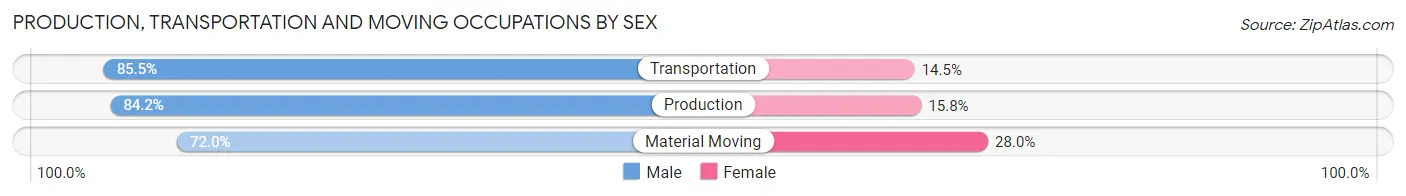
| Occupation | Male | Female |
| Production | 139 (84.2%) | 26 (15.8%) |
| Transportation | 253 (85.5%) | 43 (14.5%) |
| Material Moving | 180 (72.0%) | 70 (28.0%) |
| Total (Category) | 572 (80.4%) | 139 (19.6%) |
| Total (Overall) | 3,140 (46.3%) | 3,638 (53.7%) |
Employment Industries by Sex in Wilkinsburg borough
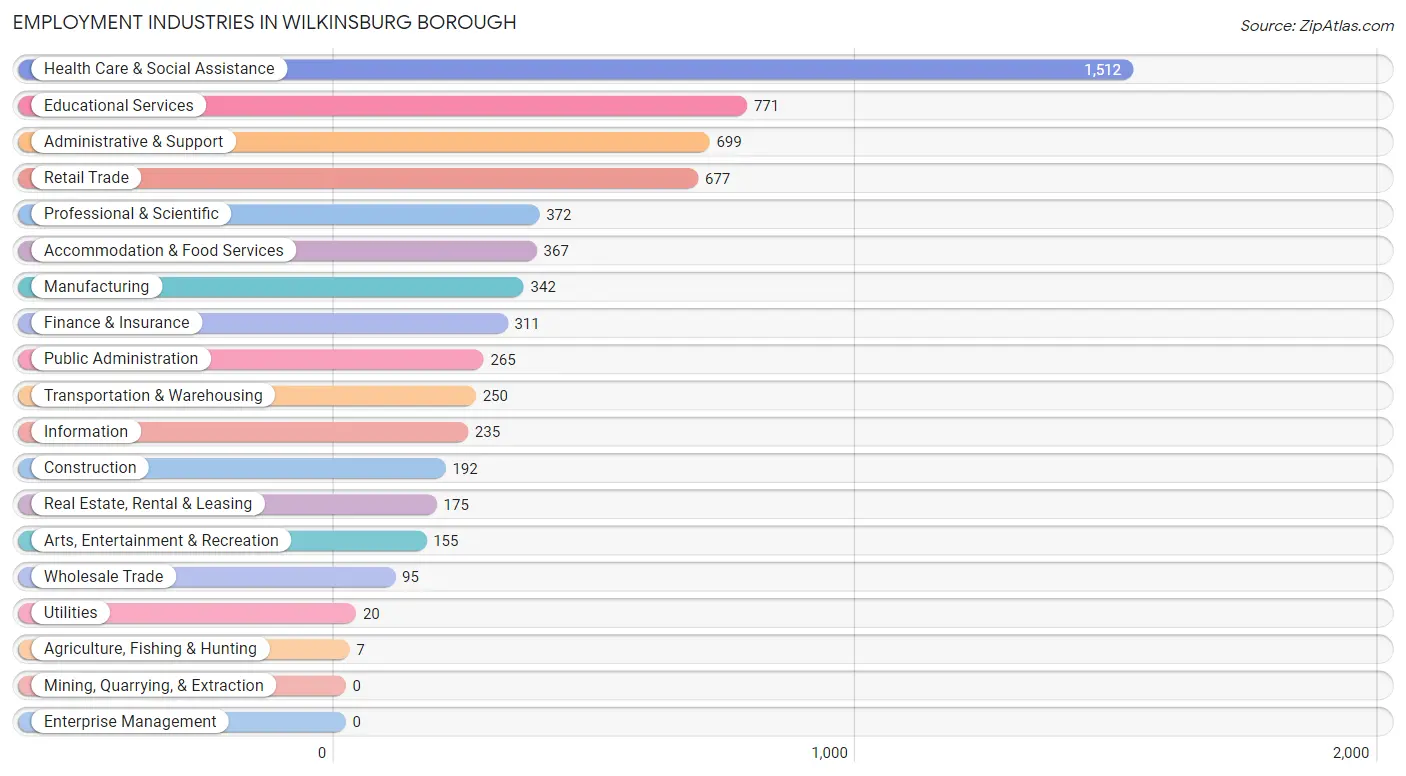
Employment Industries in Wilkinsburg borough
The major employment industries in Wilkinsburg borough include Health Care & Social Assistance (1,512 | 22.3%), Educational Services (771 | 11.4%), Administrative & Support (699 | 10.3%), Retail Trade (677 | 10.0%), and Professional & Scientific (372 | 5.5%).
Employment Industries by Sex in Wilkinsburg borough
The Wilkinsburg borough industries that see more men than women are Construction (90.6%), Real Estate, Rental & Leasing (81.7%), and Transportation & Warehousing (80.0%), whereas the industries that tend to have a higher number of women are Agriculture, Fishing & Hunting (100.0%), Health Care & Social Assistance (79.5%), and Educational Services (69.8%).
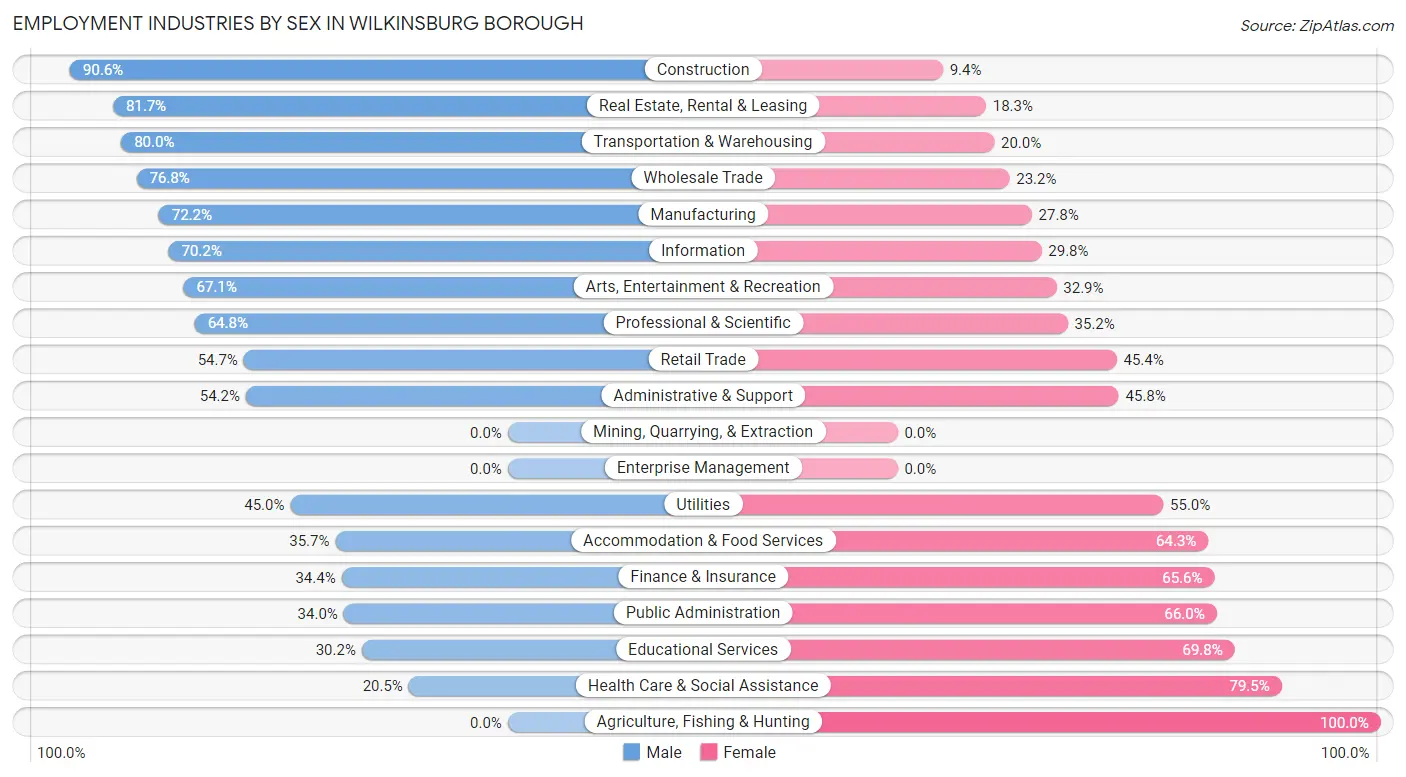
| Industry | Male | Female |
| Agriculture, Fishing & Hunting | 0 (0.0%) | 7 (100.0%) |
| Mining, Quarrying, & Extraction | 0 (0.0%) | 0 (0.0%) |
| Construction | 174 (90.6%) | 18 (9.4%) |
| Manufacturing | 247 (72.2%) | 95 (27.8%) |
| Wholesale Trade | 73 (76.8%) | 22 (23.2%) |
| Retail Trade | 370 (54.6%) | 307 (45.4%) |
| Transportation & Warehousing | 200 (80.0%) | 50 (20.0%) |
| Utilities | 9 (45.0%) | 11 (55.0%) |
| Information | 165 (70.2%) | 70 (29.8%) |
| Finance & Insurance | 107 (34.4%) | 204 (65.6%) |
| Real Estate, Rental & Leasing | 143 (81.7%) | 32 (18.3%) |
| Professional & Scientific | 241 (64.8%) | 131 (35.2%) |
| Enterprise Management | 0 (0.0%) | 0 (0.0%) |
| Administrative & Support | 379 (54.2%) | 320 (45.8%) |
| Educational Services | 233 (30.2%) | 538 (69.8%) |
| Health Care & Social Assistance | 310 (20.5%) | 1,202 (79.5%) |
| Arts, Entertainment & Recreation | 104 (67.1%) | 51 (32.9%) |
| Accommodation & Food Services | 131 (35.7%) | 236 (64.3%) |
| Public Administration | 90 (34.0%) | 175 (66.0%) |
| Total | 3,140 (46.3%) | 3,638 (53.7%) |
Education in Wilkinsburg borough
School Enrollment in Wilkinsburg borough
The most common levels of schooling among the 2,861 students in Wilkinsburg borough are high school (622 | 21.7%), elementary school (612 | 21.4%), and graduate / professional (446 | 15.6%).
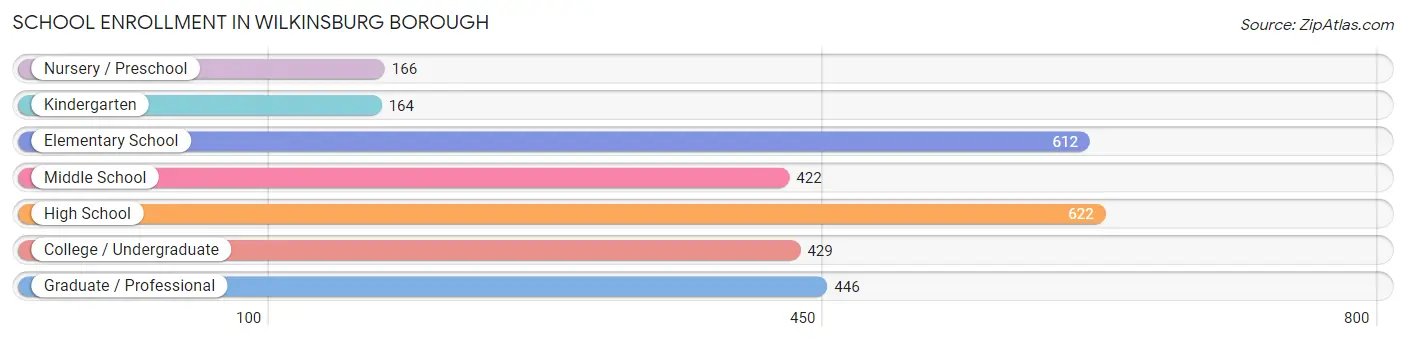
| School Level | # Students | % Students |
| Nursery / Preschool | 166 | 5.8% |
| Kindergarten | 164 | 5.7% |
| Elementary School | 612 | 21.4% |
| Middle School | 422 | 14.7% |
| High School | 622 | 21.7% |
| College / Undergraduate | 429 | 15.0% |
| Graduate / Professional | 446 | 15.6% |
| Total | 2,861 | 100.0% |
School Enrollment by Age by Funding Source in Wilkinsburg borough
Out of a total of 2,861 students who are enrolled in schools in Wilkinsburg borough, 598 (20.9%) attend a private institution, while the remaining 2,263 (79.1%) are enrolled in public schools. The age group of 35 years and over has the highest likelihood of being enrolled in private schools, with 69 (34.2% in the age bracket) enrolled. Conversely, the age group of 15 to 17 year olds has the lowest likelihood of being enrolled in a private school, with 315 (91.3% in the age bracket) attending a public institution.
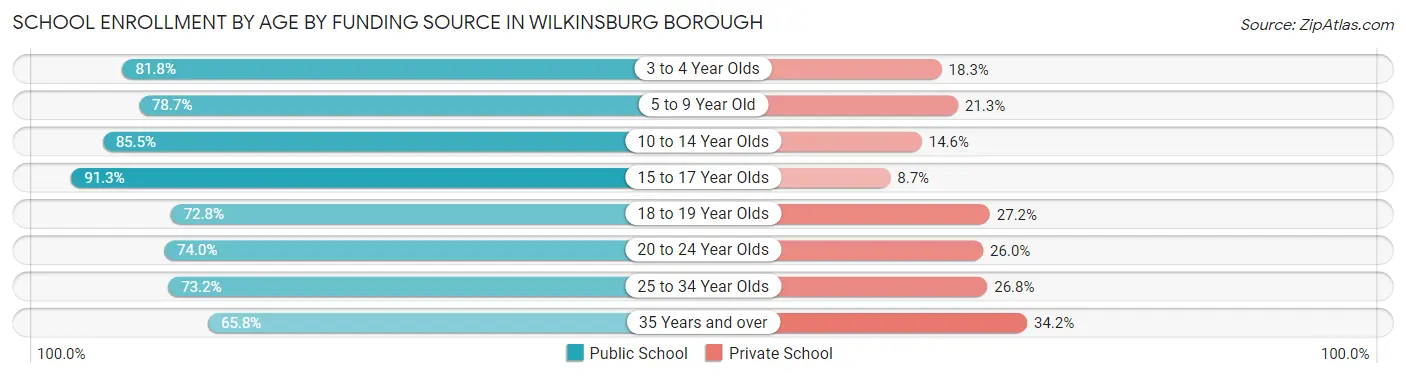
| Age Bracket | Public School | Private School |
| 3 to 4 Year Olds | 103 (81.8%) | 23 (18.2%) |
| 5 to 9 Year Old | 576 (78.7%) | 156 (21.3%) |
| 10 to 14 Year Olds | 470 (85.5%) | 80 (14.5%) |
| 15 to 17 Year Olds | 315 (91.3%) | 30 (8.7%) |
| 18 to 19 Year Olds | 171 (72.8%) | 64 (27.2%) |
| 20 to 24 Year Olds | 245 (74.0%) | 86 (26.0%) |
| 25 to 34 Year Olds | 249 (73.2%) | 91 (26.8%) |
| 35 Years and over | 133 (65.8%) | 69 (34.2%) |
| Total | 2,263 (79.1%) | 598 (20.9%) |
Educational Attainment by Field of Study in Wilkinsburg borough
Social sciences (678 | 14.3%), business (675 | 14.2%), science & technology (462 | 9.8%), literature & languages (377 | 8.0%), and liberal arts & history (367 | 7.7%) are the most common fields of study among 4,738 individuals in Wilkinsburg borough who have obtained a bachelor's degree or higher.
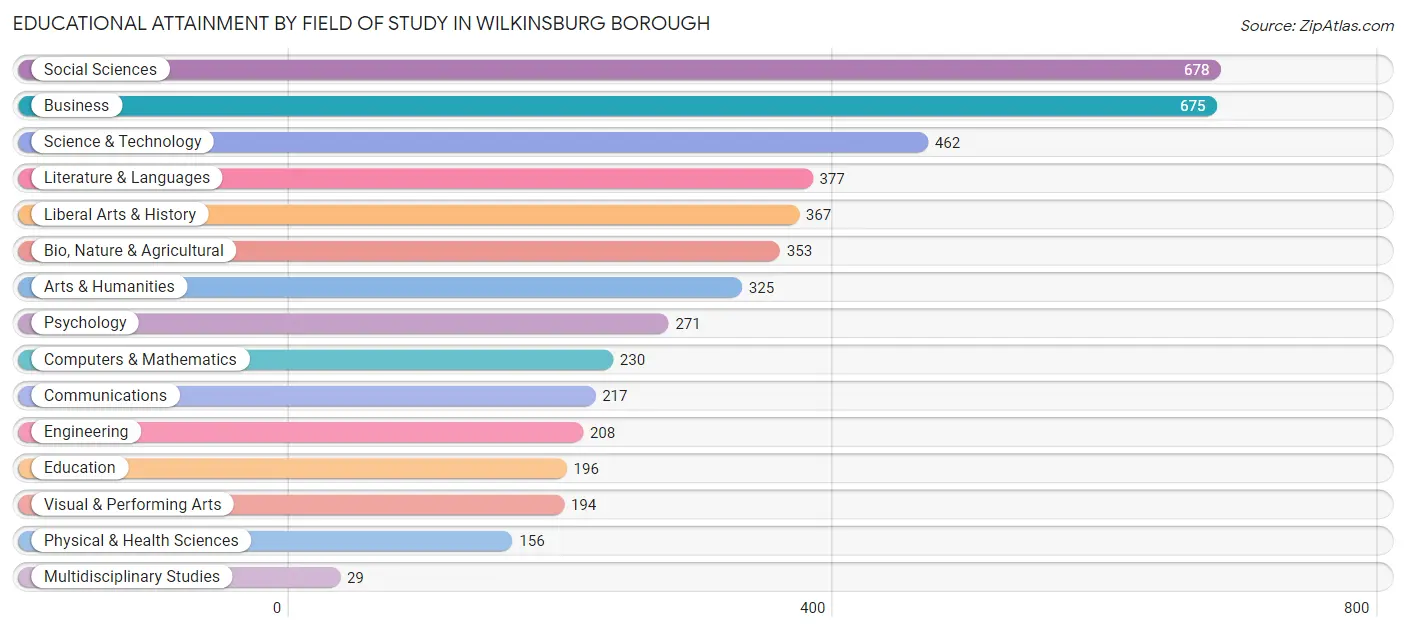
| Field of Study | # Graduates | % Graduates |
| Computers & Mathematics | 230 | 4.9% |
| Bio, Nature & Agricultural | 353 | 7.4% |
| Physical & Health Sciences | 156 | 3.3% |
| Psychology | 271 | 5.7% |
| Social Sciences | 678 | 14.3% |
| Engineering | 208 | 4.4% |
| Multidisciplinary Studies | 29 | 0.6% |
| Science & Technology | 462 | 9.8% |
| Business | 675 | 14.2% |
| Education | 196 | 4.1% |
| Literature & Languages | 377 | 8.0% |
| Liberal Arts & History | 367 | 7.7% |
| Visual & Performing Arts | 194 | 4.1% |
| Communications | 217 | 4.6% |
| Arts & Humanities | 325 | 6.9% |
| Total | 4,738 | 100.0% |
Transportation & Commute in Wilkinsburg borough
Vehicle Availability by Sex in Wilkinsburg borough
The most prevalent vehicle ownership categories in Wilkinsburg borough are males with 1 vehicle (1,378, accounting for 45.6%) and females with 1 vehicle (1,798, making up 38.0%).
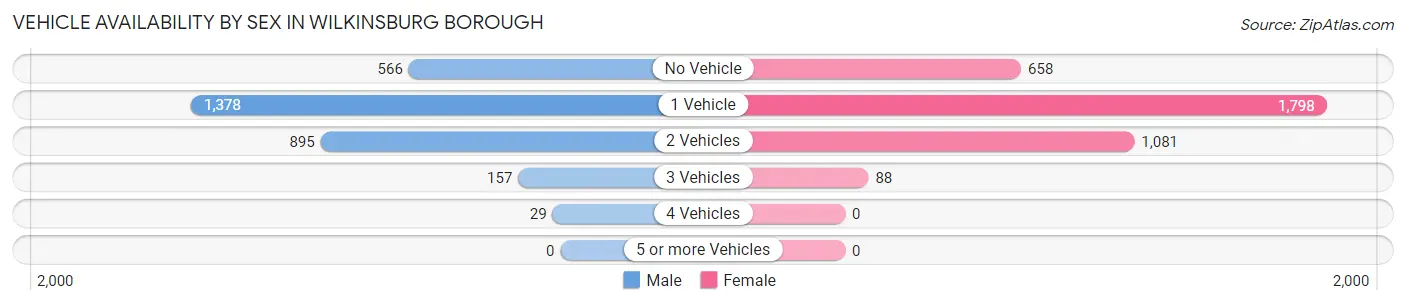
| Vehicles Available | Male | Female |
| No Vehicle | 566 (18.7%) | 658 (18.1%) |
| 1 Vehicle | 1,378 (45.6%) | 1,798 (49.6%) |
| 2 Vehicles | 895 (29.6%) | 1,081 (29.8%) |
| 3 Vehicles | 157 (5.2%) | 88 (2.4%) |
| 4 Vehicles | 29 (1.0%) | 0 (0.0%) |
| 5 or more Vehicles | 0 (0.0%) | 0 (0.0%) |
| Total | 3,025 (100.0%) | 3,625 (100.0%) |
Commute Time in Wilkinsburg borough
The most frequently occuring commute durations in Wilkinsburg borough are 20 to 24 minutes (1,136 commuters, 20.1%), 30 to 34 minutes (849 commuters, 15.0%), and 15 to 19 minutes (757 commuters, 13.4%).
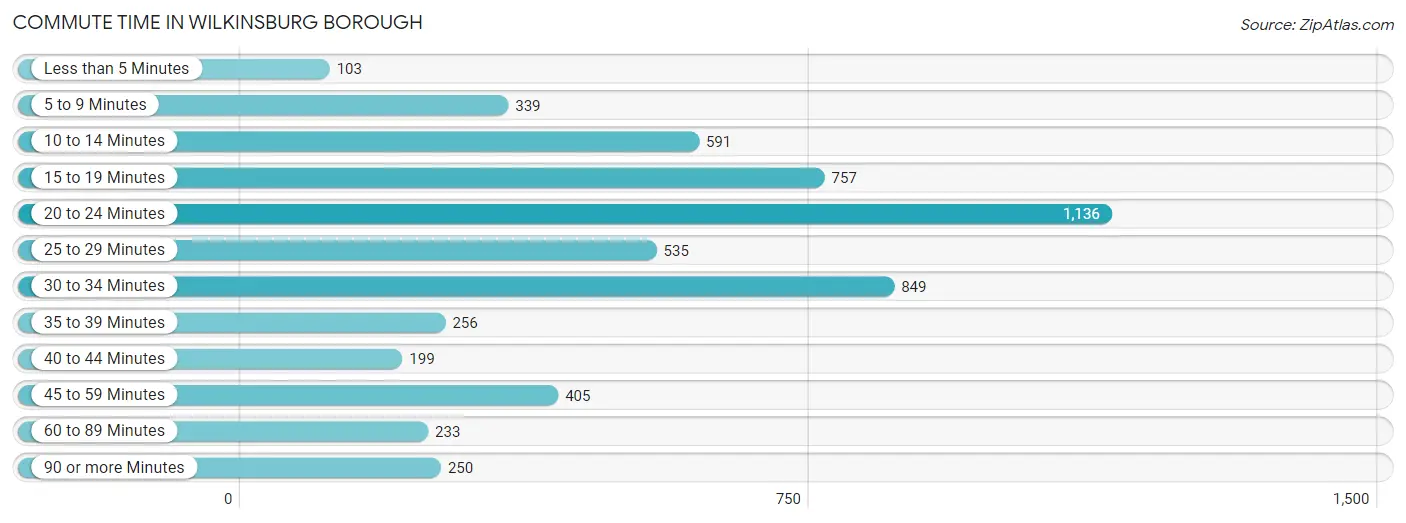
| Commute Time | # Commuters | % Commuters |
| Less than 5 Minutes | 103 | 1.8% |
| 5 to 9 Minutes | 339 | 6.0% |
| 10 to 14 Minutes | 591 | 10.4% |
| 15 to 19 Minutes | 757 | 13.4% |
| 20 to 24 Minutes | 1,136 | 20.1% |
| 25 to 29 Minutes | 535 | 9.5% |
| 30 to 34 Minutes | 849 | 15.0% |
| 35 to 39 Minutes | 256 | 4.5% |
| 40 to 44 Minutes | 199 | 3.5% |
| 45 to 59 Minutes | 405 | 7.2% |
| 60 to 89 Minutes | 233 | 4.1% |
| 90 or more Minutes | 250 | 4.4% |
Commute Time by Sex in Wilkinsburg borough
The most common commute times in Wilkinsburg borough are 20 to 24 minutes (432 commuters, 16.6%) for males and 20 to 24 minutes (704 commuters, 23.1%) for females.
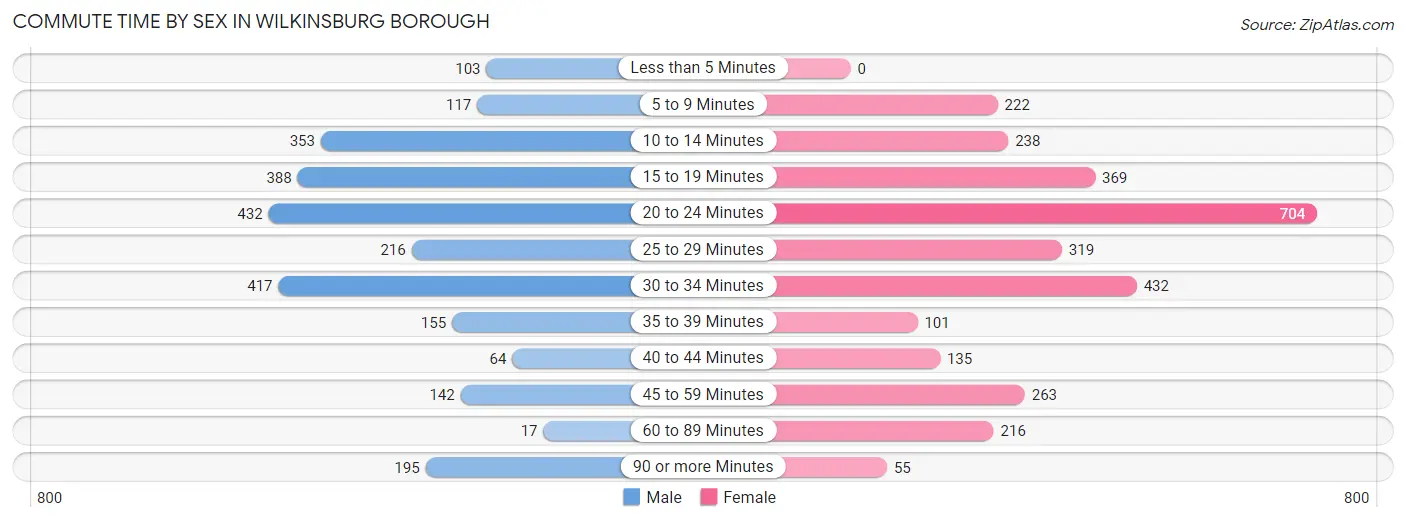
| Commute Time | Male | Female |
| Less than 5 Minutes | 103 (4.0%) | 0 (0.0%) |
| 5 to 9 Minutes | 117 (4.5%) | 222 (7.3%) |
| 10 to 14 Minutes | 353 (13.6%) | 238 (7.8%) |
| 15 to 19 Minutes | 388 (14.9%) | 369 (12.1%) |
| 20 to 24 Minutes | 432 (16.6%) | 704 (23.1%) |
| 25 to 29 Minutes | 216 (8.3%) | 319 (10.4%) |
| 30 to 34 Minutes | 417 (16.0%) | 432 (14.1%) |
| 35 to 39 Minutes | 155 (6.0%) | 101 (3.3%) |
| 40 to 44 Minutes | 64 (2.5%) | 135 (4.4%) |
| 45 to 59 Minutes | 142 (5.5%) | 263 (8.6%) |
| 60 to 89 Minutes | 17 (0.6%) | 216 (7.1%) |
| 90 or more Minutes | 195 (7.5%) | 55 (1.8%) |
Time of Departure to Work by Sex in Wilkinsburg borough
The most frequent times of departure to work in Wilkinsburg borough are 8:00 AM to 8:29 AM (449, 17.3%) for males and 8:00 AM to 8:29 AM (417, 13.7%) for females.
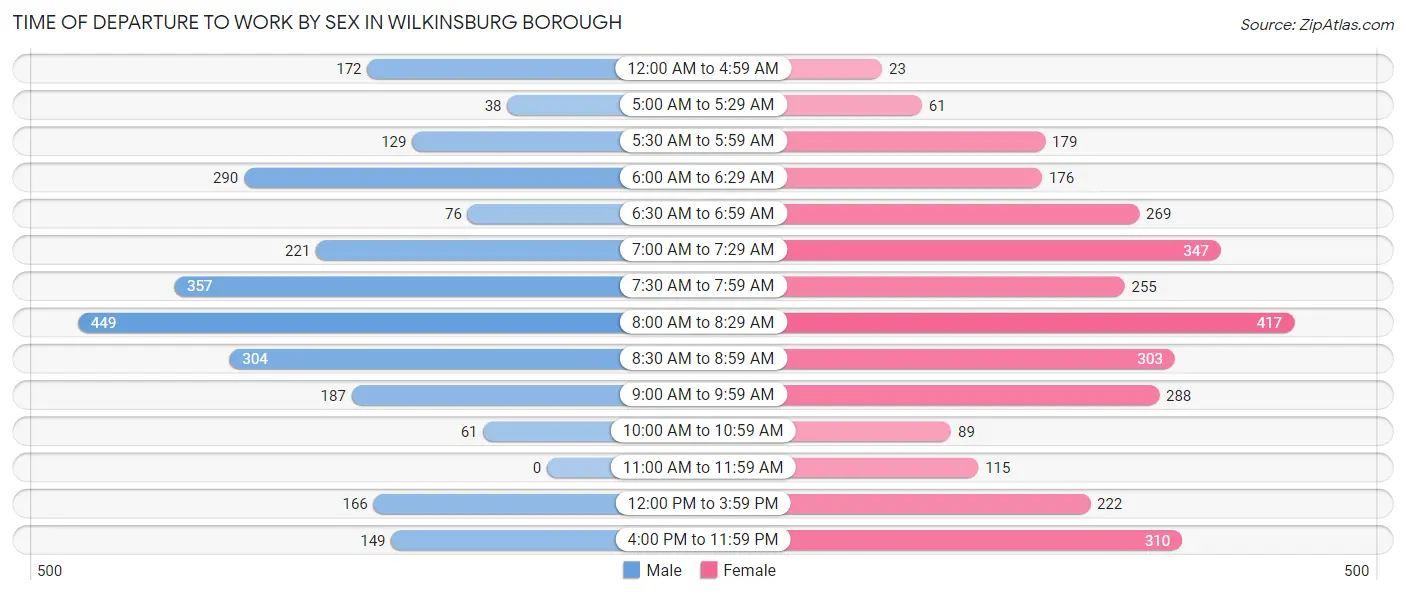
| Time of Departure | Male | Female |
| 12:00 AM to 4:59 AM | 172 (6.6%) | 23 (0.7%) |
| 5:00 AM to 5:29 AM | 38 (1.5%) | 61 (2.0%) |
| 5:30 AM to 5:59 AM | 129 (5.0%) | 179 (5.9%) |
| 6:00 AM to 6:29 AM | 290 (11.2%) | 176 (5.8%) |
| 6:30 AM to 6:59 AM | 76 (2.9%) | 269 (8.8%) |
| 7:00 AM to 7:29 AM | 221 (8.5%) | 347 (11.4%) |
| 7:30 AM to 7:59 AM | 357 (13.7%) | 255 (8.4%) |
| 8:00 AM to 8:29 AM | 449 (17.3%) | 417 (13.7%) |
| 8:30 AM to 8:59 AM | 304 (11.7%) | 303 (9.9%) |
| 9:00 AM to 9:59 AM | 187 (7.2%) | 288 (9.4%) |
| 10:00 AM to 10:59 AM | 61 (2.4%) | 89 (2.9%) |
| 11:00 AM to 11:59 AM | 0 (0.0%) | 115 (3.8%) |
| 12:00 PM to 3:59 PM | 166 (6.4%) | 222 (7.3%) |
| 4:00 PM to 11:59 PM | 149 (5.7%) | 310 (10.2%) |
| Total | 2,599 (100.0%) | 3,054 (100.0%) |
Housing Occupancy in Wilkinsburg borough
Occupancy by Ownership in Wilkinsburg borough
Of the total 7,907 dwellings in Wilkinsburg borough, owner-occupied units account for 2,374 (30.0%), while renter-occupied units make up 5,533 (70.0%).
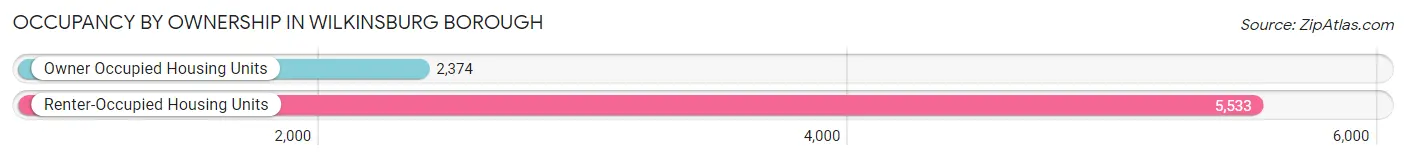
| Occupancy | # Housing Units | % Housing Units |
| Owner Occupied Housing Units | 2,374 | 30.0% |
| Renter-Occupied Housing Units | 5,533 | 70.0% |
| Total Occupied Housing Units | 7,907 | 100.0% |
Occupancy by Household Size in Wilkinsburg borough
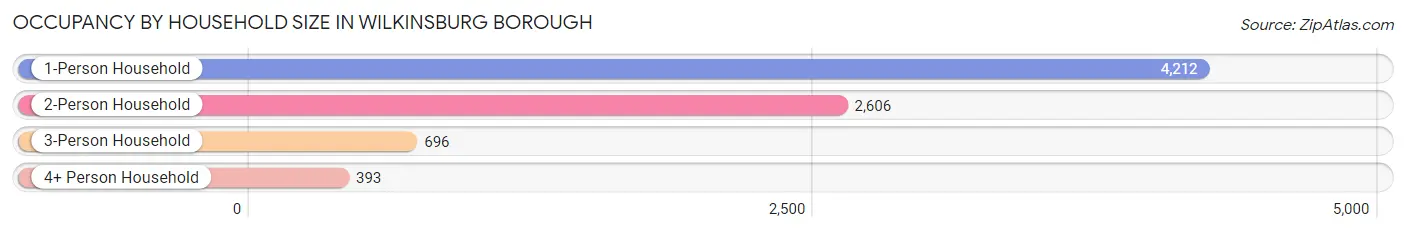
| Household Size | # Housing Units | % Housing Units |
| 1-Person Household | 4,212 | 53.3% |
| 2-Person Household | 2,606 | 33.0% |
| 3-Person Household | 696 | 8.8% |
| 4+ Person Household | 393 | 5.0% |
| Total Housing Units | 7,907 | 100.0% |
Occupancy by Ownership by Household Size in Wilkinsburg borough
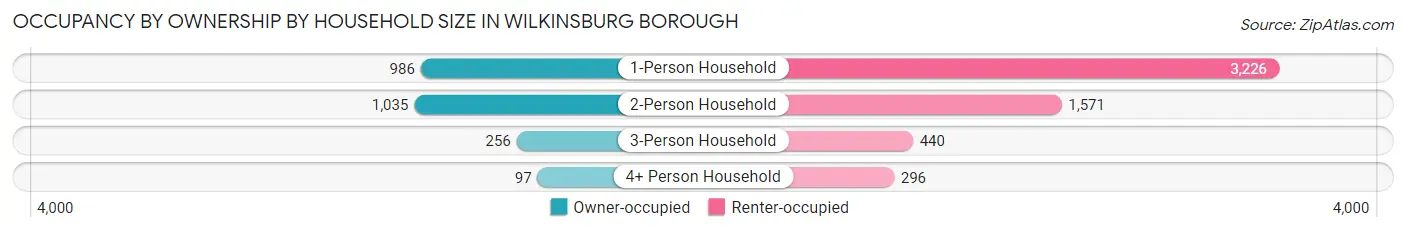
| Household Size | Owner-occupied | Renter-occupied |
| 1-Person Household | 986 (23.4%) | 3,226 (76.6%) |
| 2-Person Household | 1,035 (39.7%) | 1,571 (60.3%) |
| 3-Person Household | 256 (36.8%) | 440 (63.2%) |
| 4+ Person Household | 97 (24.7%) | 296 (75.3%) |
| Total Housing Units | 2,374 (30.0%) | 5,533 (70.0%) |
Occupancy by Educational Attainment in Wilkinsburg borough
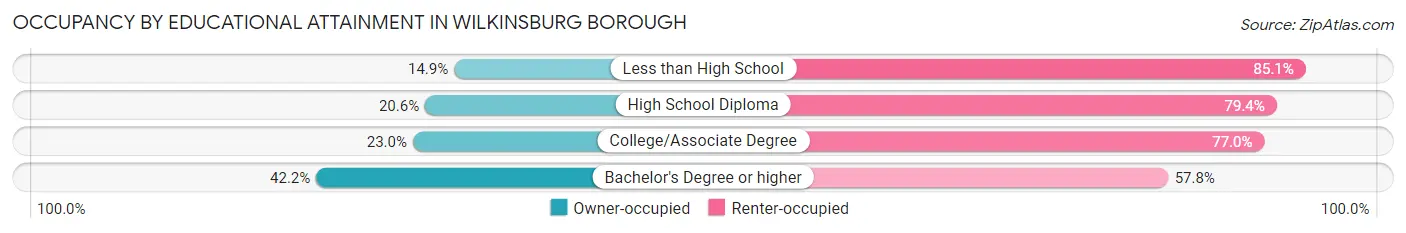
| Household Size | Owner-occupied | Renter-occupied |
| Less than High School | 70 (14.9%) | 401 (85.1%) |
| High School Diploma | 294 (20.6%) | 1,132 (79.4%) |
| College/Associate Degree | 633 (23.0%) | 2,114 (77.0%) |
| Bachelor's Degree or higher | 1,377 (42.2%) | 1,886 (57.8%) |
Occupancy by Age of Householder in Wilkinsburg borough
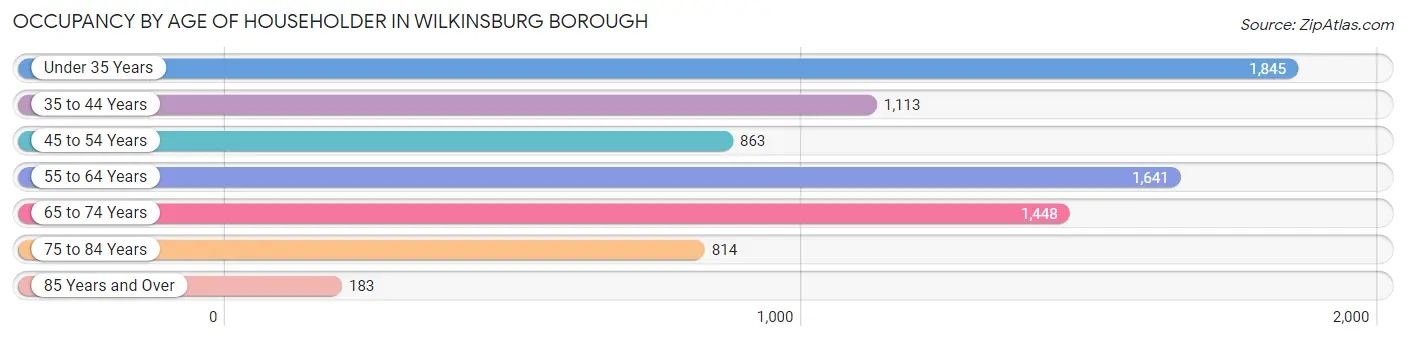
| Age Bracket | # Households | % Households |
| Under 35 Years | 1,845 | 23.3% |
| 35 to 44 Years | 1,113 | 14.1% |
| 45 to 54 Years | 863 | 10.9% |
| 55 to 64 Years | 1,641 | 20.7% |
| 65 to 74 Years | 1,448 | 18.3% |
| 75 to 84 Years | 814 | 10.3% |
| 85 Years and Over | 183 | 2.3% |
| Total | 7,907 | 100.0% |
Housing Finances in Wilkinsburg borough
Median Income by Occupancy in Wilkinsburg borough
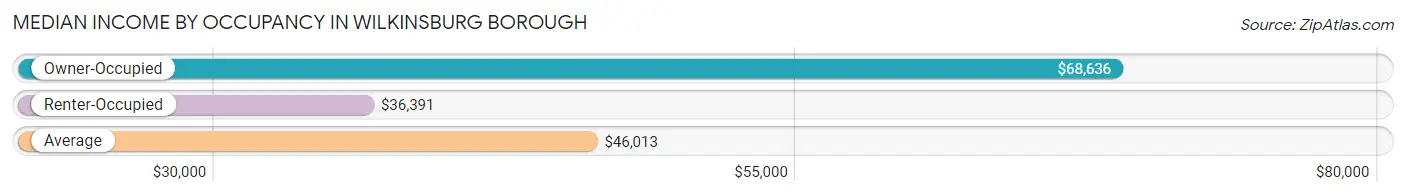
| Occupancy Type | # Households | Median Income |
| Owner-Occupied | 2,374 (30.0%) | $68,636 |
| Renter-Occupied | 5,533 (70.0%) | $36,391 |
| Average | 7,907 (100.0%) | $46,013 |
Occupancy by Householder Income Bracket in Wilkinsburg borough
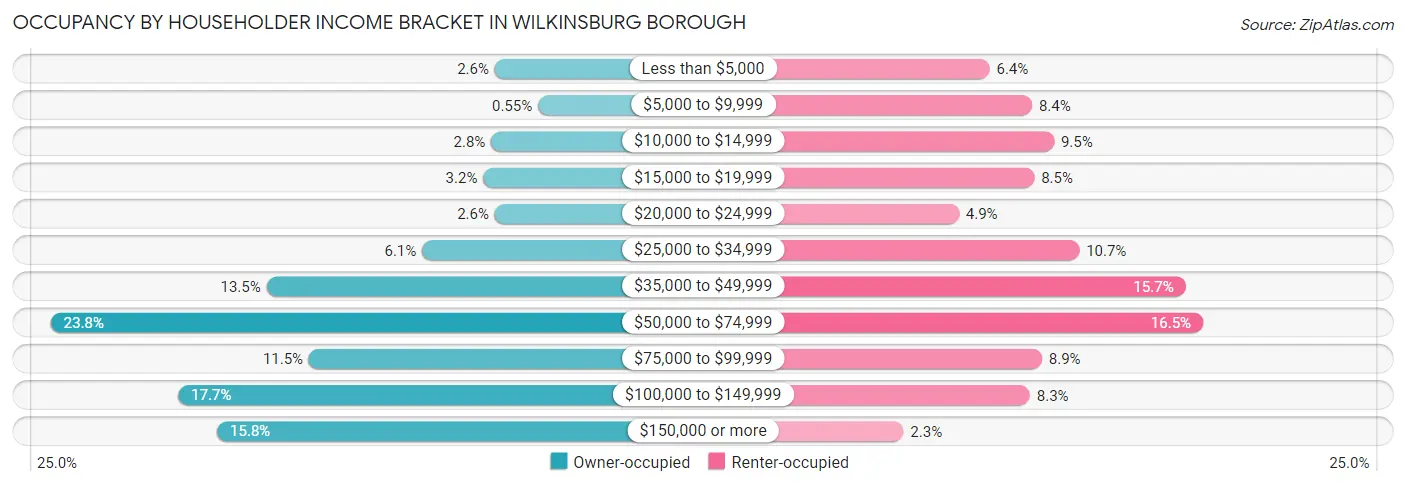
| Income Bracket | Owner-occupied | Renter-occupied |
| Less than $5,000 | 62 (2.6%) | 353 (6.4%) |
| $5,000 to $9,999 | 13 (0.5%) | 465 (8.4%) |
| $10,000 to $14,999 | 66 (2.8%) | 523 (9.5%) |
| $15,000 to $19,999 | 75 (3.2%) | 471 (8.5%) |
| $20,000 to $24,999 | 62 (2.6%) | 272 (4.9%) |
| $25,000 to $34,999 | 144 (6.1%) | 589 (10.6%) |
| $35,000 to $49,999 | 320 (13.5%) | 869 (15.7%) |
| $50,000 to $74,999 | 564 (23.8%) | 915 (16.5%) |
| $75,000 to $99,999 | 272 (11.5%) | 491 (8.9%) |
| $100,000 to $149,999 | 420 (17.7%) | 459 (8.3%) |
| $150,000 or more | 376 (15.8%) | 126 (2.3%) |
| Total | 2,374 (100.0%) | 5,533 (100.0%) |
Monthly Housing Cost Tiers in Wilkinsburg borough
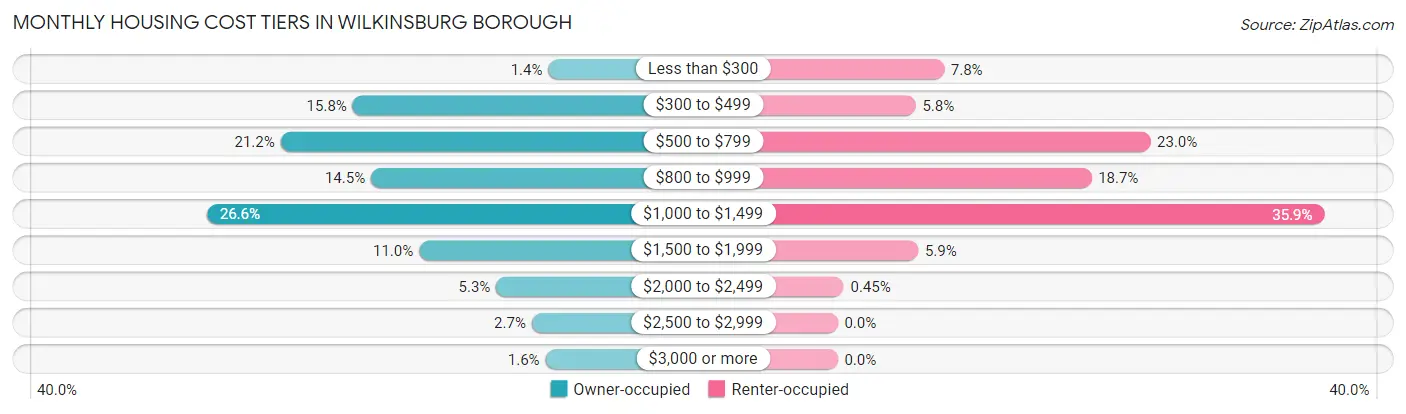
| Monthly Cost | Owner-occupied | Renter-occupied |
| Less than $300 | 34 (1.4%) | 434 (7.8%) |
| $300 to $499 | 376 (15.8%) | 318 (5.8%) |
| $500 to $799 | 502 (21.1%) | 1,274 (23.0%) |
| $800 to $999 | 344 (14.5%) | 1,034 (18.7%) |
| $1,000 to $1,499 | 631 (26.6%) | 1,984 (35.9%) |
| $1,500 to $1,999 | 260 (11.0%) | 328 (5.9%) |
| $2,000 to $2,499 | 125 (5.3%) | 25 (0.4%) |
| $2,500 to $2,999 | 63 (2.6%) | 0 (0.0%) |
| $3,000 or more | 39 (1.6%) | 0 (0.0%) |
| Total | 2,374 (100.0%) | 5,533 (100.0%) |
Physical Housing Characteristics in Wilkinsburg borough
Housing Structures in Wilkinsburg borough
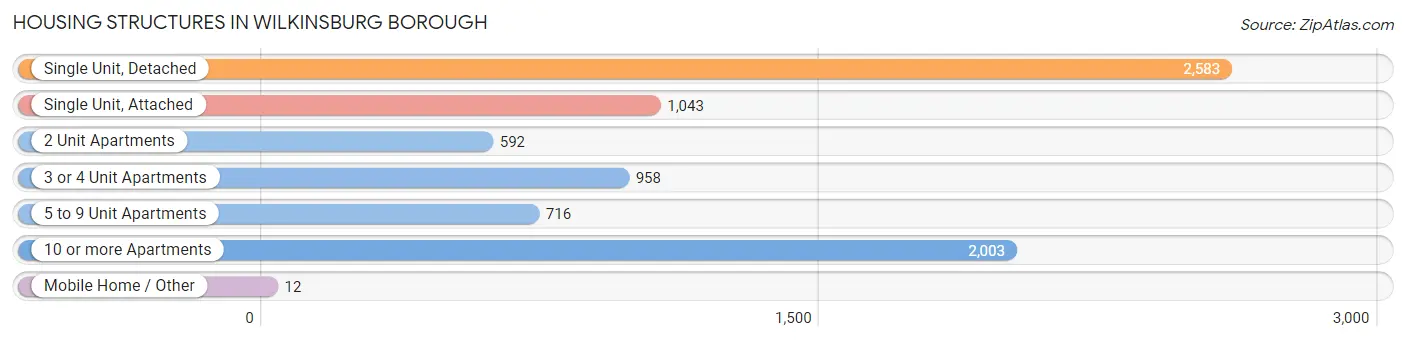
| Structure Type | # Housing Units | % Housing Units |
| Single Unit, Detached | 2,583 | 32.7% |
| Single Unit, Attached | 1,043 | 13.2% |
| 2 Unit Apartments | 592 | 7.5% |
| 3 or 4 Unit Apartments | 958 | 12.1% |
| 5 to 9 Unit Apartments | 716 | 9.1% |
| 10 or more Apartments | 2,003 | 25.3% |
| Mobile Home / Other | 12 | 0.2% |
| Total | 7,907 | 100.0% |
Housing Structures by Occupancy in Wilkinsburg borough
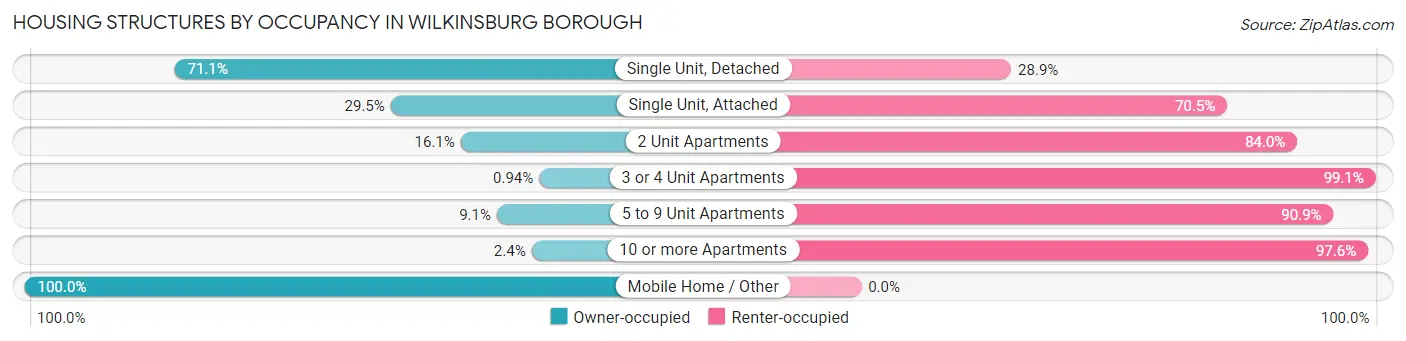
| Structure Type | Owner-occupied | Renter-occupied |
| Single Unit, Detached | 1,837 (71.1%) | 746 (28.9%) |
| Single Unit, Attached | 308 (29.5%) | 735 (70.5%) |
| 2 Unit Apartments | 95 (16.1%) | 497 (84.0%) |
| 3 or 4 Unit Apartments | 9 (0.9%) | 949 (99.1%) |
| 5 to 9 Unit Apartments | 65 (9.1%) | 651 (90.9%) |
| 10 or more Apartments | 48 (2.4%) | 1,955 (97.6%) |
| Mobile Home / Other | 12 (100.0%) | 0 (0.0%) |
| Total | 2,374 (30.0%) | 5,533 (70.0%) |
Housing Structures by Number of Rooms in Wilkinsburg borough
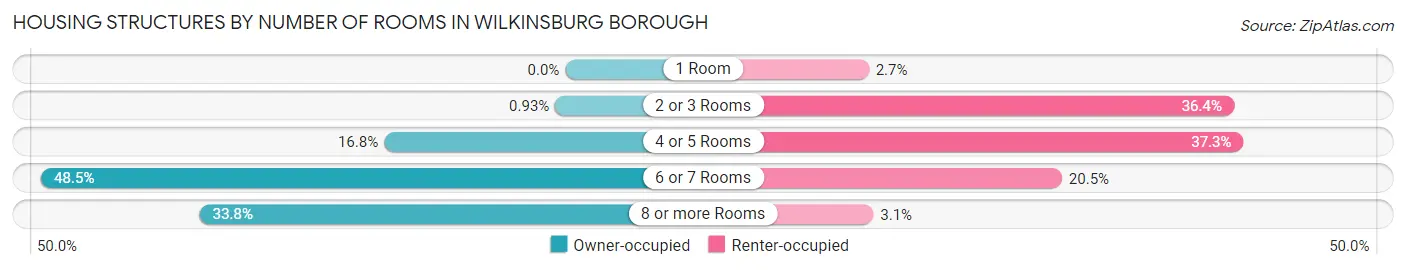
| Number of Rooms | Owner-occupied | Renter-occupied |
| 1 Room | 0 (0.0%) | 147 (2.7%) |
| 2 or 3 Rooms | 22 (0.9%) | 2,015 (36.4%) |
| 4 or 5 Rooms | 398 (16.8%) | 2,064 (37.3%) |
| 6 or 7 Rooms | 1,151 (48.5%) | 1,136 (20.5%) |
| 8 or more Rooms | 803 (33.8%) | 171 (3.1%) |
| Total | 2,374 (100.0%) | 5,533 (100.0%) |
Housing Structure by Heating Type in Wilkinsburg borough
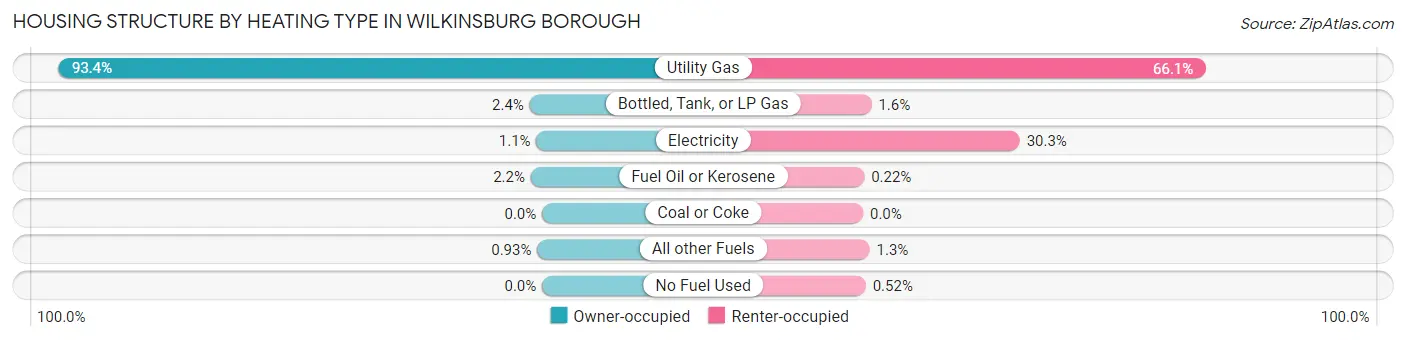
| Heating Type | Owner-occupied | Renter-occupied |
| Utility Gas | 2,217 (93.4%) | 3,657 (66.1%) |
| Bottled, Tank, or LP Gas | 57 (2.4%) | 90 (1.6%) |
| Electricity | 26 (1.1%) | 1,675 (30.3%) |
| Fuel Oil or Kerosene | 52 (2.2%) | 12 (0.2%) |
| Coal or Coke | 0 (0.0%) | 0 (0.0%) |
| All other Fuels | 22 (0.9%) | 70 (1.3%) |
| No Fuel Used | 0 (0.0%) | 29 (0.5%) |
| Total | 2,374 (100.0%) | 5,533 (100.0%) |
Household Vehicle Usage in Wilkinsburg borough
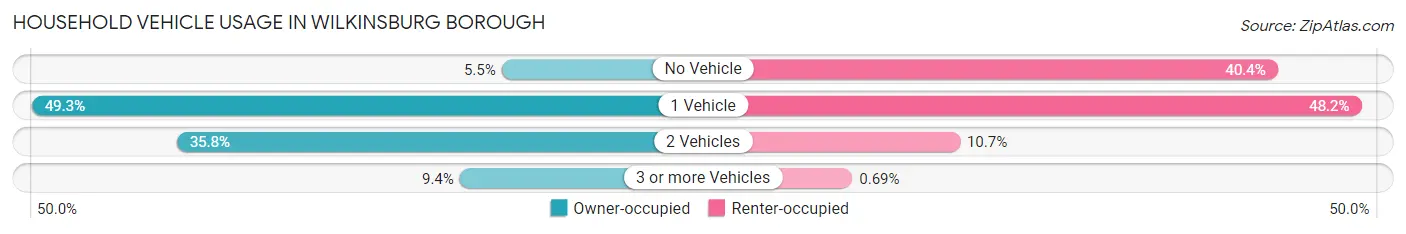
| Vehicles per Household | Owner-occupied | Renter-occupied |
| No Vehicle | 130 (5.5%) | 2,234 (40.4%) |
| 1 Vehicle | 1,171 (49.3%) | 2,667 (48.2%) |
| 2 Vehicles | 850 (35.8%) | 594 (10.7%) |
| 3 or more Vehicles | 223 (9.4%) | 38 (0.7%) |
| Total | 2,374 (100.0%) | 5,533 (100.0%) |
Real Estate & Mortgages in Wilkinsburg borough
Real Estate and Mortgage Overview in Wilkinsburg borough
| Characteristic | Without Mortgage | With Mortgage |
| Housing Units | 1,230 | 1,144 |
| Median Property Value | $100,800 | $155,500 |
| Median Household Income | $58,676 | $261 |
| Monthly Housing Costs | $648 | $25 |
| Real Estate Taxes | $2,405 | $8 |
Property Value by Mortgage Status in Wilkinsburg borough
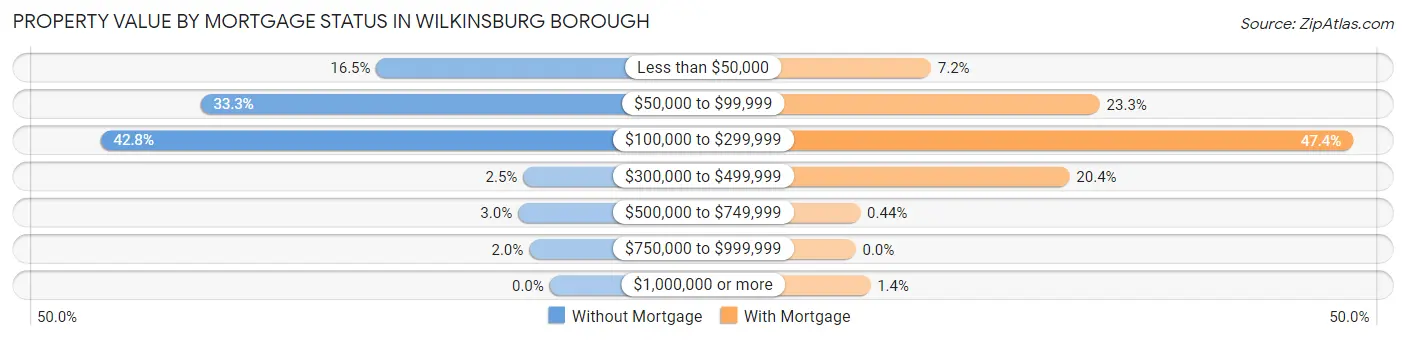
| Property Value | Without Mortgage | With Mortgage |
| Less than $50,000 | 203 (16.5%) | 82 (7.2%) |
| $50,000 to $99,999 | 409 (33.3%) | 266 (23.3%) |
| $100,000 to $299,999 | 526 (42.8%) | 542 (47.4%) |
| $300,000 to $499,999 | 31 (2.5%) | 233 (20.4%) |
| $500,000 to $749,999 | 37 (3.0%) | 5 (0.4%) |
| $750,000 to $999,999 | 24 (1.9%) | 0 (0.0%) |
| $1,000,000 or more | 0 (0.0%) | 16 (1.4%) |
| Total | 1,230 (100.0%) | 1,144 (100.0%) |
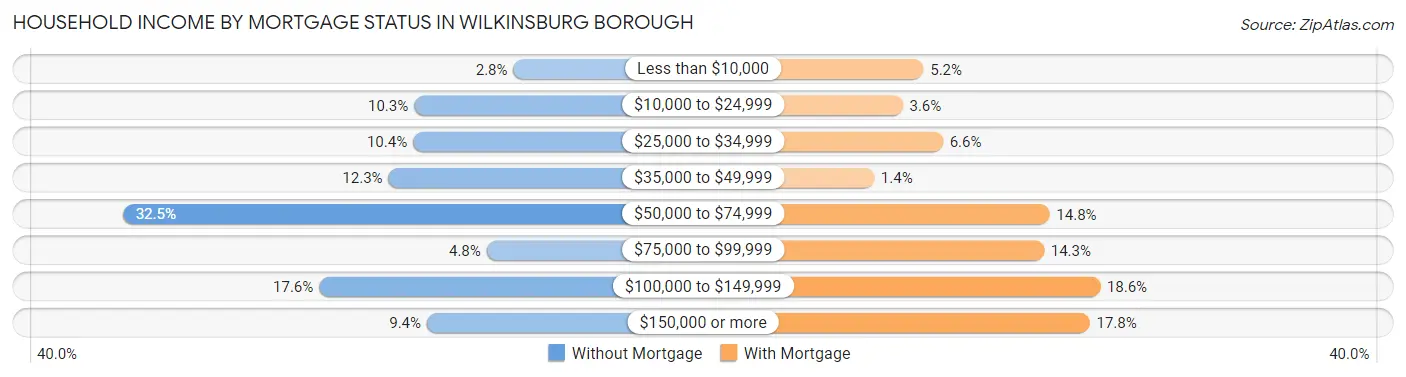
Household Income by Mortgage Status in Wilkinsburg borough
| Household Income | Without Mortgage | With Mortgage |
| Less than $10,000 | 34 (2.8%) | 59 (5.2%) |
| $10,000 to $24,999 | 127 (10.3%) | 41 (3.6%) |
| $25,000 to $34,999 | 128 (10.4%) | 76 (6.6%) |
| $35,000 to $49,999 | 151 (12.3%) | 16 (1.4%) |
| $50,000 to $74,999 | 400 (32.5%) | 169 (14.8%) |
| $75,000 to $99,999 | 59 (4.8%) | 164 (14.3%) |
| $100,000 to $149,999 | 216 (17.6%) | 213 (18.6%) |
| $150,000 or more | 115 (9.3%) | 204 (17.8%) |
| Total | 1,230 (100.0%) | 1,144 (100.0%) |
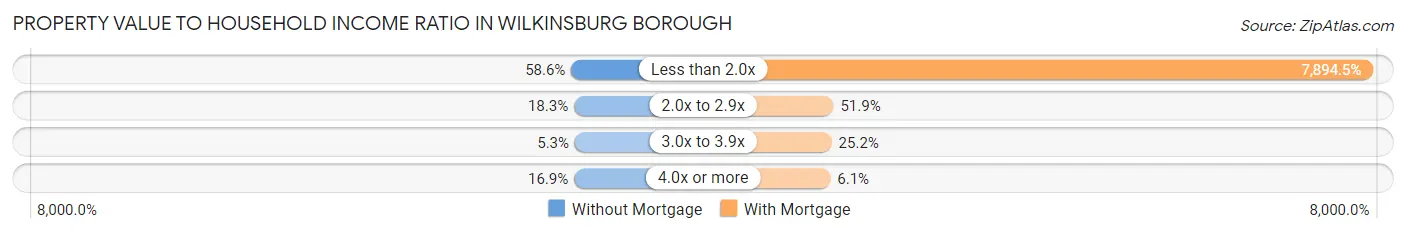
Property Value to Household Income Ratio in Wilkinsburg borough
| Value-to-Income Ratio | Without Mortgage | With Mortgage |
| Less than 2.0x | 721 (58.6%) | 90,313 (7,894.5%) |
| 2.0x to 2.9x | 225 (18.3%) | 594 (51.9%) |
| 3.0x to 3.9x | 65 (5.3%) | 288 (25.2%) |
| 4.0x or more | 208 (16.9%) | 70 (6.1%) |
| Total | 1,230 (100.0%) | 1,144 (100.0%) |
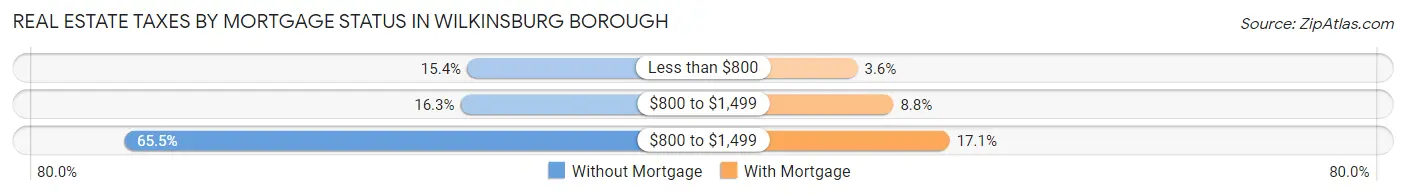
Real Estate Taxes by Mortgage Status in Wilkinsburg borough
| Property Taxes | Without Mortgage | With Mortgage |
| Less than $800 | 189 (15.4%) | 41 (3.6%) |
| $800 to $1,499 | 201 (16.3%) | 101 (8.8%) |
| $800 to $1,499 | 805 (65.4%) | 195 (17.1%) |
| Total | 1,230 (100.0%) | 1,144 (100.0%) |
Health & Disability in Wilkinsburg borough
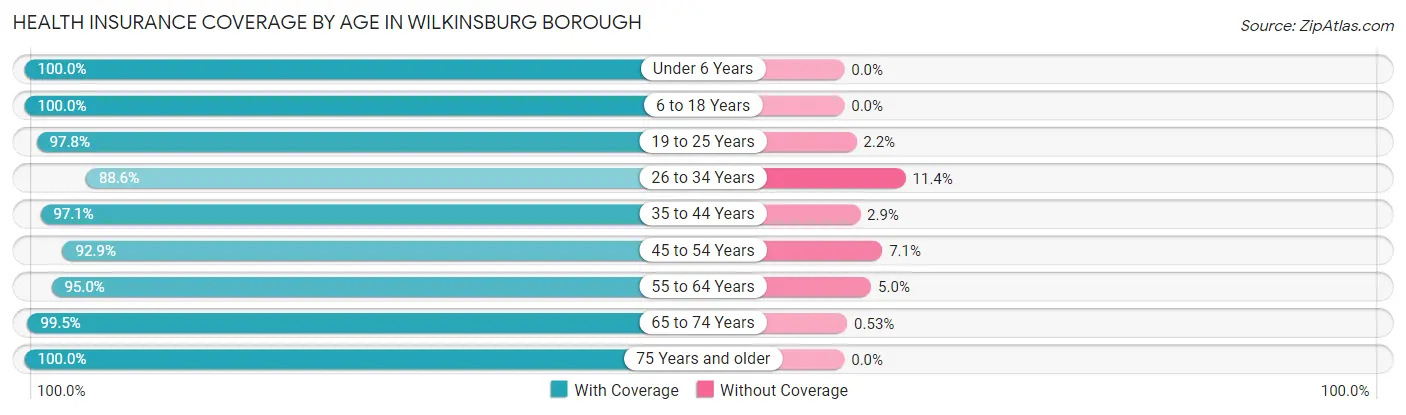
Health Insurance Coverage by Age in Wilkinsburg borough
| Age Bracket | With Coverage | Without Coverage |
| Under 6 Years | 584 (100.0%) | 0 (0.0%) |
| 6 to 18 Years | 1,846 (100.0%) | 0 (0.0%) |
| 19 to 25 Years | 1,002 (97.8%) | 23 (2.2%) |
| 26 to 34 Years | 2,178 (88.6%) | 281 (11.4%) |
| 35 to 44 Years | 1,516 (97.1%) | 46 (2.9%) |
| 45 to 54 Years | 1,286 (92.9%) | 98 (7.1%) |
| 55 to 64 Years | 2,163 (95.0%) | 114 (5.0%) |
| 65 to 74 Years | 1,866 (99.5%) | 10 (0.5%) |
| 75 Years and older | 1,235 (100.0%) | 0 (0.0%) |
| Total | 13,676 (96.0%) | 572 (4.0%) |
Health Insurance Coverage by Citizenship Status in Wilkinsburg borough
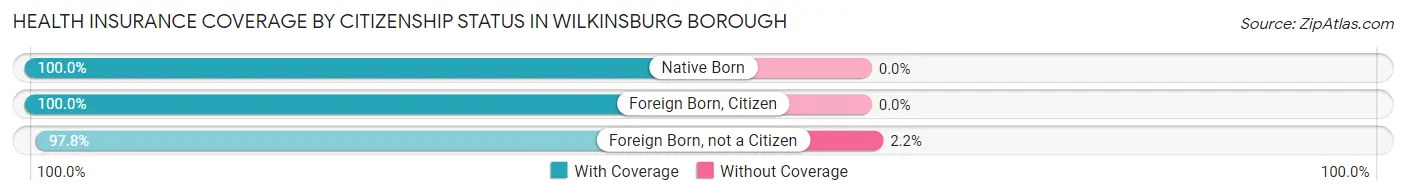
| Citizenship Status | With Coverage | Without Coverage |
| Native Born | 584 (100.0%) | 0 (0.0%) |
| Foreign Born, Citizen | 1,846 (100.0%) | 0 (0.0%) |
| Foreign Born, not a Citizen | 1,002 (97.8%) | 23 (2.2%) |
Health Insurance Coverage by Household Income in Wilkinsburg borough
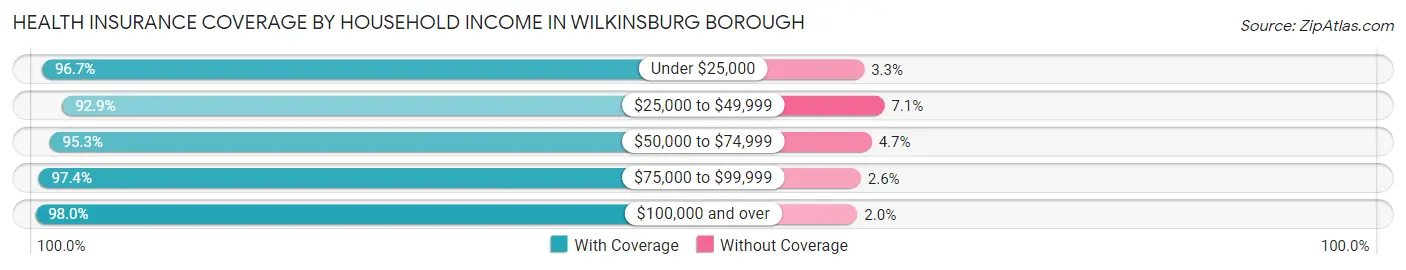
| Household Income | With Coverage | Without Coverage |
| Under $25,000 | 3,744 (96.7%) | 126 (3.3%) |
| $25,000 to $49,999 | 2,910 (92.9%) | 221 (7.1%) |
| $50,000 to $74,999 | 2,530 (95.3%) | 124 (4.7%) |
| $75,000 to $99,999 | 1,665 (97.4%) | 45 (2.6%) |
| $100,000 and over | 2,754 (98.0%) | 56 (2.0%) |
Public vs Private Health Insurance Coverage by Age in Wilkinsburg borough
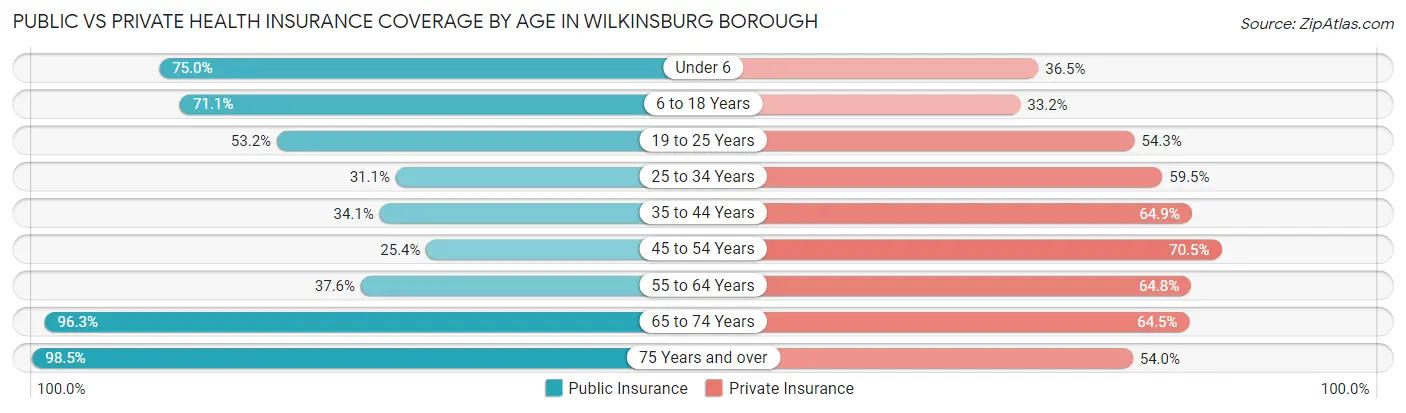
| Age Bracket | Public Insurance | Private Insurance |
| Under 6 | 438 (75.0%) | 213 (36.5%) |
| 6 to 18 Years | 1,313 (71.1%) | 612 (33.2%) |
| 19 to 25 Years | 545 (53.2%) | 557 (54.3%) |
| 25 to 34 Years | 765 (31.1%) | 1,463 (59.5%) |
| 35 to 44 Years | 533 (34.1%) | 1,014 (64.9%) |
| 45 to 54 Years | 352 (25.4%) | 975 (70.5%) |
| 55 to 64 Years | 856 (37.6%) | 1,476 (64.8%) |
| 65 to 74 Years | 1,806 (96.3%) | 1,210 (64.5%) |
| 75 Years and over | 1,217 (98.5%) | 667 (54.0%) |
| Total | 7,825 (54.9%) | 8,187 (57.5%) |
Disability Status by Sex by Age in Wilkinsburg borough
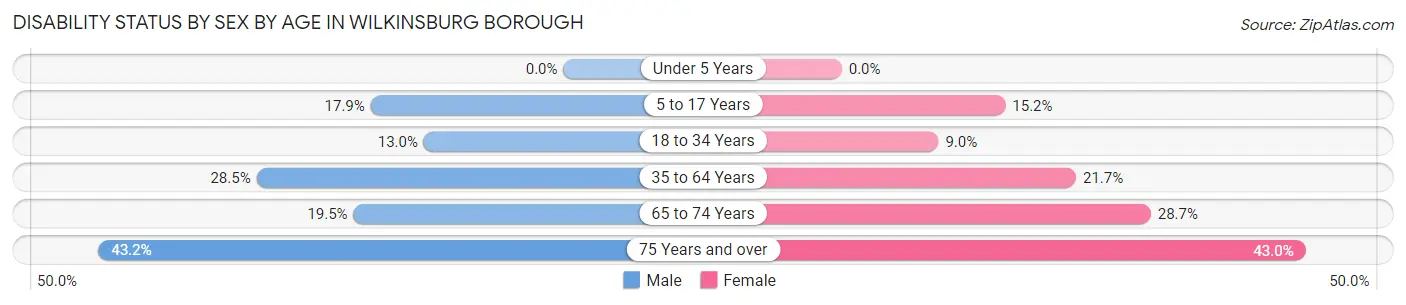
| Age Bracket | Male | Female |
| Under 5 Years | 0 (0.0%) | 0 (0.0%) |
| 5 to 17 Years | 119 (17.9%) | 155 (15.2%) |
| 18 to 34 Years | 227 (13.0%) | 175 (9.0%) |
| 35 to 64 Years | 632 (28.5%) | 653 (21.7%) |
| 65 to 74 Years | 127 (19.5%) | 351 (28.7%) |
| 75 Years and over | 183 (43.2%) | 349 (43.0%) |
Disability Class by Sex by Age in Wilkinsburg borough
Disability Class: Hearing Difficulty
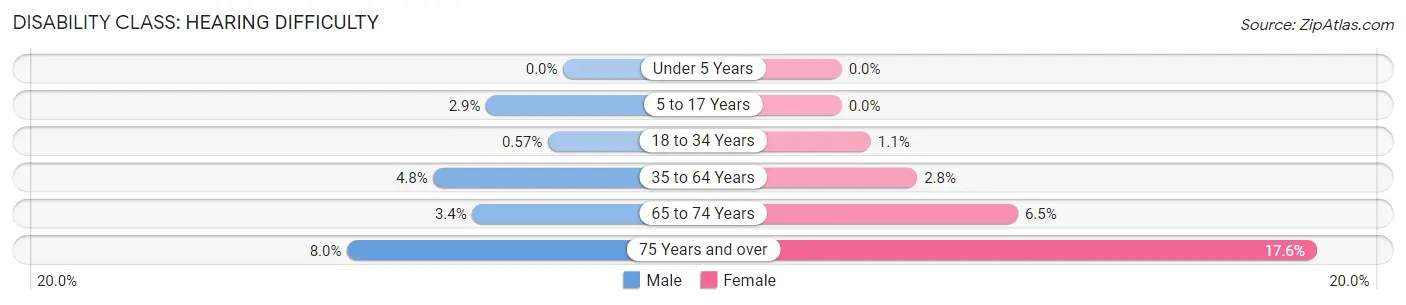
| Age Bracket | Male | Female |
| Under 5 Years | 0 (0.0%) | 0 (0.0%) |
| 5 to 17 Years | 19 (2.9%) | 0 (0.0%) |
| 18 to 34 Years | 10 (0.6%) | 21 (1.1%) |
| 35 to 64 Years | 107 (4.8%) | 84 (2.8%) |
| 65 to 74 Years | 22 (3.4%) | 80 (6.5%) |
| 75 Years and over | 34 (8.0%) | 143 (17.6%) |
Disability Class: Vision Difficulty
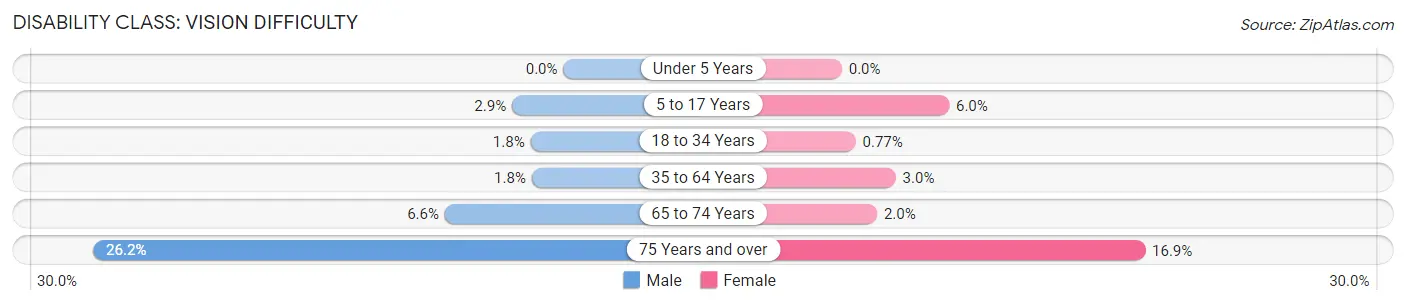
| Age Bracket | Male | Female |
| Under 5 Years | 0 (0.0%) | 0 (0.0%) |
| 5 to 17 Years | 19 (2.9%) | 61 (6.0%) |
| 18 to 34 Years | 32 (1.8%) | 15 (0.8%) |
| 35 to 64 Years | 39 (1.8%) | 90 (3.0%) |
| 65 to 74 Years | 43 (6.6%) | 24 (2.0%) |
| 75 Years and over | 111 (26.2%) | 137 (16.9%) |
Disability Class: Cognitive Difficulty
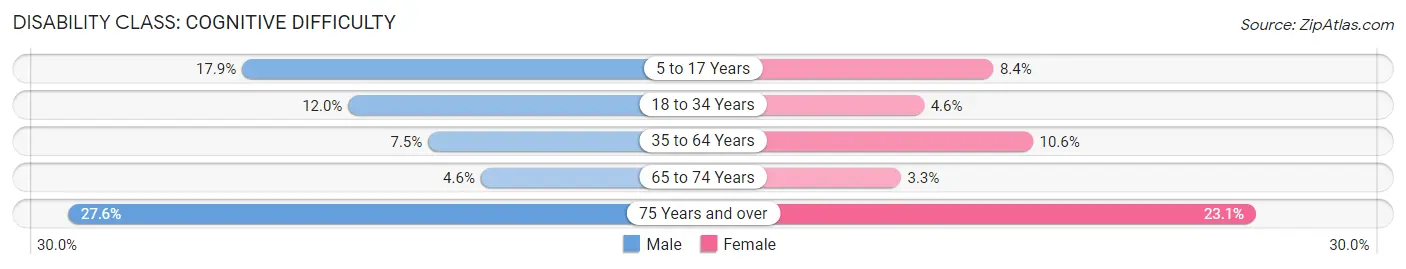
| Age Bracket | Male | Female |
| 5 to 17 Years | 119 (17.9%) | 86 (8.4%) |
| 18 to 34 Years | 210 (12.0%) | 89 (4.6%) |
| 35 to 64 Years | 167 (7.5%) | 319 (10.6%) |
| 65 to 74 Years | 30 (4.6%) | 40 (3.3%) |
| 75 Years and over | 117 (27.6%) | 187 (23.1%) |
Disability Class: Ambulatory Difficulty
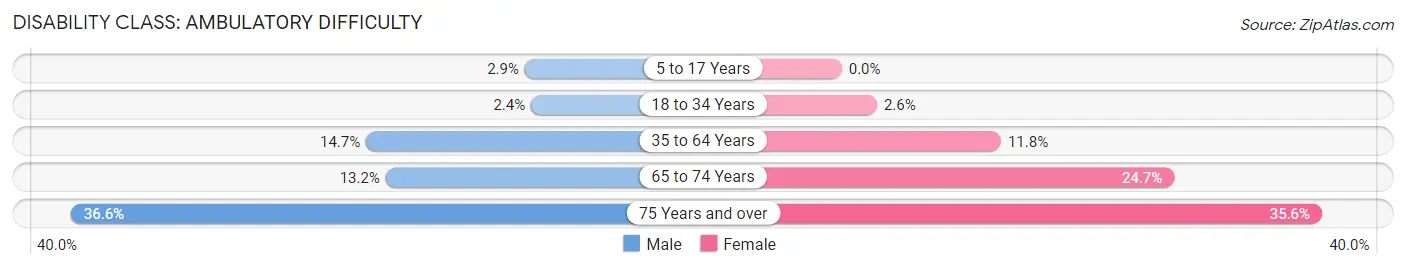
| Age Bracket | Male | Female |
| 5 to 17 Years | 19 (2.9%) | 0 (0.0%) |
| 18 to 34 Years | 42 (2.4%) | 51 (2.6%) |
| 35 to 64 Years | 325 (14.6%) | 355 (11.8%) |
| 65 to 74 Years | 86 (13.2%) | 302 (24.7%) |
| 75 Years and over | 155 (36.6%) | 289 (35.6%) |
Disability Class: Self-Care Difficulty
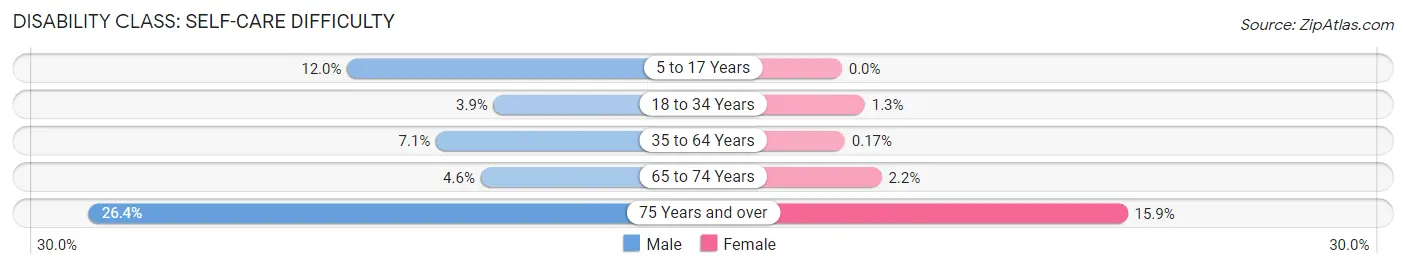
| Age Bracket | Male | Female |
| 5 to 17 Years | 80 (12.0%) | 0 (0.0%) |
| 18 to 34 Years | 68 (3.9%) | 25 (1.3%) |
| 35 to 64 Years | 157 (7.1%) | 5 (0.2%) |
| 65 to 74 Years | 30 (4.6%) | 27 (2.2%) |
| 75 Years and over | 112 (26.4%) | 129 (15.9%) |
Technology Access in Wilkinsburg borough
Computing Device Access in Wilkinsburg borough
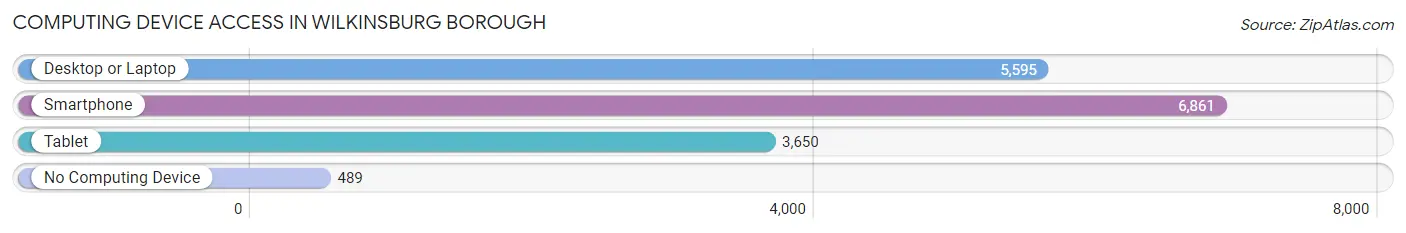
| Device Type | # Households | % Households |
| Desktop or Laptop | 5,595 | 70.8% |
| Smartphone | 6,861 | 86.8% |
| Tablet | 3,650 | 46.2% |
| No Computing Device | 489 | 6.2% |
| Total | 7,907 | 100.0% |
Internet Access in Wilkinsburg borough
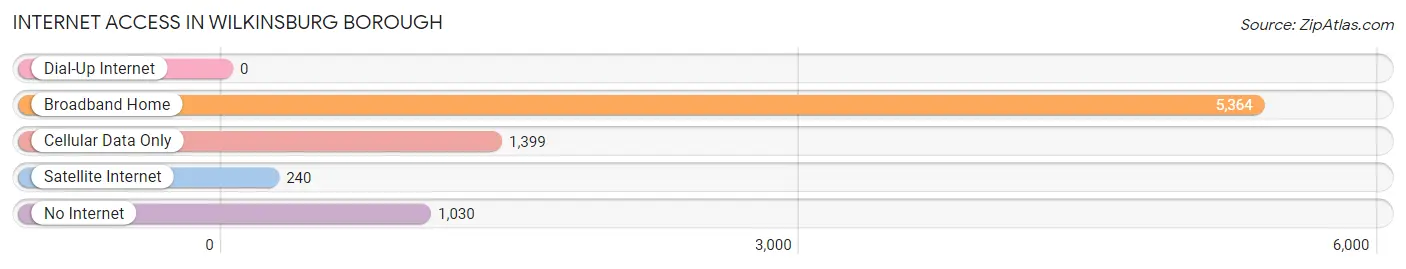
| Internet Type | # Households | % Households |
| Dial-Up Internet | 0 | 0.0% |
| Broadband Home | 5,364 | 67.8% |
| Cellular Data Only | 1,399 | 17.7% |
| Satellite Internet | 240 | 3.0% |
| No Internet | 1,030 | 13.0% |
| Total | 7,907 | 100.0% |
Wilkinsburg borough Summary
Wilkinsburg Borough is a small borough located in Allegheny County, Pennsylvania. It is situated just east of the City of Pittsburgh and is part of the Pittsburgh metropolitan area. The borough has a population of 15,930 as of the 2010 census, making it the second-smallest borough in Allegheny County. Wilkinsburg is a diverse community with a rich history and a vibrant culture.
History
Wilkinsburg was founded in 1887 by John Wilkins, Jr., a prominent Pittsburgh businessman. The borough was named after him and was incorporated in 1895. Wilkinsburg was originally a rural farming community, but it quickly grew into a bustling industrial center. The borough was home to several steel mills, coal mines, and other industries. The population of Wilkinsburg grew rapidly in the early 20th century, reaching a peak of nearly 30,000 in the 1950s.
The borough experienced a decline in the late 20th century as the steel industry declined and many of the factories and businesses closed. The population of Wilkinsburg decreased significantly, and the borough became known for its poverty and crime. In recent years, Wilkinsburg has seen a resurgence in population and economic activity. The borough has become a popular destination for young professionals and families looking for affordable housing and a diverse community.
Geography
Wilkinsburg is located in Allegheny County, Pennsylvania, just east of the City of Pittsburgh. The borough is situated on the Allegheny Plateau, and the terrain is mostly flat. The borough is bordered by the boroughs of Edgewood, Swissvale, and Penn Hills, as well as the City of Pittsburgh. Wilkinsburg is located in the Monongahela River watershed and is home to several creeks, including Turtle Creek, which runs through the borough.
Economy
Wilkinsburg’s economy is largely based on service industries, retail, and light manufacturing. The borough is home to several small businesses, including restaurants, shops, and professional services. Wilkinsburg is also home to several large employers, including UPMC, Highmark, and the University of Pittsburgh Medical Center. The borough is also home to several industrial parks, which provide jobs in manufacturing and other industries.
Demographics
As of the 2010 census, Wilkinsburg had a population of 15,930. The population is racially and ethnically diverse, with African Americans making up the largest racial group at 44.3%. The second-largest racial group is White at 37.3%, followed by Hispanic or Latino at 8.3%. The median household income in Wilkinsburg is $30,945, and the median age is 36.7.
Wilkinsburg is a vibrant and diverse community with a rich history and a bright future. The borough has experienced a resurgence in recent years, and it is becoming an increasingly popular destination for young professionals and families looking for affordable housing and a diverse community. Wilkinsburg is a great place to live, work, and play, and it is sure to continue to grow and thrive in the years to come.
Common Questions
What is the Total Population of Wilkinsburg borough?
Total Population of Wilkinsburg borough is 14,340.
What is the Total Male Population of Wilkinsburg borough?
Total Male Population of Wilkinsburg borough is 5,998.
What is the Total Female Population of Wilkinsburg borough?
Total Female Population of Wilkinsburg borough is 8,342.
What is the Ratio of Males per 100 Females in Wilkinsburg borough?
There are 71.90 Males per 100 Females in Wilkinsburg borough.
What is the Ratio of Females per 100 Males in Wilkinsburg borough?
There are 139.08 Females per 100 Males in Wilkinsburg borough.
What is the Median Population Age in Wilkinsburg borough?
Median Population Age in Wilkinsburg borough is 44.1 Years.
What is the Average Family Size in Wilkinsburg borough
Average Family Size in Wilkinsburg borough is 2.8 People.
What is the Average Household Size in Wilkinsburg borough
Average Household Size in Wilkinsburg borough is 1.8 People.
What is Per Capita Income in Wilkinsburg borough?
Per Capita income in Wilkinsburg borough is $35,482.
What is the Median Family Income in Wilkinsburg borough?
Median Family Income in Wilkinsburg borough is $56,277.
What is the Median Household income in Wilkinsburg borough?
Median Household Income in Wilkinsburg borough is $46,013.
What is Income or Wage Gap in Wilkinsburg borough?
Income or Wage Gap in Wilkinsburg borough is 18.3%.
Women in Wilkinsburg borough earn 81.7 cents for every dollar earned by a man.
What is Inequality or Gini Index in Wilkinsburg borough?
Inequality or Gini Index in Wilkinsburg borough is 0.48.
How Large is the Labor Force in Wilkinsburg borough?
There are 7,404 People in the Labor Forcein in Wilkinsburg borough.
What is the Percentage of People in the Labor Force in Wilkinsburg borough?
59.9% of People are in the Labor Force in Wilkinsburg borough.
What is the Unemployment Rate in Wilkinsburg borough?
Unemployment Rate in Wilkinsburg borough is 8.5%.