Trafford borough, PA
Trafford borough Overview
3,237
TOTAL POPULATION
1,480
MALE POPULATION
1,757
FEMALE POPULATION
84.23
MALES / 100 FEMALES
118.72
FEMALES / 100 MALES
38.3
MEDIAN AGE
2.9
AVG FAMILY SIZE
2.3
AVG HOUSEHOLD SIZE
$29,597
PER CAPITA INCOME
$61,836
AVG FAMILY INCOME
$57,450
AVG HOUSEHOLD INCOME
30.6%
WAGE / INCOME GAP [ % ]
69.4¢/ $1
WAGE / INCOME GAP [ $ ]
0.38
INEQUALITY / GINI INDEX
1,536
LABOR FORCE [ PEOPLE ]
59.3%
PERCENT IN LABOR FORCE
4.5%
UNEMPLOYMENT RATE
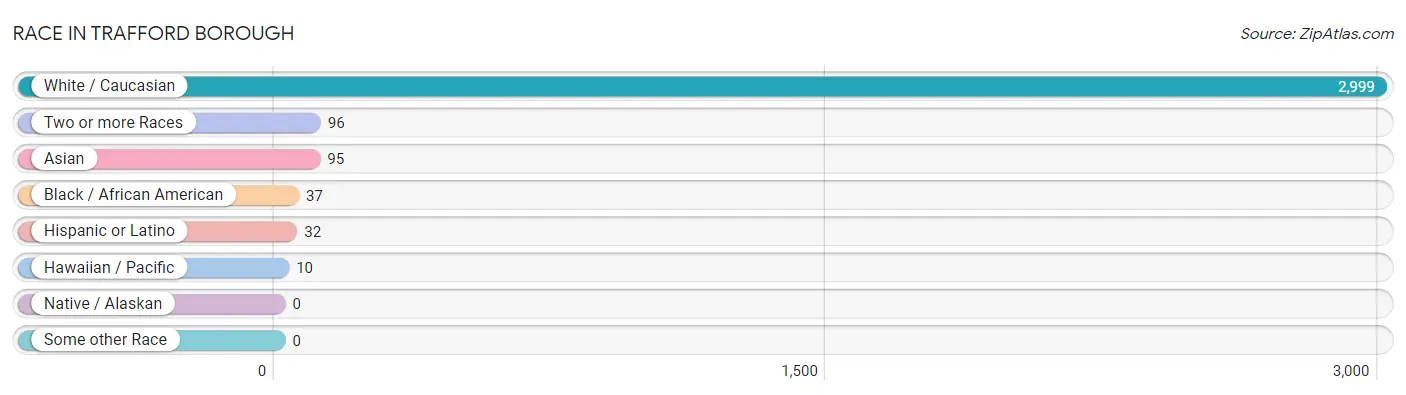
Race in Trafford borough
The most populous races in Trafford borough are White / Caucasian (2,999 | 92.6%), Two or more Races (96 | 3.0%), and Asian (95 | 2.9%).
| Race | # Population | % Population |
| Asian | 95 | 2.9% |
| Black / African American | 37 | 1.1% |
| Hawaiian / Pacific | 10 | 0.3% |
| Hispanic or Latino | 32 | 1.0% |
| Native / Alaskan | 0 | 0.0% |
| White / Caucasian | 2,999 | 92.6% |
| Two or more Races | 96 | 3.0% |
| Some other Race | 0 | 0.0% |
| Total | 3,237 | 100.0% |
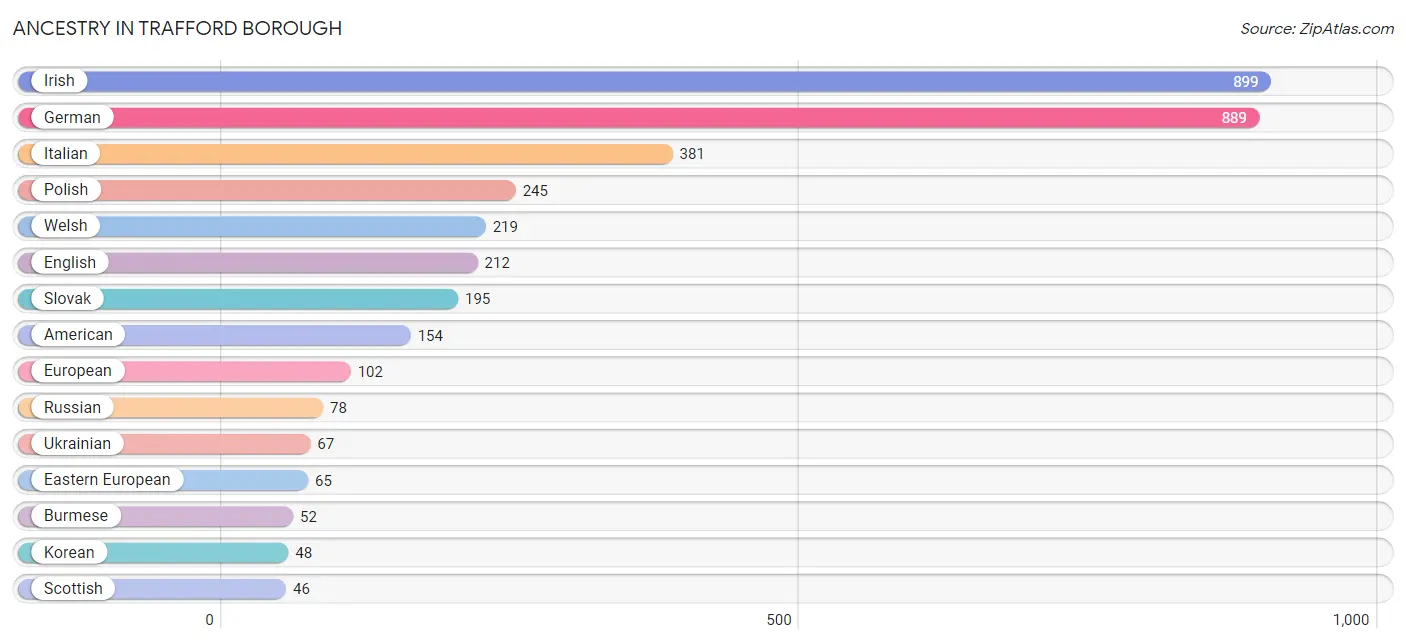
Ancestry in Trafford borough
The most populous ancestries reported in Trafford borough are Irish (899 | 27.8%), German (889 | 27.5%), Italian (381 | 11.8%), Polish (245 | 7.6%), and Welsh (219 | 6.8%), together accounting for 81.3% of all Trafford borough residents.
| Ancestry | # Population | % Population |
| American | 154 | 4.8% |
| Apache | 6 | 0.2% |
| Arab | 16 | 0.5% |
| Bhutanese | 8 | 0.3% |
| British | 8 | 0.3% |
| Burmese | 52 | 1.6% |
| Croatian | 44 | 1.4% |
| Czech | 12 | 0.4% |
| Dutch | 10 | 0.3% |
| Eastern European | 65 | 2.0% |
| English | 212 | 6.6% |
| European | 102 | 3.2% |
| German | 889 | 27.5% |
| Ghanaian | 17 | 0.5% |
| Greek | 9 | 0.3% |
| Guamanian / Chamorro | 10 | 0.3% |
| Hungarian | 23 | 0.7% |
| Irish | 899 | 27.8% |
| Italian | 381 | 11.8% |
| Korean | 48 | 1.5% |
| Lebanese | 9 | 0.3% |
| Mexican | 9 | 0.3% |
| Pennsylvania German | 21 | 0.6% |
| Polish | 245 | 7.6% |
| Romanian | 15 | 0.5% |
| Russian | 78 | 2.4% |
| Scandinavian | 11 | 0.3% |
| Scotch-Irish | 20 | 0.6% |
| Scottish | 46 | 1.4% |
| Serbian | 41 | 1.3% |
| Slavic | 32 | 1.0% |
| Slovak | 195 | 6.0% |
| Slovene | 8 | 0.3% |
| Spaniard | 4 | 0.1% |
| Subsaharan African | 17 | 0.5% |
| Swedish | 12 | 0.4% |
| Syrian | 7 | 0.2% |
| Ukrainian | 67 | 2.1% |
| Welsh | 219 | 6.8% |
| Yugoslavian | 7 | 0.2% | View All 40 Rows |
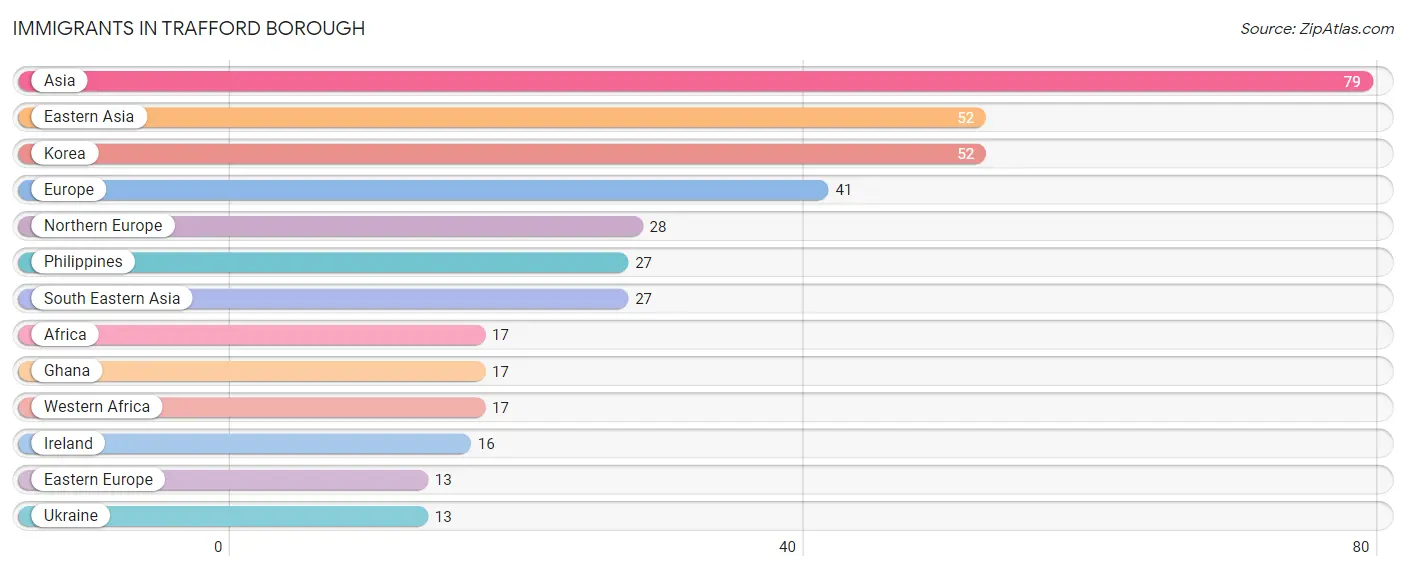
Immigrants in Trafford borough
The most numerous immigrant groups reported in Trafford borough came from Asia (79 | 2.4%), Eastern Asia (52 | 1.6%), Korea (52 | 1.6%), Europe (41 | 1.3%), and Northern Europe (28 | 0.9%), together accounting for 7.8% of all Trafford borough residents.
| Immigration Origin | # Population | % Population |
| Africa | 17 | 0.5% |
| Asia | 79 | 2.4% |
| Eastern Asia | 52 | 1.6% |
| Eastern Europe | 13 | 0.4% |
| Europe | 41 | 1.3% |
| Ghana | 17 | 0.5% |
| Ireland | 16 | 0.5% |
| Korea | 52 | 1.6% |
| Northern Europe | 28 | 0.9% |
| Philippines | 27 | 0.8% |
| South Eastern Asia | 27 | 0.8% |
| Ukraine | 13 | 0.4% |
| Western Africa | 17 | 0.5% | View All 13 Rows |
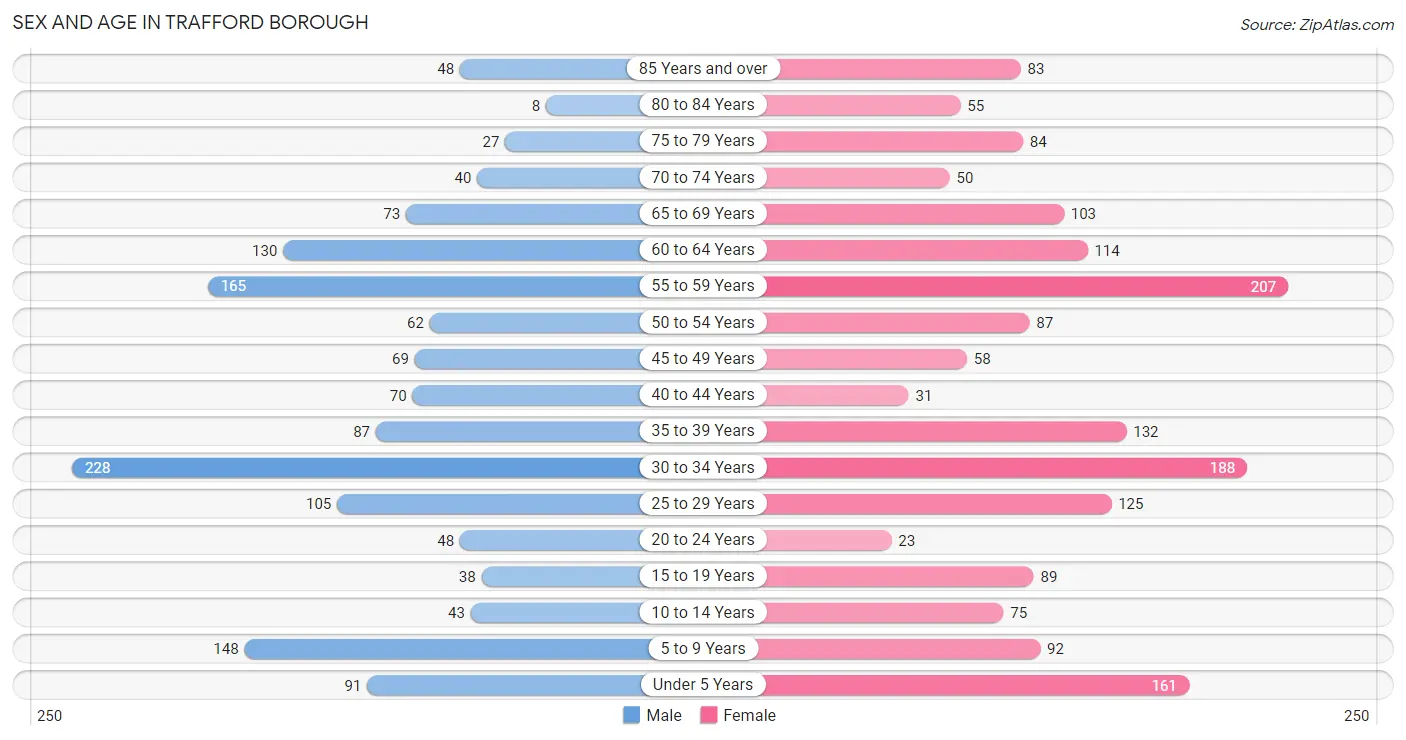
Sex and Age in Trafford borough
Sex and Age in Trafford borough
The most populous age groups in Trafford borough are 30 to 34 Years (228 | 15.4%) for men and 55 to 59 Years (207 | 11.8%) for women.
| Age Bracket | Male | Female |
| Under 5 Years | 91 (6.1%) | 161 (9.2%) |
| 5 to 9 Years | 148 (10.0%) | 92 (5.2%) |
| 10 to 14 Years | 43 (2.9%) | 75 (4.3%) |
| 15 to 19 Years | 38 (2.6%) | 89 (5.1%) |
| 20 to 24 Years | 48 (3.2%) | 23 (1.3%) |
| 25 to 29 Years | 105 (7.1%) | 125 (7.1%) |
| 30 to 34 Years | 228 (15.4%) | 188 (10.7%) |
| 35 to 39 Years | 87 (5.9%) | 132 (7.5%) |
| 40 to 44 Years | 70 (4.7%) | 31 (1.8%) |
| 45 to 49 Years | 69 (4.7%) | 58 (3.3%) |
| 50 to 54 Years | 62 (4.2%) | 87 (5.0%) |
| 55 to 59 Years | 165 (11.2%) | 207 (11.8%) |
| 60 to 64 Years | 130 (8.8%) | 114 (6.5%) |
| 65 to 69 Years | 73 (4.9%) | 103 (5.9%) |
| 70 to 74 Years | 40 (2.7%) | 50 (2.9%) |
| 75 to 79 Years | 27 (1.8%) | 84 (4.8%) |
| 80 to 84 Years | 8 (0.5%) | 55 (3.1%) |
| 85 Years and over | 48 (3.2%) | 83 (4.7%) |
| Total | 1,480 (100.0%) | 1,757 (100.0%) |
Families and Households in Trafford borough
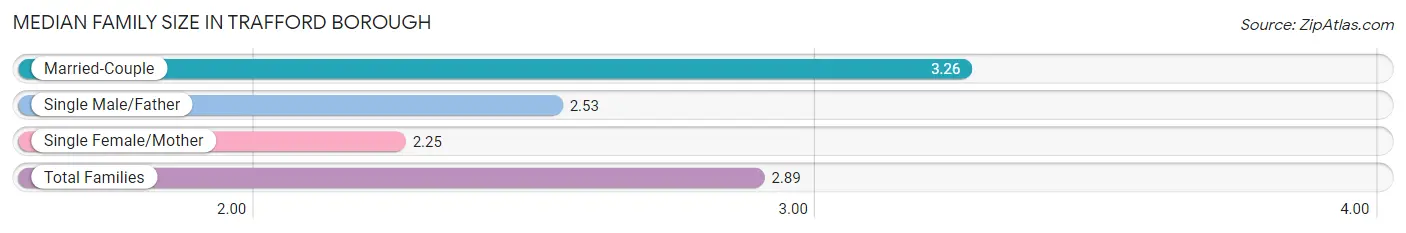
Median Family Size in Trafford borough
The median family size in Trafford borough is 2.89 persons per family, with married-couple families (536 | 61.5%) accounting for the largest median family size of 3.26 persons per family. On the other hand, single female/mother families (273 | 31.3%) represent the smallest median family size with 2.25 persons per family.
| Family Type | # Families | Family Size |
| Married-Couple | 536 (61.5%) | 3.26 |
| Single Male/Father | 62 (7.1%) | 2.53 |
| Single Female/Mother | 273 (31.3%) | 2.25 |
| Total Families | 871 (100.0%) | 2.89 |
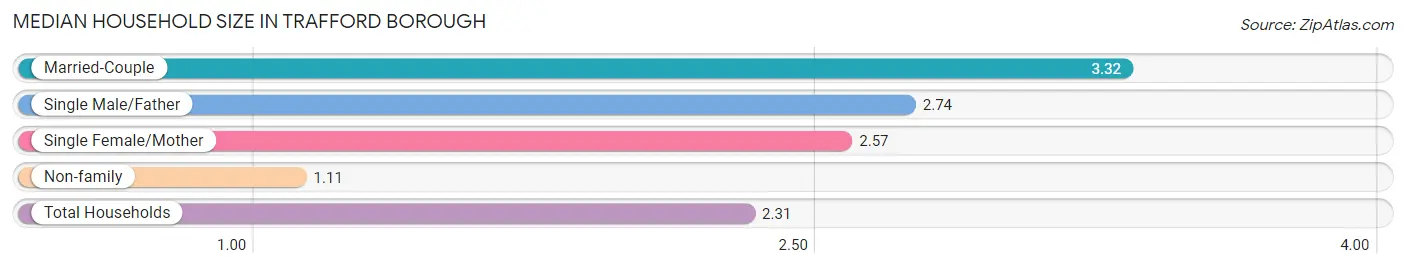
Median Household Size in Trafford borough
The median household size in Trafford borough is 2.31 persons per household, with married-couple households (536 | 38.3%) accounting for the largest median household size of 3.32 persons per household. non-family households (529 | 37.8%) represent the smallest median household size with 1.11 persons per household.
| Household Type | # Households | Household Size |
| Married-Couple | 536 (38.3%) | 3.32 |
| Single Male/Father | 62 (4.4%) | 2.74 |
| Single Female/Mother | 273 (19.5%) | 2.57 |
| Non-family | 529 (37.8%) | 1.11 |
| Total Households | 1,400 (100.0%) | 2.31 |
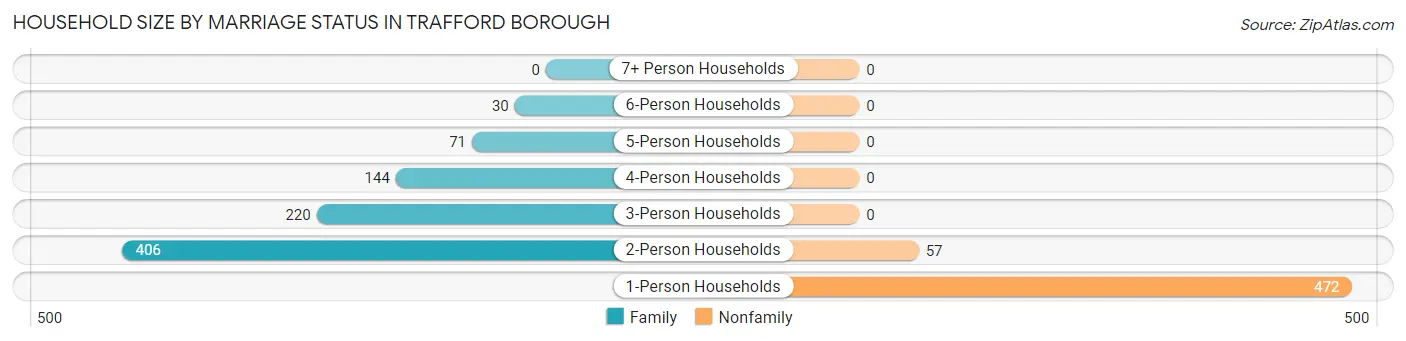
Household Size by Marriage Status in Trafford borough
Out of a total of 1,400 households in Trafford borough, 871 (62.2%) are family households, while 529 (37.8%) are nonfamily households. The most numerous type of family households are 2-person households, comprising 406, and the most common type of nonfamily households are 1-person households, comprising 472.
| Household Size | Family Households | Nonfamily Households |
| 1-Person Households | - | 472 (33.7%) |
| 2-Person Households | 406 (29.0%) | 57 (4.1%) |
| 3-Person Households | 220 (15.7%) | 0 (0.0%) |
| 4-Person Households | 144 (10.3%) | 0 (0.0%) |
| 5-Person Households | 71 (5.1%) | 0 (0.0%) |
| 6-Person Households | 30 (2.1%) | 0 (0.0%) |
| 7+ Person Households | 0 (0.0%) | 0 (0.0%) |
| Total | 871 (62.2%) | 529 (37.8%) |
Female Fertility in Trafford borough
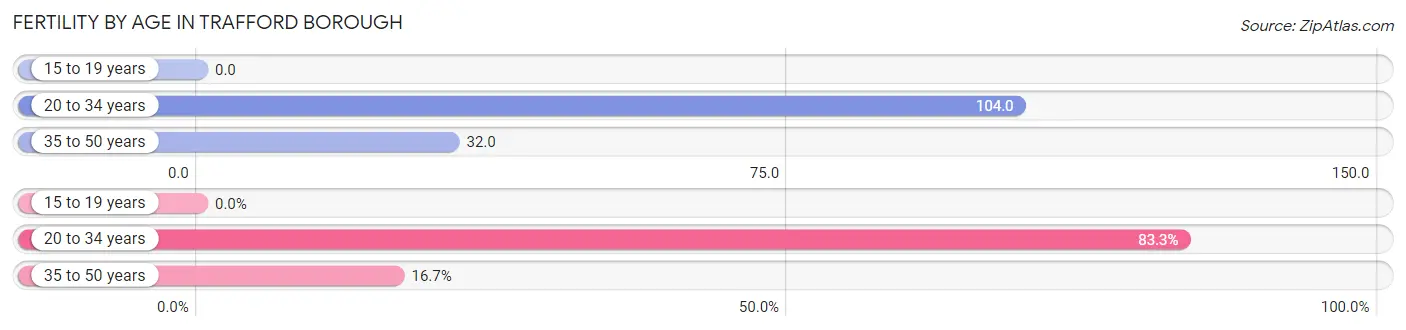
Fertility by Age in Trafford borough
Average fertility rate in Trafford borough is 65.0 births per 1,000 women. Women in the age bracket of 20 to 34 years have the highest fertility rate with 104.0 births per 1,000 women. Women in the age bracket of 20 to 34 years acount for 83.3% of all women with births.
| Age Bracket | Women with Births | Births / 1,000 Women |
| 15 to 19 years | 0 (0.0%) | 0.0 |
| 20 to 34 years | 35 (83.3%) | 104.0 |
| 35 to 50 years | 7 (16.7%) | 32.0 |
| Total | 42 (100.0%) | 65.0 |
Fertility by Age by Marriage Status in Trafford borough
16.7% of women with births (42) in Trafford borough are married. The highest percentage of unmarried women with births falls into 20 to 34 years age bracket with 100.0% of them unmarried at the time of birth, while the lowest percentage of unmarried women with births belong to 35 to 50 years age bracket with 0.0% of them unmarried.
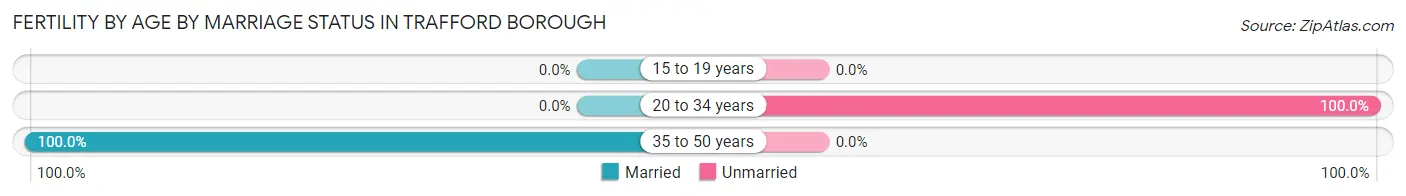
| Age Bracket | Married | Unmarried |
| 15 to 19 years | 0 (0.0%) | 0 (0.0%) |
| 20 to 34 years | 0 (0.0%) | 35 (100.0%) |
| 35 to 50 years | 7 (100.0%) | 0 (0.0%) |
| Total | 7 (16.7%) | 35 (83.3%) |
Fertility by Education in Trafford borough
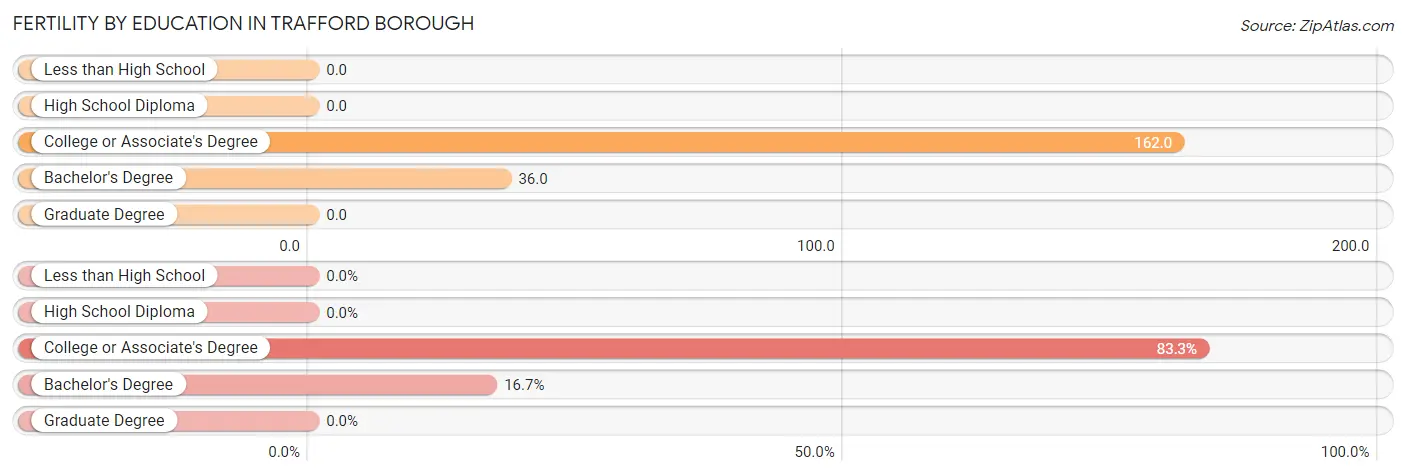
| Educational Attainment | Women with Births | Births / 1,000 Women |
| Less than High School | 0 (0.0%) | 0.0 |
| High School Diploma | 0 (0.0%) | 0.0 |
| College or Associate's Degree | 35 (83.3%) | 162.0 |
| Bachelor's Degree | 7 (16.7%) | 36.0 |
| Graduate Degree | 0 (0.0%) | 0.0 |
| Total | 42 (100.0%) | 65.0 |
Fertility by Education by Marriage Status in Trafford borough
83.3% of women with births in Trafford borough are unmarried. Women with the educational attainment of bachelor's degree are most likely to be married with 100.0% of them married at childbirth, while women with the educational attainment of college or associate's degree are least likely to be married with 100.0% of them unmarried at childbirth.
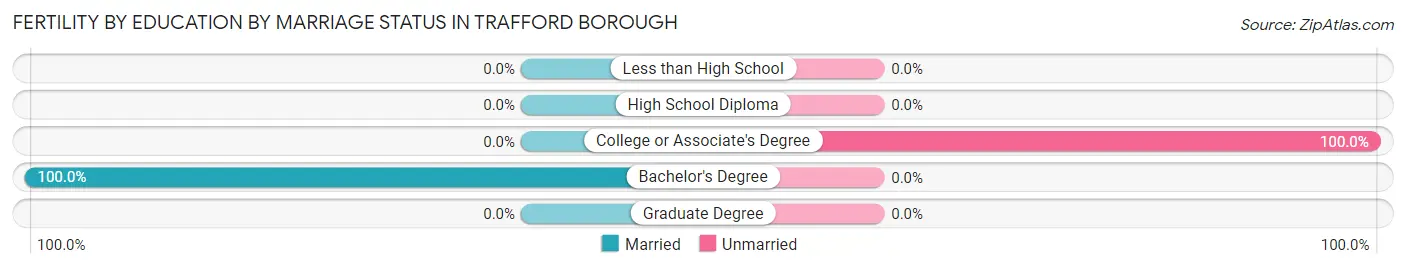
| Educational Attainment | Married | Unmarried |
| Less than High School | 0 (0.0%) | 0 (0.0%) |
| High School Diploma | 0 (0.0%) | 0 (0.0%) |
| College or Associate's Degree | 0 (0.0%) | 35 (100.0%) |
| Bachelor's Degree | 7 (100.0%) | 0 (0.0%) |
| Graduate Degree | 0 (0.0%) | 0 (0.0%) |
| Total | 7 (16.7%) | 35 (83.3%) |
Income in Trafford borough
Income Overview in Trafford borough
Per Capita Income in Trafford borough is $29,597, while median incomes of families and households are $61,836 and $57,450 respectively.
| Characteristic | Number | Measure |
| Per Capita Income | 3,237 | $29,597 |
| Median Family Income | 871 | $61,836 |
| Mean Family Income | 871 | $75,007 |
| Median Household Income | 1,400 | $57,450 |
| Mean Household Income | 1,400 | $66,555 |
| Income Deficit | 871 | $0 |
| Wage / Income Gap (%) | 3,237 | 30.58% |
| Wage / Income Gap ($) | 3,237 | 69.42¢ per $1 |
| Gini / Inequality Index | 3,237 | 0.38 |
Earnings by Sex in Trafford borough
Average Earnings in Trafford borough are $39,092, $46,005 for men and $31,938 for women, a difference of 30.6%.
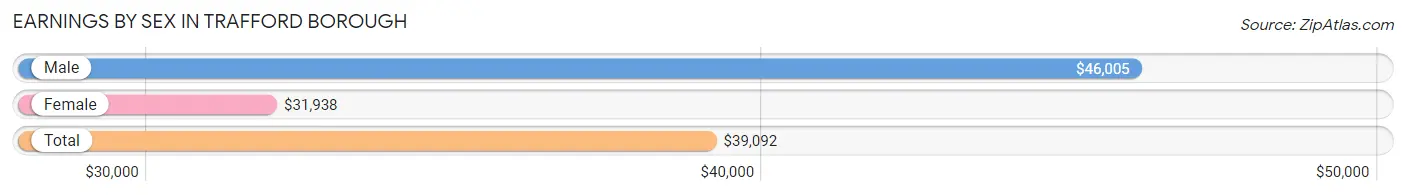
| Sex | Number | Average Earnings |
| Male | 798 (49.3%) | $46,005 |
| Female | 819 (50.6%) | $31,938 |
| Total | 1,617 (100.0%) | $39,092 |
Earnings by Sex by Income Bracket in Trafford borough
The most common earnings brackets in Trafford borough are $35,000 to $39,999 for men (143 | 17.9%) and $12,500 to $14,999 for women (102 | 12.4%).
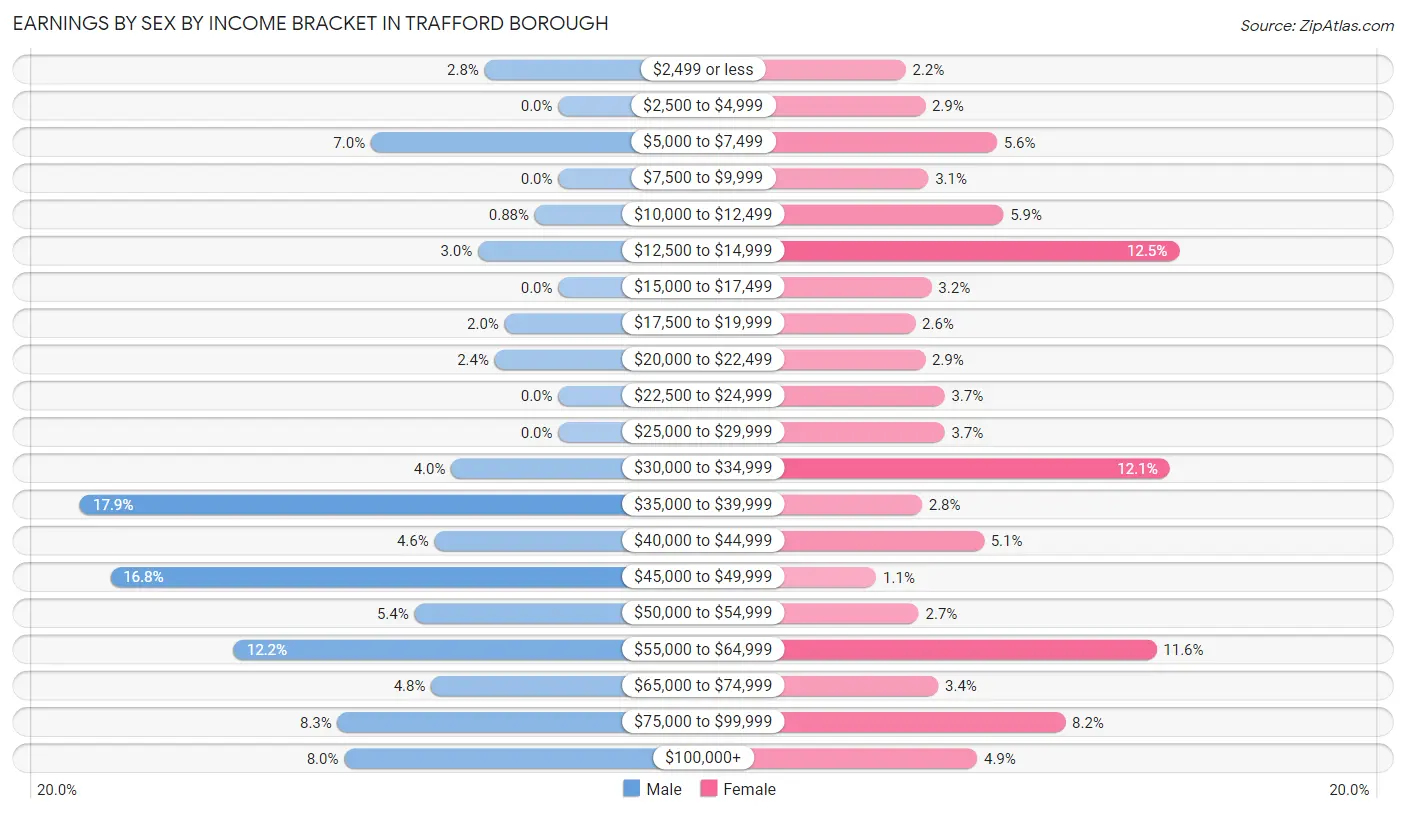
| Income | Male | Female |
| $2,499 or less | 22 (2.8%) | 18 (2.2%) |
| $2,500 to $4,999 | 0 (0.0%) | 24 (2.9%) |
| $5,000 to $7,499 | 56 (7.0%) | 46 (5.6%) |
| $7,500 to $9,999 | 0 (0.0%) | 25 (3.0%) |
| $10,000 to $12,499 | 7 (0.9%) | 48 (5.9%) |
| $12,500 to $14,999 | 24 (3.0%) | 102 (12.4%) |
| $15,000 to $17,499 | 0 (0.0%) | 26 (3.2%) |
| $17,500 to $19,999 | 16 (2.0%) | 21 (2.6%) |
| $20,000 to $22,499 | 19 (2.4%) | 24 (2.9%) |
| $22,500 to $24,999 | 0 (0.0%) | 30 (3.7%) |
| $25,000 to $29,999 | 0 (0.0%) | 30 (3.7%) |
| $30,000 to $34,999 | 32 (4.0%) | 99 (12.1%) |
| $35,000 to $39,999 | 143 (17.9%) | 23 (2.8%) |
| $40,000 to $44,999 | 37 (4.6%) | 42 (5.1%) |
| $45,000 to $49,999 | 134 (16.8%) | 9 (1.1%) |
| $50,000 to $54,999 | 43 (5.4%) | 22 (2.7%) |
| $55,000 to $64,999 | 97 (12.2%) | 95 (11.6%) |
| $65,000 to $74,999 | 38 (4.8%) | 28 (3.4%) |
| $75,000 to $99,999 | 66 (8.3%) | 67 (8.2%) |
| $100,000+ | 64 (8.0%) | 40 (4.9%) |
| Total | 798 (100.0%) | 819 (100.0%) |
Earnings by Sex by Educational Attainment in Trafford borough
Average earnings in Trafford borough are $46,343 for men and $33,006 for women, a difference of 28.8%. Men with an educational attainment of bachelor's degree enjoy the highest average annual earnings of $77,688, while those with graduate degree education earn the least with $40,221. Women with an educational attainment of graduate degree earn the most with the average annual earnings of $64,722, while those with college or associate's degree education have the smallest earnings of $22,500.
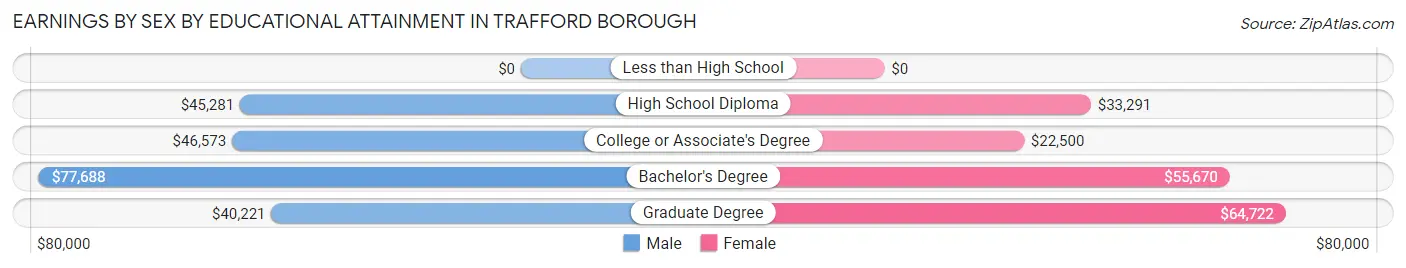
| Educational Attainment | Male Income | Female Income |
| Less than High School | - | - |
| High School Diploma | $45,281 | $33,291 |
| College or Associate's Degree | $46,573 | $22,500 |
| Bachelor's Degree | $77,688 | $55,670 |
| Graduate Degree | $40,221 | $64,722 |
| Total | $46,343 | $33,006 |
Family Income in Trafford borough
Family Income Brackets in Trafford borough
According to the Trafford borough family income data, there are 237 families falling into the $50,000 to $74,999 income range, which is the most common income bracket and makes up 27.2% of all families.
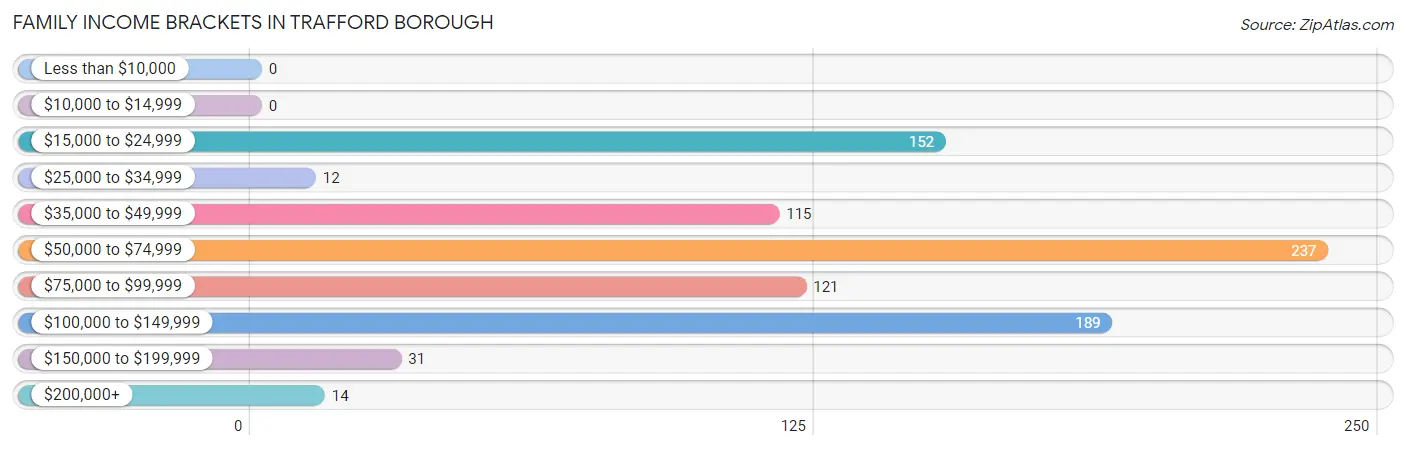
| Income Bracket | # Families | % Families |
| Less than $10,000 | 0 | 0.0% |
| $10,000 to $14,999 | 0 | 0.0% |
| $15,000 to $24,999 | 152 | 17.5% |
| $25,000 to $34,999 | 12 | 1.4% |
| $35,000 to $49,999 | 115 | 13.2% |
| $50,000 to $74,999 | 237 | 27.2% |
| $75,000 to $99,999 | 121 | 13.9% |
| $100,000 to $149,999 | 189 | 21.7% |
| $150,000 to $199,999 | 31 | 3.6% |
| $200,000+ | 14 | 1.6% |
Family Income by Famaliy Size in Trafford borough
5-person families (61 | 7.0%) account for the highest median family income in Trafford borough with $121,696 per family, while 3-person families (185 | 21.2%) have the highest median income of $31,806 per family member.
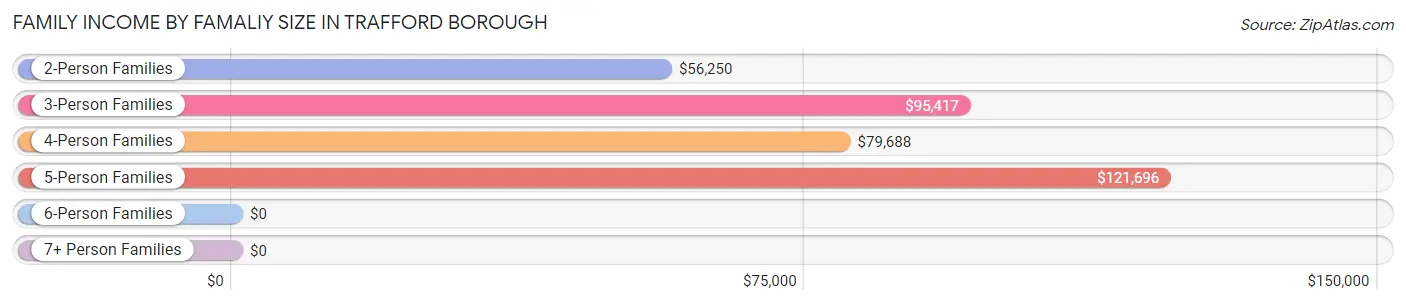
| Income Bracket | # Families | Median Income |
| 2-Person Families | 465 (53.4%) | $56,250 |
| 3-Person Families | 185 (21.2%) | $95,417 |
| 4-Person Families | 141 (16.2%) | $79,688 |
| 5-Person Families | 61 (7.0%) | $121,696 |
| 6-Person Families | 19 (2.2%) | $0 |
| 7+ Person Families | 0 (0.0%) | $0 |
| Total | 871 (100.0%) | $61,836 |
Family Income by Number of Earners in Trafford borough
The median family income in Trafford borough is $61,836, with families comprising 3+ earners (46) having the highest median family income of $181,500, while families with 1 earner (347) have the lowest median family income of $46,038, accounting for 5.3% and 39.8% of families, respectively.
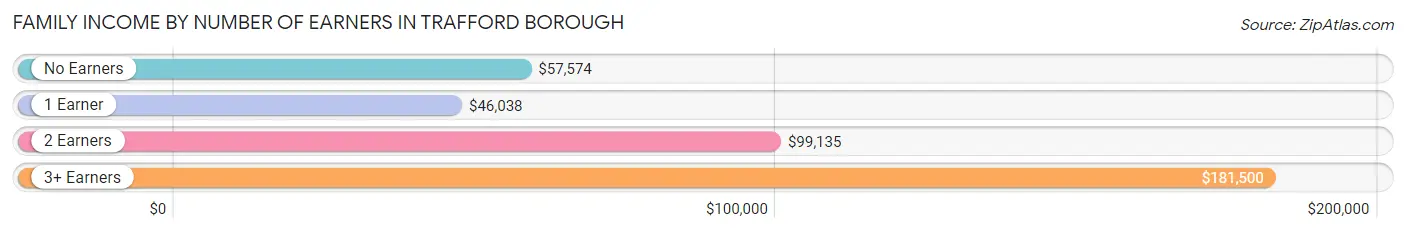
| Number of Earners | # Families | Median Income |
| No Earners | 143 (16.4%) | $57,574 |
| 1 Earner | 347 (39.8%) | $46,038 |
| 2 Earners | 335 (38.5%) | $99,135 |
| 3+ Earners | 46 (5.3%) | $181,500 |
| Total | 871 (100.0%) | $61,836 |
Household Income in Trafford borough
Household Income Brackets in Trafford borough
With 323 households falling in the category, the $50,000 to $74,999 income range is the most frequent in Trafford borough, accounting for 23.1% of all households. In contrast, only 20 households (1.4%) fall into the less than $10,000 income bracket, making it the least populous group.
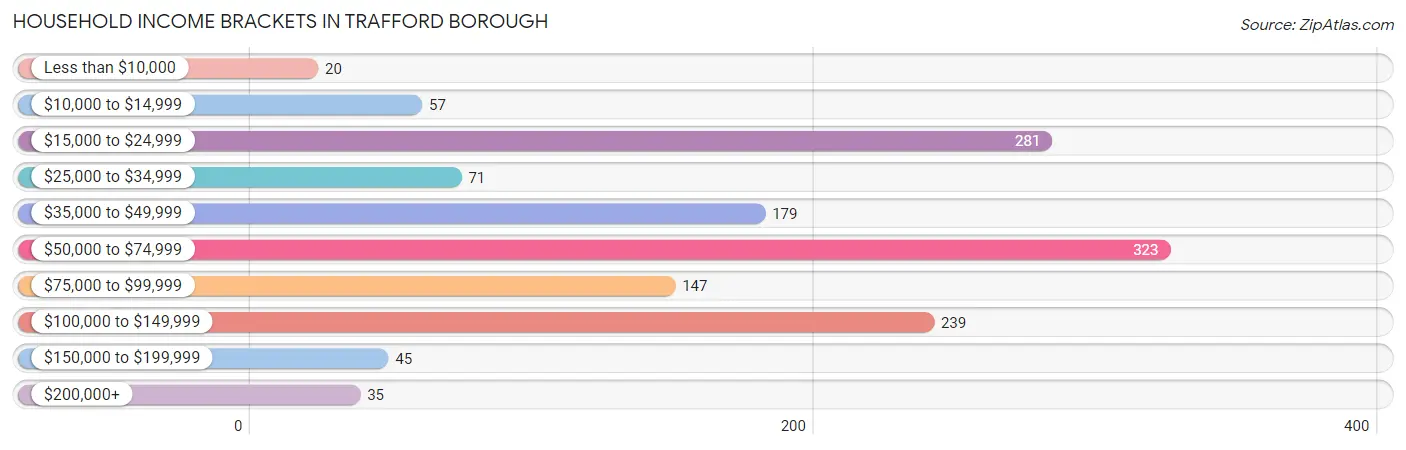
| Income Bracket | # Households | % Households |
| Less than $10,000 | 20 | 1.4% |
| $10,000 to $14,999 | 57 | 4.1% |
| $15,000 to $24,999 | 281 | 20.1% |
| $25,000 to $34,999 | 71 | 5.1% |
| $35,000 to $49,999 | 179 | 12.8% |
| $50,000 to $74,999 | 323 | 23.1% |
| $75,000 to $99,999 | 147 | 10.5% |
| $100,000 to $149,999 | 239 | 17.1% |
| $150,000 to $199,999 | 45 | 3.2% |
| $200,000+ | 35 | 2.5% |
Household Income by Householder Age in Trafford borough
The median household income in Trafford borough is $57,450, with the highest median household income of $76,184 found in the 25 to 44 years age bracket for the primary householder. A total of 444 households (31.7%) fall into this category. Meanwhile, the 15 to 24 years age bracket for the primary householder has the lowest median household income of $0, with 22 households (1.6%) in this group.
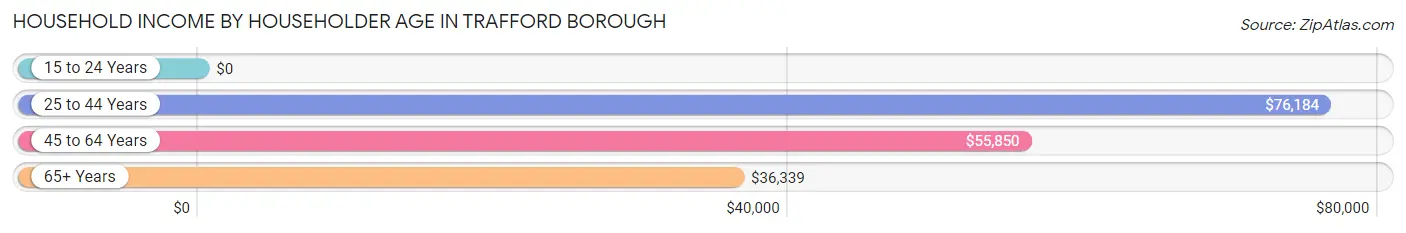
| Income Bracket | # Households | Median Income |
| 15 to 24 Years | 22 (1.6%) | $0 |
| 25 to 44 Years | 444 (31.7%) | $76,184 |
| 45 to 64 Years | 527 (37.6%) | $55,850 |
| 65+ Years | 407 (29.1%) | $36,339 |
| Total | 1,400 (100.0%) | $57,450 |
Poverty in Trafford borough
Income Below Poverty by Sex and Age in Trafford borough
With 5.3% poverty level for males and 4.4% for females among the residents of Trafford borough, 55 to 64 year old males and 16 and 17 year old females are the most vulnerable to poverty, with 38 males (12.9%) and 8 females (29.6%) in their respective age groups living below the poverty level.
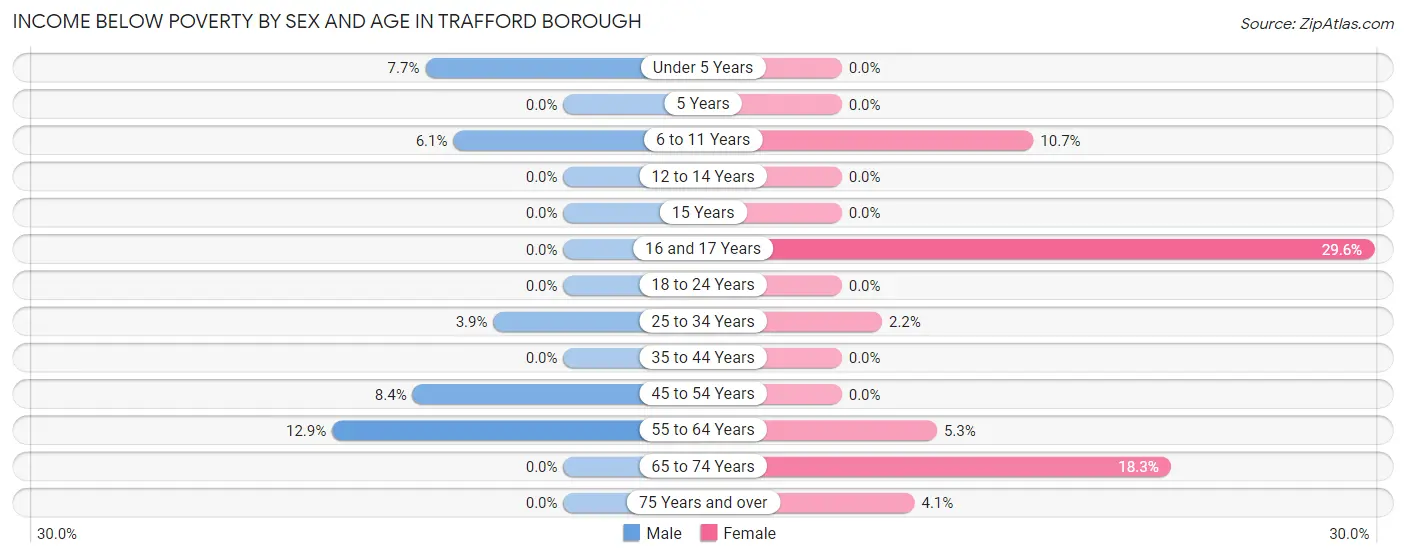
| Age Bracket | Male | Female |
| Under 5 Years | 7 (7.7%) | 0 (0.0%) |
| 5 Years | 0 (0.0%) | 0 (0.0%) |
| 6 to 11 Years | 10 (6.1%) | 8 (10.7%) |
| 12 to 14 Years | 0 (0.0%) | 0 (0.0%) |
| 15 Years | 0 (0.0%) | 0 (0.0%) |
| 16 and 17 Years | 0 (0.0%) | 8 (29.6%) |
| 18 to 24 Years | 0 (0.0%) | 0 (0.0%) |
| 25 to 34 Years | 13 (3.9%) | 7 (2.2%) |
| 35 to 44 Years | 0 (0.0%) | 0 (0.0%) |
| 45 to 54 Years | 11 (8.4%) | 0 (0.0%) |
| 55 to 64 Years | 38 (12.9%) | 17 (5.3%) |
| 65 to 74 Years | 0 (0.0%) | 28 (18.3%) |
| 75 Years and over | 0 (0.0%) | 9 (4.1%) |
| Total | 79 (5.3%) | 77 (4.4%) |
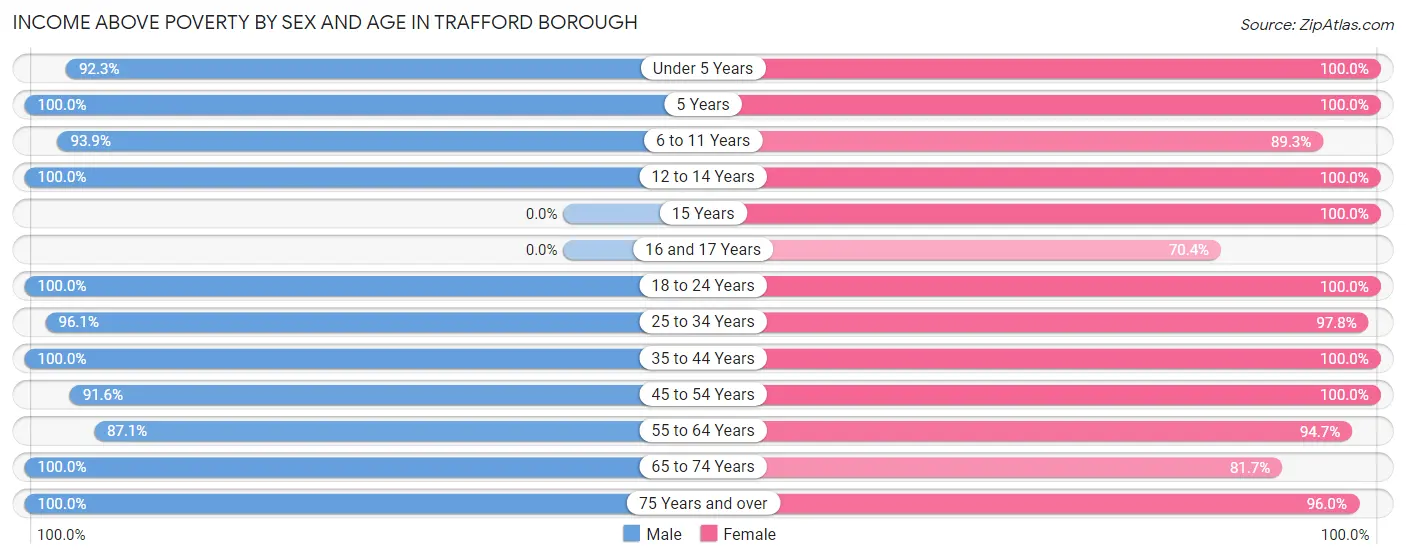
Income Above Poverty by Sex and Age in Trafford borough
According to the poverty statistics in Trafford borough, males aged 5 years and females aged under 5 years are the age groups that are most secure financially, with 100.0% of males and 100.0% of females in these age groups living above the poverty line.
| Age Bracket | Male | Female |
| Under 5 Years | 84 (92.3%) | 161 (100.0%) |
| 5 Years | 17 (100.0%) | 43 (100.0%) |
| 6 to 11 Years | 153 (93.9%) | 67 (89.3%) |
| 12 to 14 Years | 11 (100.0%) | 49 (100.0%) |
| 15 Years | 0 (0.0%) | 37 (100.0%) |
| 16 and 17 Years | 0 (0.0%) | 19 (70.4%) |
| 18 to 24 Years | 86 (100.0%) | 48 (100.0%) |
| 25 to 34 Years | 320 (96.1%) | 306 (97.8%) |
| 35 to 44 Years | 157 (100.0%) | 163 (100.0%) |
| 45 to 54 Years | 120 (91.6%) | 145 (100.0%) |
| 55 to 64 Years | 257 (87.1%) | 304 (94.7%) |
| 65 to 74 Years | 113 (100.0%) | 125 (81.7%) |
| 75 Years and over | 83 (100.0%) | 213 (96.0%) |
| Total | 1,401 (94.7%) | 1,680 (95.6%) |
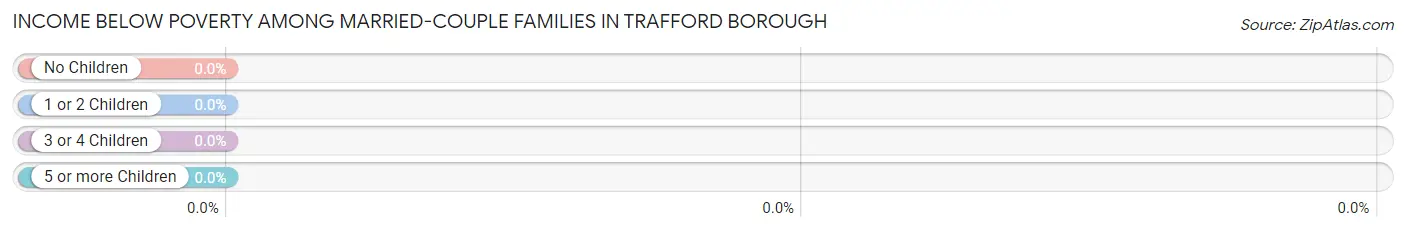
Income Below Poverty Among Married-Couple Families in Trafford borough
| Children | Above Poverty | Below Poverty |
| No Children | 283 (100.0%) | 0 (0.0%) |
| 1 or 2 Children | 224 (100.0%) | 0 (0.0%) |
| 3 or 4 Children | 29 (100.0%) | 0 (0.0%) |
| 5 or more Children | 0 (0.0%) | 0 (0.0%) |
| Total | 536 (100.0%) | 0 (0.0%) |
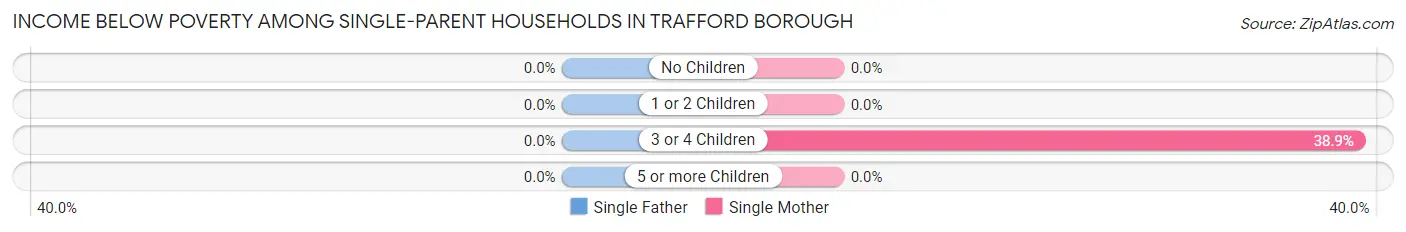
Income Below Poverty Among Single-Parent Households in Trafford borough
| Children | Single Father | Single Mother |
| No Children | 0 (0.0%) | 0 (0.0%) |
| 1 or 2 Children | 0 (0.0%) | 0 (0.0%) |
| 3 or 4 Children | 0 (0.0%) | 7 (38.9%) |
| 5 or more Children | 0 (0.0%) | 0 (0.0%) |
| Total | 0 (0.0%) | 7 (2.6%) |
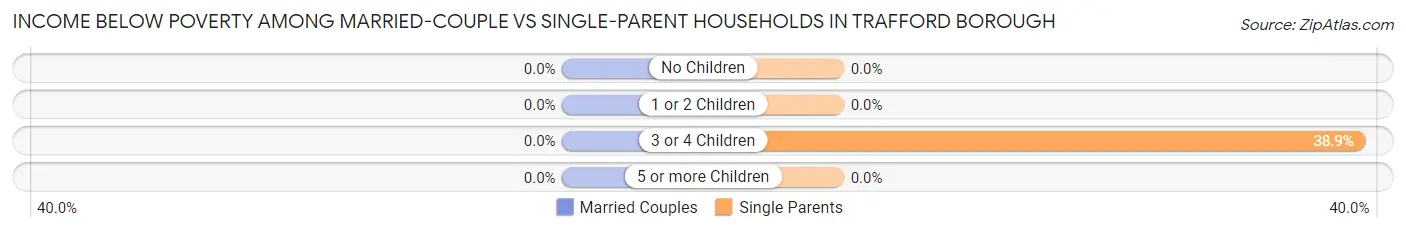
Income Below Poverty Among Married-Couple vs Single-Parent Households in Trafford borough
| Children | Married-Couple Families | Single-Parent Households |
| No Children | 0 (0.0%) | 0 (0.0%) |
| 1 or 2 Children | 0 (0.0%) | 0 (0.0%) |
| 3 or 4 Children | 0 (0.0%) | 7 (38.9%) |
| 5 or more Children | 0 (0.0%) | 0 (0.0%) |
| Total | 0 (0.0%) | 7 (2.1%) |
Employment Characteristics in Trafford borough
Employment by Class of Employer in Trafford borough
Among the 1,438 employed individuals in Trafford borough, private company employees (1,030 | 71.6%), not-for-profit organizations (189 | 13.1%), and state government employees (64 | 4.4%) make up the most common classes of employment.
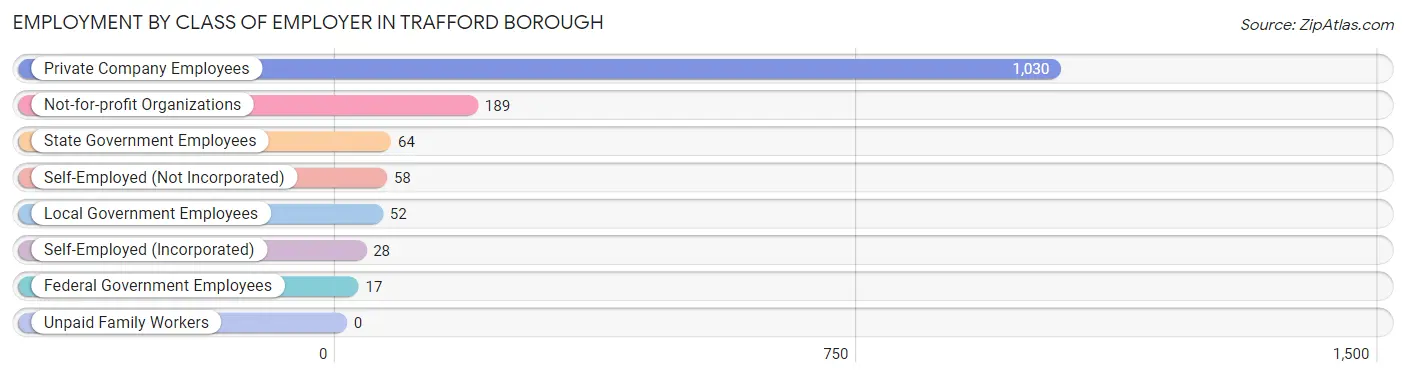
| Employer Class | # Employees | % Employees |
| Private Company Employees | 1,030 | 71.6% |
| Self-Employed (Incorporated) | 28 | 1.9% |
| Self-Employed (Not Incorporated) | 58 | 4.0% |
| Not-for-profit Organizations | 189 | 13.1% |
| Local Government Employees | 52 | 3.6% |
| State Government Employees | 64 | 4.4% |
| Federal Government Employees | 17 | 1.2% |
| Unpaid Family Workers | 0 | 0.0% |
| Total | 1,438 | 100.0% |
Employment Status by Age in Trafford borough
According to the labor force statistics for Trafford borough, out of the total population over 16 years of age (2,590), 59.3% or 1,536 individuals are in the labor force, with 4.5% or 69 of them unemployed. The age group with the highest labor force participation rate is 35 to 44 years, with 92.5% or 296 individuals in the labor force. Within the labor force, the 16 to 19 years age range has the highest percentage of unemployed individuals, with 29.6% or 8 of them being unemployed.
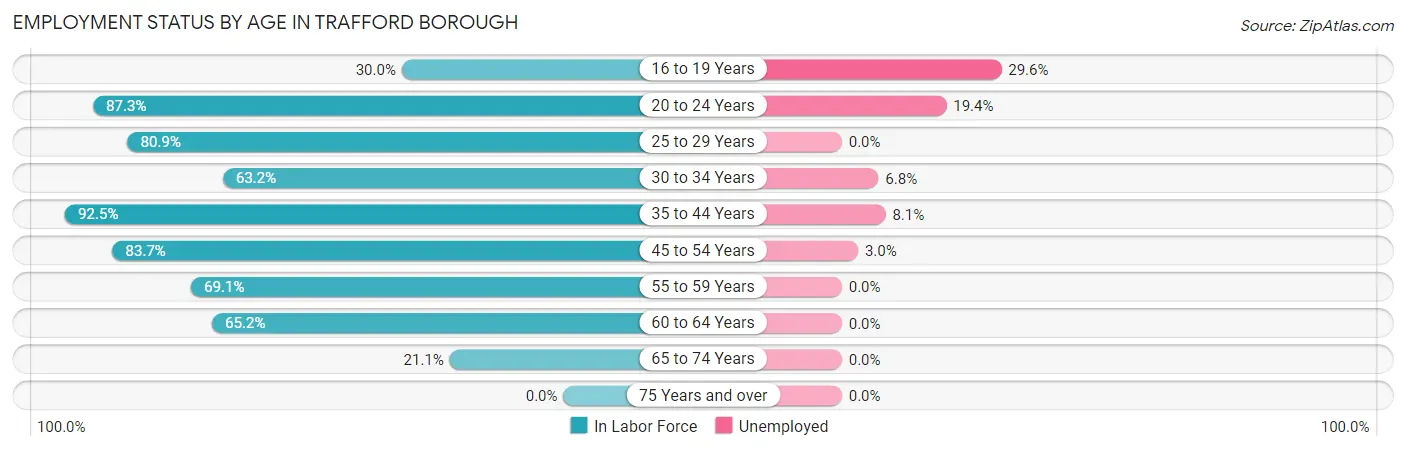
| Age Bracket | In Labor Force | Unemployed |
| 16 to 19 Years | 27 (30.0%) | 8 (29.6%) |
| 20 to 24 Years | 62 (87.3%) | 12 (19.4%) |
| 25 to 29 Years | 186 (80.9%) | 0 (0.0%) |
| 30 to 34 Years | 263 (63.2%) | 18 (6.8%) |
| 35 to 44 Years | 296 (92.5%) | 24 (8.1%) |
| 45 to 54 Years | 231 (83.7%) | 7 (3.0%) |
| 55 to 59 Years | 257 (69.1%) | 0 (0.0%) |
| 60 to 64 Years | 159 (65.2%) | 0 (0.0%) |
| 65 to 74 Years | 56 (21.1%) | 0 (0.0%) |
| 75 Years and over | 0 (0.0%) | 0 (0.0%) |
| Total | 1,536 (59.3%) | 69 (4.5%) |
Employment Status by Educational Attainment in Trafford borough
According to labor force statistics for Trafford borough, 74.9% of individuals (1,392) out of the total population between 25 and 64 years of age (1,858) are in the labor force, with 3.5% or 49 of them being unemployed. The group with the highest labor force participation rate are those with the educational attainment of bachelor's degree or higher, with 87.1% or 461 individuals in the labor force. Within the labor force, individuals with college / associate degree education have the highest percentage of unemployment, with 5.9% or 29 of them being unemployed.
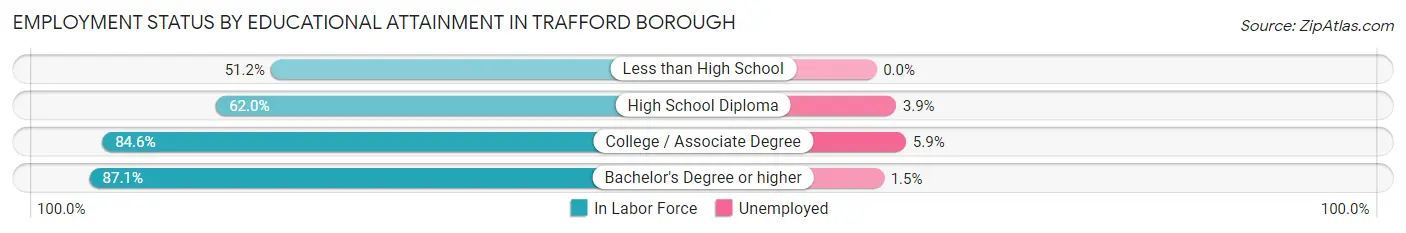
| Educational Attainment | In Labor Force | Unemployed |
| Less than High School | 111 (51.2%) | 0 (0.0%) |
| High School Diploma | 331 (62.0%) | 21 (3.9%) |
| College / Associate Degree | 489 (84.6%) | 34 (5.9%) |
| Bachelor's Degree or higher | 461 (87.1%) | 8 (1.5%) |
| Total | 1,392 (74.9%) | 65 (3.5%) |
Employment Occupations by Sex in Trafford borough
Management, Business, Science and Arts Occupations
The most common Management, Business, Science and Arts occupations in Trafford borough are Community & Social Service (166 | 11.3%), Health Diagnosing & Treating (118 | 8.0%), Health Technologists (91 | 6.2%), Education Instruction & Library (83 | 5.7%), and Management (68 | 4.6%).
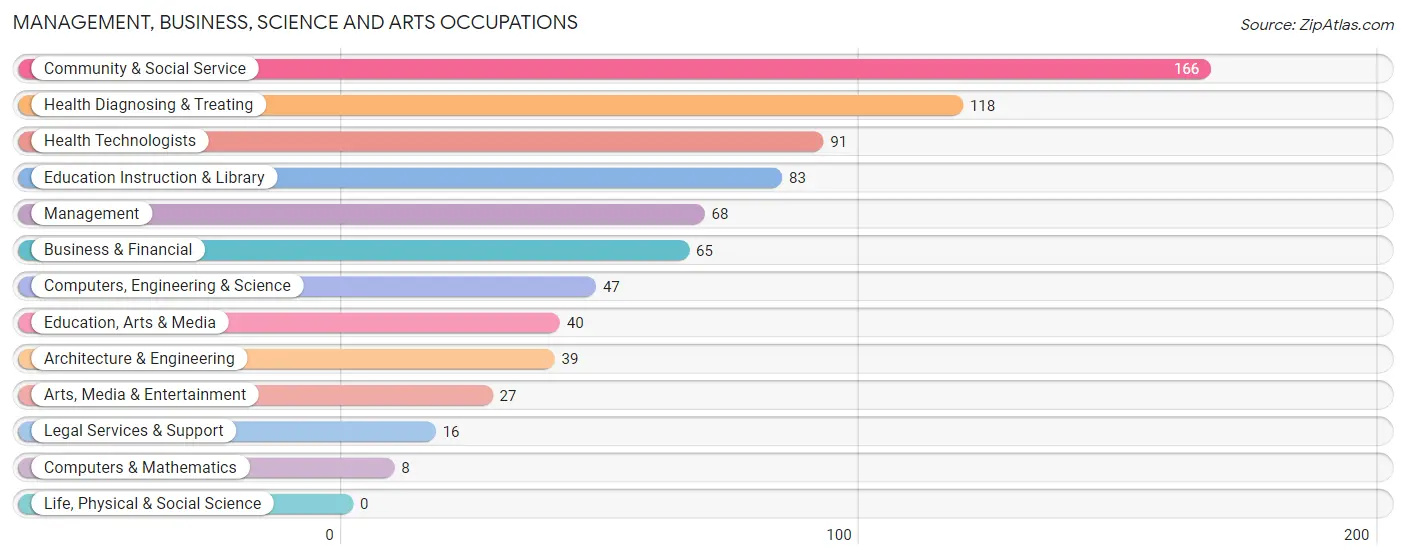
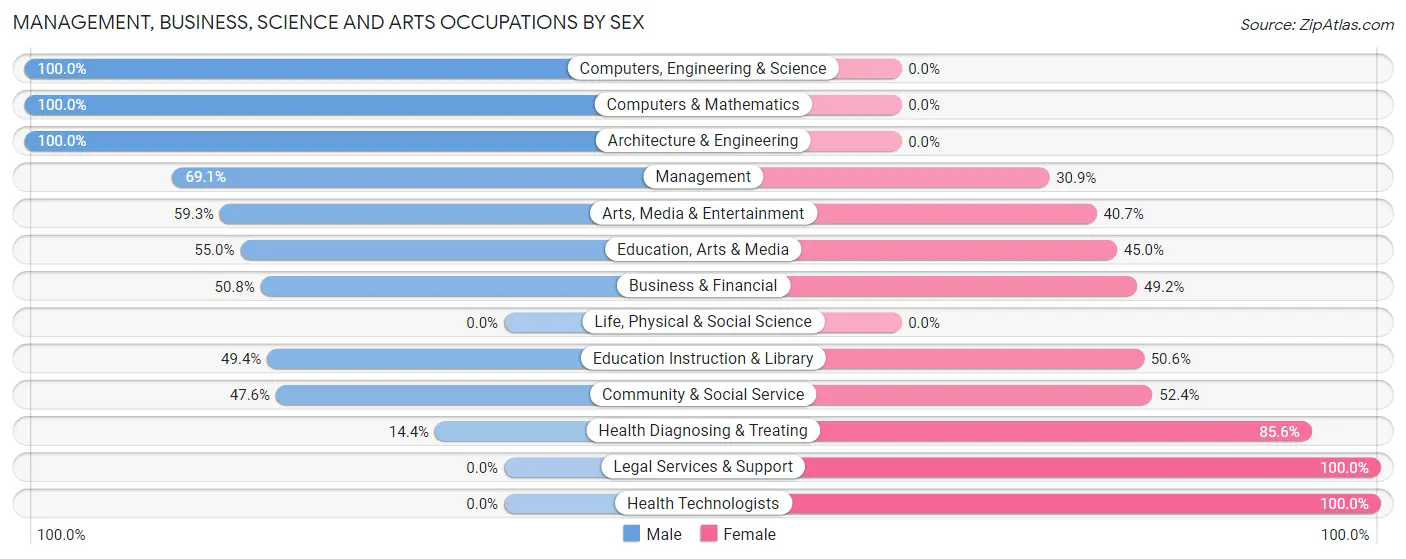
Management, Business, Science and Arts Occupations by Sex
Within the Management, Business, Science and Arts occupations in Trafford borough, the most male-oriented occupations are Computers, Engineering & Science (100.0%), Computers & Mathematics (100.0%), and Architecture & Engineering (100.0%), while the most female-oriented occupations are Legal Services & Support (100.0%), Health Technologists (100.0%), and Health Diagnosing & Treating (85.6%).
| Occupation | Male | Female |
| Management | 47 (69.1%) | 21 (30.9%) |
| Business & Financial | 33 (50.8%) | 32 (49.2%) |
| Computers, Engineering & Science | 47 (100.0%) | 0 (0.0%) |
| Computers & Mathematics | 8 (100.0%) | 0 (0.0%) |
| Architecture & Engineering | 39 (100.0%) | 0 (0.0%) |
| Life, Physical & Social Science | 0 (0.0%) | 0 (0.0%) |
| Community & Social Service | 79 (47.6%) | 87 (52.4%) |
| Education, Arts & Media | 22 (55.0%) | 18 (45.0%) |
| Legal Services & Support | 0 (0.0%) | 16 (100.0%) |
| Education Instruction & Library | 41 (49.4%) | 42 (50.6%) |
| Arts, Media & Entertainment | 16 (59.3%) | 11 (40.7%) |
| Health Diagnosing & Treating | 17 (14.4%) | 101 (85.6%) |
| Health Technologists | 0 (0.0%) | 91 (100.0%) |
| Total (Category) | 223 (48.1%) | 241 (51.9%) |
| Total (Overall) | 727 (49.5%) | 741 (50.5%) |
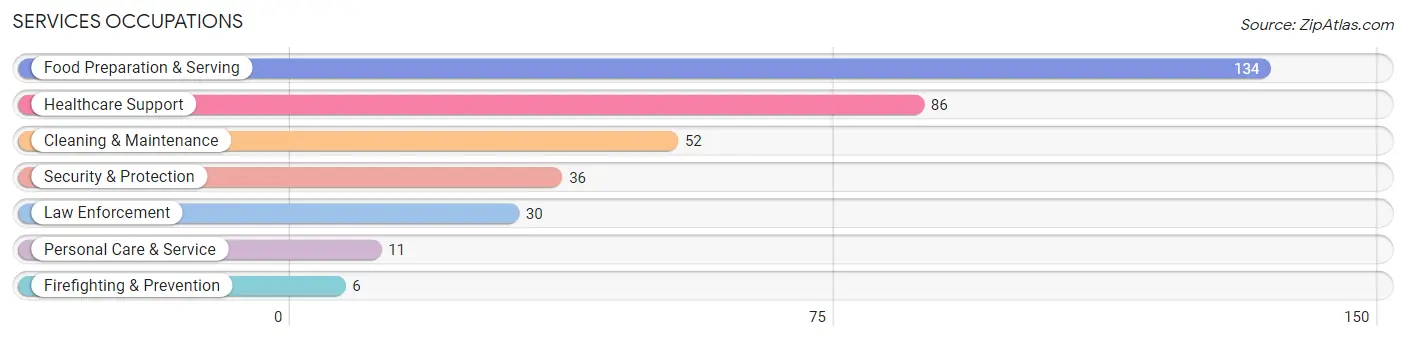
Services Occupations
The most common Services occupations in Trafford borough are Food Preparation & Serving (134 | 9.1%), Healthcare Support (86 | 5.9%), Cleaning & Maintenance (52 | 3.5%), Security & Protection (36 | 2.5%), and Law Enforcement (30 | 2.0%).
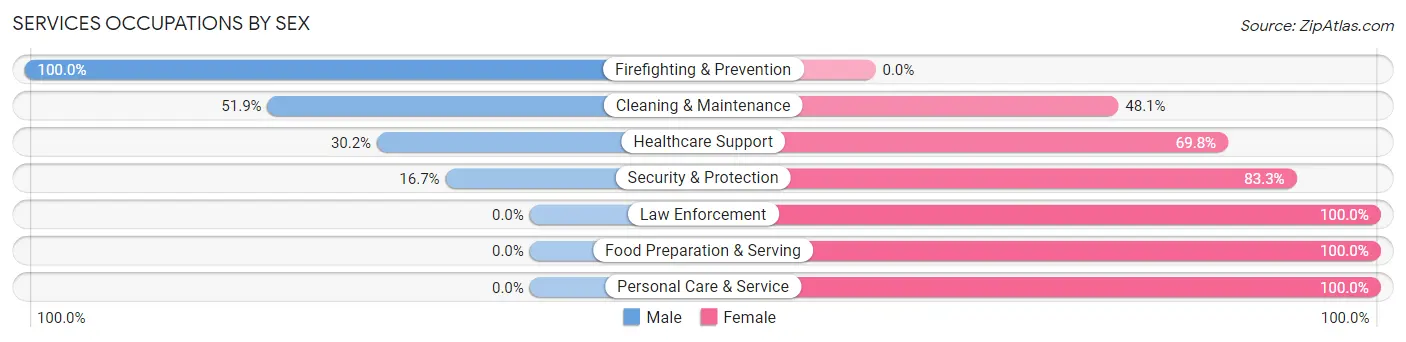
Services Occupations by Sex
Within the Services occupations in Trafford borough, the most male-oriented occupations are Firefighting & Prevention (100.0%), Cleaning & Maintenance (51.9%), and Healthcare Support (30.2%), while the most female-oriented occupations are Law Enforcement (100.0%), Food Preparation & Serving (100.0%), and Personal Care & Service (100.0%).
| Occupation | Male | Female |
| Healthcare Support | 26 (30.2%) | 60 (69.8%) |
| Security & Protection | 6 (16.7%) | 30 (83.3%) |
| Firefighting & Prevention | 6 (100.0%) | 0 (0.0%) |
| Law Enforcement | 0 (0.0%) | 30 (100.0%) |
| Food Preparation & Serving | 0 (0.0%) | 134 (100.0%) |
| Cleaning & Maintenance | 27 (51.9%) | 25 (48.1%) |
| Personal Care & Service | 0 (0.0%) | 11 (100.0%) |
| Total (Category) | 59 (18.5%) | 260 (81.5%) |
| Total (Overall) | 727 (49.5%) | 741 (50.5%) |
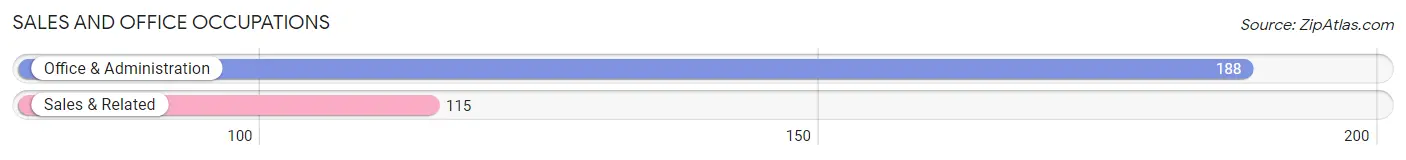
Sales and Office Occupations
The most common Sales and Office occupations in Trafford borough are Office & Administration (188 | 12.8%), and Sales & Related (115 | 7.8%).
Sales and Office Occupations by Sex
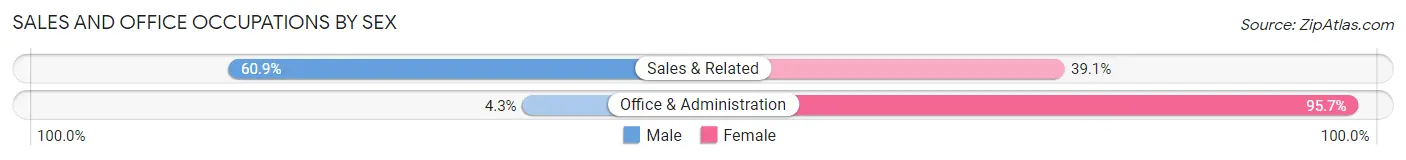
| Occupation | Male | Female |
| Sales & Related | 70 (60.9%) | 45 (39.1%) |
| Office & Administration | 8 (4.3%) | 180 (95.7%) |
| Total (Category) | 78 (25.7%) | 225 (74.3%) |
| Total (Overall) | 727 (49.5%) | 741 (50.5%) |
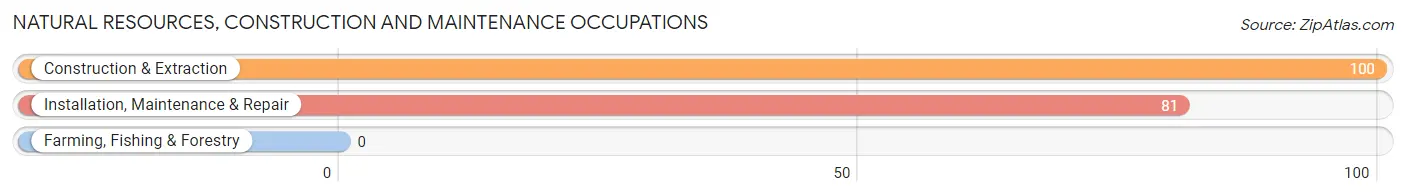
Natural Resources, Construction and Maintenance Occupations
The most common Natural Resources, Construction and Maintenance occupations in Trafford borough are Construction & Extraction (100 | 6.8%), and Installation, Maintenance & Repair (81 | 5.5%).
Natural Resources, Construction and Maintenance Occupations by Sex
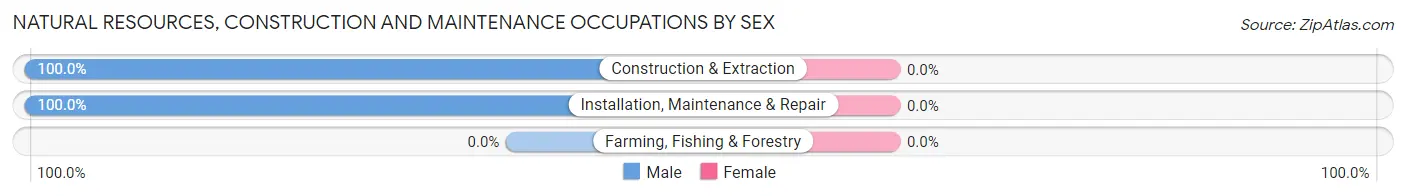
| Occupation | Male | Female |
| Farming, Fishing & Forestry | 0 (0.0%) | 0 (0.0%) |
| Construction & Extraction | 100 (100.0%) | 0 (0.0%) |
| Installation, Maintenance & Repair | 81 (100.0%) | 0 (0.0%) |
| Total (Category) | 181 (100.0%) | 0 (0.0%) |
| Total (Overall) | 727 (49.5%) | 741 (50.5%) |
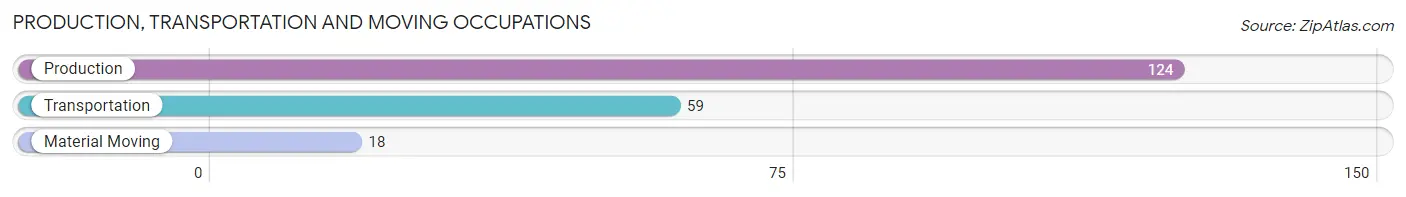
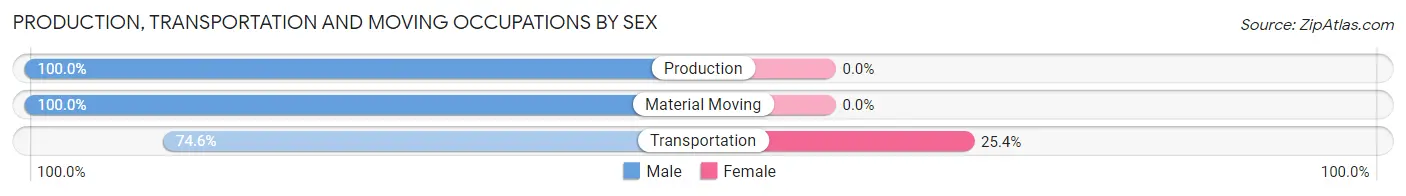
Production, Transportation and Moving Occupations
The most common Production, Transportation and Moving occupations in Trafford borough are Production (124 | 8.5%), Transportation (59 | 4.0%), and Material Moving (18 | 1.2%).
Production, Transportation and Moving Occupations by Sex
| Occupation | Male | Female |
| Production | 124 (100.0%) | 0 (0.0%) |
| Transportation | 44 (74.6%) | 15 (25.4%) |
| Material Moving | 18 (100.0%) | 0 (0.0%) |
| Total (Category) | 186 (92.5%) | 15 (7.5%) |
| Total (Overall) | 727 (49.5%) | 741 (50.5%) |
Employment Industries by Sex in Trafford borough
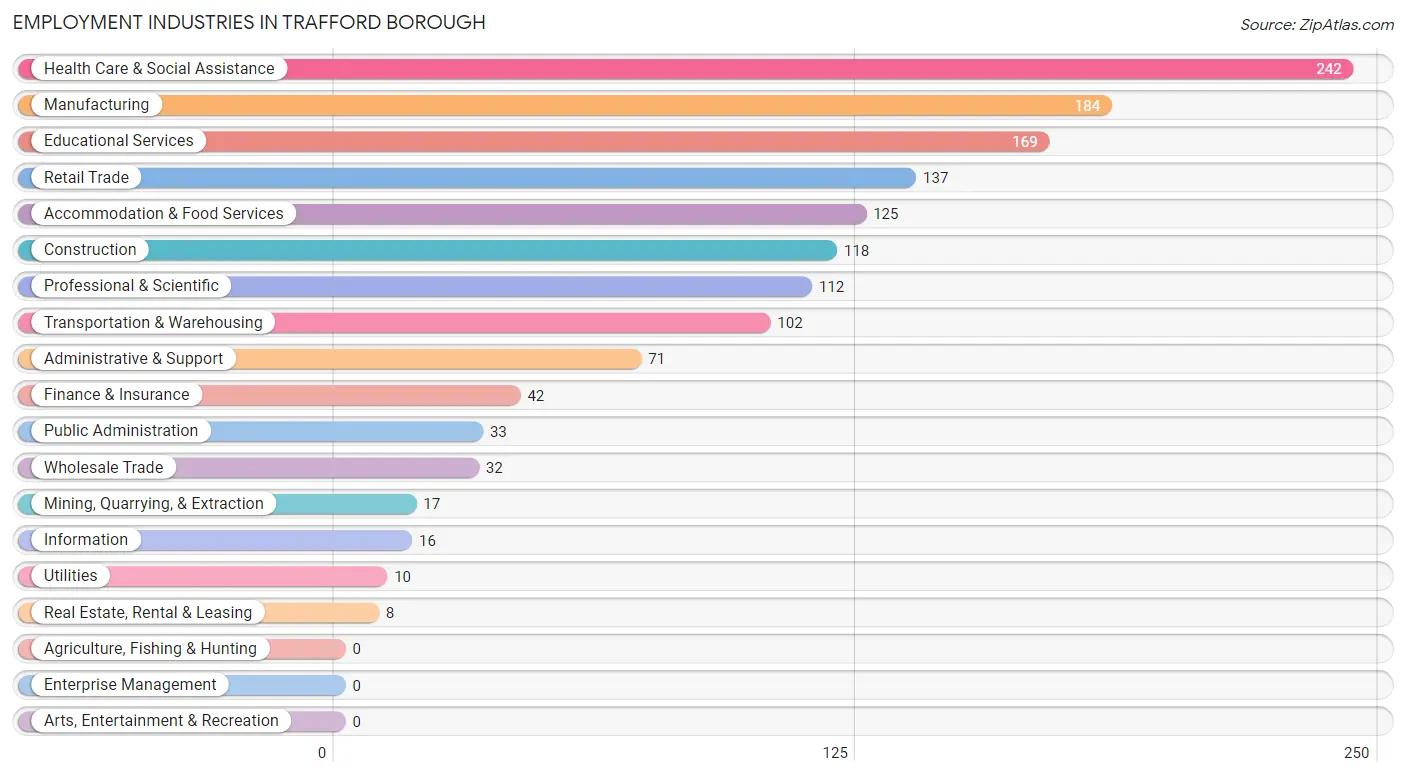
Employment Industries in Trafford borough
The major employment industries in Trafford borough include Health Care & Social Assistance (242 | 16.5%), Manufacturing (184 | 12.5%), Educational Services (169 | 11.5%), Retail Trade (137 | 9.3%), and Accommodation & Food Services (125 | 8.5%).
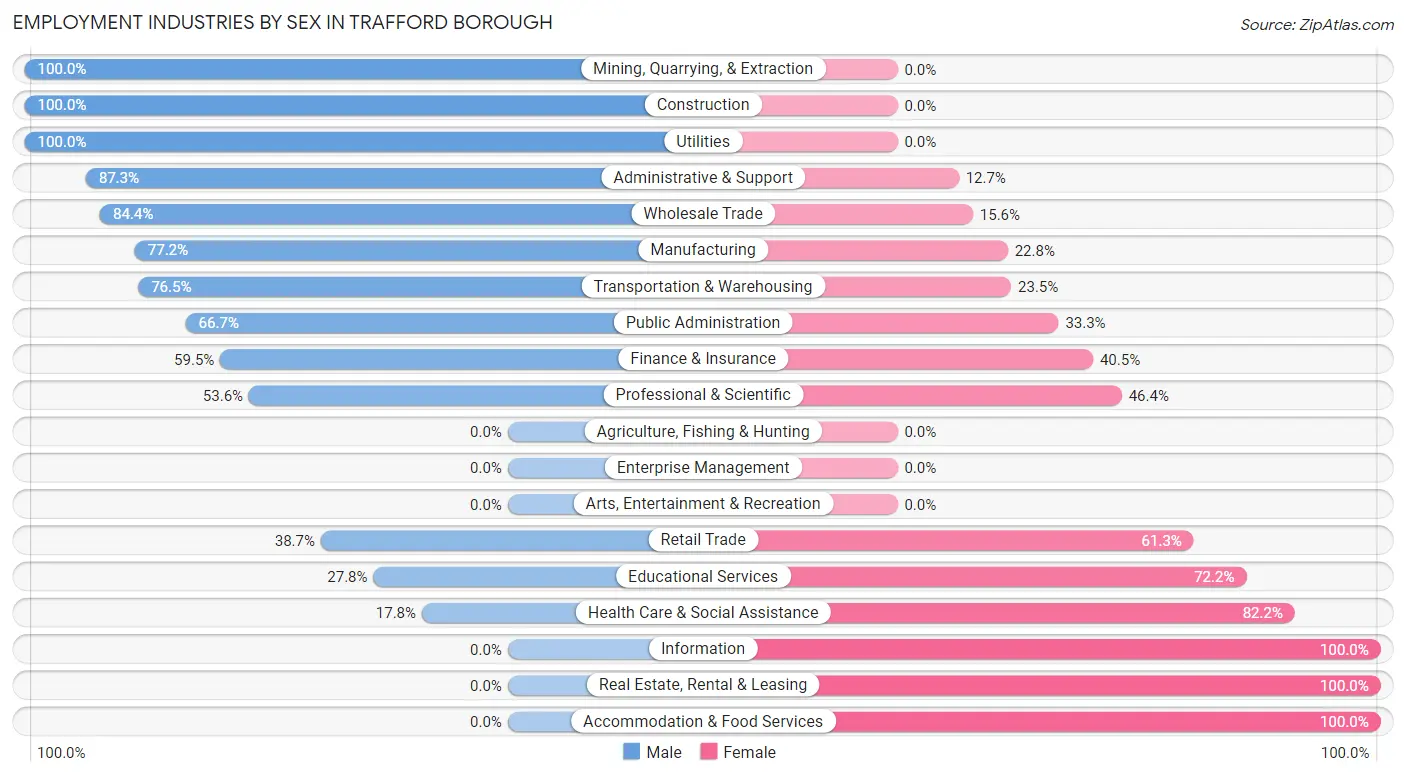
Employment Industries by Sex in Trafford borough
The Trafford borough industries that see more men than women are Mining, Quarrying, & Extraction (100.0%), Construction (100.0%), and Utilities (100.0%), whereas the industries that tend to have a higher number of women are Information (100.0%), Real Estate, Rental & Leasing (100.0%), and Accommodation & Food Services (100.0%).
| Industry | Male | Female |
| Agriculture, Fishing & Hunting | 0 (0.0%) | 0 (0.0%) |
| Mining, Quarrying, & Extraction | 17 (100.0%) | 0 (0.0%) |
| Construction | 118 (100.0%) | 0 (0.0%) |
| Manufacturing | 142 (77.2%) | 42 (22.8%) |
| Wholesale Trade | 27 (84.4%) | 5 (15.6%) |
| Retail Trade | 53 (38.7%) | 84 (61.3%) |
| Transportation & Warehousing | 78 (76.5%) | 24 (23.5%) |
| Utilities | 10 (100.0%) | 0 (0.0%) |
| Information | 0 (0.0%) | 16 (100.0%) |
| Finance & Insurance | 25 (59.5%) | 17 (40.5%) |
| Real Estate, Rental & Leasing | 0 (0.0%) | 8 (100.0%) |
| Professional & Scientific | 60 (53.6%) | 52 (46.4%) |
| Enterprise Management | 0 (0.0%) | 0 (0.0%) |
| Administrative & Support | 62 (87.3%) | 9 (12.7%) |
| Educational Services | 47 (27.8%) | 122 (72.2%) |
| Health Care & Social Assistance | 43 (17.8%) | 199 (82.2%) |
| Arts, Entertainment & Recreation | 0 (0.0%) | 0 (0.0%) |
| Accommodation & Food Services | 0 (0.0%) | 125 (100.0%) |
| Public Administration | 22 (66.7%) | 11 (33.3%) |
| Total | 727 (49.5%) | 741 (50.5%) |
Education in Trafford borough
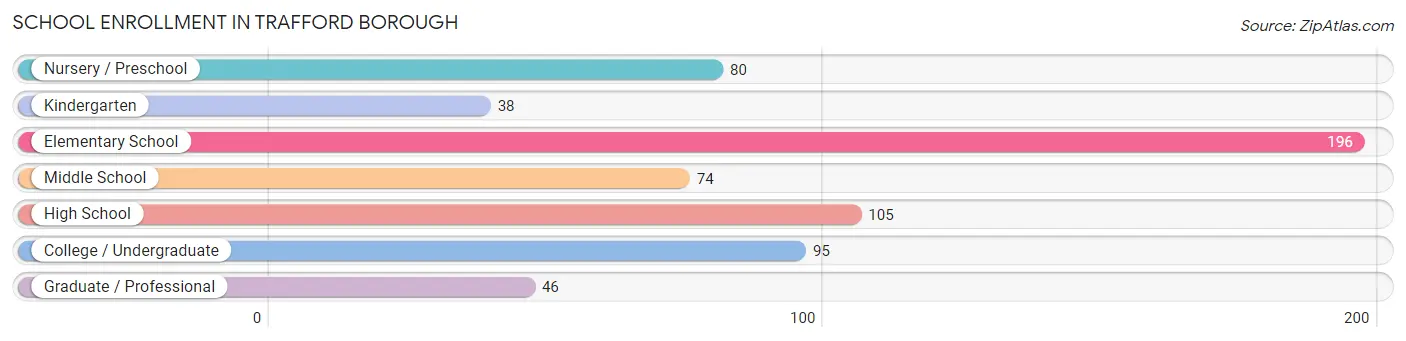
School Enrollment in Trafford borough
The most common levels of schooling among the 634 students in Trafford borough are elementary school (196 | 30.9%), high school (105 | 16.6%), and college / undergraduate (95 | 15.0%).
| School Level | # Students | % Students |
| Nursery / Preschool | 80 | 12.6% |
| Kindergarten | 38 | 6.0% |
| Elementary School | 196 | 30.9% |
| Middle School | 74 | 11.7% |
| High School | 105 | 16.6% |
| College / Undergraduate | 95 | 15.0% |
| Graduate / Professional | 46 | 7.3% |
| Total | 634 | 100.0% |
School Enrollment by Age by Funding Source in Trafford borough
Out of a total of 634 students who are enrolled in schools in Trafford borough, 126 (19.9%) attend a private institution, while the remaining 508 (80.1%) are enrolled in public schools. The age group of 3 to 4 year olds has the highest likelihood of being enrolled in private schools, with 48 (100.0% in the age bracket) enrolled. Conversely, the age group of 15 to 17 year olds has the lowest likelihood of being enrolled in a private school, with 64 (100.0% in the age bracket) attending a public institution.
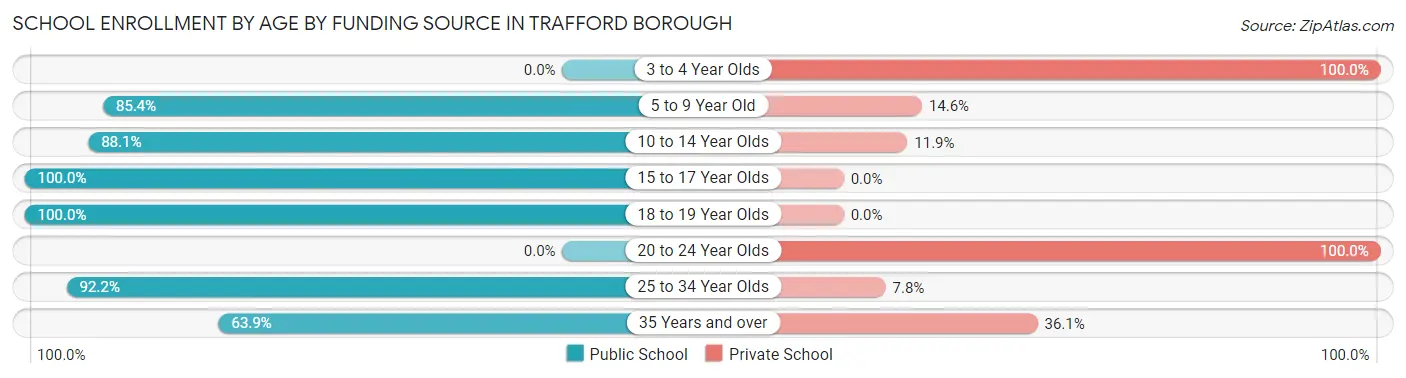
| Age Bracket | Public School | Private School |
| 3 to 4 Year Olds | 0 (0.0%) | 48 (100.0%) |
| 5 to 9 Year Old | 205 (85.4%) | 35 (14.6%) |
| 10 to 14 Year Olds | 104 (88.1%) | 14 (11.9%) |
| 15 to 17 Year Olds | 64 (100.0%) | 0 (0.0%) |
| 18 to 19 Year Olds | 53 (100.0%) | 0 (0.0%) |
| 20 to 24 Year Olds | 0 (0.0%) | 11 (100.0%) |
| 25 to 34 Year Olds | 59 (92.2%) | 5 (7.8%) |
| 35 Years and over | 23 (63.9%) | 13 (36.1%) |
| Total | 508 (80.1%) | 126 (19.9%) |
Educational Attainment by Field of Study in Trafford borough
Education (137 | 20.3%), literature & languages (86 | 12.7%), business (80 | 11.8%), science & technology (65 | 9.6%), and communications (61 | 9.0%) are the most common fields of study among 675 individuals in Trafford borough who have obtained a bachelor's degree or higher.
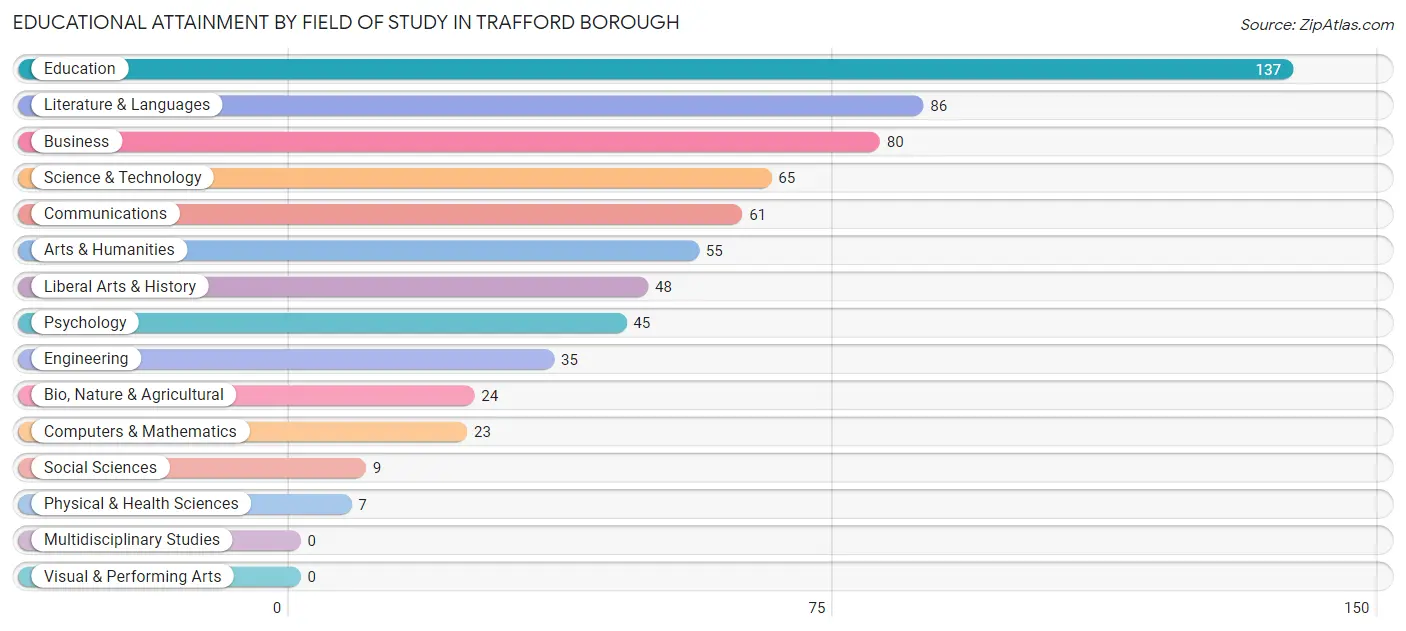
| Field of Study | # Graduates | % Graduates |
| Computers & Mathematics | 23 | 3.4% |
| Bio, Nature & Agricultural | 24 | 3.6% |
| Physical & Health Sciences | 7 | 1.0% |
| Psychology | 45 | 6.7% |
| Social Sciences | 9 | 1.3% |
| Engineering | 35 | 5.2% |
| Multidisciplinary Studies | 0 | 0.0% |
| Science & Technology | 65 | 9.6% |
| Business | 80 | 11.8% |
| Education | 137 | 20.3% |
| Literature & Languages | 86 | 12.7% |
| Liberal Arts & History | 48 | 7.1% |
| Visual & Performing Arts | 0 | 0.0% |
| Communications | 61 | 9.0% |
| Arts & Humanities | 55 | 8.2% |
| Total | 675 | 100.0% |
Transportation & Commute in Trafford borough
Vehicle Availability by Sex in Trafford borough
The most prevalent vehicle ownership categories in Trafford borough are males with 2 vehicles (336, accounting for 47.2%) and females with 2 vehicles (218, making up 46.3%).
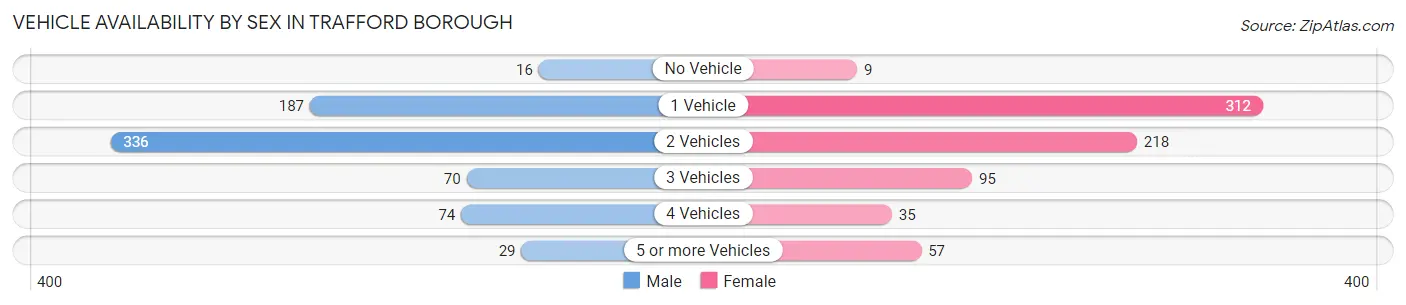
| Vehicles Available | Male | Female |
| No Vehicle | 16 (2.2%) | 9 (1.2%) |
| 1 Vehicle | 187 (26.3%) | 312 (43.0%) |
| 2 Vehicles | 336 (47.2%) | 218 (30.0%) |
| 3 Vehicles | 70 (9.8%) | 95 (13.1%) |
| 4 Vehicles | 74 (10.4%) | 35 (4.8%) |
| 5 or more Vehicles | 29 (4.1%) | 57 (7.9%) |
| Total | 712 (100.0%) | 726 (100.0%) |
Commute Time in Trafford borough
The most frequently occuring commute durations in Trafford borough are 30 to 34 minutes (219 commuters, 17.2%), 15 to 19 minutes (209 commuters, 16.4%), and less than 5 minutes (169 commuters, 13.3%).
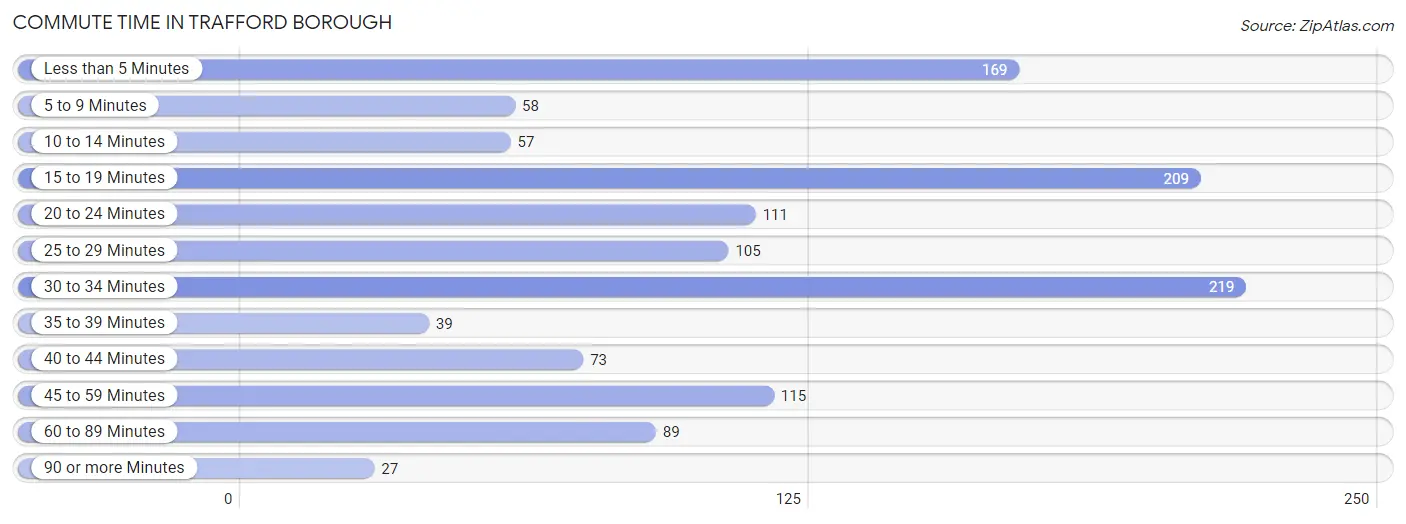
| Commute Time | # Commuters | % Commuters |
| Less than 5 Minutes | 169 | 13.3% |
| 5 to 9 Minutes | 58 | 4.6% |
| 10 to 14 Minutes | 57 | 4.5% |
| 15 to 19 Minutes | 209 | 16.4% |
| 20 to 24 Minutes | 111 | 8.7% |
| 25 to 29 Minutes | 105 | 8.3% |
| 30 to 34 Minutes | 219 | 17.2% |
| 35 to 39 Minutes | 39 | 3.1% |
| 40 to 44 Minutes | 73 | 5.7% |
| 45 to 59 Minutes | 115 | 9.0% |
| 60 to 89 Minutes | 89 | 7.0% |
| 90 or more Minutes | 27 | 2.1% |
Commute Time by Sex in Trafford borough
The most common commute times in Trafford borough are 15 to 19 minutes (100 commuters, 15.7%) for males and less than 5 minutes (122 commuters, 19.3%) for females.
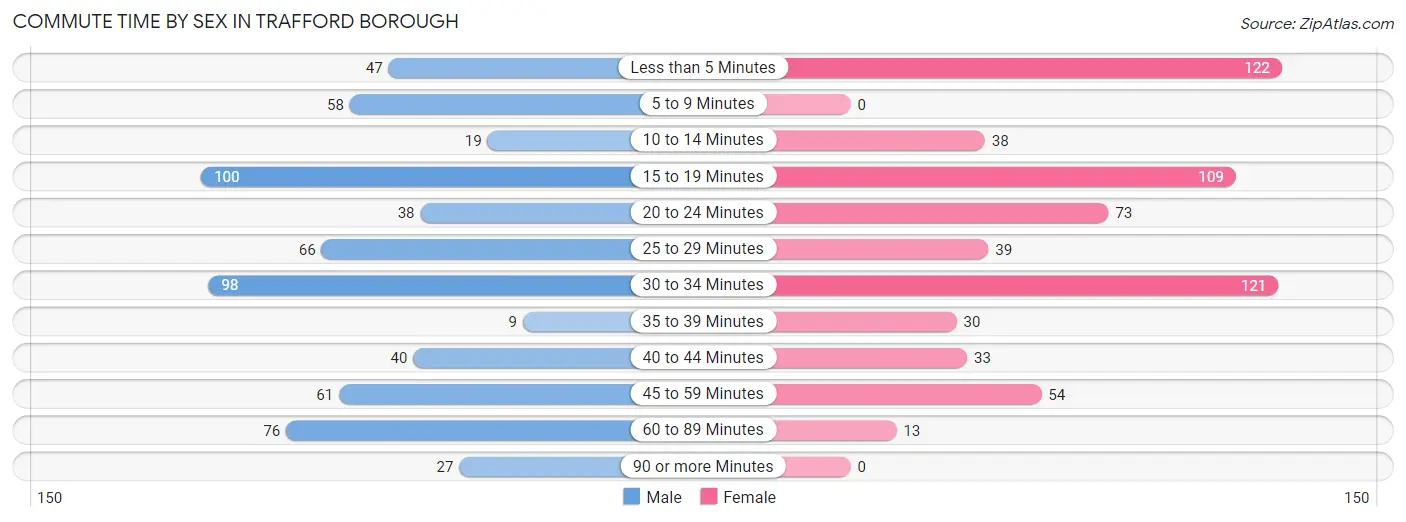
| Commute Time | Male | Female |
| Less than 5 Minutes | 47 (7.4%) | 122 (19.3%) |
| 5 to 9 Minutes | 58 (9.1%) | 0 (0.0%) |
| 10 to 14 Minutes | 19 (3.0%) | 38 (6.0%) |
| 15 to 19 Minutes | 100 (15.7%) | 109 (17.2%) |
| 20 to 24 Minutes | 38 (5.9%) | 73 (11.6%) |
| 25 to 29 Minutes | 66 (10.3%) | 39 (6.2%) |
| 30 to 34 Minutes | 98 (15.3%) | 121 (19.2%) |
| 35 to 39 Minutes | 9 (1.4%) | 30 (4.8%) |
| 40 to 44 Minutes | 40 (6.3%) | 33 (5.2%) |
| 45 to 59 Minutes | 61 (9.6%) | 54 (8.5%) |
| 60 to 89 Minutes | 76 (11.9%) | 13 (2.1%) |
| 90 or more Minutes | 27 (4.2%) | 0 (0.0%) |
Time of Departure to Work by Sex in Trafford borough
The most frequent times of departure to work in Trafford borough are 8:00 AM to 8:29 AM (110, 17.2%) for males and 10:00 AM to 10:59 AM (120, 19.0%) for females.
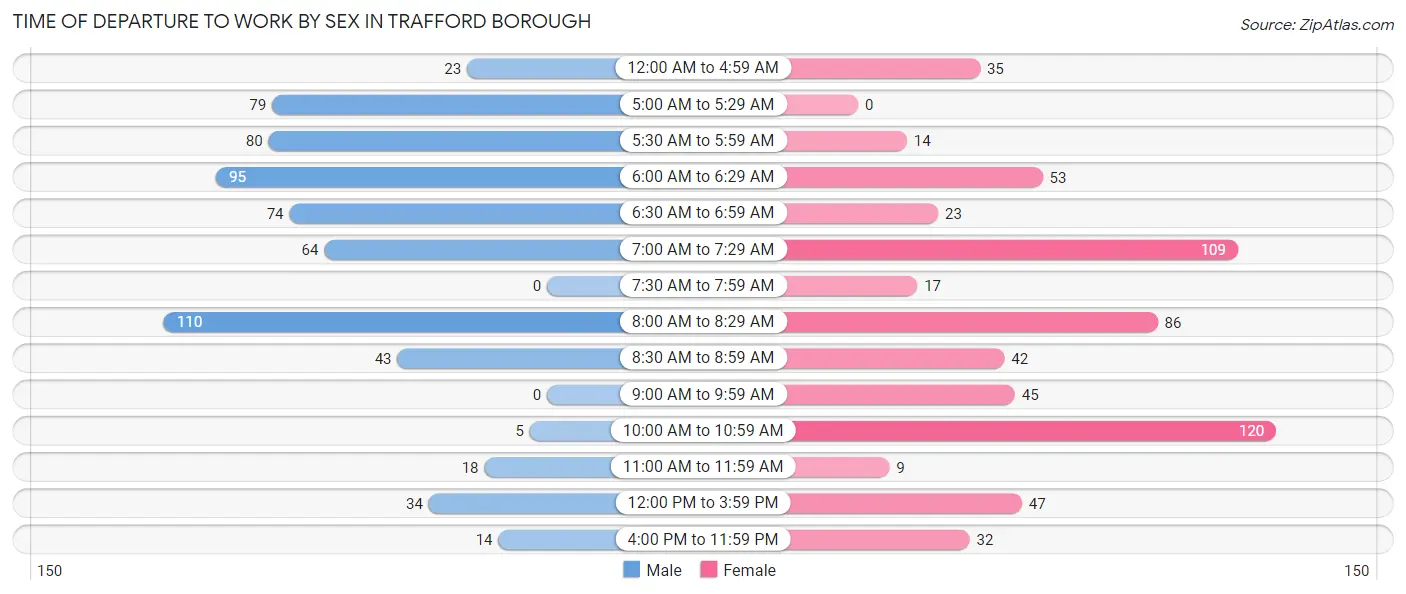
| Time of Departure | Male | Female |
| 12:00 AM to 4:59 AM | 23 (3.6%) | 35 (5.5%) |
| 5:00 AM to 5:29 AM | 79 (12.4%) | 0 (0.0%) |
| 5:30 AM to 5:59 AM | 80 (12.5%) | 14 (2.2%) |
| 6:00 AM to 6:29 AM | 95 (14.9%) | 53 (8.4%) |
| 6:30 AM to 6:59 AM | 74 (11.6%) | 23 (3.6%) |
| 7:00 AM to 7:29 AM | 64 (10.0%) | 109 (17.2%) |
| 7:30 AM to 7:59 AM | 0 (0.0%) | 17 (2.7%) |
| 8:00 AM to 8:29 AM | 110 (17.2%) | 86 (13.6%) |
| 8:30 AM to 8:59 AM | 43 (6.7%) | 42 (6.7%) |
| 9:00 AM to 9:59 AM | 0 (0.0%) | 45 (7.1%) |
| 10:00 AM to 10:59 AM | 5 (0.8%) | 120 (19.0%) |
| 11:00 AM to 11:59 AM | 18 (2.8%) | 9 (1.4%) |
| 12:00 PM to 3:59 PM | 34 (5.3%) | 47 (7.4%) |
| 4:00 PM to 11:59 PM | 14 (2.2%) | 32 (5.1%) |
| Total | 639 (100.0%) | 632 (100.0%) |
Housing Occupancy in Trafford borough
Occupancy by Ownership in Trafford borough
Of the total 1,400 dwellings in Trafford borough, owner-occupied units account for 1,005 (71.8%), while renter-occupied units make up 395 (28.2%).
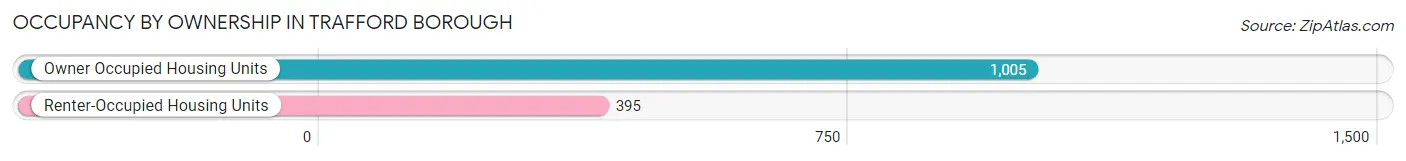
| Occupancy | # Housing Units | % Housing Units |
| Owner Occupied Housing Units | 1,005 | 71.8% |
| Renter-Occupied Housing Units | 395 | 28.2% |
| Total Occupied Housing Units | 1,400 | 100.0% |
Occupancy by Household Size in Trafford borough
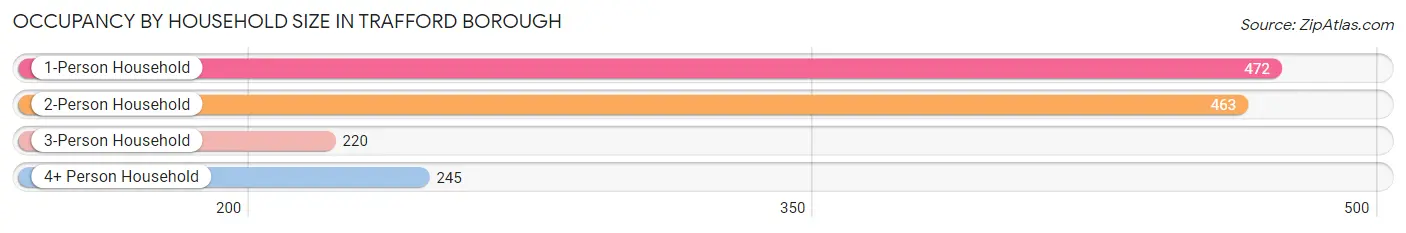
| Household Size | # Housing Units | % Housing Units |
| 1-Person Household | 472 | 33.7% |
| 2-Person Household | 463 | 33.1% |
| 3-Person Household | 220 | 15.7% |
| 4+ Person Household | 245 | 17.5% |
| Total Housing Units | 1,400 | 100.0% |
Occupancy by Ownership by Household Size in Trafford borough
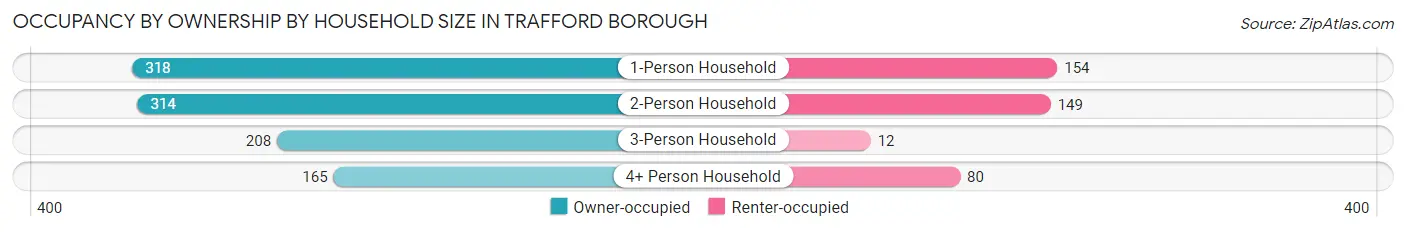
| Household Size | Owner-occupied | Renter-occupied |
| 1-Person Household | 318 (67.4%) | 154 (32.6%) |
| 2-Person Household | 314 (67.8%) | 149 (32.2%) |
| 3-Person Household | 208 (94.6%) | 12 (5.4%) |
| 4+ Person Household | 165 (67.3%) | 80 (32.7%) |
| Total Housing Units | 1,005 (71.8%) | 395 (28.2%) |
Occupancy by Educational Attainment in Trafford borough
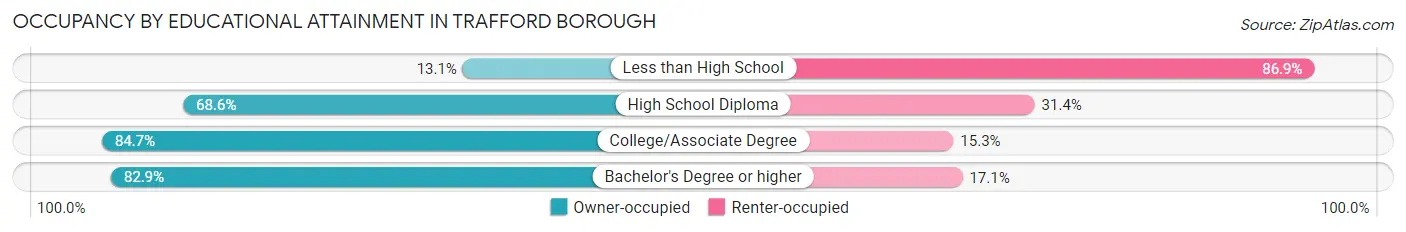
| Household Size | Owner-occupied | Renter-occupied |
| Less than High School | 18 (13.1%) | 119 (86.9%) |
| High School Diploma | 323 (68.6%) | 148 (31.4%) |
| College/Associate Degree | 354 (84.7%) | 64 (15.3%) |
| Bachelor's Degree or higher | 310 (82.9%) | 64 (17.1%) |
Occupancy by Age of Householder in Trafford borough
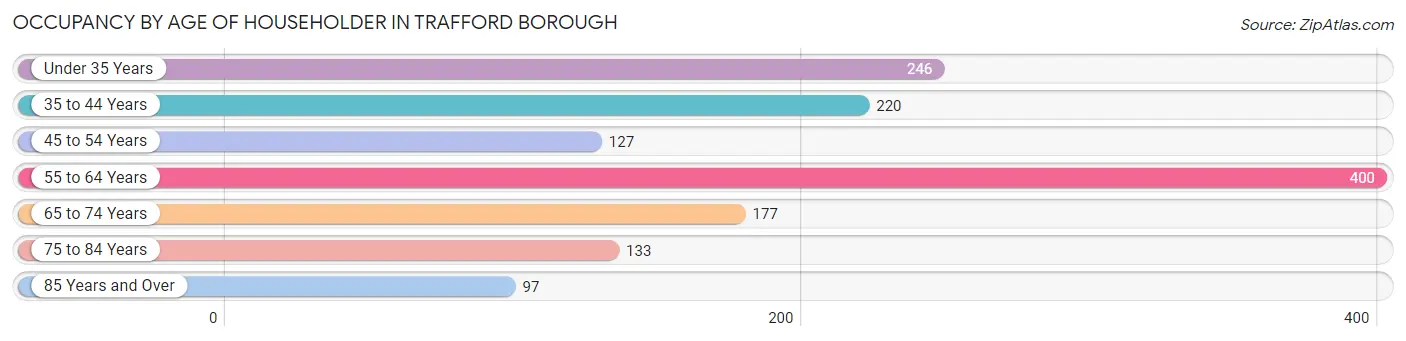
| Age Bracket | # Households | % Households |
| Under 35 Years | 246 | 17.6% |
| 35 to 44 Years | 220 | 15.7% |
| 45 to 54 Years | 127 | 9.1% |
| 55 to 64 Years | 400 | 28.6% |
| 65 to 74 Years | 177 | 12.6% |
| 75 to 84 Years | 133 | 9.5% |
| 85 Years and Over | 97 | 6.9% |
| Total | 1,400 | 100.0% |
Housing Finances in Trafford borough
Median Income by Occupancy in Trafford borough
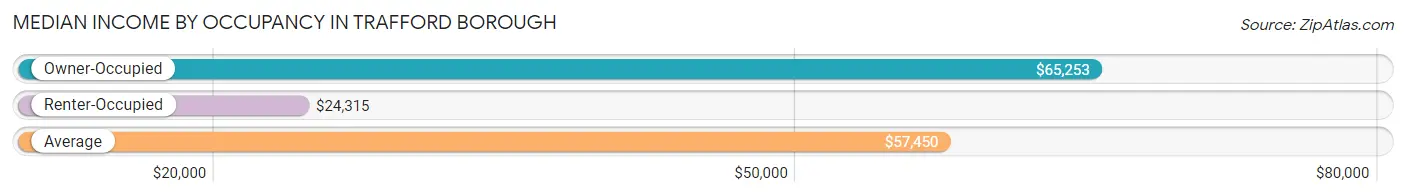
| Occupancy Type | # Households | Median Income |
| Owner-Occupied | 1,005 (71.8%) | $65,253 |
| Renter-Occupied | 395 (28.2%) | $24,315 |
| Average | 1,400 (100.0%) | $57,450 |
Occupancy by Householder Income Bracket in Trafford borough
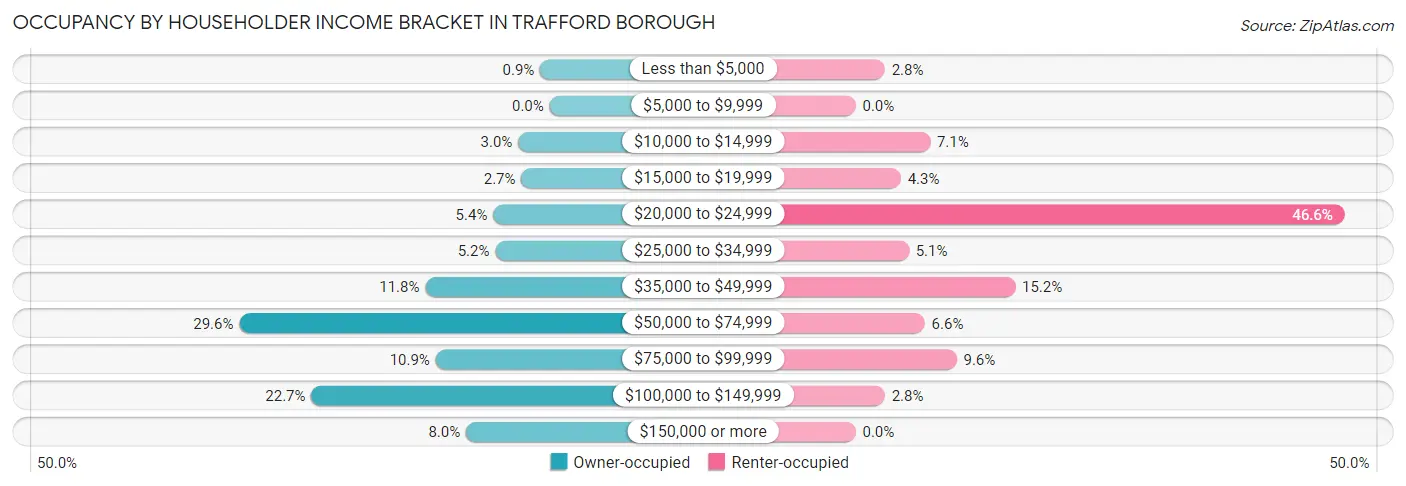
| Income Bracket | Owner-occupied | Renter-occupied |
| Less than $5,000 | 9 (0.9%) | 11 (2.8%) |
| $5,000 to $9,999 | 0 (0.0%) | 0 (0.0%) |
| $10,000 to $14,999 | 30 (3.0%) | 28 (7.1%) |
| $15,000 to $19,999 | 27 (2.7%) | 17 (4.3%) |
| $20,000 to $24,999 | 54 (5.4%) | 184 (46.6%) |
| $25,000 to $34,999 | 52 (5.2%) | 20 (5.1%) |
| $35,000 to $49,999 | 119 (11.8%) | 60 (15.2%) |
| $50,000 to $74,999 | 297 (29.5%) | 26 (6.6%) |
| $75,000 to $99,999 | 109 (10.8%) | 38 (9.6%) |
| $100,000 to $149,999 | 228 (22.7%) | 11 (2.8%) |
| $150,000 or more | 80 (8.0%) | 0 (0.0%) |
| Total | 1,005 (100.0%) | 395 (100.0%) |
Monthly Housing Cost Tiers in Trafford borough
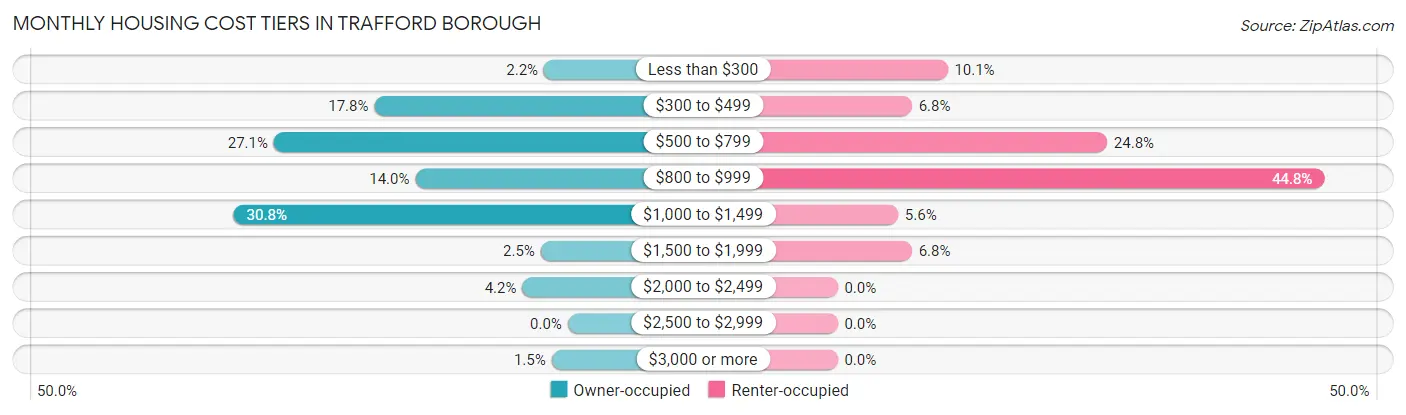
| Monthly Cost | Owner-occupied | Renter-occupied |
| Less than $300 | 22 (2.2%) | 40 (10.1%) |
| $300 to $499 | 179 (17.8%) | 27 (6.8%) |
| $500 to $799 | 272 (27.1%) | 98 (24.8%) |
| $800 to $999 | 141 (14.0%) | 177 (44.8%) |
| $1,000 to $1,499 | 309 (30.7%) | 22 (5.6%) |
| $1,500 to $1,999 | 25 (2.5%) | 27 (6.8%) |
| $2,000 to $2,499 | 42 (4.2%) | 0 (0.0%) |
| $2,500 to $2,999 | 0 (0.0%) | 0 (0.0%) |
| $3,000 or more | 15 (1.5%) | 0 (0.0%) |
| Total | 1,005 (100.0%) | 395 (100.0%) |
Physical Housing Characteristics in Trafford borough
Housing Structures in Trafford borough
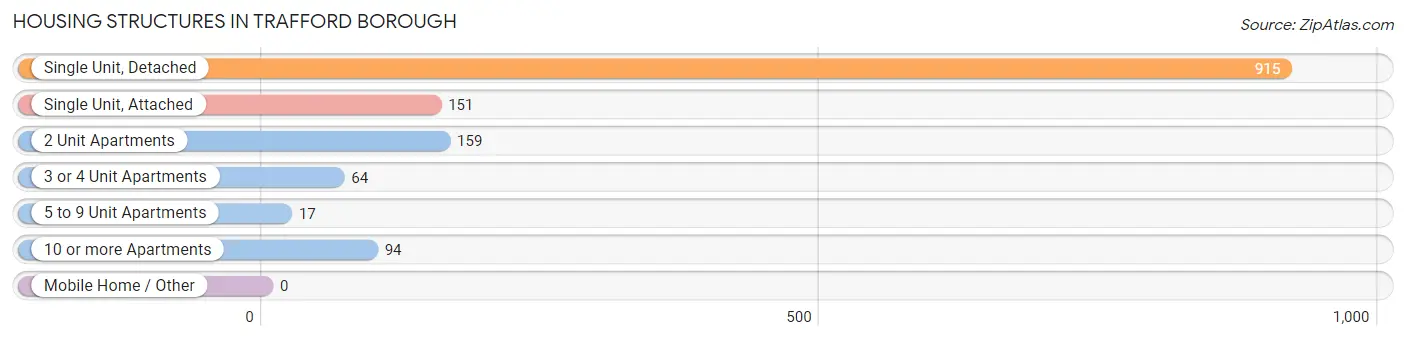
| Structure Type | # Housing Units | % Housing Units |
| Single Unit, Detached | 915 | 65.4% |
| Single Unit, Attached | 151 | 10.8% |
| 2 Unit Apartments | 159 | 11.4% |
| 3 or 4 Unit Apartments | 64 | 4.6% |
| 5 to 9 Unit Apartments | 17 | 1.2% |
| 10 or more Apartments | 94 | 6.7% |
| Mobile Home / Other | 0 | 0.0% |
| Total | 1,400 | 100.0% |
Housing Structures by Occupancy in Trafford borough
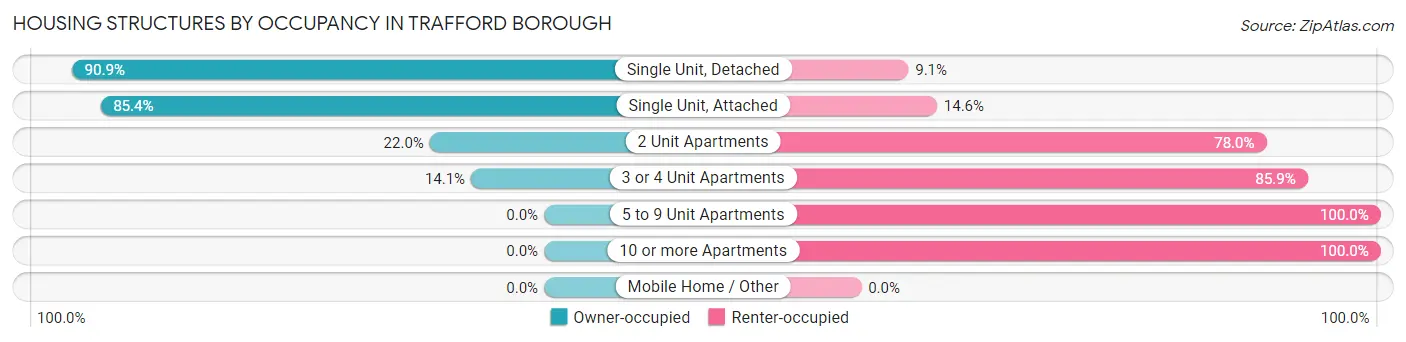
| Structure Type | Owner-occupied | Renter-occupied |
| Single Unit, Detached | 832 (90.9%) | 83 (9.1%) |
| Single Unit, Attached | 129 (85.4%) | 22 (14.6%) |
| 2 Unit Apartments | 35 (22.0%) | 124 (78.0%) |
| 3 or 4 Unit Apartments | 9 (14.1%) | 55 (85.9%) |
| 5 to 9 Unit Apartments | 0 (0.0%) | 17 (100.0%) |
| 10 or more Apartments | 0 (0.0%) | 94 (100.0%) |
| Mobile Home / Other | 0 (0.0%) | 0 (0.0%) |
| Total | 1,005 (71.8%) | 395 (28.2%) |
Housing Structures by Number of Rooms in Trafford borough
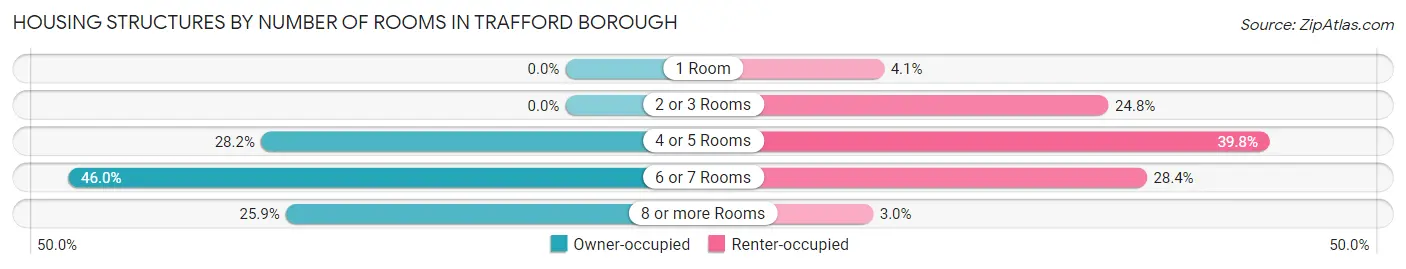
| Number of Rooms | Owner-occupied | Renter-occupied |
| 1 Room | 0 (0.0%) | 16 (4.1%) |
| 2 or 3 Rooms | 0 (0.0%) | 98 (24.8%) |
| 4 or 5 Rooms | 283 (28.2%) | 157 (39.8%) |
| 6 or 7 Rooms | 462 (46.0%) | 112 (28.3%) |
| 8 or more Rooms | 260 (25.9%) | 12 (3.0%) |
| Total | 1,005 (100.0%) | 395 (100.0%) |
Housing Structure by Heating Type in Trafford borough
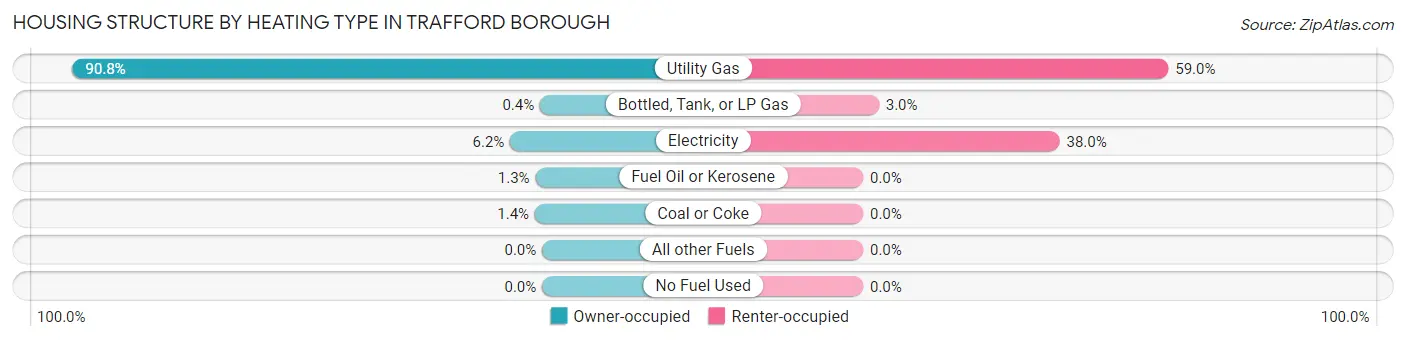
| Heating Type | Owner-occupied | Renter-occupied |
| Utility Gas | 912 (90.7%) | 233 (59.0%) |
| Bottled, Tank, or LP Gas | 4 (0.4%) | 12 (3.0%) |
| Electricity | 62 (6.2%) | 150 (38.0%) |
| Fuel Oil or Kerosene | 13 (1.3%) | 0 (0.0%) |
| Coal or Coke | 14 (1.4%) | 0 (0.0%) |
| All other Fuels | 0 (0.0%) | 0 (0.0%) |
| No Fuel Used | 0 (0.0%) | 0 (0.0%) |
| Total | 1,005 (100.0%) | 395 (100.0%) |
Household Vehicle Usage in Trafford borough
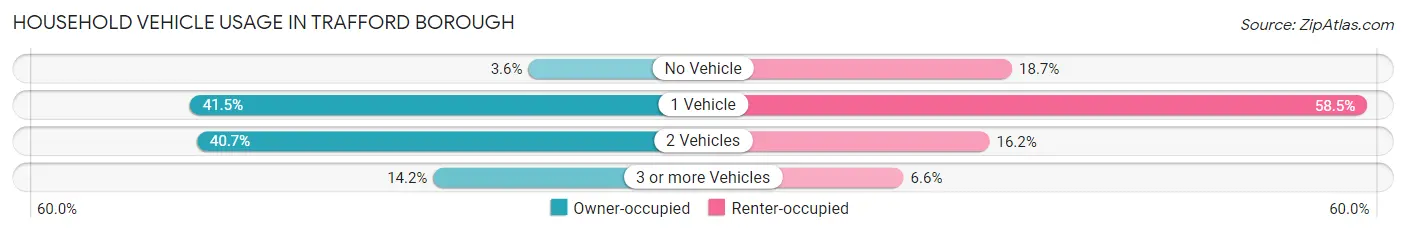
| Vehicles per Household | Owner-occupied | Renter-occupied |
| No Vehicle | 36 (3.6%) | 74 (18.7%) |
| 1 Vehicle | 417 (41.5%) | 231 (58.5%) |
| 2 Vehicles | 409 (40.7%) | 64 (16.2%) |
| 3 or more Vehicles | 143 (14.2%) | 26 (6.6%) |
| Total | 1,005 (100.0%) | 395 (100.0%) |
Real Estate & Mortgages in Trafford borough
Real Estate and Mortgage Overview in Trafford borough
| Characteristic | Without Mortgage | With Mortgage |
| Housing Units | 475 | 530 |
| Median Property Value | $137,100 | $131,700 |
| Median Household Income | $56,875 | $50 |
| Monthly Housing Costs | $529 | $15 |
| Real Estate Taxes | $2,420 | $12 |
Property Value by Mortgage Status in Trafford borough
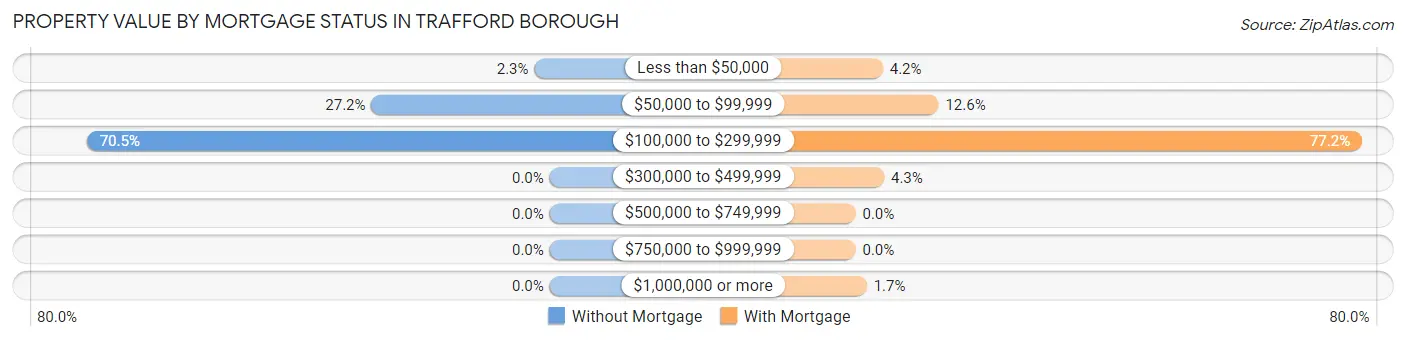
| Property Value | Without Mortgage | With Mortgage |
| Less than $50,000 | 11 (2.3%) | 22 (4.2%) |
| $50,000 to $99,999 | 129 (27.2%) | 67 (12.6%) |
| $100,000 to $299,999 | 335 (70.5%) | 409 (77.2%) |
| $300,000 to $499,999 | 0 (0.0%) | 23 (4.3%) |
| $500,000 to $749,999 | 0 (0.0%) | 0 (0.0%) |
| $750,000 to $999,999 | 0 (0.0%) | 0 (0.0%) |
| $1,000,000 or more | 0 (0.0%) | 9 (1.7%) |
| Total | 475 (100.0%) | 530 (100.0%) |
Household Income by Mortgage Status in Trafford borough
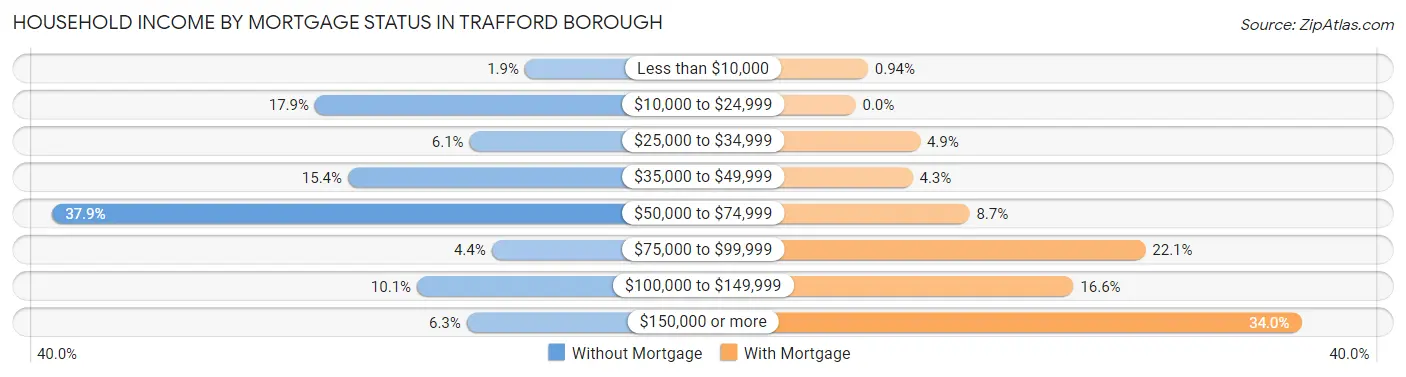
| Household Income | Without Mortgage | With Mortgage |
| Less than $10,000 | 9 (1.9%) | 5 (0.9%) |
| $10,000 to $24,999 | 85 (17.9%) | 0 (0.0%) |
| $25,000 to $34,999 | 29 (6.1%) | 26 (4.9%) |
| $35,000 to $49,999 | 73 (15.4%) | 23 (4.3%) |
| $50,000 to $74,999 | 180 (37.9%) | 46 (8.7%) |
| $75,000 to $99,999 | 21 (4.4%) | 117 (22.1%) |
| $100,000 to $149,999 | 48 (10.1%) | 88 (16.6%) |
| $150,000 or more | 30 (6.3%) | 180 (34.0%) |
| Total | 475 (100.0%) | 530 (100.0%) |
Property Value to Household Income Ratio in Trafford borough
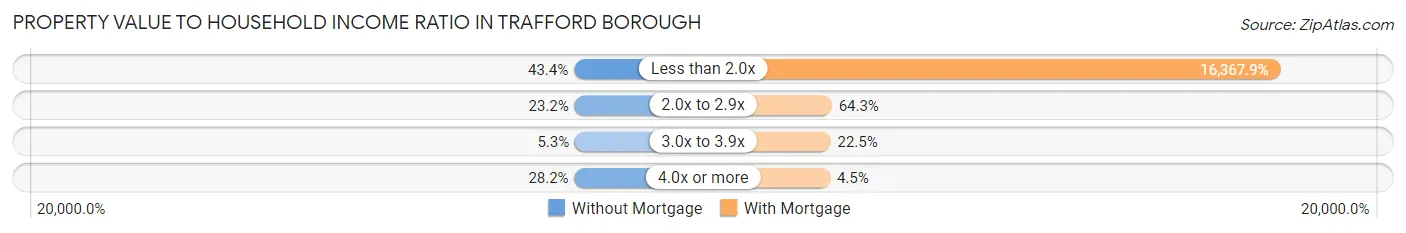
| Value-to-Income Ratio | Without Mortgage | With Mortgage |
| Less than 2.0x | 206 (43.4%) | 86,750 (16,367.9%) |
| 2.0x to 2.9x | 110 (23.2%) | 341 (64.3%) |
| 3.0x to 3.9x | 25 (5.3%) | 119 (22.5%) |
| 4.0x or more | 134 (28.2%) | 24 (4.5%) |
| Total | 475 (100.0%) | 530 (100.0%) |
Real Estate Taxes by Mortgage Status in Trafford borough
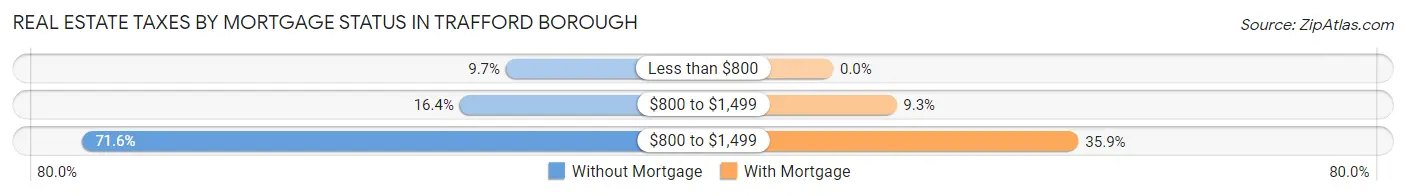
| Property Taxes | Without Mortgage | With Mortgage |
| Less than $800 | 46 (9.7%) | 0 (0.0%) |
| $800 to $1,499 | 78 (16.4%) | 49 (9.2%) |
| $800 to $1,499 | 340 (71.6%) | 190 (35.8%) |
| Total | 475 (100.0%) | 530 (100.0%) |
Health & Disability in Trafford borough
Health Insurance Coverage by Age in Trafford borough
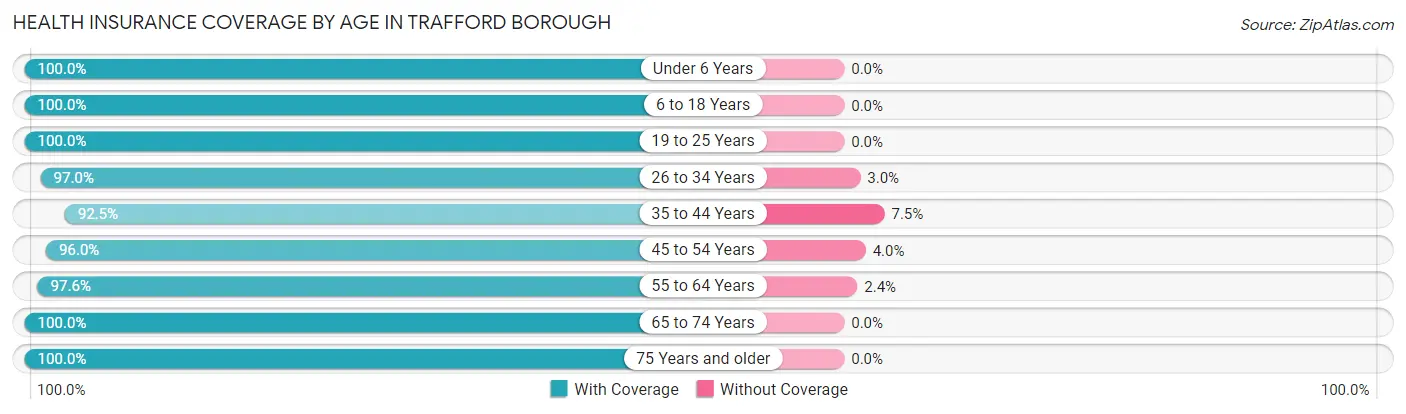
| Age Bracket | With Coverage | Without Coverage |
| Under 6 Years | 312 (100.0%) | 0 (0.0%) |
| 6 to 18 Years | 395 (100.0%) | 0 (0.0%) |
| 19 to 25 Years | 144 (100.0%) | 0 (0.0%) |
| 26 to 34 Years | 585 (97.0%) | 18 (3.0%) |
| 35 to 44 Years | 296 (92.5%) | 24 (7.5%) |
| 45 to 54 Years | 265 (96.0%) | 11 (4.0%) |
| 55 to 64 Years | 601 (97.6%) | 15 (2.4%) |
| 65 to 74 Years | 266 (100.0%) | 0 (0.0%) |
| 75 Years and older | 305 (100.0%) | 0 (0.0%) |
| Total | 3,169 (97.9%) | 68 (2.1%) |
Health Insurance Coverage by Citizenship Status in Trafford borough
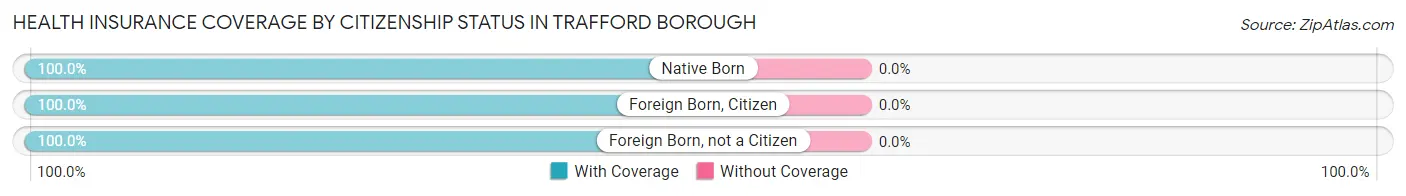
| Citizenship Status | With Coverage | Without Coverage |
| Native Born | 312 (100.0%) | 0 (0.0%) |
| Foreign Born, Citizen | 395 (100.0%) | 0 (0.0%) |
| Foreign Born, not a Citizen | 144 (100.0%) | 0 (0.0%) |
Health Insurance Coverage by Household Income in Trafford borough
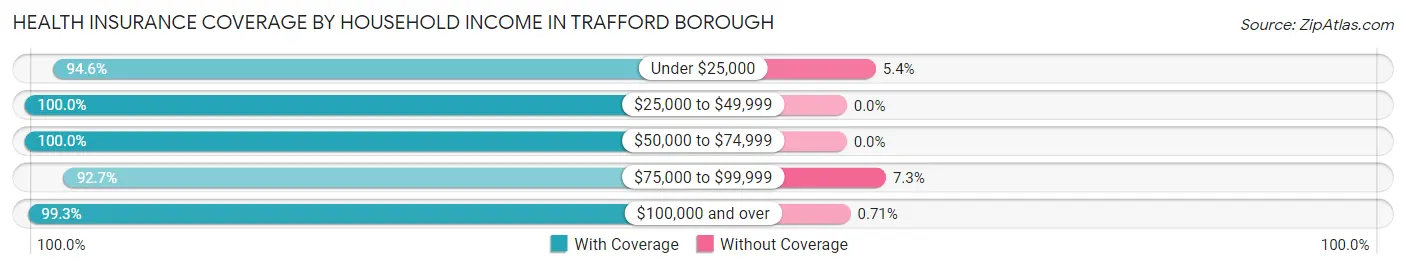
| Household Income | With Coverage | Without Coverage |
| Under $25,000 | 452 (94.6%) | 26 (5.4%) |
| $25,000 to $49,999 | 493 (100.0%) | 0 (0.0%) |
| $50,000 to $74,999 | 681 (100.0%) | 0 (0.0%) |
| $75,000 to $99,999 | 429 (92.7%) | 34 (7.3%) |
| $100,000 and over | 1,114 (99.3%) | 8 (0.7%) |
Public vs Private Health Insurance Coverage by Age in Trafford borough
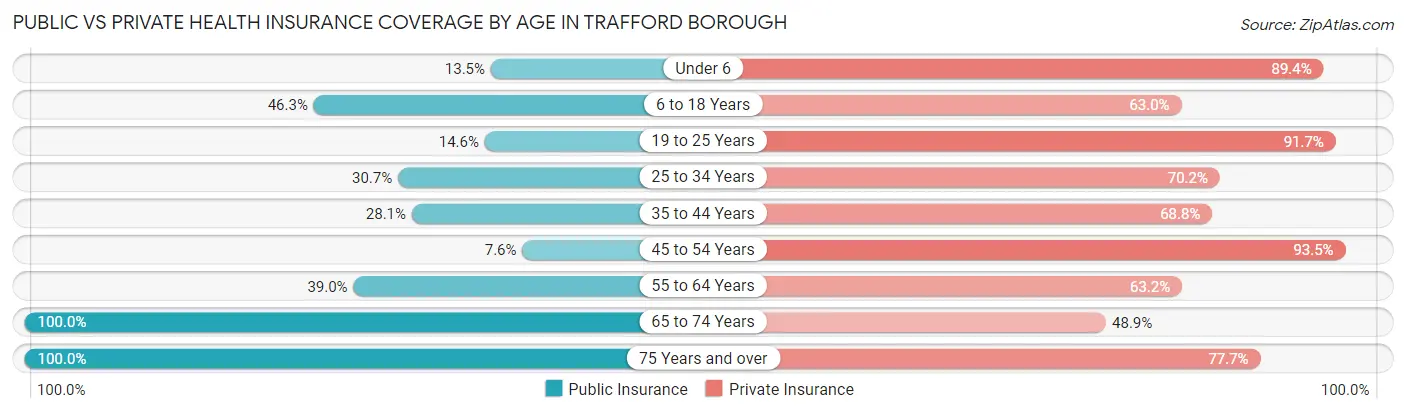
| Age Bracket | Public Insurance | Private Insurance |
| Under 6 | 42 (13.5%) | 279 (89.4%) |
| 6 to 18 Years | 183 (46.3%) | 249 (63.0%) |
| 19 to 25 Years | 21 (14.6%) | 132 (91.7%) |
| 25 to 34 Years | 185 (30.7%) | 423 (70.2%) |
| 35 to 44 Years | 90 (28.1%) | 220 (68.8%) |
| 45 to 54 Years | 21 (7.6%) | 258 (93.5%) |
| 55 to 64 Years | 240 (39.0%) | 389 (63.1%) |
| 65 to 74 Years | 266 (100.0%) | 130 (48.9%) |
| 75 Years and over | 305 (100.0%) | 237 (77.7%) |
| Total | 1,353 (41.8%) | 2,317 (71.6%) |
Disability Status by Sex by Age in Trafford borough
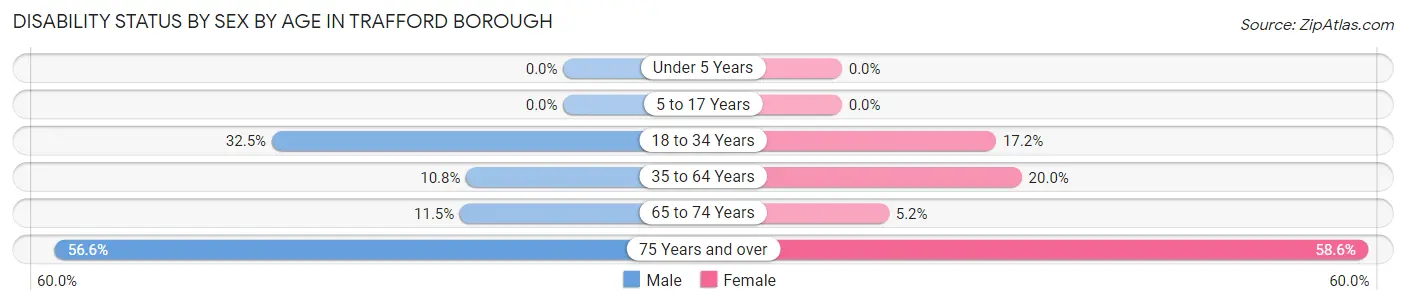
| Age Bracket | Male | Female |
| Under 5 Years | 0 (0.0%) | 0 (0.0%) |
| 5 to 17 Years | 0 (0.0%) | 0 (0.0%) |
| 18 to 34 Years | 136 (32.5%) | 62 (17.2%) |
| 35 to 64 Years | 63 (10.8%) | 126 (20.0%) |
| 65 to 74 Years | 13 (11.5%) | 8 (5.2%) |
| 75 Years and over | 47 (56.6%) | 130 (58.6%) |
Disability Class by Sex by Age in Trafford borough
Disability Class: Hearing Difficulty
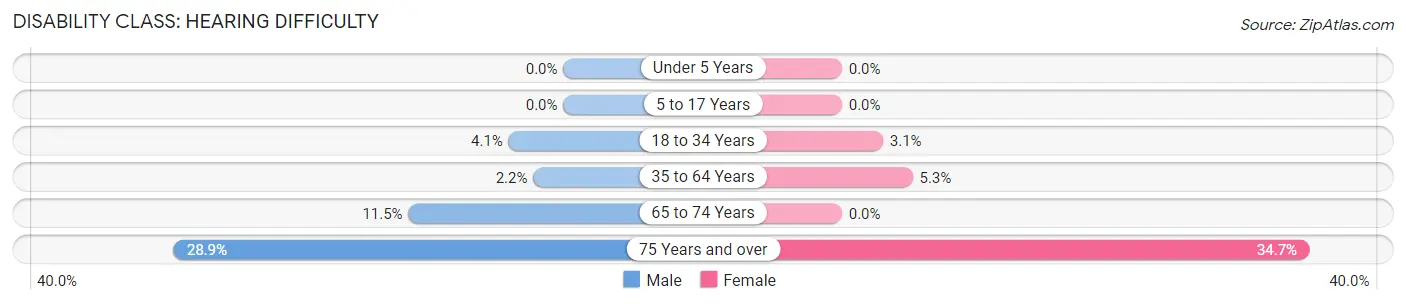
| Age Bracket | Male | Female |
| Under 5 Years | 0 (0.0%) | 0 (0.0%) |
| 5 to 17 Years | 0 (0.0%) | 0 (0.0%) |
| 18 to 34 Years | 17 (4.1%) | 11 (3.0%) |
| 35 to 64 Years | 13 (2.2%) | 33 (5.2%) |
| 65 to 74 Years | 13 (11.5%) | 0 (0.0%) |
| 75 Years and over | 24 (28.9%) | 77 (34.7%) |
Disability Class: Vision Difficulty
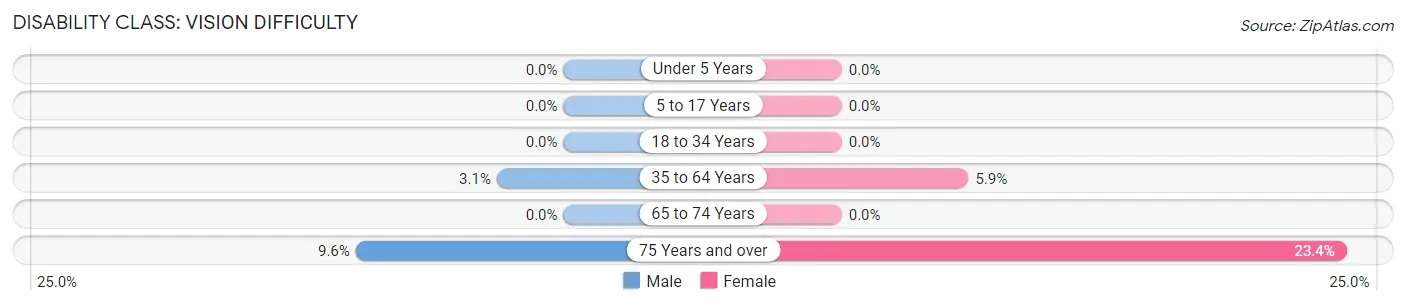
| Age Bracket | Male | Female |
| Under 5 Years | 0 (0.0%) | 0 (0.0%) |
| 5 to 17 Years | 0 (0.0%) | 0 (0.0%) |
| 18 to 34 Years | 0 (0.0%) | 0 (0.0%) |
| 35 to 64 Years | 18 (3.1%) | 37 (5.9%) |
| 65 to 74 Years | 0 (0.0%) | 0 (0.0%) |
| 75 Years and over | 8 (9.6%) | 52 (23.4%) |
Disability Class: Cognitive Difficulty
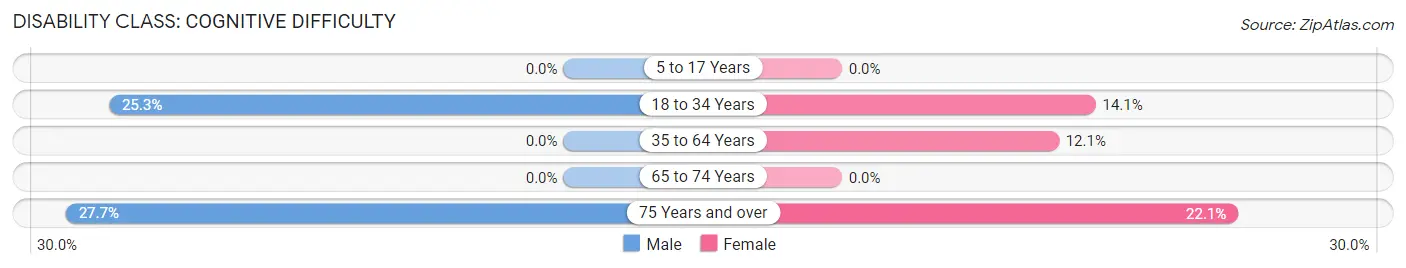
| Age Bracket | Male | Female |
| 5 to 17 Years | 0 (0.0%) | 0 (0.0%) |
| 18 to 34 Years | 106 (25.3%) | 51 (14.1%) |
| 35 to 64 Years | 0 (0.0%) | 76 (12.1%) |
| 65 to 74 Years | 0 (0.0%) | 0 (0.0%) |
| 75 Years and over | 23 (27.7%) | 49 (22.1%) |
Disability Class: Ambulatory Difficulty
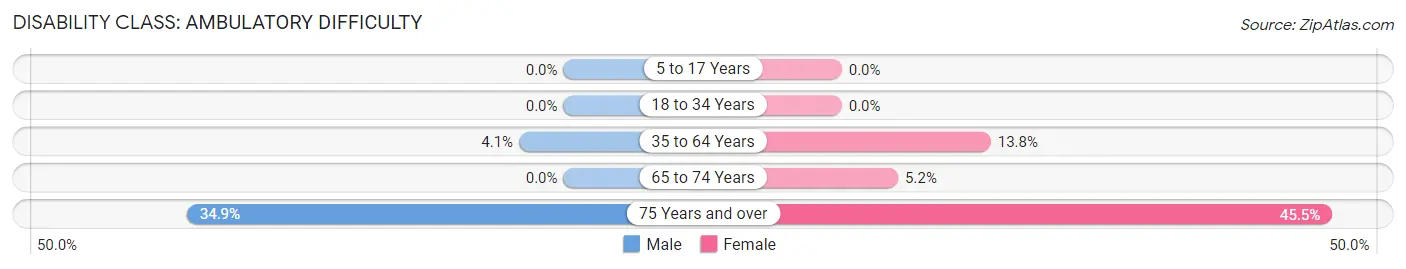
| Age Bracket | Male | Female |
| 5 to 17 Years | 0 (0.0%) | 0 (0.0%) |
| 18 to 34 Years | 0 (0.0%) | 0 (0.0%) |
| 35 to 64 Years | 24 (4.1%) | 87 (13.8%) |
| 65 to 74 Years | 0 (0.0%) | 8 (5.2%) |
| 75 Years and over | 29 (34.9%) | 101 (45.5%) |
Disability Class: Self-Care Difficulty
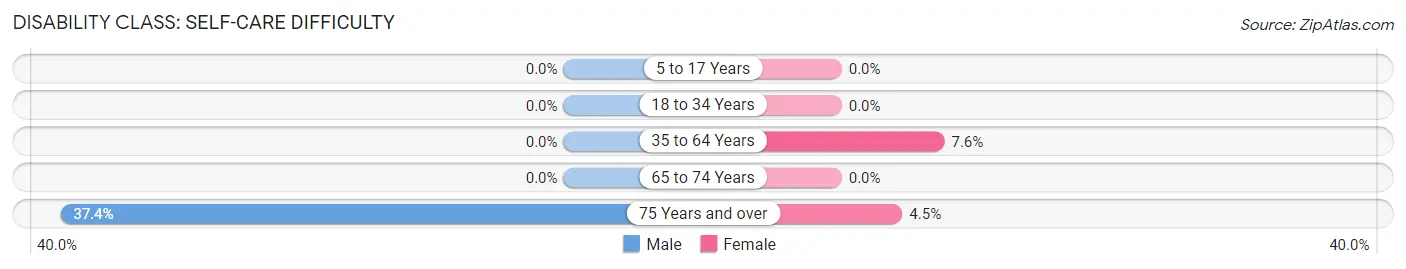
| Age Bracket | Male | Female |
| 5 to 17 Years | 0 (0.0%) | 0 (0.0%) |
| 18 to 34 Years | 0 (0.0%) | 0 (0.0%) |
| 35 to 64 Years | 0 (0.0%) | 48 (7.6%) |
| 65 to 74 Years | 0 (0.0%) | 0 (0.0%) |
| 75 Years and over | 31 (37.3%) | 10 (4.5%) |
Technology Access in Trafford borough
Computing Device Access in Trafford borough
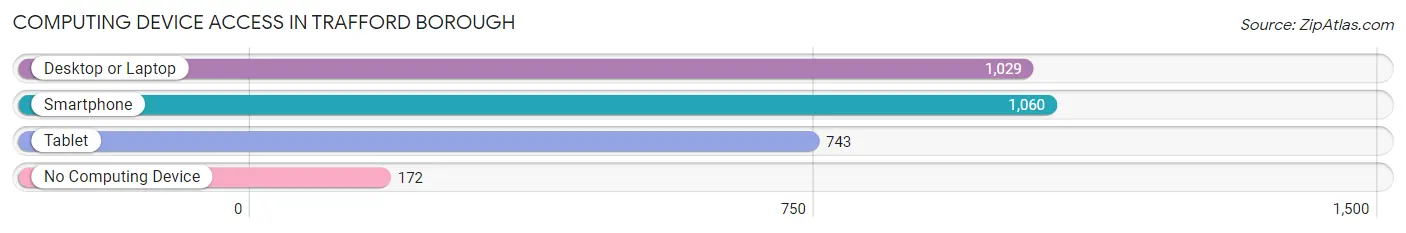
| Device Type | # Households | % Households |
| Desktop or Laptop | 1,029 | 73.5% |
| Smartphone | 1,060 | 75.7% |
| Tablet | 743 | 53.1% |
| No Computing Device | 172 | 12.3% |
| Total | 1,400 | 100.0% |
Internet Access in Trafford borough
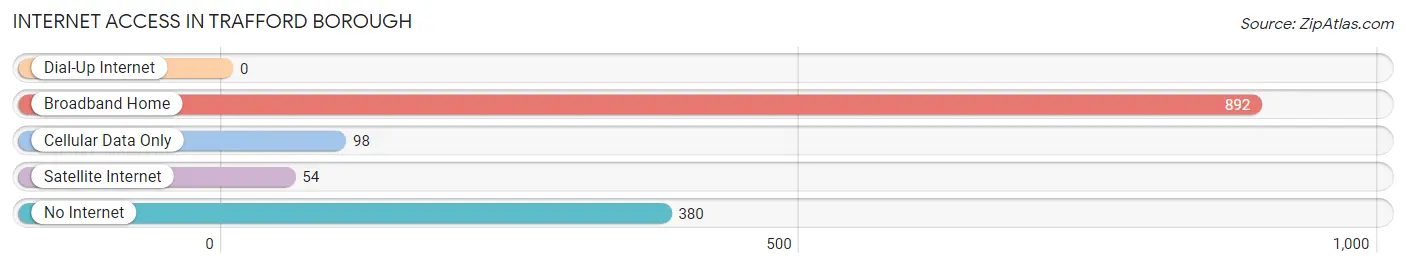
| Internet Type | # Households | % Households |
| Dial-Up Internet | 0 | 0.0% |
| Broadband Home | 892 | 63.7% |
| Cellular Data Only | 98 | 7.0% |
| Satellite Internet | 54 | 3.9% |
| No Internet | 380 | 27.1% |
| Total | 1,400 | 100.0% |
Trafford borough Summary
Trafford Borough is a borough located in Allegheny County, Pennsylvania. It is a suburb of Pittsburgh and is part of the Greater Pittsburgh Metropolitan Area. The population of Trafford Borough was 2,845 at the 2010 census.
History
The area that is now Trafford Borough was first settled in the late 1700s by a group of Scots-Irish immigrants. The area was originally known as "Trafford's Crossroads" due to its location at the intersection of two major roads. The area was officially incorporated as a borough in 1891.
The borough was named after Trafford, England, which was the hometown of one of the original settlers. The borough was originally a farming community, but it began to grow in the early 1900s when the Pennsylvania Railroad built a line through the area. This allowed for the development of industry and commerce in the area.
Geography
Trafford Borough is located in Allegheny County, Pennsylvania. It is situated in the Monongahela River Valley, about 15 miles southeast of Pittsburgh. The borough is bordered by the boroughs of Wilmerding and North Versailles to the north, East McKeesport to the east, and Monroeville to the south.
The borough has a total area of 1.2 square miles, all of which is land. The terrain is mostly flat, with some rolling hills. The borough is located in the Allegheny Plateau region of Pennsylvania.
Economy
The economy of Trafford Borough is largely based on manufacturing and retail. The borough is home to several manufacturing companies, including a steel mill, a paper mill, and a plastics factory. There are also several retail stores in the borough, including a grocery store, a hardware store, and a pharmacy.
The borough also has a number of small businesses, including restaurants, auto repair shops, and a variety of other services. The borough is also home to a number of professional offices, including lawyers, accountants, and doctors.
Demographics
As of the 2010 census, the population of Trafford Borough was 2,845. The racial makeup of the borough was 94.3% White, 2.7% African American, 0.3% Native American, 0.7% Asian, 0.1% Pacific Islander, 0.7% from other races, and 1.2% from two or more races. Hispanic or Latino of any race were 1.7% of the population.
The median household income in Trafford Borough was $45,938, and the median family income was $54,844. The per capita income was $21,945. About 8.3% of families and 10.2% of the population were below the poverty line, including 14.2% of those under age 18 and 6.2% of those age 65 or over.
The population of Trafford Borough is largely made up of families. About 57.3% of households are married couples living together, and 32.2% have children under the age of 18 living with them. The borough is also home to a large number of senior citizens, with about 20.3% of the population over the age of 65.
Common Questions
What is the Total Population of Trafford borough?
Total Population of Trafford borough is 3,237.
What is the Total Male Population of Trafford borough?
Total Male Population of Trafford borough is 1,480.
What is the Total Female Population of Trafford borough?
Total Female Population of Trafford borough is 1,757.
What is the Ratio of Males per 100 Females in Trafford borough?
There are 84.23 Males per 100 Females in Trafford borough.
What is the Ratio of Females per 100 Males in Trafford borough?
There are 118.72 Females per 100 Males in Trafford borough.
What is the Median Population Age in Trafford borough?
Median Population Age in Trafford borough is 38.3 Years.
What is the Average Family Size in Trafford borough
Average Family Size in Trafford borough is 2.9 People.
What is the Average Household Size in Trafford borough
Average Household Size in Trafford borough is 2.3 People.
What is Per Capita Income in Trafford borough?
Per Capita income in Trafford borough is $29,597.
What is the Median Family Income in Trafford borough?
Median Family Income in Trafford borough is $61,836.
What is the Median Household income in Trafford borough?
Median Household Income in Trafford borough is $57,450.
What is Income or Wage Gap in Trafford borough?
Income or Wage Gap in Trafford borough is 30.6%.
Women in Trafford borough earn 69.4 cents for every dollar earned by a man.
What is Inequality or Gini Index in Trafford borough?
Inequality or Gini Index in Trafford borough is 0.38.
How Large is the Labor Force in Trafford borough?
There are 1,536 People in the Labor Forcein in Trafford borough.
What is the Percentage of People in the Labor Force in Trafford borough?
59.3% of People are in the Labor Force in Trafford borough.
What is the Unemployment Rate in Trafford borough?
Unemployment Rate in Trafford borough is 4.5%.