Milwaukie, OR
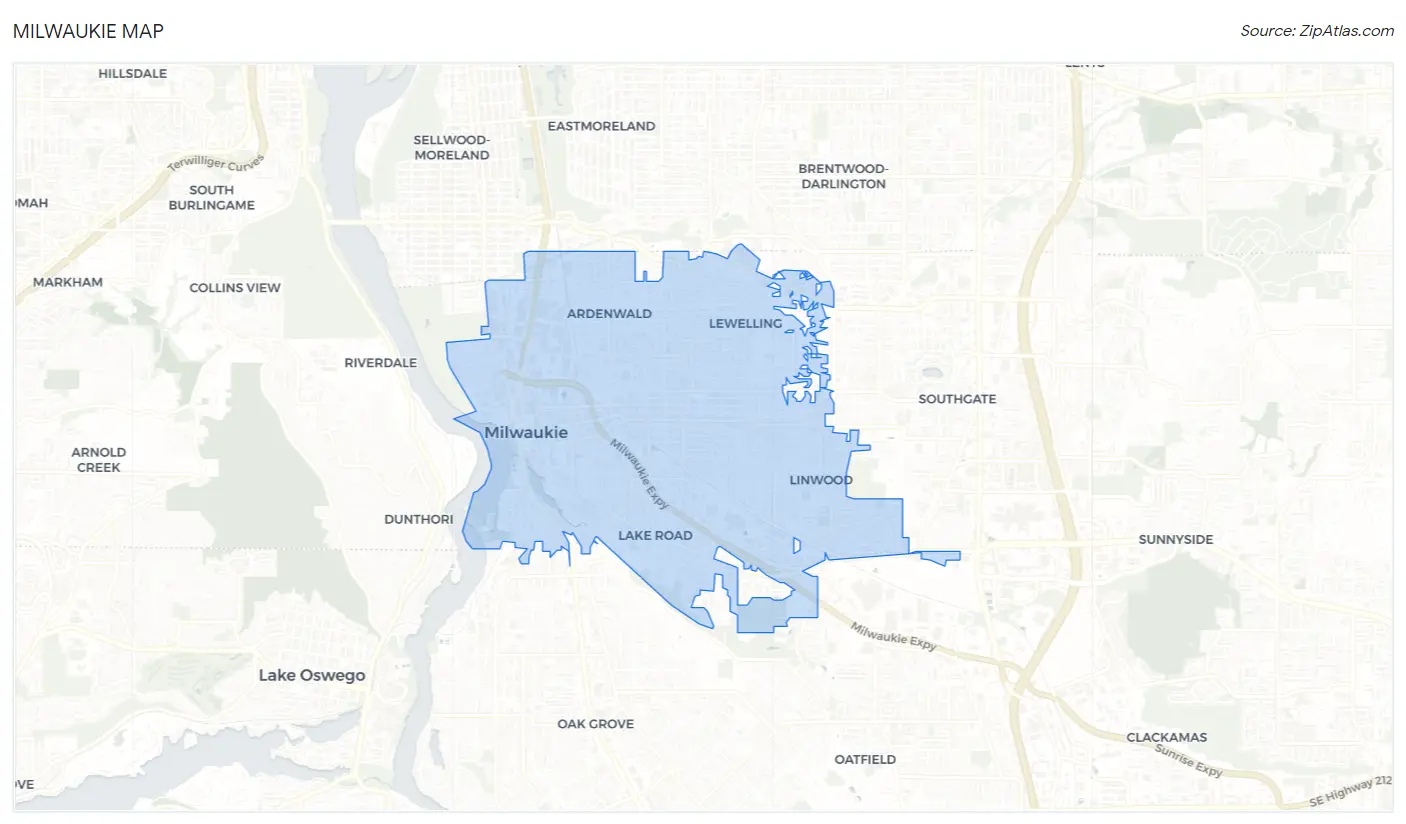
Milwaukie Map
Milwaukie Overview
21,195
TOTAL POPULATION
10,230
MALE POPULATION
10,965
FEMALE POPULATION
93.30
MALES / 100 FEMALES
107.18
FEMALES / 100 MALES
40.2
MEDIAN AGE
2.9
AVG FAMILY SIZE
2.2
AVG HOUSEHOLD SIZE
$44,973
PER CAPITA INCOME
$102,839
AVG FAMILY INCOME
$78,676
AVG HOUSEHOLD INCOME
28.1%
WAGE / INCOME GAP [ % ]
71.9¢/ $1
WAGE / INCOME GAP [ $ ]
0.40
INEQUALITY / GINI INDEX
12,624
LABOR FORCE [ PEOPLE ]
70.5%
PERCENT IN LABOR FORCE
5.5%
UNEMPLOYMENT RATE
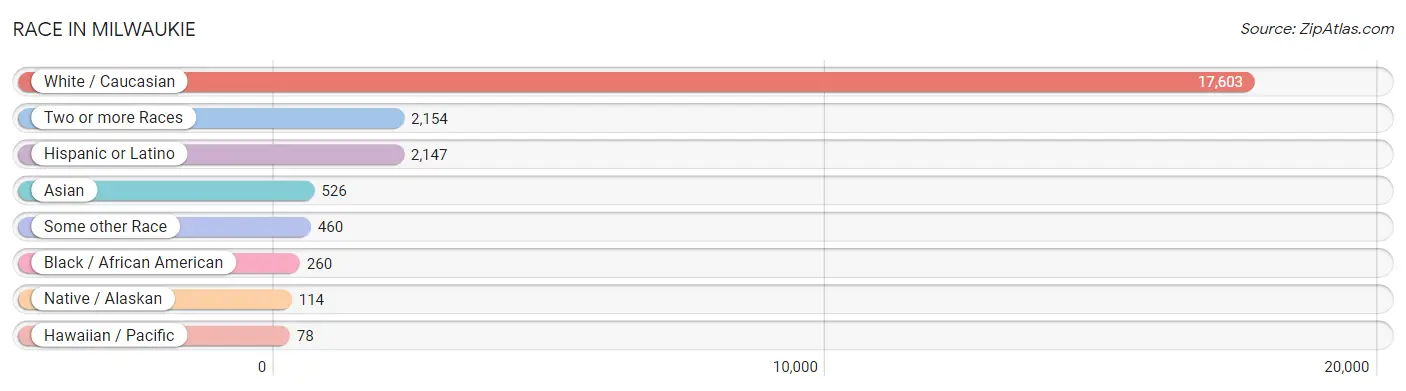
Race in Milwaukie
The most populous races in Milwaukie are White / Caucasian (17,603 | 83.1%), Two or more Races (2,154 | 10.2%), and Hispanic or Latino (2,147 | 10.1%).
| Race | # Population | % Population |
| Asian | 526 | 2.5% |
| Black / African American | 260 | 1.2% |
| Hawaiian / Pacific | 78 | 0.4% |
| Hispanic or Latino | 2,147 | 10.1% |
| Native / Alaskan | 114 | 0.5% |
| White / Caucasian | 17,603 | 83.1% |
| Two or more Races | 2,154 | 10.2% |
| Some other Race | 460 | 2.2% |
| Total | 21,195 | 100.0% |
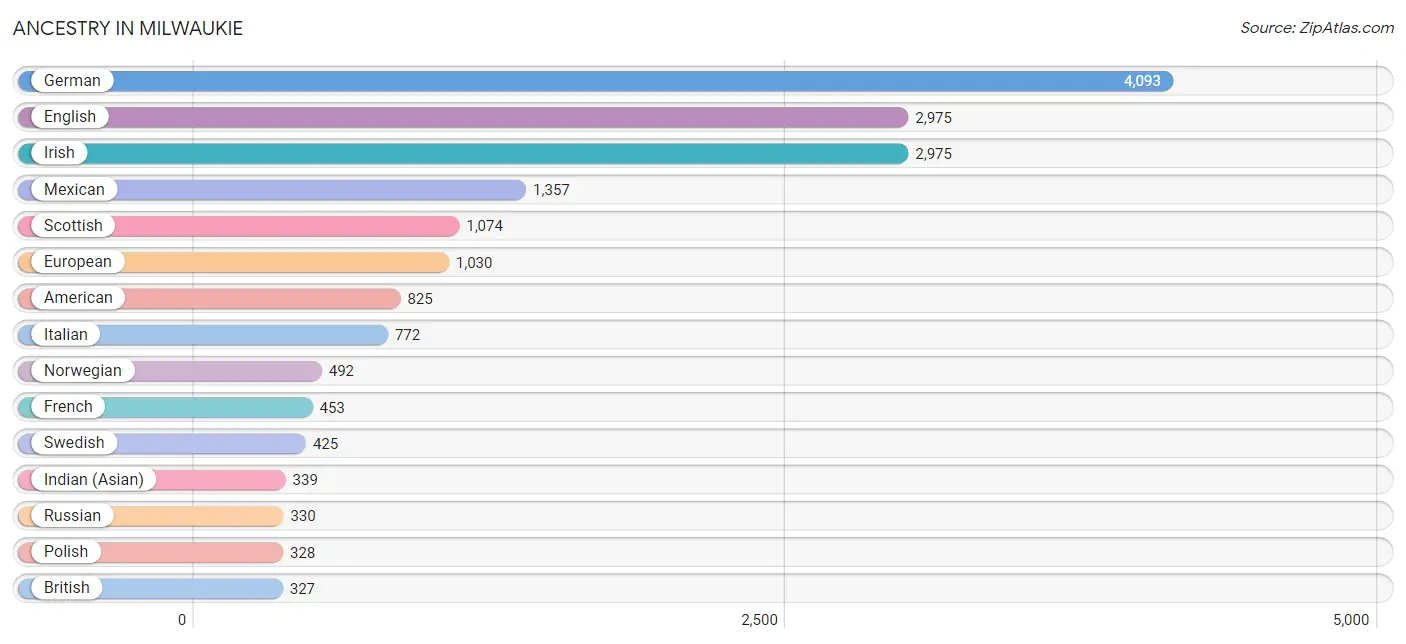
Ancestry in Milwaukie
The most populous ancestries reported in Milwaukie are German (4,093 | 19.3%), English (2,975 | 14.0%), Irish (2,975 | 14.0%), Mexican (1,357 | 6.4%), and Scottish (1,074 | 5.1%), together accounting for 58.9% of all Milwaukie residents.
| Ancestry | # Population | % Population |
| American | 825 | 3.9% |
| Arab | 119 | 0.6% |
| Armenian | 33 | 0.2% |
| Australian | 6 | 0.0% |
| Austrian | 44 | 0.2% |
| Basque | 9 | 0.0% |
| Belgian | 60 | 0.3% |
| Bhutanese | 69 | 0.3% |
| Blackfeet | 41 | 0.2% |
| British | 327 | 1.5% |
| Burmese | 63 | 0.3% |
| Canadian | 73 | 0.3% |
| Celtic | 19 | 0.1% |
| Central American | 67 | 0.3% |
| Central American Indian | 31 | 0.2% |
| Cherokee | 175 | 0.8% |
| Chilean | 37 | 0.2% |
| Chinese | 55 | 0.3% |
| Chippewa | 6 | 0.0% |
| Choctaw | 27 | 0.1% |
| Croatian | 32 | 0.2% |
| Cuban | 29 | 0.1% |
| Czech | 122 | 0.6% |
| Czechoslovakian | 50 | 0.2% |
| Danish | 129 | 0.6% |
| Dominican | 13 | 0.1% |
| Dutch | 287 | 1.3% |
| Eastern European | 199 | 0.9% |
| English | 2,975 | 14.0% |
| Estonian | 63 | 0.3% |
| European | 1,030 | 4.9% |
| Filipino | 46 | 0.2% |
| Finnish | 145 | 0.7% |
| French | 453 | 2.1% |
| French Canadian | 139 | 0.7% |
| German | 4,093 | 19.3% |
| Greek | 29 | 0.1% |
| Guatemalan | 11 | 0.1% |
| Haitian | 13 | 0.1% |
| Hungarian | 64 | 0.3% |
| Icelander | 13 | 0.1% |
| Indian (Asian) | 339 | 1.6% |
| Iraqi | 15 | 0.1% |
| Irish | 2,975 | 14.0% |
| Italian | 772 | 3.6% |
| Japanese | 28 | 0.1% |
| Korean | 101 | 0.5% |
| Laotian | 6 | 0.0% |
| Latvian | 19 | 0.1% |
| Lebanese | 71 | 0.3% |
| Lithuanian | 43 | 0.2% |
| Macedonian | 15 | 0.1% |
| Mexican | 1,357 | 6.4% |
| Mexican American Indian | 18 | 0.1% |
| Native Hawaiian | 114 | 0.5% |
| Nepalese | 49 | 0.2% |
| Nicaraguan | 1 | 0.0% |
| Northern European | 188 | 0.9% |
| Norwegian | 492 | 2.3% |
| Pakistani | 74 | 0.4% |
| Panamanian | 24 | 0.1% |
| Peruvian | 33 | 0.2% |
| Polish | 328 | 1.5% |
| Portuguese | 174 | 0.8% |
| Puerto Rican | 236 | 1.1% |
| Romanian | 42 | 0.2% |
| Russian | 330 | 1.6% |
| Salvadoran | 31 | 0.2% |
| Scandinavian | 290 | 1.4% |
| Scotch-Irish | 230 | 1.1% |
| Scottish | 1,074 | 5.1% |
| Seminole | 25 | 0.1% |
| Serbian | 9 | 0.0% |
| Sioux | 44 | 0.2% |
| Slovak | 6 | 0.0% |
| South American | 100 | 0.5% |
| South American Indian | 15 | 0.1% |
| Spaniard | 111 | 0.5% |
| Spanish | 48 | 0.2% |
| Sri Lankan | 18 | 0.1% |
| Swedish | 425 | 2.0% |
| Swiss | 96 | 0.4% |
| Syrian | 10 | 0.1% |
| Thai | 215 | 1.0% |
| Ukrainian | 83 | 0.4% |
| Venezuelan | 30 | 0.1% |
| Welsh | 278 | 1.3% |
| West Indian | 4 | 0.0% |
| Yugoslavian | 24 | 0.1% | View All 89 Rows |
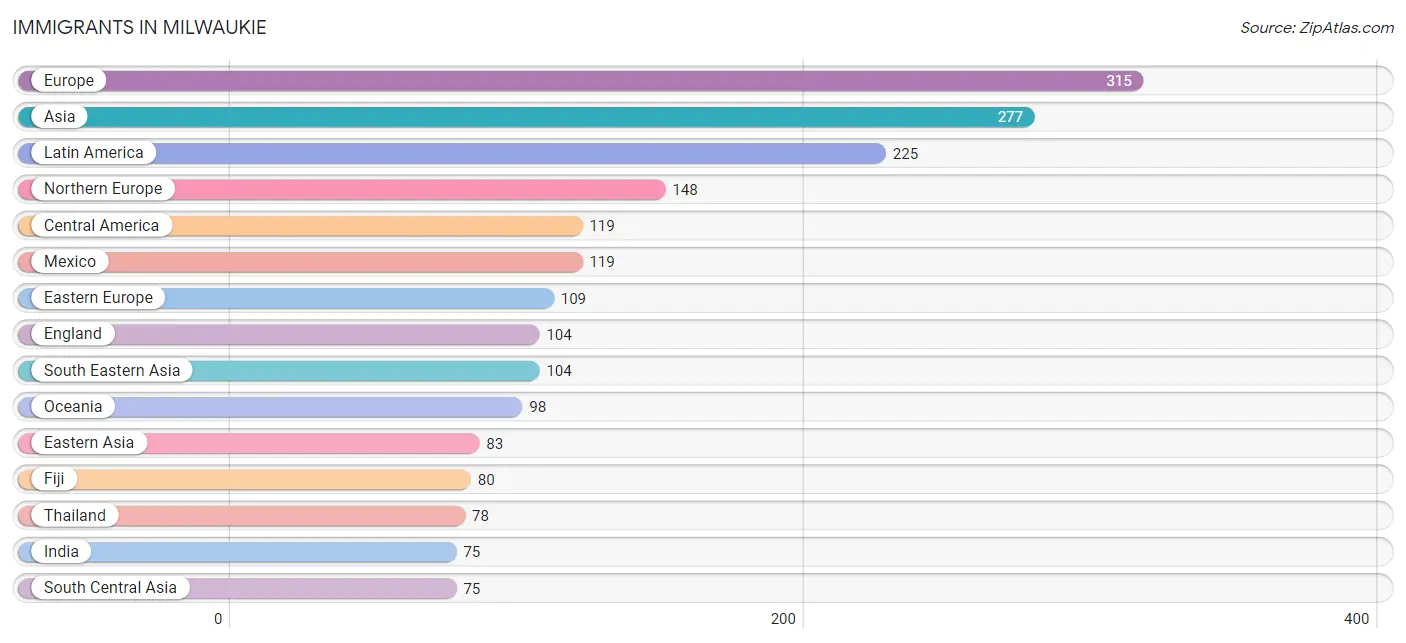
Immigrants in Milwaukie
The most numerous immigrant groups reported in Milwaukie came from Europe (315 | 1.5%), Asia (277 | 1.3%), Latin America (225 | 1.1%), Northern Europe (148 | 0.7%), and Central America (119 | 0.6%), together accounting for 5.1% of all Milwaukie residents.
| Immigration Origin | # Population | % Population |
| Africa | 9 | 0.0% |
| Asia | 277 | 1.3% |
| Austria | 9 | 0.0% |
| Brazil | 15 | 0.1% |
| Canada | 48 | 0.2% |
| Caribbean | 32 | 0.2% |
| Central America | 119 | 0.6% |
| Chile | 11 | 0.1% |
| China | 30 | 0.1% |
| Cuba | 18 | 0.1% |
| Czechoslovakia | 6 | 0.0% |
| Eastern Asia | 83 | 0.4% |
| Eastern Europe | 109 | 0.5% |
| England | 104 | 0.5% |
| Europe | 315 | 1.5% |
| Fiji | 80 | 0.4% |
| Germany | 28 | 0.1% |
| Grenada | 4 | 0.0% |
| India | 75 | 0.4% |
| Iraq | 15 | 0.1% |
| Italy | 10 | 0.1% |
| Japan | 20 | 0.1% |
| Korea | 33 | 0.2% |
| Latin America | 225 | 1.1% |
| Mexico | 119 | 0.6% |
| Micronesia | 18 | 0.1% |
| Netherlands | 11 | 0.1% |
| Northern Europe | 148 | 0.7% |
| Oceania | 98 | 0.5% |
| Philippines | 26 | 0.1% |
| Romania | 23 | 0.1% |
| Russia | 42 | 0.2% |
| South Africa | 9 | 0.0% |
| South America | 74 | 0.4% |
| South Central Asia | 75 | 0.4% |
| South Eastern Asia | 104 | 0.5% |
| Southern Europe | 10 | 0.1% |
| Taiwan | 6 | 0.0% |
| Thailand | 78 | 0.4% |
| Trinidad and Tobago | 10 | 0.1% |
| Ukraine | 9 | 0.0% |
| Venezuela | 48 | 0.2% |
| Western Asia | 15 | 0.1% |
| Western Europe | 48 | 0.2% | View All 44 Rows |
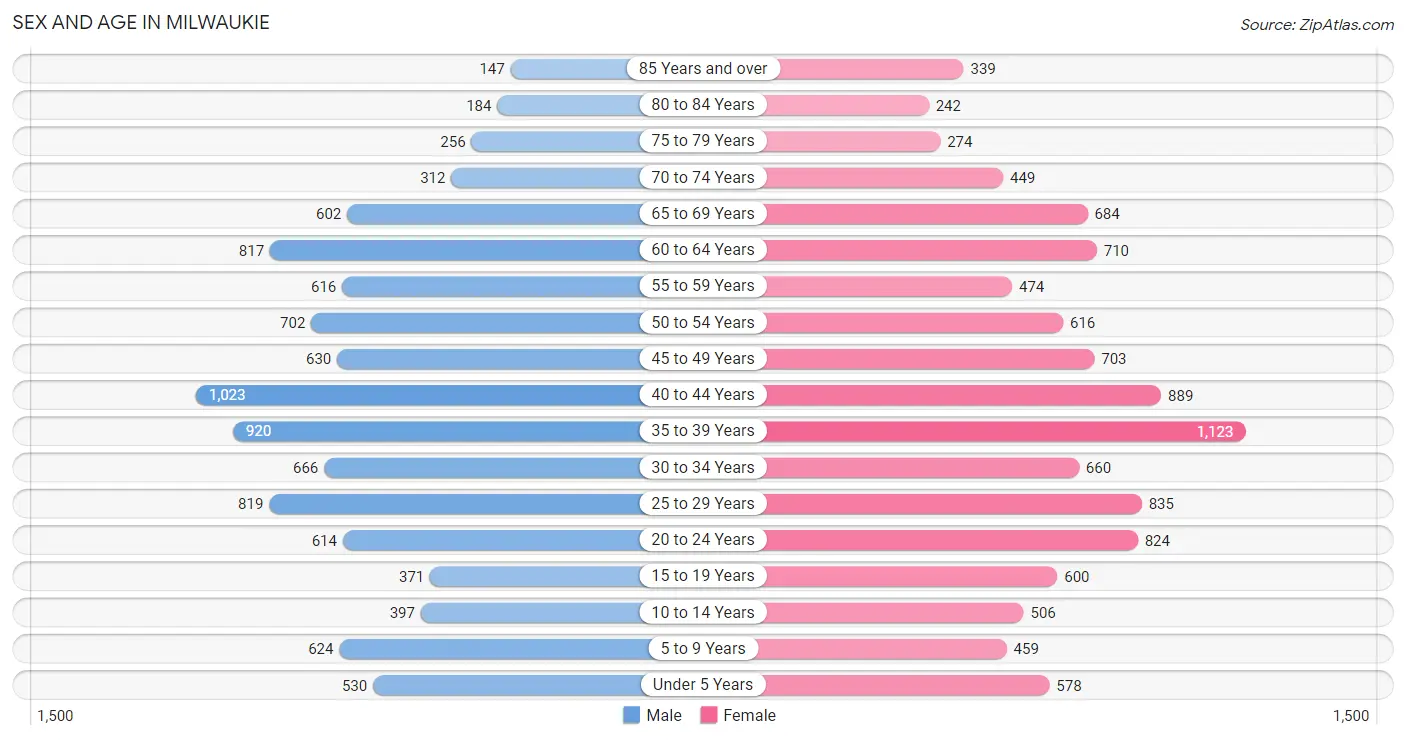
Sex and Age in Milwaukie
Sex and Age in Milwaukie
The most populous age groups in Milwaukie are 40 to 44 Years (1,023 | 10.0%) for men and 35 to 39 Years (1,123 | 10.2%) for women.
| Age Bracket | Male | Female |
| Under 5 Years | 530 (5.2%) | 578 (5.3%) |
| 5 to 9 Years | 624 (6.1%) | 459 (4.2%) |
| 10 to 14 Years | 397 (3.9%) | 506 (4.6%) |
| 15 to 19 Years | 371 (3.6%) | 600 (5.5%) |
| 20 to 24 Years | 614 (6.0%) | 824 (7.5%) |
| 25 to 29 Years | 819 (8.0%) | 835 (7.6%) |
| 30 to 34 Years | 666 (6.5%) | 660 (6.0%) |
| 35 to 39 Years | 920 (9.0%) | 1,123 (10.2%) |
| 40 to 44 Years | 1,023 (10.0%) | 889 (8.1%) |
| 45 to 49 Years | 630 (6.2%) | 703 (6.4%) |
| 50 to 54 Years | 702 (6.9%) | 616 (5.6%) |
| 55 to 59 Years | 616 (6.0%) | 474 (4.3%) |
| 60 to 64 Years | 817 (8.0%) | 710 (6.5%) |
| 65 to 69 Years | 602 (5.9%) | 684 (6.2%) |
| 70 to 74 Years | 312 (3.0%) | 449 (4.1%) |
| 75 to 79 Years | 256 (2.5%) | 274 (2.5%) |
| 80 to 84 Years | 184 (1.8%) | 242 (2.2%) |
| 85 Years and over | 147 (1.4%) | 339 (3.1%) |
| Total | 10,230 (100.0%) | 10,965 (100.0%) |
Families and Households in Milwaukie
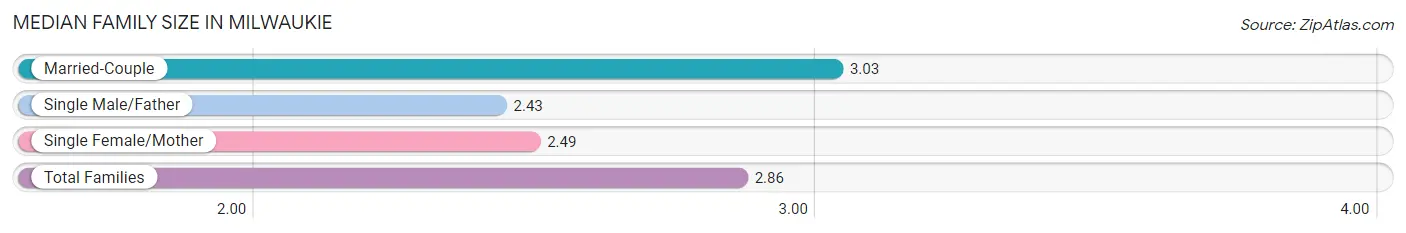
Median Family Size in Milwaukie
The median family size in Milwaukie is 2.86 persons per family, with married-couple families (3,693 | 70.6%) accounting for the largest median family size of 3.03 persons per family. On the other hand, single male/father families (547 | 10.4%) represent the smallest median family size with 2.43 persons per family.
| Family Type | # Families | Family Size |
| Married-Couple | 3,693 (70.6%) | 3.03 |
| Single Male/Father | 547 (10.4%) | 2.43 |
| Single Female/Mother | 992 (19.0%) | 2.49 |
| Total Families | 5,232 (100.0%) | 2.86 |
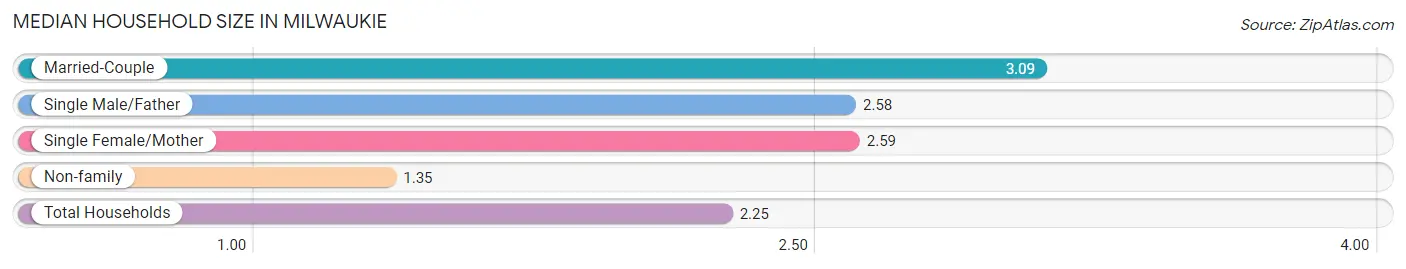
Median Household Size in Milwaukie
The median household size in Milwaukie is 2.25 persons per household, with married-couple households (3,693 | 39.8%) accounting for the largest median household size of 3.09 persons per household. non-family households (4,054 | 43.7%) represent the smallest median household size with 1.35 persons per household.
| Household Type | # Households | Household Size |
| Married-Couple | 3,693 (39.8%) | 3.09 |
| Single Male/Father | 547 (5.9%) | 2.58 |
| Single Female/Mother | 992 (10.7%) | 2.59 |
| Non-family | 4,054 (43.7%) | 1.35 |
| Total Households | 9,286 (100.0%) | 2.25 |
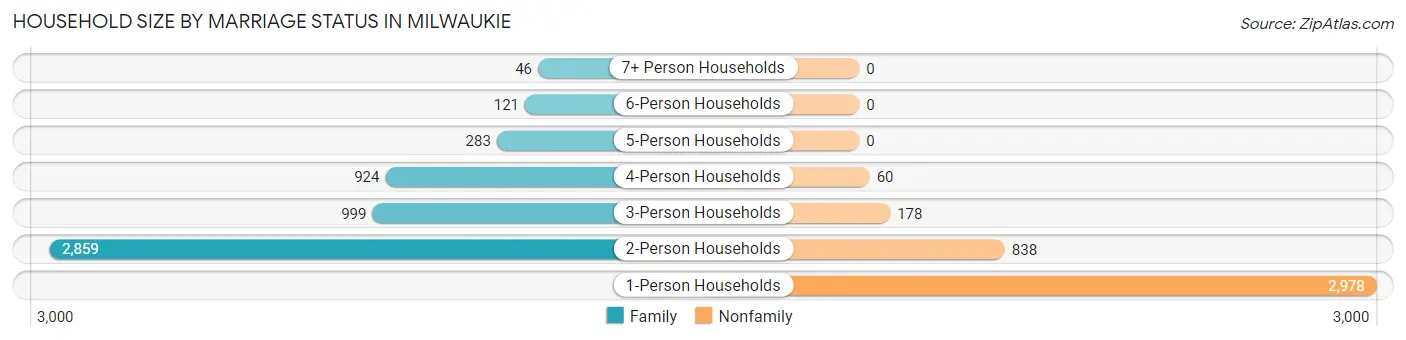
Household Size by Marriage Status in Milwaukie
Out of a total of 9,286 households in Milwaukie, 5,232 (56.3%) are family households, while 4,054 (43.7%) are nonfamily households. The most numerous type of family households are 2-person households, comprising 2,859, and the most common type of nonfamily households are 1-person households, comprising 2,978.
| Household Size | Family Households | Nonfamily Households |
| 1-Person Households | - | 2,978 (32.1%) |
| 2-Person Households | 2,859 (30.8%) | 838 (9.0%) |
| 3-Person Households | 999 (10.8%) | 178 (1.9%) |
| 4-Person Households | 924 (10.0%) | 60 (0.6%) |
| 5-Person Households | 283 (3.0%) | 0 (0.0%) |
| 6-Person Households | 121 (1.3%) | 0 (0.0%) |
| 7+ Person Households | 46 (0.5%) | 0 (0.0%) |
| Total | 5,232 (56.3%) | 4,054 (43.7%) |
Female Fertility in Milwaukie
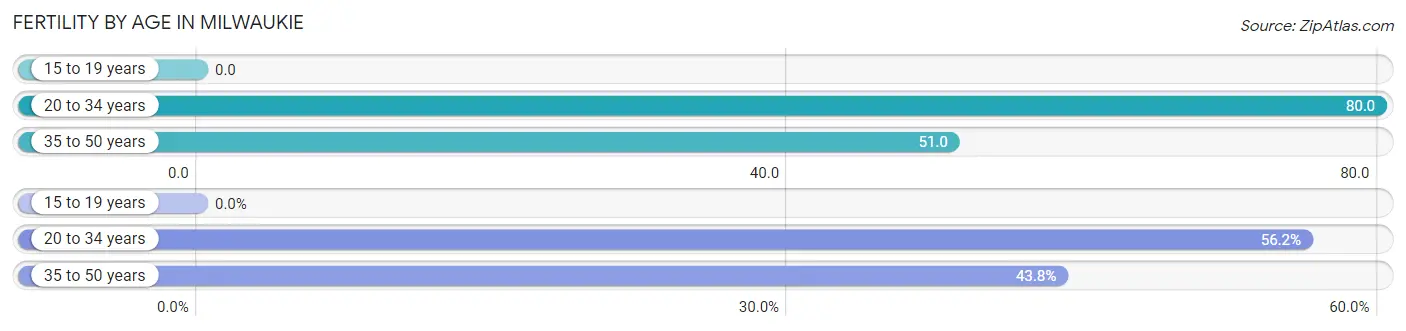
Fertility by Age in Milwaukie
Average fertility rate in Milwaukie is 57.0 births per 1,000 women. Women in the age bracket of 20 to 34 years have the highest fertility rate with 80.0 births per 1,000 women. Women in the age bracket of 20 to 34 years acount for 56.2% of all women with births.
| Age Bracket | Women with Births | Births / 1,000 Women |
| 15 to 19 years | 0 (0.0%) | 0.0 |
| 20 to 34 years | 185 (56.2%) | 80.0 |
| 35 to 50 years | 144 (43.8%) | 51.0 |
| Total | 329 (100.0%) | 57.0 |
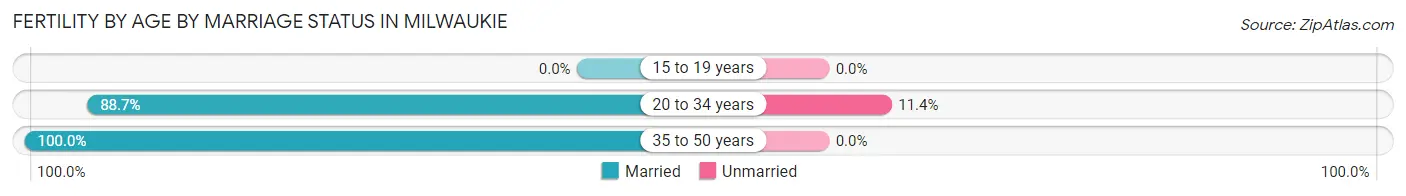
Fertility by Age by Marriage Status in Milwaukie
93.6% of women with births (329) in Milwaukie are married. The highest percentage of unmarried women with births falls into 20 to 34 years age bracket with 11.4% of them unmarried at the time of birth, while the lowest percentage of unmarried women with births belong to 35 to 50 years age bracket with 0.0% of them unmarried.
| Age Bracket | Married | Unmarried |
| 15 to 19 years | 0 (0.0%) | 0 (0.0%) |
| 20 to 34 years | 164 (88.6%) | 21 (11.4%) |
| 35 to 50 years | 144 (100.0%) | 0 (0.0%) |
| Total | 308 (93.6%) | 21 (6.4%) |
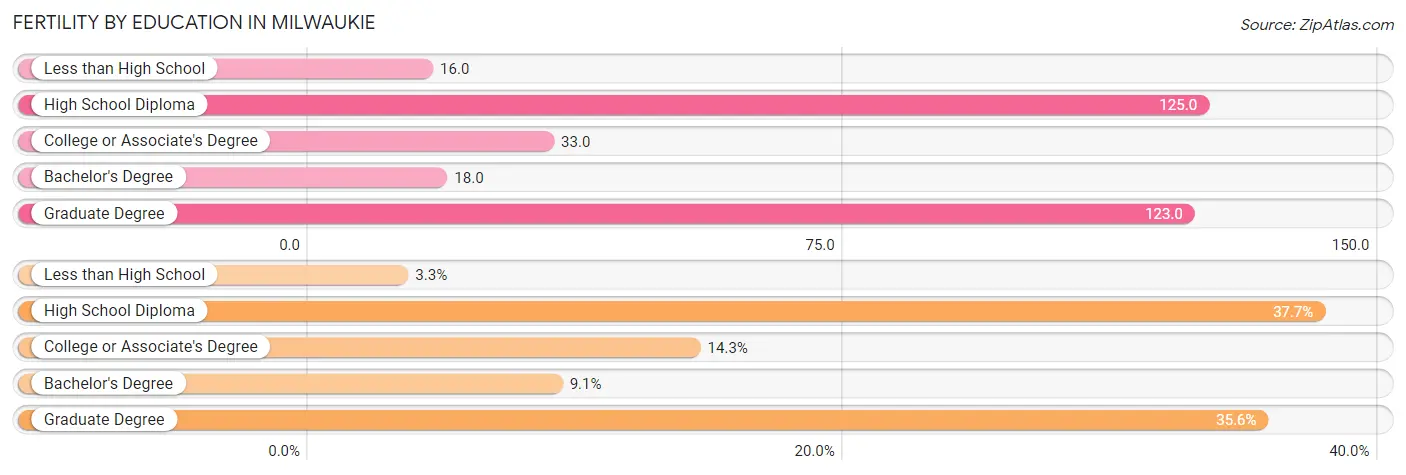
Fertility by Education in Milwaukie
Average fertility rate in Milwaukie is 57.0 births per 1,000 women. Women with the education attainment of high school diploma have the highest fertility rate of 125.0 births per 1,000 women, while women with the education attainment of less than high school have the lowest fertility at 16.0 births per 1,000 women. Women with the education attainment of high school diploma represent 37.7% of all women with births.
| Educational Attainment | Women with Births | Births / 1,000 Women |
| Less than High School | 11 (3.3%) | 16.0 |
| High School Diploma | 124 (37.7%) | 125.0 |
| College or Associate's Degree | 47 (14.3%) | 33.0 |
| Bachelor's Degree | 30 (9.1%) | 18.0 |
| Graduate Degree | 117 (35.6%) | 123.0 |
| Total | 329 (100.0%) | 57.0 |
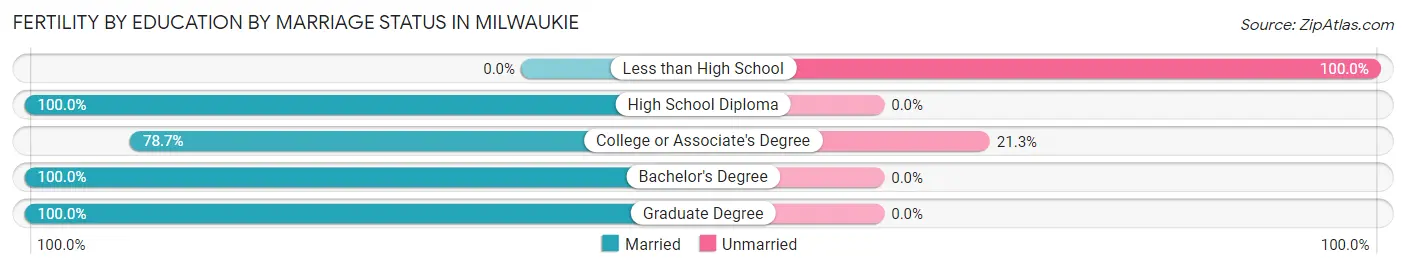
Fertility by Education by Marriage Status in Milwaukie
6.4% of women with births in Milwaukie are unmarried. Women with the educational attainment of high school diploma are most likely to be married with 100.0% of them married at childbirth, while women with the educational attainment of less than high school are least likely to be married with 100.0% of them unmarried at childbirth.
| Educational Attainment | Married | Unmarried |
| Less than High School | 0 (0.0%) | 11 (100.0%) |
| High School Diploma | 124 (100.0%) | 0 (0.0%) |
| College or Associate's Degree | 37 (78.7%) | 10 (21.3%) |
| Bachelor's Degree | 30 (100.0%) | 0 (0.0%) |
| Graduate Degree | 117 (100.0%) | 0 (0.0%) |
| Total | 308 (93.6%) | 21 (6.4%) |
Income in Milwaukie
Income Overview in Milwaukie
Per Capita Income in Milwaukie is $44,973, while median incomes of families and households are $102,839 and $78,676 respectively.
| Characteristic | Number | Measure |
| Per Capita Income | 21,195 | $44,973 |
| Median Family Income | 5,232 | $102,839 |
| Mean Family Income | 5,232 | $119,377 |
| Median Household Income | 9,286 | $78,676 |
| Mean Household Income | 9,286 | $101,112 |
| Income Deficit | 5,232 | $0 |
| Wage / Income Gap (%) | 21,195 | 28.13% |
| Wage / Income Gap ($) | 21,195 | 71.87¢ per $1 |
| Gini / Inequality Index | 21,195 | 0.40 |
Earnings by Sex in Milwaukie
Average Earnings in Milwaukie are $48,844, $57,633 for men and $41,420 for women, a difference of 28.1%.
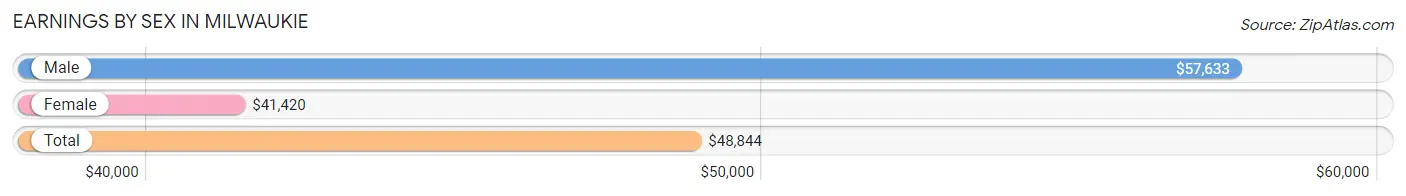
| Sex | Number | Average Earnings |
| Male | 6,616 (50.7%) | $57,633 |
| Female | 6,422 (49.3%) | $41,420 |
| Total | 13,038 (100.0%) | $48,844 |
Earnings by Sex by Income Bracket in Milwaukie
The most common earnings brackets in Milwaukie are $100,000+ for men (1,372 | 20.7%) and $75,000 to $99,999 for women (802 | 12.5%).
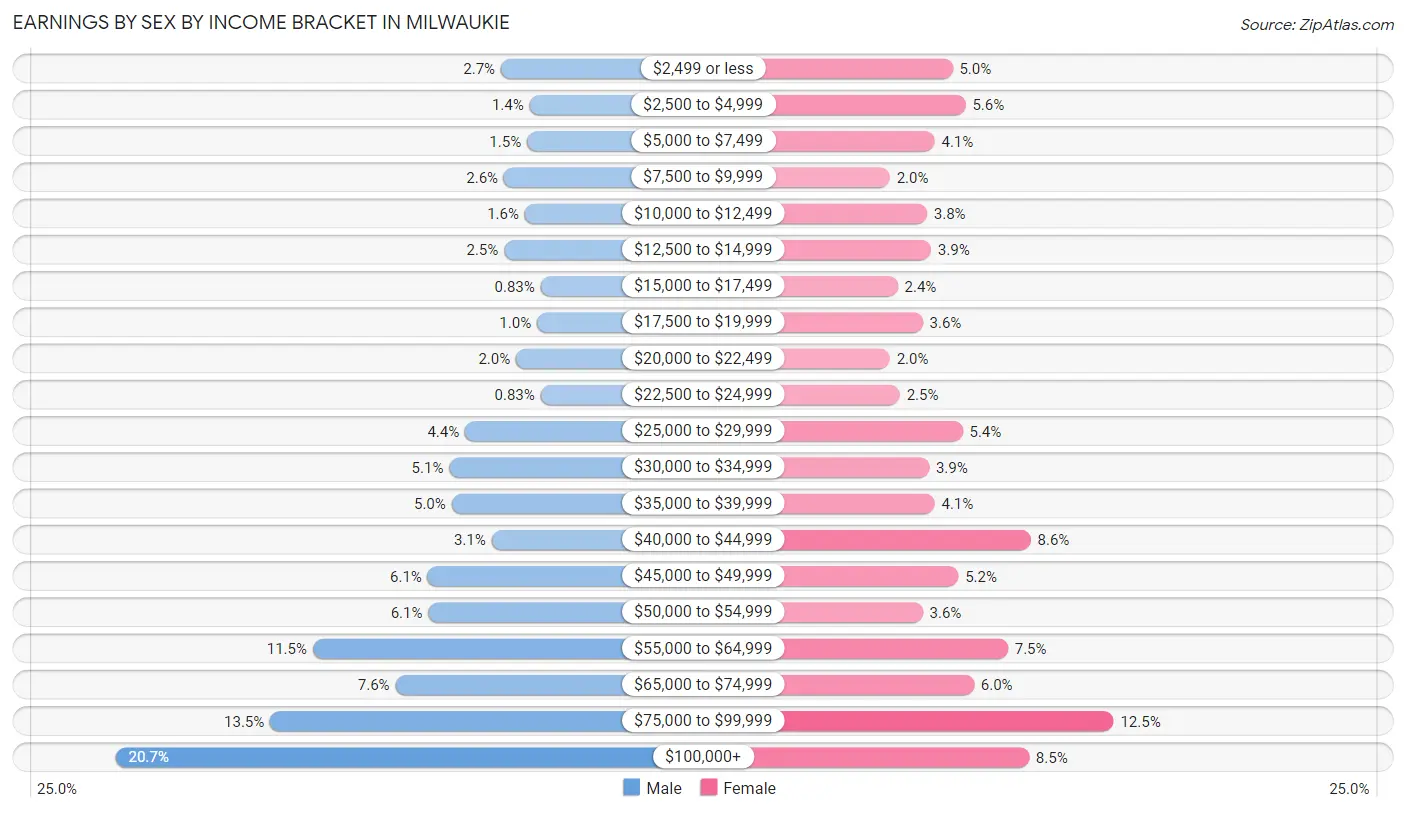
| Income | Male | Female |
| $2,499 or less | 178 (2.7%) | 318 (5.0%) |
| $2,500 to $4,999 | 89 (1.3%) | 357 (5.6%) |
| $5,000 to $7,499 | 97 (1.5%) | 264 (4.1%) |
| $7,500 to $9,999 | 169 (2.5%) | 129 (2.0%) |
| $10,000 to $12,499 | 104 (1.6%) | 241 (3.7%) |
| $12,500 to $14,999 | 168 (2.5%) | 253 (3.9%) |
| $15,000 to $17,499 | 55 (0.8%) | 153 (2.4%) |
| $17,500 to $19,999 | 66 (1.0%) | 228 (3.5%) |
| $20,000 to $22,499 | 131 (2.0%) | 129 (2.0%) |
| $22,500 to $24,999 | 55 (0.8%) | 159 (2.5%) |
| $25,000 to $29,999 | 289 (4.4%) | 348 (5.4%) |
| $30,000 to $34,999 | 338 (5.1%) | 247 (3.8%) |
| $35,000 to $39,999 | 331 (5.0%) | 264 (4.1%) |
| $40,000 to $44,999 | 207 (3.1%) | 553 (8.6%) |
| $45,000 to $49,999 | 405 (6.1%) | 335 (5.2%) |
| $50,000 to $54,999 | 403 (6.1%) | 228 (3.5%) |
| $55,000 to $64,999 | 761 (11.5%) | 484 (7.5%) |
| $65,000 to $74,999 | 505 (7.6%) | 382 (5.9%) |
| $75,000 to $99,999 | 893 (13.5%) | 802 (12.5%) |
| $100,000+ | 1,372 (20.7%) | 548 (8.5%) |
| Total | 6,616 (100.0%) | 6,422 (100.0%) |
Earnings by Sex by Educational Attainment in Milwaukie
Average earnings in Milwaukie are $60,863 for men and $44,387 for women, a difference of 27.1%. Men with an educational attainment of bachelor's degree enjoy the highest average annual earnings of $79,120, while those with less than high school education earn the least with $38,653. Women with an educational attainment of graduate degree earn the most with the average annual earnings of $65,027, while those with less than high school education have the smallest earnings of $23,226.
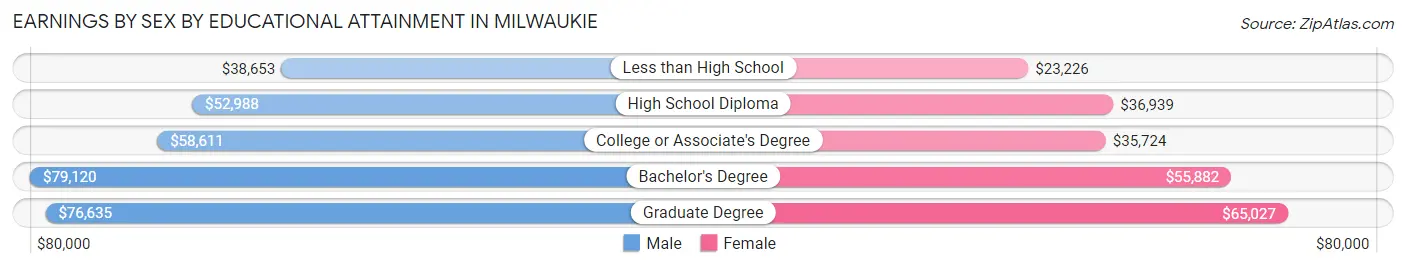
| Educational Attainment | Male Income | Female Income |
| Less than High School | $38,653 | $23,226 |
| High School Diploma | $52,988 | $36,939 |
| College or Associate's Degree | $58,611 | $35,724 |
| Bachelor's Degree | $79,120 | $55,882 |
| Graduate Degree | $76,635 | $65,027 |
| Total | $60,863 | $44,387 |
Family Income in Milwaukie
Family Income Brackets in Milwaukie
According to the Milwaukie family income data, there are 1,256 families falling into the $100,000 to $149,999 income range, which is the most common income bracket and makes up 24.0% of all families. Conversely, the $10,000 to $14,999 income bracket is the least frequent group with only 52 families (1.0%) belonging to this category.
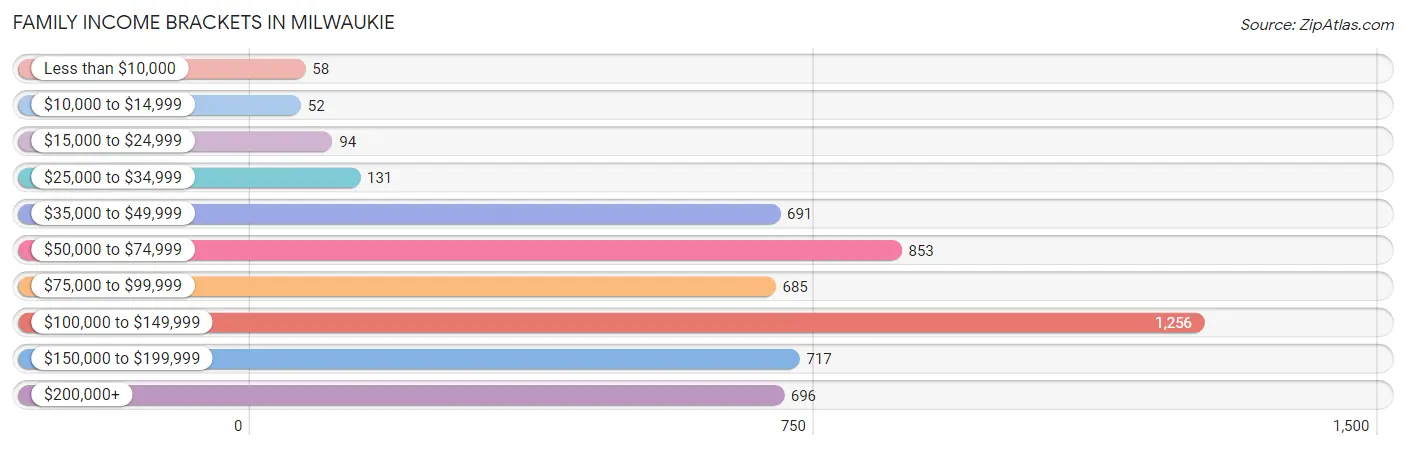
| Income Bracket | # Families | % Families |
| Less than $10,000 | 58 | 1.1% |
| $10,000 to $14,999 | 52 | 1.0% |
| $15,000 to $24,999 | 94 | 1.8% |
| $25,000 to $34,999 | 131 | 2.5% |
| $35,000 to $49,999 | 691 | 13.2% |
| $50,000 to $74,999 | 853 | 16.3% |
| $75,000 to $99,999 | 685 | 13.1% |
| $100,000 to $149,999 | 1,256 | 24.0% |
| $150,000 to $199,999 | 717 | 13.7% |
| $200,000+ | 696 | 13.3% |
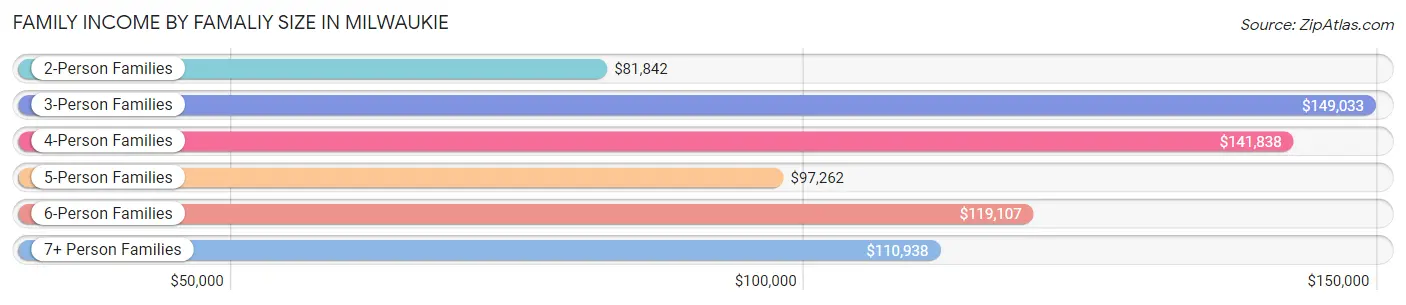
Family Income by Famaliy Size in Milwaukie
3-person families (999 | 19.1%) account for the highest median family income in Milwaukie with $149,033 per family, while 3-person families (999 | 19.1%) have the highest median income of $49,678 per family member.
| Income Bracket | # Families | Median Income |
| 2-Person Families | 2,936 (56.1%) | $81,842 |
| 3-Person Families | 999 (19.1%) | $149,033 |
| 4-Person Families | 965 (18.4%) | $141,838 |
| 5-Person Families | 234 (4.5%) | $97,262 |
| 6-Person Families | 65 (1.2%) | $119,107 |
| 7+ Person Families | 33 (0.6%) | $110,938 |
| Total | 5,232 (100.0%) | $102,839 |
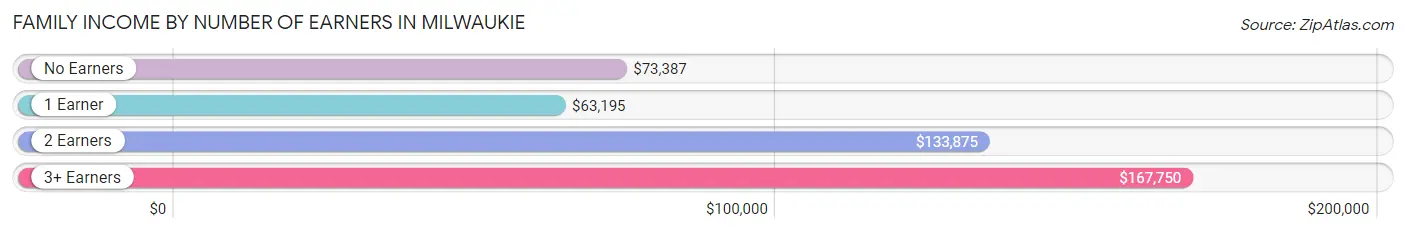
Family Income by Number of Earners in Milwaukie
The median family income in Milwaukie is $102,839, with families comprising 3+ earners (479) having the highest median family income of $167,750, while families with 1 earner (1,746) have the lowest median family income of $63,195, accounting for 9.2% and 33.4% of families, respectively.
| Number of Earners | # Families | Median Income |
| No Earners | 576 (11.0%) | $73,387 |
| 1 Earner | 1,746 (33.4%) | $63,195 |
| 2 Earners | 2,431 (46.5%) | $133,875 |
| 3+ Earners | 479 (9.2%) | $167,750 |
| Total | 5,232 (100.0%) | $102,839 |
Household Income in Milwaukie
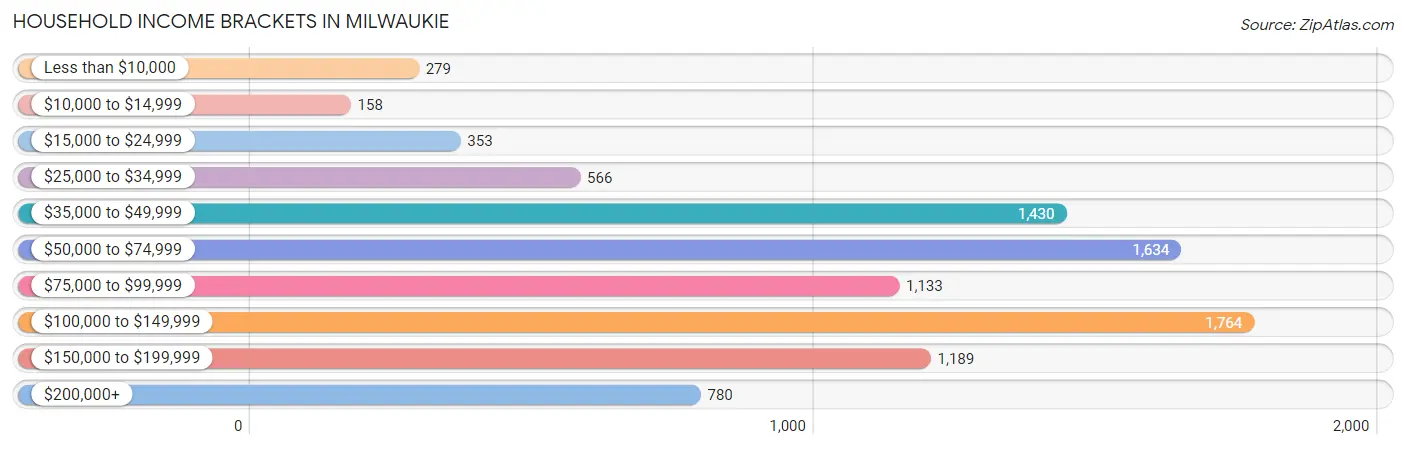
Household Income Brackets in Milwaukie
With 1,764 households falling in the category, the $100,000 to $149,999 income range is the most frequent in Milwaukie, accounting for 19.0% of all households. In contrast, only 158 households (1.7%) fall into the $10,000 to $14,999 income bracket, making it the least populous group.
| Income Bracket | # Households | % Households |
| Less than $10,000 | 279 | 3.0% |
| $10,000 to $14,999 | 158 | 1.7% |
| $15,000 to $24,999 | 353 | 3.8% |
| $25,000 to $34,999 | 566 | 6.1% |
| $35,000 to $49,999 | 1,430 | 15.4% |
| $50,000 to $74,999 | 1,634 | 17.6% |
| $75,000 to $99,999 | 1,133 | 12.2% |
| $100,000 to $149,999 | 1,764 | 19.0% |
| $150,000 to $199,999 | 1,189 | 12.8% |
| $200,000+ | 780 | 8.4% |
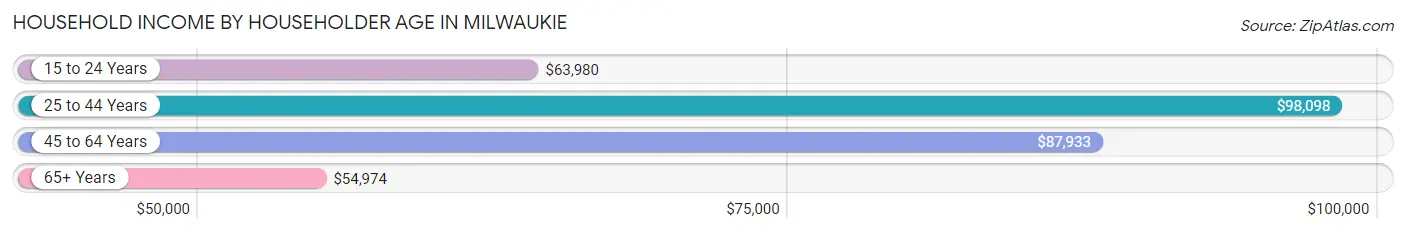
Household Income by Householder Age in Milwaukie
The median household income in Milwaukie is $78,676, with the highest median household income of $98,098 found in the 25 to 44 years age bracket for the primary householder. A total of 3,803 households (40.9%) fall into this category. Meanwhile, the 65+ years age bracket for the primary householder has the lowest median household income of $54,974, with 2,343 households (25.2%) in this group.
| Income Bracket | # Households | Median Income |
| 15 to 24 Years | 258 (2.8%) | $63,980 |
| 25 to 44 Years | 3,803 (40.9%) | $98,098 |
| 45 to 64 Years | 2,882 (31.0%) | $87,933 |
| 65+ Years | 2,343 (25.2%) | $54,974 |
| Total | 9,286 (100.0%) | $78,676 |
Poverty in Milwaukie
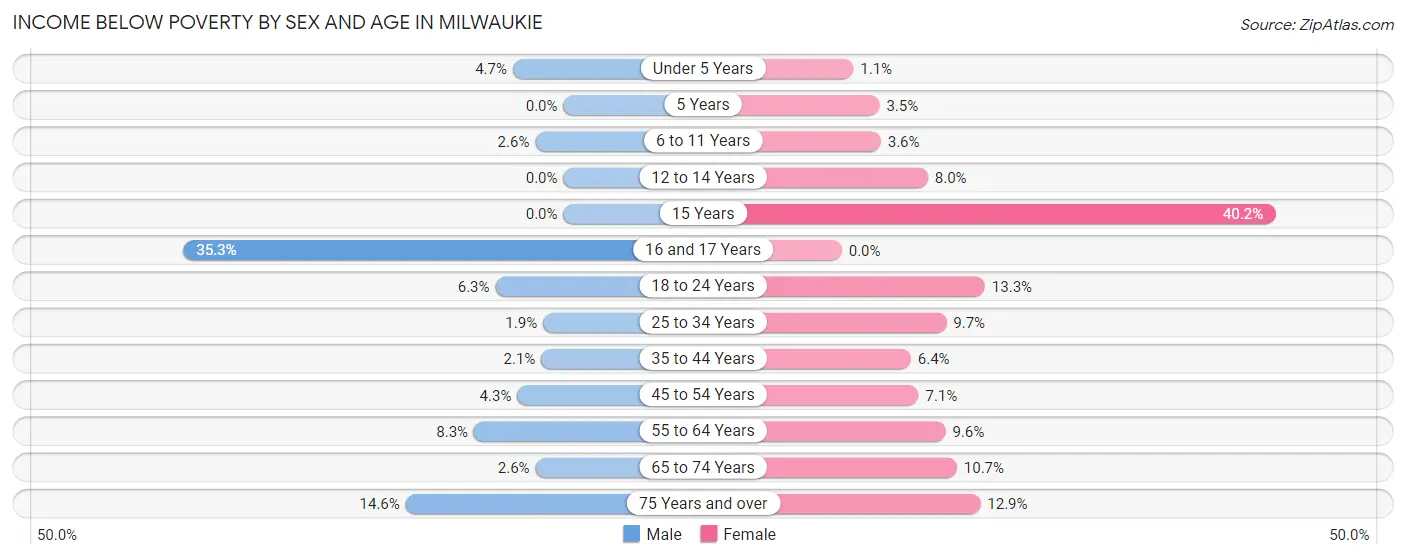
Income Below Poverty by Sex and Age in Milwaukie
With 4.9% poverty level for males and 8.5% for females among the residents of Milwaukie, 16 and 17 year old males and 15 year old females are the most vulnerable to poverty, with 61 males (35.3%) and 39 females (40.2%) in their respective age groups living below the poverty level.
| Age Bracket | Male | Female |
| Under 5 Years | 24 (4.7%) | 6 (1.1%) |
| 5 Years | 0 (0.0%) | 5 (3.5%) |
| 6 to 11 Years | 17 (2.6%) | 19 (3.6%) |
| 12 to 14 Years | 0 (0.0%) | 23 (8.0%) |
| 15 Years | 0 (0.0%) | 39 (40.2%) |
| 16 and 17 Years | 61 (35.3%) | 0 (0.0%) |
| 18 to 24 Years | 45 (6.3%) | 126 (13.3%) |
| 25 to 34 Years | 28 (1.9%) | 145 (9.7%) |
| 35 to 44 Years | 40 (2.1%) | 129 (6.4%) |
| 45 to 54 Years | 57 (4.3%) | 94 (7.1%) |
| 55 to 64 Years | 119 (8.3%) | 114 (9.6%) |
| 65 to 74 Years | 23 (2.6%) | 121 (10.7%) |
| 75 Years and over | 83 (14.6%) | 106 (12.9%) |
| Total | 497 (4.9%) | 927 (8.5%) |
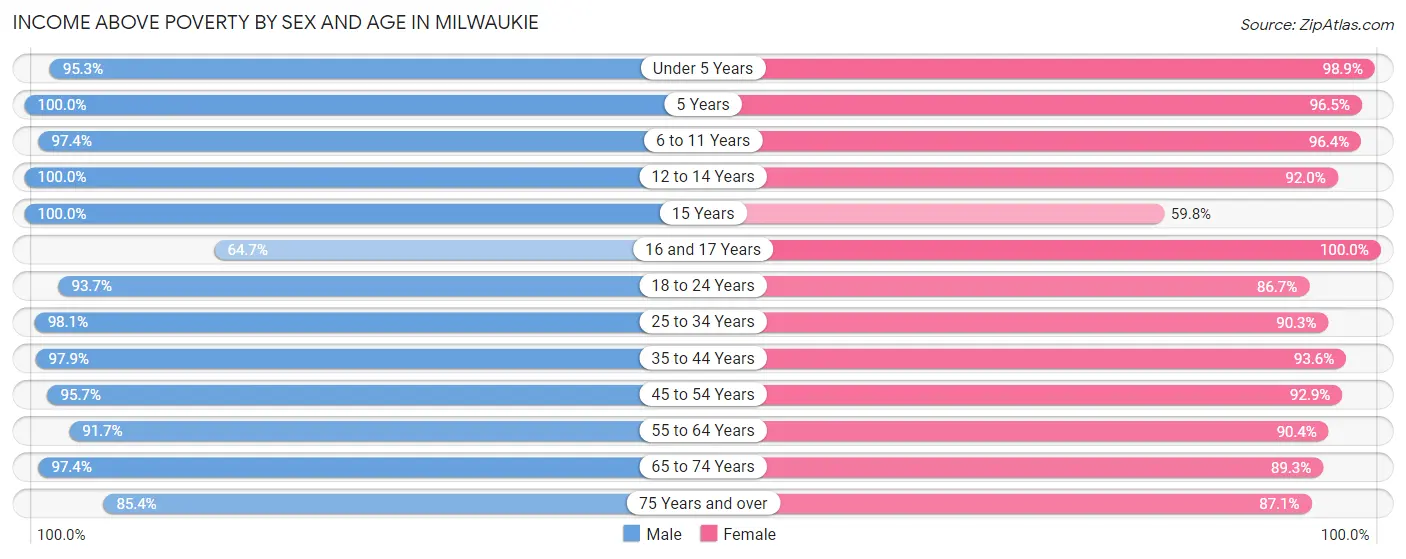
Income Above Poverty by Sex and Age in Milwaukie
According to the poverty statistics in Milwaukie, males aged 5 years and females aged 16 and 17 years are the age groups that are most secure financially, with 100.0% of males and 100.0% of females in these age groups living above the poverty line.
| Age Bracket | Male | Female |
| Under 5 Years | 488 (95.3%) | 557 (98.9%) |
| 5 Years | 139 (100.0%) | 138 (96.5%) |
| 6 to 11 Years | 634 (97.4%) | 506 (96.4%) |
| 12 to 14 Years | 208 (100.0%) | 265 (92.0%) |
| 15 Years | 98 (100.0%) | 58 (59.8%) |
| 16 and 17 Years | 112 (64.7%) | 378 (100.0%) |
| 18 to 24 Years | 668 (93.7%) | 823 (86.7%) |
| 25 to 34 Years | 1,457 (98.1%) | 1,350 (90.3%) |
| 35 to 44 Years | 1,903 (97.9%) | 1,883 (93.6%) |
| 45 to 54 Years | 1,274 (95.7%) | 1,225 (92.9%) |
| 55 to 64 Years | 1,314 (91.7%) | 1,070 (90.4%) |
| 65 to 74 Years | 866 (97.4%) | 1,012 (89.3%) |
| 75 Years and over | 484 (85.4%) | 718 (87.1%) |
| Total | 9,645 (95.1%) | 9,983 (91.5%) |
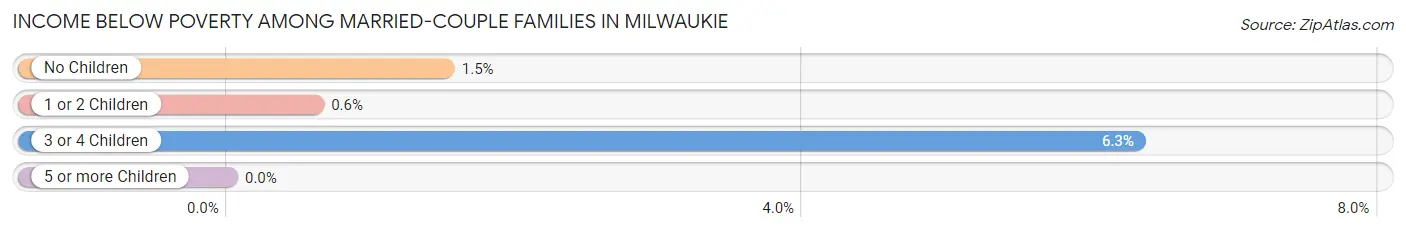
Income Below Poverty Among Married-Couple Families in Milwaukie
The poverty statistics for married-couple families in Milwaukie show that 1.3% or 48 of the total 3,693 families live below the poverty line. Families with 3 or 4 children have the highest poverty rate of 6.3%, comprising of 6 families. On the other hand, families with 5 or more children have the lowest poverty rate of 0.0%, which includes 0 families.
| Children | Above Poverty | Below Poverty |
| No Children | 2,220 (98.5%) | 34 (1.5%) |
| 1 or 2 Children | 1,324 (99.4%) | 8 (0.6%) |
| 3 or 4 Children | 89 (93.7%) | 6 (6.3%) |
| 5 or more Children | 12 (100.0%) | 0 (0.0%) |
| Total | 3,645 (98.7%) | 48 (1.3%) |
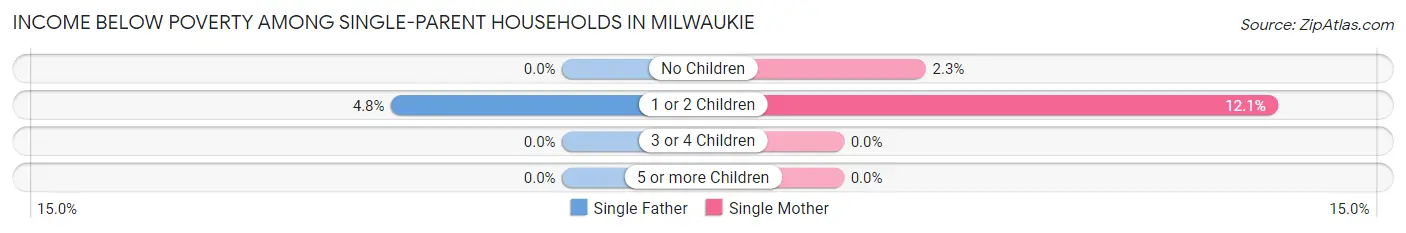
Income Below Poverty Among Single-Parent Households in Milwaukie
According to the poverty data in Milwaukie, 2.7% or 15 single-father households and 8.4% or 83 single-mother households are living below the poverty line. Among single-father households, those with 1 or 2 children have the highest poverty rate, with 15 households (4.8%) experiencing poverty. Likewise, among single-mother households, those with 1 or 2 children have the highest poverty rate, with 75 households (12.1%) falling below the poverty line.
| Children | Single Father | Single Mother |
| No Children | 0 (0.0%) | 8 (2.3%) |
| 1 or 2 Children | 15 (4.8%) | 75 (12.1%) |
| 3 or 4 Children | 0 (0.0%) | 0 (0.0%) |
| 5 or more Children | 0 (0.0%) | 0 (0.0%) |
| Total | 15 (2.7%) | 83 (8.4%) |
Income Below Poverty Among Married-Couple vs Single-Parent Households in Milwaukie
The poverty data for Milwaukie shows that 48 of the married-couple family households (1.3%) and 98 of the single-parent households (6.4%) are living below the poverty level. Within the married-couple family households, those with 3 or 4 children have the highest poverty rate, with 6 households (6.3%) falling below the poverty line. Among the single-parent households, those with 1 or 2 children have the highest poverty rate, with 90 household (9.7%) living below poverty.
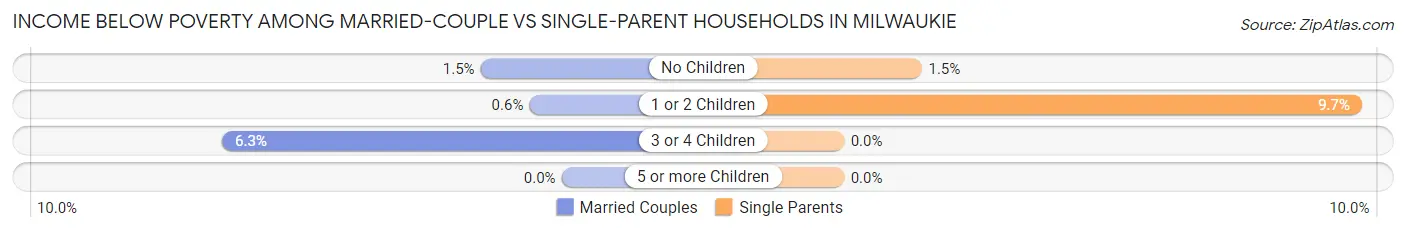
| Children | Married-Couple Families | Single-Parent Households |
| No Children | 34 (1.5%) | 8 (1.5%) |
| 1 or 2 Children | 8 (0.6%) | 90 (9.7%) |
| 3 or 4 Children | 6 (6.3%) | 0 (0.0%) |
| 5 or more Children | 0 (0.0%) | 0 (0.0%) |
| Total | 48 (1.3%) | 98 (6.4%) |
Employment Characteristics in Milwaukie
Employment by Class of Employer in Milwaukie
Among the 11,764 employed individuals in Milwaukie, private company employees (7,686 | 65.3%), not-for-profit organizations (1,309 | 11.1%), and local government employees (984 | 8.4%) make up the most common classes of employment.
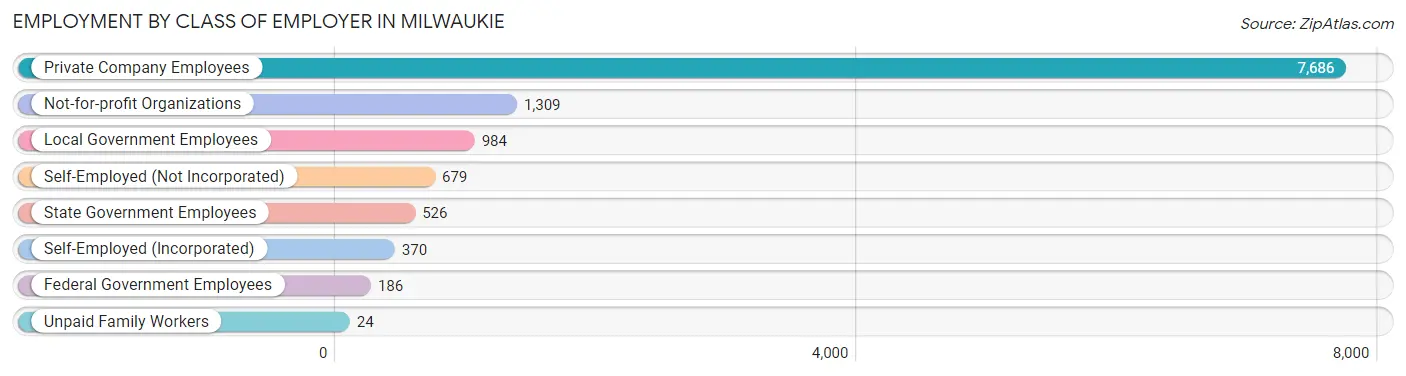
| Employer Class | # Employees | % Employees |
| Private Company Employees | 7,686 | 65.3% |
| Self-Employed (Incorporated) | 370 | 3.2% |
| Self-Employed (Not Incorporated) | 679 | 5.8% |
| Not-for-profit Organizations | 1,309 | 11.1% |
| Local Government Employees | 984 | 8.4% |
| State Government Employees | 526 | 4.5% |
| Federal Government Employees | 186 | 1.6% |
| Unpaid Family Workers | 24 | 0.2% |
| Total | 11,764 | 100.0% |
Employment Status by Age in Milwaukie
According to the labor force statistics for Milwaukie, out of the total population over 16 years of age (17,906), 70.5% or 12,624 individuals are in the labor force, with 5.5% or 694 of them unemployed. The age group with the highest labor force participation rate is 25 to 29 years, with 98.3% or 1,626 individuals in the labor force. Within the labor force, the 75 years and over age range has the highest percentage of unemployed individuals, with 12.3% or 9 of them being unemployed.
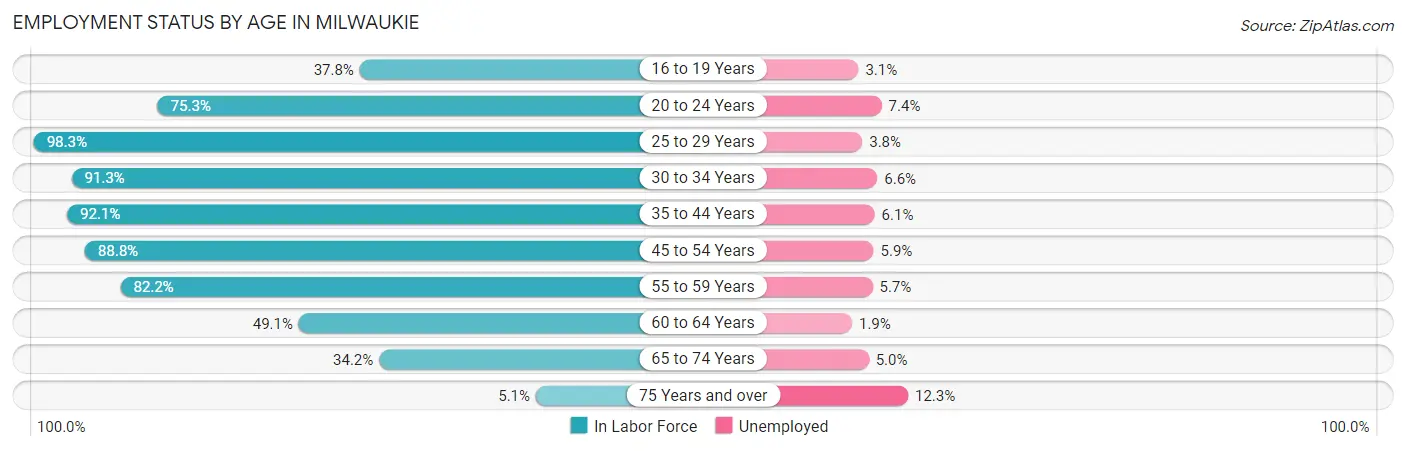
| Age Bracket | In Labor Force | Unemployed |
| 16 to 19 Years | 293 (37.8%) | 9 (3.1%) |
| 20 to 24 Years | 1,083 (75.3%) | 80 (7.4%) |
| 25 to 29 Years | 1,626 (98.3%) | 62 (3.8%) |
| 30 to 34 Years | 1,211 (91.3%) | 80 (6.6%) |
| 35 to 44 Years | 3,643 (92.1%) | 222 (6.1%) |
| 45 to 54 Years | 2,354 (88.8%) | 139 (5.9%) |
| 55 to 59 Years | 896 (82.2%) | 51 (5.7%) |
| 60 to 64 Years | 750 (49.1%) | 14 (1.9%) |
| 65 to 74 Years | 700 (34.2%) | 35 (5.0%) |
| 75 Years and over | 74 (5.1%) | 9 (12.3%) |
| Total | 12,624 (70.5%) | 694 (5.5%) |
Employment Status by Educational Attainment in Milwaukie
According to labor force statistics for Milwaukie, 85.9% of individuals (10,482) out of the total population between 25 and 64 years of age (12,203) are in the labor force, with 5.4% or 566 of them being unemployed. The group with the highest labor force participation rate are those with the educational attainment of bachelor's degree or higher, with 92.9% or 4,661 individuals in the labor force. Within the labor force, individuals with high school diploma education have the highest percentage of unemployment, with 9.0% or 178 of them being unemployed.
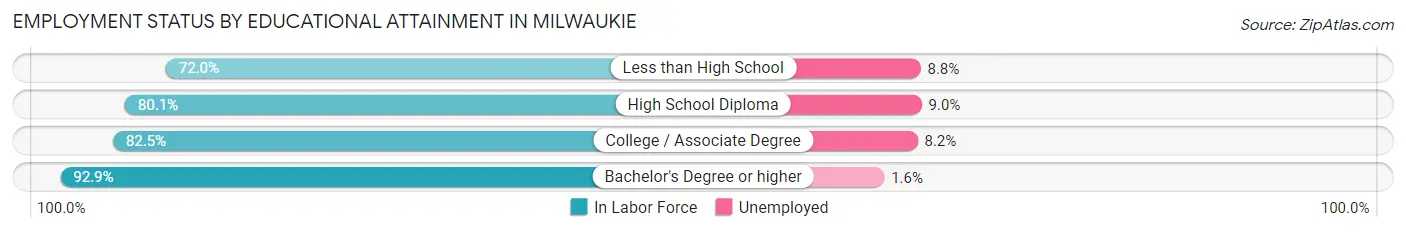
| Educational Attainment | In Labor Force | Unemployed |
| Less than High School | 363 (72.0%) | 44 (8.8%) |
| High School Diploma | 1,979 (80.1%) | 222 (9.0%) |
| College / Associate Degree | 3,474 (82.5%) | 345 (8.2%) |
| Bachelor's Degree or higher | 4,661 (92.9%) | 80 (1.6%) |
| Total | 10,482 (85.9%) | 659 (5.4%) |
Employment Occupations by Sex in Milwaukie
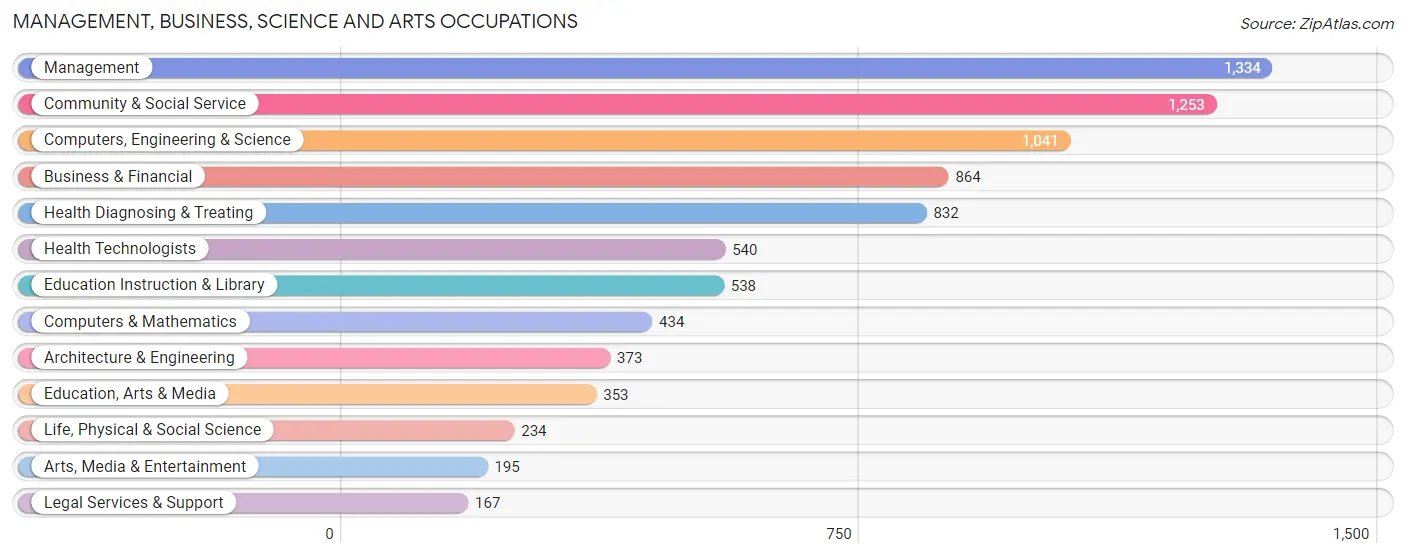
Management, Business, Science and Arts Occupations
The most common Management, Business, Science and Arts occupations in Milwaukie are Management (1,334 | 11.2%), Community & Social Service (1,253 | 10.5%), Computers, Engineering & Science (1,041 | 8.7%), Business & Financial (864 | 7.3%), and Health Diagnosing & Treating (832 | 7.0%).
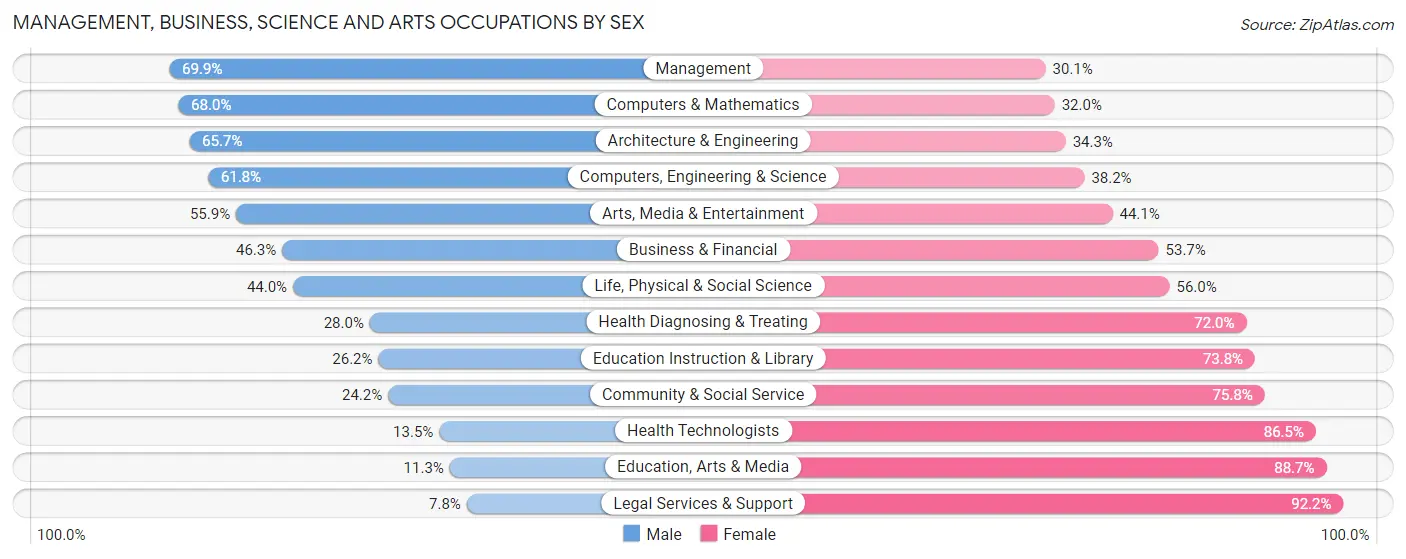
Management, Business, Science and Arts Occupations by Sex
Within the Management, Business, Science and Arts occupations in Milwaukie, the most male-oriented occupations are Management (69.9%), Computers & Mathematics (68.0%), and Architecture & Engineering (65.7%), while the most female-oriented occupations are Legal Services & Support (92.2%), Education, Arts & Media (88.7%), and Health Technologists (86.5%).
| Occupation | Male | Female |
| Management | 932 (69.9%) | 402 (30.1%) |
| Business & Financial | 400 (46.3%) | 464 (53.7%) |
| Computers, Engineering & Science | 643 (61.8%) | 398 (38.2%) |
| Computers & Mathematics | 295 (68.0%) | 139 (32.0%) |
| Architecture & Engineering | 245 (65.7%) | 128 (34.3%) |
| Life, Physical & Social Science | 103 (44.0%) | 131 (56.0%) |
| Community & Social Service | 303 (24.2%) | 950 (75.8%) |
| Education, Arts & Media | 40 (11.3%) | 313 (88.7%) |
| Legal Services & Support | 13 (7.8%) | 154 (92.2%) |
| Education Instruction & Library | 141 (26.2%) | 397 (73.8%) |
| Arts, Media & Entertainment | 109 (55.9%) | 86 (44.1%) |
| Health Diagnosing & Treating | 233 (28.0%) | 599 (72.0%) |
| Health Technologists | 73 (13.5%) | 467 (86.5%) |
| Total (Category) | 2,511 (47.2%) | 2,813 (52.8%) |
| Total (Overall) | 6,005 (50.4%) | 5,898 (49.5%) |
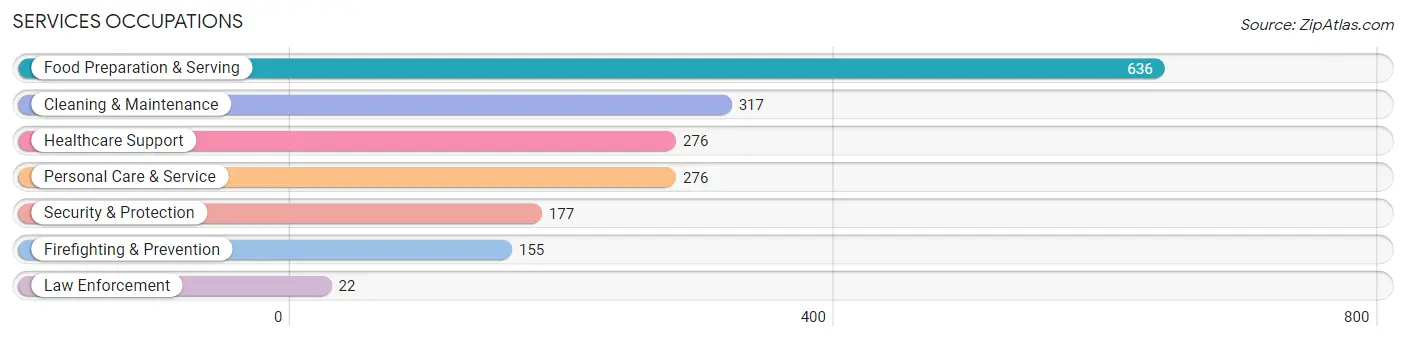
Services Occupations
The most common Services occupations in Milwaukie are Food Preparation & Serving (636 | 5.3%), Cleaning & Maintenance (317 | 2.7%), Healthcare Support (276 | 2.3%), Personal Care & Service (276 | 2.3%), and Security & Protection (177 | 1.5%).
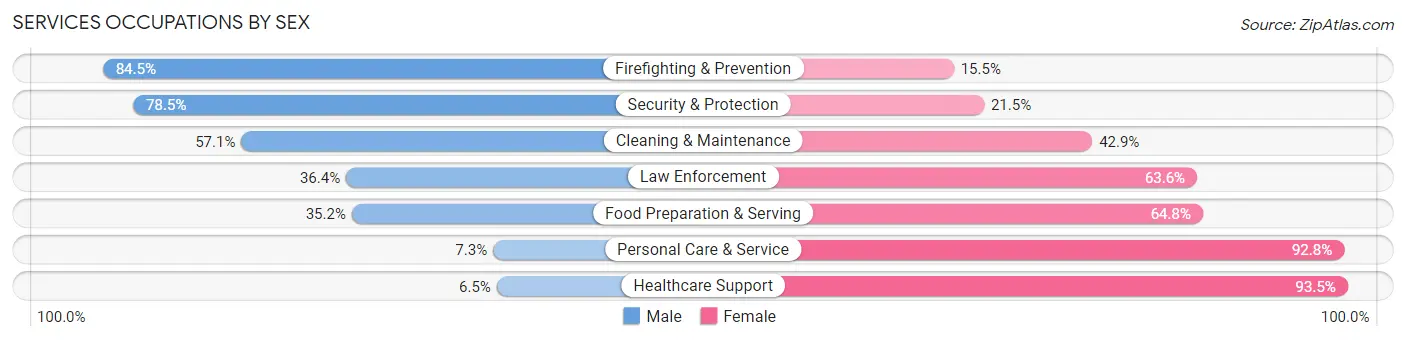
Services Occupations by Sex
Within the Services occupations in Milwaukie, the most male-oriented occupations are Firefighting & Prevention (84.5%), Security & Protection (78.5%), and Cleaning & Maintenance (57.1%), while the most female-oriented occupations are Healthcare Support (93.5%), Personal Care & Service (92.7%), and Food Preparation & Serving (64.8%).
| Occupation | Male | Female |
| Healthcare Support | 18 (6.5%) | 258 (93.5%) |
| Security & Protection | 139 (78.5%) | 38 (21.5%) |
| Firefighting & Prevention | 131 (84.5%) | 24 (15.5%) |
| Law Enforcement | 8 (36.4%) | 14 (63.6%) |
| Food Preparation & Serving | 224 (35.2%) | 412 (64.8%) |
| Cleaning & Maintenance | 181 (57.1%) | 136 (42.9%) |
| Personal Care & Service | 20 (7.2%) | 256 (92.7%) |
| Total (Category) | 582 (34.6%) | 1,100 (65.4%) |
| Total (Overall) | 6,005 (50.4%) | 5,898 (49.5%) |
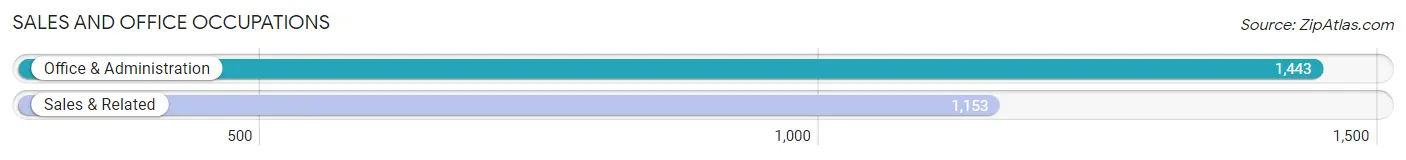
Sales and Office Occupations
The most common Sales and Office occupations in Milwaukie are Office & Administration (1,443 | 12.1%), and Sales & Related (1,153 | 9.7%).
Sales and Office Occupations by Sex
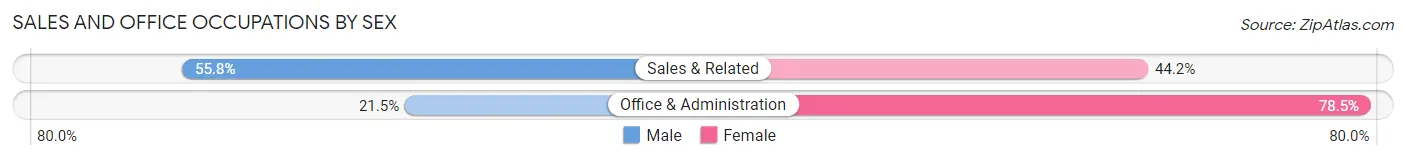
| Occupation | Male | Female |
| Sales & Related | 643 (55.8%) | 510 (44.2%) |
| Office & Administration | 310 (21.5%) | 1,133 (78.5%) |
| Total (Category) | 953 (36.7%) | 1,643 (63.3%) |
| Total (Overall) | 6,005 (50.4%) | 5,898 (49.5%) |
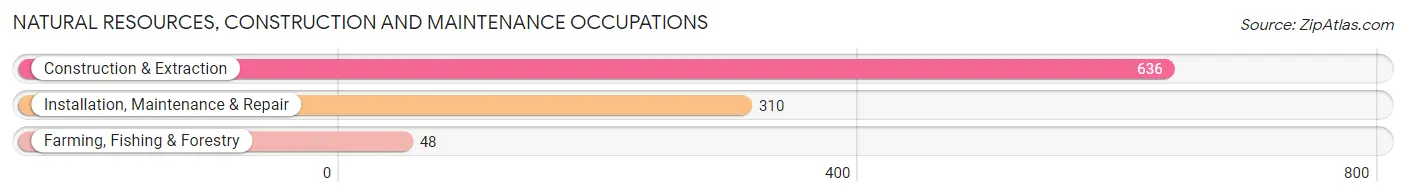
Natural Resources, Construction and Maintenance Occupations
The most common Natural Resources, Construction and Maintenance occupations in Milwaukie are Construction & Extraction (636 | 5.3%), Installation, Maintenance & Repair (310 | 2.6%), and Farming, Fishing & Forestry (48 | 0.4%).
Natural Resources, Construction and Maintenance Occupations by Sex
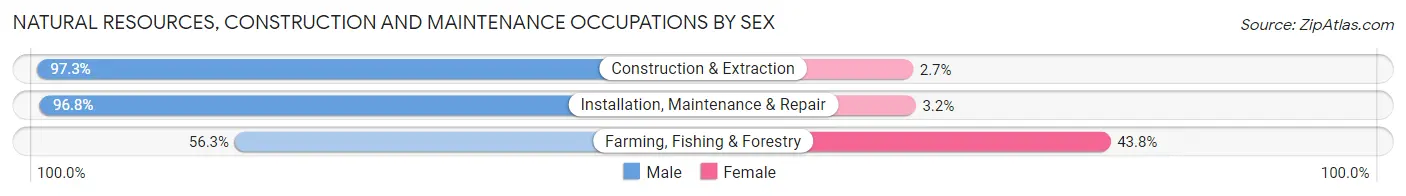
| Occupation | Male | Female |
| Farming, Fishing & Forestry | 27 (56.2%) | 21 (43.8%) |
| Construction & Extraction | 619 (97.3%) | 17 (2.7%) |
| Installation, Maintenance & Repair | 300 (96.8%) | 10 (3.2%) |
| Total (Category) | 946 (95.2%) | 48 (4.8%) |
| Total (Overall) | 6,005 (50.4%) | 5,898 (49.5%) |
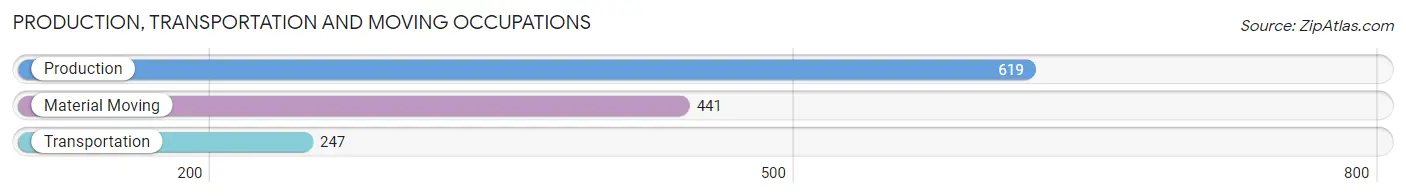
Production, Transportation and Moving Occupations
The most common Production, Transportation and Moving occupations in Milwaukie are Production (619 | 5.2%), Material Moving (441 | 3.7%), and Transportation (247 | 2.1%).
Production, Transportation and Moving Occupations by Sex
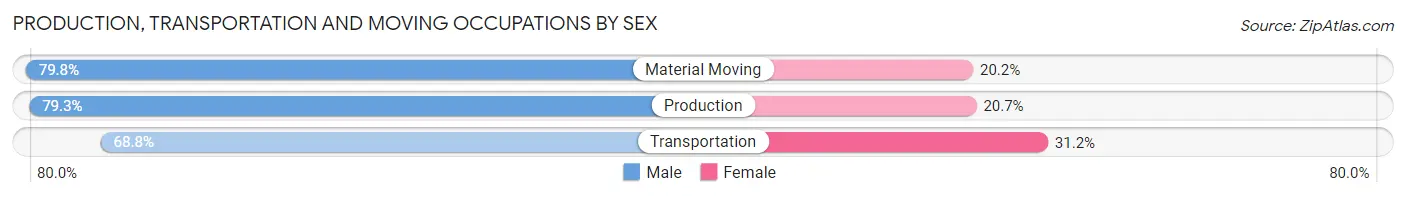
| Occupation | Male | Female |
| Production | 491 (79.3%) | 128 (20.7%) |
| Transportation | 170 (68.8%) | 77 (31.2%) |
| Material Moving | 352 (79.8%) | 89 (20.2%) |
| Total (Category) | 1,013 (77.5%) | 294 (22.5%) |
| Total (Overall) | 6,005 (50.4%) | 5,898 (49.5%) |
Employment Industries by Sex in Milwaukie
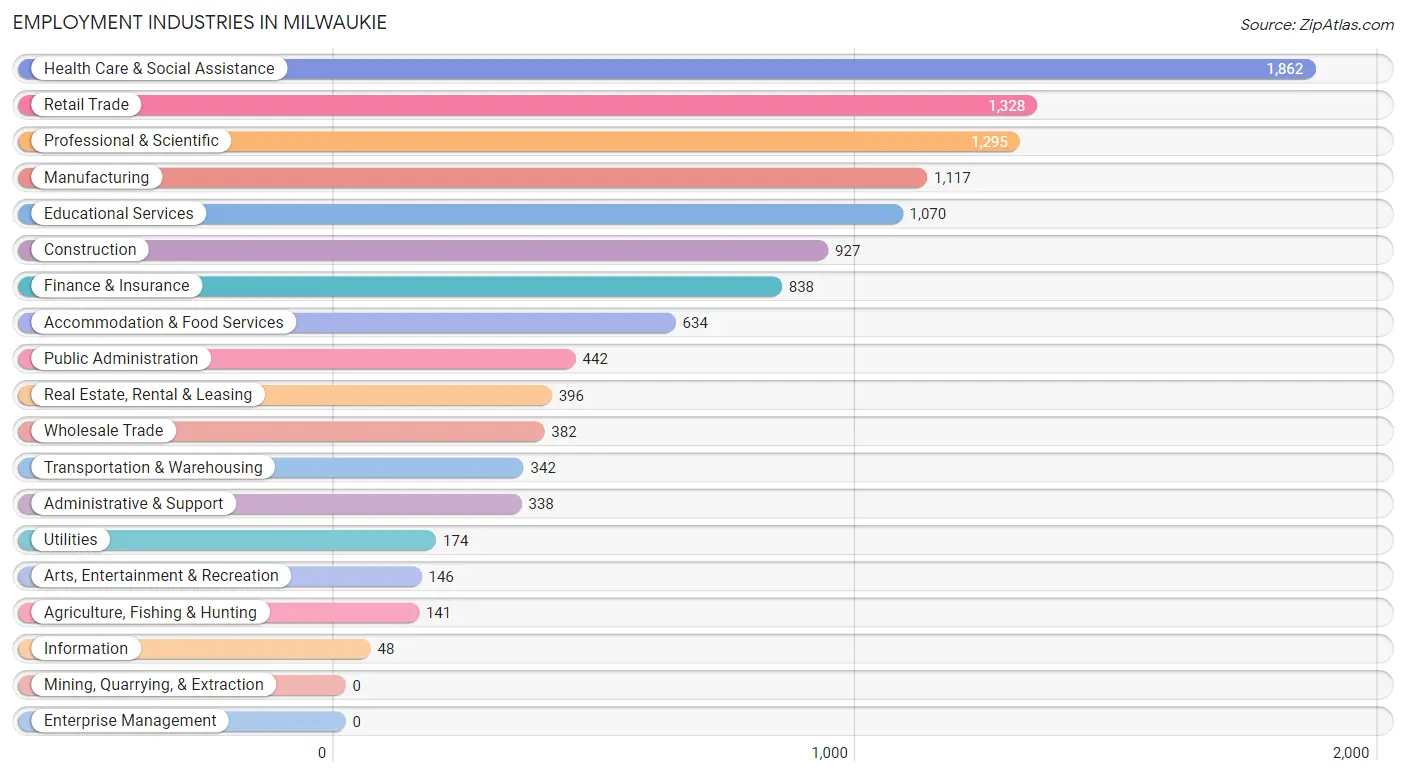
Employment Industries in Milwaukie
The major employment industries in Milwaukie include Health Care & Social Assistance (1,862 | 15.6%), Retail Trade (1,328 | 11.2%), Professional & Scientific (1,295 | 10.9%), Manufacturing (1,117 | 9.4%), and Educational Services (1,070 | 9.0%).
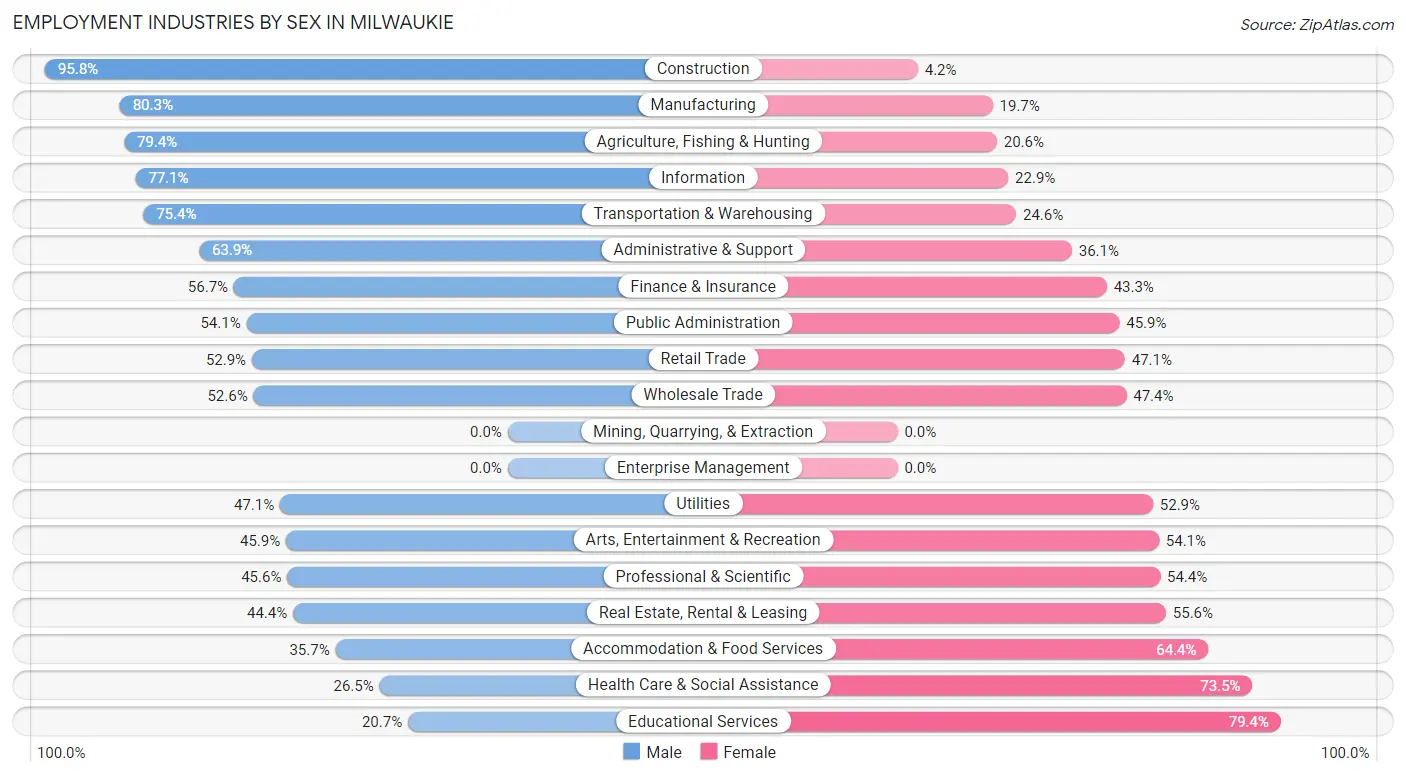
Employment Industries by Sex in Milwaukie
The Milwaukie industries that see more men than women are Construction (95.8%), Manufacturing (80.3%), and Agriculture, Fishing & Hunting (79.4%), whereas the industries that tend to have a higher number of women are Educational Services (79.3%), Health Care & Social Assistance (73.5%), and Accommodation & Food Services (64.3%).
| Industry | Male | Female |
| Agriculture, Fishing & Hunting | 112 (79.4%) | 29 (20.6%) |
| Mining, Quarrying, & Extraction | 0 (0.0%) | 0 (0.0%) |
| Construction | 888 (95.8%) | 39 (4.2%) |
| Manufacturing | 897 (80.3%) | 220 (19.7%) |
| Wholesale Trade | 201 (52.6%) | 181 (47.4%) |
| Retail Trade | 703 (52.9%) | 625 (47.1%) |
| Transportation & Warehousing | 258 (75.4%) | 84 (24.6%) |
| Utilities | 82 (47.1%) | 92 (52.9%) |
| Information | 37 (77.1%) | 11 (22.9%) |
| Finance & Insurance | 475 (56.7%) | 363 (43.3%) |
| Real Estate, Rental & Leasing | 176 (44.4%) | 220 (55.6%) |
| Professional & Scientific | 591 (45.6%) | 704 (54.4%) |
| Enterprise Management | 0 (0.0%) | 0 (0.0%) |
| Administrative & Support | 216 (63.9%) | 122 (36.1%) |
| Educational Services | 221 (20.6%) | 849 (79.3%) |
| Health Care & Social Assistance | 494 (26.5%) | 1,368 (73.5%) |
| Arts, Entertainment & Recreation | 67 (45.9%) | 79 (54.1%) |
| Accommodation & Food Services | 226 (35.6%) | 408 (64.3%) |
| Public Administration | 239 (54.1%) | 203 (45.9%) |
| Total | 6,005 (50.4%) | 5,898 (49.5%) |
Education in Milwaukie
School Enrollment in Milwaukie
The most common levels of schooling among the 4,004 students in Milwaukie are high school (900 | 22.5%), elementary school (814 | 20.3%), and college / undergraduate (731 | 18.3%).
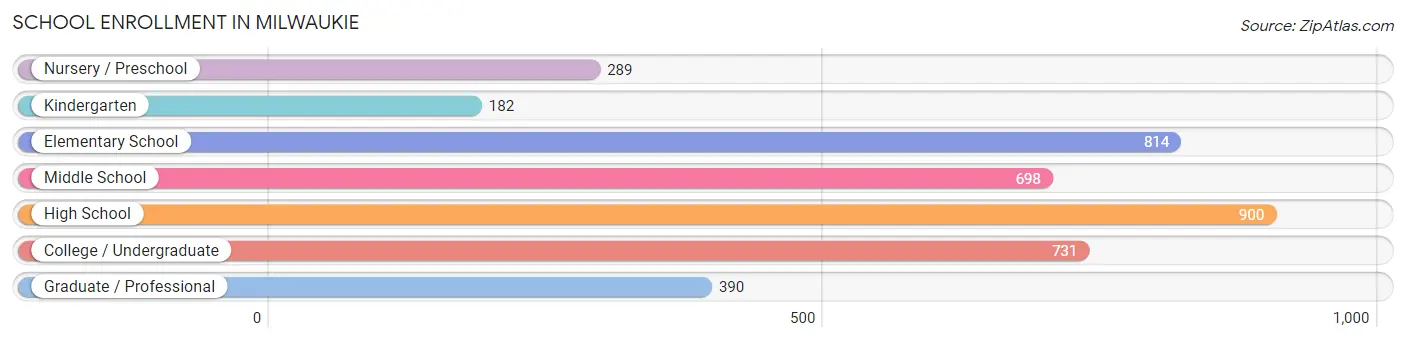
| School Level | # Students | % Students |
| Nursery / Preschool | 289 | 7.2% |
| Kindergarten | 182 | 4.5% |
| Elementary School | 814 | 20.3% |
| Middle School | 698 | 17.4% |
| High School | 900 | 22.5% |
| College / Undergraduate | 731 | 18.3% |
| Graduate / Professional | 390 | 9.7% |
| Total | 4,004 | 100.0% |
School Enrollment by Age by Funding Source in Milwaukie
Out of a total of 4,004 students who are enrolled in schools in Milwaukie, 749 (18.7%) attend a private institution, while the remaining 3,255 (81.3%) are enrolled in public schools. The age group of 3 to 4 year olds has the highest likelihood of being enrolled in private schools, with 160 (80.8% in the age bracket) enrolled. Conversely, the age group of 18 to 19 year olds has the lowest likelihood of being enrolled in a private school, with 141 (100.0% in the age bracket) attending a public institution.
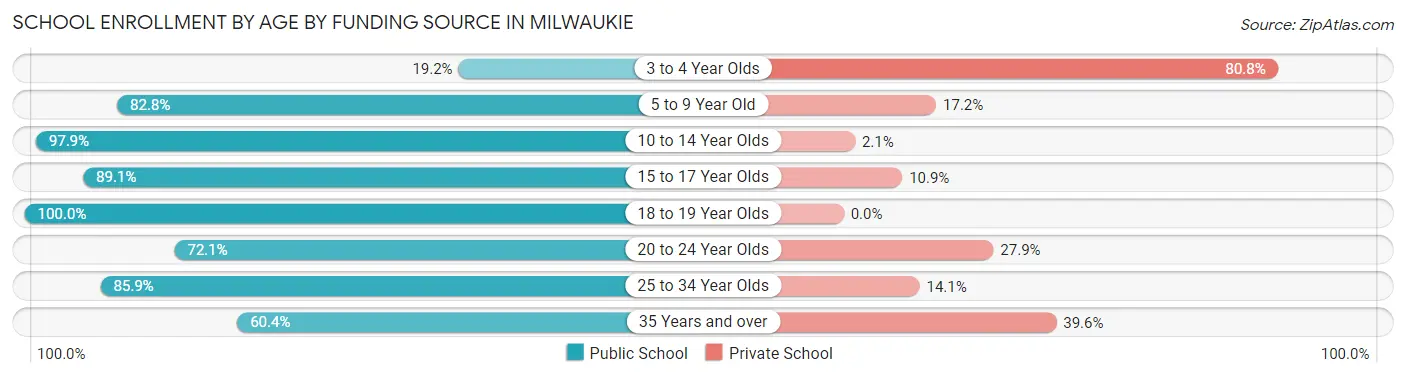
| Age Bracket | Public School | Private School |
| 3 to 4 Year Olds | 38 (19.2%) | 160 (80.8%) |
| 5 to 9 Year Old | 774 (82.8%) | 161 (17.2%) |
| 10 to 14 Year Olds | 884 (97.9%) | 19 (2.1%) |
| 15 to 17 Year Olds | 621 (89.1%) | 76 (10.9%) |
| 18 to 19 Year Olds | 141 (100.0%) | 0 (0.0%) |
| 20 to 24 Year Olds | 274 (72.1%) | 106 (27.9%) |
| 25 to 34 Year Olds | 243 (85.9%) | 40 (14.1%) |
| 35 Years and over | 282 (60.4%) | 185 (39.6%) |
| Total | 3,255 (81.3%) | 749 (18.7%) |
Educational Attainment by Field of Study in Milwaukie
Business (1,276 | 19.2%), science & technology (721 | 10.8%), social sciences (566 | 8.5%), bio, nature & agricultural (536 | 8.1%), and visual & performing arts (533 | 8.0%) are the most common fields of study among 6,650 individuals in Milwaukie who have obtained a bachelor's degree or higher.
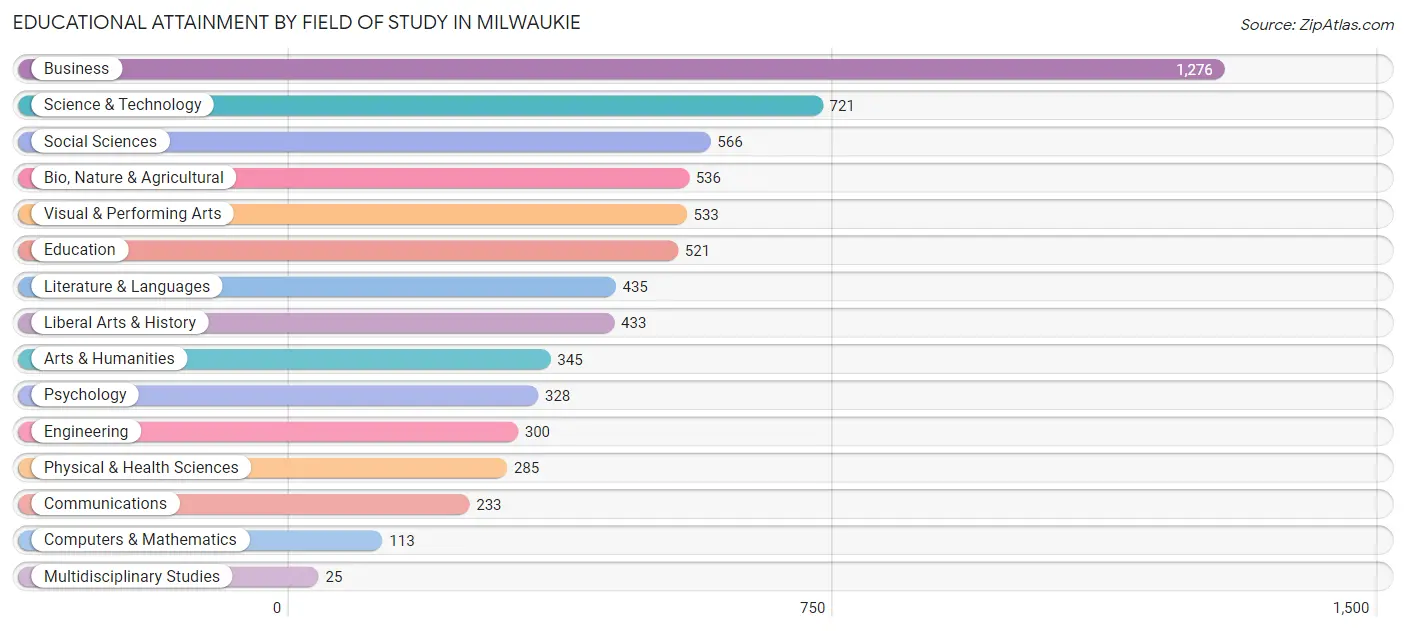
| Field of Study | # Graduates | % Graduates |
| Computers & Mathematics | 113 | 1.7% |
| Bio, Nature & Agricultural | 536 | 8.1% |
| Physical & Health Sciences | 285 | 4.3% |
| Psychology | 328 | 4.9% |
| Social Sciences | 566 | 8.5% |
| Engineering | 300 | 4.5% |
| Multidisciplinary Studies | 25 | 0.4% |
| Science & Technology | 721 | 10.8% |
| Business | 1,276 | 19.2% |
| Education | 521 | 7.8% |
| Literature & Languages | 435 | 6.5% |
| Liberal Arts & History | 433 | 6.5% |
| Visual & Performing Arts | 533 | 8.0% |
| Communications | 233 | 3.5% |
| Arts & Humanities | 345 | 5.2% |
| Total | 6,650 | 100.0% |
Transportation & Commute in Milwaukie
Vehicle Availability by Sex in Milwaukie
The most prevalent vehicle ownership categories in Milwaukie are males with 2 vehicles (2,324, accounting for 39.1%) and females with 2 vehicles (2,421, making up 40.2%).
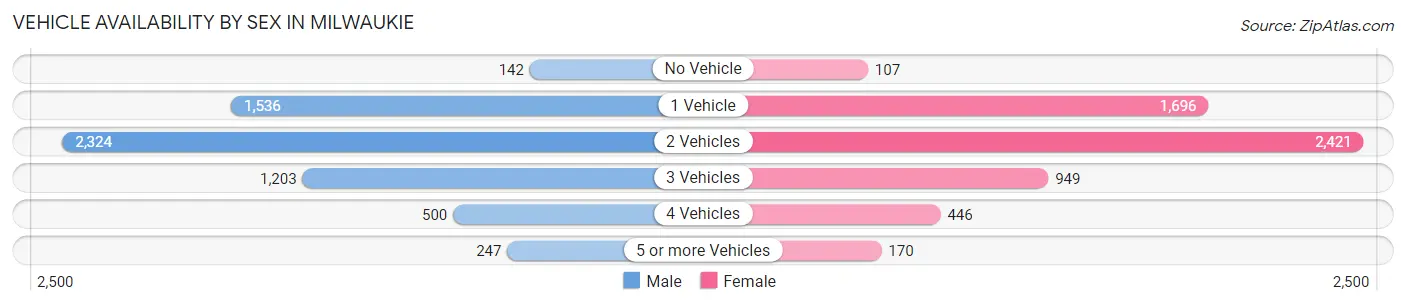
| Vehicles Available | Male | Female |
| No Vehicle | 142 (2.4%) | 107 (1.8%) |
| 1 Vehicle | 1,536 (25.8%) | 1,696 (29.3%) |
| 2 Vehicles | 2,324 (39.1%) | 2,421 (41.8%) |
| 3 Vehicles | 1,203 (20.2%) | 949 (16.4%) |
| 4 Vehicles | 500 (8.4%) | 446 (7.7%) |
| 5 or more Vehicles | 247 (4.2%) | 170 (2.9%) |
| Total | 5,952 (100.0%) | 5,789 (100.0%) |
Commute Time in Milwaukie
The most frequently occuring commute durations in Milwaukie are 30 to 34 minutes (1,955 commuters, 20.1%), 20 to 24 minutes (1,461 commuters, 15.0%), and 15 to 19 minutes (1,290 commuters, 13.2%).
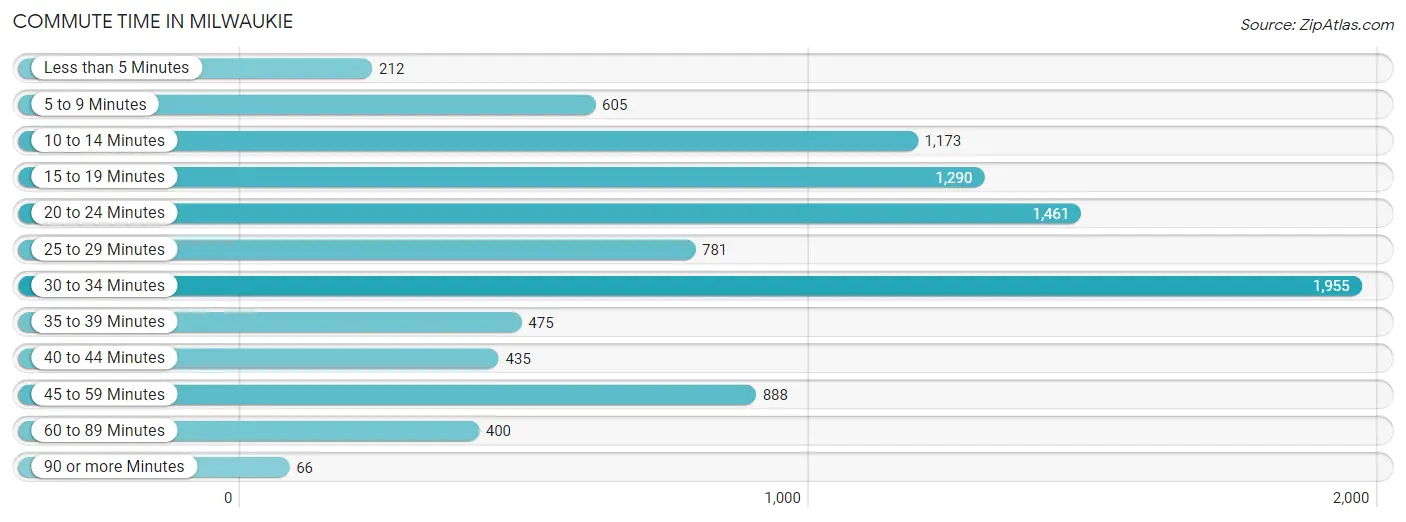
| Commute Time | # Commuters | % Commuters |
| Less than 5 Minutes | 212 | 2.2% |
| 5 to 9 Minutes | 605 | 6.2% |
| 10 to 14 Minutes | 1,173 | 12.0% |
| 15 to 19 Minutes | 1,290 | 13.2% |
| 20 to 24 Minutes | 1,461 | 15.0% |
| 25 to 29 Minutes | 781 | 8.0% |
| 30 to 34 Minutes | 1,955 | 20.1% |
| 35 to 39 Minutes | 475 | 4.9% |
| 40 to 44 Minutes | 435 | 4.5% |
| 45 to 59 Minutes | 888 | 9.1% |
| 60 to 89 Minutes | 400 | 4.1% |
| 90 or more Minutes | 66 | 0.7% |
Commute Time by Sex in Milwaukie
The most common commute times in Milwaukie are 30 to 34 minutes (1,378 commuters, 27.5%) for males and 20 to 24 minutes (800 commuters, 16.9%) for females.
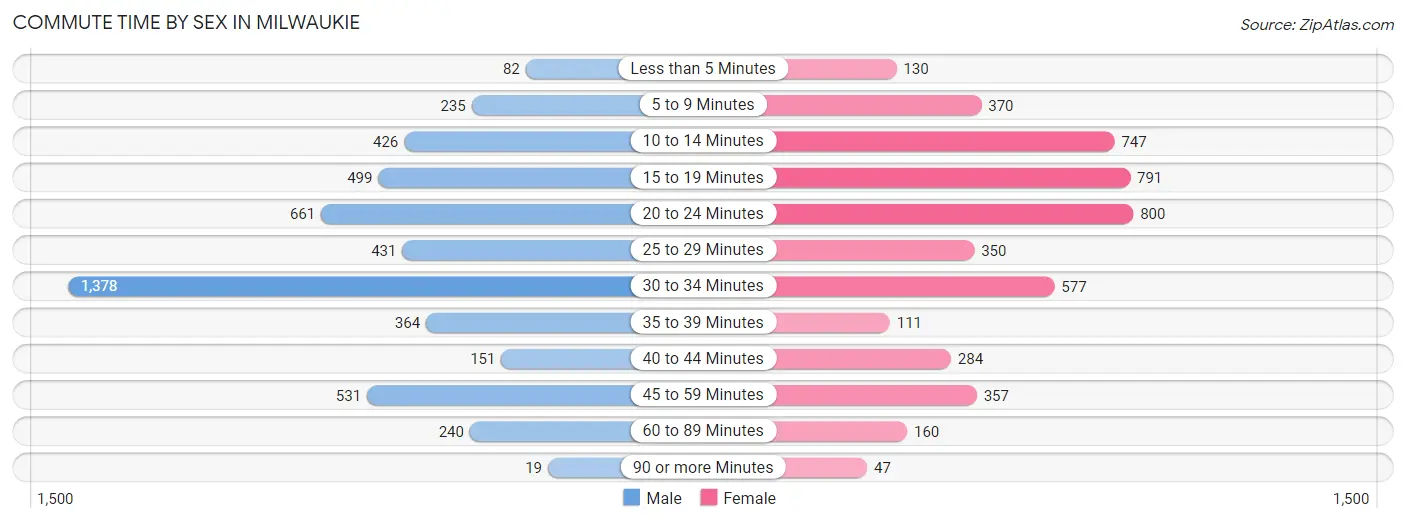
| Commute Time | Male | Female |
| Less than 5 Minutes | 82 (1.6%) | 130 (2.8%) |
| 5 to 9 Minutes | 235 (4.7%) | 370 (7.8%) |
| 10 to 14 Minutes | 426 (8.5%) | 747 (15.8%) |
| 15 to 19 Minutes | 499 (10.0%) | 791 (16.7%) |
| 20 to 24 Minutes | 661 (13.2%) | 800 (16.9%) |
| 25 to 29 Minutes | 431 (8.6%) | 350 (7.4%) |
| 30 to 34 Minutes | 1,378 (27.5%) | 577 (12.2%) |
| 35 to 39 Minutes | 364 (7.3%) | 111 (2.4%) |
| 40 to 44 Minutes | 151 (3.0%) | 284 (6.0%) |
| 45 to 59 Minutes | 531 (10.6%) | 357 (7.6%) |
| 60 to 89 Minutes | 240 (4.8%) | 160 (3.4%) |
| 90 or more Minutes | 19 (0.4%) | 47 (1.0%) |
Time of Departure to Work by Sex in Milwaukie
The most frequent times of departure to work in Milwaukie are 6:30 AM to 6:59 AM (745, 14.8%) for males and 7:00 AM to 7:29 AM (718, 15.2%) for females.
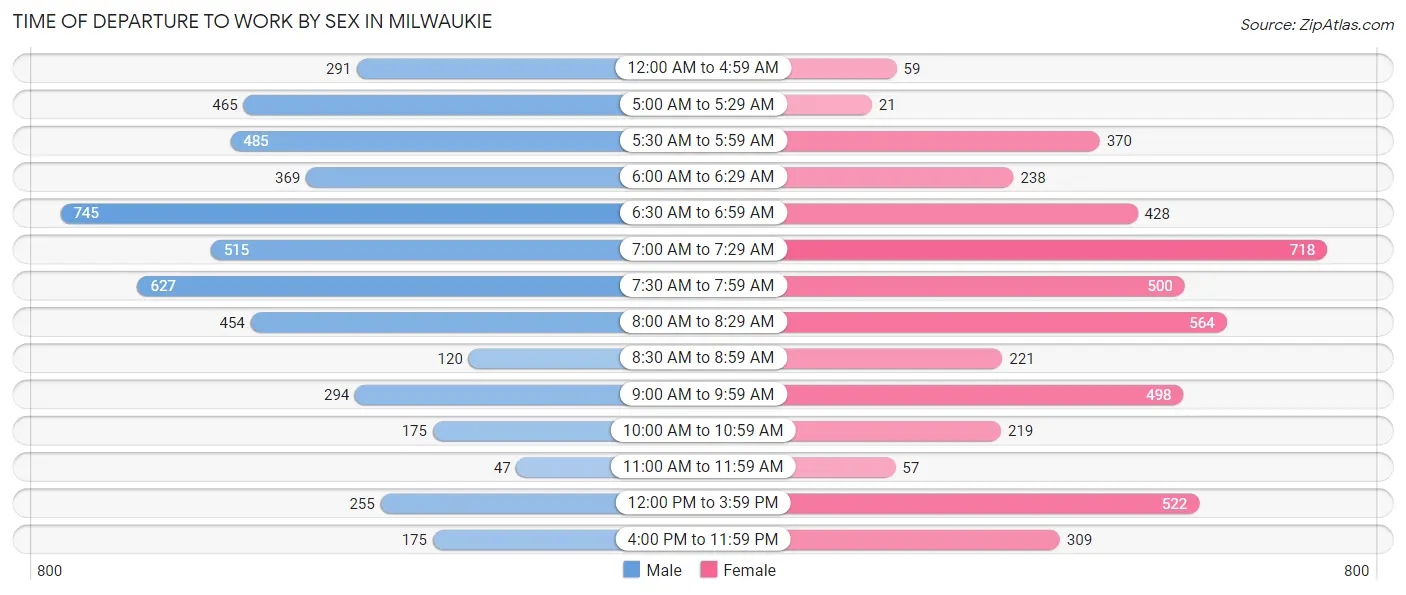
| Time of Departure | Male | Female |
| 12:00 AM to 4:59 AM | 291 (5.8%) | 59 (1.3%) |
| 5:00 AM to 5:29 AM | 465 (9.3%) | 21 (0.4%) |
| 5:30 AM to 5:59 AM | 485 (9.7%) | 370 (7.8%) |
| 6:00 AM to 6:29 AM | 369 (7.3%) | 238 (5.0%) |
| 6:30 AM to 6:59 AM | 745 (14.8%) | 428 (9.1%) |
| 7:00 AM to 7:29 AM | 515 (10.3%) | 718 (15.2%) |
| 7:30 AM to 7:59 AM | 627 (12.5%) | 500 (10.6%) |
| 8:00 AM to 8:29 AM | 454 (9.0%) | 564 (11.9%) |
| 8:30 AM to 8:59 AM | 120 (2.4%) | 221 (4.7%) |
| 9:00 AM to 9:59 AM | 294 (5.9%) | 498 (10.5%) |
| 10:00 AM to 10:59 AM | 175 (3.5%) | 219 (4.6%) |
| 11:00 AM to 11:59 AM | 47 (0.9%) | 57 (1.2%) |
| 12:00 PM to 3:59 PM | 255 (5.1%) | 522 (11.1%) |
| 4:00 PM to 11:59 PM | 175 (3.5%) | 309 (6.5%) |
| Total | 5,017 (100.0%) | 4,724 (100.0%) |
Housing Occupancy in Milwaukie
Occupancy by Ownership in Milwaukie
Of the total 9,286 dwellings in Milwaukie, owner-occupied units account for 5,440 (58.6%), while renter-occupied units make up 3,846 (41.4%).
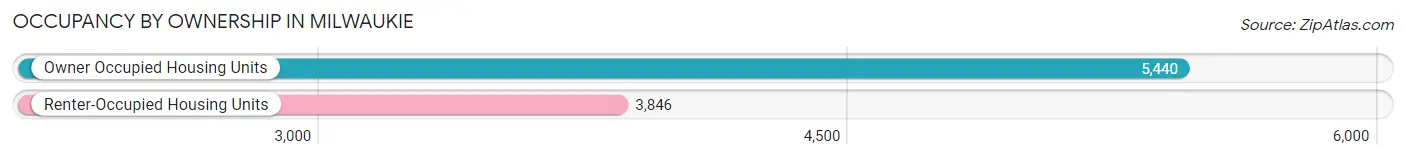
| Occupancy | # Housing Units | % Housing Units |
| Owner Occupied Housing Units | 5,440 | 58.6% |
| Renter-Occupied Housing Units | 3,846 | 41.4% |
| Total Occupied Housing Units | 9,286 | 100.0% |
Occupancy by Household Size in Milwaukie
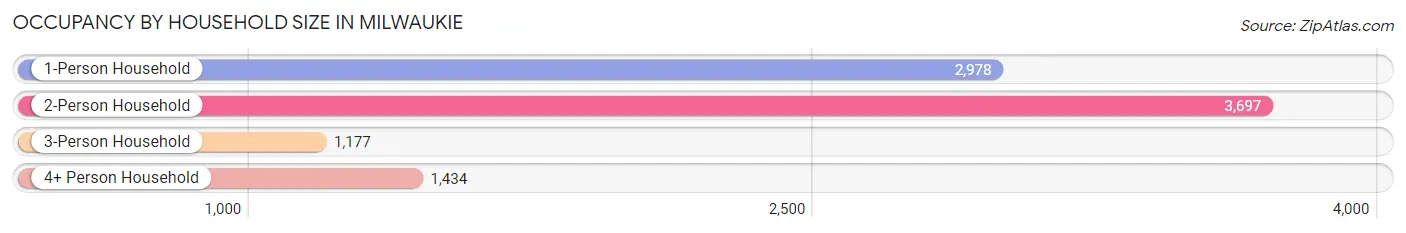
| Household Size | # Housing Units | % Housing Units |
| 1-Person Household | 2,978 | 32.1% |
| 2-Person Household | 3,697 | 39.8% |
| 3-Person Household | 1,177 | 12.7% |
| 4+ Person Household | 1,434 | 15.4% |
| Total Housing Units | 9,286 | 100.0% |
Occupancy by Ownership by Household Size in Milwaukie
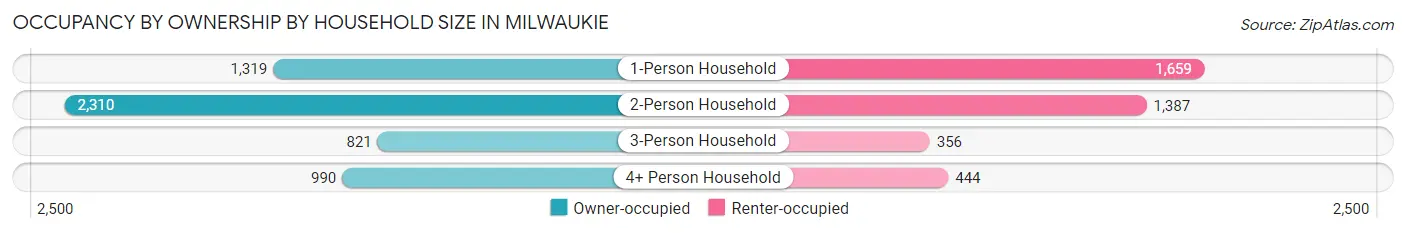
| Household Size | Owner-occupied | Renter-occupied |
| 1-Person Household | 1,319 (44.3%) | 1,659 (55.7%) |
| 2-Person Household | 2,310 (62.5%) | 1,387 (37.5%) |
| 3-Person Household | 821 (69.8%) | 356 (30.2%) |
| 4+ Person Household | 990 (69.0%) | 444 (31.0%) |
| Total Housing Units | 5,440 (58.6%) | 3,846 (41.4%) |
Occupancy by Educational Attainment in Milwaukie
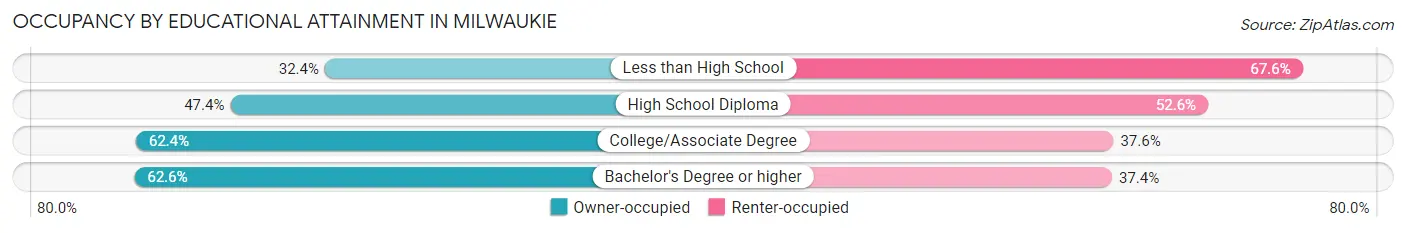
| Household Size | Owner-occupied | Renter-occupied |
| Less than High School | 113 (32.4%) | 236 (67.6%) |
| High School Diploma | 806 (47.4%) | 895 (52.6%) |
| College/Associate Degree | 2,210 (62.4%) | 1,334 (37.6%) |
| Bachelor's Degree or higher | 2,311 (62.6%) | 1,381 (37.4%) |
Occupancy by Age of Householder in Milwaukie
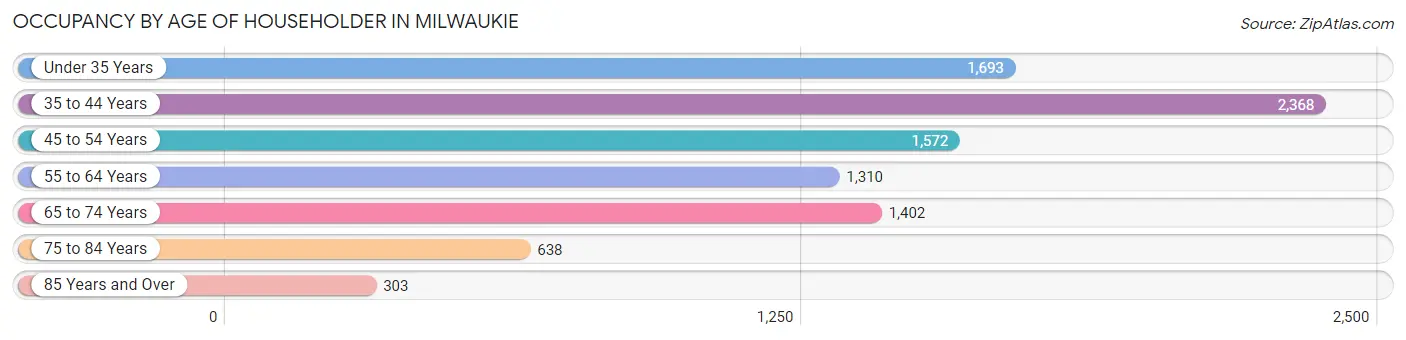
| Age Bracket | # Households | % Households |
| Under 35 Years | 1,693 | 18.2% |
| 35 to 44 Years | 2,368 | 25.5% |
| 45 to 54 Years | 1,572 | 16.9% |
| 55 to 64 Years | 1,310 | 14.1% |
| 65 to 74 Years | 1,402 | 15.1% |
| 75 to 84 Years | 638 | 6.9% |
| 85 Years and Over | 303 | 3.3% |
| Total | 9,286 | 100.0% |
Housing Finances in Milwaukie
Median Income by Occupancy in Milwaukie
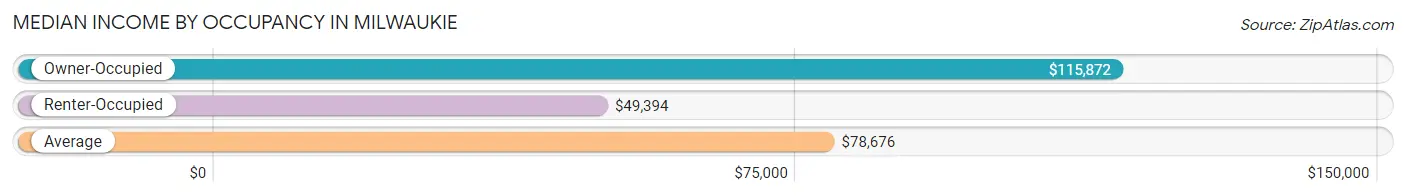
| Occupancy Type | # Households | Median Income |
| Owner-Occupied | 5,440 (58.6%) | $115,872 |
| Renter-Occupied | 3,846 (41.4%) | $49,394 |
| Average | 9,286 (100.0%) | $78,676 |
Occupancy by Householder Income Bracket in Milwaukie
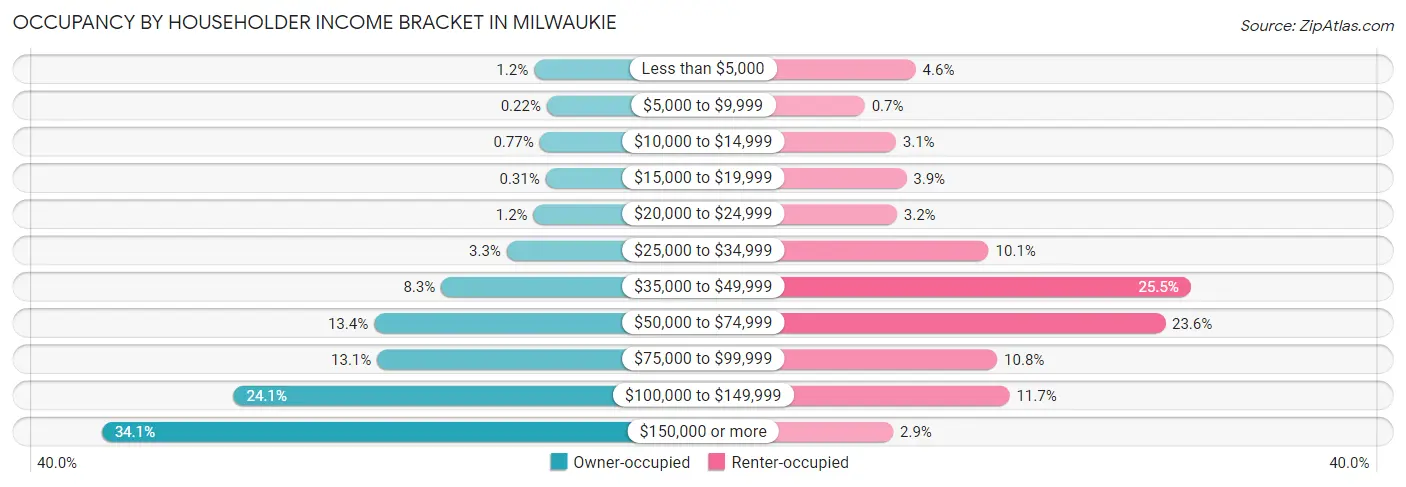
| Income Bracket | Owner-occupied | Renter-occupied |
| Less than $5,000 | 65 (1.2%) | 176 (4.6%) |
| $5,000 to $9,999 | 12 (0.2%) | 27 (0.7%) |
| $10,000 to $14,999 | 42 (0.8%) | 118 (3.1%) |
| $15,000 to $19,999 | 17 (0.3%) | 149 (3.9%) |
| $20,000 to $24,999 | 67 (1.2%) | 121 (3.2%) |
| $25,000 to $34,999 | 178 (3.3%) | 390 (10.1%) |
| $35,000 to $49,999 | 450 (8.3%) | 982 (25.5%) |
| $50,000 to $74,999 | 728 (13.4%) | 907 (23.6%) |
| $75,000 to $99,999 | 715 (13.1%) | 415 (10.8%) |
| $100,000 to $149,999 | 1,310 (24.1%) | 451 (11.7%) |
| $150,000 or more | 1,856 (34.1%) | 110 (2.9%) |
| Total | 5,440 (100.0%) | 3,846 (100.0%) |
Monthly Housing Cost Tiers in Milwaukie
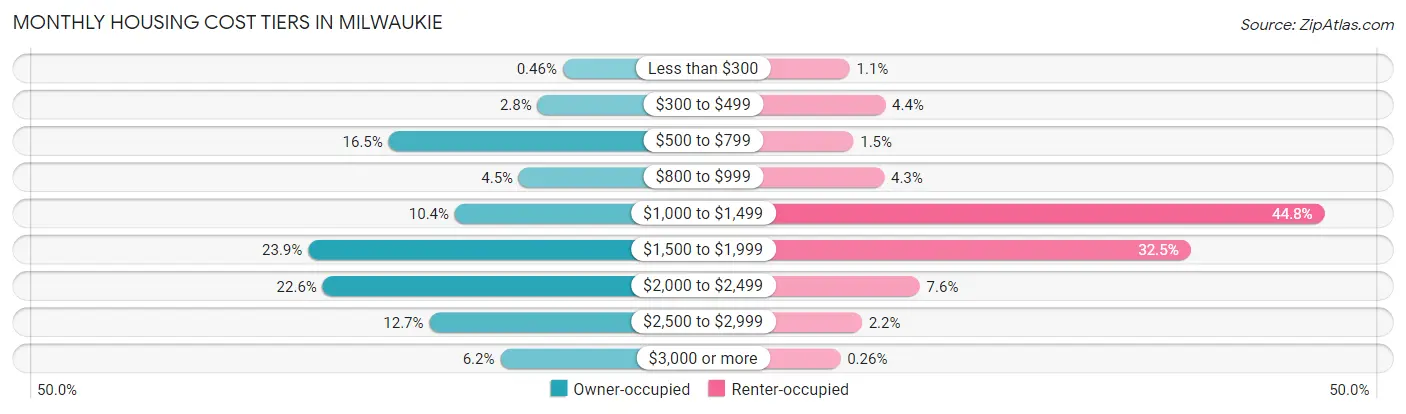
| Monthly Cost | Owner-occupied | Renter-occupied |
| Less than $300 | 25 (0.5%) | 43 (1.1%) |
| $300 to $499 | 151 (2.8%) | 169 (4.4%) |
| $500 to $799 | 897 (16.5%) | 56 (1.5%) |
| $800 to $999 | 244 (4.5%) | 165 (4.3%) |
| $1,000 to $1,499 | 565 (10.4%) | 1,724 (44.8%) |
| $1,500 to $1,999 | 1,300 (23.9%) | 1,250 (32.5%) |
| $2,000 to $2,499 | 1,227 (22.6%) | 291 (7.6%) |
| $2,500 to $2,999 | 693 (12.7%) | 86 (2.2%) |
| $3,000 or more | 338 (6.2%) | 10 (0.3%) |
| Total | 5,440 (100.0%) | 3,846 (100.0%) |
Physical Housing Characteristics in Milwaukie
Housing Structures in Milwaukie
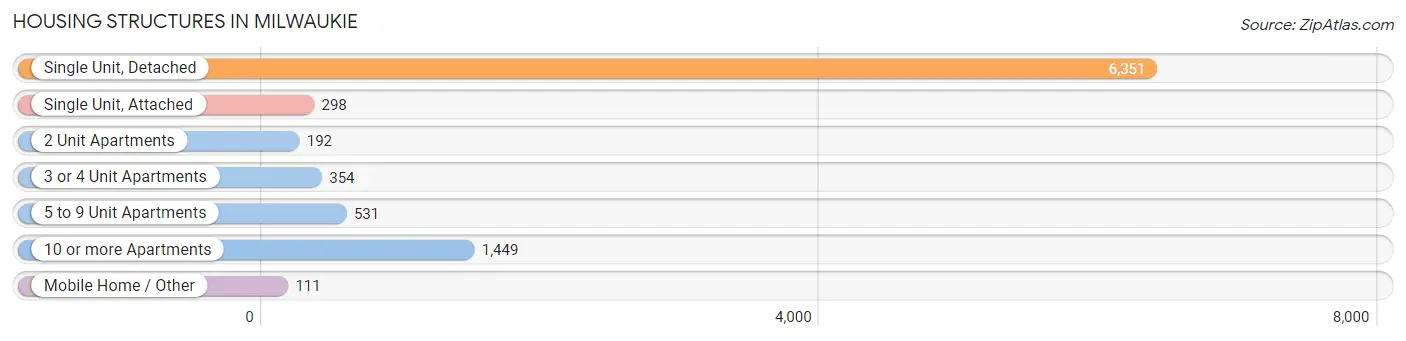
| Structure Type | # Housing Units | % Housing Units |
| Single Unit, Detached | 6,351 | 68.4% |
| Single Unit, Attached | 298 | 3.2% |
| 2 Unit Apartments | 192 | 2.1% |
| 3 or 4 Unit Apartments | 354 | 3.8% |
| 5 to 9 Unit Apartments | 531 | 5.7% |
| 10 or more Apartments | 1,449 | 15.6% |
| Mobile Home / Other | 111 | 1.2% |
| Total | 9,286 | 100.0% |
Housing Structures by Occupancy in Milwaukie
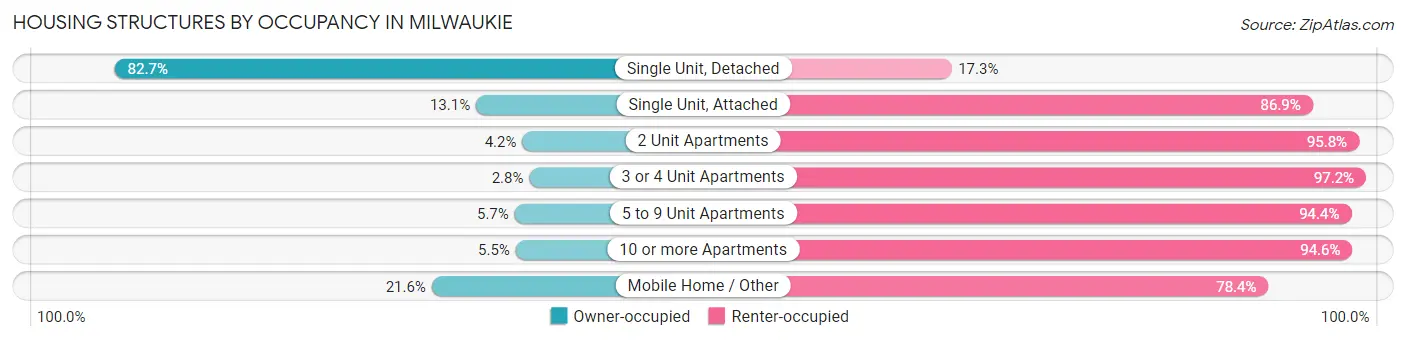
| Structure Type | Owner-occupied | Renter-occupied |
| Single Unit, Detached | 5,250 (82.7%) | 1,101 (17.3%) |
| Single Unit, Attached | 39 (13.1%) | 259 (86.9%) |
| 2 Unit Apartments | 8 (4.2%) | 184 (95.8%) |
| 3 or 4 Unit Apartments | 10 (2.8%) | 344 (97.2%) |
| 5 to 9 Unit Apartments | 30 (5.7%) | 501 (94.4%) |
| 10 or more Apartments | 79 (5.4%) | 1,370 (94.6%) |
| Mobile Home / Other | 24 (21.6%) | 87 (78.4%) |
| Total | 5,440 (58.6%) | 3,846 (41.4%) |
Housing Structures by Number of Rooms in Milwaukie
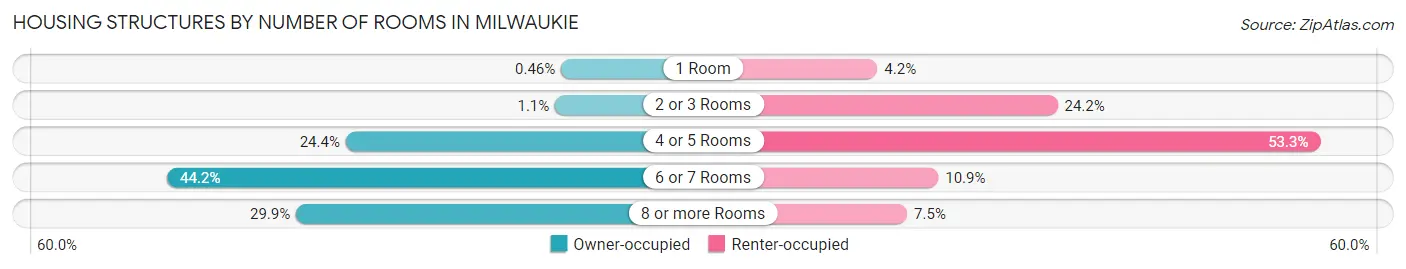
| Number of Rooms | Owner-occupied | Renter-occupied |
| 1 Room | 25 (0.5%) | 160 (4.2%) |
| 2 or 3 Rooms | 61 (1.1%) | 929 (24.1%) |
| 4 or 5 Rooms | 1,325 (24.4%) | 2,050 (53.3%) |
| 6 or 7 Rooms | 2,404 (44.2%) | 420 (10.9%) |
| 8 or more Rooms | 1,625 (29.9%) | 287 (7.5%) |
| Total | 5,440 (100.0%) | 3,846 (100.0%) |
Housing Structure by Heating Type in Milwaukie
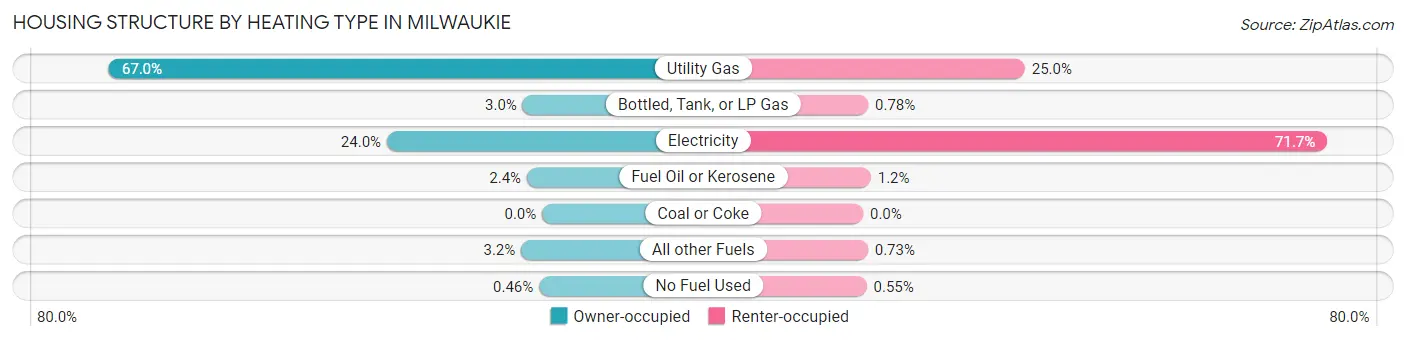
| Heating Type | Owner-occupied | Renter-occupied |
| Utility Gas | 3,643 (67.0%) | 962 (25.0%) |
| Bottled, Tank, or LP Gas | 163 (3.0%) | 30 (0.8%) |
| Electricity | 1,305 (24.0%) | 2,759 (71.7%) |
| Fuel Oil or Kerosene | 128 (2.4%) | 46 (1.2%) |
| Coal or Coke | 0 (0.0%) | 0 (0.0%) |
| All other Fuels | 176 (3.2%) | 28 (0.7%) |
| No Fuel Used | 25 (0.5%) | 21 (0.5%) |
| Total | 5,440 (100.0%) | 3,846 (100.0%) |
Household Vehicle Usage in Milwaukie
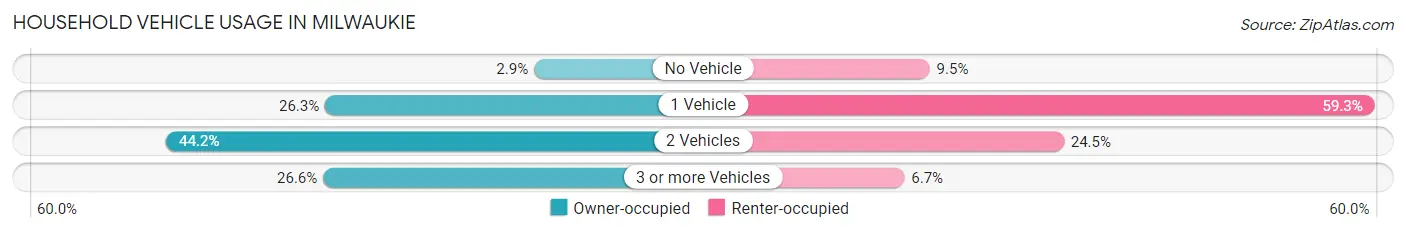
| Vehicles per Household | Owner-occupied | Renter-occupied |
| No Vehicle | 160 (2.9%) | 365 (9.5%) |
| 1 Vehicle | 1,433 (26.3%) | 2,282 (59.3%) |
| 2 Vehicles | 2,402 (44.2%) | 943 (24.5%) |
| 3 or more Vehicles | 1,445 (26.6%) | 256 (6.7%) |
| Total | 5,440 (100.0%) | 3,846 (100.0%) |
Real Estate & Mortgages in Milwaukie
Real Estate and Mortgage Overview in Milwaukie
| Characteristic | Without Mortgage | With Mortgage |
| Housing Units | 1,340 | 4,100 |
| Median Property Value | $420,000 | $449,700 |
| Median Household Income | $78,897 | $1,655 |
| Monthly Housing Costs | $655 | $338 |
| Real Estate Taxes | $4,100 | $9 |
Property Value by Mortgage Status in Milwaukie
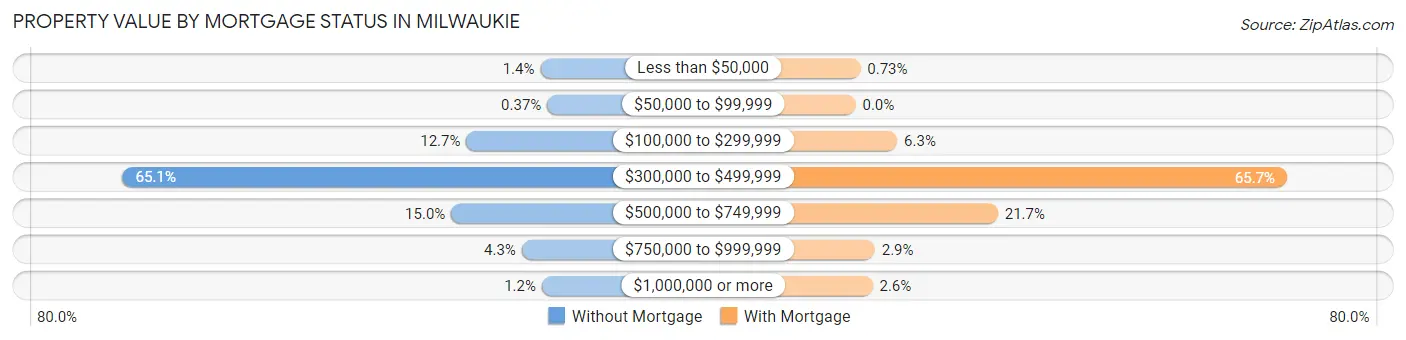
| Property Value | Without Mortgage | With Mortgage |
| Less than $50,000 | 19 (1.4%) | 30 (0.7%) |
| $50,000 to $99,999 | 5 (0.4%) | 0 (0.0%) |
| $100,000 to $299,999 | 170 (12.7%) | 260 (6.3%) |
| $300,000 to $499,999 | 872 (65.1%) | 2,695 (65.7%) |
| $500,000 to $749,999 | 201 (15.0%) | 889 (21.7%) |
| $750,000 to $999,999 | 57 (4.3%) | 120 (2.9%) |
| $1,000,000 or more | 16 (1.2%) | 106 (2.6%) |
| Total | 1,340 (100.0%) | 4,100 (100.0%) |
Household Income by Mortgage Status in Milwaukie
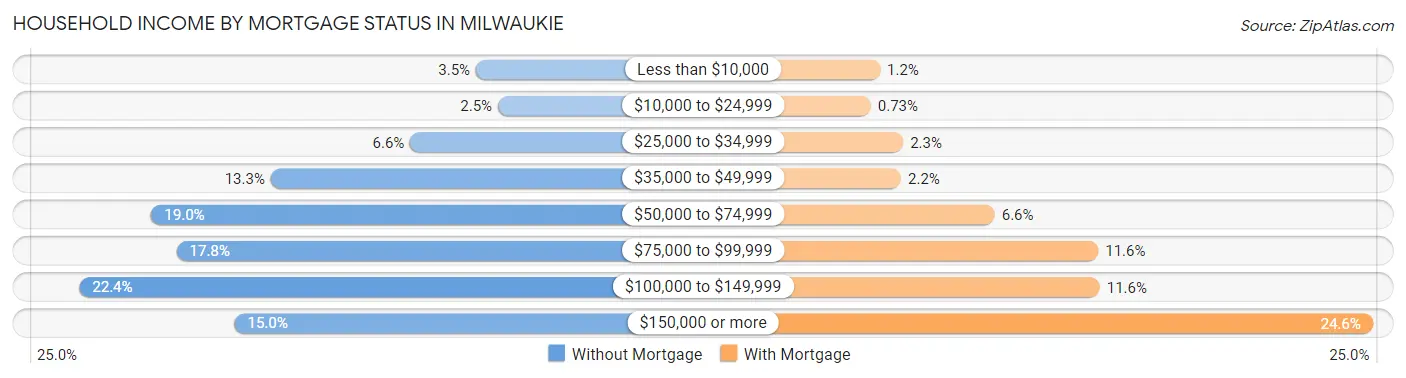
| Household Income | Without Mortgage | With Mortgage |
| Less than $10,000 | 47 (3.5%) | 48 (1.2%) |
| $10,000 to $24,999 | 33 (2.5%) | 30 (0.7%) |
| $25,000 to $34,999 | 89 (6.6%) | 93 (2.3%) |
| $35,000 to $49,999 | 178 (13.3%) | 89 (2.2%) |
| $50,000 to $74,999 | 254 (19.0%) | 272 (6.6%) |
| $75,000 to $99,999 | 238 (17.8%) | 474 (11.6%) |
| $100,000 to $149,999 | 300 (22.4%) | 477 (11.6%) |
| $150,000 or more | 201 (15.0%) | 1,010 (24.6%) |
| Total | 1,340 (100.0%) | 4,100 (100.0%) |
Property Value to Household Income Ratio in Milwaukie
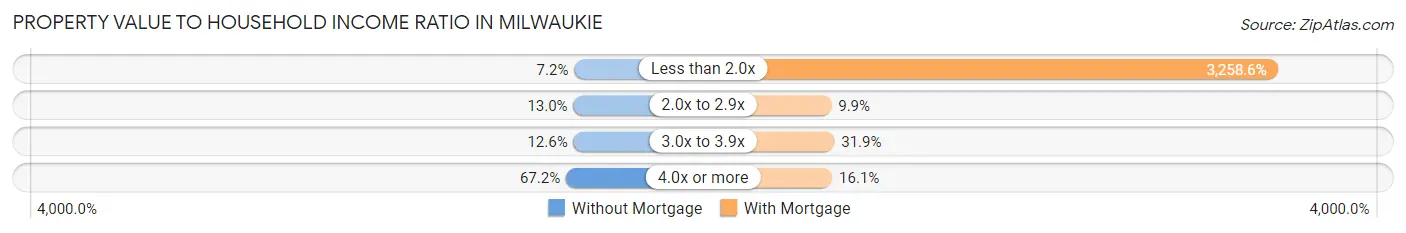
| Value-to-Income Ratio | Without Mortgage | With Mortgage |
| Less than 2.0x | 96 (7.2%) | 133,603 (3,258.6%) |
| 2.0x to 2.9x | 174 (13.0%) | 404 (9.9%) |
| 3.0x to 3.9x | 169 (12.6%) | 1,306 (31.9%) |
| 4.0x or more | 901 (67.2%) | 659 (16.1%) |
| Total | 1,340 (100.0%) | 4,100 (100.0%) |
Real Estate Taxes by Mortgage Status in Milwaukie
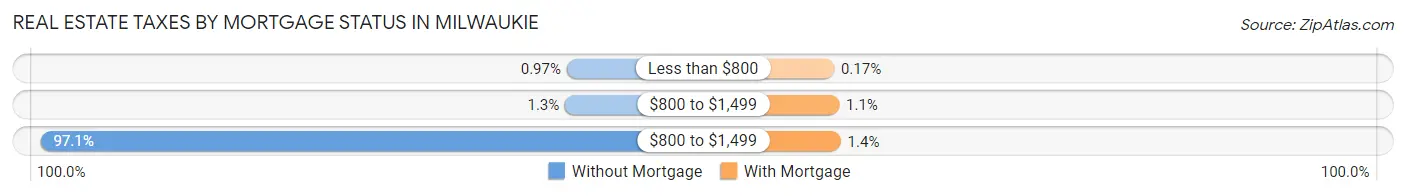
| Property Taxes | Without Mortgage | With Mortgage |
| Less than $800 | 13 (1.0%) | 7 (0.2%) |
| $800 to $1,499 | 17 (1.3%) | 45 (1.1%) |
| $800 to $1,499 | 1,301 (97.1%) | 57 (1.4%) |
| Total | 1,340 (100.0%) | 4,100 (100.0%) |
Health & Disability in Milwaukie
Health Insurance Coverage by Age in Milwaukie
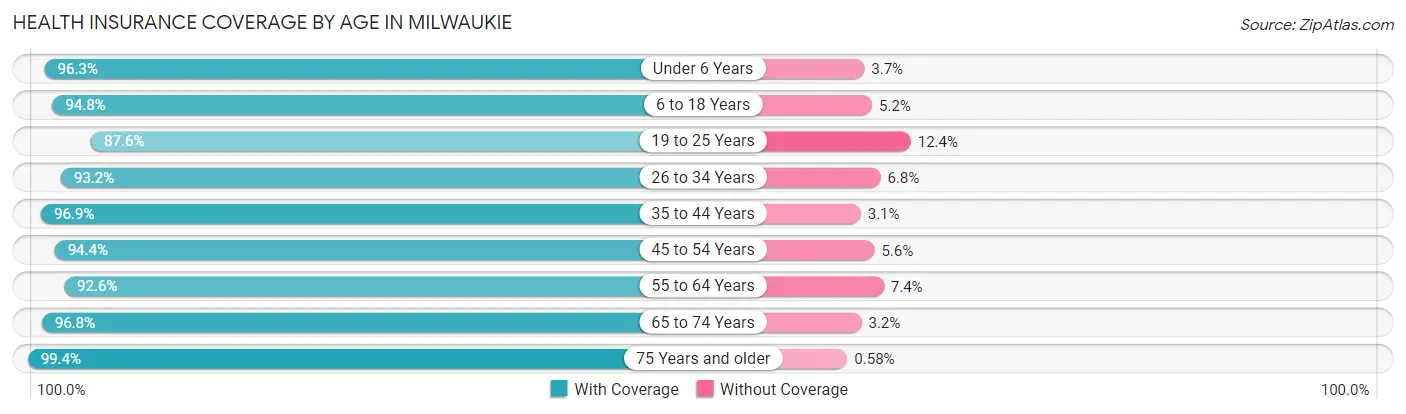
| Age Bracket | With Coverage | Without Coverage |
| Under 6 Years | 1,338 (96.3%) | 52 (3.7%) |
| 6 to 18 Years | 2,431 (94.8%) | 133 (5.2%) |
| 19 to 25 Years | 1,569 (87.6%) | 222 (12.4%) |
| 26 to 34 Years | 2,552 (93.2%) | 185 (6.8%) |
| 35 to 44 Years | 3,810 (96.9%) | 121 (3.1%) |
| 45 to 54 Years | 2,501 (94.4%) | 149 (5.6%) |
| 55 to 64 Years | 2,424 (92.6%) | 193 (7.4%) |
| 65 to 74 Years | 1,957 (96.8%) | 65 (3.2%) |
| 75 Years and older | 1,383 (99.4%) | 8 (0.6%) |
| Total | 19,965 (94.7%) | 1,128 (5.3%) |
Health Insurance Coverage by Citizenship Status in Milwaukie
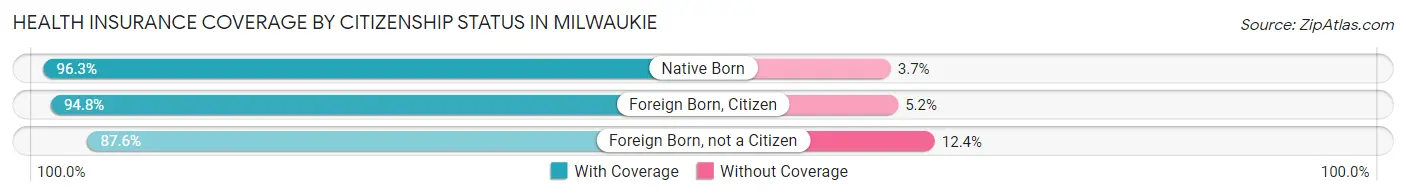
| Citizenship Status | With Coverage | Without Coverage |
| Native Born | 1,338 (96.3%) | 52 (3.7%) |
| Foreign Born, Citizen | 2,431 (94.8%) | 133 (5.2%) |
| Foreign Born, not a Citizen | 1,569 (87.6%) | 222 (12.4%) |
Health Insurance Coverage by Household Income in Milwaukie
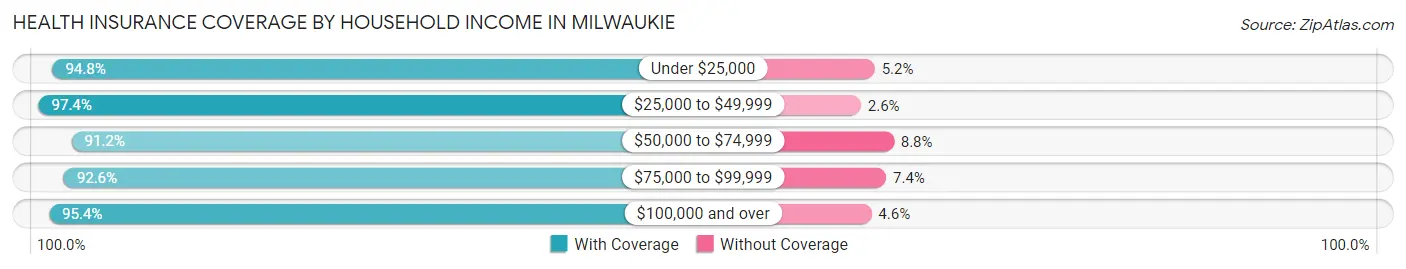
| Household Income | With Coverage | Without Coverage |
| Under $25,000 | 1,051 (94.8%) | 58 (5.2%) |
| $25,000 to $49,999 | 3,220 (97.4%) | 87 (2.6%) |
| $50,000 to $74,999 | 3,087 (91.2%) | 298 (8.8%) |
| $75,000 to $99,999 | 2,391 (92.6%) | 190 (7.4%) |
| $100,000 and over | 9,963 (95.4%) | 482 (4.6%) |
Public vs Private Health Insurance Coverage by Age in Milwaukie
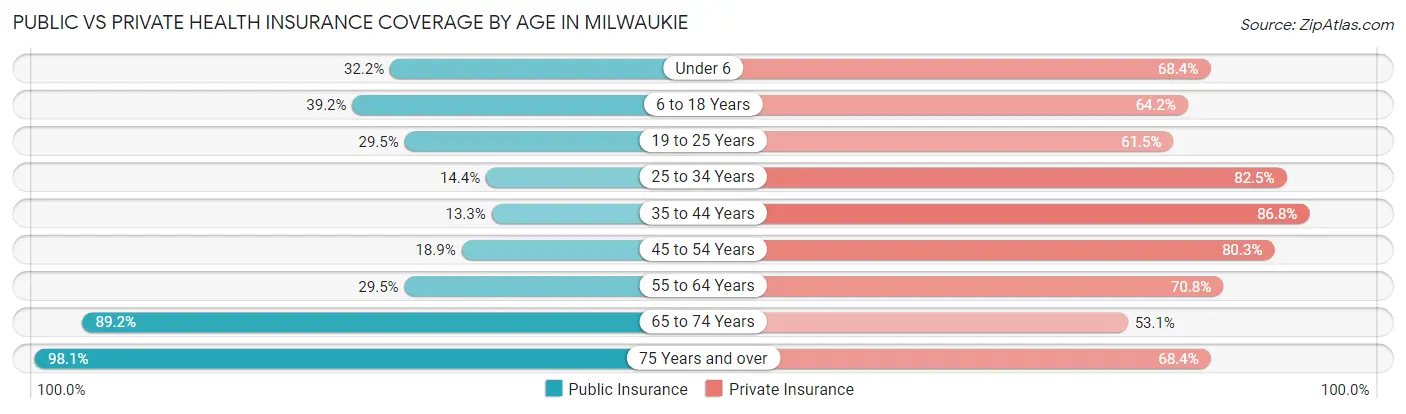
| Age Bracket | Public Insurance | Private Insurance |
| Under 6 | 447 (32.2%) | 950 (68.3%) |
| 6 to 18 Years | 1,004 (39.2%) | 1,646 (64.2%) |
| 19 to 25 Years | 528 (29.5%) | 1,102 (61.5%) |
| 25 to 34 Years | 393 (14.4%) | 2,258 (82.5%) |
| 35 to 44 Years | 524 (13.3%) | 3,410 (86.8%) |
| 45 to 54 Years | 501 (18.9%) | 2,127 (80.3%) |
| 55 to 64 Years | 772 (29.5%) | 1,852 (70.8%) |
| 65 to 74 Years | 1,804 (89.2%) | 1,073 (53.1%) |
| 75 Years and over | 1,364 (98.1%) | 952 (68.4%) |
| Total | 7,337 (34.8%) | 15,370 (72.9%) |
Disability Status by Sex by Age in Milwaukie
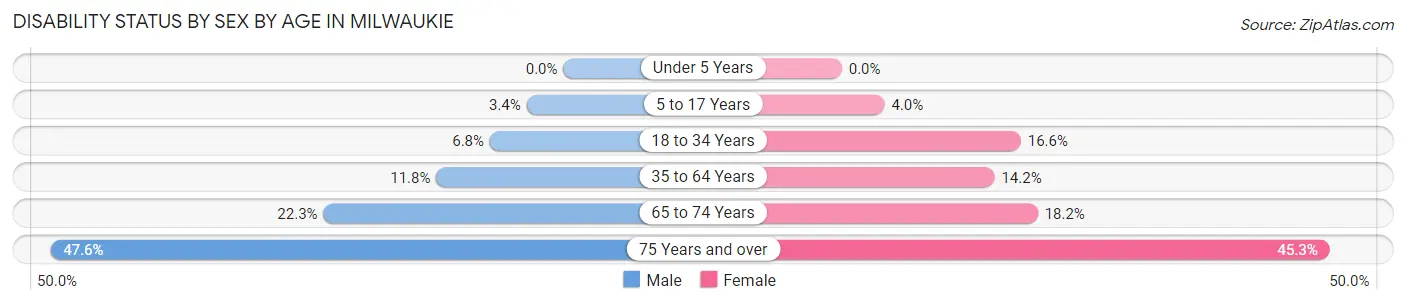
| Age Bracket | Male | Female |
| Under 5 Years | 0 (0.0%) | 0 (0.0%) |
| 5 to 17 Years | 44 (3.4%) | 57 (4.0%) |
| 18 to 34 Years | 150 (6.8%) | 406 (16.6%) |
| 35 to 64 Years | 552 (11.8%) | 640 (14.2%) |
| 65 to 74 Years | 198 (22.3%) | 206 (18.2%) |
| 75 Years and over | 270 (47.6%) | 373 (45.3%) |
Disability Class by Sex by Age in Milwaukie
Disability Class: Hearing Difficulty
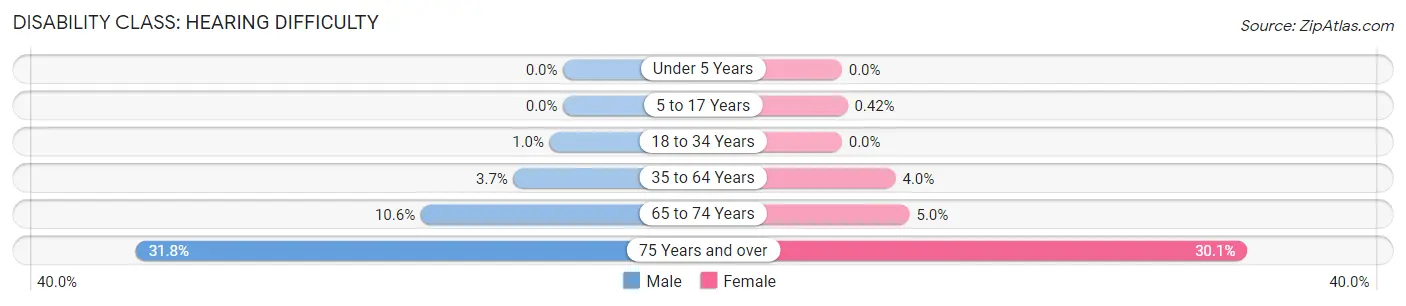
| Age Bracket | Male | Female |
| Under 5 Years | 0 (0.0%) | 0 (0.0%) |
| 5 to 17 Years | 0 (0.0%) | 6 (0.4%) |
| 18 to 34 Years | 22 (1.0%) | 0 (0.0%) |
| 35 to 64 Years | 173 (3.7%) | 180 (4.0%) |
| 65 to 74 Years | 94 (10.6%) | 57 (5.0%) |
| 75 Years and over | 180 (31.8%) | 248 (30.1%) |
Disability Class: Vision Difficulty
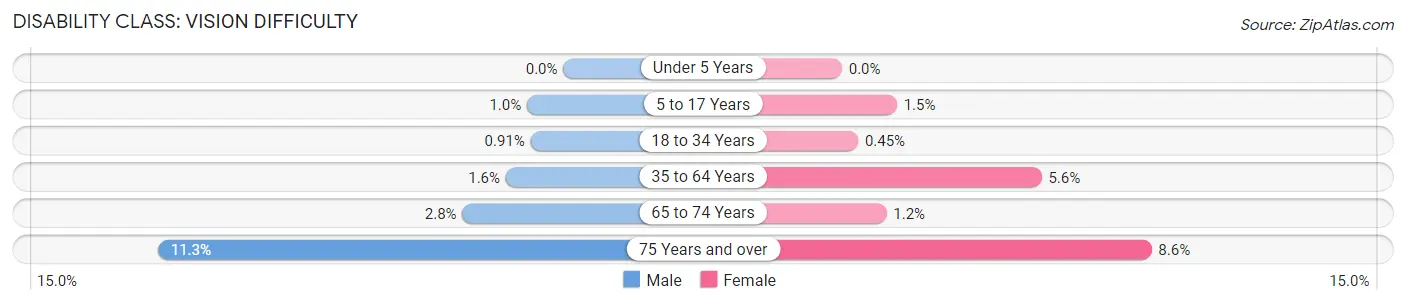
| Age Bracket | Male | Female |
| Under 5 Years | 0 (0.0%) | 0 (0.0%) |
| 5 to 17 Years | 13 (1.0%) | 22 (1.5%) |
| 18 to 34 Years | 20 (0.9%) | 11 (0.4%) |
| 35 to 64 Years | 75 (1.6%) | 251 (5.6%) |
| 65 to 74 Years | 25 (2.8%) | 14 (1.2%) |
| 75 Years and over | 64 (11.3%) | 71 (8.6%) |
Disability Class: Cognitive Difficulty
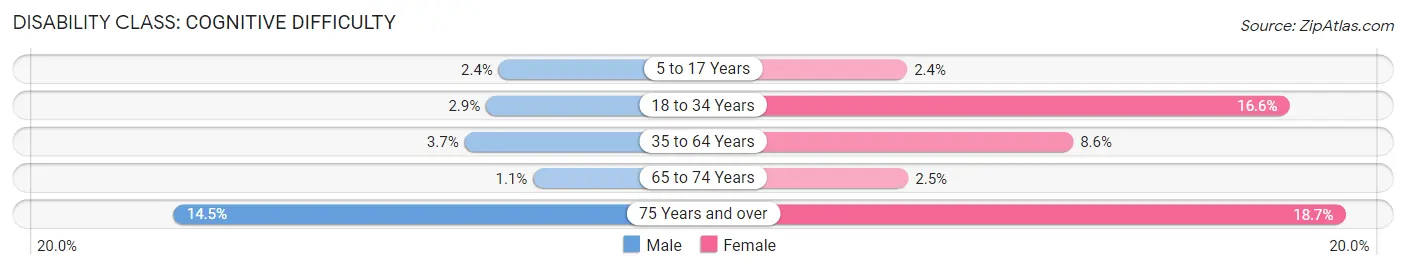
| Age Bracket | Male | Female |
| 5 to 17 Years | 31 (2.4%) | 35 (2.4%) |
| 18 to 34 Years | 63 (2.9%) | 406 (16.6%) |
| 35 to 64 Years | 172 (3.7%) | 388 (8.6%) |
| 65 to 74 Years | 10 (1.1%) | 28 (2.5%) |
| 75 Years and over | 82 (14.5%) | 154 (18.7%) |
Disability Class: Ambulatory Difficulty
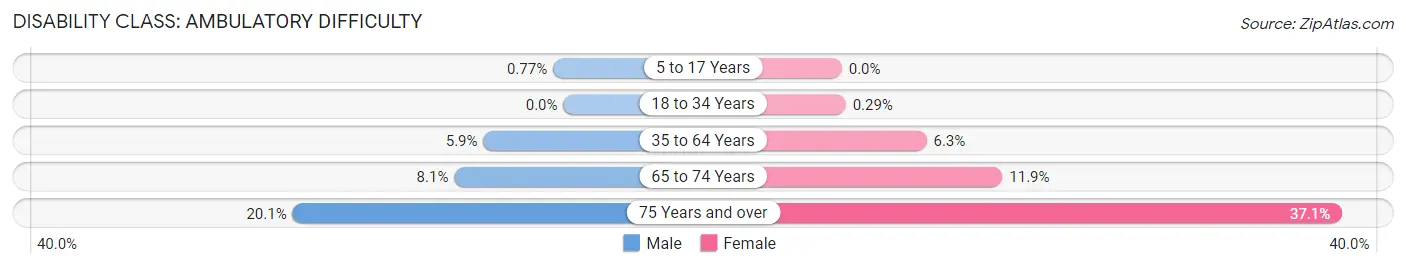
| Age Bracket | Male | Female |
| 5 to 17 Years | 10 (0.8%) | 0 (0.0%) |
| 18 to 34 Years | 0 (0.0%) | 7 (0.3%) |
| 35 to 64 Years | 278 (5.9%) | 284 (6.3%) |
| 65 to 74 Years | 72 (8.1%) | 135 (11.9%) |
| 75 Years and over | 114 (20.1%) | 306 (37.1%) |
Disability Class: Self-Care Difficulty
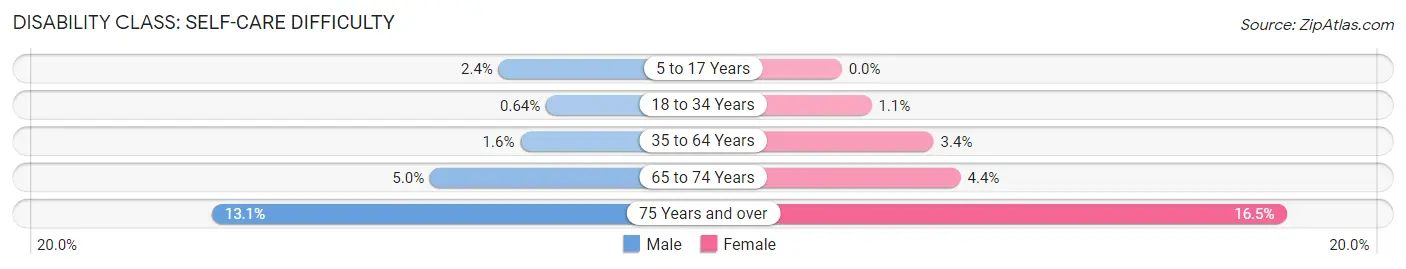
| Age Bracket | Male | Female |
| 5 to 17 Years | 31 (2.4%) | 0 (0.0%) |
| 18 to 34 Years | 14 (0.6%) | 27 (1.1%) |
| 35 to 64 Years | 75 (1.6%) | 154 (3.4%) |
| 65 to 74 Years | 44 (5.0%) | 50 (4.4%) |
| 75 Years and over | 74 (13.1%) | 136 (16.5%) |
Technology Access in Milwaukie
Computing Device Access in Milwaukie
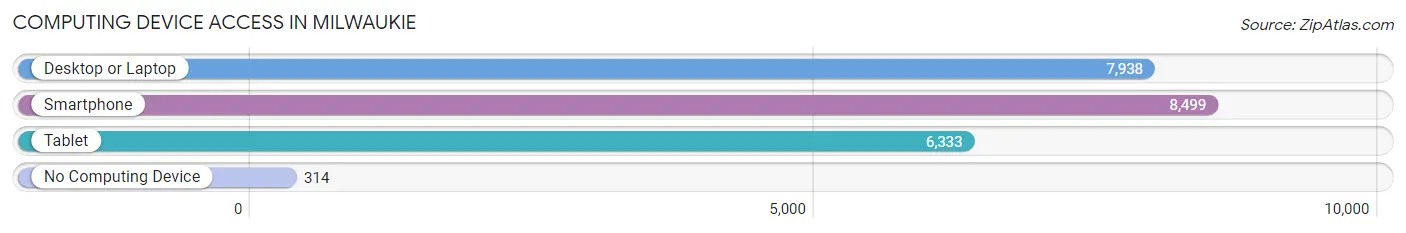
| Device Type | # Households | % Households |
| Desktop or Laptop | 7,938 | 85.5% |
| Smartphone | 8,499 | 91.5% |
| Tablet | 6,333 | 68.2% |
| No Computing Device | 314 | 3.4% |
| Total | 9,286 | 100.0% |
Internet Access in Milwaukie
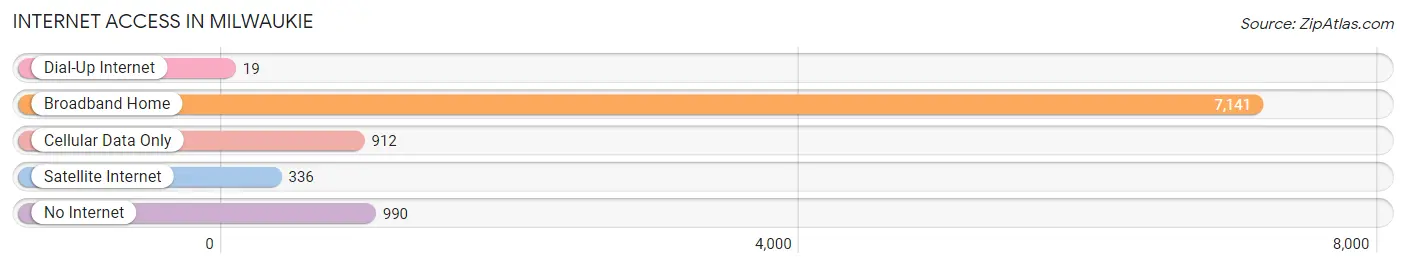
| Internet Type | # Households | % Households |
| Dial-Up Internet | 19 | 0.2% |
| Broadband Home | 7,141 | 76.9% |
| Cellular Data Only | 912 | 9.8% |
| Satellite Internet | 336 | 3.6% |
| No Internet | 990 | 10.7% |
| Total | 9,286 | 100.0% |
Milwaukie Summary
Milwaukie, Oregon is a city located in Clackamas County, Oregon, United States. It is situated on the south bank of the Willamette River, just south of Portland. The city is home to a population of approximately 21,000 people, making it the fifth-largest city in the state.
History
The area that is now Milwaukie was first inhabited by the Clackamas Indians, who lived in the area for thousands of years before the arrival of European settlers. The first European settlers arrived in the area in the early 1800s, and the city was officially incorporated in 1903. The city was named after the Milwaukee Land Company, which had purchased the land in the late 1800s.
The city experienced rapid growth in the early 20th century, due to its proximity to Portland and its access to the Willamette River. The city was home to several industries, including lumber mills, shipbuilding, and canneries. The city also became a popular tourist destination, with several resorts and amusement parks being built in the area.
Geography
Milwaukie is located in Clackamas County, Oregon, on the south bank of the Willamette River. The city is situated just south of Portland, and is bordered by the cities of Oak Grove, Jennings Lodge, and Gladstone. The city covers an area of approximately 8.5 square miles, and has a population density of 2,521 people per square mile.
The city is located in the Willamette Valley, and is surrounded by rolling hills and forests. The city is home to several parks and recreational areas, including Milwaukie Riverfront Park, Milwaukie Riverfront Trail, and Milwaukie Community Park.
Economy
Milwaukie is home to a diverse economy, with a variety of industries represented in the city. The city is home to several large employers, including the Oregon Department of Transportation, Clackamas County, and the City of Milwaukie. The city is also home to several small businesses, including restaurants, retail stores, and professional services.
The city is also home to several manufacturing companies, including Precision Castparts, which produces metal components for the aerospace industry. The city is also home to several technology companies, including Intel, which has a large research and development facility in the city.
Demographics
As of the 2010 census, Milwaukie had a population of 20,914 people. The racial makeup of the city was 79.2% White, 8.2% Hispanic or Latino, 6.2% Asian, 4.2% African American, and 2.2% Native American. The median household income in the city was $50,945, and the median family income was $60,945.
The city is home to a variety of religious denominations, including Christianity, Judaism, Islam, and Buddhism. The city is also home to a variety of cultural and recreational activities, including festivals, concerts, and sporting events.
Conclusion
Milwaukie, Oregon is a city located in Clackamas County, Oregon, United States. It is situated on the south bank of the Willamette River, just south of Portland. The city is home to a population of approximately 21,000 people, making it the fifth-largest city in the state. The city has a diverse economy, with a variety of industries represented in the city. The city is also home to a variety of religious denominations, and a variety of cultural and recreational activities.
Common Questions
What is the Total Population of Milwaukie?
Total Population of Milwaukie is 21,195.
What is the Total Male Population of Milwaukie?
Total Male Population of Milwaukie is 10,230.
What is the Total Female Population of Milwaukie?
Total Female Population of Milwaukie is 10,965.
What is the Ratio of Males per 100 Females in Milwaukie?
There are 93.30 Males per 100 Females in Milwaukie.
What is the Ratio of Females per 100 Males in Milwaukie?
There are 107.18 Females per 100 Males in Milwaukie.
What is the Median Population Age in Milwaukie?
Median Population Age in Milwaukie is 40.2 Years.
What is the Average Family Size in Milwaukie
Average Family Size in Milwaukie is 2.9 People.
What is the Average Household Size in Milwaukie
Average Household Size in Milwaukie is 2.2 People.
What is Per Capita Income in Milwaukie?
Per Capita income in Milwaukie is $44,973.
What is the Median Family Income in Milwaukie?
Median Family Income in Milwaukie is $102,839.
What is the Median Household income in Milwaukie?
Median Household Income in Milwaukie is $78,676.
What is Income or Wage Gap in Milwaukie?
Income or Wage Gap in Milwaukie is 28.1%.
Women in Milwaukie earn 71.9 cents for every dollar earned by a man.
What is Inequality or Gini Index in Milwaukie?
Inequality or Gini Index in Milwaukie is 0.40.
How Large is the Labor Force in Milwaukie?
There are 12,624 People in the Labor Forcein in Milwaukie.
What is the Percentage of People in the Labor Force in Milwaukie?
70.5% of People are in the Labor Force in Milwaukie.
What is the Unemployment Rate in Milwaukie?
Unemployment Rate in Milwaukie is 5.5%.