Warrenton, OR
Warrenton Map
Warrenton Overview
6,254
TOTAL POPULATION
2,938
MALE POPULATION
3,316
FEMALE POPULATION
88.60
MALES / 100 FEMALES
112.87
FEMALES / 100 MALES
37.5
MEDIAN AGE
3.2
AVG FAMILY SIZE
2.6
AVG HOUSEHOLD SIZE
$31,413
PER CAPITA INCOME
$78,714
AVG FAMILY INCOME
$69,400
AVG HOUSEHOLD INCOME
22.8%
WAGE / INCOME GAP [ % ]
77.2¢/ $1
WAGE / INCOME GAP [ $ ]
0.36
INEQUALITY / GINI INDEX
2,880
LABOR FORCE [ PEOPLE ]
58.0%
PERCENT IN LABOR FORCE
4.8%
UNEMPLOYMENT RATE
Warrenton Zip Codes
Warrenton Area Codes
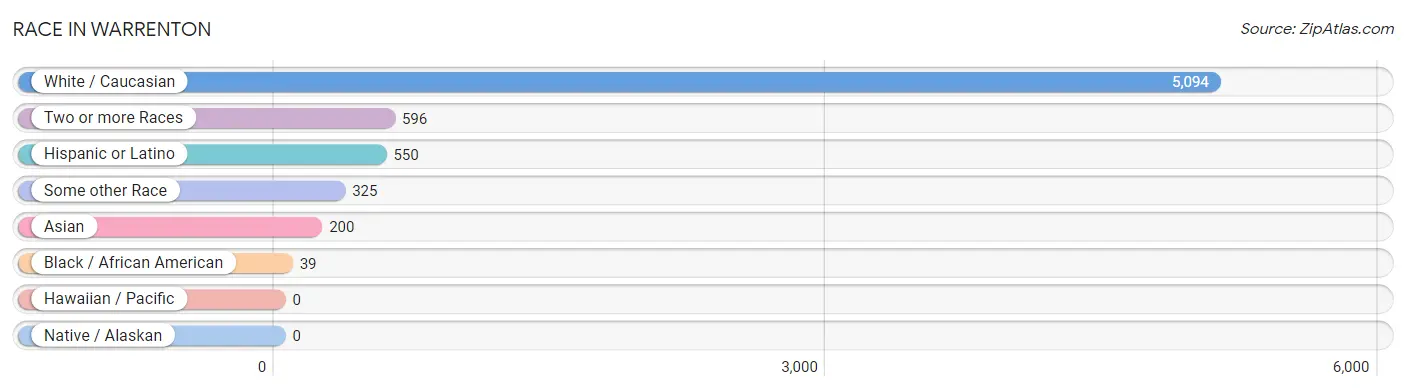
Race in Warrenton
The most populous races in Warrenton are White / Caucasian (5,094 | 81.5%), Two or more Races (596 | 9.5%), and Hispanic or Latino (550 | 8.8%).
| Race | # Population | % Population |
| Asian | 200 | 3.2% |
| Black / African American | 39 | 0.6% |
| Hawaiian / Pacific | 0 | 0.0% |
| Hispanic or Latino | 550 | 8.8% |
| Native / Alaskan | 0 | 0.0% |
| White / Caucasian | 5,094 | 81.5% |
| Two or more Races | 596 | 9.5% |
| Some other Race | 325 | 5.2% |
| Total | 6,254 | 100.0% |
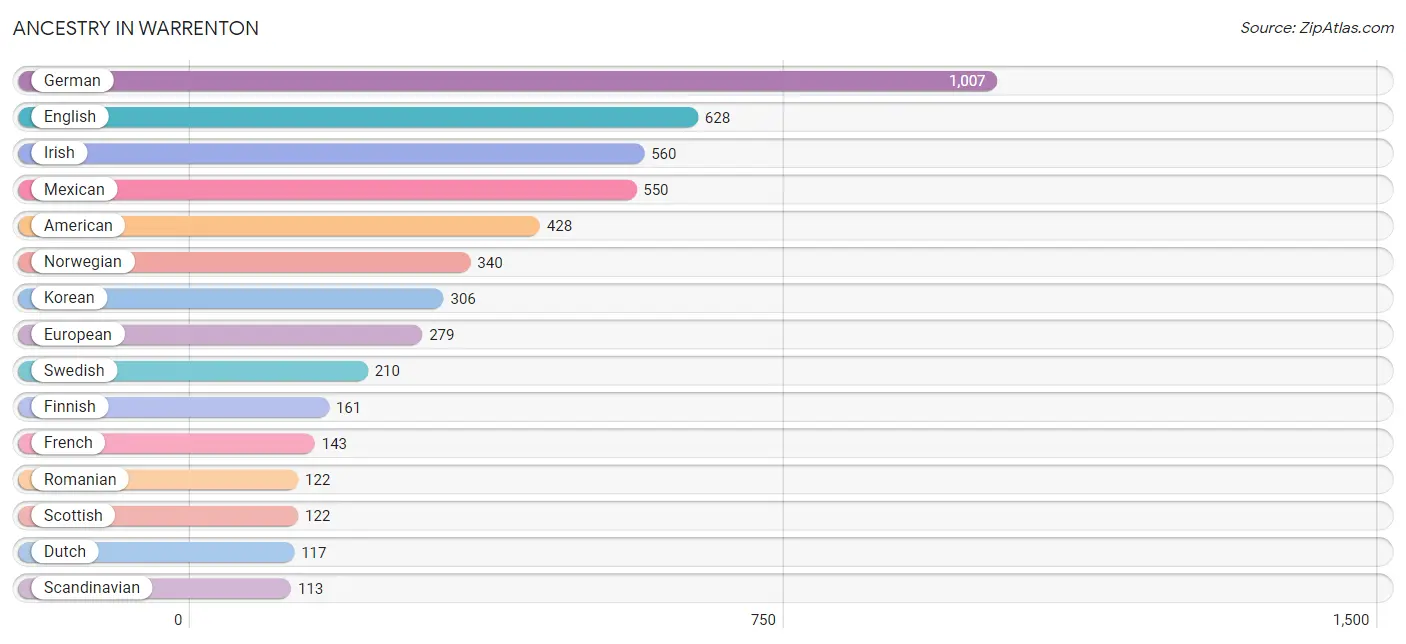
Ancestry in Warrenton
The most populous ancestries reported in Warrenton are German (1,007 | 16.1%), English (628 | 10.0%), Irish (560 | 8.9%), Mexican (550 | 8.8%), and American (428 | 6.8%), together accounting for 50.7% of all Warrenton residents.
| Ancestry | # Population | % Population |
| American | 428 | 6.8% |
| Austrian | 11 | 0.2% |
| Blackfeet | 32 | 0.5% |
| Brazilian | 41 | 0.7% |
| British | 52 | 0.8% |
| Cherokee | 32 | 0.5% |
| Crow | 17 | 0.3% |
| Czechoslovakian | 28 | 0.4% |
| Danish | 87 | 1.4% |
| Dutch | 117 | 1.9% |
| English | 628 | 10.0% |
| European | 279 | 4.5% |
| Finnish | 161 | 2.6% |
| French | 143 | 2.3% |
| German | 1,007 | 16.1% |
| Hungarian | 22 | 0.4% |
| Indian (Asian) | 34 | 0.5% |
| Irish | 560 | 8.9% |
| Italian | 41 | 0.7% |
| Korean | 306 | 4.9% |
| Mexican | 550 | 8.8% |
| Native Hawaiian | 33 | 0.5% |
| Navajo | 2 | 0.0% |
| Northern European | 1 | 0.0% |
| Norwegian | 340 | 5.4% |
| Polish | 70 | 1.1% |
| Romanian | 122 | 1.9% |
| Russian | 35 | 0.6% |
| Scandinavian | 113 | 1.8% |
| Scotch-Irish | 37 | 0.6% |
| Scottish | 122 | 1.9% |
| Slavic | 10 | 0.2% |
| Sri Lankan | 55 | 0.9% |
| Swedish | 210 | 3.4% |
| Swiss | 11 | 0.2% |
| Welsh | 45 | 0.7% | View All 36 Rows |
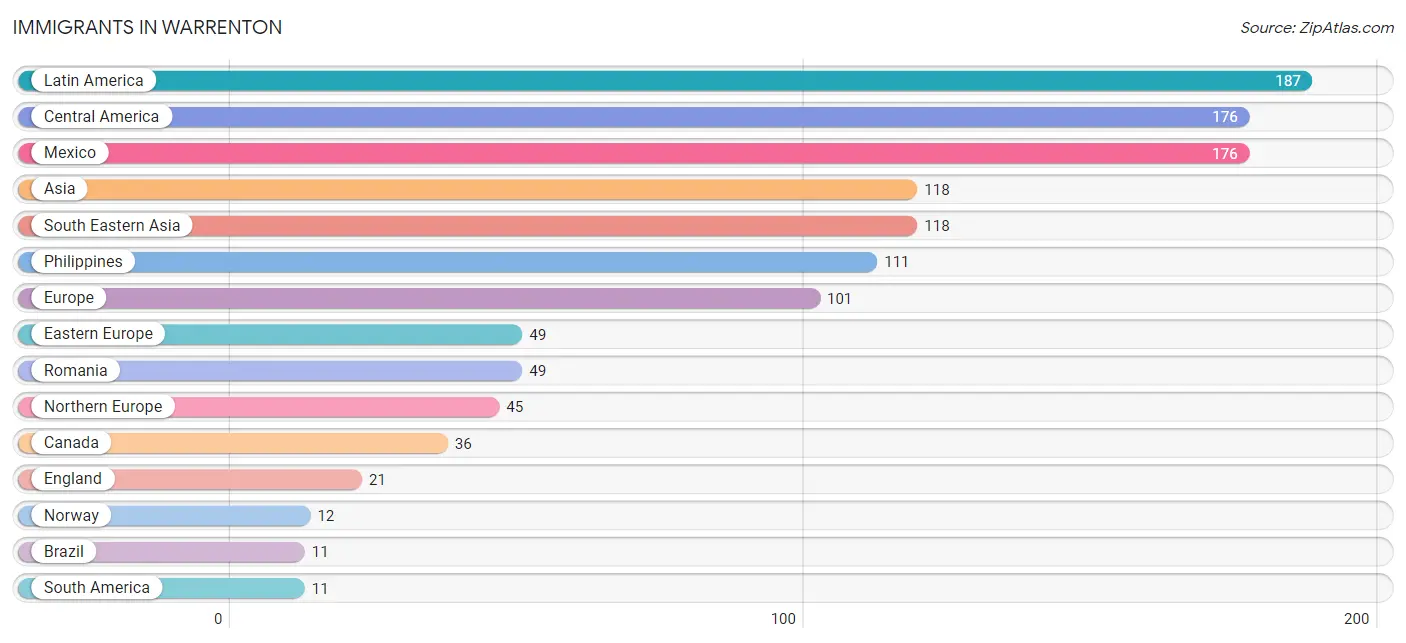
Immigrants in Warrenton
The most numerous immigrant groups reported in Warrenton came from Latin America (187 | 3.0%), Central America (176 | 2.8%), Mexico (176 | 2.8%), Asia (118 | 1.9%), and South Eastern Asia (118 | 1.9%), together accounting for 12.4% of all Warrenton residents.
| Immigration Origin | # Population | % Population |
| Asia | 118 | 1.9% |
| Brazil | 11 | 0.2% |
| Canada | 36 | 0.6% |
| Central America | 176 | 2.8% |
| Eastern Europe | 49 | 0.8% |
| England | 21 | 0.3% |
| Europe | 101 | 1.6% |
| Latin America | 187 | 3.0% |
| Mexico | 176 | 2.8% |
| Netherlands | 7 | 0.1% |
| Northern Europe | 45 | 0.7% |
| Norway | 12 | 0.2% |
| Philippines | 111 | 1.8% |
| Romania | 49 | 0.8% |
| South America | 11 | 0.2% |
| South Eastern Asia | 118 | 1.9% |
| Vietnam | 7 | 0.1% |
| Western Europe | 7 | 0.1% | View All 18 Rows |
Sex and Age in Warrenton
Sex and Age in Warrenton
The most populous age groups in Warrenton are 30 to 34 Years (374 | 12.7%) for men and 10 to 14 Years (382 | 11.5%) for women.
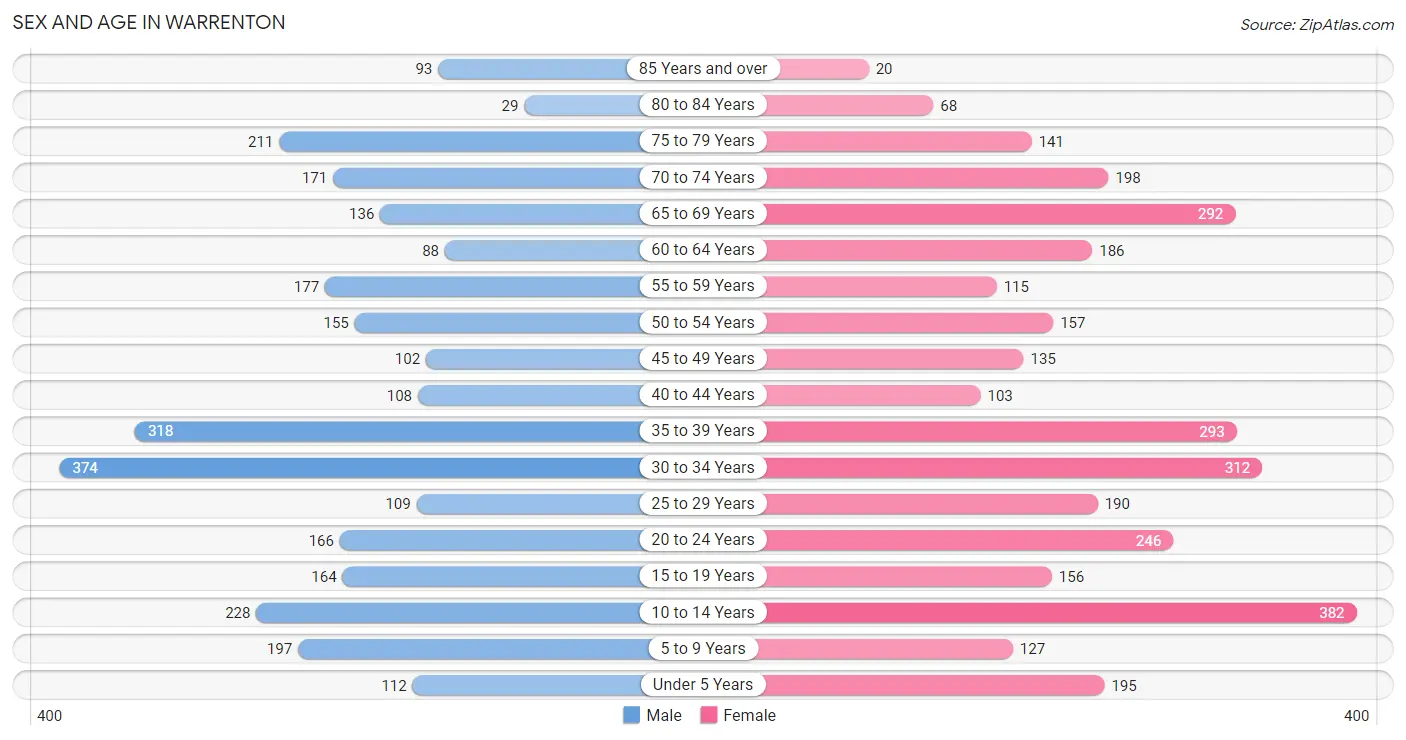
| Age Bracket | Male | Female |
| Under 5 Years | 112 (3.8%) | 195 (5.9%) |
| 5 to 9 Years | 197 (6.7%) | 127 (3.8%) |
| 10 to 14 Years | 228 (7.8%) | 382 (11.5%) |
| 15 to 19 Years | 164 (5.6%) | 156 (4.7%) |
| 20 to 24 Years | 166 (5.7%) | 246 (7.4%) |
| 25 to 29 Years | 109 (3.7%) | 190 (5.7%) |
| 30 to 34 Years | 374 (12.7%) | 312 (9.4%) |
| 35 to 39 Years | 318 (10.8%) | 293 (8.8%) |
| 40 to 44 Years | 108 (3.7%) | 103 (3.1%) |
| 45 to 49 Years | 102 (3.5%) | 135 (4.1%) |
| 50 to 54 Years | 155 (5.3%) | 157 (4.7%) |
| 55 to 59 Years | 177 (6.0%) | 115 (3.5%) |
| 60 to 64 Years | 88 (3.0%) | 186 (5.6%) |
| 65 to 69 Years | 136 (4.6%) | 292 (8.8%) |
| 70 to 74 Years | 171 (5.8%) | 198 (6.0%) |
| 75 to 79 Years | 211 (7.2%) | 141 (4.3%) |
| 80 to 84 Years | 29 (1.0%) | 68 (2.1%) |
| 85 Years and over | 93 (3.2%) | 20 (0.6%) |
| Total | 2,938 (100.0%) | 3,316 (100.0%) |
Families and Households in Warrenton
Median Family Size in Warrenton
The median family size in Warrenton is 3.25 persons per family, with single female/mother families (215 | 13.8%) accounting for the largest median family size of 3.42 persons per family. On the other hand, single male/father families (232 | 14.8%) represent the smallest median family size with 3.03 persons per family.
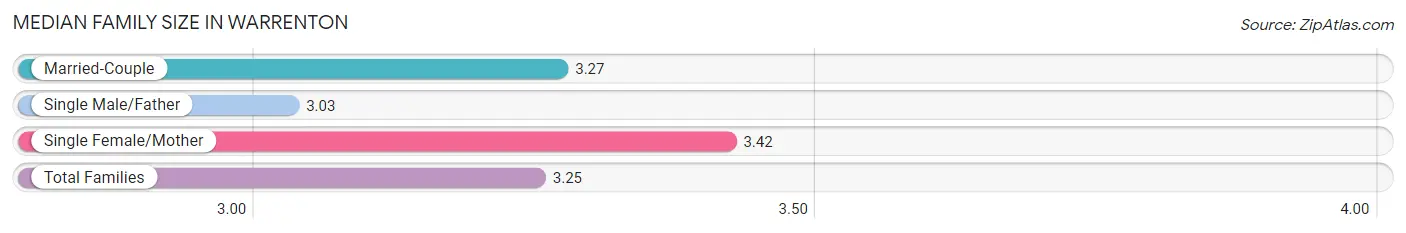
| Family Type | # Families | Family Size |
| Married-Couple | 1,117 (71.4%) | 3.27 |
| Single Male/Father | 232 (14.8%) | 3.03 |
| Single Female/Mother | 215 (13.8%) | 3.42 |
| Total Families | 1,564 (100.0%) | 3.25 |
Median Household Size in Warrenton
The median household size in Warrenton is 2.60 persons per household, with single female/mother households (215 | 9.1%) accounting for the largest median household size of 3.9 persons per household. non-family households (804 | 34.0%) represent the smallest median household size with 1.11 persons per household.
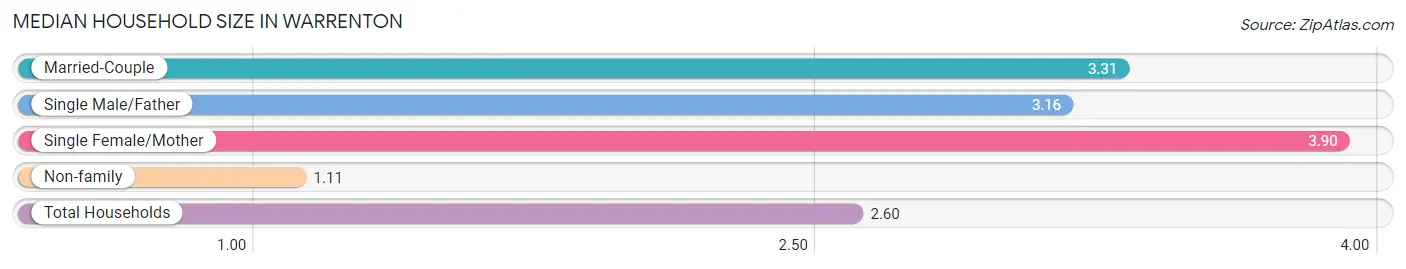
| Household Type | # Households | Household Size |
| Married-Couple | 1,117 (47.2%) | 3.31 |
| Single Male/Father | 232 (9.8%) | 3.16 |
| Single Female/Mother | 215 (9.1%) | 3.90 |
| Non-family | 804 (34.0%) | 1.11 |
| Total Households | 2,368 (100.0%) | 2.60 |
Household Size by Marriage Status in Warrenton
Out of a total of 2,368 households in Warrenton, 1,564 (66.0%) are family households, while 804 (34.0%) are nonfamily households. The most numerous type of family households are 2-person households, comprising 748, and the most common type of nonfamily households are 1-person households, comprising 714.
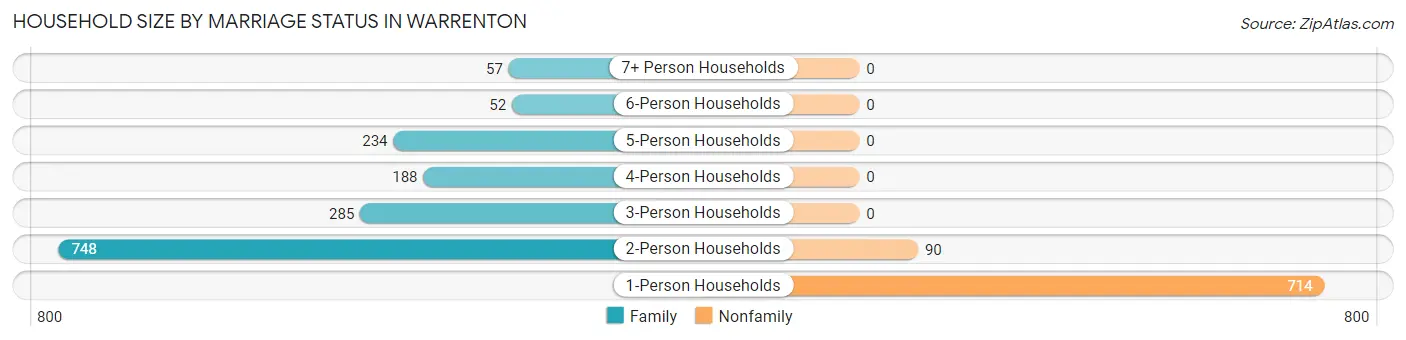
| Household Size | Family Households | Nonfamily Households |
| 1-Person Households | - | 714 (30.1%) |
| 2-Person Households | 748 (31.6%) | 90 (3.8%) |
| 3-Person Households | 285 (12.0%) | 0 (0.0%) |
| 4-Person Households | 188 (7.9%) | 0 (0.0%) |
| 5-Person Households | 234 (9.9%) | 0 (0.0%) |
| 6-Person Households | 52 (2.2%) | 0 (0.0%) |
| 7+ Person Households | 57 (2.4%) | 0 (0.0%) |
| Total | 1,564 (66.0%) | 804 (34.0%) |
Female Fertility in Warrenton
Fertility by Age in Warrenton
Average fertility rate in Warrenton is 163.0 births per 1,000 women. Women in the age bracket of 35 to 50 years have the highest fertility rate with 263.0 births per 1,000 women. Women in the age bracket of 35 to 50 years acount for 65.2% of all women with births.
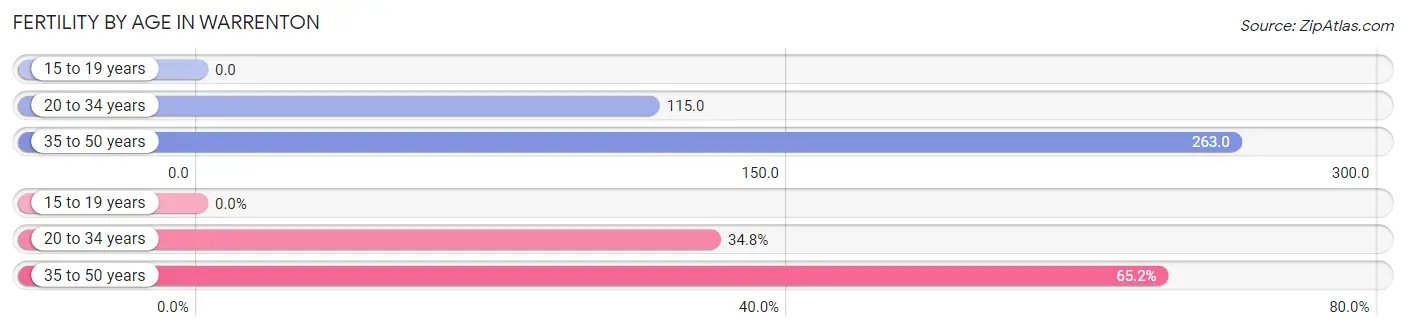
| Age Bracket | Women with Births | Births / 1,000 Women |
| 15 to 19 years | 0 (0.0%) | 0.0 |
| 20 to 34 years | 86 (34.8%) | 115.0 |
| 35 to 50 years | 161 (65.2%) | 263.0 |
| Total | 247 (100.0%) | 163.0 |
Fertility by Age by Marriage Status in Warrenton
81.0% of women with births (247) in Warrenton are married. The highest percentage of unmarried women with births falls into 20 to 34 years age bracket with 54.6% of them unmarried at the time of birth, while the lowest percentage of unmarried women with births belong to 35 to 50 years age bracket with 0.0% of them unmarried.
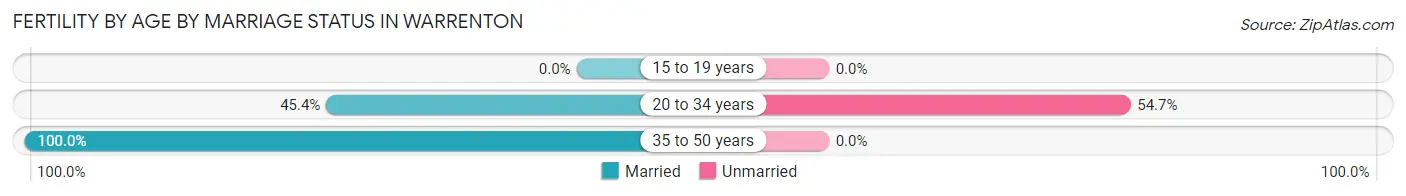
| Age Bracket | Married | Unmarried |
| 15 to 19 years | 0 (0.0%) | 0 (0.0%) |
| 20 to 34 years | 39 (45.4%) | 47 (54.6%) |
| 35 to 50 years | 161 (100.0%) | 0 (0.0%) |
| Total | 200 (81.0%) | 47 (19.0%) |
Fertility by Education in Warrenton
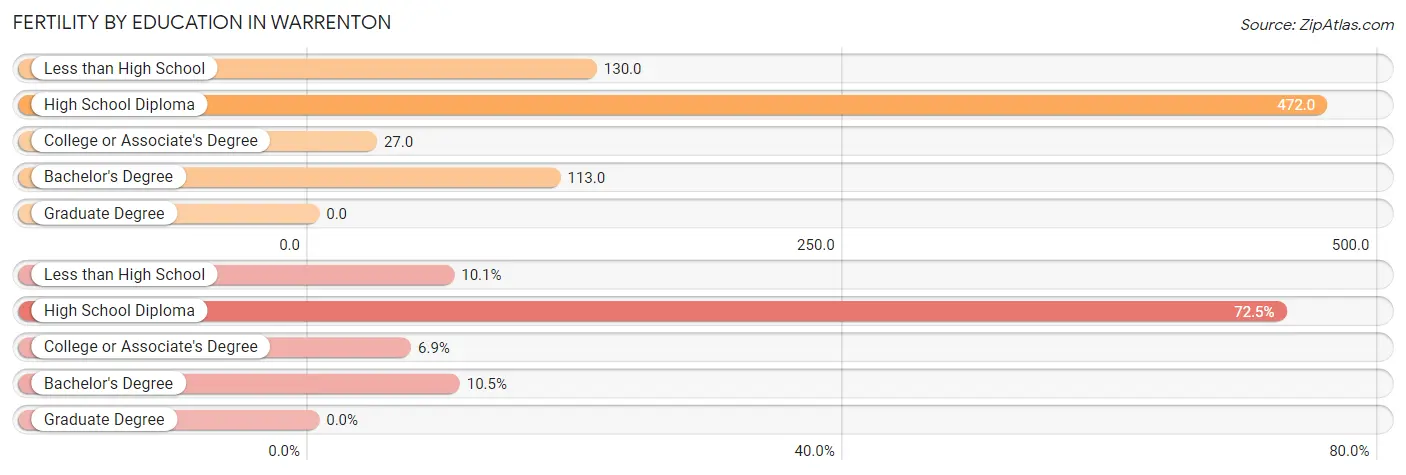
| Educational Attainment | Women with Births | Births / 1,000 Women |
| Less than High School | 25 (10.1%) | 130.0 |
| High School Diploma | 179 (72.5%) | 472.0 |
| College or Associate's Degree | 17 (6.9%) | 27.0 |
| Bachelor's Degree | 26 (10.5%) | 113.0 |
| Graduate Degree | 0 (0.0%) | 0.0 |
| Total | 247 (100.0%) | 163.0 |
Fertility by Education by Marriage Status in Warrenton
19.0% of women with births in Warrenton are unmarried. Women with the educational attainment of college or associate's degree are most likely to be married with 100.0% of them married at childbirth, while women with the educational attainment of less than high school are least likely to be married with 100.0% of them unmarried at childbirth.
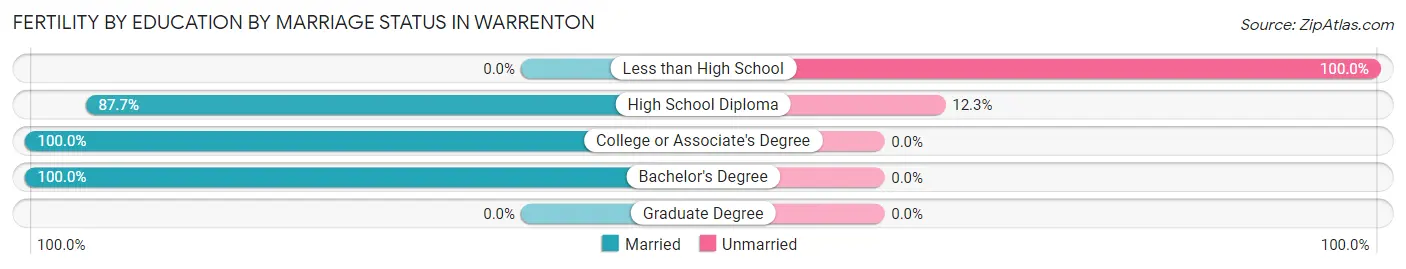
| Educational Attainment | Married | Unmarried |
| Less than High School | 0 (0.0%) | 25 (100.0%) |
| High School Diploma | 157 (87.7%) | 22 (12.3%) |
| College or Associate's Degree | 17 (100.0%) | 0 (0.0%) |
| Bachelor's Degree | 26 (100.0%) | 0 (0.0%) |
| Graduate Degree | 0 (0.0%) | 0 (0.0%) |
| Total | 200 (81.0%) | 47 (19.0%) |
Income in Warrenton
Income Overview in Warrenton
Per Capita Income in Warrenton is $31,413, while median incomes of families and households are $78,714 and $69,400 respectively.
| Characteristic | Number | Measure |
| Per Capita Income | 6,254 | $31,413 |
| Median Family Income | 1,564 | $78,714 |
| Mean Family Income | 1,564 | $87,974 |
| Median Household Income | 2,368 | $69,400 |
| Mean Household Income | 2,368 | $81,607 |
| Income Deficit | 1,564 | $0 |
| Wage / Income Gap (%) | 6,254 | 22.83% |
| Wage / Income Gap ($) | 6,254 | 77.17¢ per $1 |
| Gini / Inequality Index | 6,254 | 0.36 |
Earnings by Sex in Warrenton
Average Earnings in Warrenton are $41,132, $46,933 for men and $36,218 for women, a difference of 22.8%.
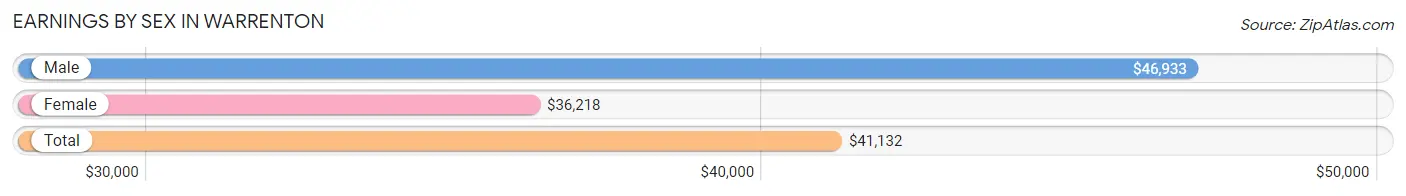
| Sex | Number | Average Earnings |
| Male | 1,547 (54.0%) | $46,933 |
| Female | 1,319 (46.0%) | $36,218 |
| Total | 2,866 (100.0%) | $41,132 |
Earnings by Sex by Income Bracket in Warrenton
The most common earnings brackets in Warrenton are $100,000+ for men (275 | 17.8%) and $25,000 to $29,999 for women (174 | 13.2%).
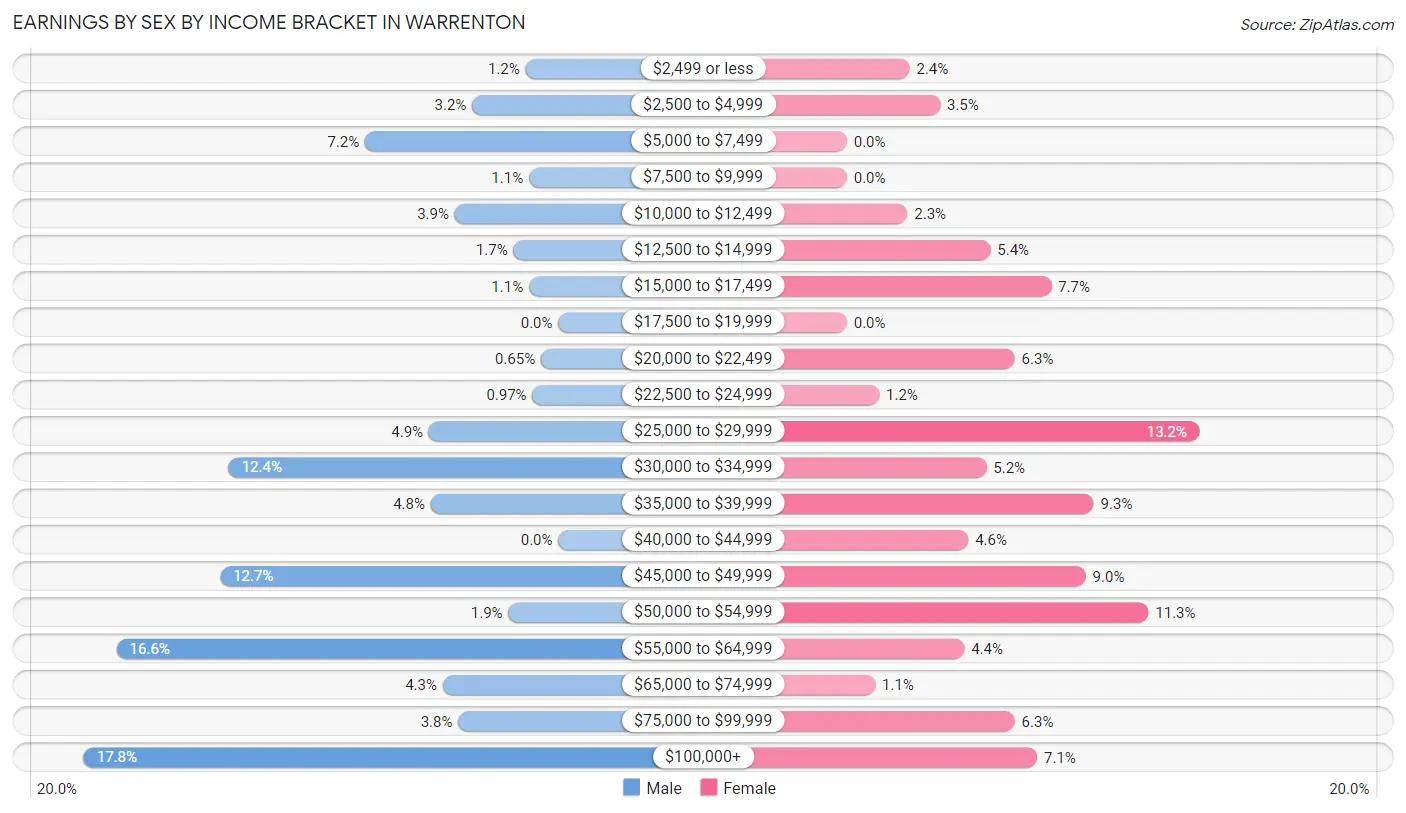
| Income | Male | Female |
| $2,499 or less | 19 (1.2%) | 31 (2.4%) |
| $2,500 to $4,999 | 50 (3.2%) | 46 (3.5%) |
| $5,000 to $7,499 | 112 (7.2%) | 0 (0.0%) |
| $7,500 to $9,999 | 17 (1.1%) | 0 (0.0%) |
| $10,000 to $12,499 | 60 (3.9%) | 30 (2.3%) |
| $12,500 to $14,999 | 26 (1.7%) | 71 (5.4%) |
| $15,000 to $17,499 | 17 (1.1%) | 101 (7.7%) |
| $17,500 to $19,999 | 0 (0.0%) | 0 (0.0%) |
| $20,000 to $22,499 | 10 (0.6%) | 83 (6.3%) |
| $22,500 to $24,999 | 15 (1.0%) | 16 (1.2%) |
| $25,000 to $29,999 | 75 (4.9%) | 174 (13.2%) |
| $30,000 to $34,999 | 191 (12.3%) | 69 (5.2%) |
| $35,000 to $39,999 | 74 (4.8%) | 122 (9.2%) |
| $40,000 to $44,999 | 0 (0.0%) | 60 (4.5%) |
| $45,000 to $49,999 | 196 (12.7%) | 118 (8.9%) |
| $50,000 to $54,999 | 29 (1.9%) | 149 (11.3%) |
| $55,000 to $64,999 | 256 (16.6%) | 58 (4.4%) |
| $65,000 to $74,999 | 67 (4.3%) | 14 (1.1%) |
| $75,000 to $99,999 | 58 (3.7%) | 83 (6.3%) |
| $100,000+ | 275 (17.8%) | 94 (7.1%) |
| Total | 1,547 (100.0%) | 1,319 (100.0%) |
Earnings by Sex by Educational Attainment in Warrenton
Average earnings in Warrenton are $51,364 for men and $38,140 for women, a difference of 25.8%. Men with an educational attainment of graduate degree enjoy the highest average annual earnings of $92,500, while those with bachelor's degree education earn the least with $34,967. Women with an educational attainment of bachelor's degree earn the most with the average annual earnings of $54,504, while those with college or associate's degree education have the smallest earnings of $33,508.
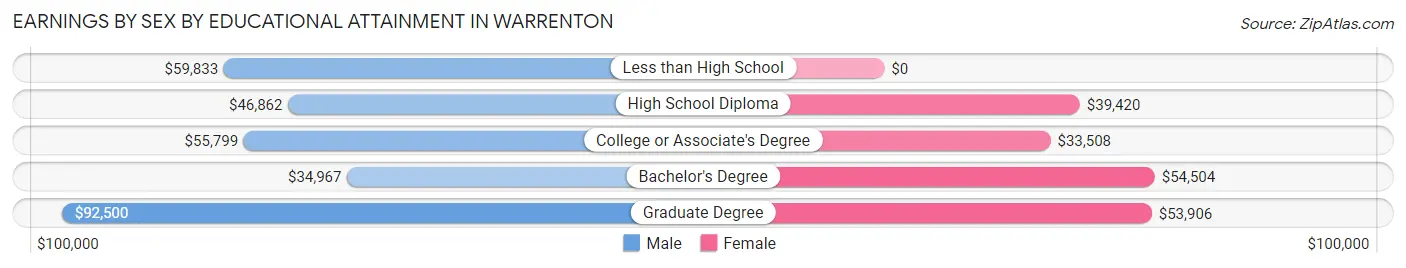
| Educational Attainment | Male Income | Female Income |
| Less than High School | $59,833 | $0 |
| High School Diploma | $46,862 | $39,420 |
| College or Associate's Degree | $55,799 | $33,508 |
| Bachelor's Degree | $34,967 | $54,504 |
| Graduate Degree | $92,500 | $53,906 |
| Total | $51,364 | $38,140 |
Family Income in Warrenton
Family Income Brackets in Warrenton
According to the Warrenton family income data, there are 372 families falling into the $100,000 to $149,999 income range, which is the most common income bracket and makes up 23.8% of all families.
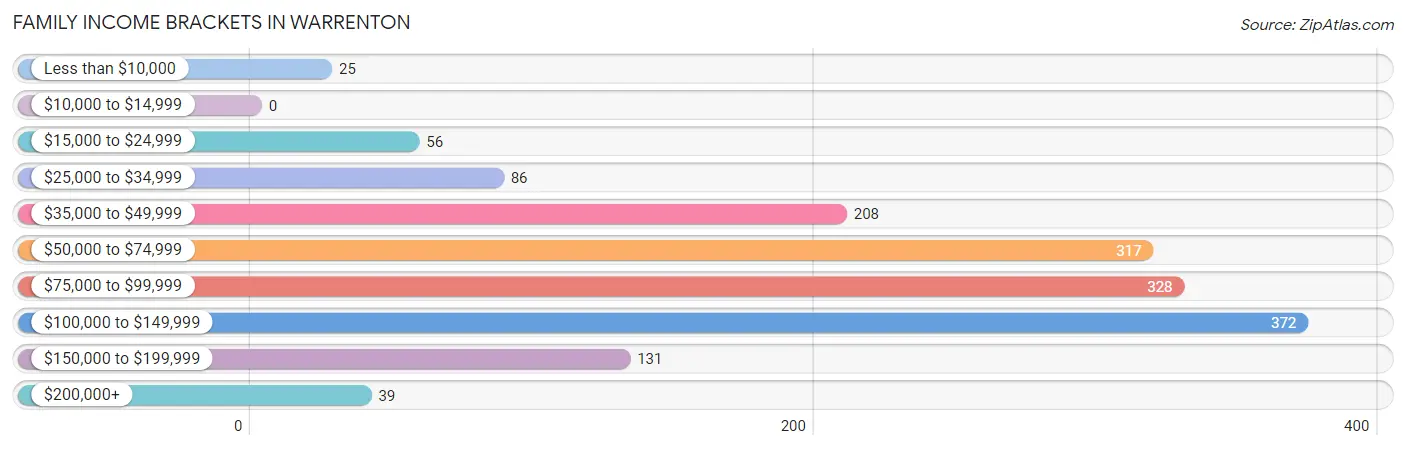
| Income Bracket | # Families | % Families |
| Less than $10,000 | 25 | 1.6% |
| $10,000 to $14,999 | 0 | 0.0% |
| $15,000 to $24,999 | 56 | 3.6% |
| $25,000 to $34,999 | 86 | 5.5% |
| $35,000 to $49,999 | 208 | 13.3% |
| $50,000 to $74,999 | 317 | 20.3% |
| $75,000 to $99,999 | 328 | 21.0% |
| $100,000 to $149,999 | 372 | 23.8% |
| $150,000 to $199,999 | 131 | 8.4% |
| $200,000+ | 39 | 2.5% |
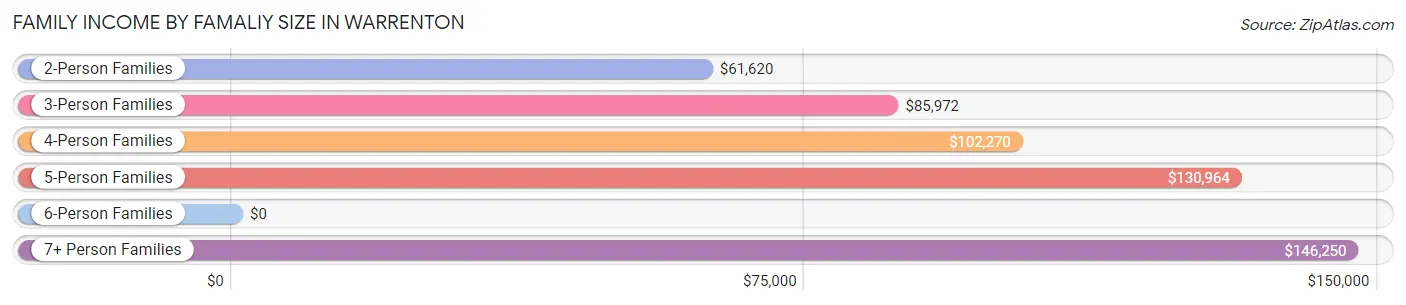
Family Income by Famaliy Size in Warrenton
7+ person families (57 | 3.6%) account for the highest median family income in Warrenton with $146,250 per family, while 2-person families (823 | 52.6%) have the highest median income of $30,810 per family member.
| Income Bracket | # Families | Median Income |
| 2-Person Families | 823 (52.6%) | $61,620 |
| 3-Person Families | 254 (16.2%) | $85,972 |
| 4-Person Families | 179 (11.5%) | $102,270 |
| 5-Person Families | 207 (13.2%) | $130,964 |
| 6-Person Families | 44 (2.8%) | $0 |
| 7+ Person Families | 57 (3.6%) | $146,250 |
| Total | 1,564 (100.0%) | $78,714 |
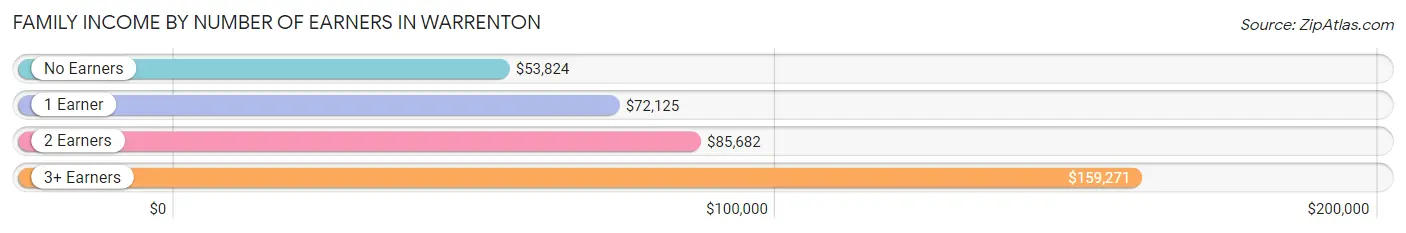
Family Income by Number of Earners in Warrenton
The median family income in Warrenton is $78,714, with families comprising 3+ earners (115) having the highest median family income of $159,271, while families with no earners (416) have the lowest median family income of $53,824, accounting for 7.3% and 26.6% of families, respectively.
| Number of Earners | # Families | Median Income |
| No Earners | 416 (26.6%) | $53,824 |
| 1 Earner | 511 (32.7%) | $72,125 |
| 2 Earners | 522 (33.4%) | $85,682 |
| 3+ Earners | 115 (7.3%) | $159,271 |
| Total | 1,564 (100.0%) | $78,714 |
Household Income in Warrenton
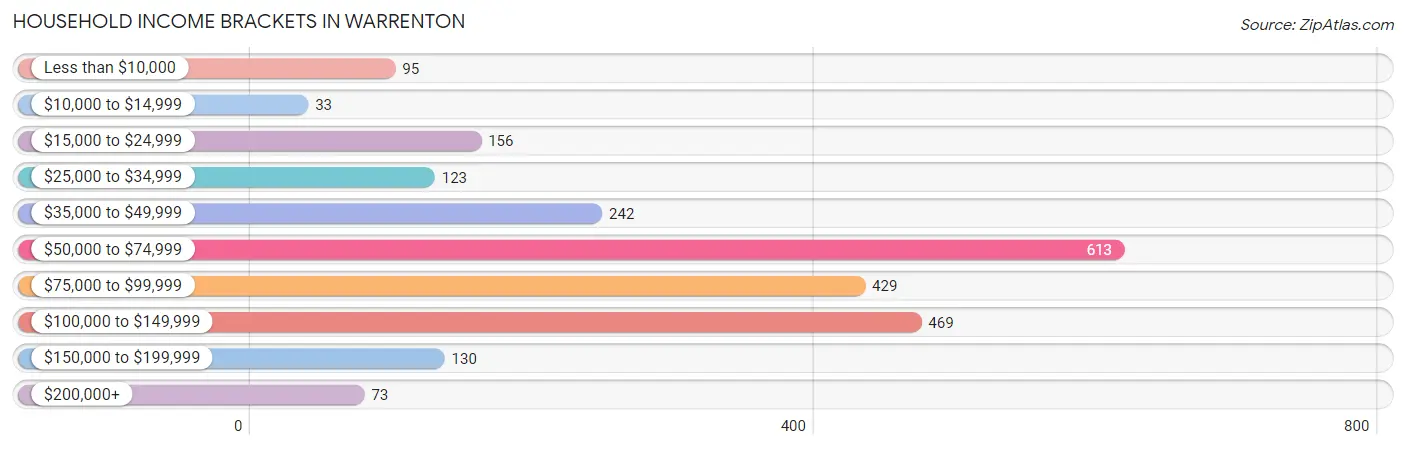
Household Income Brackets in Warrenton
With 613 households falling in the category, the $50,000 to $74,999 income range is the most frequent in Warrenton, accounting for 25.9% of all households. In contrast, only 33 households (1.4%) fall into the $10,000 to $14,999 income bracket, making it the least populous group.
| Income Bracket | # Households | % Households |
| Less than $10,000 | 95 | 4.0% |
| $10,000 to $14,999 | 33 | 1.4% |
| $15,000 to $24,999 | 156 | 6.6% |
| $25,000 to $34,999 | 123 | 5.2% |
| $35,000 to $49,999 | 242 | 10.2% |
| $50,000 to $74,999 | 613 | 25.9% |
| $75,000 to $99,999 | 429 | 18.1% |
| $100,000 to $149,999 | 469 | 19.8% |
| $150,000 to $199,999 | 130 | 5.5% |
| $200,000+ | 73 | 3.1% |
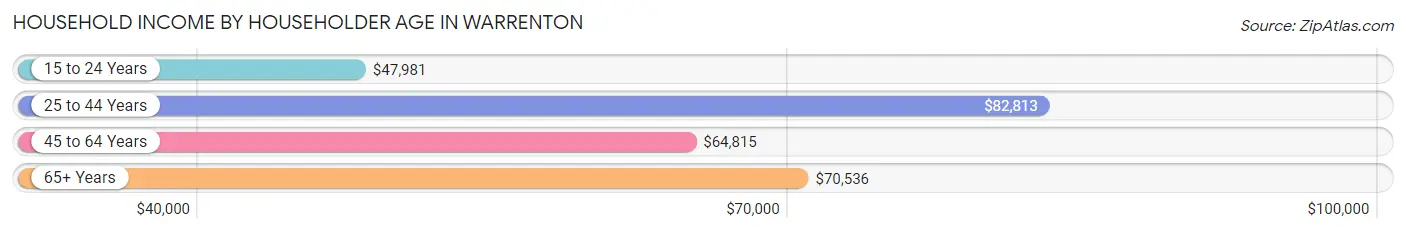
Household Income by Householder Age in Warrenton
The median household income in Warrenton is $69,400, with the highest median household income of $82,813 found in the 25 to 44 years age bracket for the primary householder. A total of 824 households (34.8%) fall into this category. Meanwhile, the 15 to 24 years age bracket for the primary householder has the lowest median household income of $47,981, with 51 households (2.1%) in this group.
| Income Bracket | # Households | Median Income |
| 15 to 24 Years | 51 (2.1%) | $47,981 |
| 25 to 44 Years | 824 (34.8%) | $82,813 |
| 45 to 64 Years | 754 (31.8%) | $64,815 |
| 65+ Years | 739 (31.2%) | $70,536 |
| Total | 2,368 (100.0%) | $69,400 |
Poverty in Warrenton
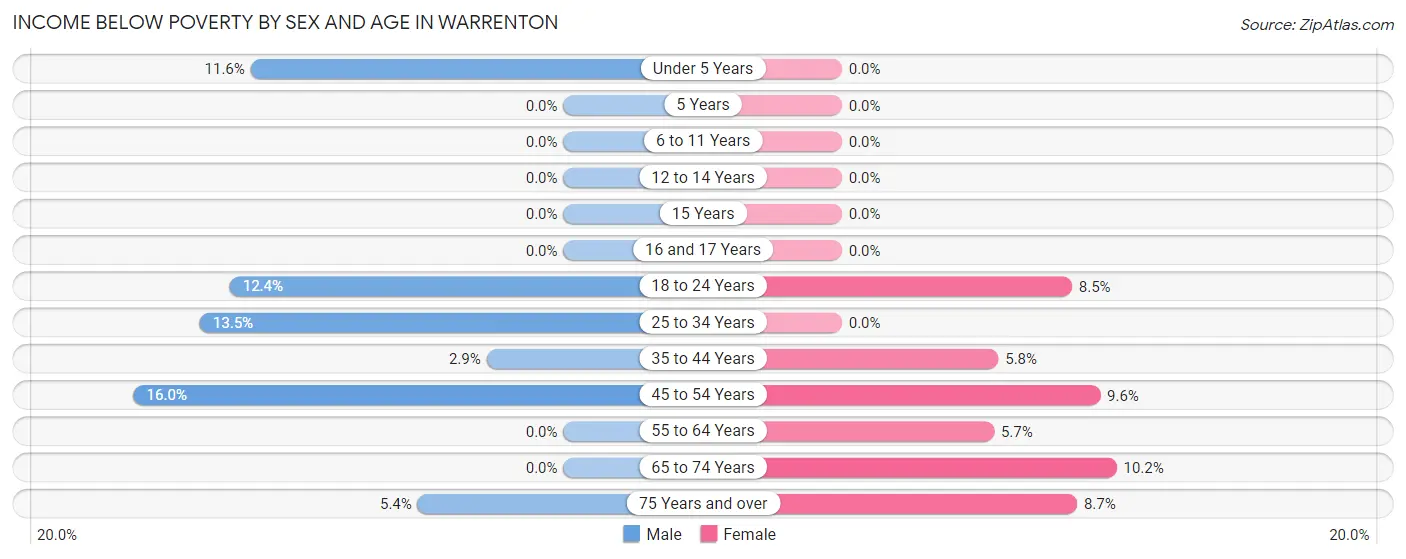
Income Below Poverty by Sex and Age in Warrenton
With 6.0% poverty level for males and 4.9% for females among the residents of Warrenton, 45 to 54 year old males and 65 to 74 year old females are the most vulnerable to poverty, with 41 males (16.0%) and 50 females (10.2%) in their respective age groups living below the poverty level.
| Age Bracket | Male | Female |
| Under 5 Years | 13 (11.6%) | 0 (0.0%) |
| 5 Years | 0 (0.0%) | 0 (0.0%) |
| 6 to 11 Years | 0 (0.0%) | 0 (0.0%) |
| 12 to 14 Years | 0 (0.0%) | 0 (0.0%) |
| 15 Years | 0 (0.0%) | 0 (0.0%) |
| 16 and 17 Years | 0 (0.0%) | 0 (0.0%) |
| 18 to 24 Years | 25 (12.4%) | 24 (8.5%) |
| 25 to 34 Years | 65 (13.5%) | 0 (0.0%) |
| 35 to 44 Years | 12 (2.9%) | 23 (5.8%) |
| 45 to 54 Years | 41 (16.0%) | 28 (9.6%) |
| 55 to 64 Years | 0 (0.0%) | 17 (5.7%) |
| 65 to 74 Years | 0 (0.0%) | 50 (10.2%) |
| 75 Years and over | 18 (5.4%) | 20 (8.7%) |
| Total | 174 (6.0%) | 162 (4.9%) |
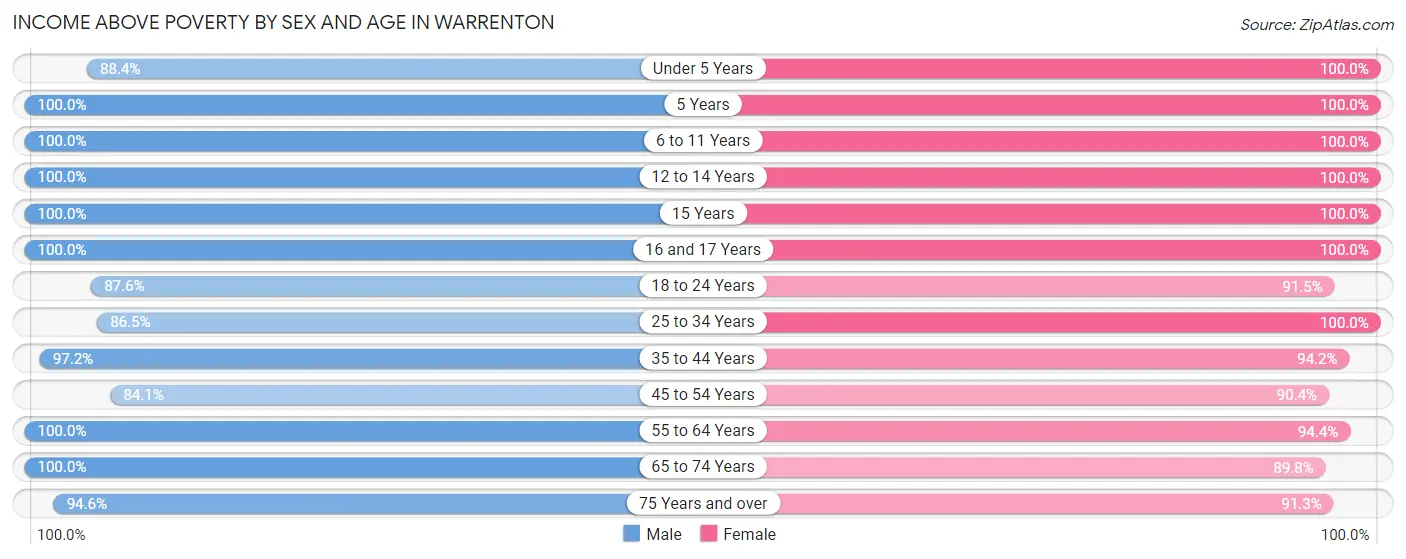
Income Above Poverty by Sex and Age in Warrenton
According to the poverty statistics in Warrenton, males aged 5 years and females aged under 5 years are the age groups that are most secure financially, with 100.0% of males and 100.0% of females in these age groups living above the poverty line.
| Age Bracket | Male | Female |
| Under 5 Years | 99 (88.4%) | 195 (100.0%) |
| 5 Years | 38 (100.0%) | 21 (100.0%) |
| 6 to 11 Years | 274 (100.0%) | 260 (100.0%) |
| 12 to 14 Years | 101 (100.0%) | 228 (100.0%) |
| 15 Years | 23 (100.0%) | 24 (100.0%) |
| 16 and 17 Years | 62 (100.0%) | 97 (100.0%) |
| 18 to 24 Years | 177 (87.6%) | 257 (91.5%) |
| 25 to 34 Years | 417 (86.5%) | 502 (100.0%) |
| 35 to 44 Years | 409 (97.2%) | 373 (94.2%) |
| 45 to 54 Years | 216 (84.1%) | 264 (90.4%) |
| 55 to 64 Years | 265 (100.0%) | 284 (94.4%) |
| 65 to 74 Years | 307 (100.0%) | 440 (89.8%) |
| 75 Years and over | 315 (94.6%) | 209 (91.3%) |
| Total | 2,703 (94.0%) | 3,154 (95.1%) |
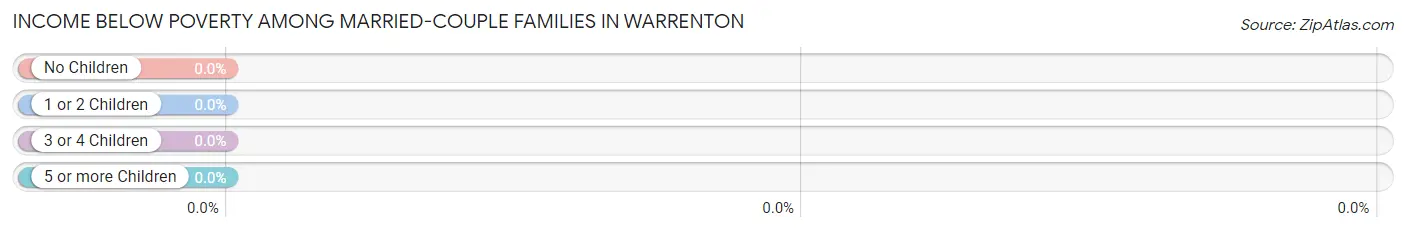
Income Below Poverty Among Married-Couple Families in Warrenton
| Children | Above Poverty | Below Poverty |
| No Children | 622 (100.0%) | 0 (0.0%) |
| 1 or 2 Children | 303 (100.0%) | 0 (0.0%) |
| 3 or 4 Children | 192 (100.0%) | 0 (0.0%) |
| 5 or more Children | 0 (0.0%) | 0 (0.0%) |
| Total | 1,117 (100.0%) | 0 (0.0%) |
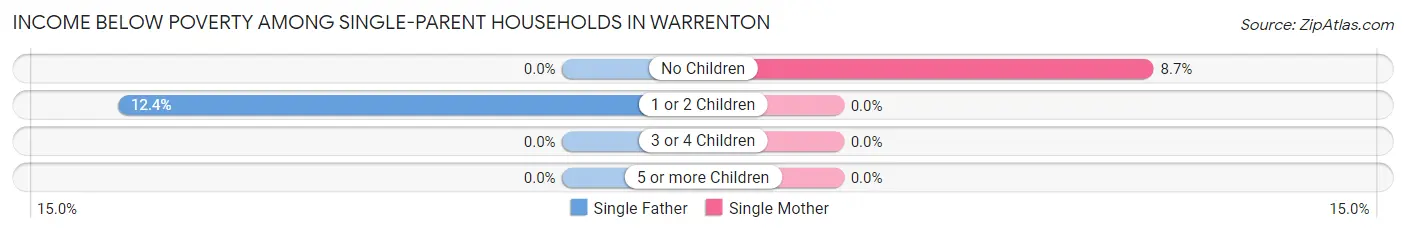
Income Below Poverty Among Single-Parent Households in Warrenton
According to the poverty data in Warrenton, 6.0% or 14 single-father households and 5.1% or 11 single-mother households are living below the poverty line. Among single-father households, those with 1 or 2 children have the highest poverty rate, with 14 households (12.4%) experiencing poverty. Likewise, among single-mother households, those with no children have the highest poverty rate, with 11 households (8.7%) falling below the poverty line.
| Children | Single Father | Single Mother |
| No Children | 0 (0.0%) | 11 (8.7%) |
| 1 or 2 Children | 14 (12.4%) | 0 (0.0%) |
| 3 or 4 Children | 0 (0.0%) | 0 (0.0%) |
| 5 or more Children | 0 (0.0%) | 0 (0.0%) |
| Total | 14 (6.0%) | 11 (5.1%) |
Income Below Poverty Among Married-Couple vs Single-Parent Households in Warrenton
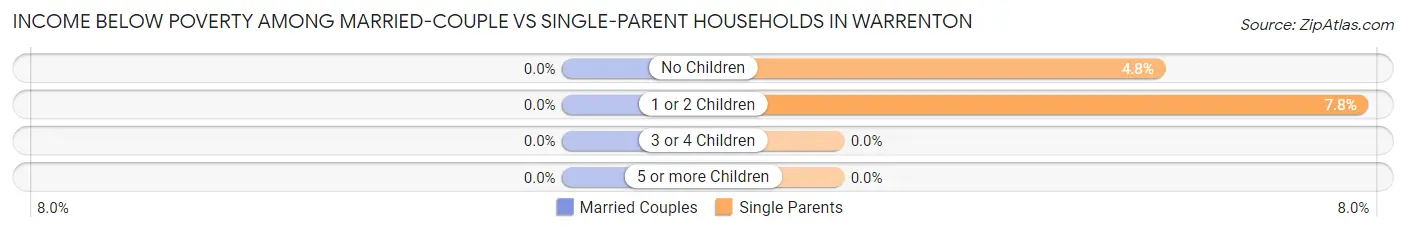
| Children | Married-Couple Families | Single-Parent Households |
| No Children | 0 (0.0%) | 11 (4.8%) |
| 1 or 2 Children | 0 (0.0%) | 14 (7.8%) |
| 3 or 4 Children | 0 (0.0%) | 0 (0.0%) |
| 5 or more Children | 0 (0.0%) | 0 (0.0%) |
| Total | 0 (0.0%) | 25 (5.6%) |
Employment Characteristics in Warrenton
Employment by Class of Employer in Warrenton
Among the 2,681 employed individuals in Warrenton, private company employees (1,870 | 69.8%), not-for-profit organizations (303 | 11.3%), and federal government employees (144 | 5.4%) make up the most common classes of employment.
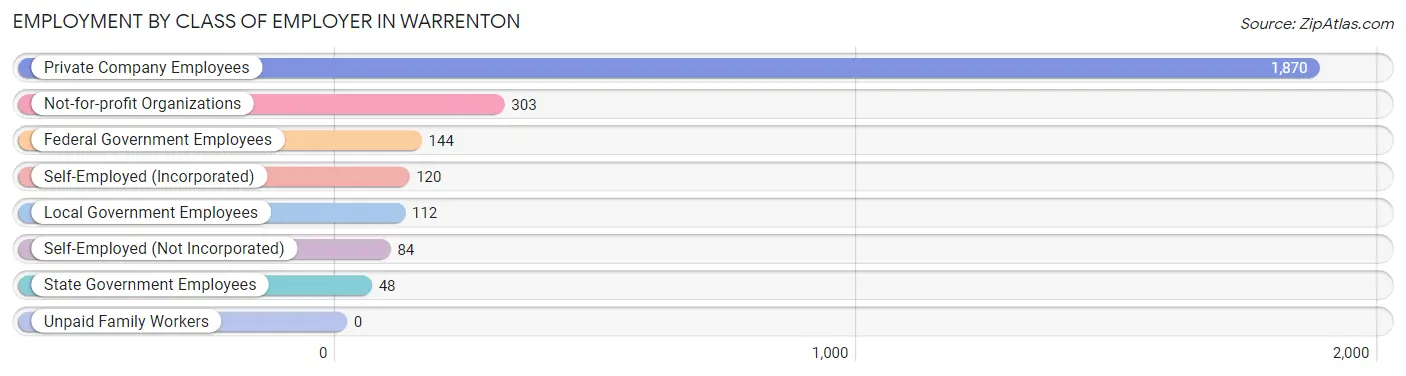
| Employer Class | # Employees | % Employees |
| Private Company Employees | 1,870 | 69.8% |
| Self-Employed (Incorporated) | 120 | 4.5% |
| Self-Employed (Not Incorporated) | 84 | 3.1% |
| Not-for-profit Organizations | 303 | 11.3% |
| Local Government Employees | 112 | 4.2% |
| State Government Employees | 48 | 1.8% |
| Federal Government Employees | 144 | 5.4% |
| Unpaid Family Workers | 0 | 0.0% |
| Total | 2,681 | 100.0% |
Employment Status by Age in Warrenton
According to the labor force statistics for Warrenton, out of the total population over 16 years of age (4,966), 58.0% or 2,880 individuals are in the labor force, with 4.8% or 138 of them unemployed. The age group with the highest labor force participation rate is 30 to 34 years, with 92.1% or 632 individuals in the labor force. Within the labor force, the 65 to 74 years age range has the highest percentage of unemployed individuals, with 21.3% or 26 of them being unemployed.
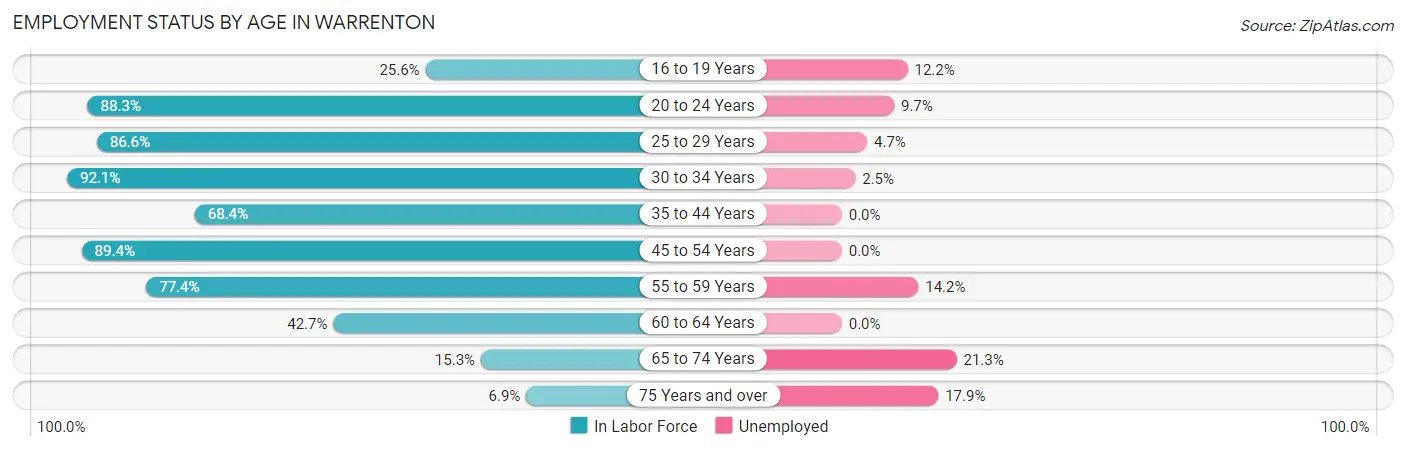
| Age Bracket | In Labor Force | Unemployed |
| 16 to 19 Years | 70 (25.6%) | 9 (12.2%) |
| 20 to 24 Years | 364 (88.3%) | 35 (9.7%) |
| 25 to 29 Years | 259 (86.6%) | 12 (4.7%) |
| 30 to 34 Years | 632 (92.1%) | 16 (2.5%) |
| 35 to 44 Years | 562 (68.4%) | 0 (0.0%) |
| 45 to 54 Years | 491 (89.4%) | 0 (0.0%) |
| 55 to 59 Years | 226 (77.4%) | 32 (14.2%) |
| 60 to 64 Years | 117 (42.7%) | 0 (0.0%) |
| 65 to 74 Years | 122 (15.3%) | 26 (21.3%) |
| 75 Years and over | 39 (6.9%) | 7 (17.9%) |
| Total | 2,880 (58.0%) | 138 (4.8%) |
Employment Status by Educational Attainment in Warrenton
According to labor force statistics for Warrenton, 78.3% of individuals (2,288) out of the total population between 25 and 64 years of age (2,922) are in the labor force, with 2.7% or 62 of them being unemployed. The group with the highest labor force participation rate are those with the educational attainment of bachelor's degree or higher, with 97.2% or 592 individuals in the labor force. Within the labor force, individuals with bachelor's degree or higher education have the highest percentage of unemployment, with 5.8% or 34 of them being unemployed.
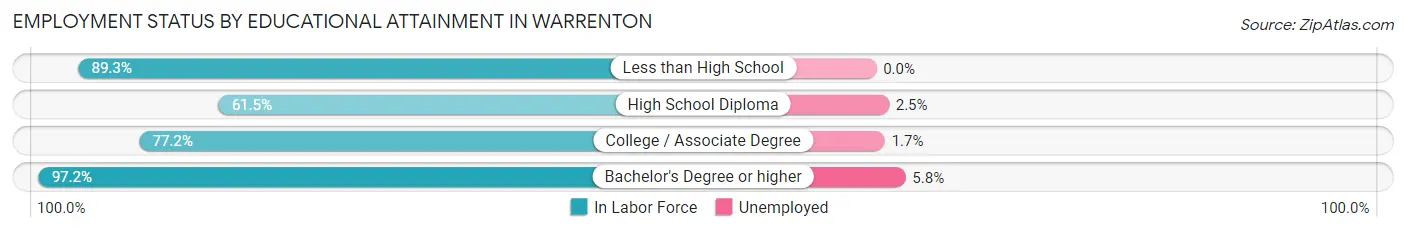
| Educational Attainment | In Labor Force | Unemployed |
| Less than High School | 234 (89.3%) | 0 (0.0%) |
| High School Diploma | 478 (61.5%) | 19 (2.5%) |
| College / Associate Degree | 984 (77.2%) | 22 (1.7%) |
| Bachelor's Degree or higher | 592 (97.2%) | 35 (5.8%) |
| Total | 2,288 (78.3%) | 79 (2.7%) |
Employment Occupations by Sex in Warrenton
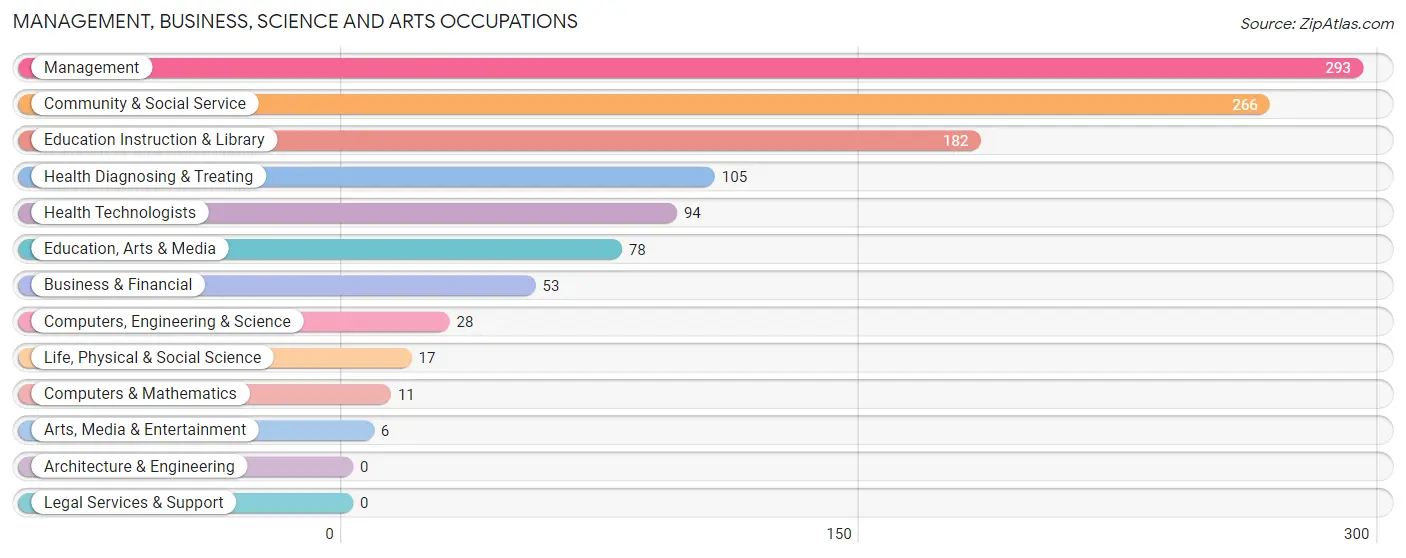
Management, Business, Science and Arts Occupations
The most common Management, Business, Science and Arts occupations in Warrenton are Management (293 | 11.0%), Community & Social Service (266 | 10.0%), Education Instruction & Library (182 | 6.9%), Health Diagnosing & Treating (105 | 4.0%), and Health Technologists (94 | 3.5%).
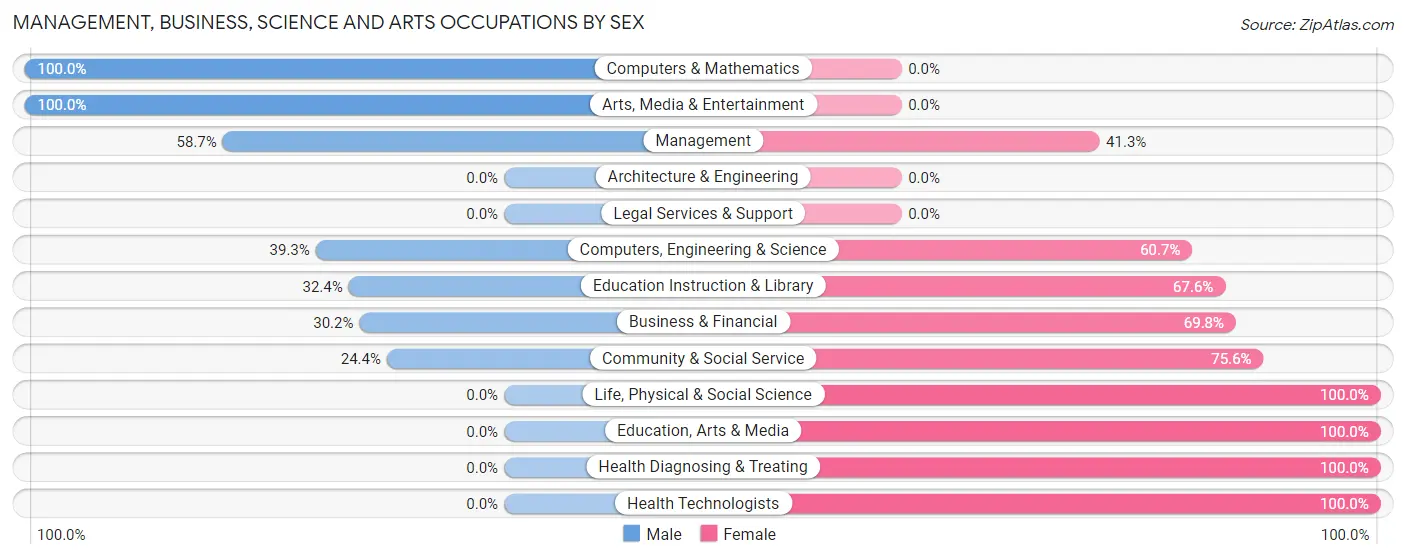
Management, Business, Science and Arts Occupations by Sex
Within the Management, Business, Science and Arts occupations in Warrenton, the most male-oriented occupations are Computers & Mathematics (100.0%), Arts, Media & Entertainment (100.0%), and Management (58.7%), while the most female-oriented occupations are Life, Physical & Social Science (100.0%), Education, Arts & Media (100.0%), and Health Diagnosing & Treating (100.0%).
| Occupation | Male | Female |
| Management | 172 (58.7%) | 121 (41.3%) |
| Business & Financial | 16 (30.2%) | 37 (69.8%) |
| Computers, Engineering & Science | 11 (39.3%) | 17 (60.7%) |
| Computers & Mathematics | 11 (100.0%) | 0 (0.0%) |
| Architecture & Engineering | 0 (0.0%) | 0 (0.0%) |
| Life, Physical & Social Science | 0 (0.0%) | 17 (100.0%) |
| Community & Social Service | 65 (24.4%) | 201 (75.6%) |
| Education, Arts & Media | 0 (0.0%) | 78 (100.0%) |
| Legal Services & Support | 0 (0.0%) | 0 (0.0%) |
| Education Instruction & Library | 59 (32.4%) | 123 (67.6%) |
| Arts, Media & Entertainment | 6 (100.0%) | 0 (0.0%) |
| Health Diagnosing & Treating | 0 (0.0%) | 105 (100.0%) |
| Health Technologists | 0 (0.0%) | 94 (100.0%) |
| Total (Category) | 264 (35.4%) | 481 (64.6%) |
| Total (Overall) | 1,388 (52.3%) | 1,268 (47.7%) |
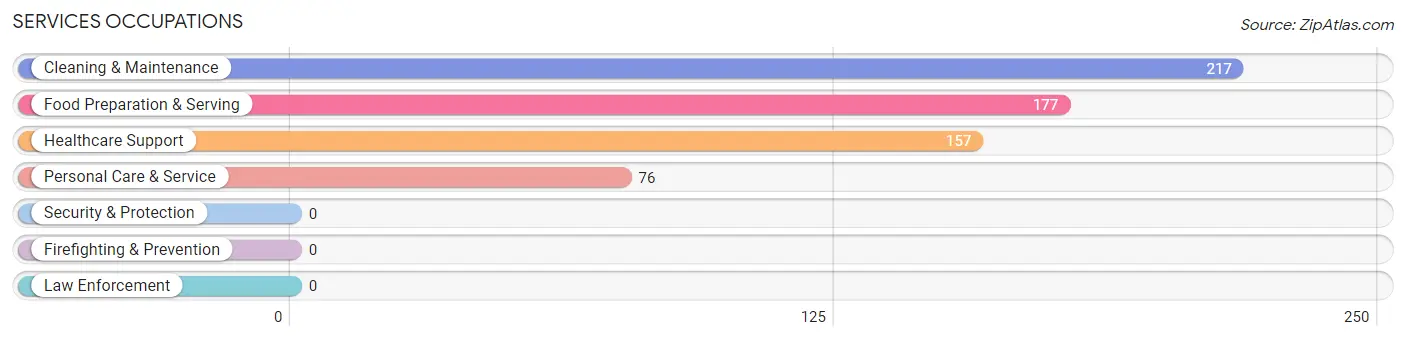
Services Occupations
The most common Services occupations in Warrenton are Cleaning & Maintenance (217 | 8.2%), Food Preparation & Serving (177 | 6.7%), Healthcare Support (157 | 5.9%), and Personal Care & Service (76 | 2.9%).
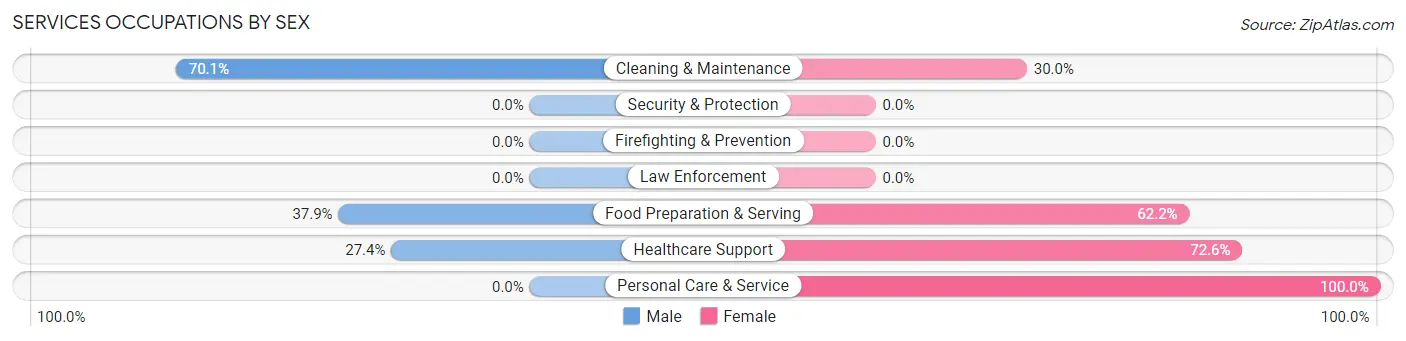
Services Occupations by Sex
Within the Services occupations in Warrenton, the most male-oriented occupations are Cleaning & Maintenance (70.1%), Food Preparation & Serving (37.9%), and Healthcare Support (27.4%), while the most female-oriented occupations are Personal Care & Service (100.0%), Healthcare Support (72.6%), and Food Preparation & Serving (62.2%).
| Occupation | Male | Female |
| Healthcare Support | 43 (27.4%) | 114 (72.6%) |
| Security & Protection | 0 (0.0%) | 0 (0.0%) |
| Firefighting & Prevention | 0 (0.0%) | 0 (0.0%) |
| Law Enforcement | 0 (0.0%) | 0 (0.0%) |
| Food Preparation & Serving | 67 (37.9%) | 110 (62.2%) |
| Cleaning & Maintenance | 152 (70.1%) | 65 (29.9%) |
| Personal Care & Service | 0 (0.0%) | 76 (100.0%) |
| Total (Category) | 262 (41.8%) | 365 (58.2%) |
| Total (Overall) | 1,388 (52.3%) | 1,268 (47.7%) |
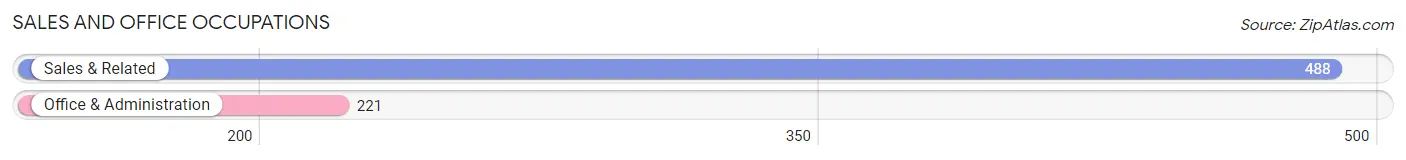
Sales and Office Occupations
The most common Sales and Office occupations in Warrenton are Sales & Related (488 | 18.4%), and Office & Administration (221 | 8.3%).
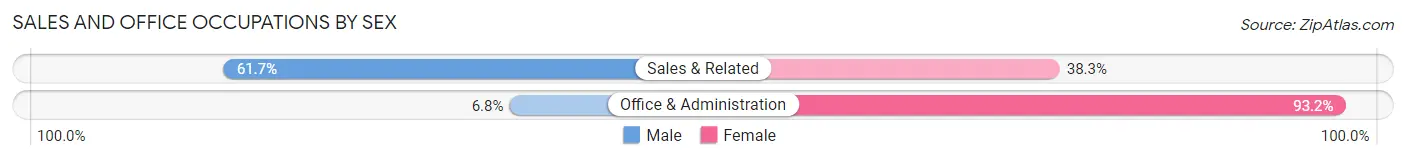
Sales and Office Occupations by Sex
| Occupation | Male | Female |
| Sales & Related | 301 (61.7%) | 187 (38.3%) |
| Office & Administration | 15 (6.8%) | 206 (93.2%) |
| Total (Category) | 316 (44.6%) | 393 (55.4%) |
| Total (Overall) | 1,388 (52.3%) | 1,268 (47.7%) |
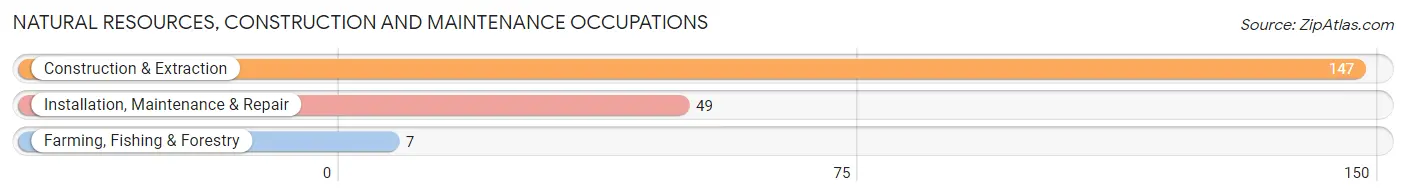
Natural Resources, Construction and Maintenance Occupations
The most common Natural Resources, Construction and Maintenance occupations in Warrenton are Construction & Extraction (147 | 5.5%), Installation, Maintenance & Repair (49 | 1.8%), and Farming, Fishing & Forestry (7 | 0.3%).
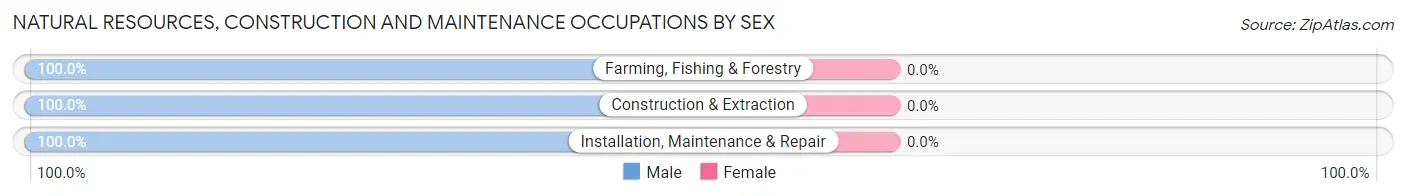
Natural Resources, Construction and Maintenance Occupations by Sex
| Occupation | Male | Female |
| Farming, Fishing & Forestry | 7 (100.0%) | 0 (0.0%) |
| Construction & Extraction | 147 (100.0%) | 0 (0.0%) |
| Installation, Maintenance & Repair | 49 (100.0%) | 0 (0.0%) |
| Total (Category) | 203 (100.0%) | 0 (0.0%) |
| Total (Overall) | 1,388 (52.3%) | 1,268 (47.7%) |
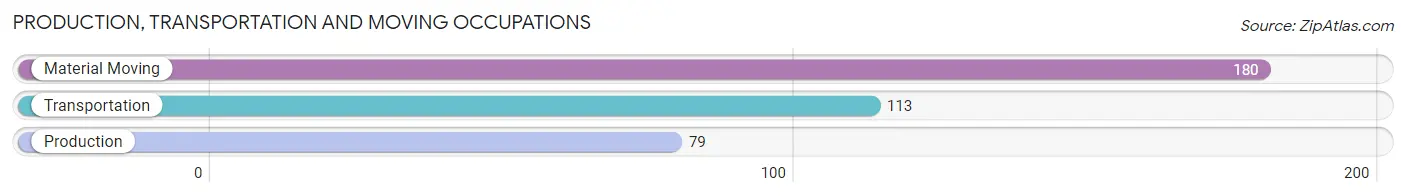
Production, Transportation and Moving Occupations
The most common Production, Transportation and Moving occupations in Warrenton are Material Moving (180 | 6.8%), Transportation (113 | 4.3%), and Production (79 | 3.0%).
Production, Transportation and Moving Occupations by Sex
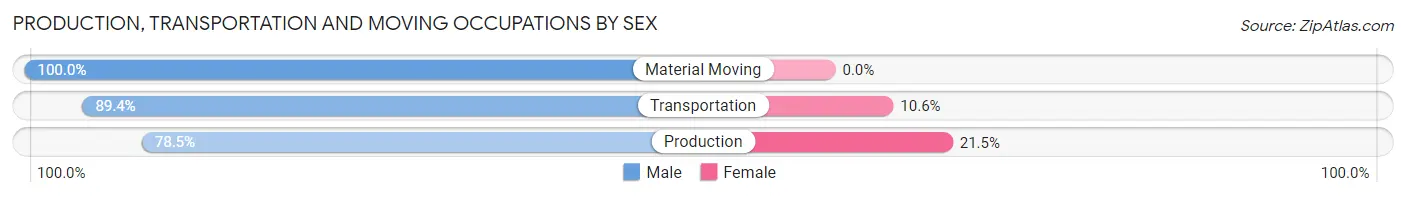
| Occupation | Male | Female |
| Production | 62 (78.5%) | 17 (21.5%) |
| Transportation | 101 (89.4%) | 12 (10.6%) |
| Material Moving | 180 (100.0%) | 0 (0.0%) |
| Total (Category) | 343 (92.2%) | 29 (7.8%) |
| Total (Overall) | 1,388 (52.3%) | 1,268 (47.7%) |
Employment Industries by Sex in Warrenton
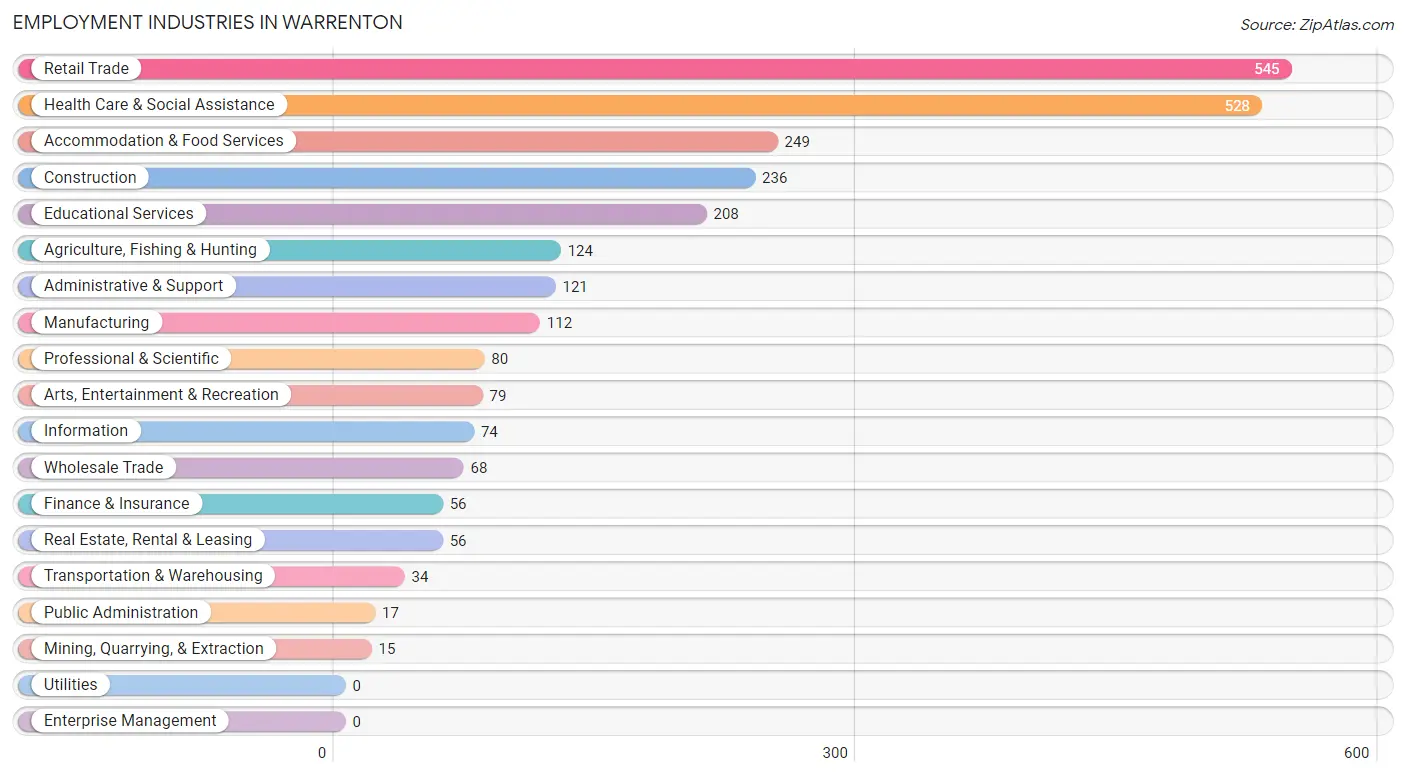
Employment Industries in Warrenton
The major employment industries in Warrenton include Retail Trade (545 | 20.5%), Health Care & Social Assistance (528 | 19.9%), Accommodation & Food Services (249 | 9.4%), Construction (236 | 8.9%), and Educational Services (208 | 7.8%).
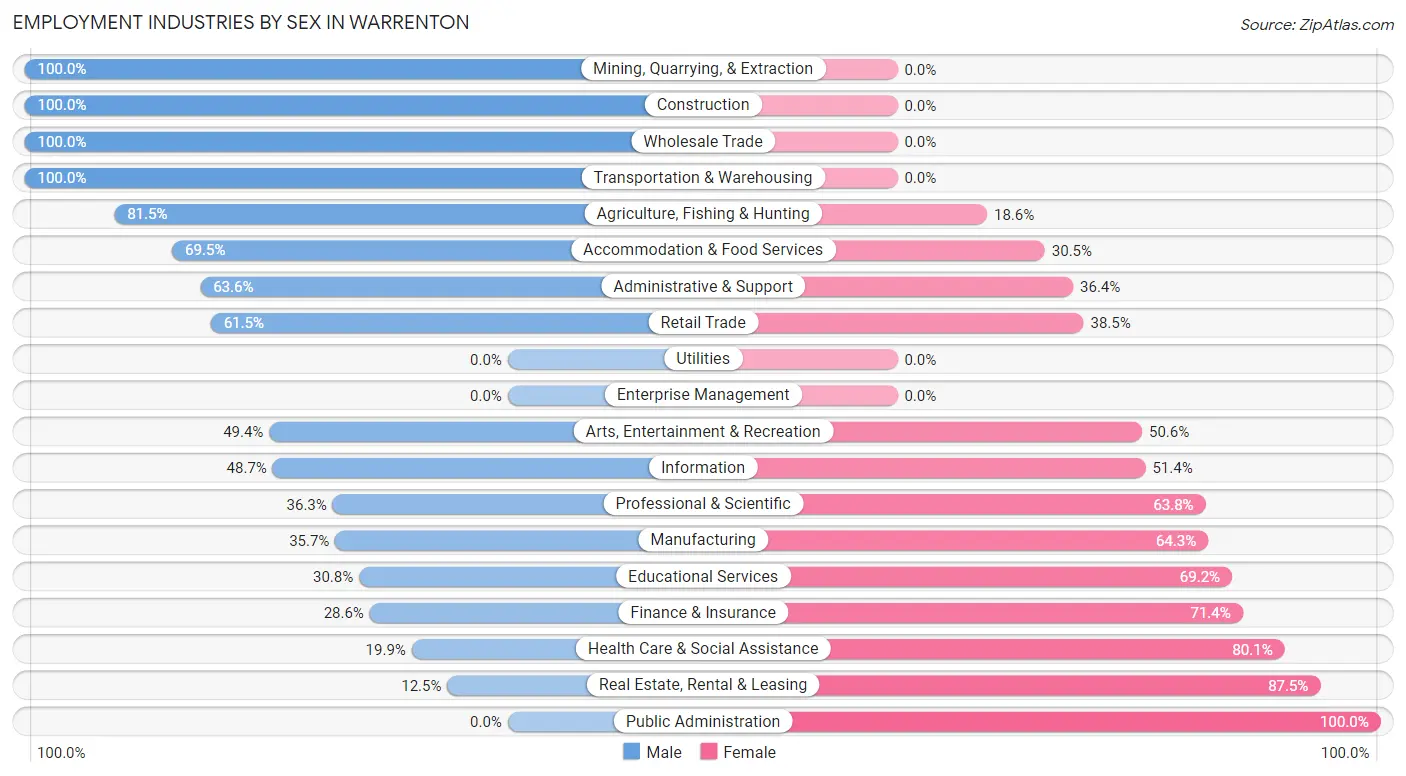
Employment Industries by Sex in Warrenton
The Warrenton industries that see more men than women are Mining, Quarrying, & Extraction (100.0%), Construction (100.0%), and Wholesale Trade (100.0%), whereas the industries that tend to have a higher number of women are Public Administration (100.0%), Real Estate, Rental & Leasing (87.5%), and Health Care & Social Assistance (80.1%).
| Industry | Male | Female |
| Agriculture, Fishing & Hunting | 101 (81.5%) | 23 (18.5%) |
| Mining, Quarrying, & Extraction | 15 (100.0%) | 0 (0.0%) |
| Construction | 236 (100.0%) | 0 (0.0%) |
| Manufacturing | 40 (35.7%) | 72 (64.3%) |
| Wholesale Trade | 68 (100.0%) | 0 (0.0%) |
| Retail Trade | 335 (61.5%) | 210 (38.5%) |
| Transportation & Warehousing | 34 (100.0%) | 0 (0.0%) |
| Utilities | 0 (0.0%) | 0 (0.0%) |
| Information | 36 (48.6%) | 38 (51.3%) |
| Finance & Insurance | 16 (28.6%) | 40 (71.4%) |
| Real Estate, Rental & Leasing | 7 (12.5%) | 49 (87.5%) |
| Professional & Scientific | 29 (36.2%) | 51 (63.7%) |
| Enterprise Management | 0 (0.0%) | 0 (0.0%) |
| Administrative & Support | 77 (63.6%) | 44 (36.4%) |
| Educational Services | 64 (30.8%) | 144 (69.2%) |
| Health Care & Social Assistance | 105 (19.9%) | 423 (80.1%) |
| Arts, Entertainment & Recreation | 39 (49.4%) | 40 (50.6%) |
| Accommodation & Food Services | 173 (69.5%) | 76 (30.5%) |
| Public Administration | 0 (0.0%) | 17 (100.0%) |
| Total | 1,388 (52.3%) | 1,268 (47.7%) |
Education in Warrenton
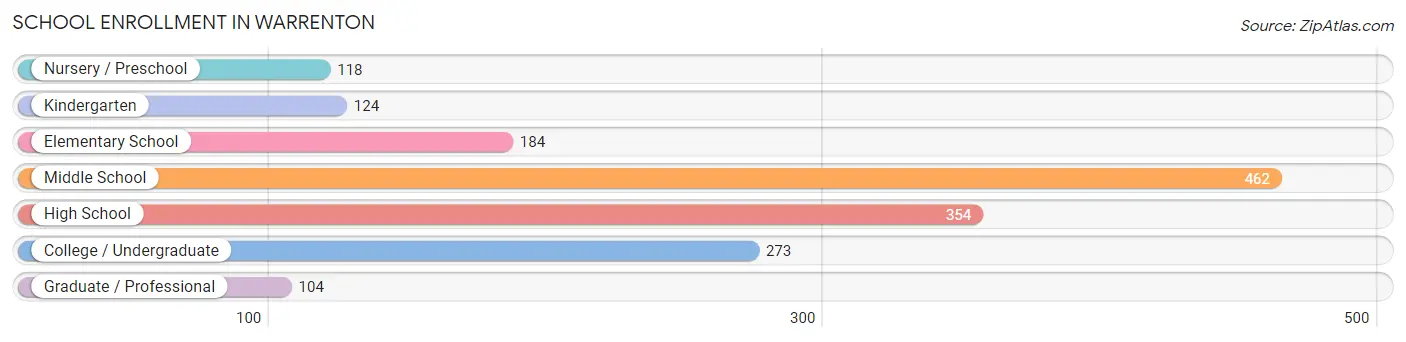
School Enrollment in Warrenton
The most common levels of schooling among the 1,619 students in Warrenton are middle school (462 | 28.5%), high school (354 | 21.9%), and college / undergraduate (273 | 16.9%).
| School Level | # Students | % Students |
| Nursery / Preschool | 118 | 7.3% |
| Kindergarten | 124 | 7.7% |
| Elementary School | 184 | 11.4% |
| Middle School | 462 | 28.5% |
| High School | 354 | 21.9% |
| College / Undergraduate | 273 | 16.9% |
| Graduate / Professional | 104 | 6.4% |
| Total | 1,619 | 100.0% |
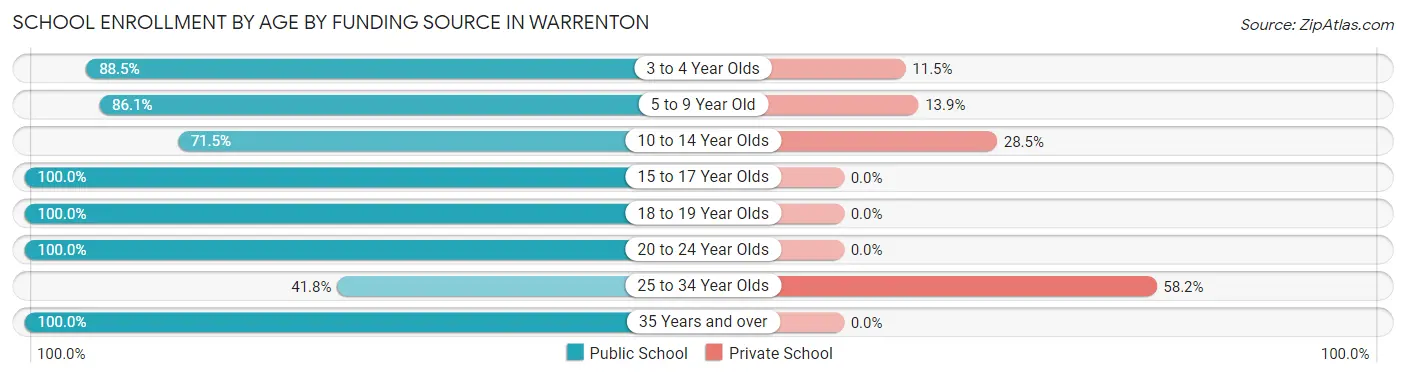
School Enrollment by Age by Funding Source in Warrenton
Out of a total of 1,619 students who are enrolled in schools in Warrenton, 282 (17.4%) attend a private institution, while the remaining 1,337 (82.6%) are enrolled in public schools. The age group of 25 to 34 year olds has the highest likelihood of being enrolled in private schools, with 53 (58.2% in the age bracket) enrolled. Conversely, the age group of 15 to 17 year olds has the lowest likelihood of being enrolled in a private school, with 206 (100.0% in the age bracket) attending a public institution.
| Age Bracket | Public School | Private School |
| 3 to 4 Year Olds | 77 (88.5%) | 10 (11.5%) |
| 5 to 9 Year Old | 279 (86.1%) | 45 (13.9%) |
| 10 to 14 Year Olds | 436 (71.5%) | 174 (28.5%) |
| 15 to 17 Year Olds | 206 (100.0%) | 0 (0.0%) |
| 18 to 19 Year Olds | 69 (100.0%) | 0 (0.0%) |
| 20 to 24 Year Olds | 159 (100.0%) | 0 (0.0%) |
| 25 to 34 Year Olds | 38 (41.8%) | 53 (58.2%) |
| 35 Years and over | 73 (100.0%) | 0 (0.0%) |
| Total | 1,337 (82.6%) | 282 (17.4%) |
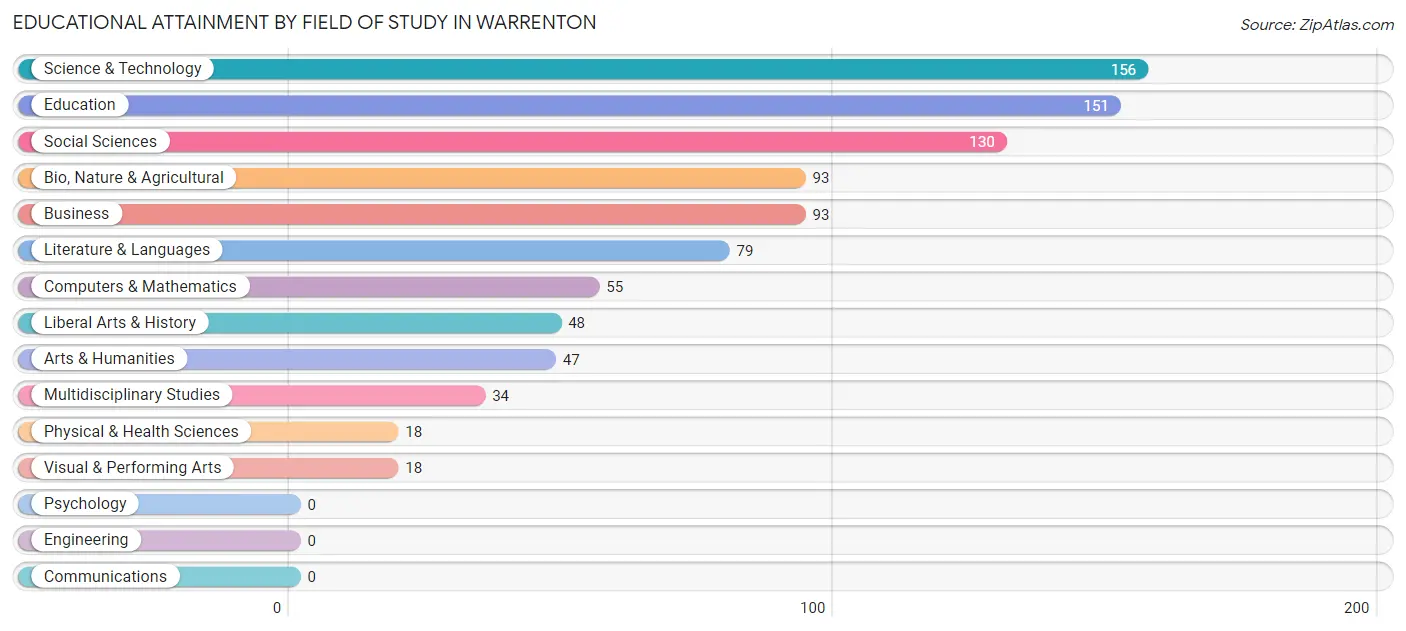
Educational Attainment by Field of Study in Warrenton
Science & technology (156 | 16.9%), education (151 | 16.4%), social sciences (130 | 14.1%), bio, nature & agricultural (93 | 10.1%), and business (93 | 10.1%) are the most common fields of study among 922 individuals in Warrenton who have obtained a bachelor's degree or higher.
| Field of Study | # Graduates | % Graduates |
| Computers & Mathematics | 55 | 6.0% |
| Bio, Nature & Agricultural | 93 | 10.1% |
| Physical & Health Sciences | 18 | 1.9% |
| Psychology | 0 | 0.0% |
| Social Sciences | 130 | 14.1% |
| Engineering | 0 | 0.0% |
| Multidisciplinary Studies | 34 | 3.7% |
| Science & Technology | 156 | 16.9% |
| Business | 93 | 10.1% |
| Education | 151 | 16.4% |
| Literature & Languages | 79 | 8.6% |
| Liberal Arts & History | 48 | 5.2% |
| Visual & Performing Arts | 18 | 1.9% |
| Communications | 0 | 0.0% |
| Arts & Humanities | 47 | 5.1% |
| Total | 922 | 100.0% |
Transportation & Commute in Warrenton
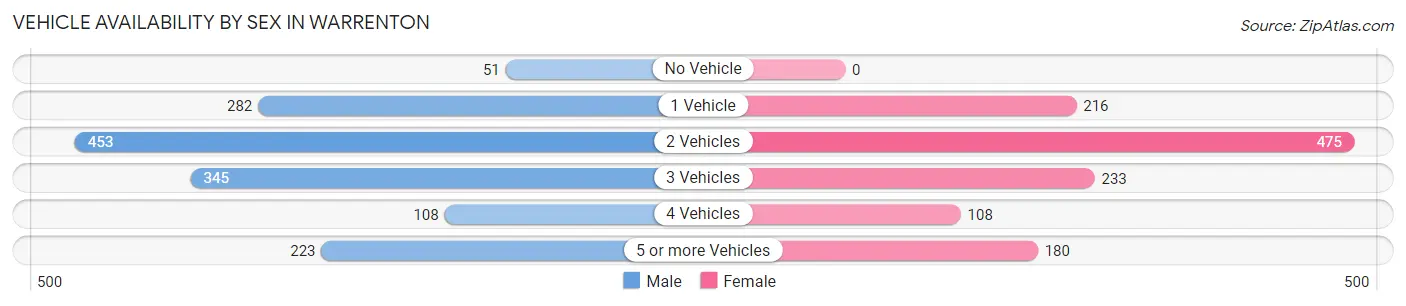
Vehicle Availability by Sex in Warrenton
The most prevalent vehicle ownership categories in Warrenton are males with 2 vehicles (453, accounting for 31.0%) and females with 2 vehicles (475, making up 37.4%).
| Vehicles Available | Male | Female |
| No Vehicle | 51 (3.5%) | 0 (0.0%) |
| 1 Vehicle | 282 (19.3%) | 216 (17.8%) |
| 2 Vehicles | 453 (31.0%) | 475 (39.2%) |
| 3 Vehicles | 345 (23.6%) | 233 (19.2%) |
| 4 Vehicles | 108 (7.4%) | 108 (8.9%) |
| 5 or more Vehicles | 223 (15.2%) | 180 (14.8%) |
| Total | 1,462 (100.0%) | 1,212 (100.0%) |
Commute Time in Warrenton
The most frequently occuring commute durations in Warrenton are 10 to 14 minutes (576 commuters, 22.3%), 15 to 19 minutes (496 commuters, 19.2%), and 20 to 24 minutes (445 commuters, 17.2%).
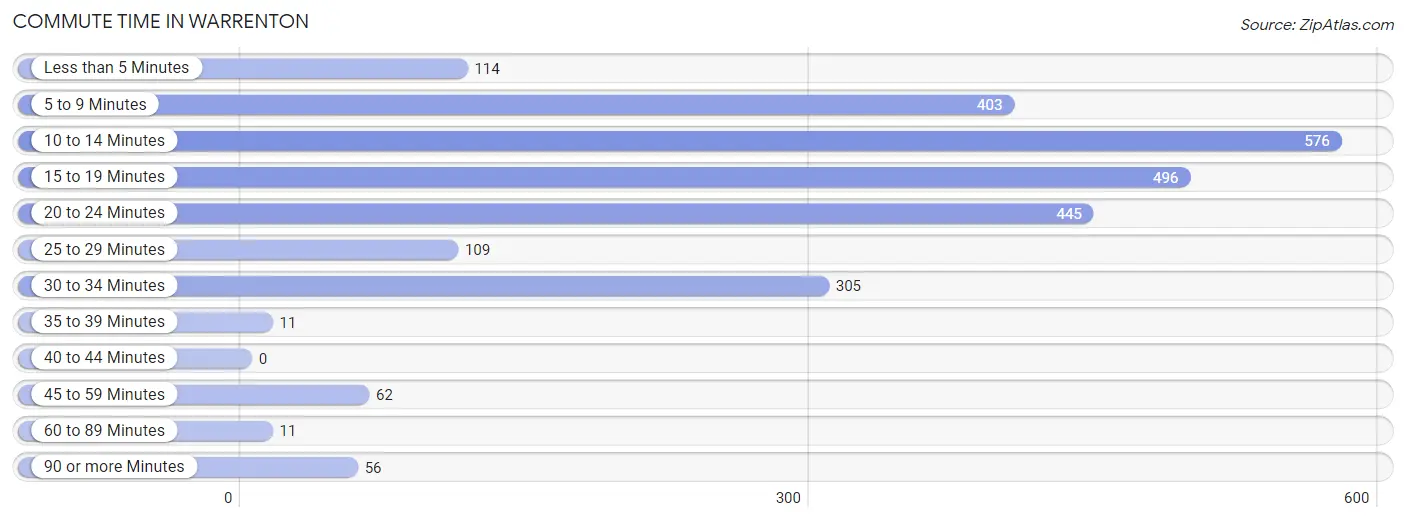
| Commute Time | # Commuters | % Commuters |
| Less than 5 Minutes | 114 | 4.4% |
| 5 to 9 Minutes | 403 | 15.6% |
| 10 to 14 Minutes | 576 | 22.3% |
| 15 to 19 Minutes | 496 | 19.2% |
| 20 to 24 Minutes | 445 | 17.2% |
| 25 to 29 Minutes | 109 | 4.2% |
| 30 to 34 Minutes | 305 | 11.8% |
| 35 to 39 Minutes | 11 | 0.4% |
| 40 to 44 Minutes | 0 | 0.0% |
| 45 to 59 Minutes | 62 | 2.4% |
| 60 to 89 Minutes | 11 | 0.4% |
| 90 or more Minutes | 56 | 2.2% |
Commute Time by Sex in Warrenton
The most common commute times in Warrenton are 10 to 14 minutes (440 commuters, 30.1%) for males and 15 to 19 minutes (305 commuters, 27.1%) for females.
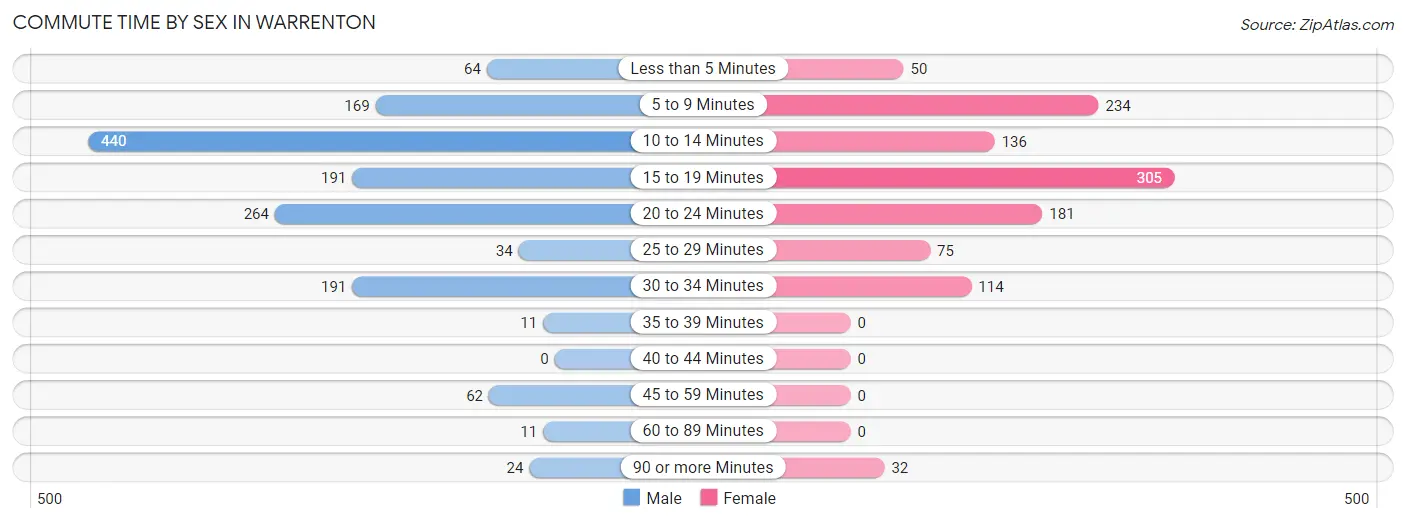
| Commute Time | Male | Female |
| Less than 5 Minutes | 64 (4.4%) | 50 (4.4%) |
| 5 to 9 Minutes | 169 (11.6%) | 234 (20.8%) |
| 10 to 14 Minutes | 440 (30.1%) | 136 (12.1%) |
| 15 to 19 Minutes | 191 (13.1%) | 305 (27.1%) |
| 20 to 24 Minutes | 264 (18.1%) | 181 (16.1%) |
| 25 to 29 Minutes | 34 (2.3%) | 75 (6.7%) |
| 30 to 34 Minutes | 191 (13.1%) | 114 (10.1%) |
| 35 to 39 Minutes | 11 (0.7%) | 0 (0.0%) |
| 40 to 44 Minutes | 0 (0.0%) | 0 (0.0%) |
| 45 to 59 Minutes | 62 (4.2%) | 0 (0.0%) |
| 60 to 89 Minutes | 11 (0.7%) | 0 (0.0%) |
| 90 or more Minutes | 24 (1.6%) | 32 (2.8%) |
Time of Departure to Work by Sex in Warrenton
The most frequent times of departure to work in Warrenton are 12:00 PM to 3:59 PM (381, 26.1%) for males and 6:30 AM to 6:59 AM (228, 20.2%) for females.
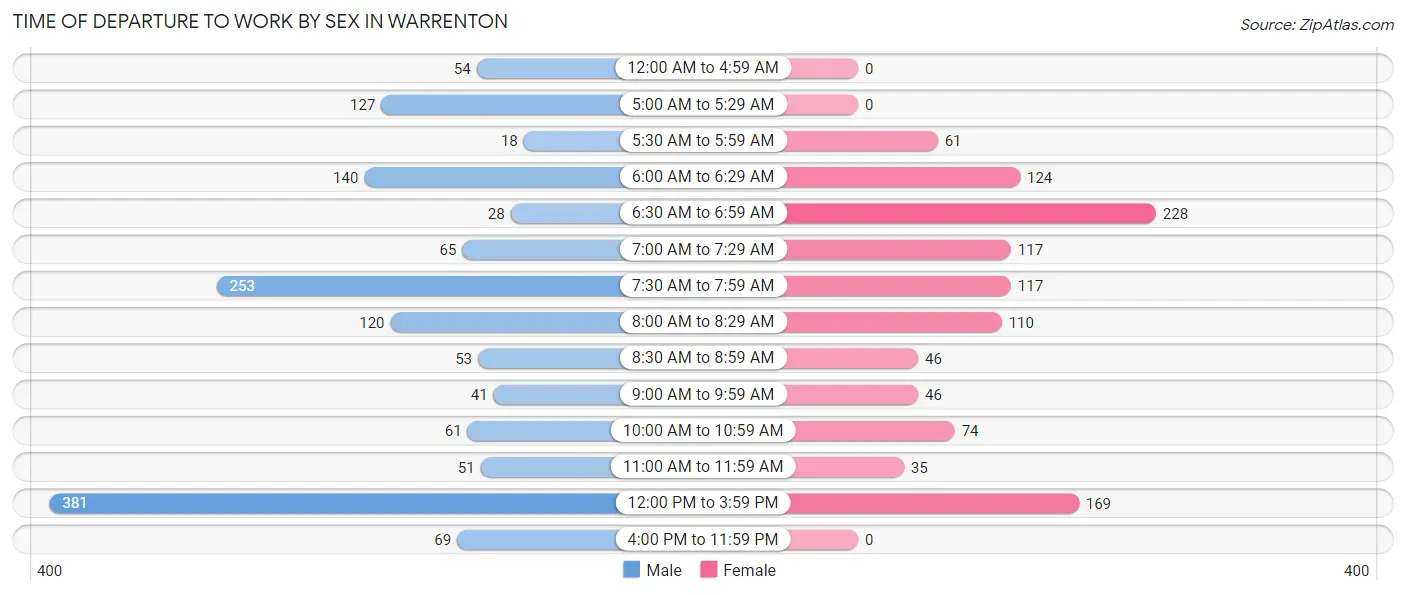
| Time of Departure | Male | Female |
| 12:00 AM to 4:59 AM | 54 (3.7%) | 0 (0.0%) |
| 5:00 AM to 5:29 AM | 127 (8.7%) | 0 (0.0%) |
| 5:30 AM to 5:59 AM | 18 (1.2%) | 61 (5.4%) |
| 6:00 AM to 6:29 AM | 140 (9.6%) | 124 (11.0%) |
| 6:30 AM to 6:59 AM | 28 (1.9%) | 228 (20.2%) |
| 7:00 AM to 7:29 AM | 65 (4.4%) | 117 (10.4%) |
| 7:30 AM to 7:59 AM | 253 (17.3%) | 117 (10.4%) |
| 8:00 AM to 8:29 AM | 120 (8.2%) | 110 (9.8%) |
| 8:30 AM to 8:59 AM | 53 (3.6%) | 46 (4.1%) |
| 9:00 AM to 9:59 AM | 41 (2.8%) | 46 (4.1%) |
| 10:00 AM to 10:59 AM | 61 (4.2%) | 74 (6.6%) |
| 11:00 AM to 11:59 AM | 51 (3.5%) | 35 (3.1%) |
| 12:00 PM to 3:59 PM | 381 (26.1%) | 169 (15.0%) |
| 4:00 PM to 11:59 PM | 69 (4.7%) | 0 (0.0%) |
| Total | 1,461 (100.0%) | 1,127 (100.0%) |
Housing Occupancy in Warrenton
Occupancy by Ownership in Warrenton
Of the total 2,368 dwellings in Warrenton, owner-occupied units account for 1,468 (62.0%), while renter-occupied units make up 900 (38.0%).
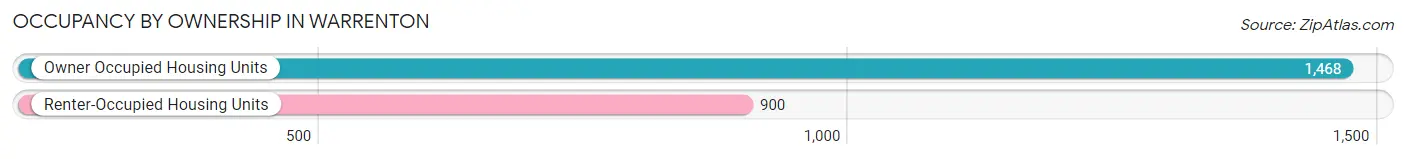
| Occupancy | # Housing Units | % Housing Units |
| Owner Occupied Housing Units | 1,468 | 62.0% |
| Renter-Occupied Housing Units | 900 | 38.0% |
| Total Occupied Housing Units | 2,368 | 100.0% |
Occupancy by Household Size in Warrenton
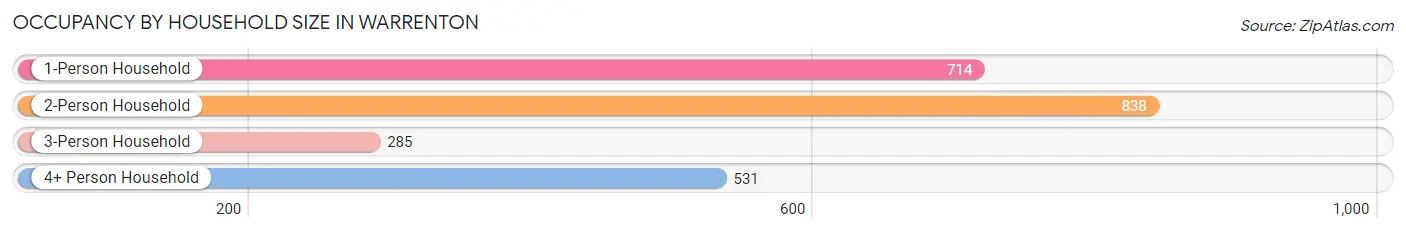
| Household Size | # Housing Units | % Housing Units |
| 1-Person Household | 714 | 30.1% |
| 2-Person Household | 838 | 35.4% |
| 3-Person Household | 285 | 12.0% |
| 4+ Person Household | 531 | 22.4% |
| Total Housing Units | 2,368 | 100.0% |
Occupancy by Ownership by Household Size in Warrenton
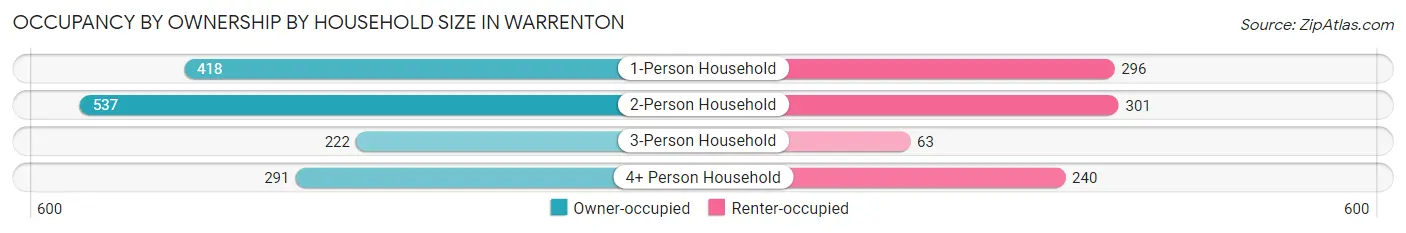
| Household Size | Owner-occupied | Renter-occupied |
| 1-Person Household | 418 (58.5%) | 296 (41.5%) |
| 2-Person Household | 537 (64.1%) | 301 (35.9%) |
| 3-Person Household | 222 (77.9%) | 63 (22.1%) |
| 4+ Person Household | 291 (54.8%) | 240 (45.2%) |
| Total Housing Units | 1,468 (62.0%) | 900 (38.0%) |
Occupancy by Educational Attainment in Warrenton
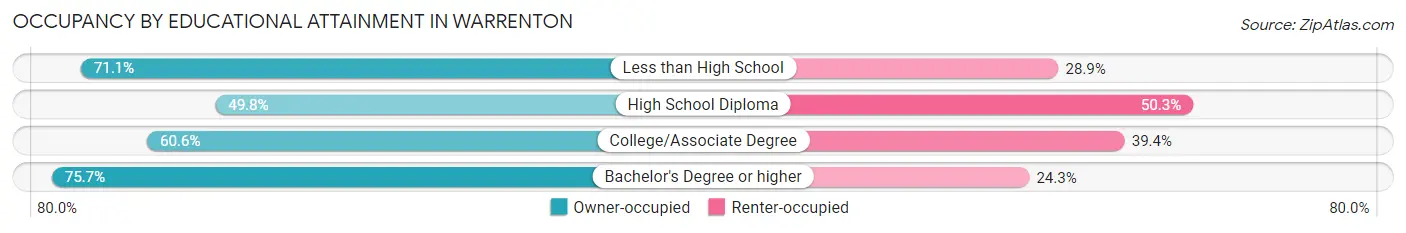
| Household Size | Owner-occupied | Renter-occupied |
| Less than High School | 140 (71.1%) | 57 (28.9%) |
| High School Diploma | 300 (49.7%) | 303 (50.2%) |
| College/Associate Degree | 636 (60.6%) | 414 (39.4%) |
| Bachelor's Degree or higher | 392 (75.7%) | 126 (24.3%) |
Occupancy by Age of Householder in Warrenton
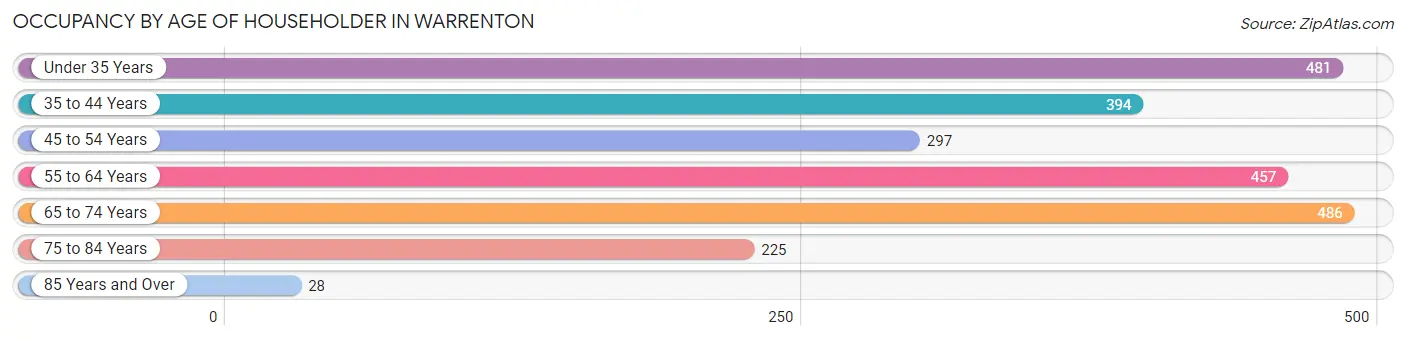
| Age Bracket | # Households | % Households |
| Under 35 Years | 481 | 20.3% |
| 35 to 44 Years | 394 | 16.6% |
| 45 to 54 Years | 297 | 12.5% |
| 55 to 64 Years | 457 | 19.3% |
| 65 to 74 Years | 486 | 20.5% |
| 75 to 84 Years | 225 | 9.5% |
| 85 Years and Over | 28 | 1.2% |
| Total | 2,368 | 100.0% |
Housing Finances in Warrenton
Median Income by Occupancy in Warrenton
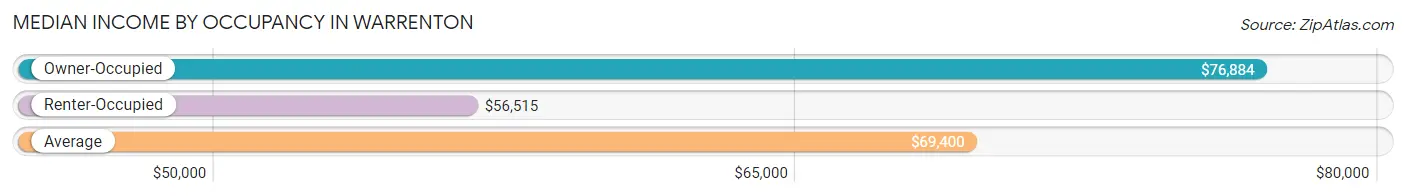
| Occupancy Type | # Households | Median Income |
| Owner-Occupied | 1,468 (62.0%) | $76,884 |
| Renter-Occupied | 900 (38.0%) | $56,515 |
| Average | 2,368 (100.0%) | $69,400 |
Occupancy by Householder Income Bracket in Warrenton
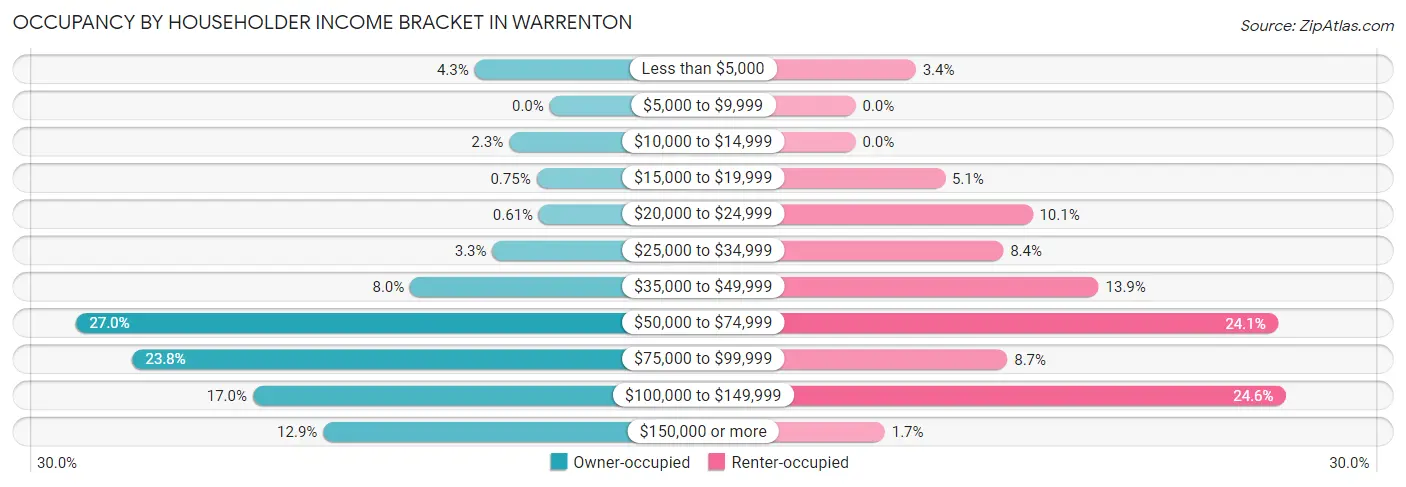
| Income Bracket | Owner-occupied | Renter-occupied |
| Less than $5,000 | 63 (4.3%) | 31 (3.4%) |
| $5,000 to $9,999 | 0 (0.0%) | 0 (0.0%) |
| $10,000 to $14,999 | 34 (2.3%) | 0 (0.0%) |
| $15,000 to $19,999 | 11 (0.7%) | 46 (5.1%) |
| $20,000 to $24,999 | 9 (0.6%) | 91 (10.1%) |
| $25,000 to $34,999 | 48 (3.3%) | 76 (8.4%) |
| $35,000 to $49,999 | 117 (8.0%) | 125 (13.9%) |
| $50,000 to $74,999 | 397 (27.0%) | 217 (24.1%) |
| $75,000 to $99,999 | 350 (23.8%) | 78 (8.7%) |
| $100,000 to $149,999 | 249 (17.0%) | 221 (24.6%) |
| $150,000 or more | 190 (12.9%) | 15 (1.7%) |
| Total | 1,468 (100.0%) | 900 (100.0%) |
Monthly Housing Cost Tiers in Warrenton
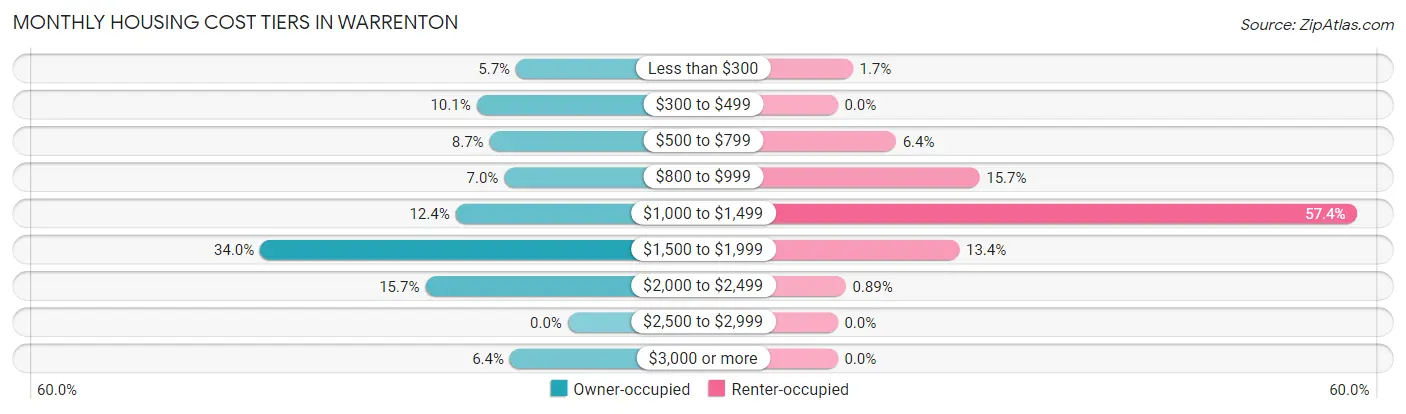
| Monthly Cost | Owner-occupied | Renter-occupied |
| Less than $300 | 84 (5.7%) | 15 (1.7%) |
| $300 to $499 | 148 (10.1%) | 0 (0.0%) |
| $500 to $799 | 127 (8.6%) | 58 (6.4%) |
| $800 to $999 | 103 (7.0%) | 141 (15.7%) |
| $1,000 to $1,499 | 182 (12.4%) | 517 (57.4%) |
| $1,500 to $1,999 | 499 (34.0%) | 121 (13.4%) |
| $2,000 to $2,499 | 231 (15.7%) | 8 (0.9%) |
| $2,500 to $2,999 | 0 (0.0%) | 0 (0.0%) |
| $3,000 or more | 94 (6.4%) | 0 (0.0%) |
| Total | 1,468 (100.0%) | 900 (100.0%) |
Physical Housing Characteristics in Warrenton
Housing Structures in Warrenton
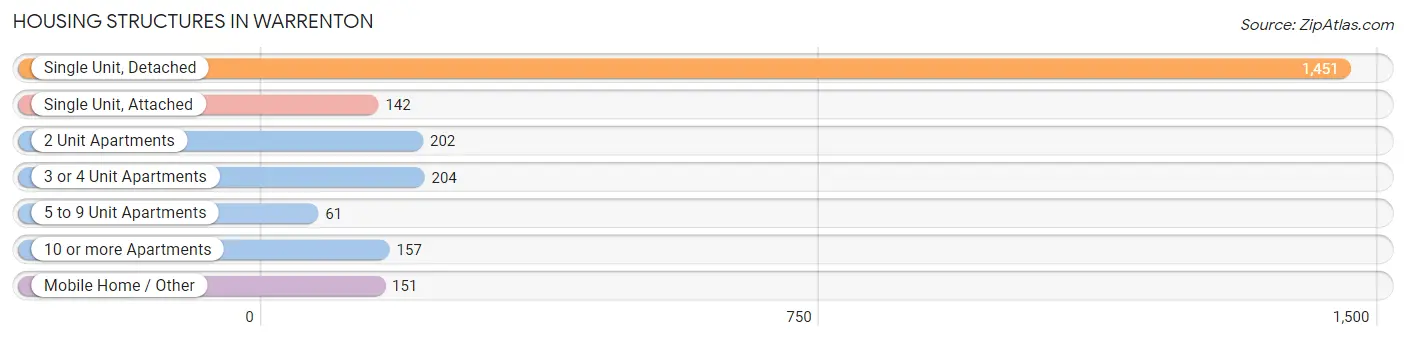
| Structure Type | # Housing Units | % Housing Units |
| Single Unit, Detached | 1,451 | 61.3% |
| Single Unit, Attached | 142 | 6.0% |
| 2 Unit Apartments | 202 | 8.5% |
| 3 or 4 Unit Apartments | 204 | 8.6% |
| 5 to 9 Unit Apartments | 61 | 2.6% |
| 10 or more Apartments | 157 | 6.6% |
| Mobile Home / Other | 151 | 6.4% |
| Total | 2,368 | 100.0% |
Housing Structures by Occupancy in Warrenton
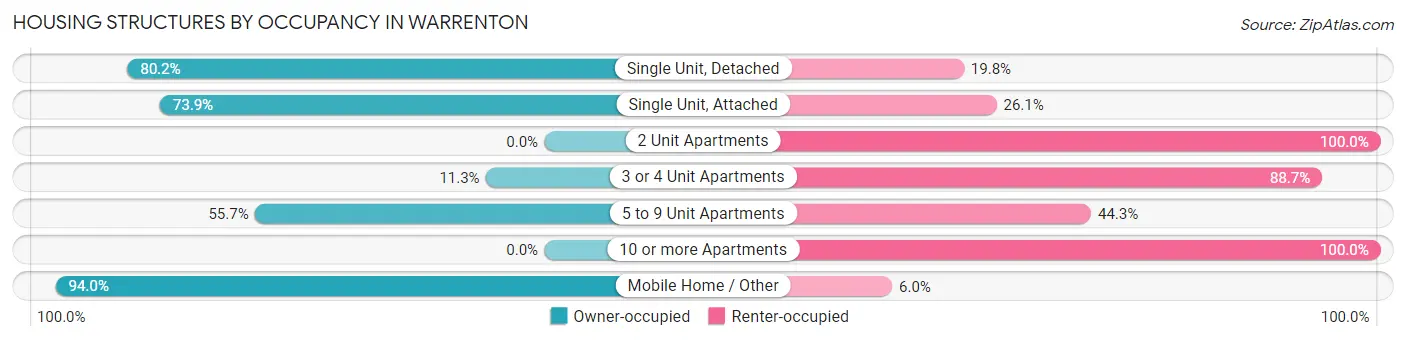
| Structure Type | Owner-occupied | Renter-occupied |
| Single Unit, Detached | 1,164 (80.2%) | 287 (19.8%) |
| Single Unit, Attached | 105 (73.9%) | 37 (26.1%) |
| 2 Unit Apartments | 0 (0.0%) | 202 (100.0%) |
| 3 or 4 Unit Apartments | 23 (11.3%) | 181 (88.7%) |
| 5 to 9 Unit Apartments | 34 (55.7%) | 27 (44.3%) |
| 10 or more Apartments | 0 (0.0%) | 157 (100.0%) |
| Mobile Home / Other | 142 (94.0%) | 9 (6.0%) |
| Total | 1,468 (62.0%) | 900 (38.0%) |
Housing Structures by Number of Rooms in Warrenton
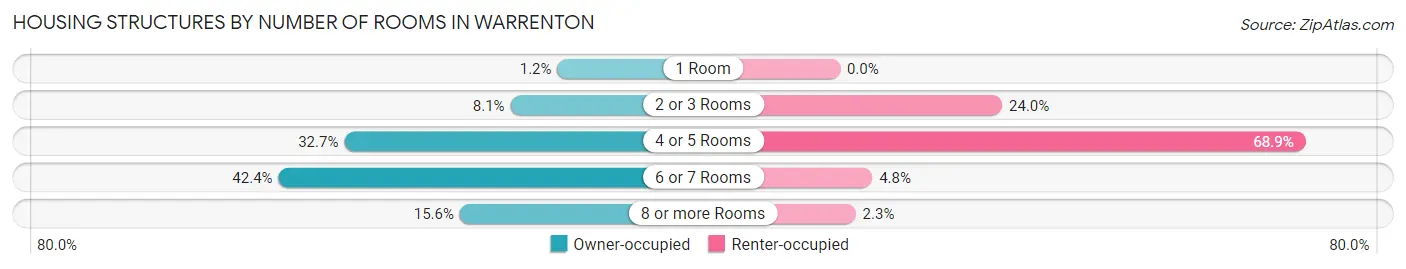
| Number of Rooms | Owner-occupied | Renter-occupied |
| 1 Room | 17 (1.2%) | 0 (0.0%) |
| 2 or 3 Rooms | 119 (8.1%) | 216 (24.0%) |
| 4 or 5 Rooms | 480 (32.7%) | 620 (68.9%) |
| 6 or 7 Rooms | 623 (42.4%) | 43 (4.8%) |
| 8 or more Rooms | 229 (15.6%) | 21 (2.3%) |
| Total | 1,468 (100.0%) | 900 (100.0%) |
Housing Structure by Heating Type in Warrenton
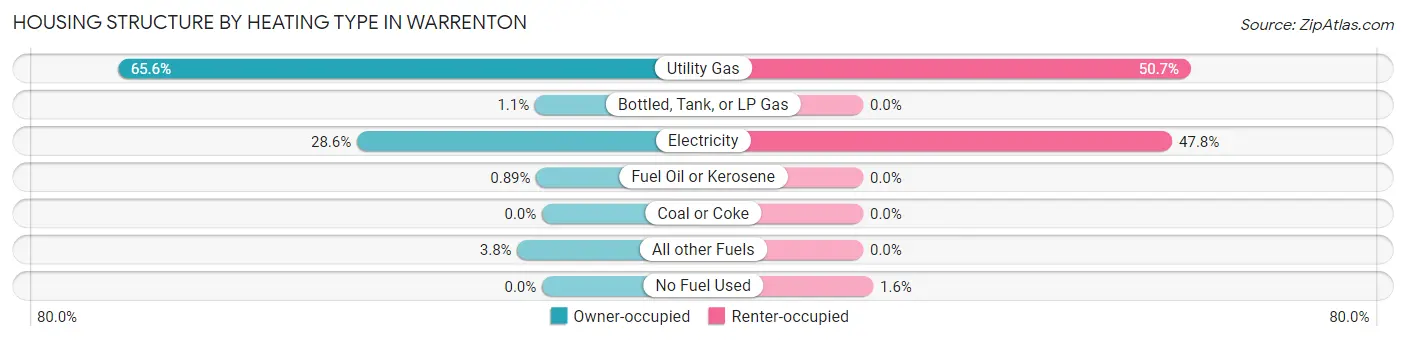
| Heating Type | Owner-occupied | Renter-occupied |
| Utility Gas | 963 (65.6%) | 456 (50.7%) |
| Bottled, Tank, or LP Gas | 16 (1.1%) | 0 (0.0%) |
| Electricity | 420 (28.6%) | 430 (47.8%) |
| Fuel Oil or Kerosene | 13 (0.9%) | 0 (0.0%) |
| Coal or Coke | 0 (0.0%) | 0 (0.0%) |
| All other Fuels | 56 (3.8%) | 0 (0.0%) |
| No Fuel Used | 0 (0.0%) | 14 (1.6%) |
| Total | 1,468 (100.0%) | 900 (100.0%) |
Household Vehicle Usage in Warrenton
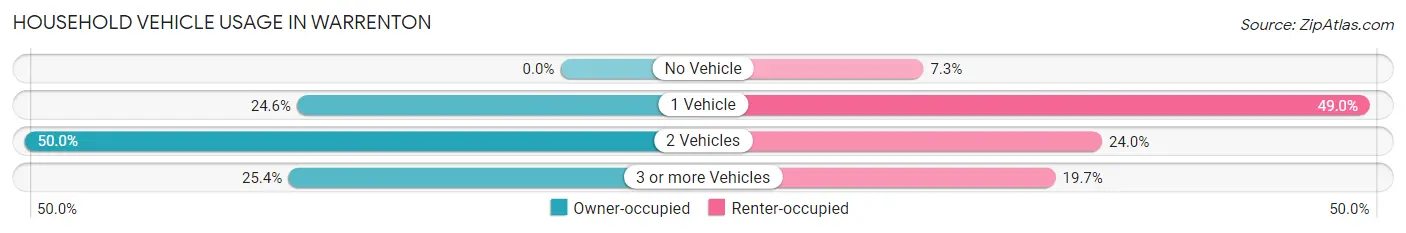
| Vehicles per Household | Owner-occupied | Renter-occupied |
| No Vehicle | 0 (0.0%) | 66 (7.3%) |
| 1 Vehicle | 361 (24.6%) | 441 (49.0%) |
| 2 Vehicles | 734 (50.0%) | 216 (24.0%) |
| 3 or more Vehicles | 373 (25.4%) | 177 (19.7%) |
| Total | 1,468 (100.0%) | 900 (100.0%) |
Real Estate & Mortgages in Warrenton
Real Estate and Mortgage Overview in Warrenton
| Characteristic | Without Mortgage | With Mortgage |
| Housing Units | 386 | 1,082 |
| Median Property Value | $350,600 | $328,900 |
| Median Household Income | $48,667 | $133 |
| Monthly Housing Costs | $461 | $94 |
| Real Estate Taxes | $2,431 | $16 |
Property Value by Mortgage Status in Warrenton
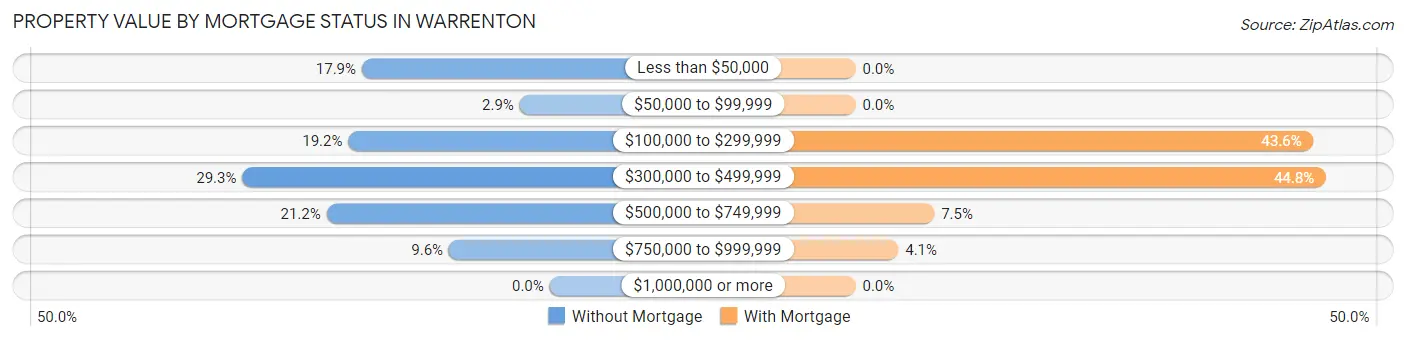
| Property Value | Without Mortgage | With Mortgage |
| Less than $50,000 | 69 (17.9%) | 0 (0.0%) |
| $50,000 to $99,999 | 11 (2.9%) | 0 (0.0%) |
| $100,000 to $299,999 | 74 (19.2%) | 472 (43.6%) |
| $300,000 to $499,999 | 113 (29.3%) | 485 (44.8%) |
| $500,000 to $749,999 | 82 (21.2%) | 81 (7.5%) |
| $750,000 to $999,999 | 37 (9.6%) | 44 (4.1%) |
| $1,000,000 or more | 0 (0.0%) | 0 (0.0%) |
| Total | 386 (100.0%) | 1,082 (100.0%) |
Household Income by Mortgage Status in Warrenton
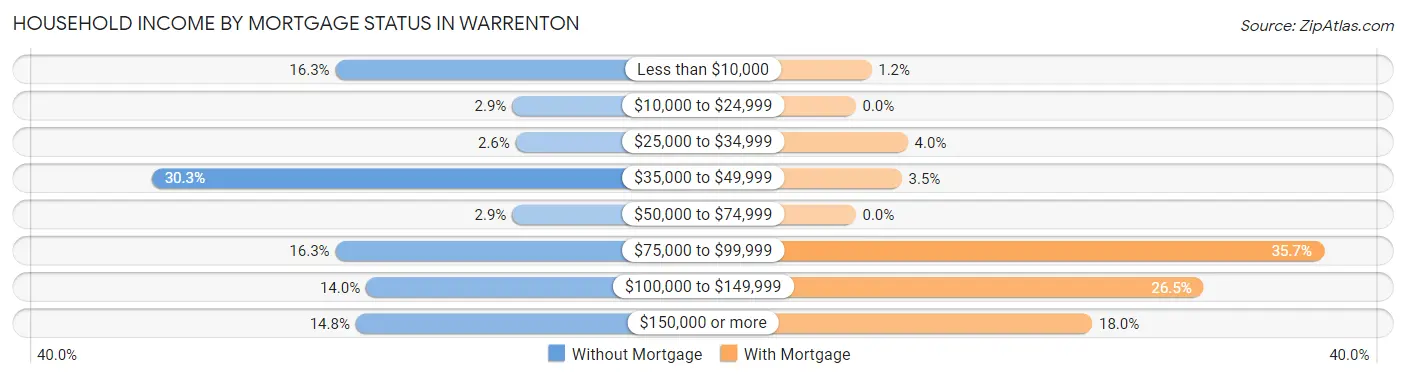
| Household Income | Without Mortgage | With Mortgage |
| Less than $10,000 | 63 (16.3%) | 13 (1.2%) |
| $10,000 to $24,999 | 11 (2.9%) | 0 (0.0%) |
| $25,000 to $34,999 | 10 (2.6%) | 43 (4.0%) |
| $35,000 to $49,999 | 117 (30.3%) | 38 (3.5%) |
| $50,000 to $74,999 | 11 (2.9%) | 0 (0.0%) |
| $75,000 to $99,999 | 63 (16.3%) | 386 (35.7%) |
| $100,000 to $149,999 | 54 (14.0%) | 287 (26.5%) |
| $150,000 or more | 57 (14.8%) | 195 (18.0%) |
| Total | 386 (100.0%) | 1,082 (100.0%) |
Property Value to Household Income Ratio in Warrenton
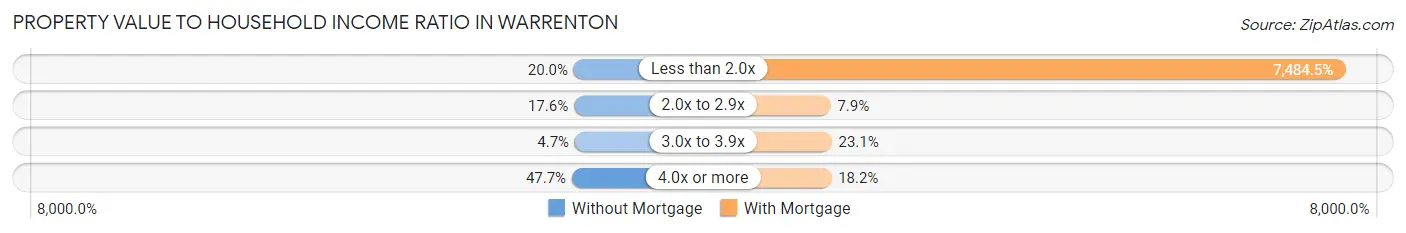
| Value-to-Income Ratio | Without Mortgage | With Mortgage |
| Less than 2.0x | 77 (20.0%) | 80,982 (7,484.5%) |
| 2.0x to 2.9x | 68 (17.6%) | 85 (7.9%) |
| 3.0x to 3.9x | 18 (4.7%) | 250 (23.1%) |
| 4.0x or more | 184 (47.7%) | 197 (18.2%) |
| Total | 386 (100.0%) | 1,082 (100.0%) |
Real Estate Taxes by Mortgage Status in Warrenton
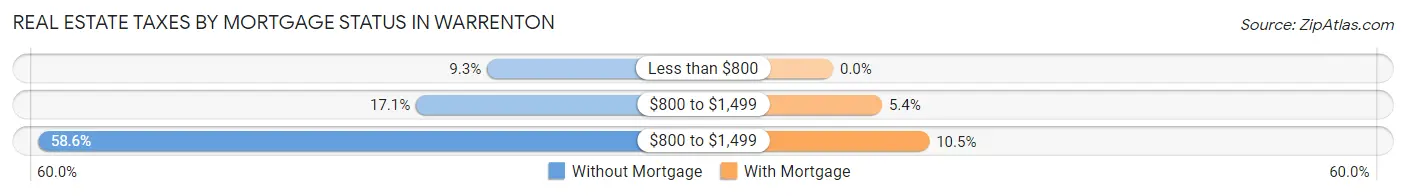
| Property Taxes | Without Mortgage | With Mortgage |
| Less than $800 | 36 (9.3%) | 0 (0.0%) |
| $800 to $1,499 | 66 (17.1%) | 58 (5.4%) |
| $800 to $1,499 | 226 (58.6%) | 114 (10.5%) |
| Total | 386 (100.0%) | 1,082 (100.0%) |
Health & Disability in Warrenton
Health Insurance Coverage by Age in Warrenton
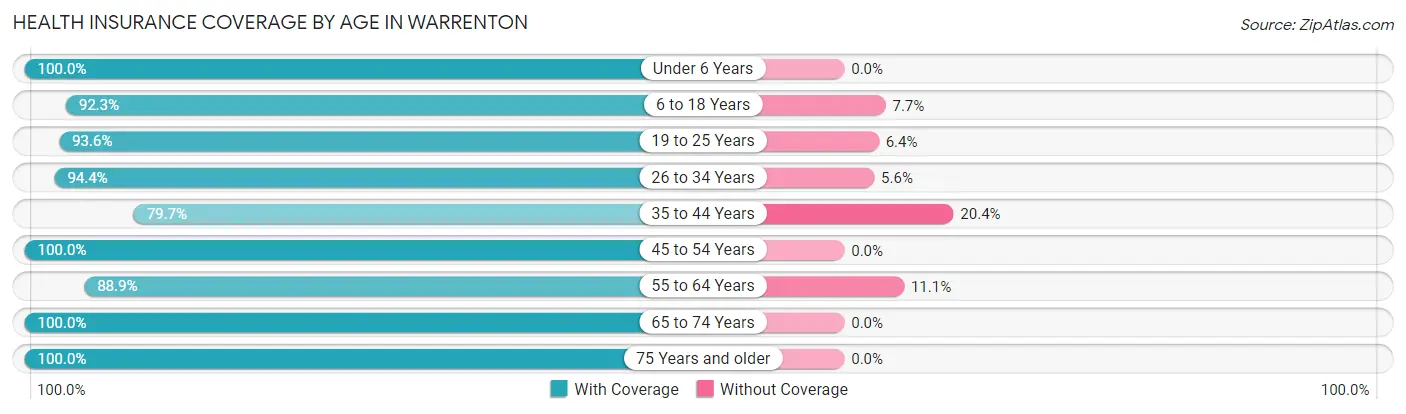
| Age Bracket | With Coverage | Without Coverage |
| Under 6 Years | 366 (100.0%) | 0 (0.0%) |
| 6 to 18 Years | 1,008 (92.3%) | 84 (7.7%) |
| 19 to 25 Years | 437 (93.6%) | 30 (6.4%) |
| 26 to 34 Years | 915 (94.4%) | 54 (5.6%) |
| 35 to 44 Years | 599 (79.6%) | 153 (20.3%) |
| 45 to 54 Years | 549 (100.0%) | 0 (0.0%) |
| 55 to 64 Years | 503 (88.9%) | 63 (11.1%) |
| 65 to 74 Years | 797 (100.0%) | 0 (0.0%) |
| 75 Years and older | 562 (100.0%) | 0 (0.0%) |
| Total | 5,736 (93.7%) | 384 (6.3%) |
Health Insurance Coverage by Citizenship Status in Warrenton
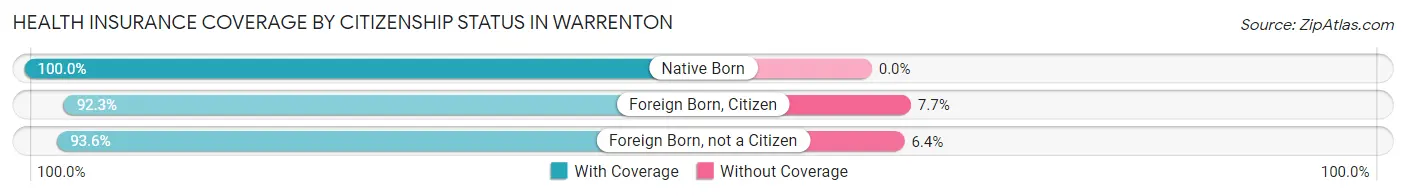
| Citizenship Status | With Coverage | Without Coverage |
| Native Born | 366 (100.0%) | 0 (0.0%) |
| Foreign Born, Citizen | 1,008 (92.3%) | 84 (7.7%) |
| Foreign Born, not a Citizen | 437 (93.6%) | 30 (6.4%) |
Health Insurance Coverage by Household Income in Warrenton
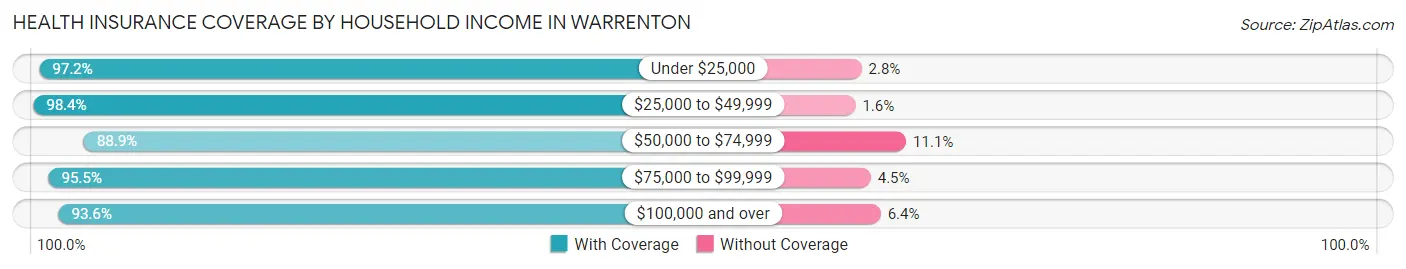
| Household Income | With Coverage | Without Coverage |
| Under $25,000 | 351 (97.2%) | 10 (2.8%) |
| $25,000 to $49,999 | 724 (98.4%) | 12 (1.6%) |
| $50,000 to $74,999 | 1,223 (88.9%) | 153 (11.1%) |
| $75,000 to $99,999 | 1,041 (95.5%) | 49 (4.5%) |
| $100,000 and over | 2,357 (93.6%) | 160 (6.4%) |
Public vs Private Health Insurance Coverage by Age in Warrenton
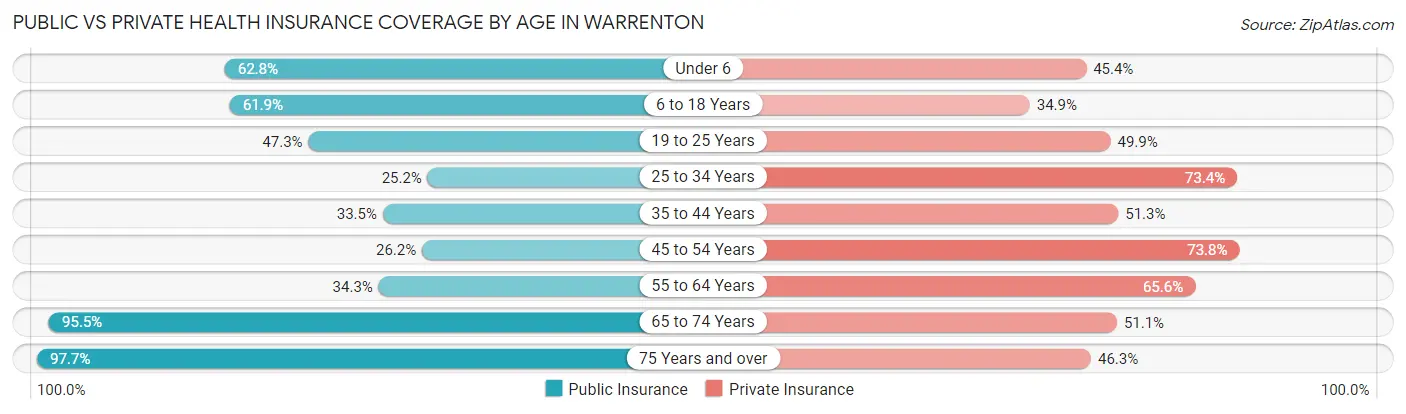
| Age Bracket | Public Insurance | Private Insurance |
| Under 6 | 230 (62.8%) | 166 (45.4%) |
| 6 to 18 Years | 676 (61.9%) | 381 (34.9%) |
| 19 to 25 Years | 221 (47.3%) | 233 (49.9%) |
| 25 to 34 Years | 244 (25.2%) | 711 (73.4%) |
| 35 to 44 Years | 252 (33.5%) | 386 (51.3%) |
| 45 to 54 Years | 144 (26.2%) | 405 (73.8%) |
| 55 to 64 Years | 194 (34.3%) | 371 (65.5%) |
| 65 to 74 Years | 761 (95.5%) | 407 (51.1%) |
| 75 Years and over | 549 (97.7%) | 260 (46.3%) |
| Total | 3,271 (53.4%) | 3,320 (54.2%) |
Disability Status by Sex by Age in Warrenton
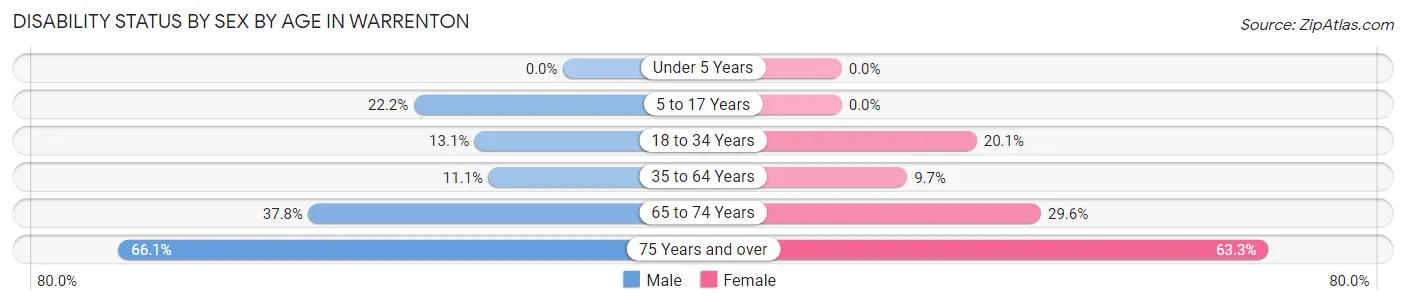
| Age Bracket | Male | Female |
| Under 5 Years | 0 (0.0%) | 0 (0.0%) |
| 5 to 17 Years | 113 (22.2%) | 0 (0.0%) |
| 18 to 34 Years | 87 (13.1%) | 157 (20.1%) |
| 35 to 64 Years | 97 (11.1%) | 96 (9.7%) |
| 65 to 74 Years | 116 (37.8%) | 145 (29.6%) |
| 75 Years and over | 220 (66.1%) | 145 (63.3%) |
Disability Class by Sex by Age in Warrenton
Disability Class: Hearing Difficulty
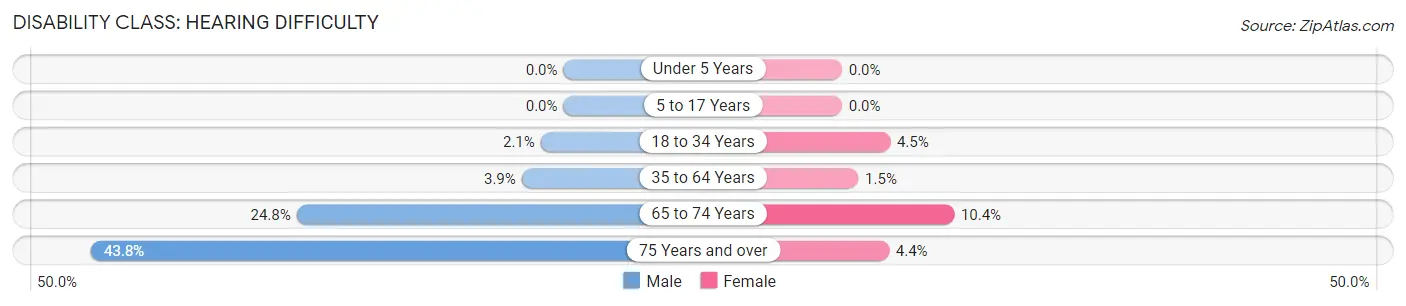
| Age Bracket | Male | Female |
| Under 5 Years | 0 (0.0%) | 0 (0.0%) |
| 5 to 17 Years | 0 (0.0%) | 0 (0.0%) |
| 18 to 34 Years | 14 (2.1%) | 35 (4.5%) |
| 35 to 64 Years | 34 (3.9%) | 15 (1.5%) |
| 65 to 74 Years | 76 (24.8%) | 51 (10.4%) |
| 75 Years and over | 146 (43.8%) | 10 (4.4%) |
Disability Class: Vision Difficulty
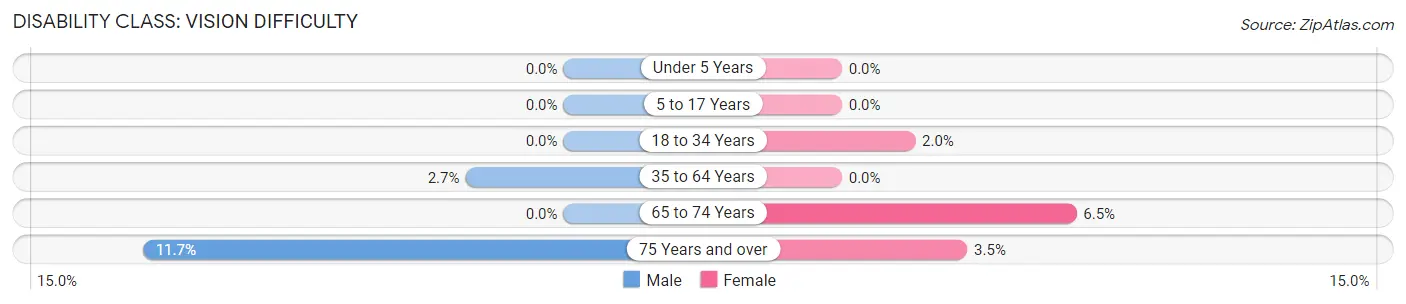
| Age Bracket | Male | Female |
| Under 5 Years | 0 (0.0%) | 0 (0.0%) |
| 5 to 17 Years | 0 (0.0%) | 0 (0.0%) |
| 18 to 34 Years | 0 (0.0%) | 16 (2.0%) |
| 35 to 64 Years | 24 (2.7%) | 0 (0.0%) |
| 65 to 74 Years | 0 (0.0%) | 32 (6.5%) |
| 75 Years and over | 39 (11.7%) | 8 (3.5%) |
Disability Class: Cognitive Difficulty
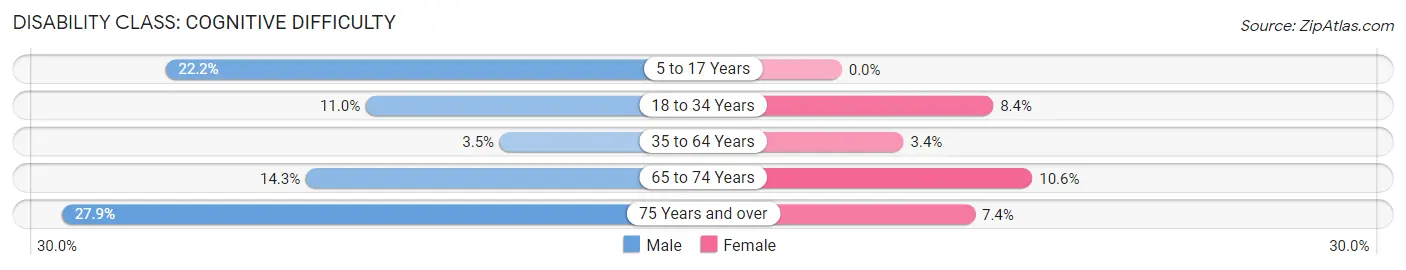
| Age Bracket | Male | Female |
| 5 to 17 Years | 113 (22.2%) | 0 (0.0%) |
| 18 to 34 Years | 73 (11.0%) | 66 (8.4%) |
| 35 to 64 Years | 31 (3.5%) | 34 (3.4%) |
| 65 to 74 Years | 44 (14.3%) | 52 (10.6%) |
| 75 Years and over | 93 (27.9%) | 17 (7.4%) |
Disability Class: Ambulatory Difficulty
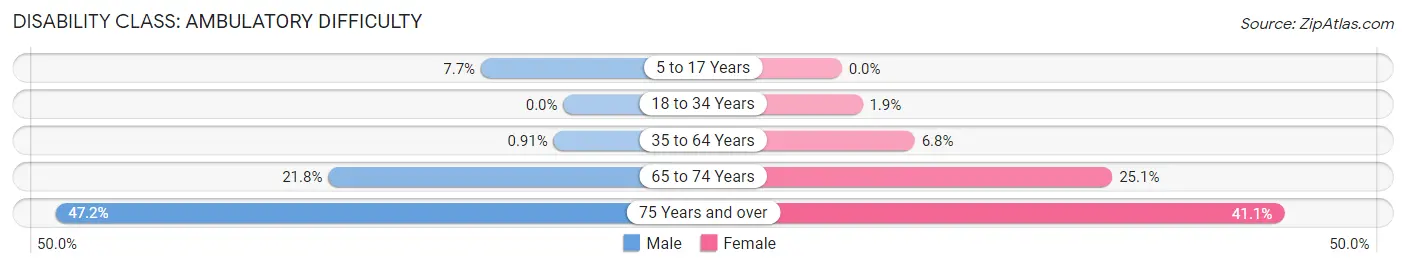
| Age Bracket | Male | Female |
| 5 to 17 Years | 39 (7.6%) | 0 (0.0%) |
| 18 to 34 Years | 0 (0.0%) | 15 (1.9%) |
| 35 to 64 Years | 8 (0.9%) | 67 (6.8%) |
| 65 to 74 Years | 67 (21.8%) | 123 (25.1%) |
| 75 Years and over | 157 (47.1%) | 94 (41.0%) |
Disability Class: Self-Care Difficulty
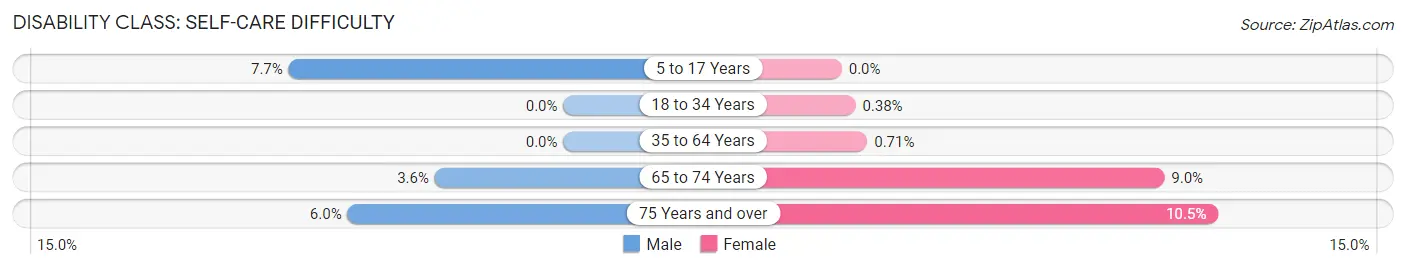
| Age Bracket | Male | Female |
| 5 to 17 Years | 39 (7.6%) | 0 (0.0%) |
| 18 to 34 Years | 0 (0.0%) | 3 (0.4%) |
| 35 to 64 Years | 0 (0.0%) | 7 (0.7%) |
| 65 to 74 Years | 11 (3.6%) | 44 (9.0%) |
| 75 Years and over | 20 (6.0%) | 24 (10.5%) |
Technology Access in Warrenton
Computing Device Access in Warrenton
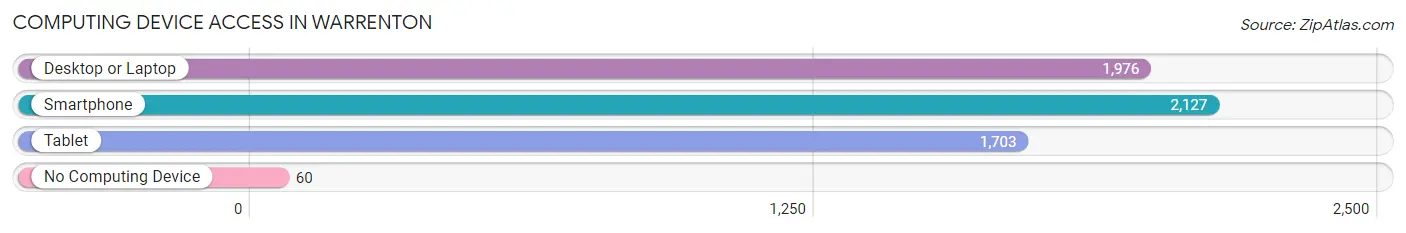
| Device Type | # Households | % Households |
| Desktop or Laptop | 1,976 | 83.5% |
| Smartphone | 2,127 | 89.8% |
| Tablet | 1,703 | 71.9% |
| No Computing Device | 60 | 2.5% |
| Total | 2,368 | 100.0% |
Internet Access in Warrenton
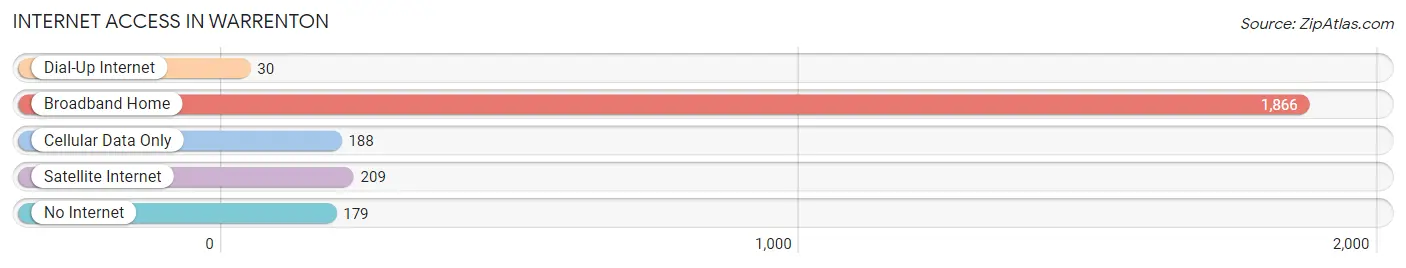
| Internet Type | # Households | % Households |
| Dial-Up Internet | 30 | 1.3% |
| Broadband Home | 1,866 | 78.8% |
| Cellular Data Only | 188 | 7.9% |
| Satellite Internet | 209 | 8.8% |
| No Internet | 179 | 7.6% |
| Total | 2,368 | 100.0% |
Warrenton Summary
Warrenton is a city located in Clatsop County, Oregon, United States. It is situated on the Columbia River, just south of Astoria, and is part of the Astoria-Warrenton-Seaside metropolitan area. The population was 4,989 at the 2010 census.
History
The area that is now Warrenton was first inhabited by the Clatsop people, a tribe of the Chinookan-speaking people. The first European settlers arrived in the area in 1851, and the town was officially founded in 1853. The town was named after D.K. Warren, an early settler.
In the late 19th century, Warrenton was a major port for the lumber industry, and the town grew rapidly. In the early 20th century, the town was a popular tourist destination, and the town's economy shifted to focus on tourism.
Geography
Warrenton is located at the mouth of the Columbia River, just south of Astoria. The city has a total area of 4.2 square miles, all of which is land. The city is located in a temperate rainforest climate, with mild temperatures year-round.
Economy
The economy of Warrenton is largely based on tourism and fishing. The city is home to several seafood processing plants, and the fishing industry is a major employer in the area. The city is also home to several retail stores, restaurants, and other businesses.
Demographics
As of the 2010 census, the population of Warrenton was 4,989. The racial makeup of the city was 90.2% White, 0.7% African American, 1.2% Native American, 1.2% Asian, 0.2% Pacific Islander, 2.3% from other races, and 4.2% from two or more races. Hispanic or Latino of any race were 6.2% of the population.
The median income for a household in Warrenton was $41,944, and the median income for a family was $50,917. The per capita income for the city was $20,945. About 11.2% of families and 14.2% of the population were below the poverty line, including 19.2% of those under age 18 and 8.3% of those age 65 or over.
Common Questions
What is the Total Population of Warrenton?
Total Population of Warrenton is 6,254.
What is the Total Male Population of Warrenton?
Total Male Population of Warrenton is 2,938.
What is the Total Female Population of Warrenton?
Total Female Population of Warrenton is 3,316.
What is the Ratio of Males per 100 Females in Warrenton?
There are 88.60 Males per 100 Females in Warrenton.
What is the Ratio of Females per 100 Males in Warrenton?
There are 112.87 Females per 100 Males in Warrenton.
What is the Median Population Age in Warrenton?
Median Population Age in Warrenton is 37.5 Years.
What is the Average Family Size in Warrenton
Average Family Size in Warrenton is 3.2 People.
What is the Average Household Size in Warrenton
Average Household Size in Warrenton is 2.6 People.
What is Per Capita Income in Warrenton?
Per Capita income in Warrenton is $31,413.
What is the Median Family Income in Warrenton?
Median Family Income in Warrenton is $78,714.
What is the Median Household income in Warrenton?
Median Household Income in Warrenton is $69,400.
What is Income or Wage Gap in Warrenton?
Income or Wage Gap in Warrenton is 22.8%.
Women in Warrenton earn 77.2 cents for every dollar earned by a man.
What is Inequality or Gini Index in Warrenton?
Inequality or Gini Index in Warrenton is 0.36.
How Large is the Labor Force in Warrenton?
There are 2,880 People in the Labor Forcein in Warrenton.
What is the Percentage of People in the Labor Force in Warrenton?
58.0% of People are in the Labor Force in Warrenton.
What is the Unemployment Rate in Warrenton?
Unemployment Rate in Warrenton is 4.8%.