Millersburg, OR
Millersburg Map
Millersburg Overview
2,964
TOTAL POPULATION
1,460
MALE POPULATION
1,504
FEMALE POPULATION
97.07
MALES / 100 FEMALES
103.01
FEMALES / 100 MALES
40.0
MEDIAN AGE
3.1
AVG FAMILY SIZE
2.8
AVG HOUSEHOLD SIZE
$45,425
PER CAPITA INCOME
$131,513
AVG FAMILY INCOME
$119,148
AVG HOUSEHOLD INCOME
44.6%
WAGE / INCOME GAP [ % ]
55.4¢/ $1
WAGE / INCOME GAP [ $ ]
0.35
INEQUALITY / GINI INDEX
1,514
LABOR FORCE [ PEOPLE ]
70.4%
PERCENT IN LABOR FORCE
2.9%
UNEMPLOYMENT RATE
Millersburg Area Codes
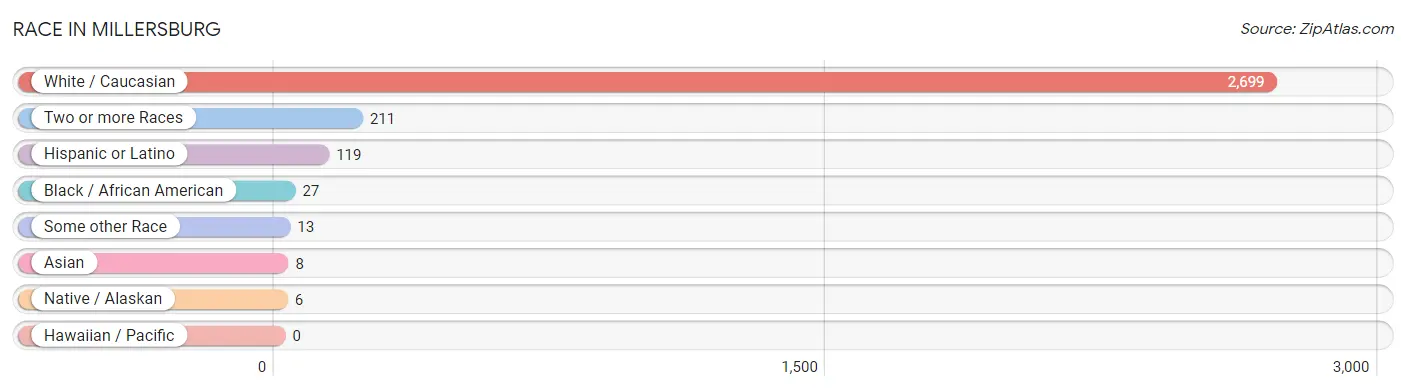
Race in Millersburg
The most populous races in Millersburg are White / Caucasian (2,699 | 91.1%), Two or more Races (211 | 7.1%), and Hispanic or Latino (119 | 4.0%).
| Race | # Population | % Population |
| Asian | 8 | 0.3% |
| Black / African American | 27 | 0.9% |
| Hawaiian / Pacific | 0 | 0.0% |
| Hispanic or Latino | 119 | 4.0% |
| Native / Alaskan | 6 | 0.2% |
| White / Caucasian | 2,699 | 91.1% |
| Two or more Races | 211 | 7.1% |
| Some other Race | 13 | 0.4% |
| Total | 2,964 | 100.0% |
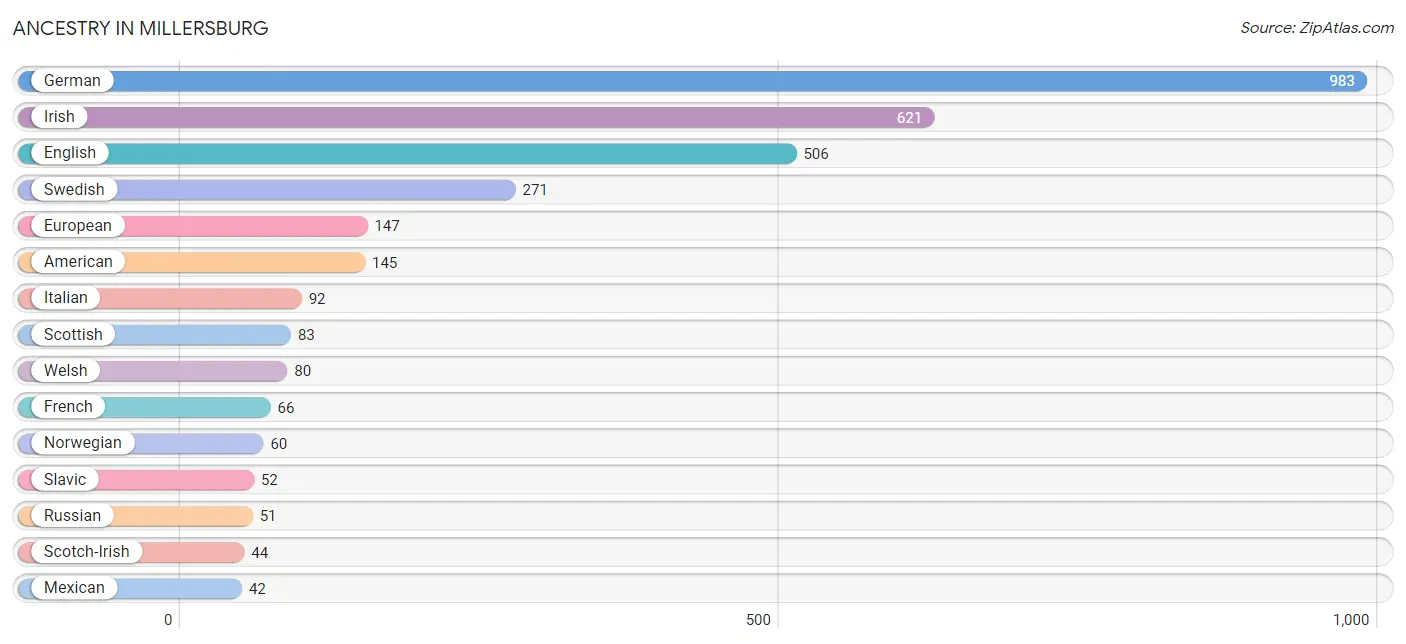
Ancestry in Millersburg
The most populous ancestries reported in Millersburg are German (983 | 33.2%), Irish (621 | 20.9%), English (506 | 17.1%), Swedish (271 | 9.1%), and European (147 | 5.0%), together accounting for 85.3% of all Millersburg residents.
| Ancestry | # Population | % Population |
| American | 145 | 4.9% |
| Arab | 14 | 0.5% |
| Austrian | 3 | 0.1% |
| Blackfeet | 19 | 0.6% |
| British | 9 | 0.3% |
| Burmese | 15 | 0.5% |
| Central American | 35 | 1.2% |
| Cherokee | 27 | 0.9% |
| Chippewa | 5 | 0.2% |
| Czech | 3 | 0.1% |
| Czechoslovakian | 2 | 0.1% |
| Danish | 40 | 1.3% |
| Dutch | 24 | 0.8% |
| Eastern European | 17 | 0.6% |
| Egyptian | 14 | 0.5% |
| English | 506 | 17.1% |
| European | 147 | 5.0% |
| Finnish | 3 | 0.1% |
| French | 66 | 2.2% |
| French American Indian | 2 | 0.1% |
| French Canadian | 10 | 0.3% |
| German | 983 | 33.2% |
| Greek | 14 | 0.5% |
| Haitian | 13 | 0.4% |
| Hungarian | 11 | 0.4% |
| Indian (Asian) | 7 | 0.2% |
| Irish | 621 | 20.9% |
| Italian | 92 | 3.1% |
| Korean | 5 | 0.2% |
| Mexican | 42 | 1.4% |
| Native Hawaiian | 5 | 0.2% |
| Nicaraguan | 35 | 1.2% |
| Northern European | 6 | 0.2% |
| Norwegian | 60 | 2.0% |
| Polish | 24 | 0.8% |
| Portuguese | 11 | 0.4% |
| Russian | 51 | 1.7% |
| Scandinavian | 4 | 0.1% |
| Scotch-Irish | 44 | 1.5% |
| Scottish | 83 | 2.8% |
| Sioux | 37 | 1.3% |
| Slavic | 52 | 1.8% |
| Spaniard | 42 | 1.4% |
| Sri Lankan | 5 | 0.2% |
| Subsaharan African | 12 | 0.4% |
| Swedish | 271 | 9.1% |
| Swiss | 18 | 0.6% |
| Thai | 5 | 0.2% |
| Tlingit-Haida | 1 | 0.0% |
| Ugandan | 12 | 0.4% |
| Ukrainian | 10 | 0.3% |
| Welsh | 80 | 2.7% | View All 52 Rows |
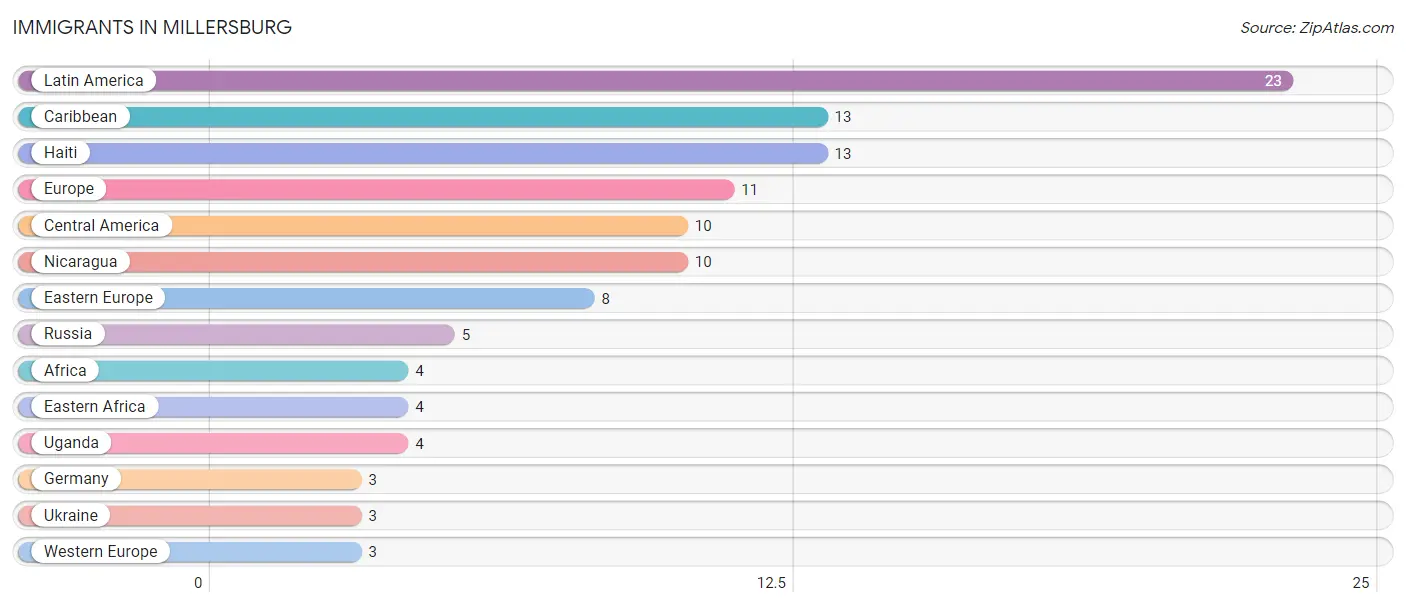
Immigrants in Millersburg
The most numerous immigrant groups reported in Millersburg came from Latin America (23 | 0.8%), Caribbean (13 | 0.4%), Haiti (13 | 0.4%), Europe (11 | 0.4%), and Central America (10 | 0.3%), together accounting for 2.4% of all Millersburg residents.
| Immigration Origin | # Population | % Population |
| Africa | 4 | 0.1% |
| Caribbean | 13 | 0.4% |
| Central America | 10 | 0.3% |
| Eastern Africa | 4 | 0.1% |
| Eastern Europe | 8 | 0.3% |
| Europe | 11 | 0.4% |
| Germany | 3 | 0.1% |
| Haiti | 13 | 0.4% |
| Latin America | 23 | 0.8% |
| Nicaragua | 10 | 0.3% |
| Russia | 5 | 0.2% |
| Uganda | 4 | 0.1% |
| Ukraine | 3 | 0.1% |
| Western Europe | 3 | 0.1% | View All 14 Rows |
Sex and Age in Millersburg
Sex and Age in Millersburg
The most populous age groups in Millersburg are 5 to 9 Years (151 | 10.3%) for men and 35 to 39 Years (180 | 12.0%) for women.
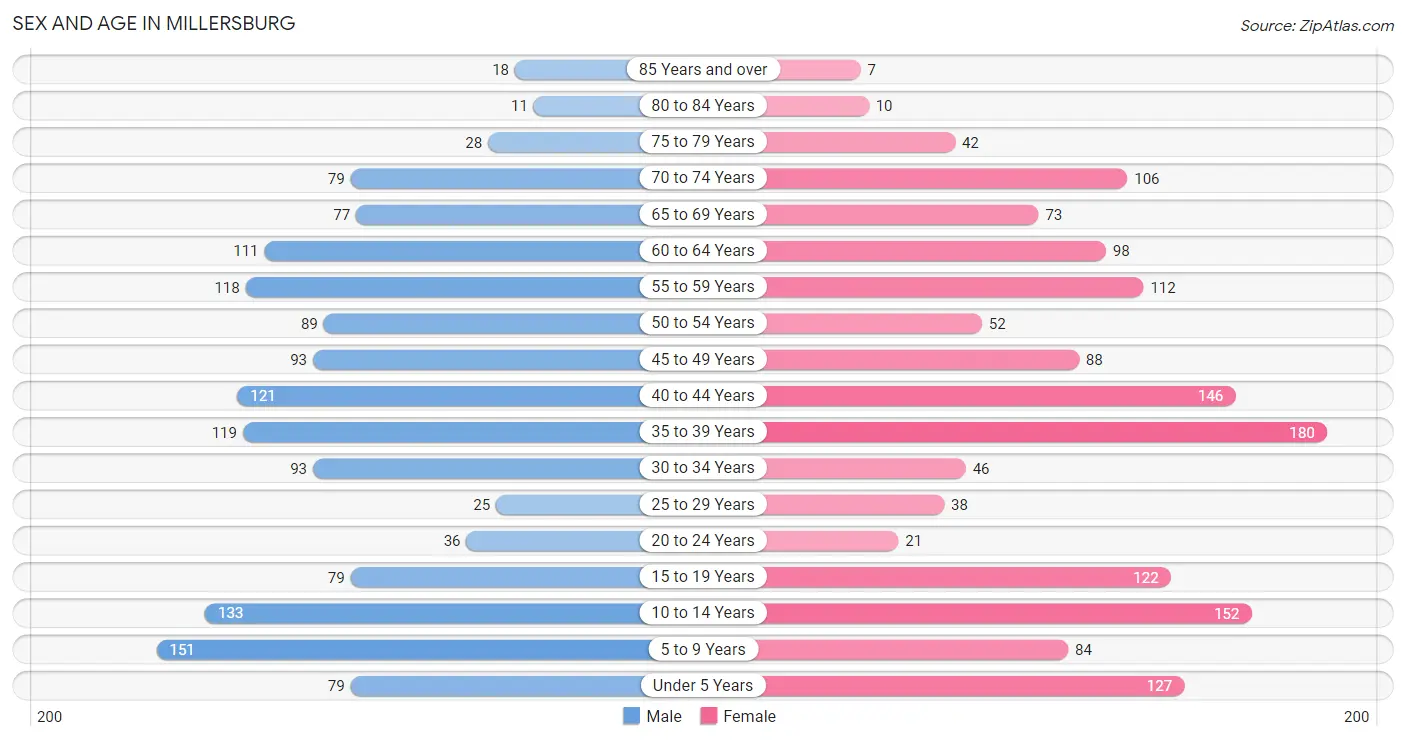
| Age Bracket | Male | Female |
| Under 5 Years | 79 (5.4%) | 127 (8.4%) |
| 5 to 9 Years | 151 (10.3%) | 84 (5.6%) |
| 10 to 14 Years | 133 (9.1%) | 152 (10.1%) |
| 15 to 19 Years | 79 (5.4%) | 122 (8.1%) |
| 20 to 24 Years | 36 (2.5%) | 21 (1.4%) |
| 25 to 29 Years | 25 (1.7%) | 38 (2.5%) |
| 30 to 34 Years | 93 (6.4%) | 46 (3.1%) |
| 35 to 39 Years | 119 (8.2%) | 180 (12.0%) |
| 40 to 44 Years | 121 (8.3%) | 146 (9.7%) |
| 45 to 49 Years | 93 (6.4%) | 88 (5.9%) |
| 50 to 54 Years | 89 (6.1%) | 52 (3.5%) |
| 55 to 59 Years | 118 (8.1%) | 112 (7.4%) |
| 60 to 64 Years | 111 (7.6%) | 98 (6.5%) |
| 65 to 69 Years | 77 (5.3%) | 73 (4.9%) |
| 70 to 74 Years | 79 (5.4%) | 106 (7.0%) |
| 75 to 79 Years | 28 (1.9%) | 42 (2.8%) |
| 80 to 84 Years | 11 (0.7%) | 10 (0.7%) |
| 85 Years and over | 18 (1.2%) | 7 (0.5%) |
| Total | 1,460 (100.0%) | 1,504 (100.0%) |
Families and Households in Millersburg
Median Family Size in Millersburg
The median family size in Millersburg is 3.10 persons per family, with married-couple families (810 | 92.8%) accounting for the largest median family size of 3.15 persons per family. On the other hand, single male/father families (25 | 2.9%) represent the smallest median family size with 2.40 persons per family.
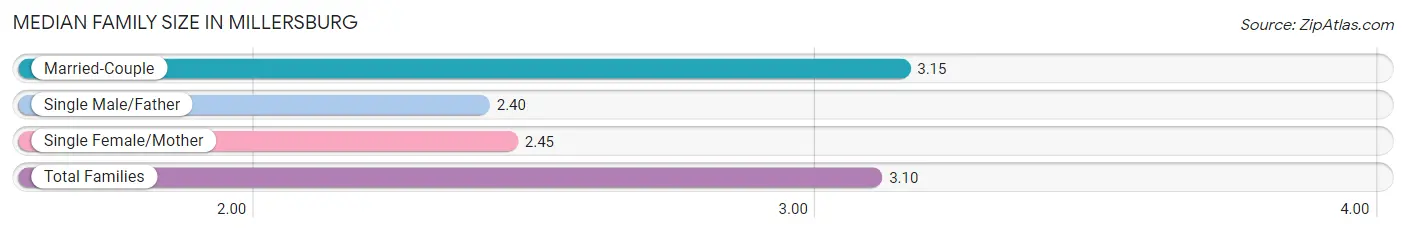
| Family Type | # Families | Family Size |
| Married-Couple | 810 (92.8%) | 3.15 |
| Single Male/Father | 25 (2.9%) | 2.40 |
| Single Female/Mother | 38 (4.3%) | 2.45 |
| Total Families | 873 (100.0%) | 3.10 |
Median Household Size in Millersburg
The median household size in Millersburg is 2.80 persons per household, with married-couple households (810 | 76.5%) accounting for the largest median household size of 3.15 persons per household. non-family households (186 | 17.6%) represent the smallest median household size with 1.29 persons per household.
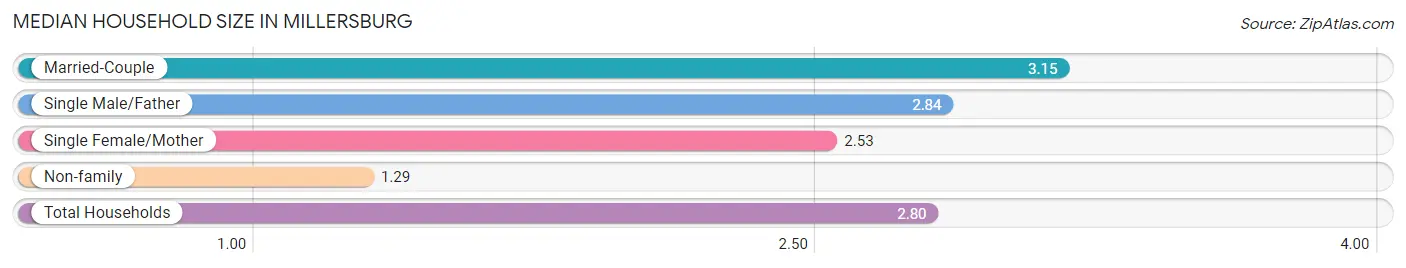
| Household Type | # Households | Household Size |
| Married-Couple | 810 (76.5%) | 3.15 |
| Single Male/Father | 25 (2.4%) | 2.84 |
| Single Female/Mother | 38 (3.6%) | 2.53 |
| Non-family | 186 (17.6%) | 1.29 |
| Total Households | 1,059 (100.0%) | 2.80 |
Household Size by Marriage Status in Millersburg
Out of a total of 1,059 households in Millersburg, 873 (82.4%) are family households, while 186 (17.6%) are nonfamily households. The most numerous type of family households are 2-person households, comprising 423, and the most common type of nonfamily households are 1-person households, comprising 122.
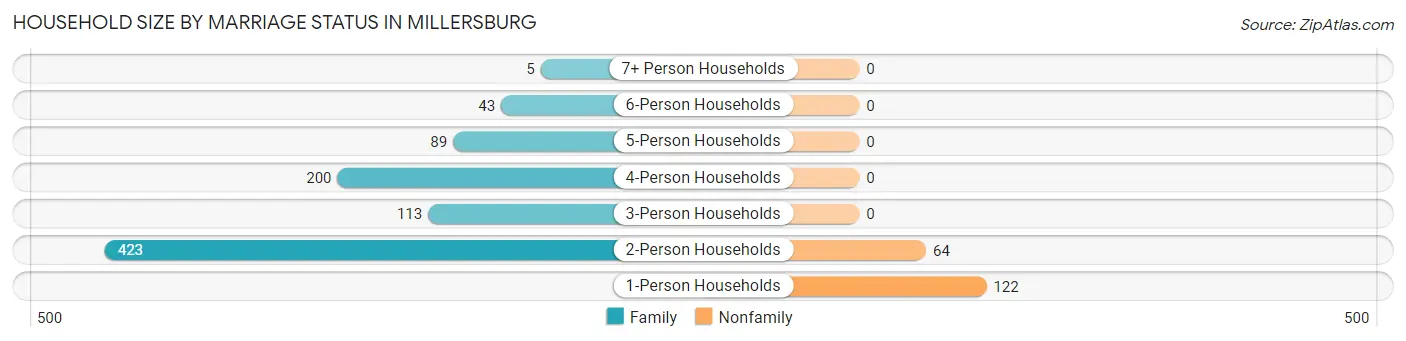
| Household Size | Family Households | Nonfamily Households |
| 1-Person Households | - | 122 (11.5%) |
| 2-Person Households | 423 (39.9%) | 64 (6.0%) |
| 3-Person Households | 113 (10.7%) | 0 (0.0%) |
| 4-Person Households | 200 (18.9%) | 0 (0.0%) |
| 5-Person Households | 89 (8.4%) | 0 (0.0%) |
| 6-Person Households | 43 (4.1%) | 0 (0.0%) |
| 7+ Person Households | 5 (0.5%) | 0 (0.0%) |
| Total | 873 (82.4%) | 186 (17.6%) |
Female Fertility in Millersburg
Fertility by Age in Millersburg
Average fertility rate in Millersburg is 50.0 births per 1,000 women. Women in the age bracket of 20 to 34 years have the highest fertility rate with 171.0 births per 1,000 women. Women in the age bracket of 20 to 34 years acount for 56.2% of all women with births.
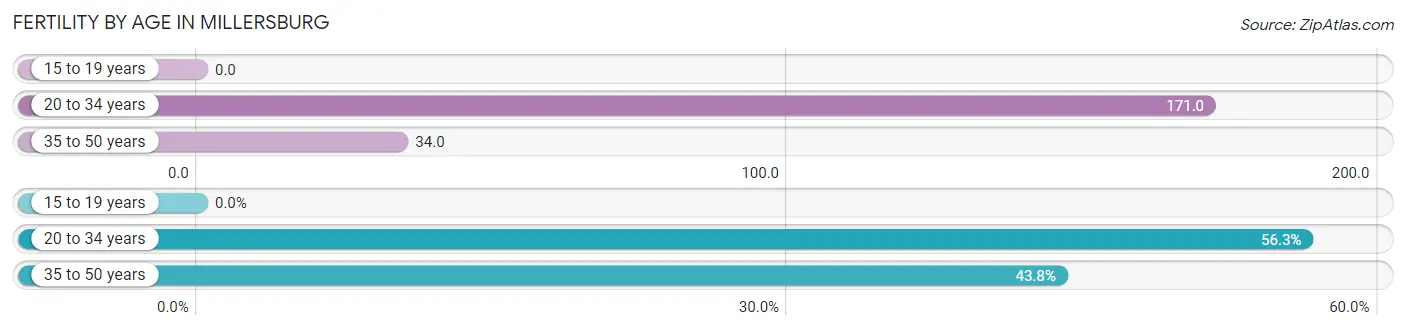
| Age Bracket | Women with Births | Births / 1,000 Women |
| 15 to 19 years | 0 (0.0%) | 0.0 |
| 20 to 34 years | 18 (56.2%) | 171.0 |
| 35 to 50 years | 14 (43.8%) | 34.0 |
| Total | 32 (100.0%) | 50.0 |
Fertility by Age by Marriage Status in Millersburg
90.6% of women with births (32) in Millersburg are married. The highest percentage of unmarried women with births falls into 20 to 34 years age bracket with 16.7% of them unmarried at the time of birth, while the lowest percentage of unmarried women with births belong to 35 to 50 years age bracket with 0.0% of them unmarried.
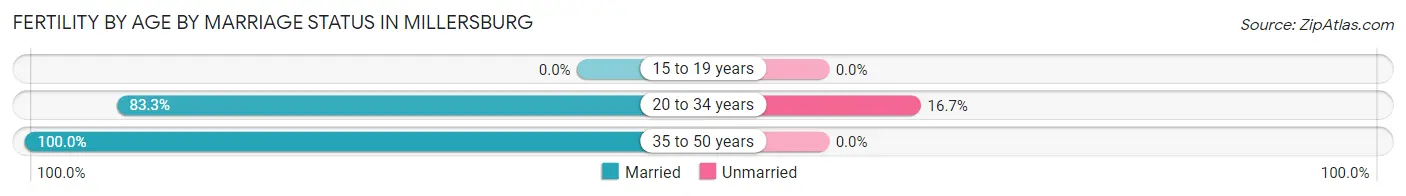
| Age Bracket | Married | Unmarried |
| 15 to 19 years | 0 (0.0%) | 0 (0.0%) |
| 20 to 34 years | 15 (83.3%) | 3 (16.7%) |
| 35 to 50 years | 14 (100.0%) | 0 (0.0%) |
| Total | 29 (90.6%) | 3 (9.4%) |
Fertility by Education in Millersburg
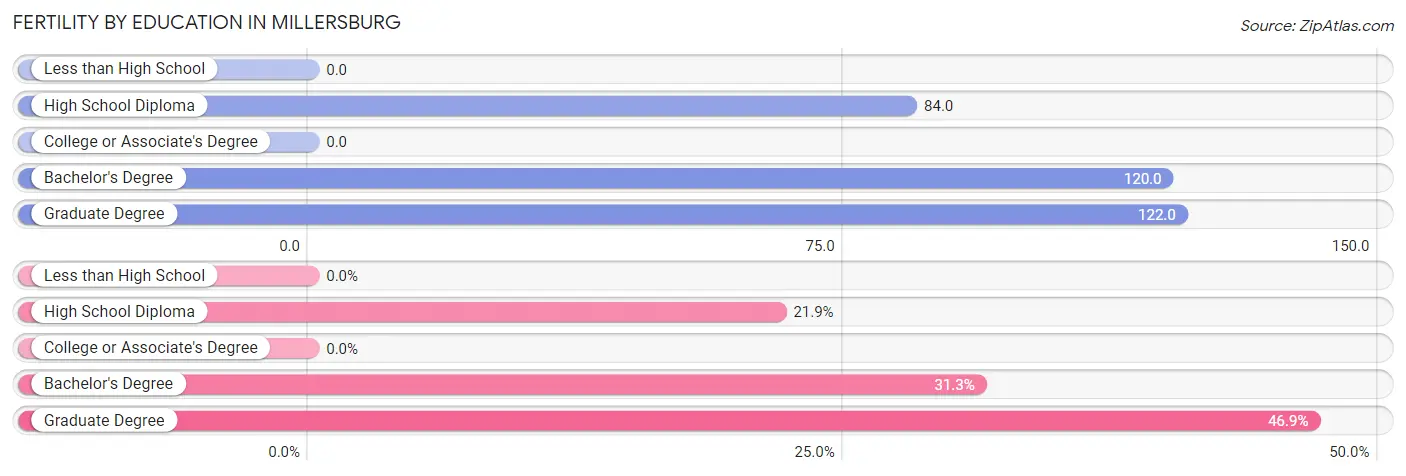
| Educational Attainment | Women with Births | Births / 1,000 Women |
| Less than High School | 0 (0.0%) | 0.0 |
| High School Diploma | 7 (21.9%) | 84.0 |
| College or Associate's Degree | 0 (0.0%) | 0.0 |
| Bachelor's Degree | 10 (31.2%) | 120.0 |
| Graduate Degree | 15 (46.9%) | 122.0 |
| Total | 32 (100.0%) | 50.0 |
Fertility by Education by Marriage Status in Millersburg
9.4% of women with births in Millersburg are unmarried. Women with the educational attainment of bachelor's degree are most likely to be married with 100.0% of them married at childbirth, while women with the educational attainment of high school diploma are least likely to be married with 42.9% of them unmarried at childbirth.

| Educational Attainment | Married | Unmarried |
| Less than High School | 0 (0.0%) | 0 (0.0%) |
| High School Diploma | 4 (57.1%) | 3 (42.9%) |
| College or Associate's Degree | 0 (0.0%) | 0 (0.0%) |
| Bachelor's Degree | 10 (100.0%) | 0 (0.0%) |
| Graduate Degree | 15 (100.0%) | 0 (0.0%) |
| Total | 29 (90.6%) | 3 (9.4%) |
Income in Millersburg
Income Overview in Millersburg
Per Capita Income in Millersburg is $45,425, while median incomes of families and households are $131,513 and $119,148 respectively.
| Characteristic | Number | Measure |
| Per Capita Income | 2,964 | $45,425 |
| Median Family Income | 873 | $131,513 |
| Mean Family Income | 873 | $139,587 |
| Median Household Income | 1,059 | $119,148 |
| Mean Household Income | 1,059 | $128,500 |
| Income Deficit | 873 | $0 |
| Wage / Income Gap (%) | 2,964 | 44.59% |
| Wage / Income Gap ($) | 2,964 | 55.41¢ per $1 |
| Gini / Inequality Index | 2,964 | 0.35 |
Earnings by Sex in Millersburg
Average Earnings in Millersburg are $64,534, $78,700 for men and $43,606 for women, a difference of 44.6%.
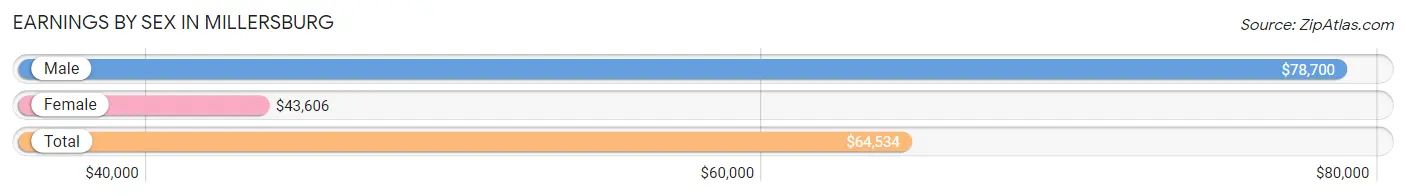
| Sex | Number | Average Earnings |
| Male | 846 (53.0%) | $78,700 |
| Female | 751 (47.0%) | $43,606 |
| Total | 1,597 (100.0%) | $64,534 |
Earnings by Sex by Income Bracket in Millersburg
The most common earnings brackets in Millersburg are $75,000 to $99,999 for men (267 | 31.6%) and $65,000 to $74,999 for women (91 | 12.1%).
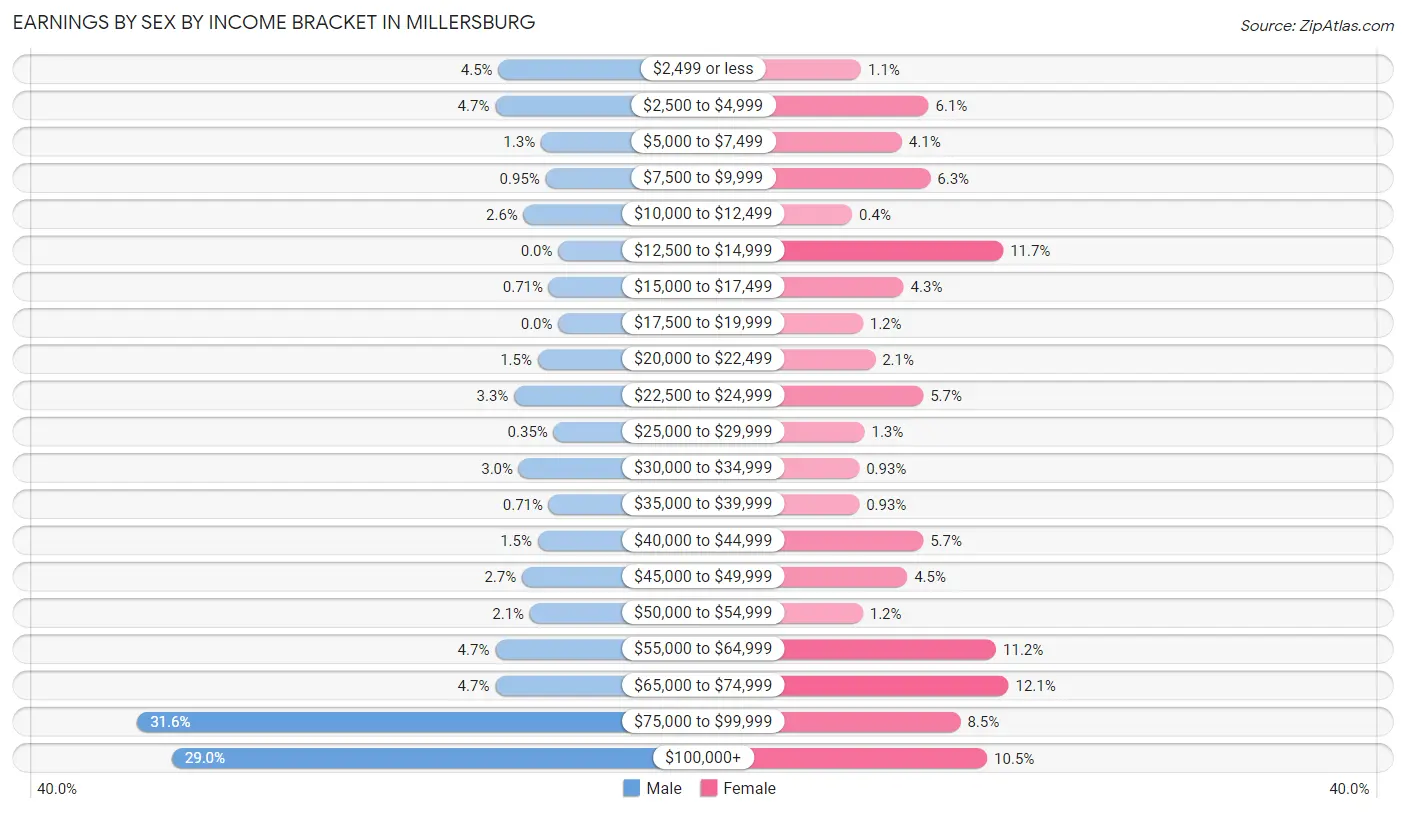
| Income | Male | Female |
| $2,499 or less | 38 (4.5%) | 8 (1.1%) |
| $2,500 to $4,999 | 40 (4.7%) | 46 (6.1%) |
| $5,000 to $7,499 | 11 (1.3%) | 31 (4.1%) |
| $7,500 to $9,999 | 8 (0.9%) | 47 (6.3%) |
| $10,000 to $12,499 | 22 (2.6%) | 3 (0.4%) |
| $12,500 to $14,999 | 0 (0.0%) | 88 (11.7%) |
| $15,000 to $17,499 | 6 (0.7%) | 32 (4.3%) |
| $17,500 to $19,999 | 0 (0.0%) | 9 (1.2%) |
| $20,000 to $22,499 | 13 (1.5%) | 16 (2.1%) |
| $22,500 to $24,999 | 28 (3.3%) | 43 (5.7%) |
| $25,000 to $29,999 | 3 (0.4%) | 10 (1.3%) |
| $30,000 to $34,999 | 25 (3.0%) | 7 (0.9%) |
| $35,000 to $39,999 | 6 (0.7%) | 7 (0.9%) |
| $40,000 to $44,999 | 13 (1.5%) | 43 (5.7%) |
| $45,000 to $49,999 | 23 (2.7%) | 34 (4.5%) |
| $50,000 to $54,999 | 18 (2.1%) | 9 (1.2%) |
| $55,000 to $64,999 | 40 (4.7%) | 84 (11.2%) |
| $65,000 to $74,999 | 40 (4.7%) | 91 (12.1%) |
| $75,000 to $99,999 | 267 (31.6%) | 64 (8.5%) |
| $100,000+ | 245 (29.0%) | 79 (10.5%) |
| Total | 846 (100.0%) | 751 (100.0%) |
Earnings by Sex by Educational Attainment in Millersburg
Average earnings in Millersburg are $83,194 for men and $46,304 for women, a difference of 44.3%. Men with an educational attainment of college or associate's degree enjoy the highest average annual earnings of $95,519, while those with high school diploma education earn the least with $55,446. Women with an educational attainment of high school diploma earn the most with the average annual earnings of $67,868, while those with college or associate's degree education have the smallest earnings of $21,500.
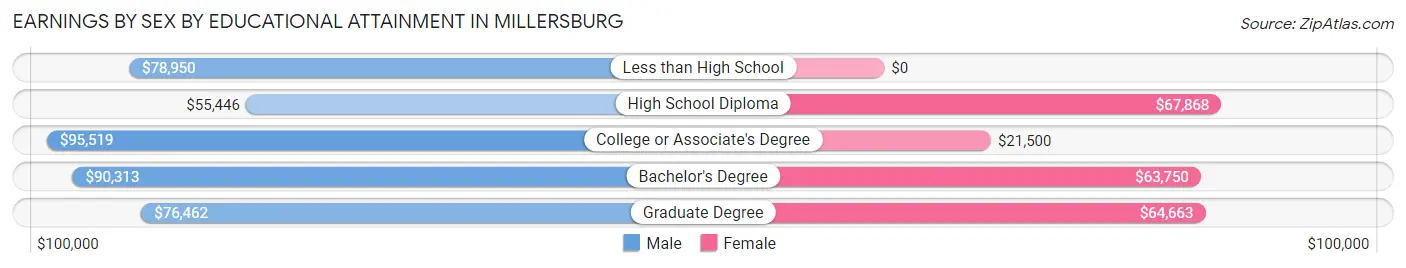
| Educational Attainment | Male Income | Female Income |
| Less than High School | $78,950 | $0 |
| High School Diploma | $55,446 | $67,868 |
| College or Associate's Degree | $95,519 | $21,500 |
| Bachelor's Degree | $90,313 | $63,750 |
| Graduate Degree | $76,462 | $64,663 |
| Total | $83,194 | $46,304 |
Family Income in Millersburg
Family Income Brackets in Millersburg
According to the Millersburg family income data, there are 285 families falling into the $100,000 to $149,999 income range, which is the most common income bracket and makes up 32.7% of all families. Conversely, the less than $10,000 income bracket is the least frequent group with only 2 families (0.2%) belonging to this category.
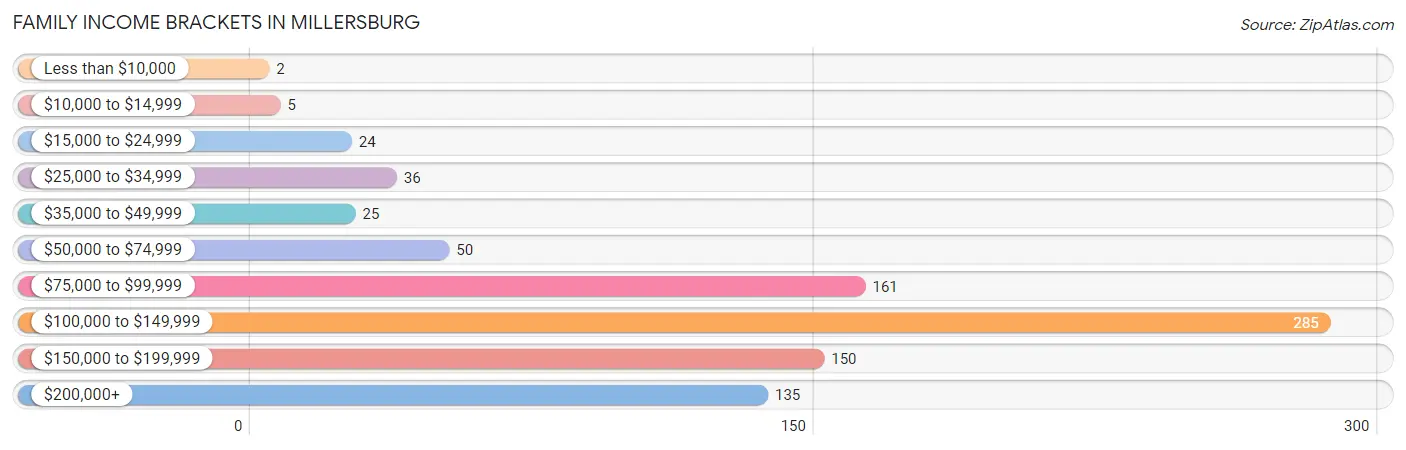
| Income Bracket | # Families | % Families |
| Less than $10,000 | 2 | 0.2% |
| $10,000 to $14,999 | 5 | 0.6% |
| $15,000 to $24,999 | 24 | 2.7% |
| $25,000 to $34,999 | 36 | 4.1% |
| $35,000 to $49,999 | 25 | 2.9% |
| $50,000 to $74,999 | 50 | 5.7% |
| $75,000 to $99,999 | 161 | 18.4% |
| $100,000 to $149,999 | 285 | 32.6% |
| $150,000 to $199,999 | 150 | 17.2% |
| $200,000+ | 135 | 15.5% |
Family Income by Famaliy Size in Millersburg
4-person families (195 | 22.3%) account for the highest median family income in Millersburg with $142,047 per family, while 2-person families (434 | 49.7%) have the highest median income of $59,102 per family member.
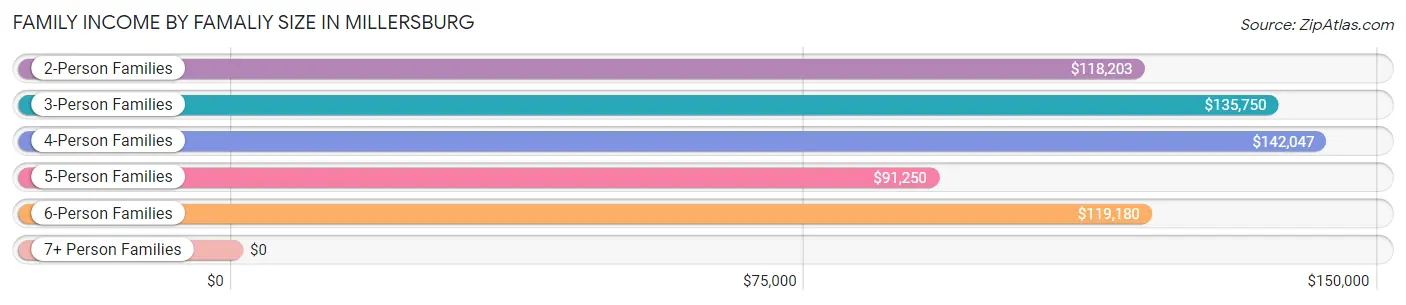
| Income Bracket | # Families | Median Income |
| 2-Person Families | 434 (49.7%) | $118,203 |
| 3-Person Families | 107 (12.3%) | $135,750 |
| 4-Person Families | 195 (22.3%) | $142,047 |
| 5-Person Families | 89 (10.2%) | $91,250 |
| 6-Person Families | 43 (4.9%) | $119,180 |
| 7+ Person Families | 5 (0.6%) | $0 |
| Total | 873 (100.0%) | $131,513 |
Family Income by Number of Earners in Millersburg
The median family income in Millersburg is $131,513, with families comprising 2 earners (471) having the highest median family income of $144,830, while families with no earners (96) have the lowest median family income of $83,409, accounting for 53.9% and 11.0% of families, respectively.
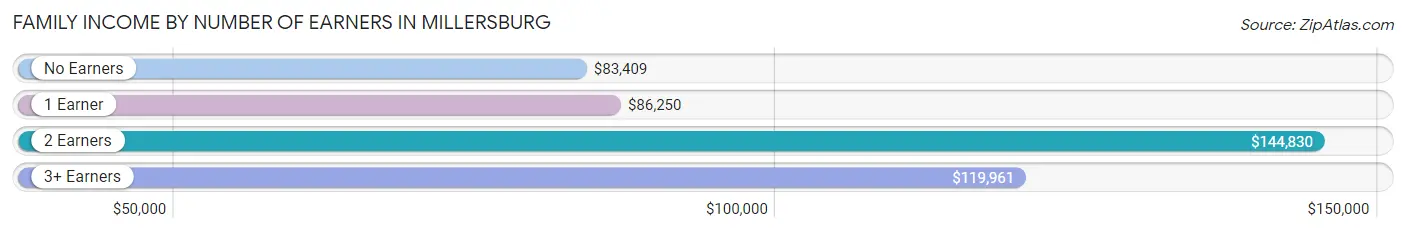
| Number of Earners | # Families | Median Income |
| No Earners | 96 (11.0%) | $83,409 |
| 1 Earner | 211 (24.2%) | $86,250 |
| 2 Earners | 471 (53.9%) | $144,830 |
| 3+ Earners | 95 (10.9%) | $119,961 |
| Total | 873 (100.0%) | $131,513 |
Household Income in Millersburg
Household Income Brackets in Millersburg
With 305 households falling in the category, the $100,000 to $149,999 income range is the most frequent in Millersburg, accounting for 28.8% of all households. In contrast, only 8 households (0.8%) fall into the less than $10,000 income bracket, making it the least populous group.
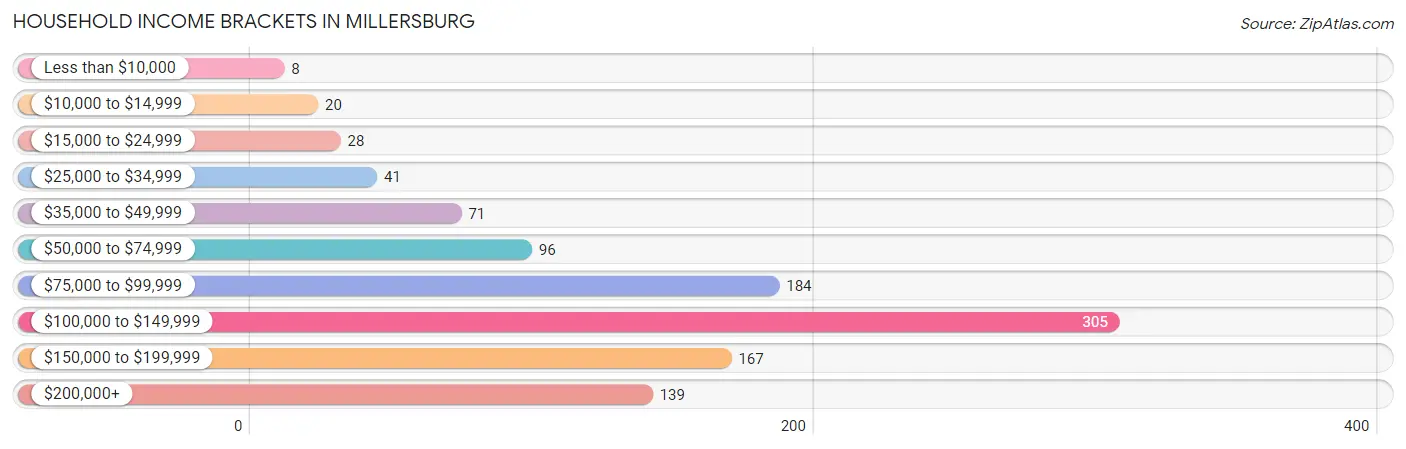
| Income Bracket | # Households | % Households |
| Less than $10,000 | 8 | 0.8% |
| $10,000 to $14,999 | 20 | 1.9% |
| $15,000 to $24,999 | 28 | 2.6% |
| $25,000 to $34,999 | 41 | 3.9% |
| $35,000 to $49,999 | 71 | 6.7% |
| $50,000 to $74,999 | 96 | 9.1% |
| $75,000 to $99,999 | 184 | 17.4% |
| $100,000 to $149,999 | 305 | 28.8% |
| $150,000 to $199,999 | 167 | 15.8% |
| $200,000+ | 139 | 13.1% |
Household Income by Householder Age in Millersburg
The median household income in Millersburg is $119,148, with the highest median household income of $140,259 found in the 25 to 44 years age bracket for the primary householder. A total of 366 households (34.6%) fall into this category.
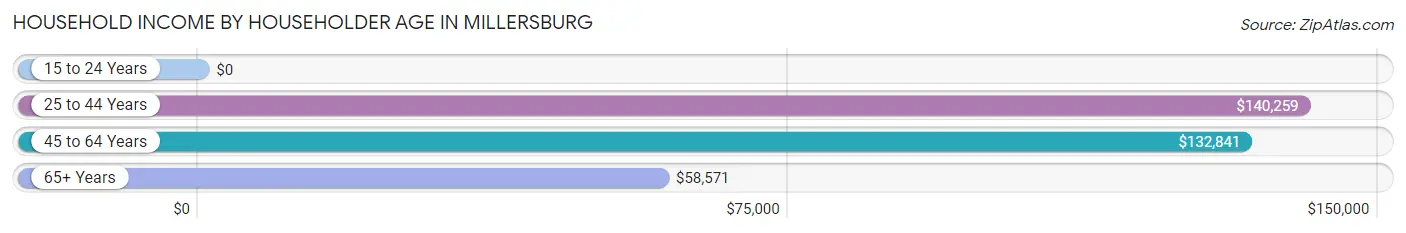
| Income Bracket | # Households | Median Income |
| 15 to 24 Years | 0 (0.0%) | $0 |
| 25 to 44 Years | 366 (34.6%) | $140,259 |
| 45 to 64 Years | 439 (41.4%) | $132,841 |
| 65+ Years | 254 (24.0%) | $58,571 |
| Total | 1,059 (100.0%) | $119,148 |
Poverty in Millersburg
Income Below Poverty by Sex and Age in Millersburg
With 7.7% poverty level for males and 7.5% for females among the residents of Millersburg, 12 to 14 year old males and 18 to 24 year old females are the most vulnerable to poverty, with 36 males (39.1%) and 18 females (25.4%) in their respective age groups living below the poverty level.
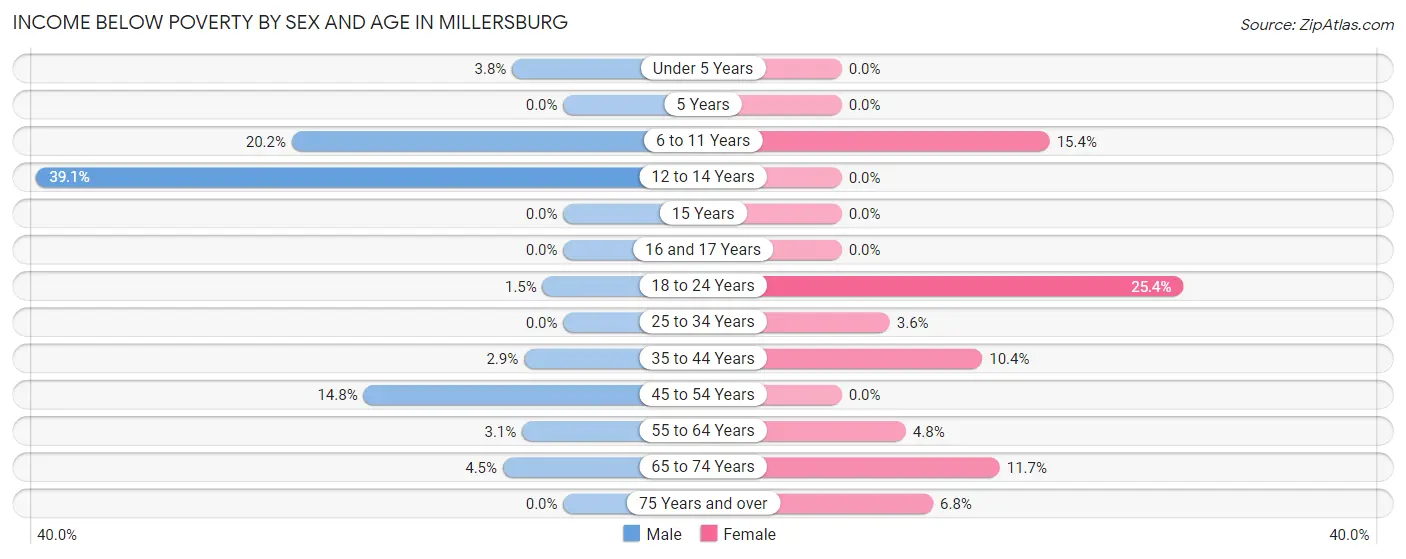
| Age Bracket | Male | Female |
| Under 5 Years | 3 (3.8%) | 0 (0.0%) |
| 5 Years | 0 (0.0%) | 0 (0.0%) |
| 6 to 11 Years | 25 (20.2%) | 23 (15.4%) |
| 12 to 14 Years | 36 (39.1%) | 0 (0.0%) |
| 15 Years | 0 (0.0%) | 0 (0.0%) |
| 16 and 17 Years | 0 (0.0%) | 0 (0.0%) |
| 18 to 24 Years | 1 (1.5%) | 18 (25.4%) |
| 25 to 34 Years | 0 (0.0%) | 3 (3.6%) |
| 35 to 44 Years | 7 (2.9%) | 34 (10.4%) |
| 45 to 54 Years | 27 (14.8%) | 0 (0.0%) |
| 55 to 64 Years | 7 (3.1%) | 10 (4.8%) |
| 65 to 74 Years | 7 (4.5%) | 21 (11.7%) |
| 75 Years and over | 0 (0.0%) | 4 (6.8%) |
| Total | 113 (7.7%) | 113 (7.5%) |
Income Above Poverty by Sex and Age in Millersburg
According to the poverty statistics in Millersburg, males aged 5 years and females aged under 5 years are the age groups that are most secure financially, with 100.0% of males and 100.0% of females in these age groups living above the poverty line.
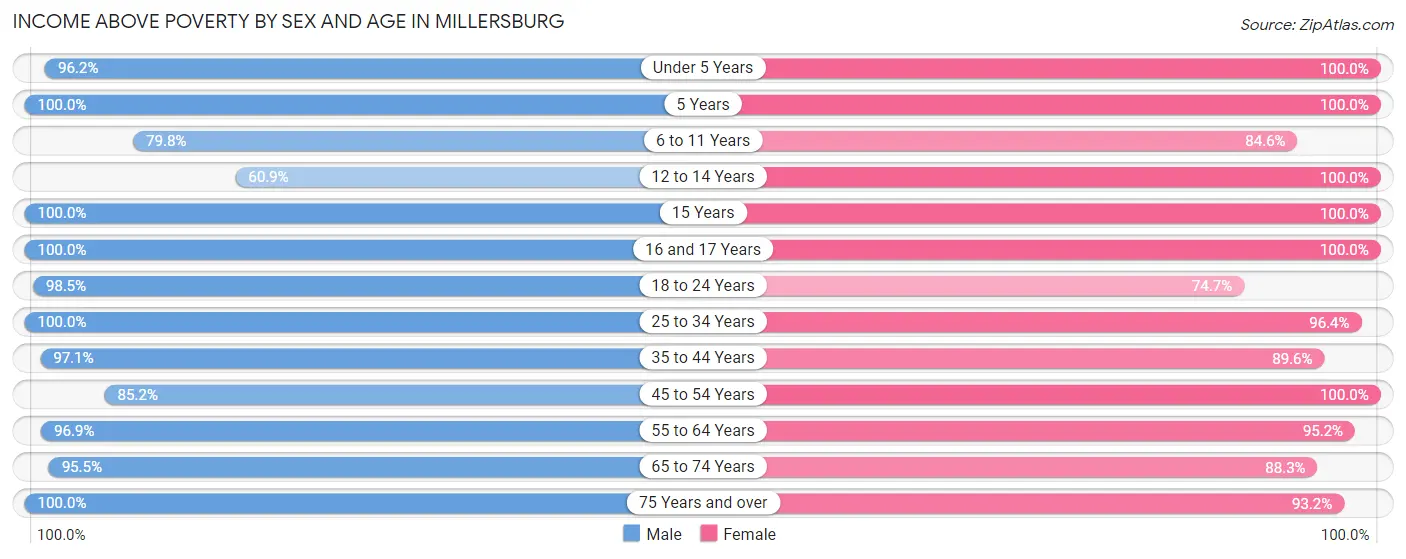
| Age Bracket | Male | Female |
| Under 5 Years | 76 (96.2%) | 127 (100.0%) |
| 5 Years | 68 (100.0%) | 16 (100.0%) |
| 6 to 11 Years | 99 (79.8%) | 126 (84.6%) |
| 12 to 14 Years | 56 (60.9%) | 71 (100.0%) |
| 15 Years | 18 (100.0%) | 70 (100.0%) |
| 16 and 17 Years | 32 (100.0%) | 2 (100.0%) |
| 18 to 24 Years | 64 (98.5%) | 53 (74.7%) |
| 25 to 34 Years | 118 (100.0%) | 81 (96.4%) |
| 35 to 44 Years | 233 (97.1%) | 292 (89.6%) |
| 45 to 54 Years | 155 (85.2%) | 140 (100.0%) |
| 55 to 64 Years | 222 (96.9%) | 200 (95.2%) |
| 65 to 74 Years | 149 (95.5%) | 158 (88.3%) |
| 75 Years and over | 57 (100.0%) | 55 (93.2%) |
| Total | 1,347 (92.3%) | 1,391 (92.5%) |
Income Below Poverty Among Married-Couple Families in Millersburg
The poverty statistics for married-couple families in Millersburg show that 3.2% or 26 of the total 810 families live below the poverty line. Families with 1 or 2 children have the highest poverty rate of 9.5%, comprising of 24 families. On the other hand, families with 3 or 4 children have the lowest poverty rate of 0.0%, which includes 0 families.
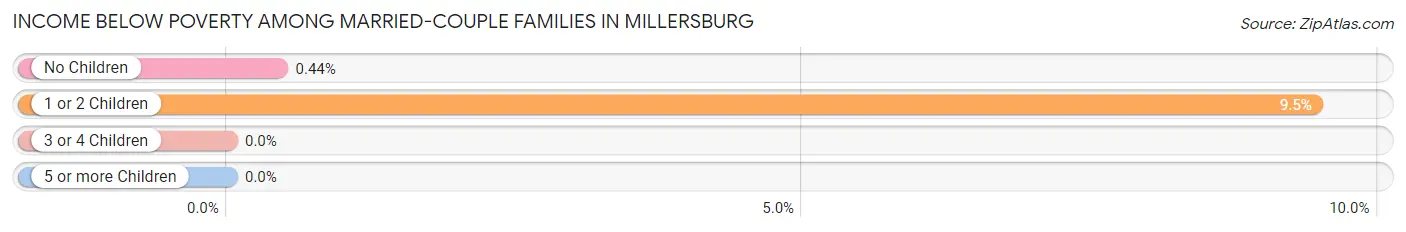
| Children | Above Poverty | Below Poverty |
| No Children | 452 (99.6%) | 2 (0.4%) |
| 1 or 2 Children | 230 (90.5%) | 24 (9.5%) |
| 3 or 4 Children | 97 (100.0%) | 0 (0.0%) |
| 5 or more Children | 5 (100.0%) | 0 (0.0%) |
| Total | 784 (96.8%) | 26 (3.2%) |
Income Below Poverty Among Single-Parent Households in Millersburg
According to the poverty data in Millersburg, 8.0% or 2 single-father households and 31.6% or 12 single-mother households are living below the poverty line. Among single-father households, those with 1 or 2 children have the highest poverty rate, with 2 households (12.5%) experiencing poverty. Likewise, among single-mother households, those with 1 or 2 children have the highest poverty rate, with 12 households (100.0%) falling below the poverty line.
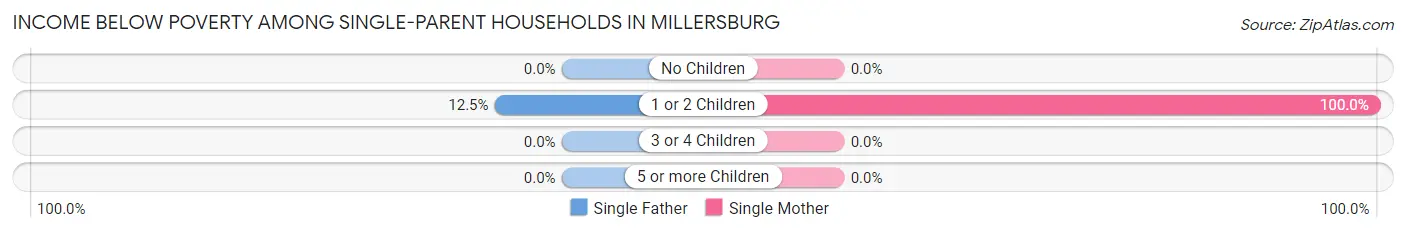
| Children | Single Father | Single Mother |
| No Children | 0 (0.0%) | 0 (0.0%) |
| 1 or 2 Children | 2 (12.5%) | 12 (100.0%) |
| 3 or 4 Children | 0 (0.0%) | 0 (0.0%) |
| 5 or more Children | 0 (0.0%) | 0 (0.0%) |
| Total | 2 (8.0%) | 12 (31.6%) |
Income Below Poverty Among Married-Couple vs Single-Parent Households in Millersburg
The poverty data for Millersburg shows that 26 of the married-couple family households (3.2%) and 14 of the single-parent households (22.2%) are living below the poverty level. Within the married-couple family households, those with 1 or 2 children have the highest poverty rate, with 24 households (9.5%) falling below the poverty line. Among the single-parent households, those with 1 or 2 children have the highest poverty rate, with 14 household (50.0%) living below poverty.
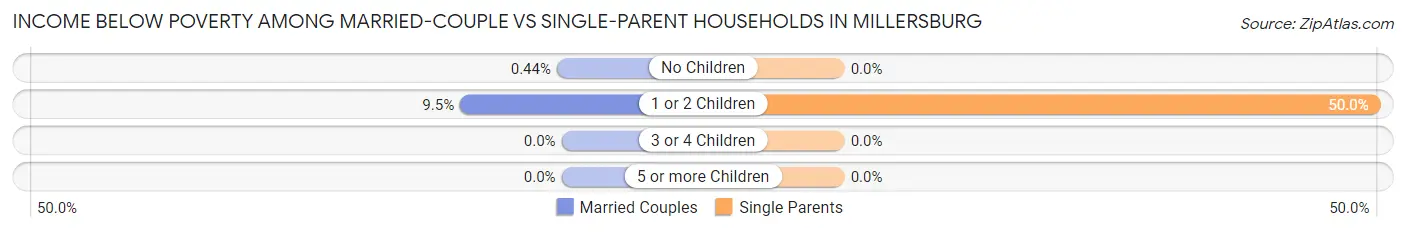
| Children | Married-Couple Families | Single-Parent Households |
| No Children | 2 (0.4%) | 0 (0.0%) |
| 1 or 2 Children | 24 (9.5%) | 14 (50.0%) |
| 3 or 4 Children | 0 (0.0%) | 0 (0.0%) |
| 5 or more Children | 0 (0.0%) | 0 (0.0%) |
| Total | 26 (3.2%) | 14 (22.2%) |
Employment Characteristics in Millersburg
Employment by Class of Employer in Millersburg
Among the 1,464 employed individuals in Millersburg, private company employees (802 | 54.8%), state government employees (245 | 16.7%), and local government employees (176 | 12.0%) make up the most common classes of employment.
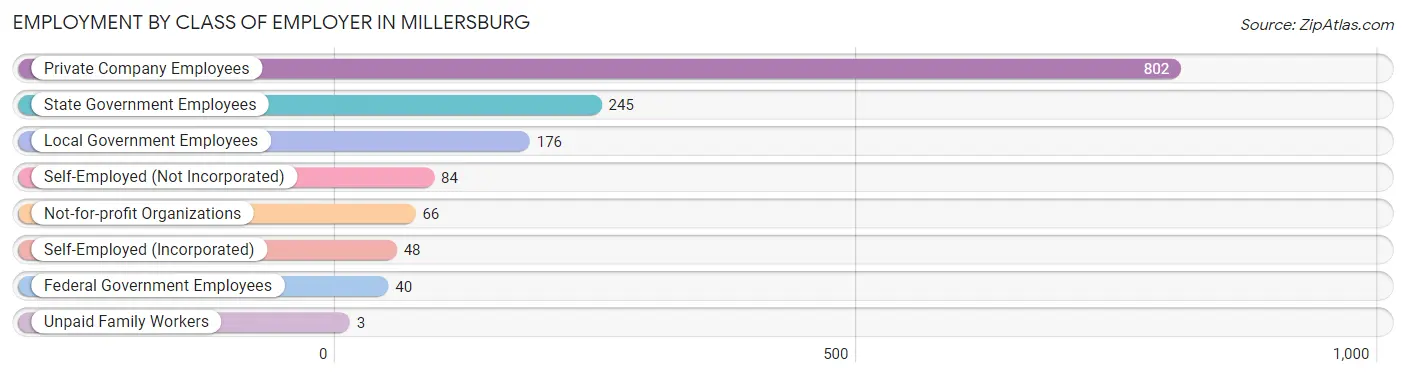
| Employer Class | # Employees | % Employees |
| Private Company Employees | 802 | 54.8% |
| Self-Employed (Incorporated) | 48 | 3.3% |
| Self-Employed (Not Incorporated) | 84 | 5.7% |
| Not-for-profit Organizations | 66 | 4.5% |
| Local Government Employees | 176 | 12.0% |
| State Government Employees | 245 | 16.7% |
| Federal Government Employees | 40 | 2.7% |
| Unpaid Family Workers | 3 | 0.2% |
| Total | 1,464 | 100.0% |
Employment Status by Age in Millersburg
According to the labor force statistics for Millersburg, out of the total population over 16 years of age (2,150), 70.4% or 1,514 individuals are in the labor force, with 2.9% or 44 of them unemployed. The age group with the highest labor force participation rate is 35 to 44 years, with 93.6% or 530 individuals in the labor force. Within the labor force, the 20 to 24 years age range has the highest percentage of unemployed individuals, with 17.3% or 9 of them being unemployed.
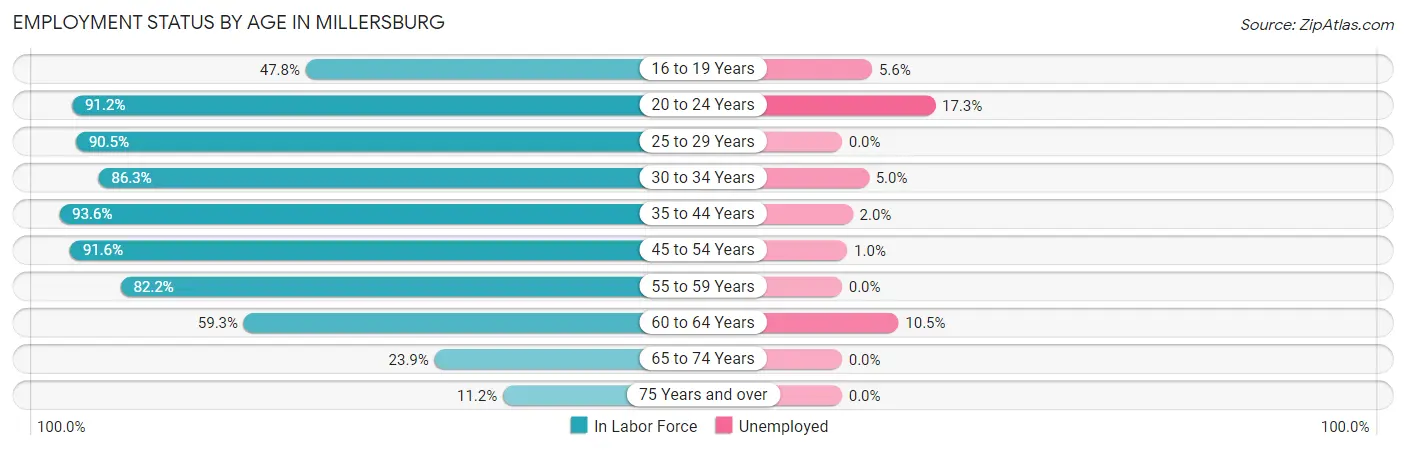
| Age Bracket | In Labor Force | Unemployed |
| 16 to 19 Years | 54 (47.8%) | 3 (5.6%) |
| 20 to 24 Years | 52 (91.2%) | 9 (17.3%) |
| 25 to 29 Years | 57 (90.5%) | 0 (0.0%) |
| 30 to 34 Years | 120 (86.3%) | 6 (5.0%) |
| 35 to 44 Years | 530 (93.6%) | 11 (2.0%) |
| 45 to 54 Years | 295 (91.6%) | 3 (1.0%) |
| 55 to 59 Years | 189 (82.2%) | 0 (0.0%) |
| 60 to 64 Years | 124 (59.3%) | 13 (10.5%) |
| 65 to 74 Years | 80 (23.9%) | 0 (0.0%) |
| 75 Years and over | 13 (11.2%) | 0 (0.0%) |
| Total | 1,514 (70.4%) | 44 (2.9%) |
Employment Status by Educational Attainment in Millersburg
According to labor force statistics for Millersburg, 86.0% of individuals (1,315) out of the total population between 25 and 64 years of age (1,529) are in the labor force, with 2.5% or 33 of them being unemployed. The group with the highest labor force participation rate are those with the educational attainment of bachelor's degree or higher, with 96.1% or 516 individuals in the labor force. Within the labor force, individuals with less than high school education have the highest percentage of unemployment, with 5.4% or 4 of them being unemployed.
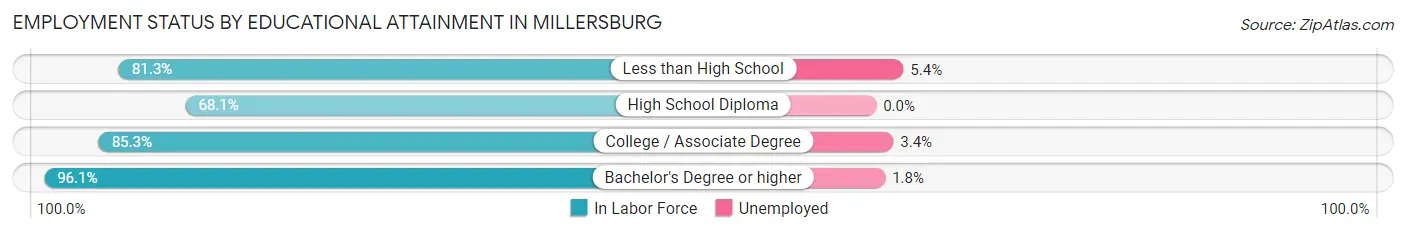
| Educational Attainment | In Labor Force | Unemployed |
| Less than High School | 74 (81.3%) | 5 (5.4%) |
| High School Diploma | 173 (68.1%) | 0 (0.0%) |
| College / Associate Degree | 552 (85.3%) | 22 (3.4%) |
| Bachelor's Degree or higher | 516 (96.1%) | 10 (1.8%) |
| Total | 1,315 (86.0%) | 38 (2.5%) |
Employment Occupations by Sex in Millersburg
Management, Business, Science and Arts Occupations
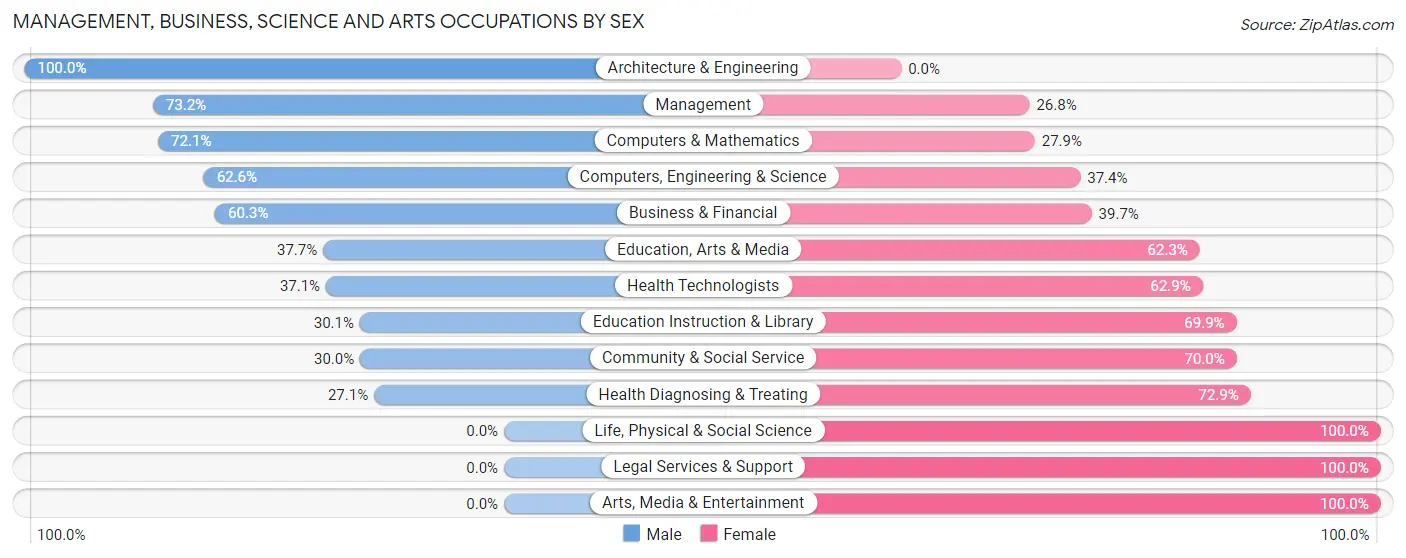
The most common Management, Business, Science and Arts occupations in Millersburg are Community & Social Service (313 | 21.6%), Education Instruction & Library (246 | 17.0%), Management (198 | 13.7%), Computers, Engineering & Science (99 | 6.8%), and Business & Financial (78 | 5.4%).
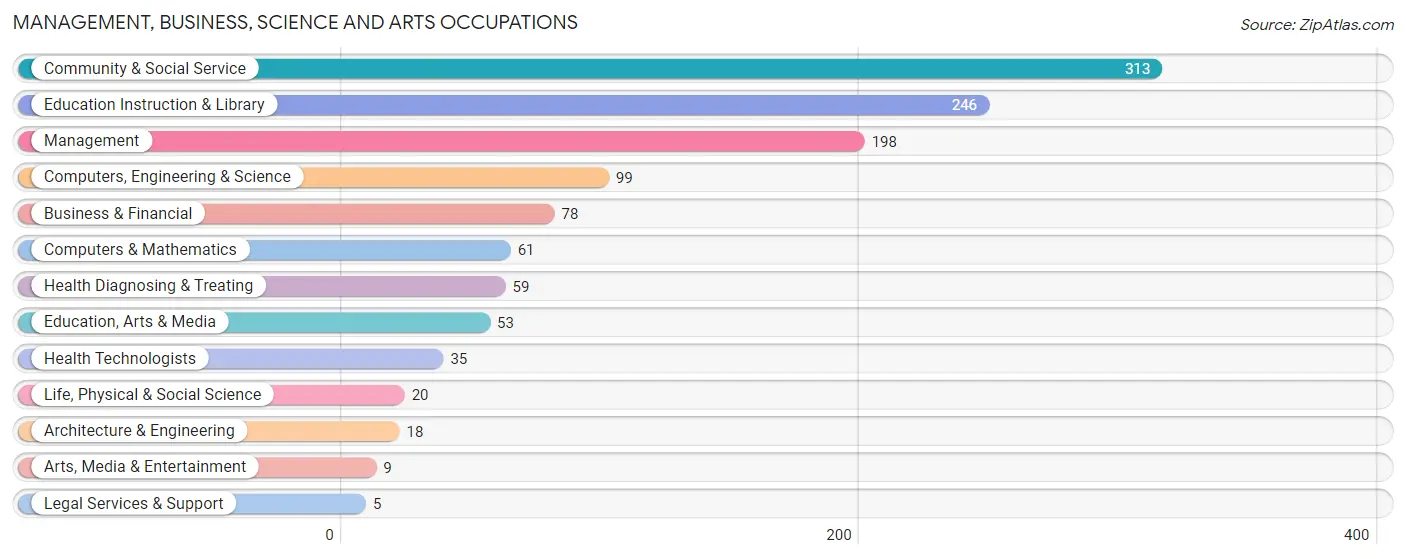
Management, Business, Science and Arts Occupations by Sex
Within the Management, Business, Science and Arts occupations in Millersburg, the most male-oriented occupations are Architecture & Engineering (100.0%), Management (73.2%), and Computers & Mathematics (72.1%), while the most female-oriented occupations are Life, Physical & Social Science (100.0%), Legal Services & Support (100.0%), and Arts, Media & Entertainment (100.0%).
| Occupation | Male | Female |
| Management | 145 (73.2%) | 53 (26.8%) |
| Business & Financial | 47 (60.3%) | 31 (39.7%) |
| Computers, Engineering & Science | 62 (62.6%) | 37 (37.4%) |
| Computers & Mathematics | 44 (72.1%) | 17 (27.9%) |
| Architecture & Engineering | 18 (100.0%) | 0 (0.0%) |
| Life, Physical & Social Science | 0 (0.0%) | 20 (100.0%) |
| Community & Social Service | 94 (30.0%) | 219 (70.0%) |
| Education, Arts & Media | 20 (37.7%) | 33 (62.3%) |
| Legal Services & Support | 0 (0.0%) | 5 (100.0%) |
| Education Instruction & Library | 74 (30.1%) | 172 (69.9%) |
| Arts, Media & Entertainment | 0 (0.0%) | 9 (100.0%) |
| Health Diagnosing & Treating | 16 (27.1%) | 43 (72.9%) |
| Health Technologists | 13 (37.1%) | 22 (62.9%) |
| Total (Category) | 364 (48.7%) | 383 (51.3%) |
| Total (Overall) | 767 (52.9%) | 684 (47.1%) |
Services Occupations
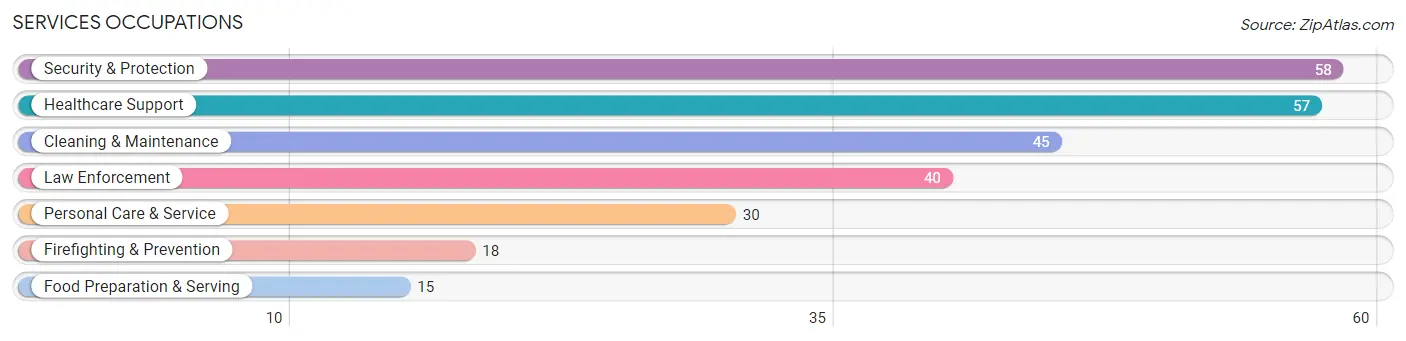
The most common Services occupations in Millersburg are Security & Protection (58 | 4.0%), Healthcare Support (57 | 3.9%), Cleaning & Maintenance (45 | 3.1%), Law Enforcement (40 | 2.8%), and Personal Care & Service (30 | 2.1%).
Services Occupations by Sex
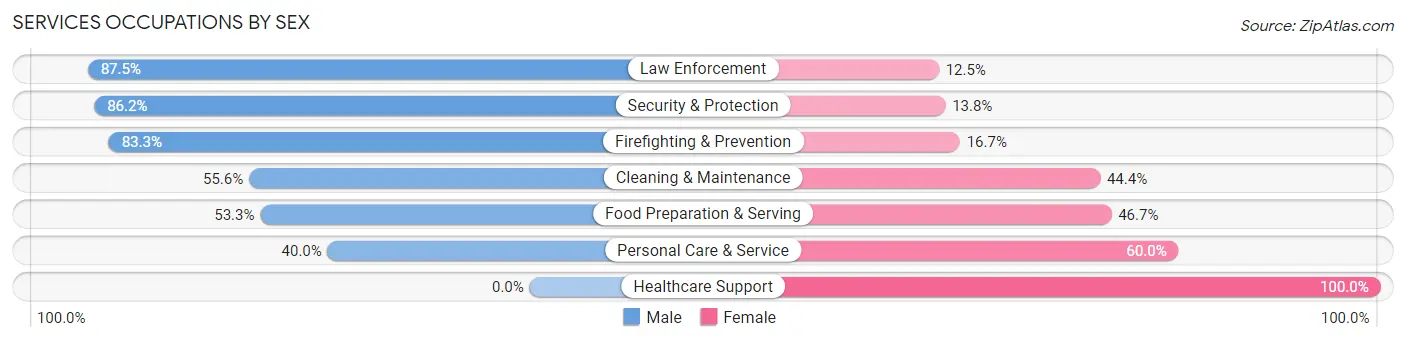
Within the Services occupations in Millersburg, the most male-oriented occupations are Law Enforcement (87.5%), Security & Protection (86.2%), and Firefighting & Prevention (83.3%), while the most female-oriented occupations are Healthcare Support (100.0%), Personal Care & Service (60.0%), and Food Preparation & Serving (46.7%).
| Occupation | Male | Female |
| Healthcare Support | 0 (0.0%) | 57 (100.0%) |
| Security & Protection | 50 (86.2%) | 8 (13.8%) |
| Firefighting & Prevention | 15 (83.3%) | 3 (16.7%) |
| Law Enforcement | 35 (87.5%) | 5 (12.5%) |
| Food Preparation & Serving | 8 (53.3%) | 7 (46.7%) |
| Cleaning & Maintenance | 25 (55.6%) | 20 (44.4%) |
| Personal Care & Service | 12 (40.0%) | 18 (60.0%) |
| Total (Category) | 95 (46.3%) | 110 (53.7%) |
| Total (Overall) | 767 (52.9%) | 684 (47.1%) |
Sales and Office Occupations
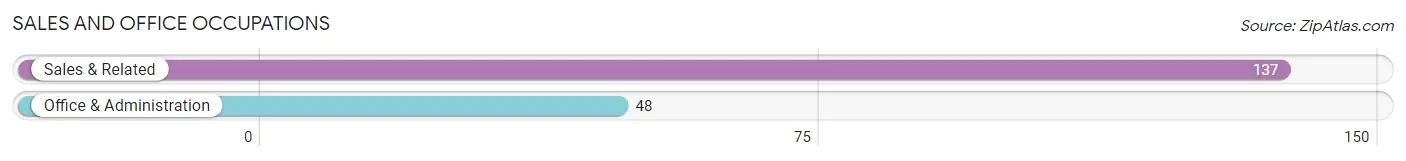
The most common Sales and Office occupations in Millersburg are Sales & Related (137 | 9.4%), and Office & Administration (48 | 3.3%).
Sales and Office Occupations by Sex
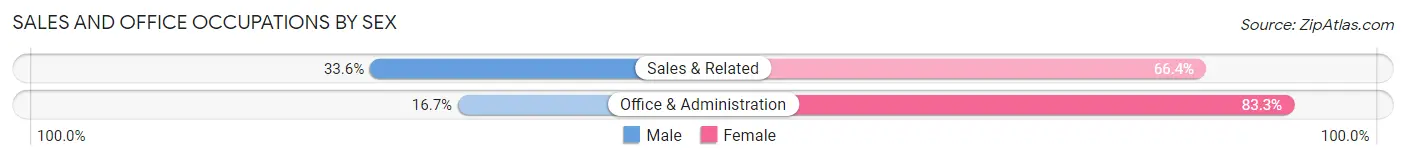
| Occupation | Male | Female |
| Sales & Related | 46 (33.6%) | 91 (66.4%) |
| Office & Administration | 8 (16.7%) | 40 (83.3%) |
| Total (Category) | 54 (29.2%) | 131 (70.8%) |
| Total (Overall) | 767 (52.9%) | 684 (47.1%) |
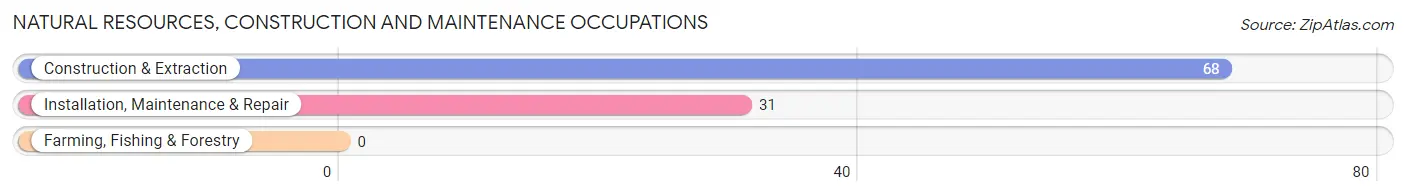
Natural Resources, Construction and Maintenance Occupations
The most common Natural Resources, Construction and Maintenance occupations in Millersburg are Construction & Extraction (68 | 4.7%), and Installation, Maintenance & Repair (31 | 2.1%).
Natural Resources, Construction and Maintenance Occupations by Sex
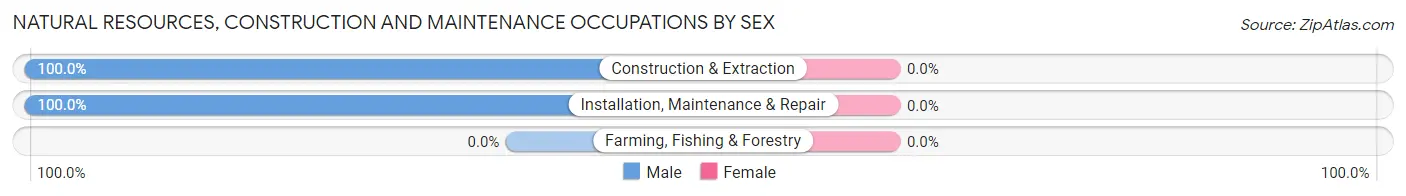
| Occupation | Male | Female |
| Farming, Fishing & Forestry | 0 (0.0%) | 0 (0.0%) |
| Construction & Extraction | 68 (100.0%) | 0 (0.0%) |
| Installation, Maintenance & Repair | 31 (100.0%) | 0 (0.0%) |
| Total (Category) | 99 (100.0%) | 0 (0.0%) |
| Total (Overall) | 767 (52.9%) | 684 (47.1%) |
Production, Transportation and Moving Occupations
The most common Production, Transportation and Moving occupations in Millersburg are Transportation (86 | 5.9%), Material Moving (82 | 5.7%), and Production (47 | 3.2%).
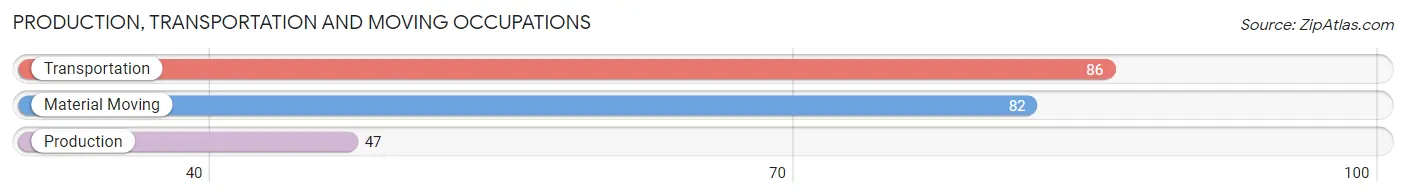
Production, Transportation and Moving Occupations by Sex
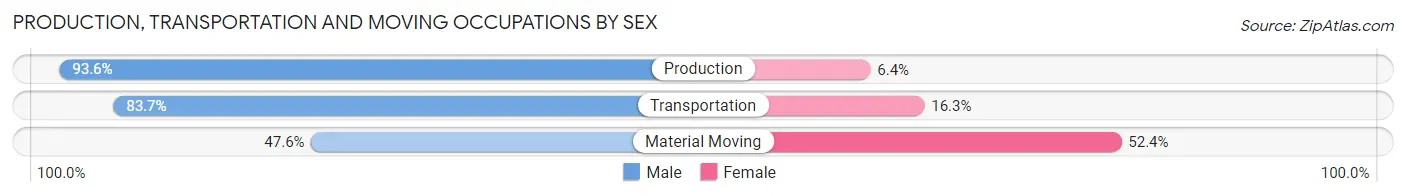
| Occupation | Male | Female |
| Production | 44 (93.6%) | 3 (6.4%) |
| Transportation | 72 (83.7%) | 14 (16.3%) |
| Material Moving | 39 (47.6%) | 43 (52.4%) |
| Total (Category) | 155 (72.1%) | 60 (27.9%) |
| Total (Overall) | 767 (52.9%) | 684 (47.1%) |
Employment Industries by Sex in Millersburg
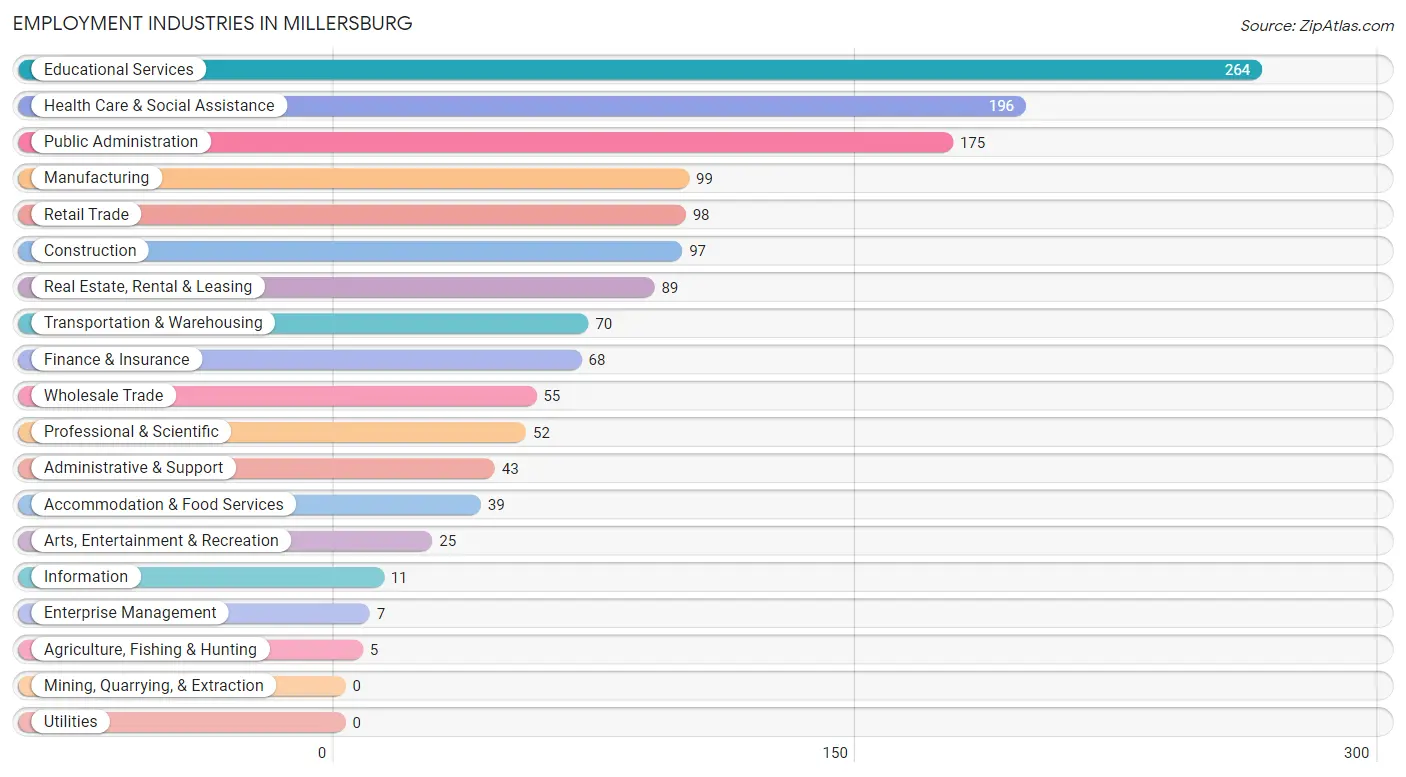
Employment Industries in Millersburg
The major employment industries in Millersburg include Educational Services (264 | 18.2%), Health Care & Social Assistance (196 | 13.5%), Public Administration (175 | 12.1%), Manufacturing (99 | 6.8%), and Retail Trade (98 | 6.8%).
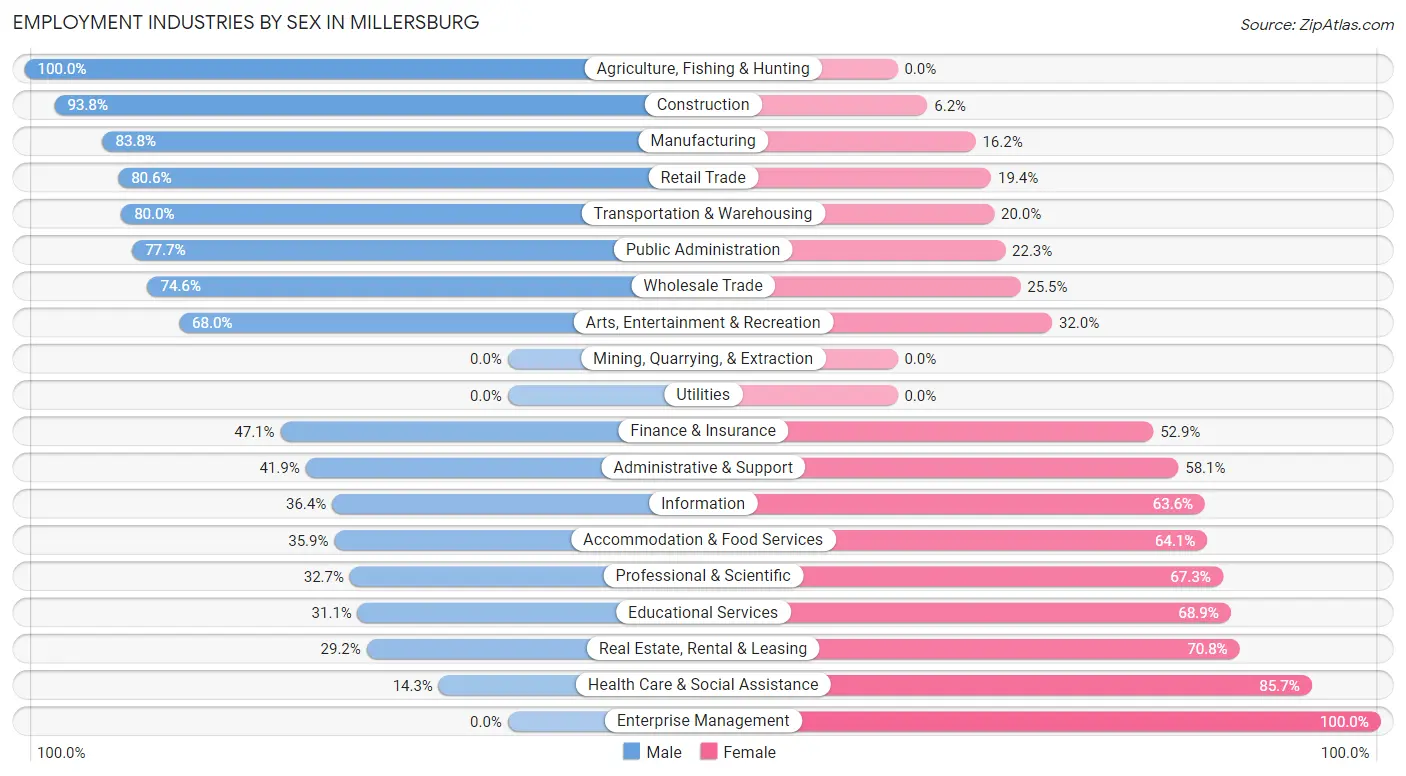
Employment Industries by Sex in Millersburg
The Millersburg industries that see more men than women are Agriculture, Fishing & Hunting (100.0%), Construction (93.8%), and Manufacturing (83.8%), whereas the industries that tend to have a higher number of women are Enterprise Management (100.0%), Health Care & Social Assistance (85.7%), and Real Estate, Rental & Leasing (70.8%).
| Industry | Male | Female |
| Agriculture, Fishing & Hunting | 5 (100.0%) | 0 (0.0%) |
| Mining, Quarrying, & Extraction | 0 (0.0%) | 0 (0.0%) |
| Construction | 91 (93.8%) | 6 (6.2%) |
| Manufacturing | 83 (83.8%) | 16 (16.2%) |
| Wholesale Trade | 41 (74.6%) | 14 (25.5%) |
| Retail Trade | 79 (80.6%) | 19 (19.4%) |
| Transportation & Warehousing | 56 (80.0%) | 14 (20.0%) |
| Utilities | 0 (0.0%) | 0 (0.0%) |
| Information | 4 (36.4%) | 7 (63.6%) |
| Finance & Insurance | 32 (47.1%) | 36 (52.9%) |
| Real Estate, Rental & Leasing | 26 (29.2%) | 63 (70.8%) |
| Professional & Scientific | 17 (32.7%) | 35 (67.3%) |
| Enterprise Management | 0 (0.0%) | 7 (100.0%) |
| Administrative & Support | 18 (41.9%) | 25 (58.1%) |
| Educational Services | 82 (31.1%) | 182 (68.9%) |
| Health Care & Social Assistance | 28 (14.3%) | 168 (85.7%) |
| Arts, Entertainment & Recreation | 17 (68.0%) | 8 (32.0%) |
| Accommodation & Food Services | 14 (35.9%) | 25 (64.1%) |
| Public Administration | 136 (77.7%) | 39 (22.3%) |
| Total | 767 (52.9%) | 684 (47.1%) |
Education in Millersburg
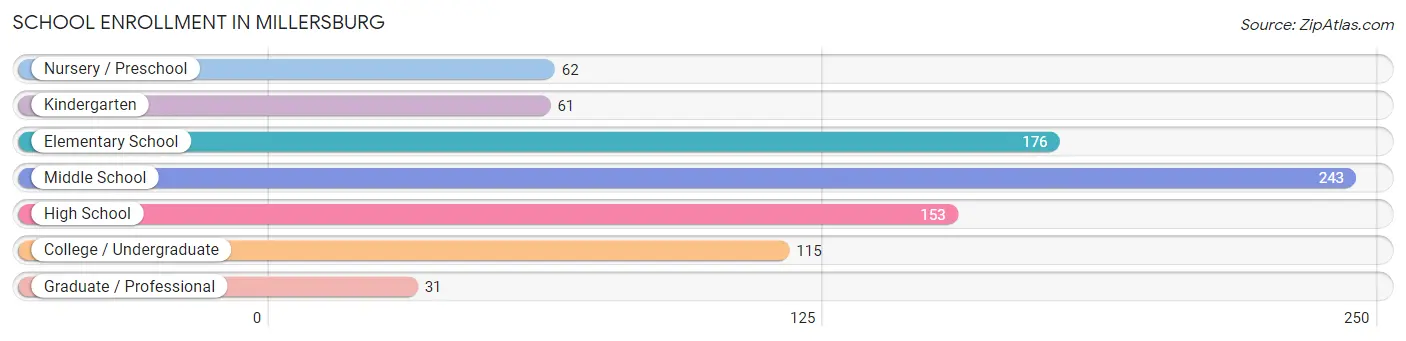
School Enrollment in Millersburg
The most common levels of schooling among the 841 students in Millersburg are middle school (243 | 28.9%), elementary school (176 | 20.9%), and high school (153 | 18.2%).
| School Level | # Students | % Students |
| Nursery / Preschool | 62 | 7.4% |
| Kindergarten | 61 | 7.2% |
| Elementary School | 176 | 20.9% |
| Middle School | 243 | 28.9% |
| High School | 153 | 18.2% |
| College / Undergraduate | 115 | 13.7% |
| Graduate / Professional | 31 | 3.7% |
| Total | 841 | 100.0% |
School Enrollment by Age by Funding Source in Millersburg
Out of a total of 841 students who are enrolled in schools in Millersburg, 142 (16.9%) attend a private institution, while the remaining 699 (83.1%) are enrolled in public schools. The age group of 3 to 4 year olds has the highest likelihood of being enrolled in private schools, with 49 (92.4% in the age bracket) enrolled. Conversely, the age group of 20 to 24 year olds has the lowest likelihood of being enrolled in a private school, with 26 (100.0% in the age bracket) attending a public institution.
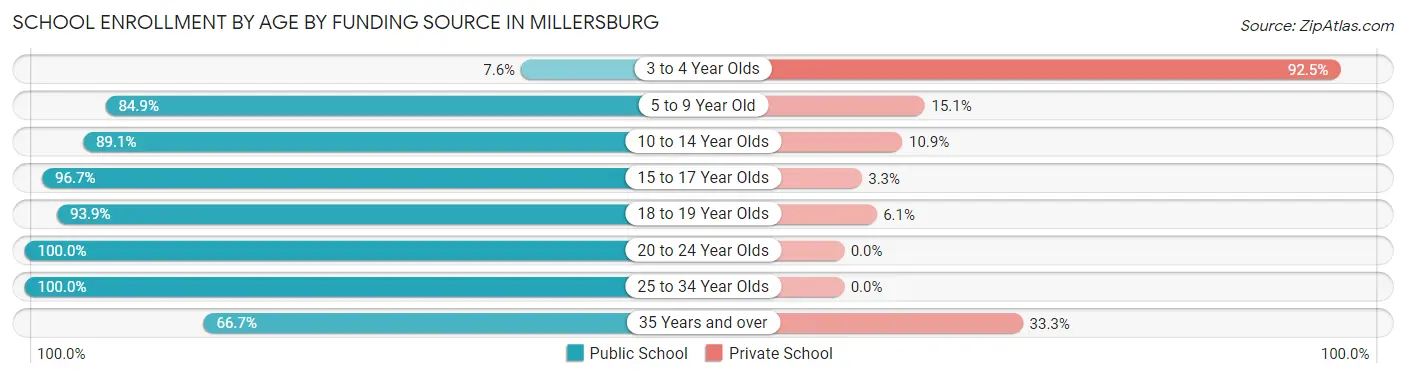
| Age Bracket | Public School | Private School |
| 3 to 4 Year Olds | 4 (7.5%) | 49 (92.4%) |
| 5 to 9 Year Old | 186 (84.9%) | 33 (15.1%) |
| 10 to 14 Year Olds | 254 (89.1%) | 31 (10.9%) |
| 15 to 17 Year Olds | 118 (96.7%) | 4 (3.3%) |
| 18 to 19 Year Olds | 62 (93.9%) | 4 (6.1%) |
| 20 to 24 Year Olds | 26 (100.0%) | 0 (0.0%) |
| 25 to 34 Year Olds | 7 (100.0%) | 0 (0.0%) |
| 35 Years and over | 42 (66.7%) | 21 (33.3%) |
| Total | 699 (83.1%) | 142 (16.9%) |
Educational Attainment by Field of Study in Millersburg
Education (122 | 19.2%), science & technology (103 | 16.2%), business (91 | 14.3%), arts & humanities (73 | 11.5%), and psychology (41 | 6.5%) are the most common fields of study among 635 individuals in Millersburg who have obtained a bachelor's degree or higher.
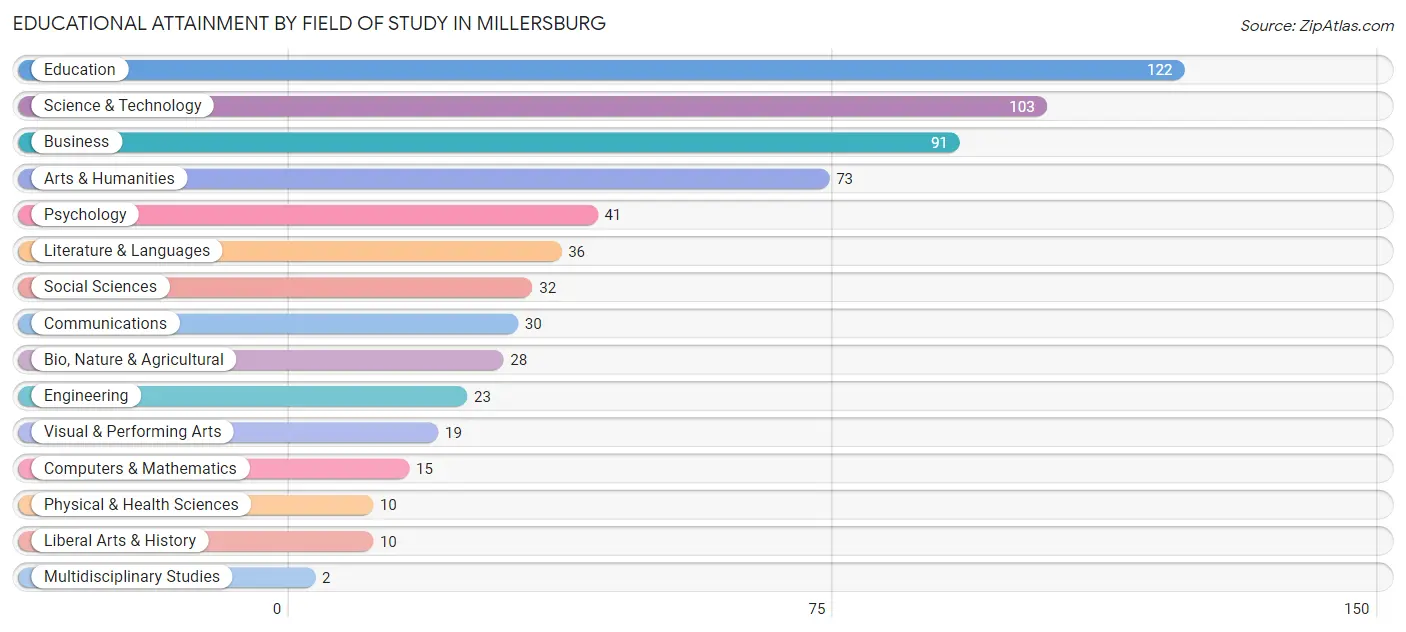
| Field of Study | # Graduates | % Graduates |
| Computers & Mathematics | 15 | 2.4% |
| Bio, Nature & Agricultural | 28 | 4.4% |
| Physical & Health Sciences | 10 | 1.6% |
| Psychology | 41 | 6.5% |
| Social Sciences | 32 | 5.0% |
| Engineering | 23 | 3.6% |
| Multidisciplinary Studies | 2 | 0.3% |
| Science & Technology | 103 | 16.2% |
| Business | 91 | 14.3% |
| Education | 122 | 19.2% |
| Literature & Languages | 36 | 5.7% |
| Liberal Arts & History | 10 | 1.6% |
| Visual & Performing Arts | 19 | 3.0% |
| Communications | 30 | 4.7% |
| Arts & Humanities | 73 | 11.5% |
| Total | 635 | 100.0% |
Transportation & Commute in Millersburg
Vehicle Availability by Sex in Millersburg
The most prevalent vehicle ownership categories in Millersburg are males with 2 vehicles (300, accounting for 38.2%) and females with 2 vehicles (326, making up 44.3%).
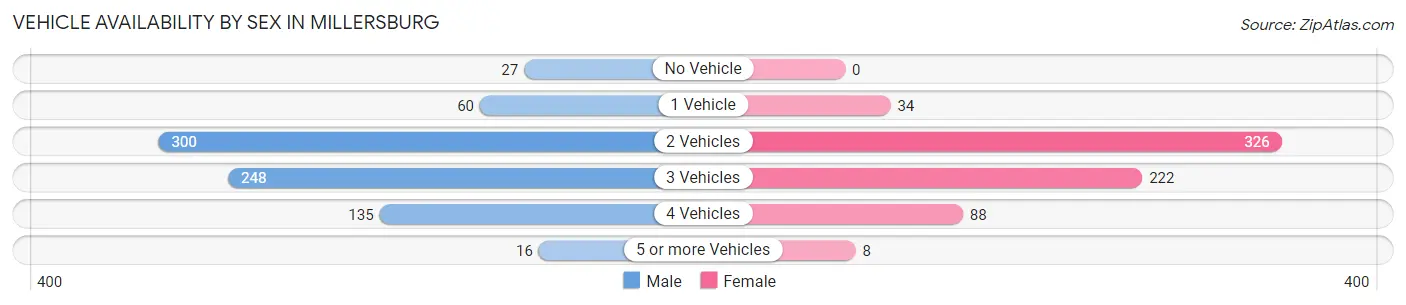
| Vehicles Available | Male | Female |
| No Vehicle | 27 (3.4%) | 0 (0.0%) |
| 1 Vehicle | 60 (7.6%) | 34 (5.0%) |
| 2 Vehicles | 300 (38.2%) | 326 (48.1%) |
| 3 Vehicles | 248 (31.6%) | 222 (32.7%) |
| 4 Vehicles | 135 (17.2%) | 88 (13.0%) |
| 5 or more Vehicles | 16 (2.0%) | 8 (1.2%) |
| Total | 786 (100.0%) | 678 (100.0%) |
Commute Time in Millersburg
The most frequently occuring commute durations in Millersburg are 20 to 24 minutes (231 commuters, 19.8%), 30 to 34 minutes (214 commuters, 18.4%), and 5 to 9 minutes (168 commuters, 14.4%).
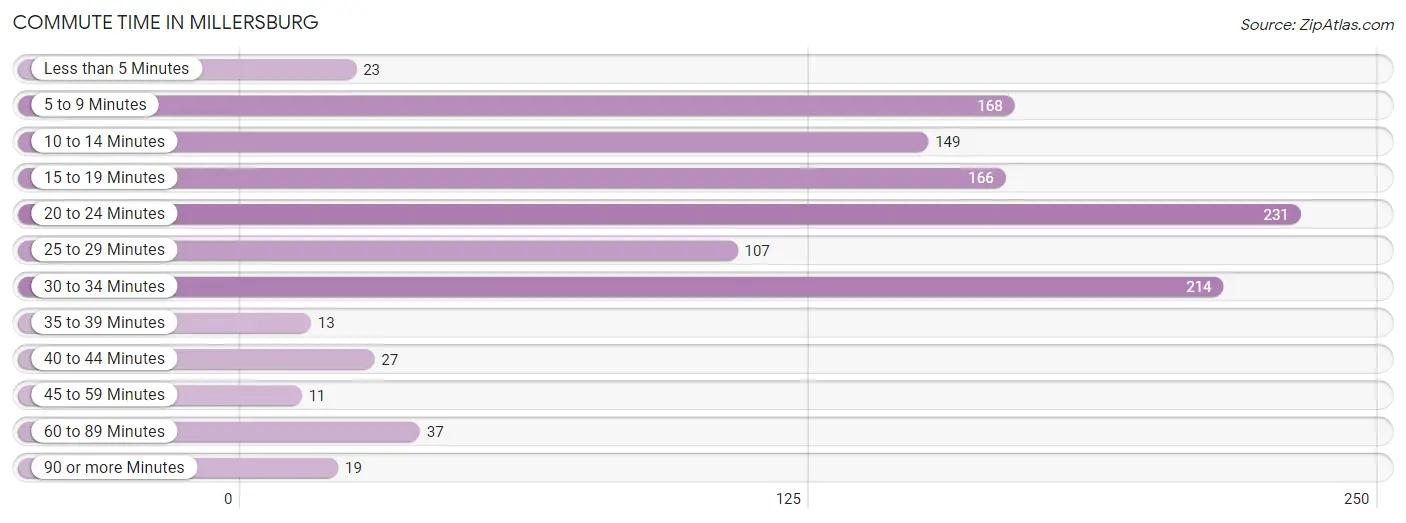
| Commute Time | # Commuters | % Commuters |
| Less than 5 Minutes | 23 | 2.0% |
| 5 to 9 Minutes | 168 | 14.4% |
| 10 to 14 Minutes | 149 | 12.8% |
| 15 to 19 Minutes | 166 | 14.2% |
| 20 to 24 Minutes | 231 | 19.8% |
| 25 to 29 Minutes | 107 | 9.2% |
| 30 to 34 Minutes | 214 | 18.4% |
| 35 to 39 Minutes | 13 | 1.1% |
| 40 to 44 Minutes | 27 | 2.3% |
| 45 to 59 Minutes | 11 | 0.9% |
| 60 to 89 Minutes | 37 | 3.2% |
| 90 or more Minutes | 19 | 1.6% |
Commute Time by Sex in Millersburg
The most common commute times in Millersburg are 20 to 24 minutes (149 commuters, 20.8%) for males and 30 to 34 minutes (108 commuters, 24.0%) for females.
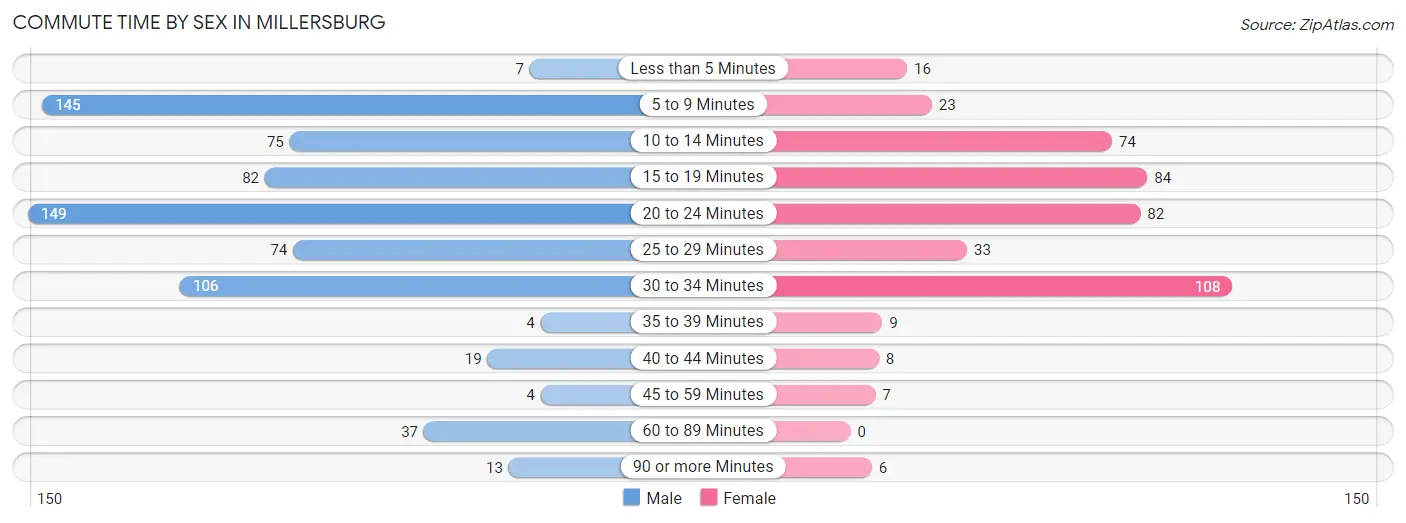
| Commute Time | Male | Female |
| Less than 5 Minutes | 7 (1.0%) | 16 (3.6%) |
| 5 to 9 Minutes | 145 (20.3%) | 23 (5.1%) |
| 10 to 14 Minutes | 75 (10.5%) | 74 (16.4%) |
| 15 to 19 Minutes | 82 (11.5%) | 84 (18.7%) |
| 20 to 24 Minutes | 149 (20.8%) | 82 (18.2%) |
| 25 to 29 Minutes | 74 (10.3%) | 33 (7.3%) |
| 30 to 34 Minutes | 106 (14.8%) | 108 (24.0%) |
| 35 to 39 Minutes | 4 (0.6%) | 9 (2.0%) |
| 40 to 44 Minutes | 19 (2.7%) | 8 (1.8%) |
| 45 to 59 Minutes | 4 (0.6%) | 7 (1.6%) |
| 60 to 89 Minutes | 37 (5.2%) | 0 (0.0%) |
| 90 or more Minutes | 13 (1.8%) | 6 (1.3%) |
Time of Departure to Work by Sex in Millersburg
The most frequent times of departure to work in Millersburg are 7:00 AM to 7:29 AM (161, 22.5%) for males and 7:00 AM to 7:29 AM (85, 18.9%) for females.
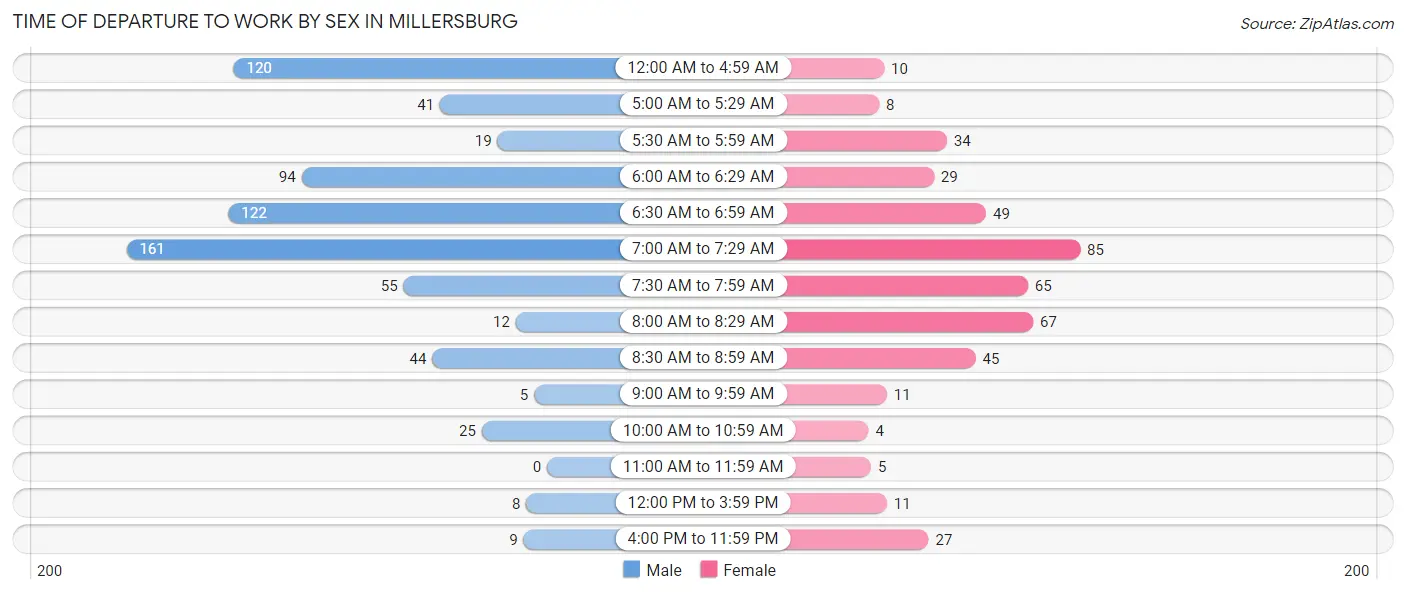
| Time of Departure | Male | Female |
| 12:00 AM to 4:59 AM | 120 (16.8%) | 10 (2.2%) |
| 5:00 AM to 5:29 AM | 41 (5.7%) | 8 (1.8%) |
| 5:30 AM to 5:59 AM | 19 (2.7%) | 34 (7.6%) |
| 6:00 AM to 6:29 AM | 94 (13.2%) | 29 (6.4%) |
| 6:30 AM to 6:59 AM | 122 (17.1%) | 49 (10.9%) |
| 7:00 AM to 7:29 AM | 161 (22.5%) | 85 (18.9%) |
| 7:30 AM to 7:59 AM | 55 (7.7%) | 65 (14.4%) |
| 8:00 AM to 8:29 AM | 12 (1.7%) | 67 (14.9%) |
| 8:30 AM to 8:59 AM | 44 (6.1%) | 45 (10.0%) |
| 9:00 AM to 9:59 AM | 5 (0.7%) | 11 (2.4%) |
| 10:00 AM to 10:59 AM | 25 (3.5%) | 4 (0.9%) |
| 11:00 AM to 11:59 AM | 0 (0.0%) | 5 (1.1%) |
| 12:00 PM to 3:59 PM | 8 (1.1%) | 11 (2.4%) |
| 4:00 PM to 11:59 PM | 9 (1.3%) | 27 (6.0%) |
| Total | 715 (100.0%) | 450 (100.0%) |
Housing Occupancy in Millersburg
Occupancy by Ownership in Millersburg
Of the total 1,059 dwellings in Millersburg, owner-occupied units account for 1,010 (95.4%), while renter-occupied units make up 49 (4.6%).
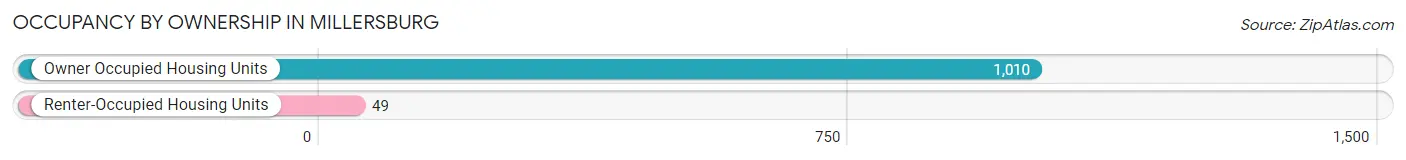
| Occupancy | # Housing Units | % Housing Units |
| Owner Occupied Housing Units | 1,010 | 95.4% |
| Renter-Occupied Housing Units | 49 | 4.6% |
| Total Occupied Housing Units | 1,059 | 100.0% |
Occupancy by Household Size in Millersburg
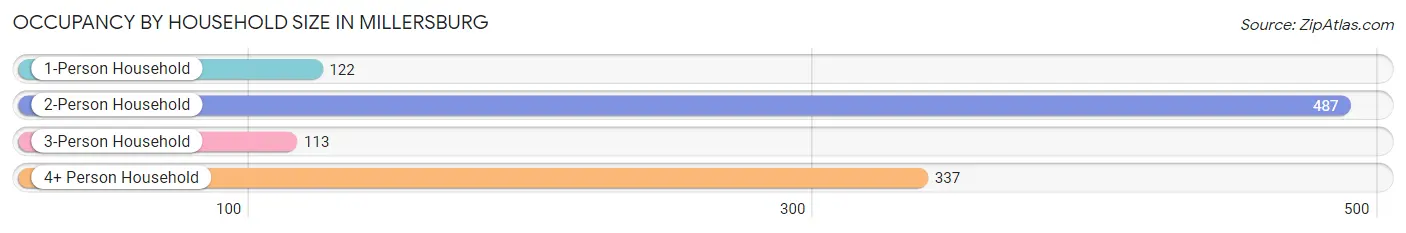
| Household Size | # Housing Units | % Housing Units |
| 1-Person Household | 122 | 11.5% |
| 2-Person Household | 487 | 46.0% |
| 3-Person Household | 113 | 10.7% |
| 4+ Person Household | 337 | 31.8% |
| Total Housing Units | 1,059 | 100.0% |
Occupancy by Ownership by Household Size in Millersburg
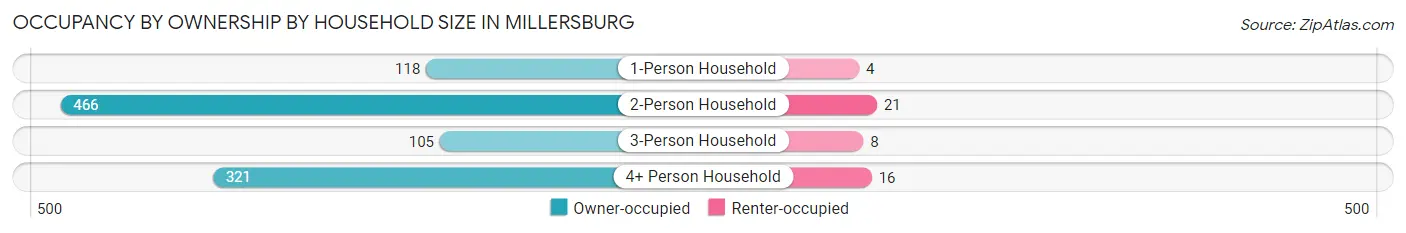
| Household Size | Owner-occupied | Renter-occupied |
| 1-Person Household | 118 (96.7%) | 4 (3.3%) |
| 2-Person Household | 466 (95.7%) | 21 (4.3%) |
| 3-Person Household | 105 (92.9%) | 8 (7.1%) |
| 4+ Person Household | 321 (95.3%) | 16 (4.8%) |
| Total Housing Units | 1,010 (95.4%) | 49 (4.6%) |
Occupancy by Educational Attainment in Millersburg
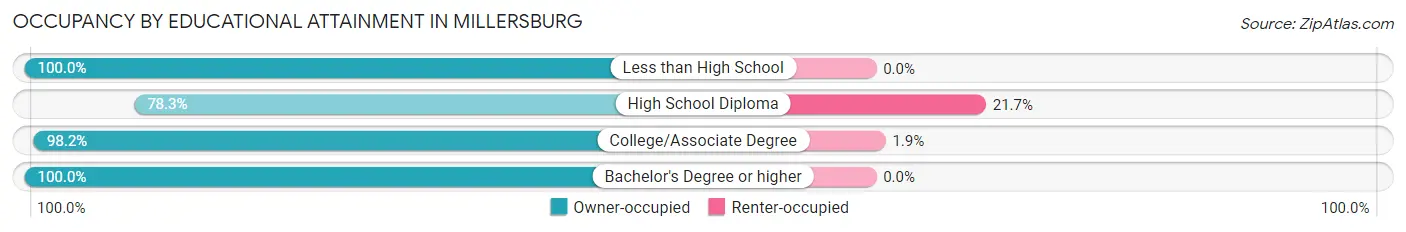
| Household Size | Owner-occupied | Renter-occupied |
| Less than High School | 58 (100.0%) | 0 (0.0%) |
| High School Diploma | 144 (78.3%) | 40 (21.7%) |
| College/Associate Degree | 477 (98.2%) | 9 (1.8%) |
| Bachelor's Degree or higher | 331 (100.0%) | 0 (0.0%) |
Occupancy by Age of Householder in Millersburg
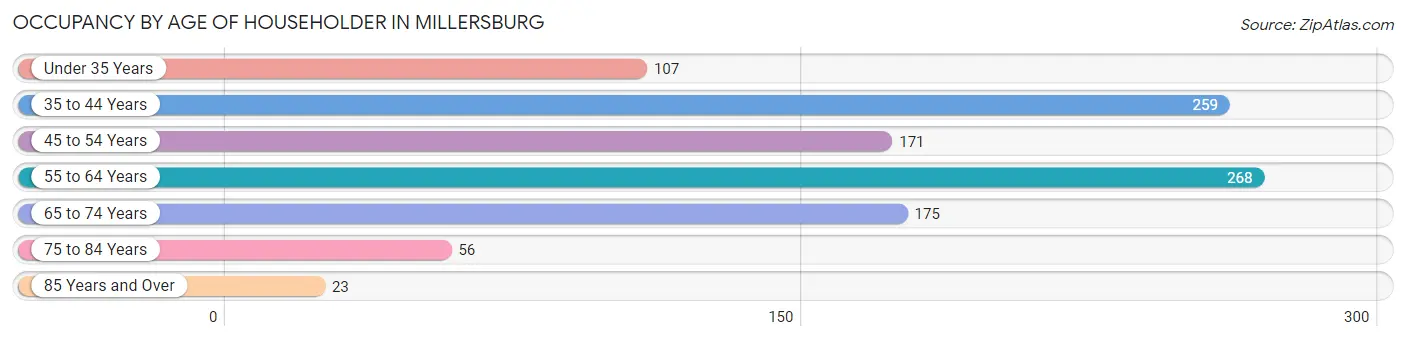
| Age Bracket | # Households | % Households |
| Under 35 Years | 107 | 10.1% |
| 35 to 44 Years | 259 | 24.5% |
| 45 to 54 Years | 171 | 16.2% |
| 55 to 64 Years | 268 | 25.3% |
| 65 to 74 Years | 175 | 16.5% |
| 75 to 84 Years | 56 | 5.3% |
| 85 Years and Over | 23 | 2.2% |
| Total | 1,059 | 100.0% |
Housing Finances in Millersburg
Median Income by Occupancy in Millersburg
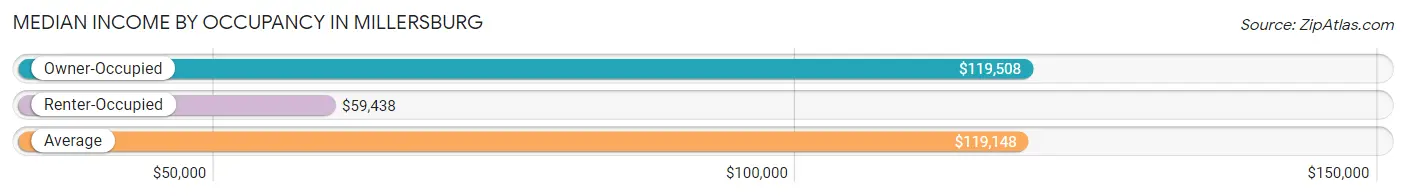
| Occupancy Type | # Households | Median Income |
| Owner-Occupied | 1,010 (95.4%) | $119,508 |
| Renter-Occupied | 49 (4.6%) | $59,438 |
| Average | 1,059 (100.0%) | $119,148 |
Occupancy by Householder Income Bracket in Millersburg
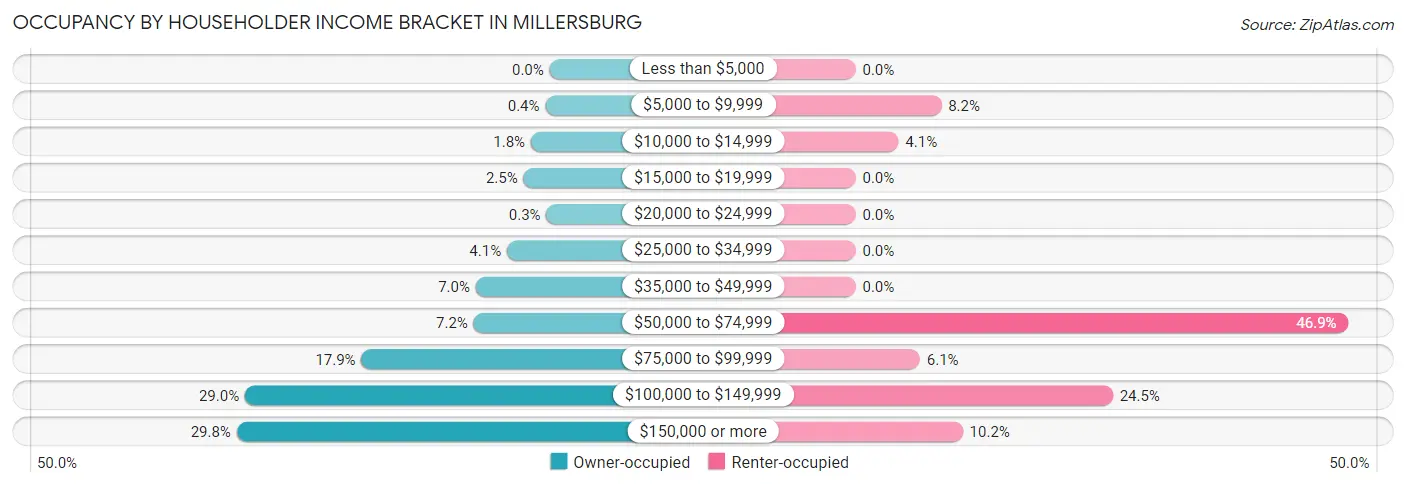
| Income Bracket | Owner-occupied | Renter-occupied |
| Less than $5,000 | 0 (0.0%) | 0 (0.0%) |
| $5,000 to $9,999 | 4 (0.4%) | 4 (8.2%) |
| $10,000 to $14,999 | 18 (1.8%) | 2 (4.1%) |
| $15,000 to $19,999 | 25 (2.5%) | 0 (0.0%) |
| $20,000 to $24,999 | 3 (0.3%) | 0 (0.0%) |
| $25,000 to $34,999 | 41 (4.1%) | 0 (0.0%) |
| $35,000 to $49,999 | 71 (7.0%) | 0 (0.0%) |
| $50,000 to $74,999 | 73 (7.2%) | 23 (46.9%) |
| $75,000 to $99,999 | 181 (17.9%) | 3 (6.1%) |
| $100,000 to $149,999 | 293 (29.0%) | 12 (24.5%) |
| $150,000 or more | 301 (29.8%) | 5 (10.2%) |
| Total | 1,010 (100.0%) | 49 (100.0%) |
Monthly Housing Cost Tiers in Millersburg
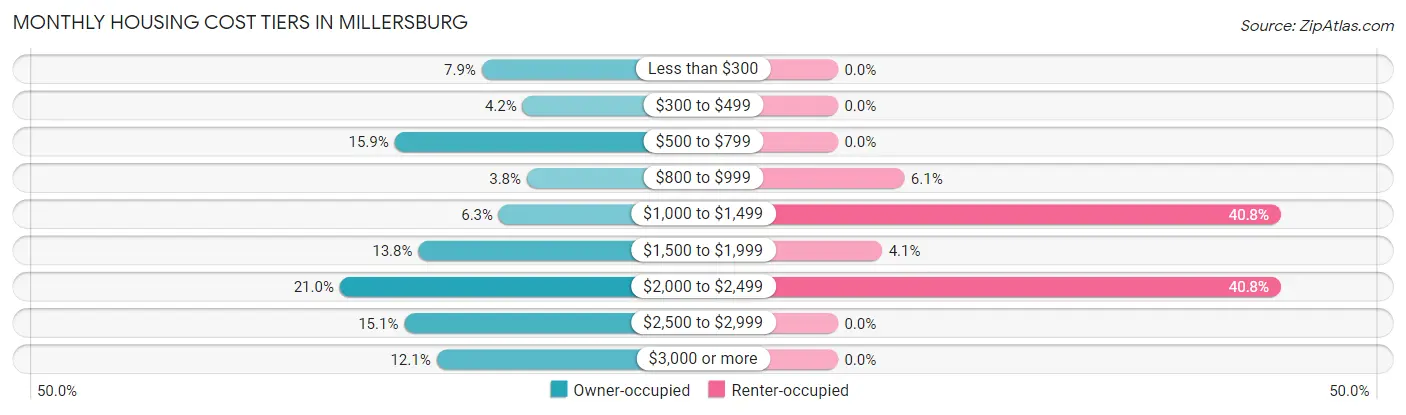
| Monthly Cost | Owner-occupied | Renter-occupied |
| Less than $300 | 80 (7.9%) | 0 (0.0%) |
| $300 to $499 | 42 (4.2%) | 0 (0.0%) |
| $500 to $799 | 161 (15.9%) | 0 (0.0%) |
| $800 to $999 | 38 (3.8%) | 3 (6.1%) |
| $1,000 to $1,499 | 64 (6.3%) | 20 (40.8%) |
| $1,500 to $1,999 | 139 (13.8%) | 2 (4.1%) |
| $2,000 to $2,499 | 212 (21.0%) | 20 (40.8%) |
| $2,500 to $2,999 | 152 (15.0%) | 0 (0.0%) |
| $3,000 or more | 122 (12.1%) | 0 (0.0%) |
| Total | 1,010 (100.0%) | 49 (100.0%) |
Physical Housing Characteristics in Millersburg
Housing Structures in Millersburg
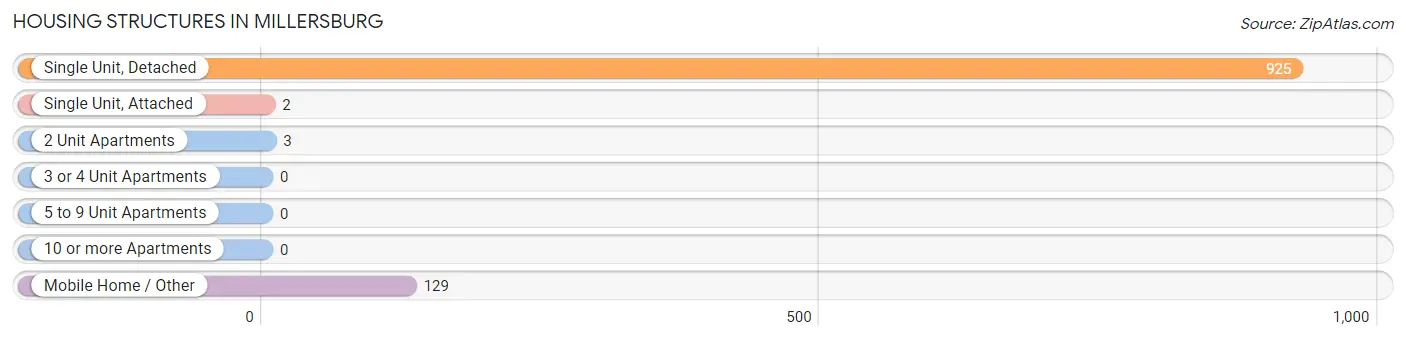
| Structure Type | # Housing Units | % Housing Units |
| Single Unit, Detached | 925 | 87.4% |
| Single Unit, Attached | 2 | 0.2% |
| 2 Unit Apartments | 3 | 0.3% |
| 3 or 4 Unit Apartments | 0 | 0.0% |
| 5 to 9 Unit Apartments | 0 | 0.0% |
| 10 or more Apartments | 0 | 0.0% |
| Mobile Home / Other | 129 | 12.2% |
| Total | 1,059 | 100.0% |
Housing Structures by Occupancy in Millersburg
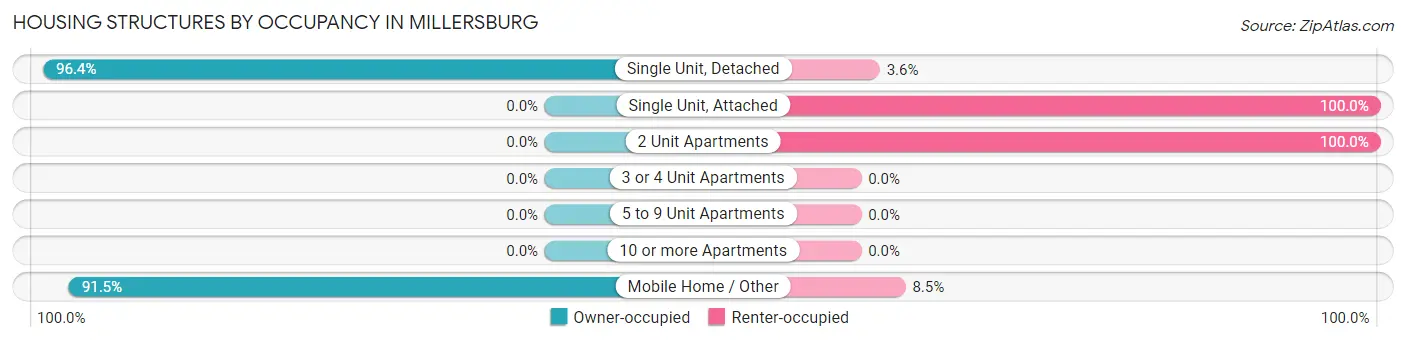
| Structure Type | Owner-occupied | Renter-occupied |
| Single Unit, Detached | 892 (96.4%) | 33 (3.6%) |
| Single Unit, Attached | 0 (0.0%) | 2 (100.0%) |
| 2 Unit Apartments | 0 (0.0%) | 3 (100.0%) |
| 3 or 4 Unit Apartments | 0 (0.0%) | 0 (0.0%) |
| 5 to 9 Unit Apartments | 0 (0.0%) | 0 (0.0%) |
| 10 or more Apartments | 0 (0.0%) | 0 (0.0%) |
| Mobile Home / Other | 118 (91.5%) | 11 (8.5%) |
| Total | 1,010 (95.4%) | 49 (4.6%) |
Housing Structures by Number of Rooms in Millersburg
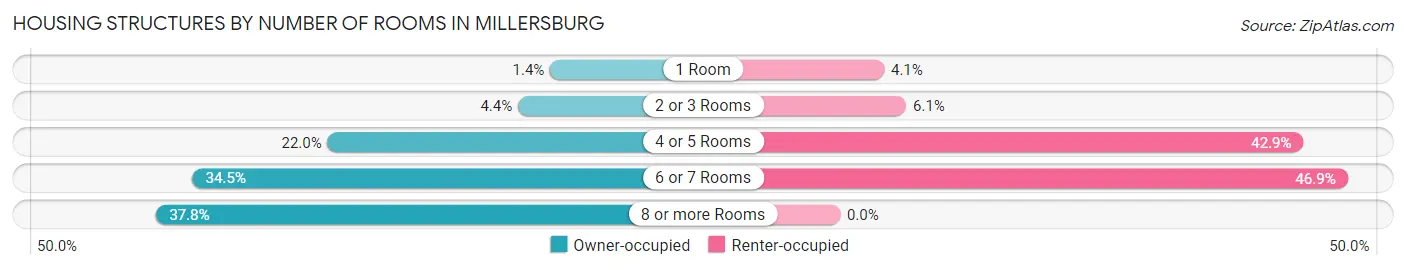
| Number of Rooms | Owner-occupied | Renter-occupied |
| 1 Room | 14 (1.4%) | 2 (4.1%) |
| 2 or 3 Rooms | 44 (4.4%) | 3 (6.1%) |
| 4 or 5 Rooms | 222 (22.0%) | 21 (42.9%) |
| 6 or 7 Rooms | 348 (34.5%) | 23 (46.9%) |
| 8 or more Rooms | 382 (37.8%) | 0 (0.0%) |
| Total | 1,010 (100.0%) | 49 (100.0%) |
Housing Structure by Heating Type in Millersburg
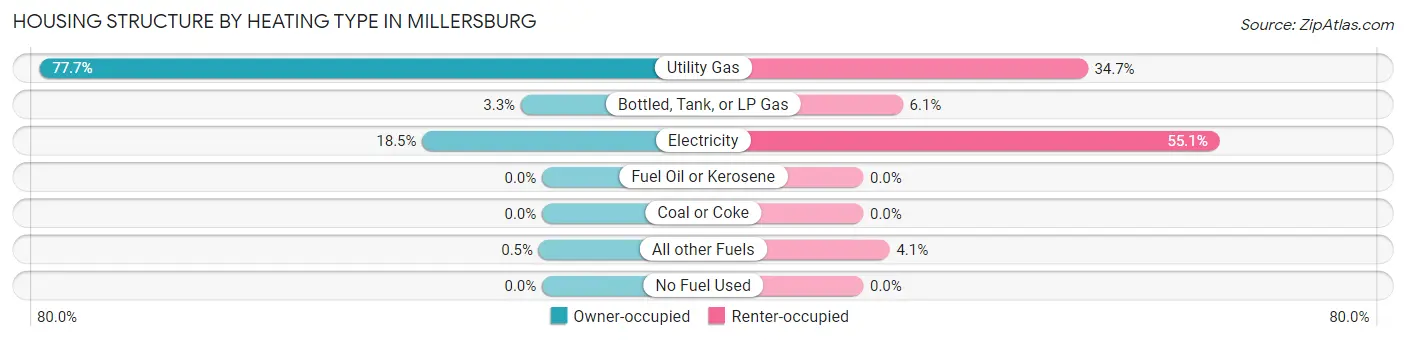
| Heating Type | Owner-occupied | Renter-occupied |
| Utility Gas | 785 (77.7%) | 17 (34.7%) |
| Bottled, Tank, or LP Gas | 33 (3.3%) | 3 (6.1%) |
| Electricity | 187 (18.5%) | 27 (55.1%) |
| Fuel Oil or Kerosene | 0 (0.0%) | 0 (0.0%) |
| Coal or Coke | 0 (0.0%) | 0 (0.0%) |
| All other Fuels | 5 (0.5%) | 2 (4.1%) |
| No Fuel Used | 0 (0.0%) | 0 (0.0%) |
| Total | 1,010 (100.0%) | 49 (100.0%) |
Household Vehicle Usage in Millersburg
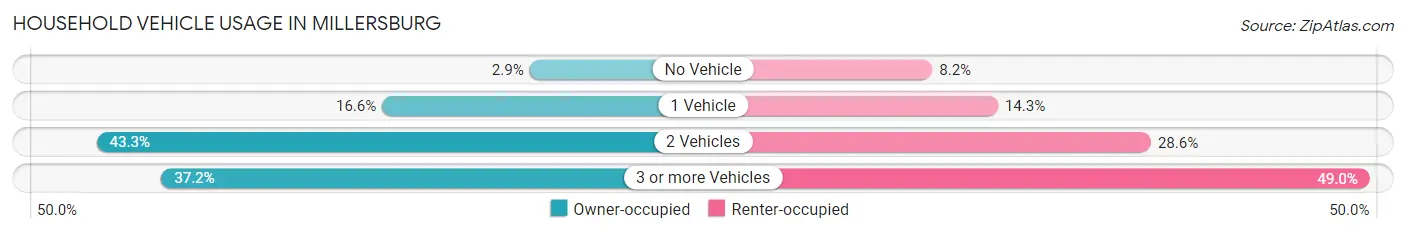
| Vehicles per Household | Owner-occupied | Renter-occupied |
| No Vehicle | 29 (2.9%) | 4 (8.2%) |
| 1 Vehicle | 168 (16.6%) | 7 (14.3%) |
| 2 Vehicles | 437 (43.3%) | 14 (28.6%) |
| 3 or more Vehicles | 376 (37.2%) | 24 (49.0%) |
| Total | 1,010 (100.0%) | 49 (100.0%) |
Real Estate & Mortgages in Millersburg
Real Estate and Mortgage Overview in Millersburg
| Characteristic | Without Mortgage | With Mortgage |
| Housing Units | 332 | 678 |
| Median Property Value | $389,700 | $480,900 |
| Median Household Income | $66,429 | $237 |
| Monthly Housing Costs | $609 | $122 |
| Real Estate Taxes | $3,962 | $0 |
Property Value by Mortgage Status in Millersburg
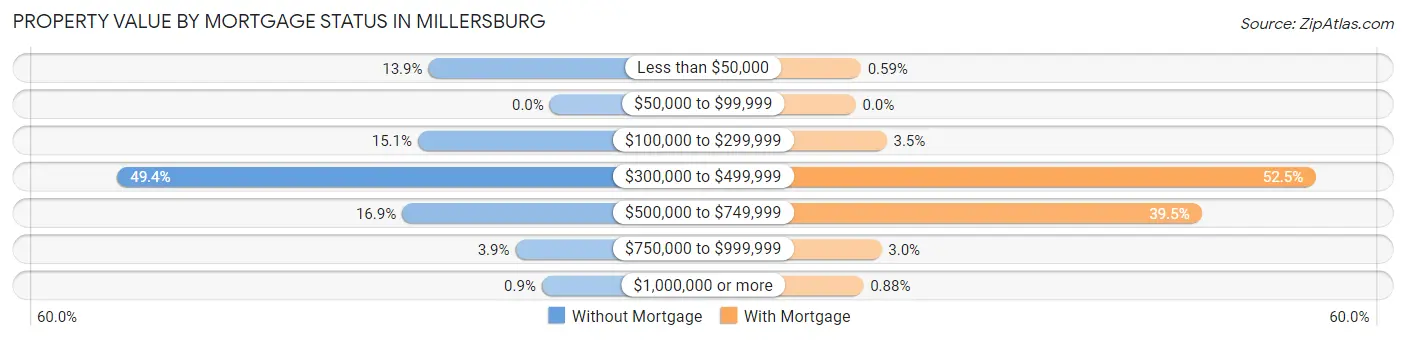
| Property Value | Without Mortgage | With Mortgage |
| Less than $50,000 | 46 (13.9%) | 4 (0.6%) |
| $50,000 to $99,999 | 0 (0.0%) | 0 (0.0%) |
| $100,000 to $299,999 | 50 (15.1%) | 24 (3.5%) |
| $300,000 to $499,999 | 164 (49.4%) | 356 (52.5%) |
| $500,000 to $749,999 | 56 (16.9%) | 268 (39.5%) |
| $750,000 to $999,999 | 13 (3.9%) | 20 (2.9%) |
| $1,000,000 or more | 3 (0.9%) | 6 (0.9%) |
| Total | 332 (100.0%) | 678 (100.0%) |
Household Income by Mortgage Status in Millersburg
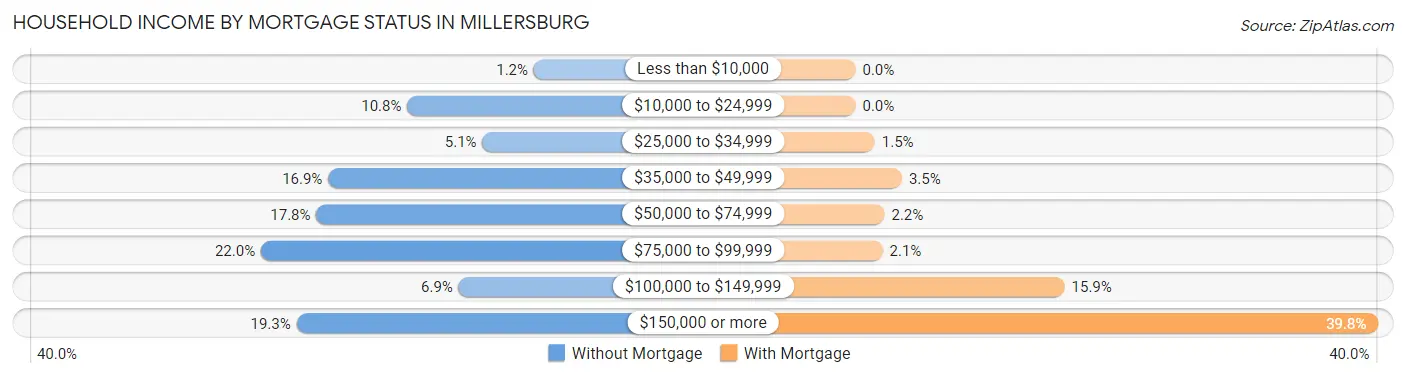
| Household Income | Without Mortgage | With Mortgage |
| Less than $10,000 | 4 (1.2%) | 0 (0.0%) |
| $10,000 to $24,999 | 36 (10.8%) | 0 (0.0%) |
| $25,000 to $34,999 | 17 (5.1%) | 10 (1.5%) |
| $35,000 to $49,999 | 56 (16.9%) | 24 (3.5%) |
| $50,000 to $74,999 | 59 (17.8%) | 15 (2.2%) |
| $75,000 to $99,999 | 73 (22.0%) | 14 (2.1%) |
| $100,000 to $149,999 | 23 (6.9%) | 108 (15.9%) |
| $150,000 or more | 64 (19.3%) | 270 (39.8%) |
| Total | 332 (100.0%) | 678 (100.0%) |
Property Value to Household Income Ratio in Millersburg
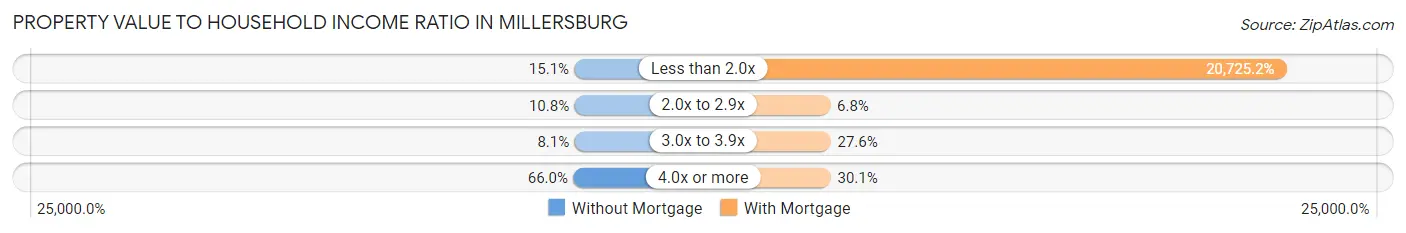
| Value-to-Income Ratio | Without Mortgage | With Mortgage |
| Less than 2.0x | 50 (15.1%) | 140,517 (20,725.2%) |
| 2.0x to 2.9x | 36 (10.8%) | 46 (6.8%) |
| 3.0x to 3.9x | 27 (8.1%) | 187 (27.6%) |
| 4.0x or more | 219 (66.0%) | 204 (30.1%) |
| Total | 332 (100.0%) | 678 (100.0%) |
Real Estate Taxes by Mortgage Status in Millersburg
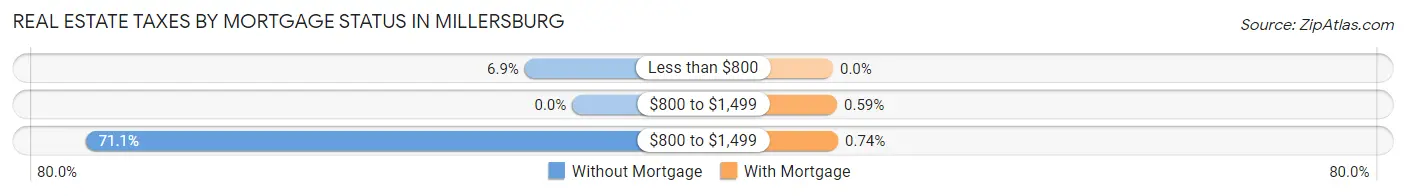
| Property Taxes | Without Mortgage | With Mortgage |
| Less than $800 | 23 (6.9%) | 0 (0.0%) |
| $800 to $1,499 | 0 (0.0%) | 4 (0.6%) |
| $800 to $1,499 | 236 (71.1%) | 5 (0.7%) |
| Total | 332 (100.0%) | 678 (100.0%) |
Health & Disability in Millersburg
Health Insurance Coverage by Age in Millersburg
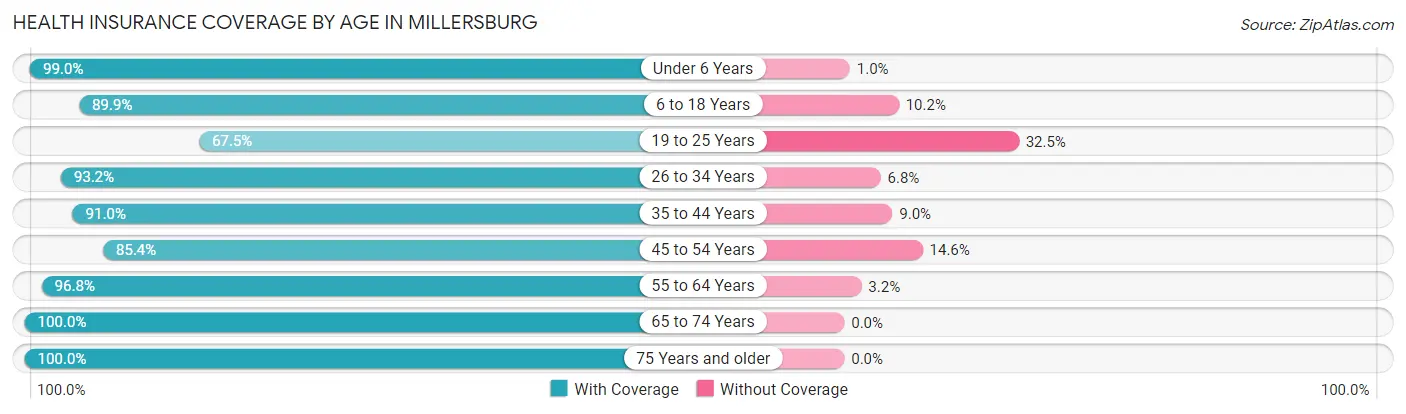
| Age Bracket | With Coverage | Without Coverage |
| Under 6 Years | 287 (99.0%) | 3 (1.0%) |
| 6 to 18 Years | 522 (89.8%) | 59 (10.2%) |
| 19 to 25 Years | 83 (67.5%) | 40 (32.5%) |
| 26 to 34 Years | 179 (93.2%) | 13 (6.8%) |
| 35 to 44 Years | 498 (91.0%) | 49 (9.0%) |
| 45 to 54 Years | 275 (85.4%) | 47 (14.6%) |
| 55 to 64 Years | 425 (96.8%) | 14 (3.2%) |
| 65 to 74 Years | 335 (100.0%) | 0 (0.0%) |
| 75 Years and older | 116 (100.0%) | 0 (0.0%) |
| Total | 2,720 (92.4%) | 225 (7.6%) |
Health Insurance Coverage by Citizenship Status in Millersburg
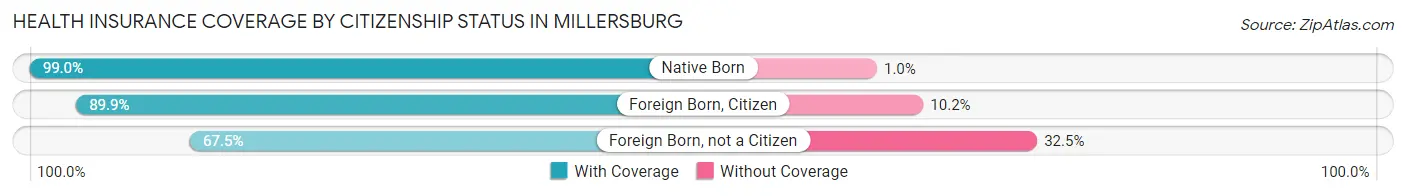
| Citizenship Status | With Coverage | Without Coverage |
| Native Born | 287 (99.0%) | 3 (1.0%) |
| Foreign Born, Citizen | 522 (89.8%) | 59 (10.2%) |
| Foreign Born, not a Citizen | 83 (67.5%) | 40 (32.5%) |
Health Insurance Coverage by Household Income in Millersburg
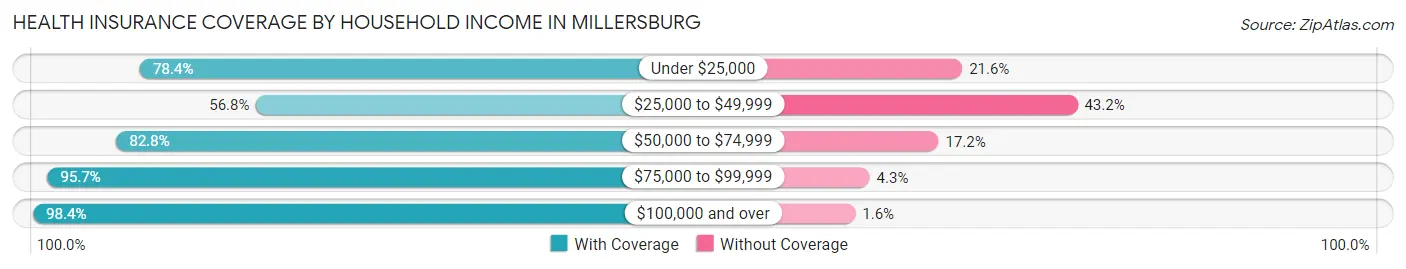
| Household Income | With Coverage | Without Coverage |
| Under $25,000 | 87 (78.4%) | 24 (21.6%) |
| $25,000 to $49,999 | 155 (56.8%) | 118 (43.2%) |
| $50,000 to $74,999 | 159 (82.8%) | 33 (17.2%) |
| $75,000 to $99,999 | 425 (95.7%) | 19 (4.3%) |
| $100,000 and over | 1,890 (98.4%) | 31 (1.6%) |
Public vs Private Health Insurance Coverage by Age in Millersburg
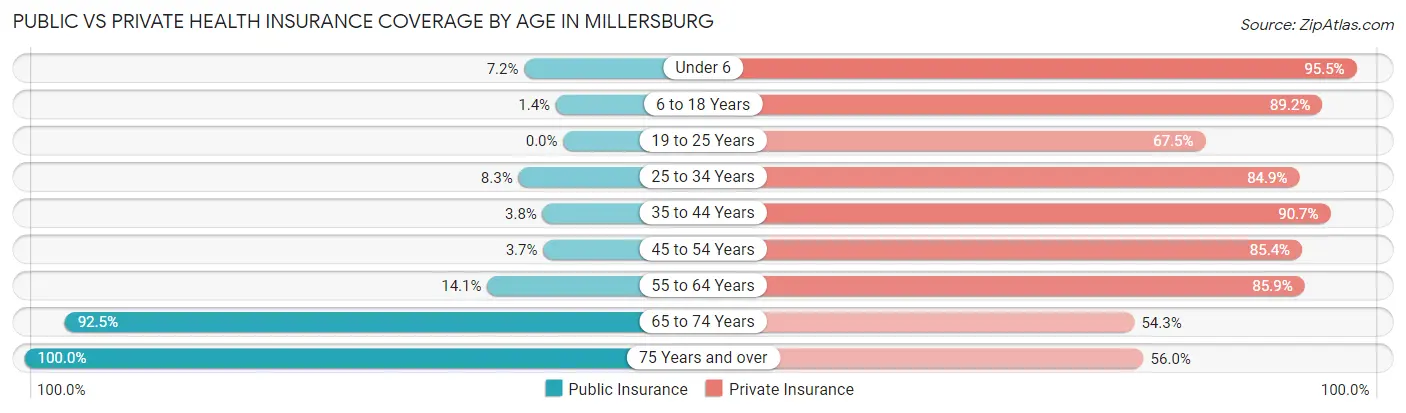
| Age Bracket | Public Insurance | Private Insurance |
| Under 6 | 21 (7.2%) | 277 (95.5%) |
| 6 to 18 Years | 8 (1.4%) | 518 (89.2%) |
| 19 to 25 Years | 0 (0.0%) | 83 (67.5%) |
| 25 to 34 Years | 16 (8.3%) | 163 (84.9%) |
| 35 to 44 Years | 21 (3.8%) | 496 (90.7%) |
| 45 to 54 Years | 12 (3.7%) | 275 (85.4%) |
| 55 to 64 Years | 62 (14.1%) | 377 (85.9%) |
| 65 to 74 Years | 310 (92.5%) | 182 (54.3%) |
| 75 Years and over | 116 (100.0%) | 65 (56.0%) |
| Total | 566 (19.2%) | 2,436 (82.7%) |
Disability Status by Sex by Age in Millersburg
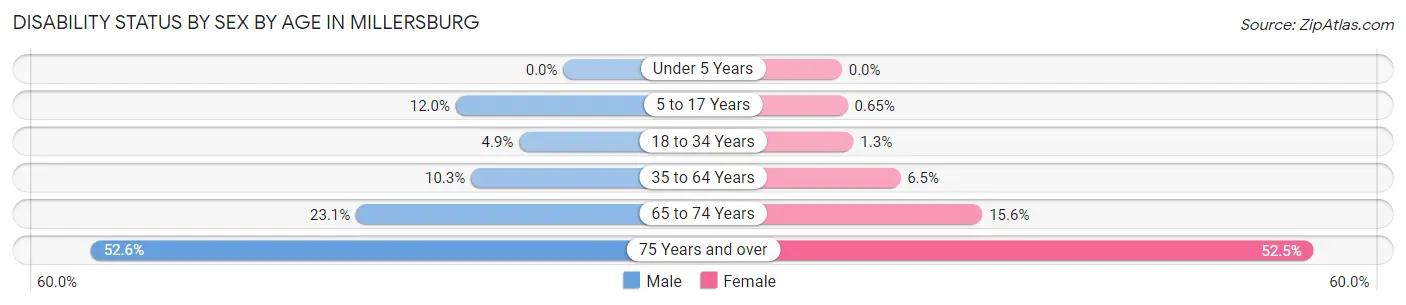
| Age Bracket | Male | Female |
| Under 5 Years | 0 (0.0%) | 0 (0.0%) |
| 5 to 17 Years | 40 (12.0%) | 2 (0.6%) |
| 18 to 34 Years | 9 (4.9%) | 2 (1.3%) |
| 35 to 64 Years | 65 (10.3%) | 44 (6.5%) |
| 65 to 74 Years | 36 (23.1%) | 28 (15.6%) |
| 75 Years and over | 30 (52.6%) | 31 (52.5%) |
Disability Class by Sex by Age in Millersburg
Disability Class: Hearing Difficulty
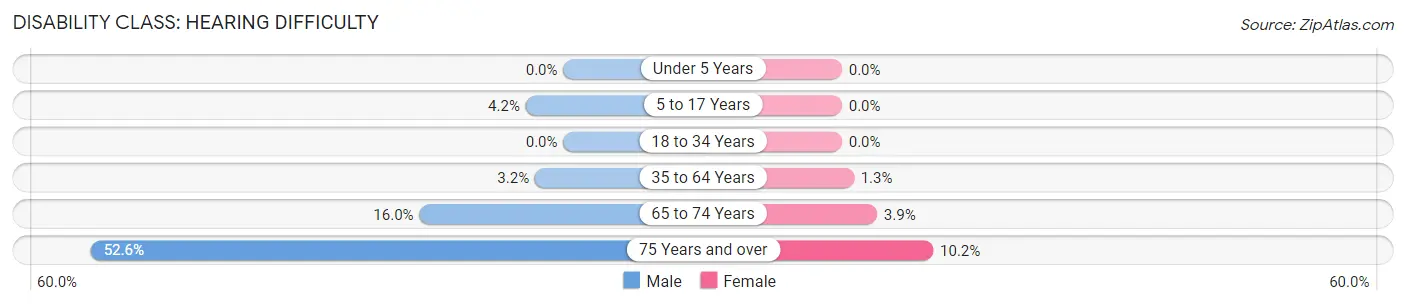
| Age Bracket | Male | Female |
| Under 5 Years | 0 (0.0%) | 0 (0.0%) |
| 5 to 17 Years | 14 (4.2%) | 0 (0.0%) |
| 18 to 34 Years | 0 (0.0%) | 0 (0.0%) |
| 35 to 64 Years | 20 (3.2%) | 9 (1.3%) |
| 65 to 74 Years | 25 (16.0%) | 7 (3.9%) |
| 75 Years and over | 30 (52.6%) | 6 (10.2%) |
Disability Class: Vision Difficulty
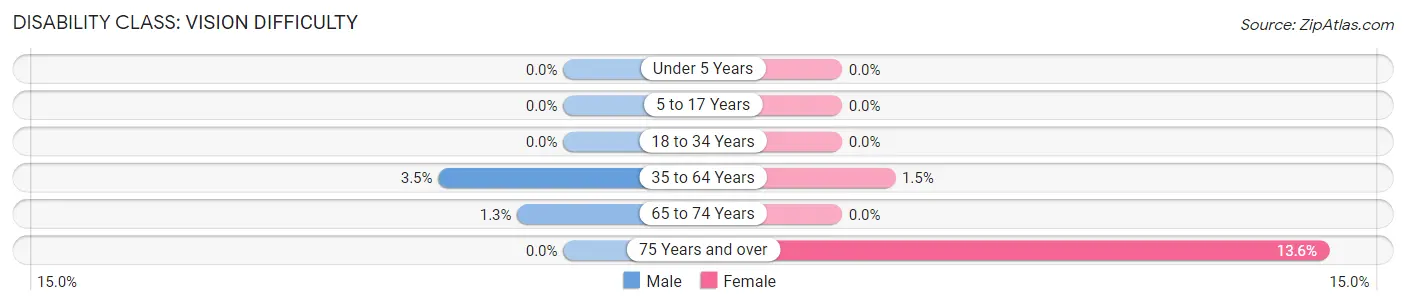
| Age Bracket | Male | Female |
| Under 5 Years | 0 (0.0%) | 0 (0.0%) |
| 5 to 17 Years | 0 (0.0%) | 0 (0.0%) |
| 18 to 34 Years | 0 (0.0%) | 0 (0.0%) |
| 35 to 64 Years | 22 (3.5%) | 10 (1.5%) |
| 65 to 74 Years | 2 (1.3%) | 0 (0.0%) |
| 75 Years and over | 0 (0.0%) | 8 (13.6%) |
Disability Class: Cognitive Difficulty
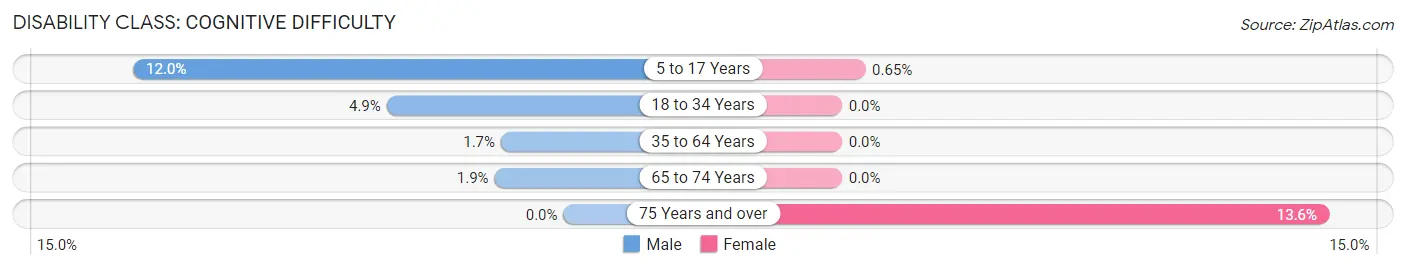
| Age Bracket | Male | Female |
| 5 to 17 Years | 40 (12.0%) | 2 (0.6%) |
| 18 to 34 Years | 9 (4.9%) | 0 (0.0%) |
| 35 to 64 Years | 11 (1.7%) | 0 (0.0%) |
| 65 to 74 Years | 3 (1.9%) | 0 (0.0%) |
| 75 Years and over | 0 (0.0%) | 8 (13.6%) |
Disability Class: Ambulatory Difficulty
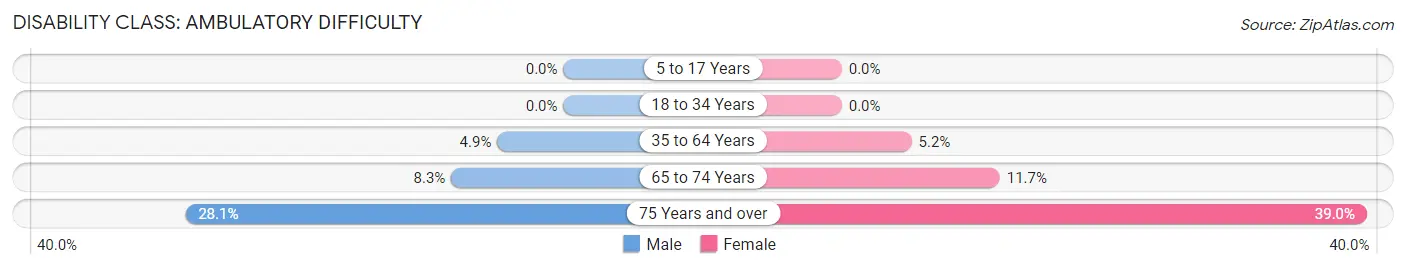
| Age Bracket | Male | Female |
| 5 to 17 Years | 0 (0.0%) | 0 (0.0%) |
| 18 to 34 Years | 0 (0.0%) | 0 (0.0%) |
| 35 to 64 Years | 31 (4.9%) | 35 (5.2%) |
| 65 to 74 Years | 13 (8.3%) | 21 (11.7%) |
| 75 Years and over | 16 (28.1%) | 23 (39.0%) |
Disability Class: Self-Care Difficulty
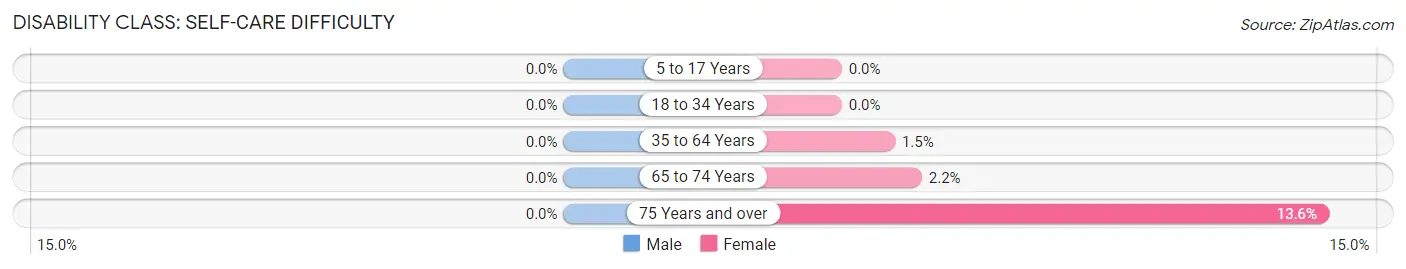
| Age Bracket | Male | Female |
| 5 to 17 Years | 0 (0.0%) | 0 (0.0%) |
| 18 to 34 Years | 0 (0.0%) | 0 (0.0%) |
| 35 to 64 Years | 0 (0.0%) | 10 (1.5%) |
| 65 to 74 Years | 0 (0.0%) | 4 (2.2%) |
| 75 Years and over | 0 (0.0%) | 8 (13.6%) |
Technology Access in Millersburg
Computing Device Access in Millersburg
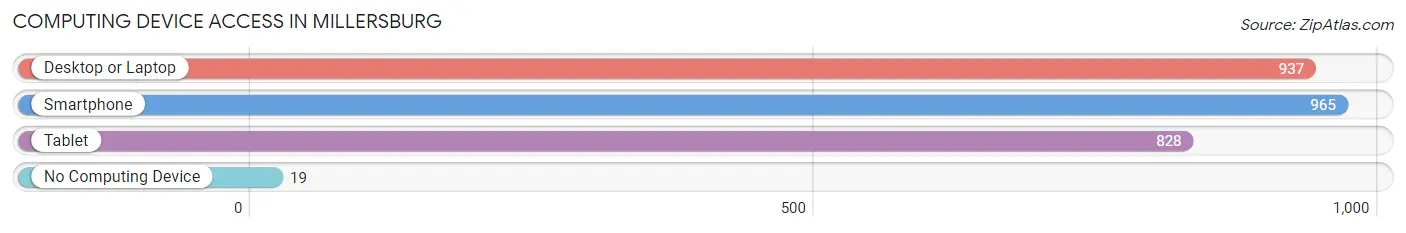
| Device Type | # Households | % Households |
| Desktop or Laptop | 937 | 88.5% |
| Smartphone | 965 | 91.1% |
| Tablet | 828 | 78.2% |
| No Computing Device | 19 | 1.8% |
| Total | 1,059 | 100.0% |
Internet Access in Millersburg
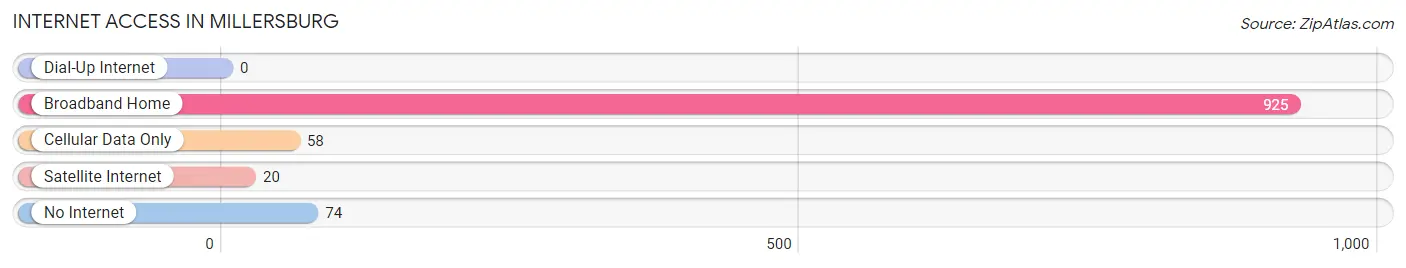
| Internet Type | # Households | % Households |
| Dial-Up Internet | 0 | 0.0% |
| Broadband Home | 925 | 87.4% |
| Cellular Data Only | 58 | 5.5% |
| Satellite Internet | 20 | 1.9% |
| No Internet | 74 | 7.0% |
| Total | 1,059 | 100.0% |
Millersburg Summary
Millerburg is a small unincorporated community located in the Umpqua Valley of Oregon. It is situated in Douglas County, approximately 10 miles south of Roseburg. The town is home to a population of around 500 people and is known for its rural charm and small-town atmosphere.
History
Millerburg was founded in 1853 by a group of settlers from the Midwest. The town was named after the Miller family, who were among the first settlers. The town was originally a farming community, with the main crops being wheat, oats, and hay. In the late 1800s, the town began to grow and develop, with the addition of a post office, a school, and a general store.
In the early 1900s, Millerburg began to experience a period of growth and prosperity. The town was home to several businesses, including a sawmill, a blacksmith shop, and a hotel. The town also had a newspaper, the Millerburg News, which was published from 1908 to 1912.
In the 1920s, Millerburg experienced a decline in population due to the Great Depression. The town was also affected by the Dust Bowl, which caused many of the farmers to leave the area. Despite this, the town managed to survive and continued to be a small farming community.
Geography
Millerburg is located in the Umpqua Valley of Oregon. The town is situated in Douglas County, approximately 10 miles south of Roseburg. The town is surrounded by rolling hills and is situated at an elevation of 1,000 feet. The climate in Millerburg is mild, with temperatures ranging from the mid-30s in the winter to the mid-80s in the summer.
Economy
Millerburg is a small, rural community with a limited economy. The town is home to a few small businesses, including a general store, a gas station, and a restaurant. The town is also home to a few farms, which produce hay, wheat, and oats.
Demographics
As of the 2010 census, Millerburg had a population of 498 people. The racial makeup of the town was 97.2% White, 0.2% African American, 0.4% Native American, 0.2% Asian, 0.2% from other races, and 1.8% from two or more races. The median household income in Millerburg was $37,500, and the median family income was $41,250. The per capita income in Millerburg was $17,845.
Conclusion
Millerburg is a small, rural community located in the Umpqua Valley of Oregon. The town is home to a population of around 500 people and is known for its rural charm and small-town atmosphere. The town is home to a few small businesses, including a general store, a gas station, and a restaurant. The town is also home to a few farms, which produce hay, wheat, and oats. Millerburg has a population that is predominantly White, with a median household income of $37,500 and a median family income of $41,250.
Common Questions
What is the Total Population of Millersburg?
Total Population of Millersburg is 2,964.
What is the Total Male Population of Millersburg?
Total Male Population of Millersburg is 1,460.
What is the Total Female Population of Millersburg?
Total Female Population of Millersburg is 1,504.
What is the Ratio of Males per 100 Females in Millersburg?
There are 97.07 Males per 100 Females in Millersburg.
What is the Ratio of Females per 100 Males in Millersburg?
There are 103.01 Females per 100 Males in Millersburg.
What is the Median Population Age in Millersburg?
Median Population Age in Millersburg is 40.0 Years.
What is the Average Family Size in Millersburg
Average Family Size in Millersburg is 3.1 People.
What is the Average Household Size in Millersburg
Average Household Size in Millersburg is 2.8 People.
What is Per Capita Income in Millersburg?
Per Capita income in Millersburg is $45,425.
What is the Median Family Income in Millersburg?
Median Family Income in Millersburg is $131,513.
What is the Median Household income in Millersburg?
Median Household Income in Millersburg is $119,148.
What is Income or Wage Gap in Millersburg?
Income or Wage Gap in Millersburg is 44.6%.
Women in Millersburg earn 55.4 cents for every dollar earned by a man.
What is Inequality or Gini Index in Millersburg?
Inequality or Gini Index in Millersburg is 0.35.
How Large is the Labor Force in Millersburg?
There are 1,514 People in the Labor Forcein in Millersburg.
What is the Percentage of People in the Labor Force in Millersburg?
70.4% of People are in the Labor Force in Millersburg.
What is the Unemployment Rate in Millersburg?
Unemployment Rate in Millersburg is 2.9%.