Jennings Lodge, OR
Jennings Lodge Map
Jennings Lodge Overview
7,662
TOTAL POPULATION
3,325
MALE POPULATION
4,337
FEMALE POPULATION
76.67
MALES / 100 FEMALES
130.44
FEMALES / 100 MALES
42.4
MEDIAN AGE
2.8
AVG FAMILY SIZE
2.2
AVG HOUSEHOLD SIZE
$37,887
PER CAPITA INCOME
$68,925
AVG FAMILY INCOME
$64,887
AVG HOUSEHOLD INCOME
31.3%
WAGE / INCOME GAP [ % ]
68.7¢/ $1
WAGE / INCOME GAP [ $ ]
0.46
INEQUALITY / GINI INDEX
4,084
LABOR FORCE [ PEOPLE ]
63.1%
PERCENT IN LABOR FORCE
5.8%
UNEMPLOYMENT RATE
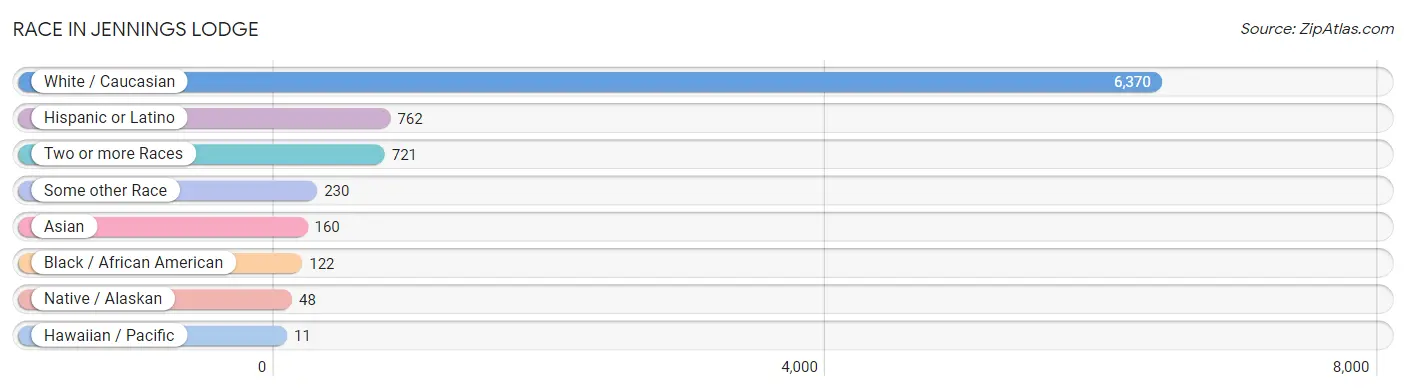
Race in Jennings Lodge
The most populous races in Jennings Lodge are White / Caucasian (6,370 | 83.1%), Hispanic or Latino (762 | 10.0%), and Two or more Races (721 | 9.4%).
| Race | # Population | % Population |
| Asian | 160 | 2.1% |
| Black / African American | 122 | 1.6% |
| Hawaiian / Pacific | 11 | 0.1% |
| Hispanic or Latino | 762 | 10.0% |
| Native / Alaskan | 48 | 0.6% |
| White / Caucasian | 6,370 | 83.1% |
| Two or more Races | 721 | 9.4% |
| Some other Race | 230 | 3.0% |
| Total | 7,662 | 100.0% |
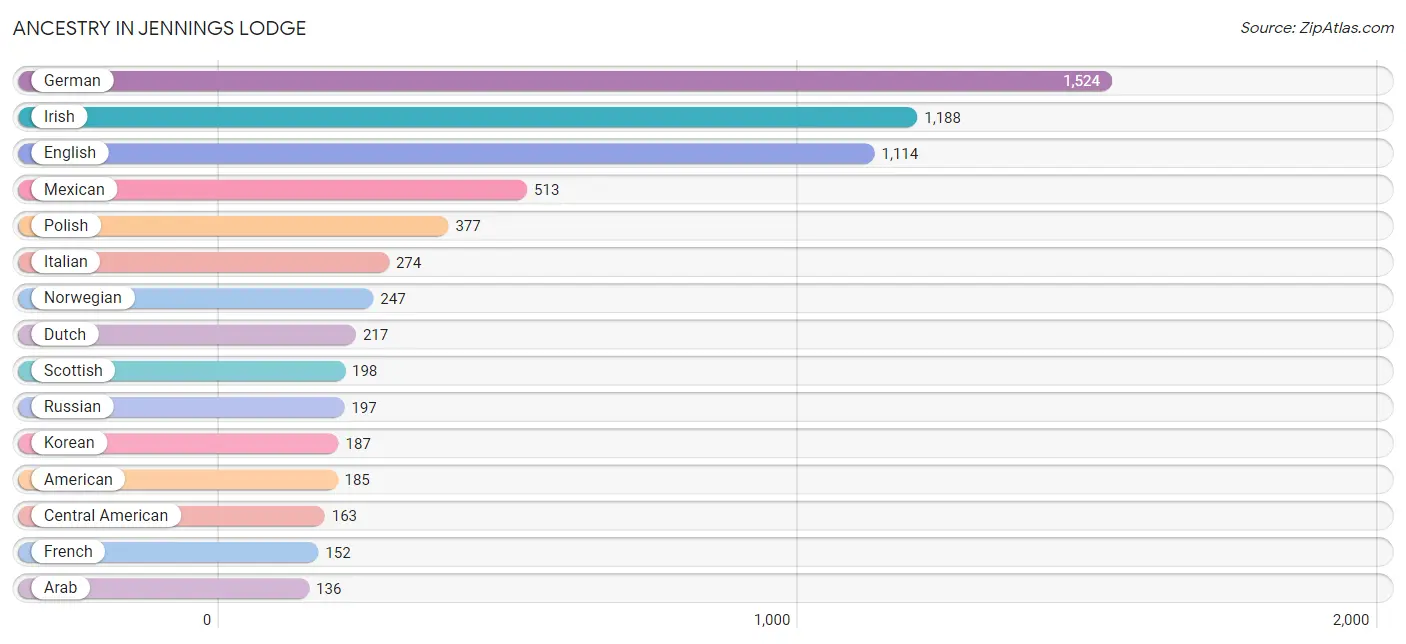
Ancestry in Jennings Lodge
The most populous ancestries reported in Jennings Lodge are German (1,524 | 19.9%), Irish (1,188 | 15.5%), English (1,114 | 14.5%), Mexican (513 | 6.7%), and Polish (377 | 4.9%), together accounting for 61.6% of all Jennings Lodge residents.
| Ancestry | # Population | % Population |
| American | 185 | 2.4% |
| Arab | 136 | 1.8% |
| Austrian | 8 | 0.1% |
| Bhutanese | 15 | 0.2% |
| Blackfeet | 12 | 0.2% |
| Brazilian | 20 | 0.3% |
| British | 93 | 1.2% |
| Canadian | 21 | 0.3% |
| Central American | 163 | 2.1% |
| Central American Indian | 27 | 0.4% |
| Chilean | 14 | 0.2% |
| Chippewa | 47 | 0.6% |
| Cuban | 37 | 0.5% |
| Czech | 20 | 0.3% |
| Czechoslovakian | 28 | 0.4% |
| Danish | 74 | 1.0% |
| Dutch | 217 | 2.8% |
| English | 1,114 | 14.5% |
| Ethiopian | 44 | 0.6% |
| European | 124 | 1.6% |
| Finnish | 26 | 0.3% |
| French | 152 | 2.0% |
| French Canadian | 48 | 0.6% |
| German | 1,524 | 19.9% |
| Greek | 119 | 1.5% |
| Guatemalan | 115 | 1.5% |
| Indian (Asian) | 20 | 0.3% |
| Iraqi | 136 | 1.8% |
| Irish | 1,188 | 15.5% |
| Iroquois | 26 | 0.3% |
| Italian | 274 | 3.6% |
| Korean | 187 | 2.4% |
| Lithuanian | 10 | 0.1% |
| Malaysian | 52 | 0.7% |
| Mexican | 513 | 6.7% |
| Mexican American Indian | 15 | 0.2% |
| Native Hawaiian | 11 | 0.1% |
| Norwegian | 247 | 3.2% |
| Polish | 377 | 4.9% |
| Portuguese | 12 | 0.2% |
| Puerto Rican | 10 | 0.1% |
| Romanian | 13 | 0.2% |
| Russian | 197 | 2.6% |
| Salvadoran | 48 | 0.6% |
| Scotch-Irish | 48 | 0.6% |
| Scottish | 198 | 2.6% |
| Serbian | 13 | 0.2% |
| Sioux | 47 | 0.6% |
| Slovene | 10 | 0.1% |
| South American | 14 | 0.2% |
| Spanish | 25 | 0.3% |
| Sri Lankan | 52 | 0.7% |
| Subsaharan African | 44 | 0.6% |
| Swedish | 128 | 1.7% |
| Ukrainian | 46 | 0.6% |
| Ute | 37 | 0.5% |
| Welsh | 26 | 0.3% | View All 57 Rows |
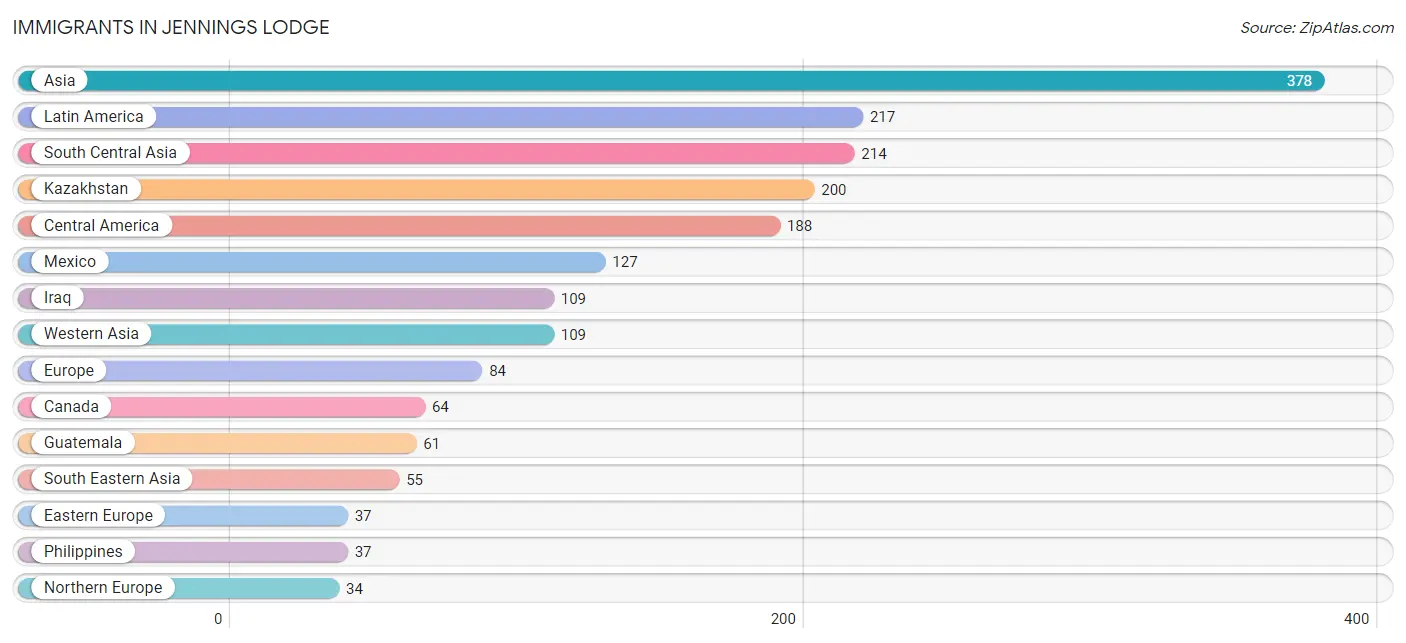
Immigrants in Jennings Lodge
The most numerous immigrant groups reported in Jennings Lodge came from Asia (378 | 4.9%), Latin America (217 | 2.8%), South Central Asia (214 | 2.8%), Kazakhstan (200 | 2.6%), and Central America (188 | 2.5%), together accounting for 15.6% of all Jennings Lodge residents.
| Immigration Origin | # Population | % Population |
| Africa | 15 | 0.2% |
| Asia | 378 | 4.9% |
| Canada | 64 | 0.8% |
| Caribbean | 29 | 0.4% |
| Central America | 188 | 2.5% |
| Cuba | 29 | 0.4% |
| Eastern Africa | 15 | 0.2% |
| Eastern Europe | 37 | 0.5% |
| Ethiopia | 15 | 0.2% |
| Europe | 84 | 1.1% |
| Germany | 13 | 0.2% |
| Guatemala | 61 | 0.8% |
| Iraq | 109 | 1.4% |
| Kazakhstan | 200 | 2.6% |
| Laos | 18 | 0.2% |
| Latin America | 217 | 2.8% |
| Mexico | 127 | 1.7% |
| Moldova | 12 | 0.2% |
| Northern Europe | 34 | 0.4% |
| Pakistan | 14 | 0.2% |
| Philippines | 37 | 0.5% |
| South Central Asia | 214 | 2.8% |
| South Eastern Asia | 55 | 0.7% |
| Ukraine | 25 | 0.3% |
| Western Asia | 109 | 1.4% |
| Western Europe | 13 | 0.2% | View All 26 Rows |
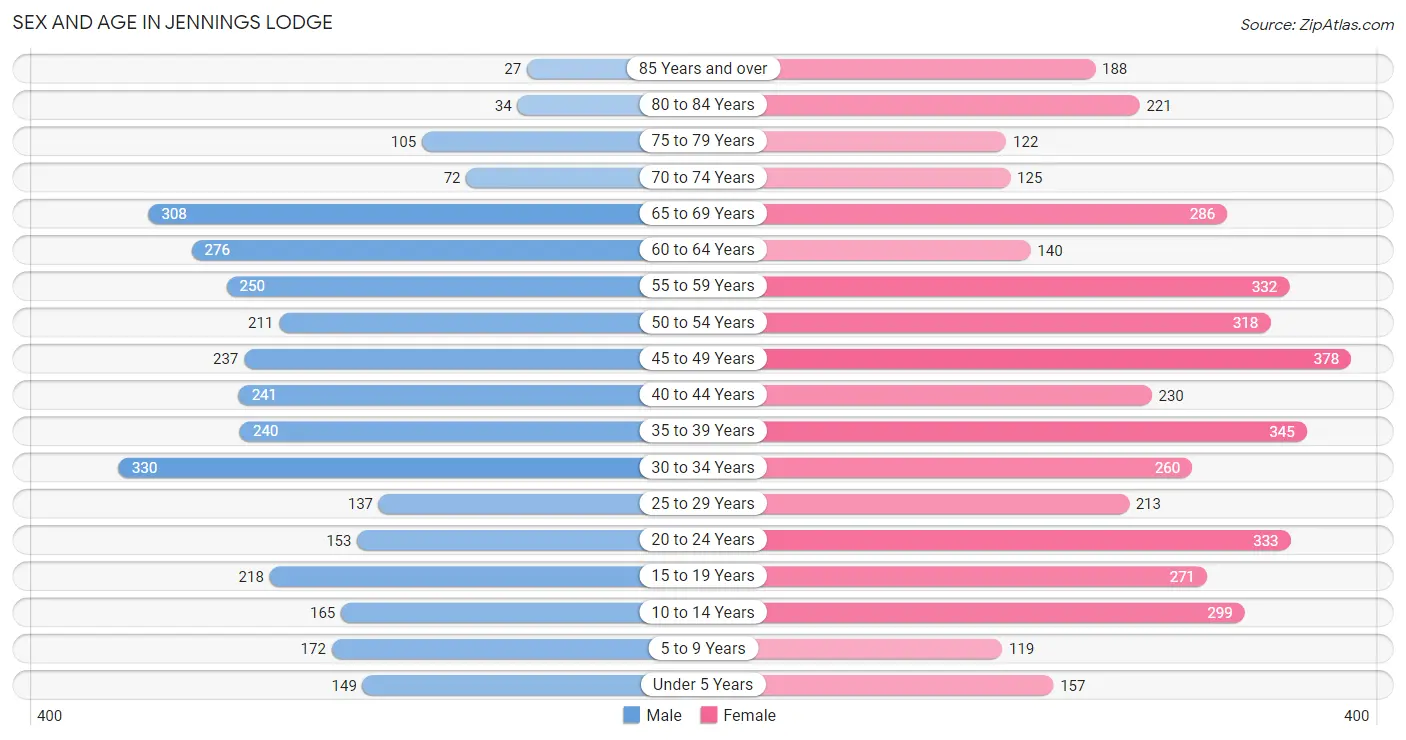
Sex and Age in Jennings Lodge
Sex and Age in Jennings Lodge
The most populous age groups in Jennings Lodge are 30 to 34 Years (330 | 9.9%) for men and 45 to 49 Years (378 | 8.7%) for women.
| Age Bracket | Male | Female |
| Under 5 Years | 149 (4.5%) | 157 (3.6%) |
| 5 to 9 Years | 172 (5.2%) | 119 (2.7%) |
| 10 to 14 Years | 165 (5.0%) | 299 (6.9%) |
| 15 to 19 Years | 218 (6.6%) | 271 (6.2%) |
| 20 to 24 Years | 153 (4.6%) | 333 (7.7%) |
| 25 to 29 Years | 137 (4.1%) | 213 (4.9%) |
| 30 to 34 Years | 330 (9.9%) | 260 (6.0%) |
| 35 to 39 Years | 240 (7.2%) | 345 (8.0%) |
| 40 to 44 Years | 241 (7.2%) | 230 (5.3%) |
| 45 to 49 Years | 237 (7.1%) | 378 (8.7%) |
| 50 to 54 Years | 211 (6.4%) | 318 (7.3%) |
| 55 to 59 Years | 250 (7.5%) | 332 (7.7%) |
| 60 to 64 Years | 276 (8.3%) | 140 (3.2%) |
| 65 to 69 Years | 308 (9.3%) | 286 (6.6%) |
| 70 to 74 Years | 72 (2.2%) | 125 (2.9%) |
| 75 to 79 Years | 105 (3.2%) | 122 (2.8%) |
| 80 to 84 Years | 34 (1.0%) | 221 (5.1%) |
| 85 Years and over | 27 (0.8%) | 188 (4.3%) |
| Total | 3,325 (100.0%) | 4,337 (100.0%) |
Families and Households in Jennings Lodge
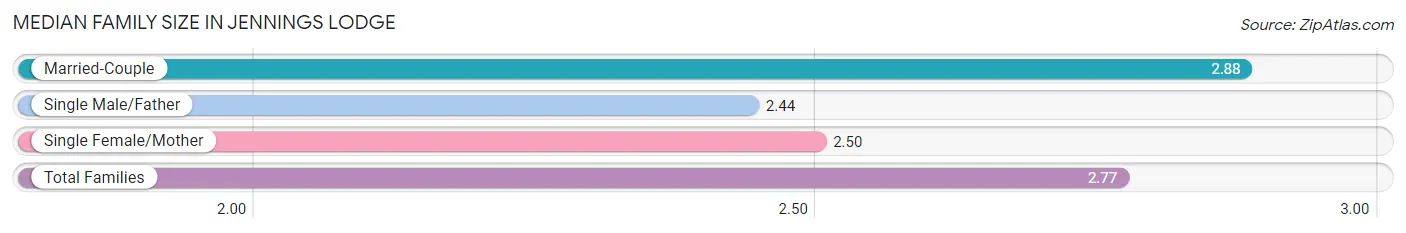
Median Family Size in Jennings Lodge
The median family size in Jennings Lodge is 2.77 persons per family, with married-couple families (1,519 | 71.8%) accounting for the largest median family size of 2.88 persons per family. On the other hand, single male/father families (62 | 2.9%) represent the smallest median family size with 2.44 persons per family.
| Family Type | # Families | Family Size |
| Married-Couple | 1,519 (71.8%) | 2.88 |
| Single Male/Father | 62 (2.9%) | 2.44 |
| Single Female/Mother | 534 (25.3%) | 2.50 |
| Total Families | 2,115 (100.0%) | 2.77 |
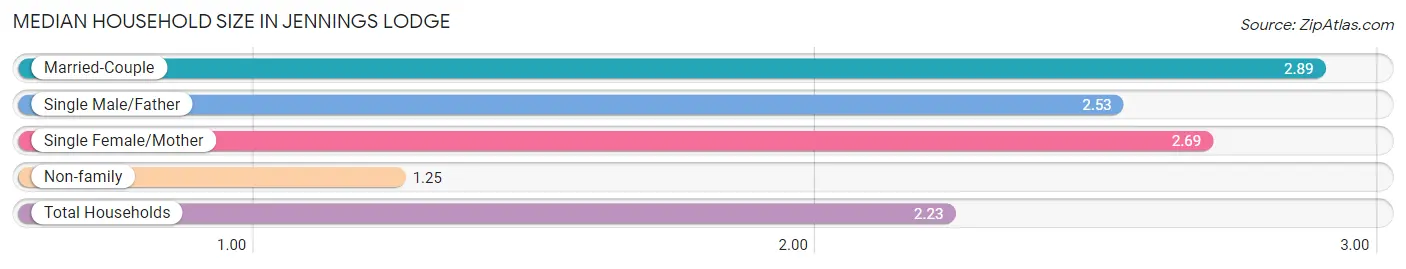
Median Household Size in Jennings Lodge
The median household size in Jennings Lodge is 2.23 persons per household, with married-couple households (1,519 | 44.5%) accounting for the largest median household size of 2.89 persons per household. non-family households (1,298 | 38.0%) represent the smallest median household size with 1.25 persons per household.
| Household Type | # Households | Household Size |
| Married-Couple | 1,519 (44.5%) | 2.89 |
| Single Male/Father | 62 (1.8%) | 2.53 |
| Single Female/Mother | 534 (15.7%) | 2.69 |
| Non-family | 1,298 (38.0%) | 1.25 |
| Total Households | 3,413 (100.0%) | 2.23 |
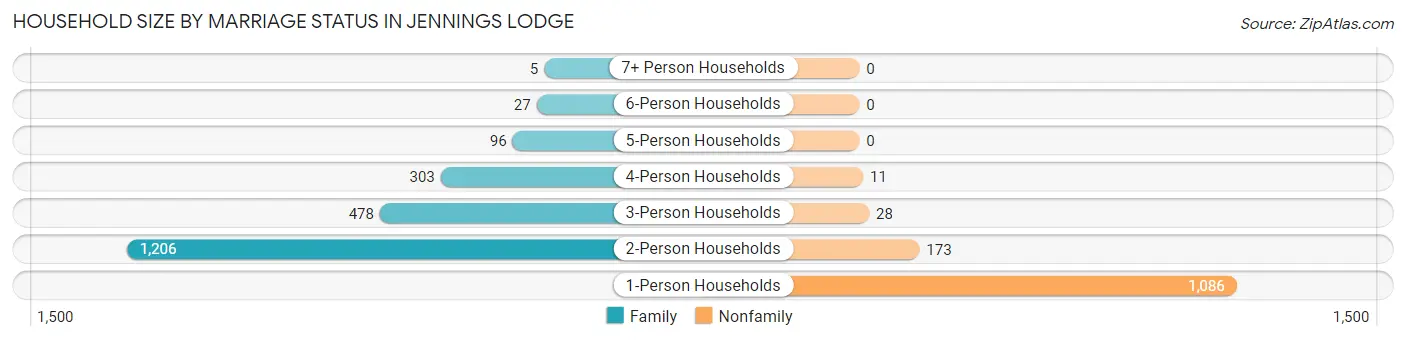
Household Size by Marriage Status in Jennings Lodge
Out of a total of 3,413 households in Jennings Lodge, 2,115 (62.0%) are family households, while 1,298 (38.0%) are nonfamily households. The most numerous type of family households are 2-person households, comprising 1,206, and the most common type of nonfamily households are 1-person households, comprising 1,086.
| Household Size | Family Households | Nonfamily Households |
| 1-Person Households | - | 1,086 (31.8%) |
| 2-Person Households | 1,206 (35.3%) | 173 (5.1%) |
| 3-Person Households | 478 (14.0%) | 28 (0.8%) |
| 4-Person Households | 303 (8.9%) | 11 (0.3%) |
| 5-Person Households | 96 (2.8%) | 0 (0.0%) |
| 6-Person Households | 27 (0.8%) | 0 (0.0%) |
| 7+ Person Households | 5 (0.2%) | 0 (0.0%) |
| Total | 2,115 (62.0%) | 1,298 (38.0%) |
Female Fertility in Jennings Lodge
Fertility by Age in Jennings Lodge
Average fertility rate in Jennings Lodge is 36.0 births per 1,000 women. Women in the age bracket of 35 to 50 years have the highest fertility rate with 45.0 births per 1,000 women. Women in the age bracket of 35 to 50 years acount for 58.9% of all women with births.
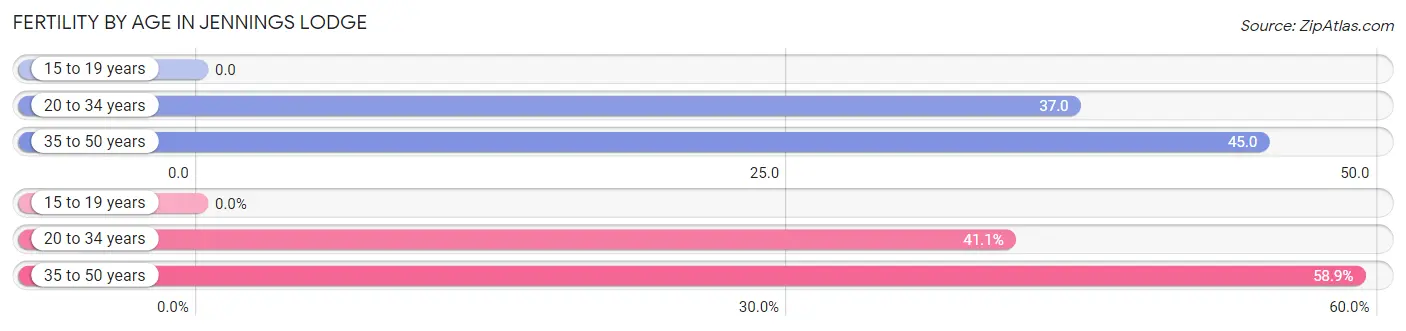
| Age Bracket | Women with Births | Births / 1,000 Women |
| 15 to 19 years | 0 (0.0%) | 0.0 |
| 20 to 34 years | 30 (41.1%) | 37.0 |
| 35 to 50 years | 43 (58.9%) | 45.0 |
| Total | 73 (100.0%) | 36.0 |
Fertility by Age by Marriage Status in Jennings Lodge
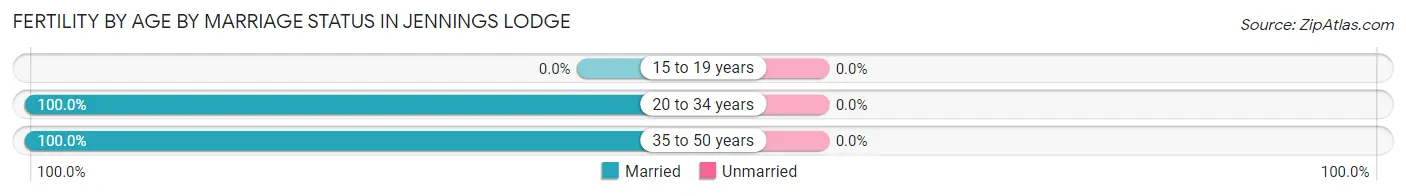
| Age Bracket | Married | Unmarried |
| 15 to 19 years | 0 (0.0%) | 0 (0.0%) |
| 20 to 34 years | 30 (100.0%) | 0 (0.0%) |
| 35 to 50 years | 43 (100.0%) | 0 (0.0%) |
| Total | 73 (100.0%) | 0 (0.0%) |
Fertility by Education in Jennings Lodge
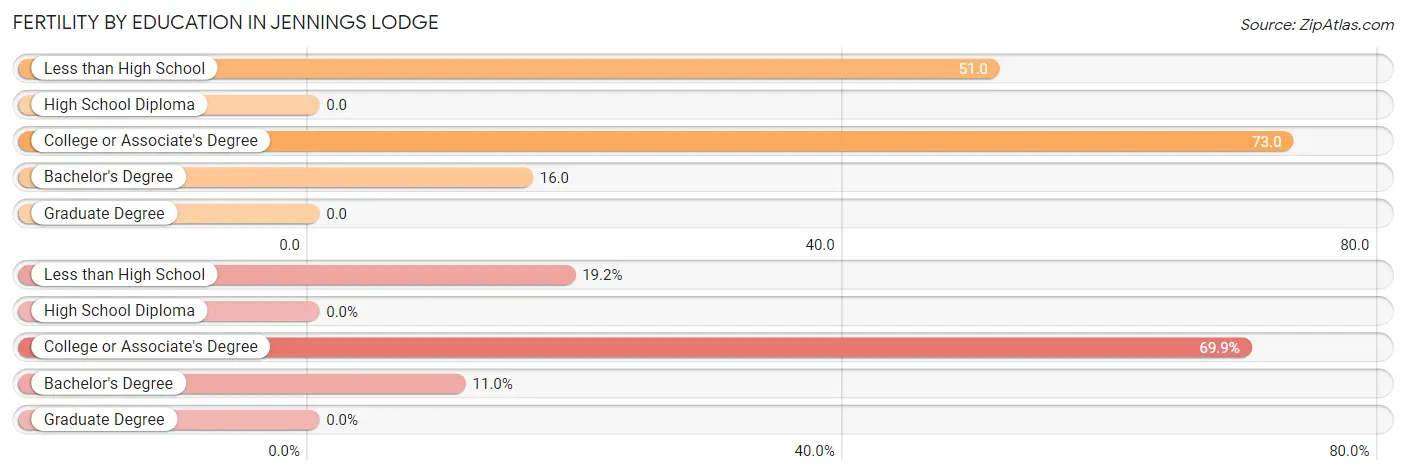
| Educational Attainment | Women with Births | Births / 1,000 Women |
| Less than High School | 14 (19.2%) | 51.0 |
| High School Diploma | 0 (0.0%) | 0.0 |
| College or Associate's Degree | 51 (69.9%) | 73.0 |
| Bachelor's Degree | 8 (11.0%) | 16.0 |
| Graduate Degree | 0 (0.0%) | 0.0 |
| Total | 73 (100.0%) | 36.0 |
Fertility by Education by Marriage Status in Jennings Lodge
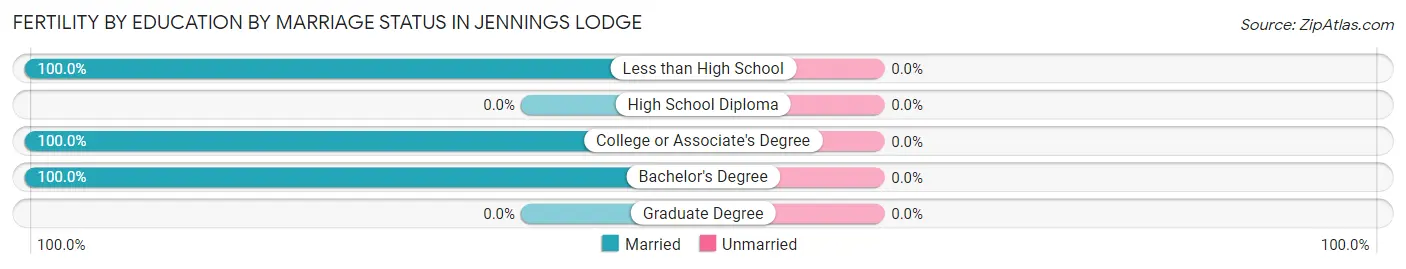
| Educational Attainment | Married | Unmarried |
| Less than High School | 14 (100.0%) | 0 (0.0%) |
| High School Diploma | 0 (0.0%) | 0 (0.0%) |
| College or Associate's Degree | 51 (100.0%) | 0 (0.0%) |
| Bachelor's Degree | 8 (100.0%) | 0 (0.0%) |
| Graduate Degree | 0 (0.0%) | 0 (0.0%) |
| Total | 73 (100.0%) | 0 (0.0%) |
Income in Jennings Lodge
Income Overview in Jennings Lodge
Per Capita Income in Jennings Lodge is $37,887, while median incomes of families and households are $68,925 and $64,887 respectively.
| Characteristic | Number | Measure |
| Per Capita Income | 7,662 | $37,887 |
| Median Family Income | 2,115 | $68,925 |
| Mean Family Income | 2,115 | $94,701 |
| Median Household Income | 3,413 | $64,887 |
| Mean Household Income | 3,413 | $83,071 |
| Income Deficit | 2,115 | $0 |
| Wage / Income Gap (%) | 7,662 | 31.28% |
| Wage / Income Gap ($) | 7,662 | 68.72¢ per $1 |
| Gini / Inequality Index | 7,662 | 0.46 |
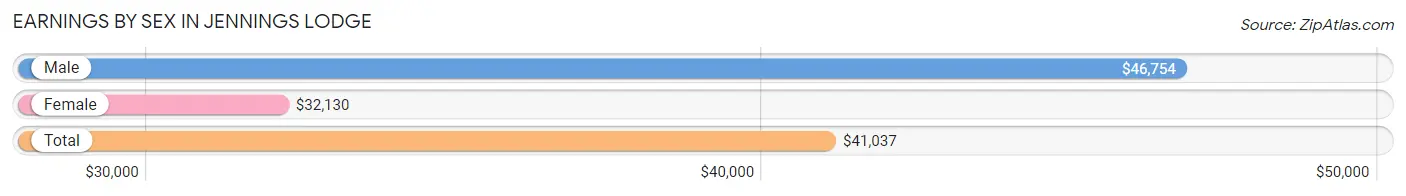
Earnings by Sex in Jennings Lodge
Average Earnings in Jennings Lodge are $41,037, $46,754 for men and $32,130 for women, a difference of 31.3%.
| Sex | Number | Average Earnings |
| Male | 1,932 (45.4%) | $46,754 |
| Female | 2,322 (54.6%) | $32,130 |
| Total | 4,254 (100.0%) | $41,037 |
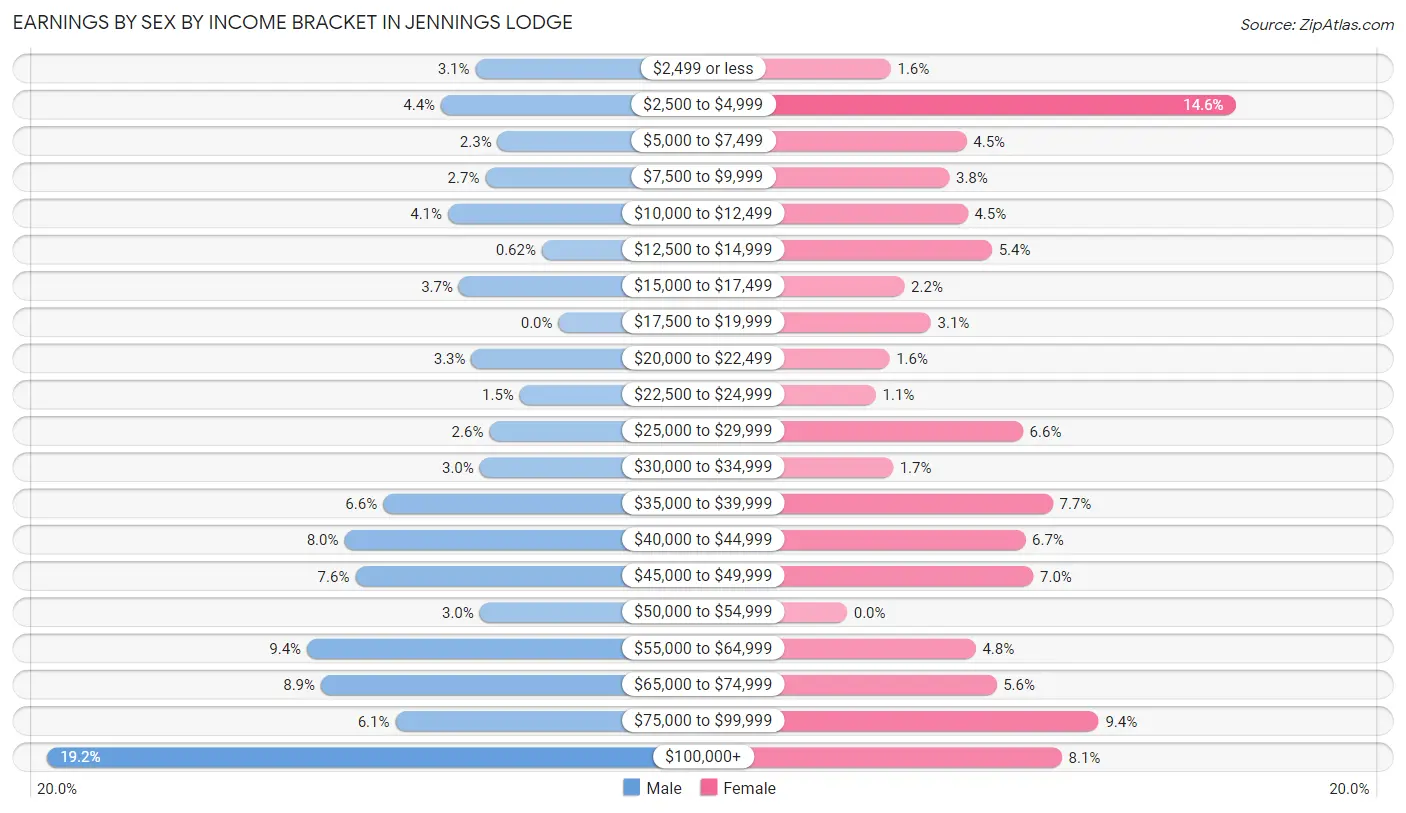
Earnings by Sex by Income Bracket in Jennings Lodge
The most common earnings brackets in Jennings Lodge are $100,000+ for men (370 | 19.2%) and $2,500 to $4,999 for women (338 | 14.6%).
| Income | Male | Female |
| $2,499 or less | 60 (3.1%) | 38 (1.6%) |
| $2,500 to $4,999 | 85 (4.4%) | 338 (14.6%) |
| $5,000 to $7,499 | 44 (2.3%) | 104 (4.5%) |
| $7,500 to $9,999 | 53 (2.7%) | 89 (3.8%) |
| $10,000 to $12,499 | 80 (4.1%) | 105 (4.5%) |
| $12,500 to $14,999 | 12 (0.6%) | 126 (5.4%) |
| $15,000 to $17,499 | 72 (3.7%) | 50 (2.1%) |
| $17,500 to $19,999 | 0 (0.0%) | 73 (3.1%) |
| $20,000 to $22,499 | 63 (3.3%) | 37 (1.6%) |
| $22,500 to $24,999 | 28 (1.5%) | 25 (1.1%) |
| $25,000 to $29,999 | 50 (2.6%) | 153 (6.6%) |
| $30,000 to $34,999 | 57 (2.9%) | 40 (1.7%) |
| $35,000 to $39,999 | 127 (6.6%) | 179 (7.7%) |
| $40,000 to $44,999 | 155 (8.0%) | 155 (6.7%) |
| $45,000 to $49,999 | 147 (7.6%) | 162 (7.0%) |
| $50,000 to $54,999 | 57 (2.9%) | 0 (0.0%) |
| $55,000 to $64,999 | 182 (9.4%) | 112 (4.8%) |
| $65,000 to $74,999 | 172 (8.9%) | 130 (5.6%) |
| $75,000 to $99,999 | 118 (6.1%) | 219 (9.4%) |
| $100,000+ | 370 (19.2%) | 187 (8.1%) |
| Total | 1,932 (100.0%) | 2,322 (100.0%) |
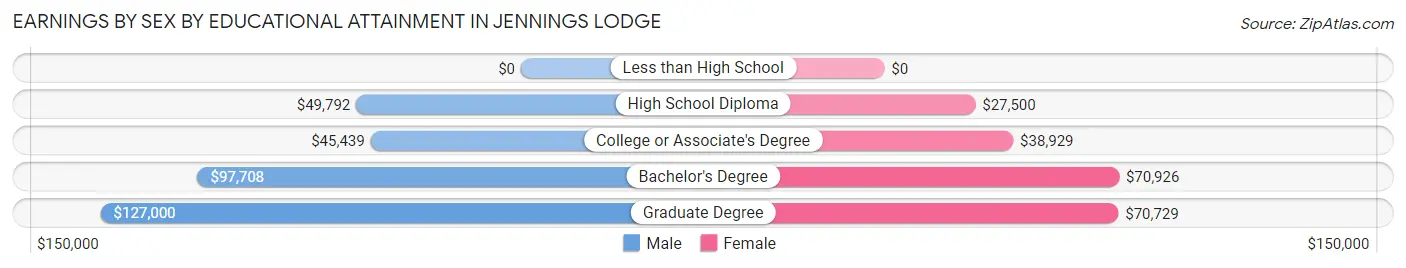
Earnings by Sex by Educational Attainment in Jennings Lodge
Average earnings in Jennings Lodge are $49,242 for men and $41,071 for women, a difference of 16.6%. Men with an educational attainment of graduate degree enjoy the highest average annual earnings of $127,000, while those with college or associate's degree education earn the least with $45,439. Women with an educational attainment of bachelor's degree earn the most with the average annual earnings of $70,926, while those with high school diploma education have the smallest earnings of $27,500.
| Educational Attainment | Male Income | Female Income |
| Less than High School | - | - |
| High School Diploma | $49,792 | $27,500 |
| College or Associate's Degree | $45,439 | $38,929 |
| Bachelor's Degree | $97,708 | $70,926 |
| Graduate Degree | $127,000 | $70,729 |
| Total | $49,242 | $41,071 |
Family Income in Jennings Lodge
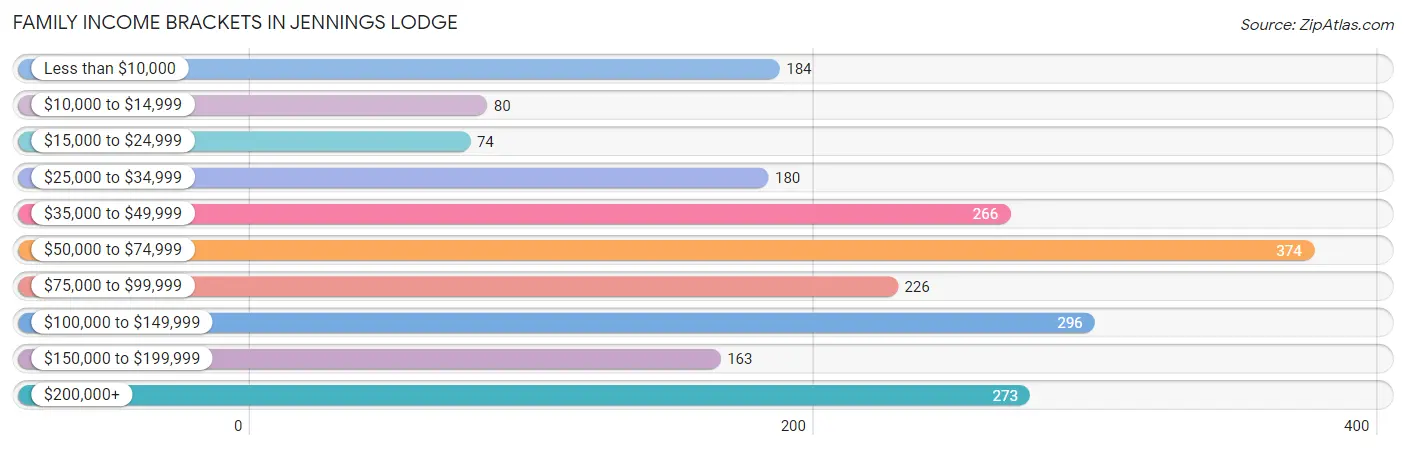
Family Income Brackets in Jennings Lodge
According to the Jennings Lodge family income data, there are 374 families falling into the $50,000 to $74,999 income range, which is the most common income bracket and makes up 17.7% of all families. Conversely, the $15,000 to $24,999 income bracket is the least frequent group with only 74 families (3.5%) belonging to this category.
| Income Bracket | # Families | % Families |
| Less than $10,000 | 184 | 8.7% |
| $10,000 to $14,999 | 80 | 3.8% |
| $15,000 to $24,999 | 74 | 3.5% |
| $25,000 to $34,999 | 180 | 8.5% |
| $35,000 to $49,999 | 266 | 12.6% |
| $50,000 to $74,999 | 374 | 17.7% |
| $75,000 to $99,999 | 226 | 10.7% |
| $100,000 to $149,999 | 296 | 14.0% |
| $150,000 to $199,999 | 163 | 7.7% |
| $200,000+ | 273 | 12.9% |
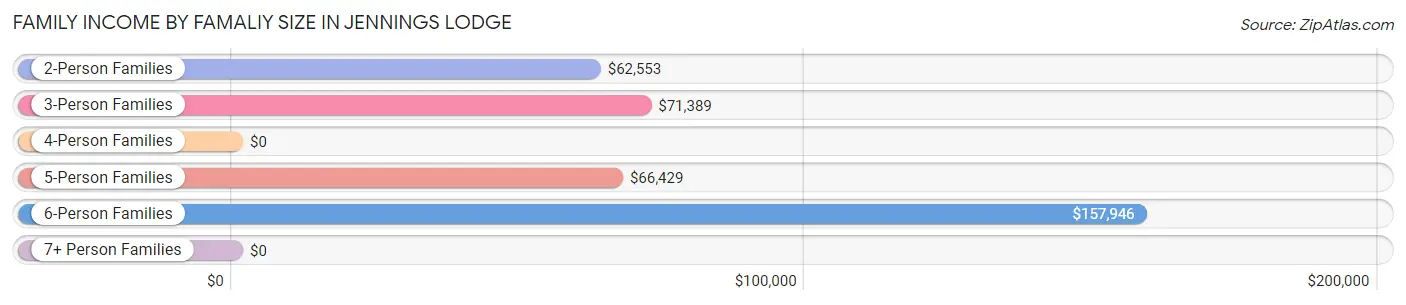
Family Income by Famaliy Size in Jennings Lodge
6-person families (23 | 1.1%) account for the highest median family income in Jennings Lodge with $157,946 per family, while 2-person families (1,302 | 61.6%) have the highest median income of $31,276 per family member.
| Income Bracket | # Families | Median Income |
| 2-Person Families | 1,302 (61.6%) | $62,553 |
| 3-Person Families | 382 (18.1%) | $71,389 |
| 4-Person Families | 312 (14.7%) | $0 |
| 5-Person Families | 96 (4.5%) | $66,429 |
| 6-Person Families | 23 (1.1%) | $157,946 |
| 7+ Person Families | 0 (0.0%) | $0 |
| Total | 2,115 (100.0%) | $68,925 |
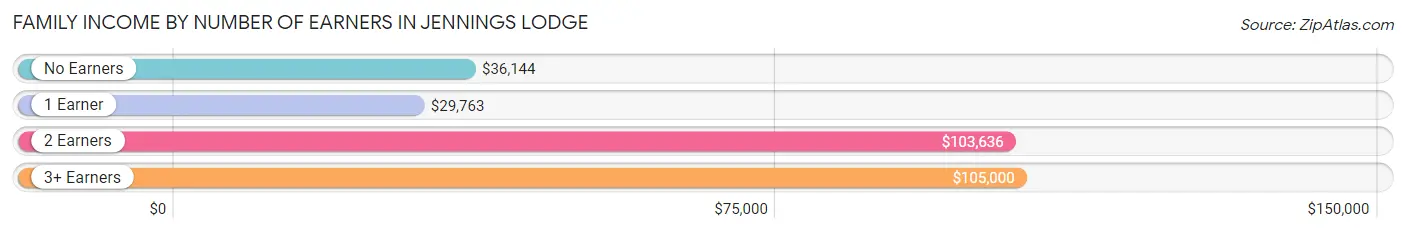
Family Income by Number of Earners in Jennings Lodge
The median family income in Jennings Lodge is $68,925, with families comprising 3+ earners (160) having the highest median family income of $105,000, while families with 1 earner (543) have the lowest median family income of $29,763, accounting for 7.6% and 25.7% of families, respectively.
| Number of Earners | # Families | Median Income |
| No Earners | 400 (18.9%) | $36,144 |
| 1 Earner | 543 (25.7%) | $29,763 |
| 2 Earners | 1,012 (47.8%) | $103,636 |
| 3+ Earners | 160 (7.6%) | $105,000 |
| Total | 2,115 (100.0%) | $68,925 |
Household Income in Jennings Lodge
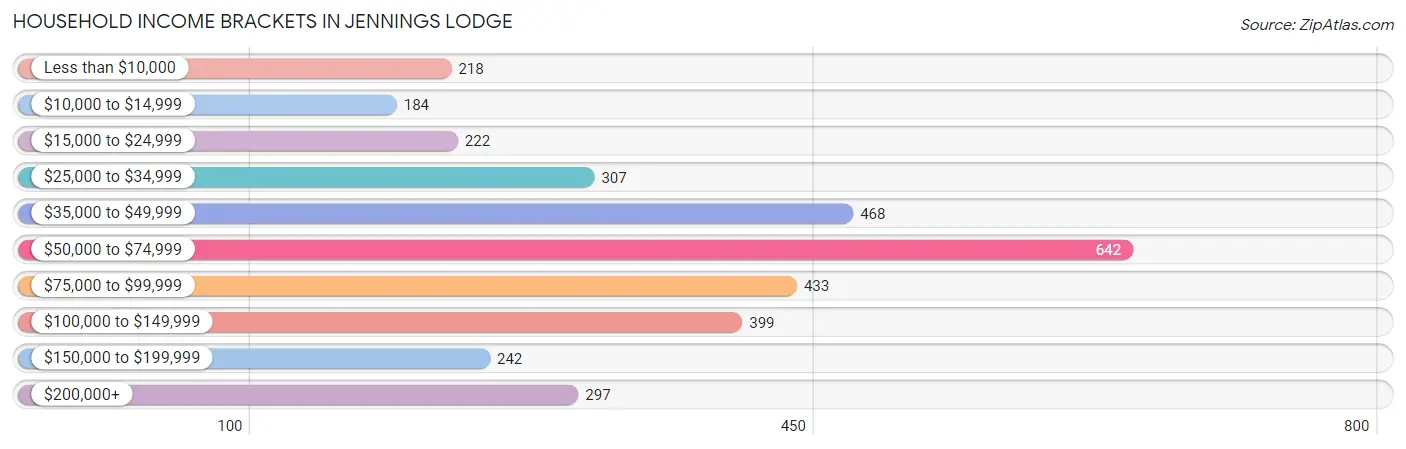
Household Income Brackets in Jennings Lodge
With 642 households falling in the category, the $50,000 to $74,999 income range is the most frequent in Jennings Lodge, accounting for 18.8% of all households. In contrast, only 184 households (5.4%) fall into the $10,000 to $14,999 income bracket, making it the least populous group.
| Income Bracket | # Households | % Households |
| Less than $10,000 | 218 | 6.4% |
| $10,000 to $14,999 | 184 | 5.4% |
| $15,000 to $24,999 | 222 | 6.5% |
| $25,000 to $34,999 | 307 | 9.0% |
| $35,000 to $49,999 | 468 | 13.7% |
| $50,000 to $74,999 | 642 | 18.8% |
| $75,000 to $99,999 | 433 | 12.7% |
| $100,000 to $149,999 | 399 | 11.7% |
| $150,000 to $199,999 | 242 | 7.1% |
| $200,000+ | 297 | 8.7% |
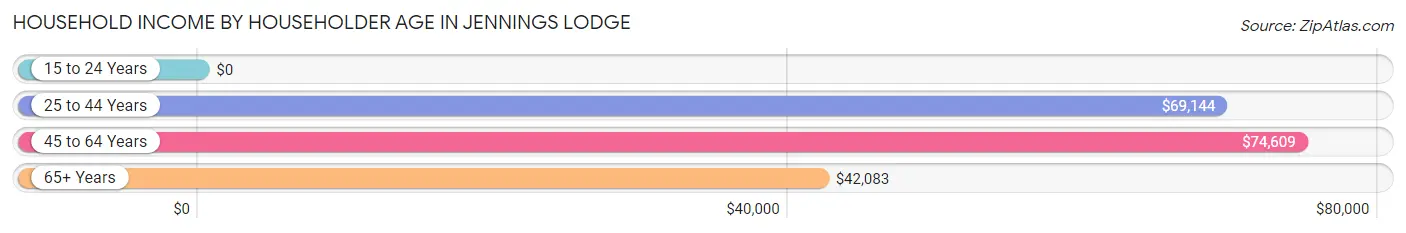
Household Income by Householder Age in Jennings Lodge
The median household income in Jennings Lodge is $64,887, with the highest median household income of $74,609 found in the 45 to 64 years age bracket for the primary householder. A total of 1,163 households (34.1%) fall into this category. Meanwhile, the 15 to 24 years age bracket for the primary householder has the lowest median household income of $0, with 162 households (4.8%) in this group.
| Income Bracket | # Households | Median Income |
| 15 to 24 Years | 162 (4.8%) | $0 |
| 25 to 44 Years | 1,058 (31.0%) | $69,144 |
| 45 to 64 Years | 1,163 (34.1%) | $74,609 |
| 65+ Years | 1,030 (30.2%) | $42,083 |
| Total | 3,413 (100.0%) | $64,887 |
Poverty in Jennings Lodge
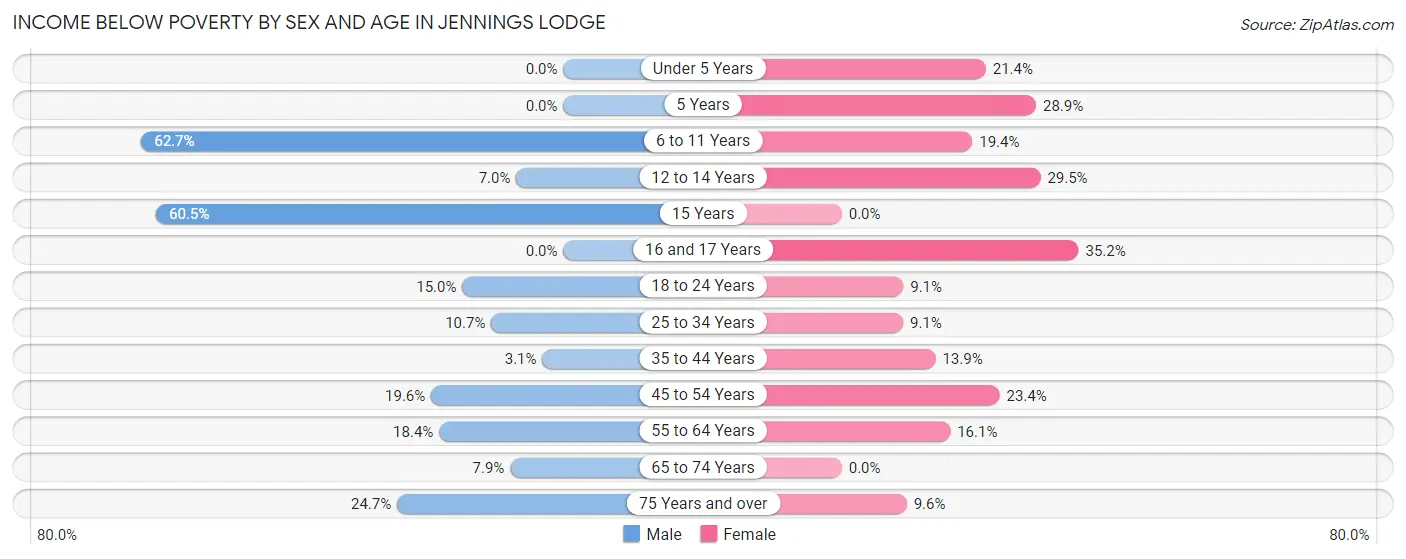
Income Below Poverty by Sex and Age in Jennings Lodge
With 15.4% poverty level for males and 14.3% for females among the residents of Jennings Lodge, 6 to 11 year old males and 16 and 17 year old females are the most vulnerable to poverty, with 99 males (62.7%) and 32 females (35.2%) in their respective age groups living below the poverty level.
| Age Bracket | Male | Female |
| Under 5 Years | 0 (0.0%) | 31 (21.4%) |
| 5 Years | 0 (0.0%) | 15 (28.8%) |
| 6 to 11 Years | 99 (62.7%) | 44 (19.4%) |
| 12 to 14 Years | 10 (7.0%) | 41 (29.5%) |
| 15 Years | 52 (60.5%) | 0 (0.0%) |
| 16 and 17 Years | 0 (0.0%) | 32 (35.2%) |
| 18 to 24 Years | 27 (15.0%) | 43 (9.1%) |
| 25 to 34 Years | 50 (10.7%) | 43 (9.1%) |
| 35 to 44 Years | 15 (3.1%) | 80 (13.9%) |
| 45 to 54 Years | 88 (19.6%) | 163 (23.4%) |
| 55 to 64 Years | 97 (18.4%) | 76 (16.1%) |
| 65 to 74 Years | 30 (7.9%) | 0 (0.0%) |
| 75 Years and over | 41 (24.7%) | 51 (9.6%) |
| Total | 509 (15.4%) | 619 (14.3%) |
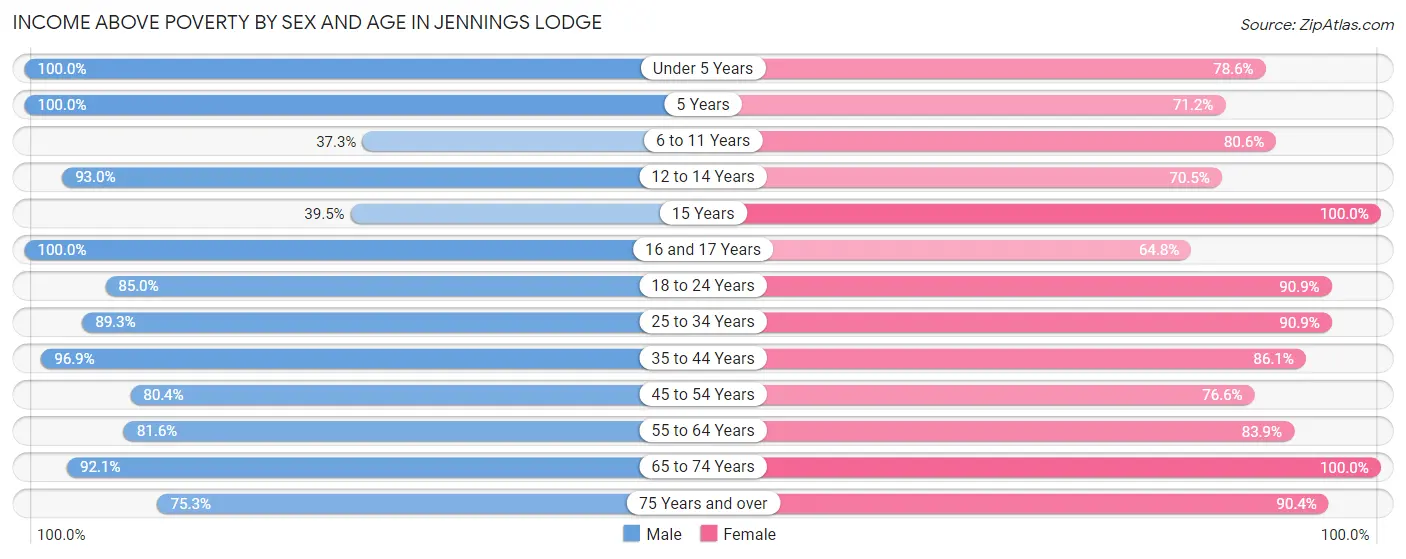
Income Above Poverty by Sex and Age in Jennings Lodge
According to the poverty statistics in Jennings Lodge, males aged under 5 years and females aged 15 years are the age groups that are most secure financially, with 100.0% of males and 100.0% of females in these age groups living above the poverty line.
| Age Bracket | Male | Female |
| Under 5 Years | 129 (100.0%) | 114 (78.6%) |
| 5 Years | 36 (100.0%) | 37 (71.2%) |
| 6 to 11 Years | 59 (37.3%) | 183 (80.6%) |
| 12 to 14 Years | 133 (93.0%) | 98 (70.5%) |
| 15 Years | 34 (39.5%) | 42 (100.0%) |
| 16 and 17 Years | 105 (100.0%) | 59 (64.8%) |
| 18 to 24 Years | 153 (85.0%) | 428 (90.9%) |
| 25 to 34 Years | 417 (89.3%) | 430 (90.9%) |
| 35 to 44 Years | 466 (96.9%) | 495 (86.1%) |
| 45 to 54 Years | 360 (80.4%) | 533 (76.6%) |
| 55 to 64 Years | 429 (81.6%) | 396 (83.9%) |
| 65 to 74 Years | 350 (92.1%) | 411 (100.0%) |
| 75 Years and over | 125 (75.3%) | 478 (90.4%) |
| Total | 2,796 (84.6%) | 3,704 (85.7%) |
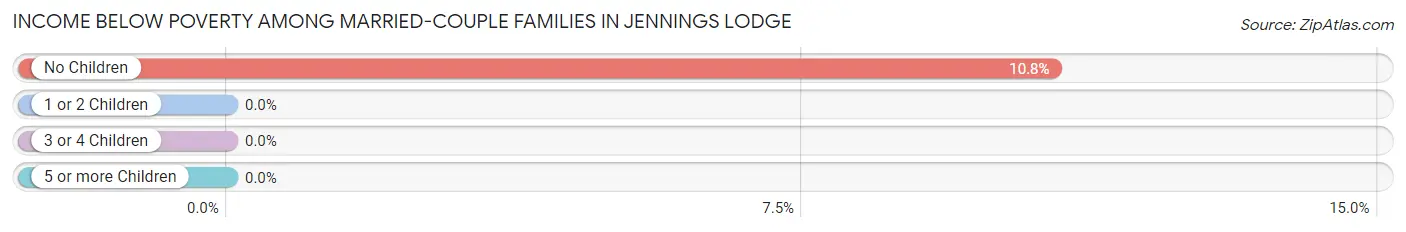
Income Below Poverty Among Married-Couple Families in Jennings Lodge
The poverty statistics for married-couple families in Jennings Lodge show that 7.2% or 109 of the total 1,519 families live below the poverty line. Families with no children have the highest poverty rate of 10.7%, comprising of 109 families. On the other hand, families with 1 or 2 children have the lowest poverty rate of 0.0%, which includes 0 families.
| Children | Above Poverty | Below Poverty |
| No Children | 905 (89.2%) | 109 (10.7%) |
| 1 or 2 Children | 424 (100.0%) | 0 (0.0%) |
| 3 or 4 Children | 81 (100.0%) | 0 (0.0%) |
| 5 or more Children | 0 (0.0%) | 0 (0.0%) |
| Total | 1,410 (92.8%) | 109 (7.2%) |
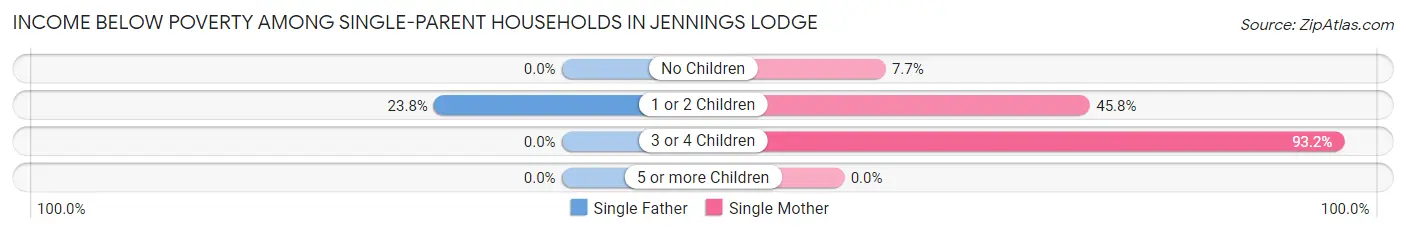
Income Below Poverty Among Single-Parent Households in Jennings Lodge
According to the poverty data in Jennings Lodge, 16.1% or 10 single-father households and 39.0% or 208 single-mother households are living below the poverty line. Among single-father households, those with 1 or 2 children have the highest poverty rate, with 10 households (23.8%) experiencing poverty. Likewise, among single-mother households, those with 3 or 4 children have the highest poverty rate, with 55 households (93.2%) falling below the poverty line.
| Children | Single Father | Single Mother |
| No Children | 0 (0.0%) | 13 (7.7%) |
| 1 or 2 Children | 10 (23.8%) | 140 (45.8%) |
| 3 or 4 Children | 0 (0.0%) | 55 (93.2%) |
| 5 or more Children | 0 (0.0%) | 0 (0.0%) |
| Total | 10 (16.1%) | 208 (39.0%) |
Income Below Poverty Among Married-Couple vs Single-Parent Households in Jennings Lodge
The poverty data for Jennings Lodge shows that 109 of the married-couple family households (7.2%) and 218 of the single-parent households (36.6%) are living below the poverty level. Within the married-couple family households, those with no children have the highest poverty rate, with 109 households (10.7%) falling below the poverty line. Among the single-parent households, those with 3 or 4 children have the highest poverty rate, with 55 household (93.2%) living below poverty.
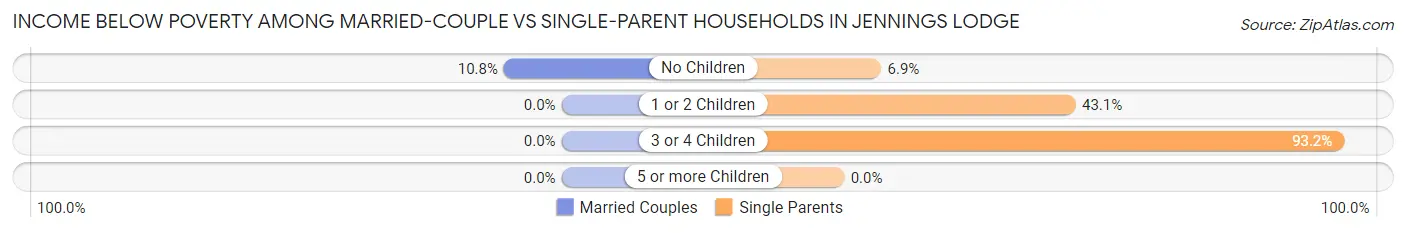
| Children | Married-Couple Families | Single-Parent Households |
| No Children | 109 (10.7%) | 13 (6.9%) |
| 1 or 2 Children | 0 (0.0%) | 150 (43.1%) |
| 3 or 4 Children | 0 (0.0%) | 55 (93.2%) |
| 5 or more Children | 0 (0.0%) | 0 (0.0%) |
| Total | 109 (7.2%) | 218 (36.6%) |
Employment Characteristics in Jennings Lodge
Employment by Class of Employer in Jennings Lodge
Among the 3,762 employed individuals in Jennings Lodge, private company employees (2,646 | 70.3%), not-for-profit organizations (488 | 13.0%), and local government employees (189 | 5.0%) make up the most common classes of employment.
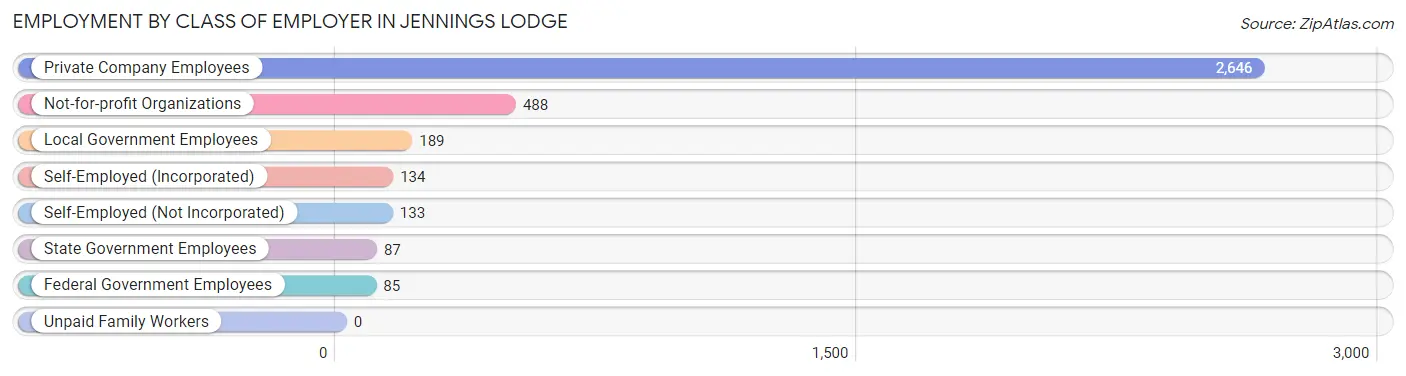
| Employer Class | # Employees | % Employees |
| Private Company Employees | 2,646 | 70.3% |
| Self-Employed (Incorporated) | 134 | 3.6% |
| Self-Employed (Not Incorporated) | 133 | 3.5% |
| Not-for-profit Organizations | 488 | 13.0% |
| Local Government Employees | 189 | 5.0% |
| State Government Employees | 87 | 2.3% |
| Federal Government Employees | 85 | 2.3% |
| Unpaid Family Workers | 0 | 0.0% |
| Total | 3,762 | 100.0% |
Employment Status by Age in Jennings Lodge
According to the labor force statistics for Jennings Lodge, out of the total population over 16 years of age (6,473), 63.1% or 4,084 individuals are in the labor force, with 5.8% or 237 of them unemployed. The age group with the highest labor force participation rate is 30 to 34 years, with 93.7% or 553 individuals in the labor force. Within the labor force, the 20 to 24 years age range has the highest percentage of unemployed individuals, with 16.2% or 68 of them being unemployed.
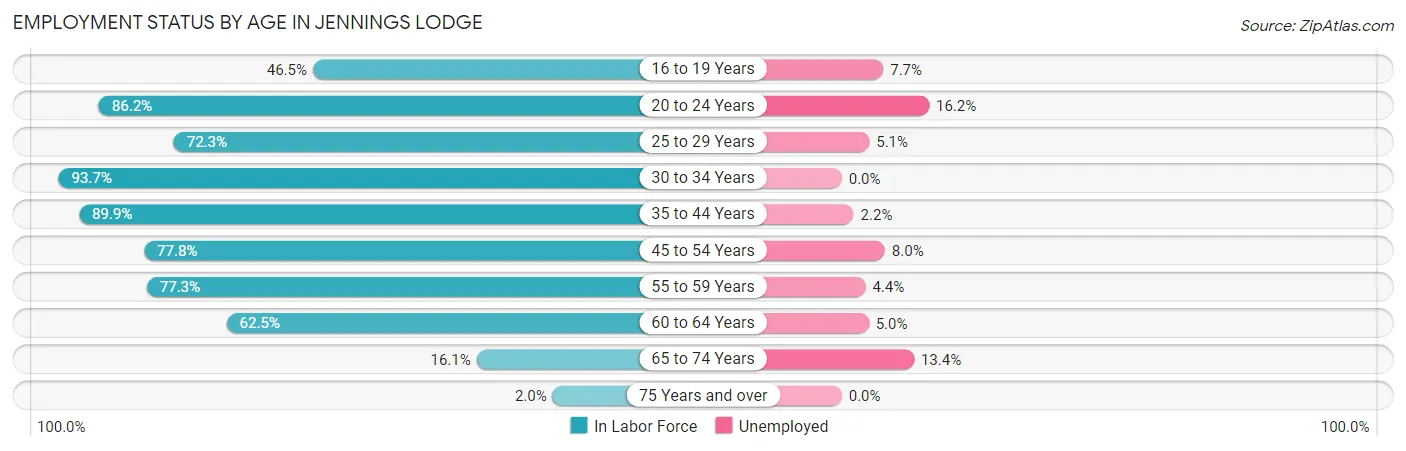
| Age Bracket | In Labor Force | Unemployed |
| 16 to 19 Years | 168 (46.5%) | 13 (7.7%) |
| 20 to 24 Years | 419 (86.2%) | 68 (16.2%) |
| 25 to 29 Years | 253 (72.3%) | 13 (5.1%) |
| 30 to 34 Years | 553 (93.7%) | 0 (0.0%) |
| 35 to 44 Years | 949 (89.9%) | 21 (2.2%) |
| 45 to 54 Years | 890 (77.8%) | 71 (8.0%) |
| 55 to 59 Years | 450 (77.3%) | 20 (4.4%) |
| 60 to 64 Years | 260 (62.5%) | 13 (5.0%) |
| 65 to 74 Years | 127 (16.1%) | 17 (13.4%) |
| 75 Years and over | 14 (2.0%) | 0 (0.0%) |
| Total | 4,084 (63.1%) | 237 (5.8%) |
Employment Status by Educational Attainment in Jennings Lodge
According to labor force statistics for Jennings Lodge, 81.1% of individuals (3,356) out of the total population between 25 and 64 years of age (4,138) are in the labor force, with 4.1% or 138 of them being unemployed. The group with the highest labor force participation rate are those with the educational attainment of high school diploma, with 85.7% or 779 individuals in the labor force. Within the labor force, individuals with high school diploma education have the highest percentage of unemployment, with 8.2% or 64 of them being unemployed.
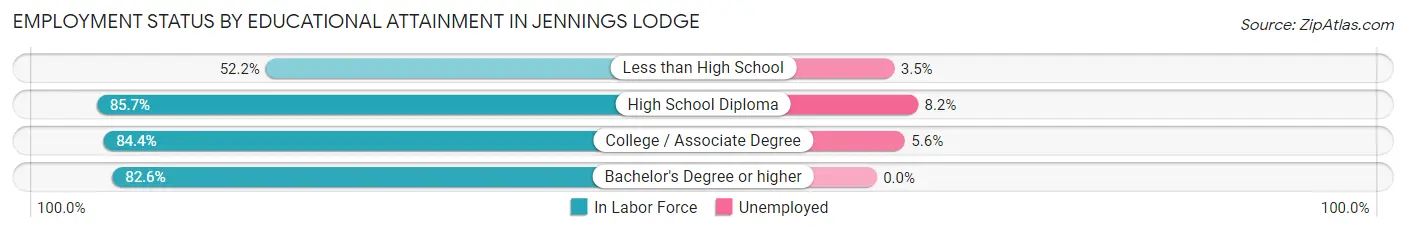
| Educational Attainment | In Labor Force | Unemployed |
| Less than High School | 200 (52.2%) | 13 (3.5%) |
| High School Diploma | 779 (85.7%) | 75 (8.2%) |
| College / Associate Degree | 1,189 (84.4%) | 79 (5.6%) |
| Bachelor's Degree or higher | 1,187 (82.6%) | 0 (0.0%) |
| Total | 3,356 (81.1%) | 170 (4.1%) |
Employment Occupations by Sex in Jennings Lodge
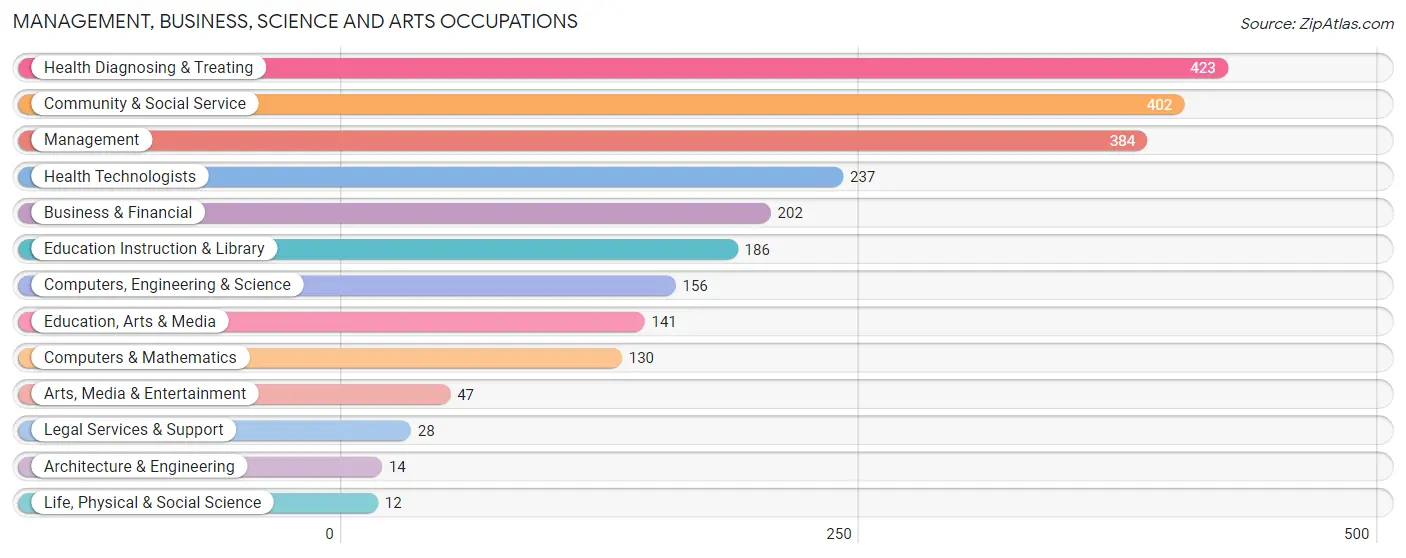
Management, Business, Science and Arts Occupations
The most common Management, Business, Science and Arts occupations in Jennings Lodge are Health Diagnosing & Treating (423 | 11.0%), Community & Social Service (402 | 10.4%), Management (384 | 10.0%), Health Technologists (237 | 6.2%), and Business & Financial (202 | 5.2%).
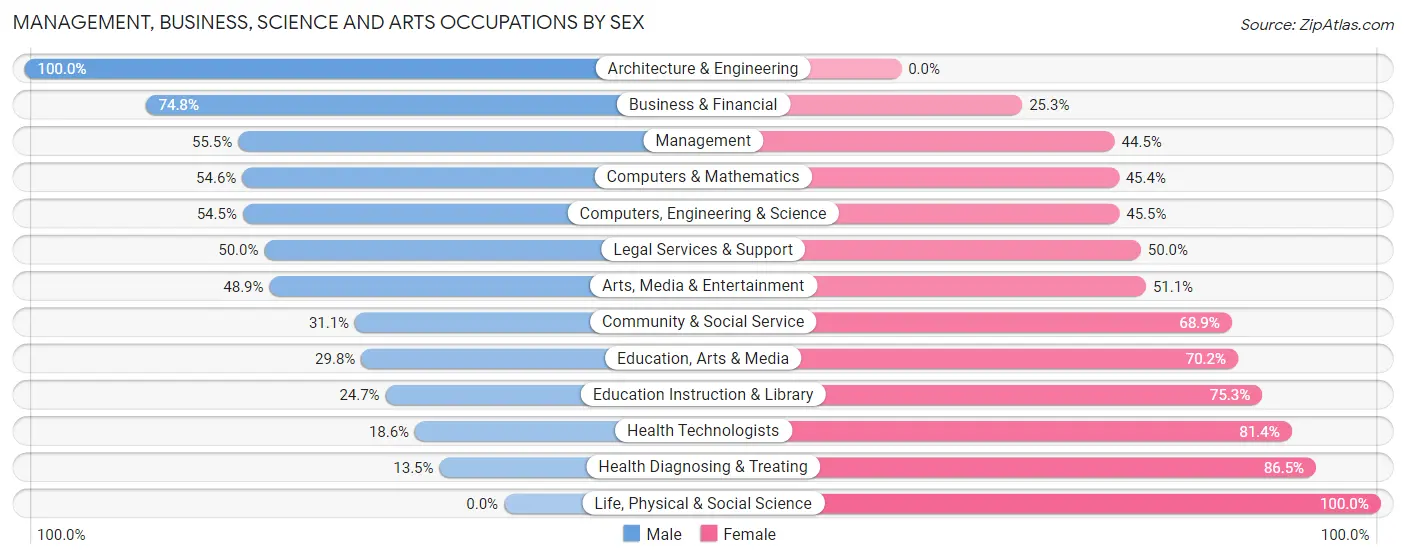
Management, Business, Science and Arts Occupations by Sex
Within the Management, Business, Science and Arts occupations in Jennings Lodge, the most male-oriented occupations are Architecture & Engineering (100.0%), Business & Financial (74.8%), and Management (55.5%), while the most female-oriented occupations are Life, Physical & Social Science (100.0%), Health Diagnosing & Treating (86.5%), and Health Technologists (81.4%).
| Occupation | Male | Female |
| Management | 213 (55.5%) | 171 (44.5%) |
| Business & Financial | 151 (74.8%) | 51 (25.3%) |
| Computers, Engineering & Science | 85 (54.5%) | 71 (45.5%) |
| Computers & Mathematics | 71 (54.6%) | 59 (45.4%) |
| Architecture & Engineering | 14 (100.0%) | 0 (0.0%) |
| Life, Physical & Social Science | 0 (0.0%) | 12 (100.0%) |
| Community & Social Service | 125 (31.1%) | 277 (68.9%) |
| Education, Arts & Media | 42 (29.8%) | 99 (70.2%) |
| Legal Services & Support | 14 (50.0%) | 14 (50.0%) |
| Education Instruction & Library | 46 (24.7%) | 140 (75.3%) |
| Arts, Media & Entertainment | 23 (48.9%) | 24 (51.1%) |
| Health Diagnosing & Treating | 57 (13.5%) | 366 (86.5%) |
| Health Technologists | 44 (18.6%) | 193 (81.4%) |
| Total (Category) | 631 (40.3%) | 936 (59.7%) |
| Total (Overall) | 1,781 (46.3%) | 2,066 (53.7%) |
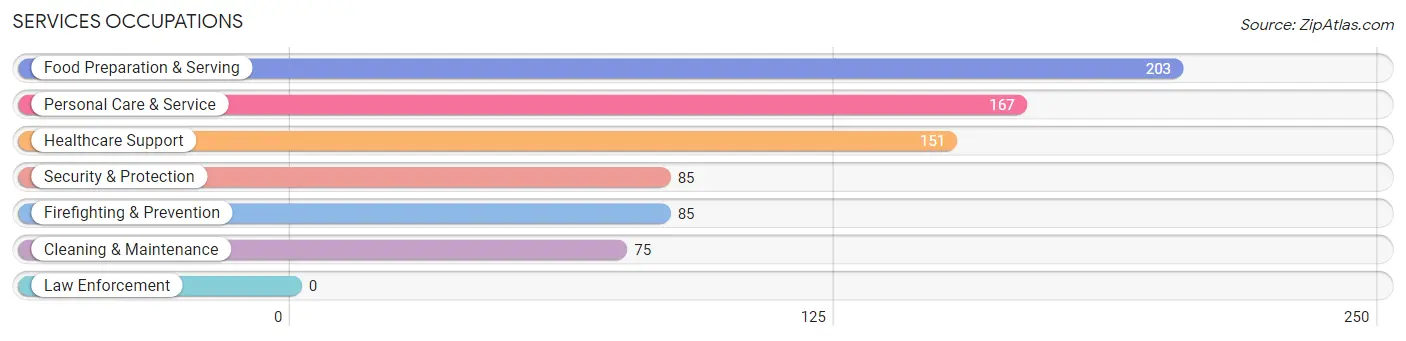
Services Occupations
The most common Services occupations in Jennings Lodge are Food Preparation & Serving (203 | 5.3%), Personal Care & Service (167 | 4.3%), Healthcare Support (151 | 3.9%), Security & Protection (85 | 2.2%), and Firefighting & Prevention (85 | 2.2%).
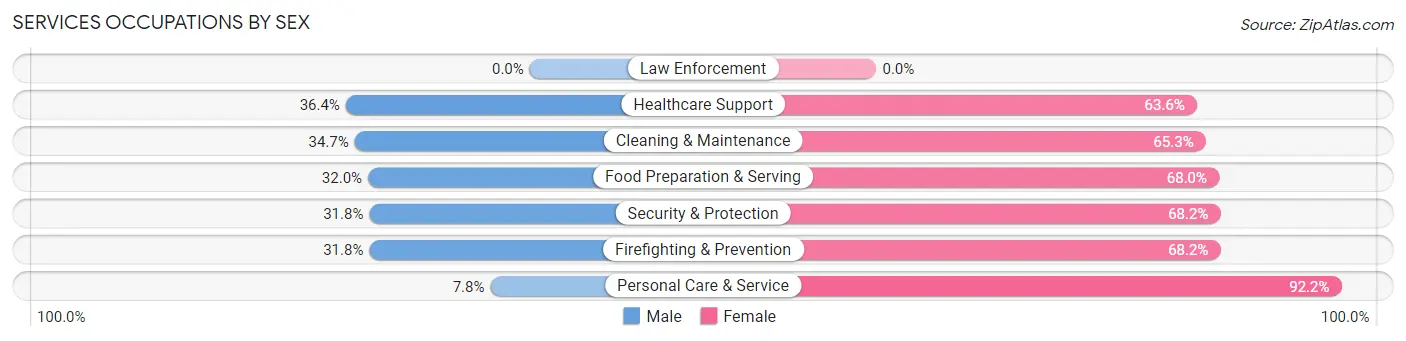
Services Occupations by Sex
Within the Services occupations in Jennings Lodge, the most male-oriented occupations are Healthcare Support (36.4%), Cleaning & Maintenance (34.7%), and Food Preparation & Serving (32.0%), while the most female-oriented occupations are Personal Care & Service (92.2%), Security & Protection (68.2%), and Firefighting & Prevention (68.2%).
| Occupation | Male | Female |
| Healthcare Support | 55 (36.4%) | 96 (63.6%) |
| Security & Protection | 27 (31.8%) | 58 (68.2%) |
| Firefighting & Prevention | 27 (31.8%) | 58 (68.2%) |
| Law Enforcement | 0 (0.0%) | 0 (0.0%) |
| Food Preparation & Serving | 65 (32.0%) | 138 (68.0%) |
| Cleaning & Maintenance | 26 (34.7%) | 49 (65.3%) |
| Personal Care & Service | 13 (7.8%) | 154 (92.2%) |
| Total (Category) | 186 (27.3%) | 495 (72.7%) |
| Total (Overall) | 1,781 (46.3%) | 2,066 (53.7%) |
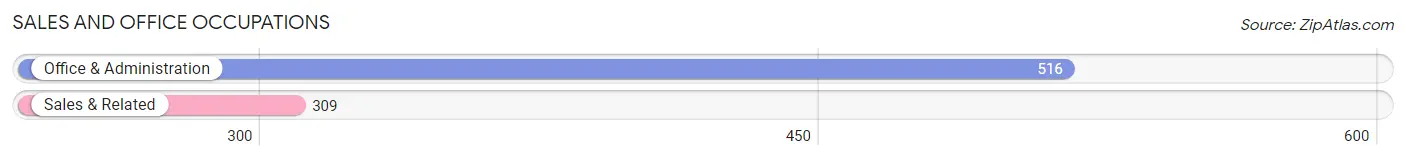
Sales and Office Occupations
The most common Sales and Office occupations in Jennings Lodge are Office & Administration (516 | 13.4%), and Sales & Related (309 | 8.0%).
Sales and Office Occupations by Sex
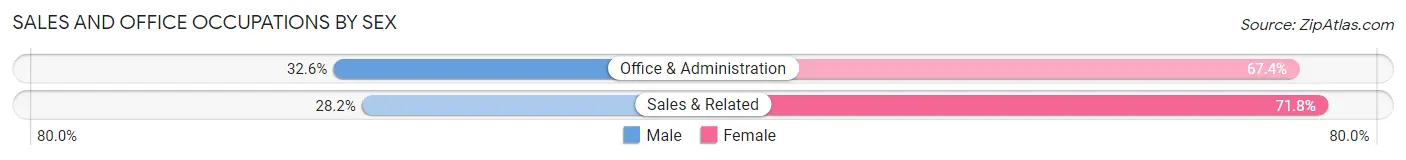
| Occupation | Male | Female |
| Sales & Related | 87 (28.2%) | 222 (71.8%) |
| Office & Administration | 168 (32.6%) | 348 (67.4%) |
| Total (Category) | 255 (30.9%) | 570 (69.1%) |
| Total (Overall) | 1,781 (46.3%) | 2,066 (53.7%) |
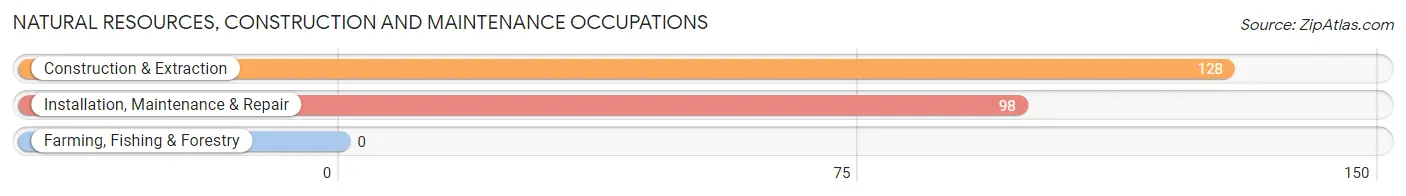
Natural Resources, Construction and Maintenance Occupations
The most common Natural Resources, Construction and Maintenance occupations in Jennings Lodge are Construction & Extraction (128 | 3.3%), and Installation, Maintenance & Repair (98 | 2.5%).
Natural Resources, Construction and Maintenance Occupations by Sex
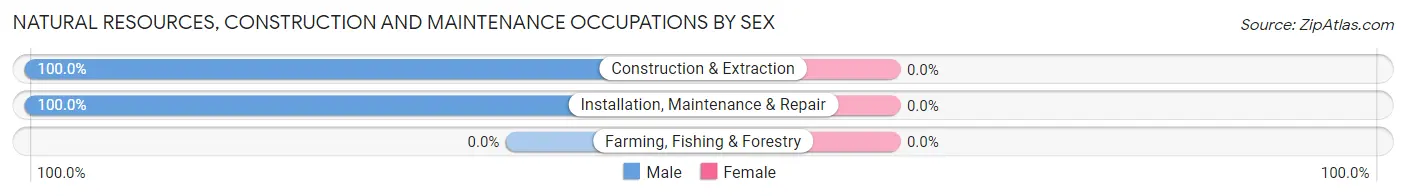
| Occupation | Male | Female |
| Farming, Fishing & Forestry | 0 (0.0%) | 0 (0.0%) |
| Construction & Extraction | 128 (100.0%) | 0 (0.0%) |
| Installation, Maintenance & Repair | 98 (100.0%) | 0 (0.0%) |
| Total (Category) | 226 (100.0%) | 0 (0.0%) |
| Total (Overall) | 1,781 (46.3%) | 2,066 (53.7%) |
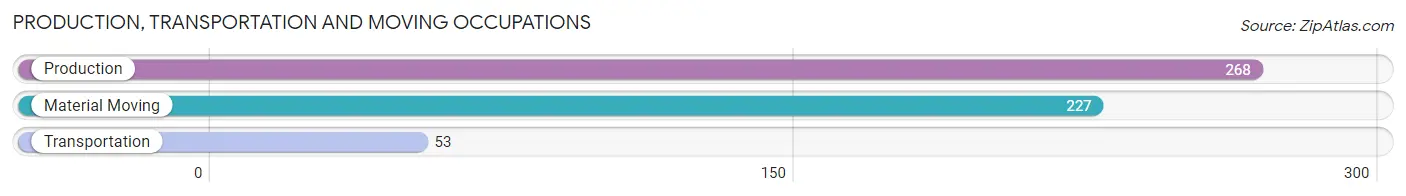
Production, Transportation and Moving Occupations
The most common Production, Transportation and Moving occupations in Jennings Lodge are Production (268 | 7.0%), Material Moving (227 | 5.9%), and Transportation (53 | 1.4%).
Production, Transportation and Moving Occupations by Sex
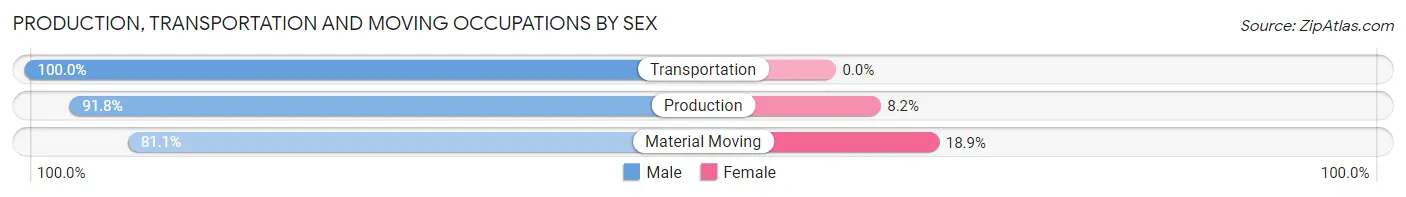
| Occupation | Male | Female |
| Production | 246 (91.8%) | 22 (8.2%) |
| Transportation | 53 (100.0%) | 0 (0.0%) |
| Material Moving | 184 (81.1%) | 43 (18.9%) |
| Total (Category) | 483 (88.1%) | 65 (11.9%) |
| Total (Overall) | 1,781 (46.3%) | 2,066 (53.7%) |
Employment Industries by Sex in Jennings Lodge
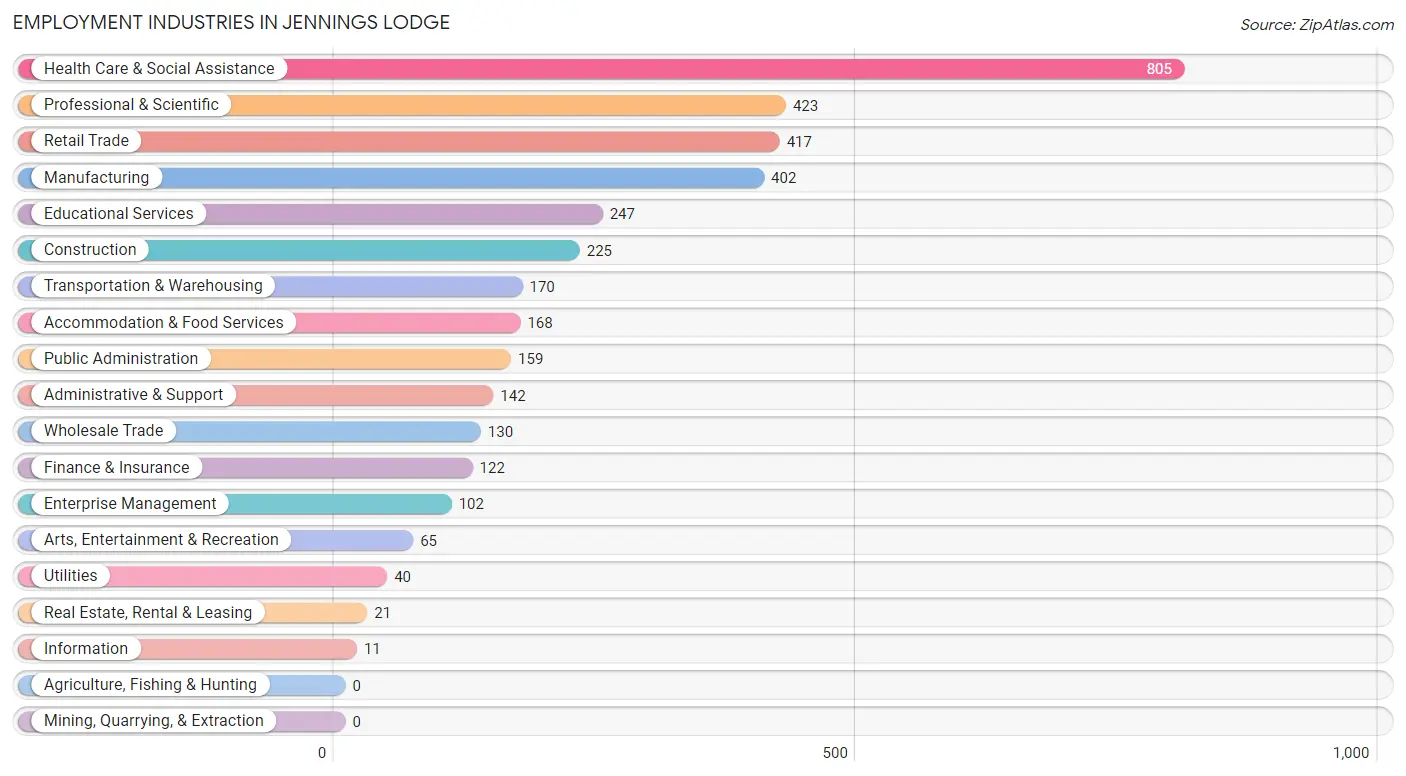
Employment Industries in Jennings Lodge
The major employment industries in Jennings Lodge include Health Care & Social Assistance (805 | 20.9%), Professional & Scientific (423 | 11.0%), Retail Trade (417 | 10.8%), Manufacturing (402 | 10.4%), and Educational Services (247 | 6.4%).
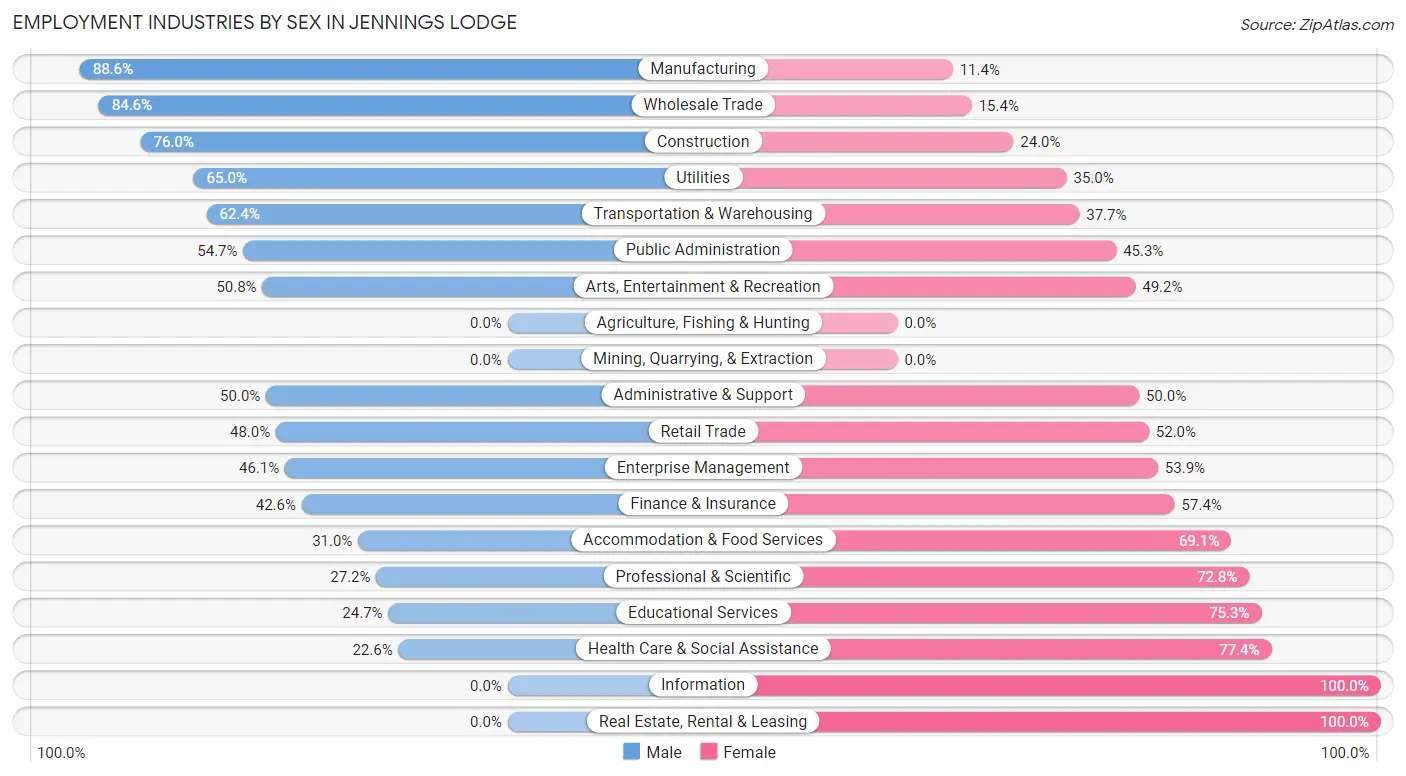
Employment Industries by Sex in Jennings Lodge
The Jennings Lodge industries that see more men than women are Manufacturing (88.6%), Wholesale Trade (84.6%), and Construction (76.0%), whereas the industries that tend to have a higher number of women are Information (100.0%), Real Estate, Rental & Leasing (100.0%), and Health Care & Social Assistance (77.4%).
| Industry | Male | Female |
| Agriculture, Fishing & Hunting | 0 (0.0%) | 0 (0.0%) |
| Mining, Quarrying, & Extraction | 0 (0.0%) | 0 (0.0%) |
| Construction | 171 (76.0%) | 54 (24.0%) |
| Manufacturing | 356 (88.6%) | 46 (11.4%) |
| Wholesale Trade | 110 (84.6%) | 20 (15.4%) |
| Retail Trade | 200 (48.0%) | 217 (52.0%) |
| Transportation & Warehousing | 106 (62.4%) | 64 (37.7%) |
| Utilities | 26 (65.0%) | 14 (35.0%) |
| Information | 0 (0.0%) | 11 (100.0%) |
| Finance & Insurance | 52 (42.6%) | 70 (57.4%) |
| Real Estate, Rental & Leasing | 0 (0.0%) | 21 (100.0%) |
| Professional & Scientific | 115 (27.2%) | 308 (72.8%) |
| Enterprise Management | 47 (46.1%) | 55 (53.9%) |
| Administrative & Support | 71 (50.0%) | 71 (50.0%) |
| Educational Services | 61 (24.7%) | 186 (75.3%) |
| Health Care & Social Assistance | 182 (22.6%) | 623 (77.4%) |
| Arts, Entertainment & Recreation | 33 (50.8%) | 32 (49.2%) |
| Accommodation & Food Services | 52 (30.9%) | 116 (69.1%) |
| Public Administration | 87 (54.7%) | 72 (45.3%) |
| Total | 1,781 (46.3%) | 2,066 (53.7%) |
Education in Jennings Lodge
School Enrollment in Jennings Lodge
The most common levels of schooling among the 1,404 students in Jennings Lodge are high school (442 | 31.5%), middle school (319 | 22.7%), and elementary school (235 | 16.7%).
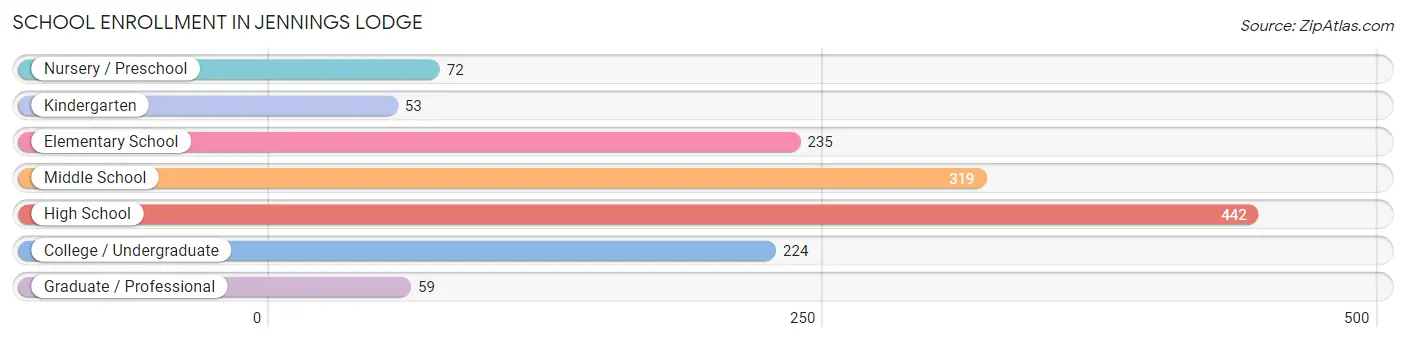
| School Level | # Students | % Students |
| Nursery / Preschool | 72 | 5.1% |
| Kindergarten | 53 | 3.8% |
| Elementary School | 235 | 16.7% |
| Middle School | 319 | 22.7% |
| High School | 442 | 31.5% |
| College / Undergraduate | 224 | 16.0% |
| Graduate / Professional | 59 | 4.2% |
| Total | 1,404 | 100.0% |
School Enrollment by Age by Funding Source in Jennings Lodge
Out of a total of 1,404 students who are enrolled in schools in Jennings Lodge, 188 (13.4%) attend a private institution, while the remaining 1,216 (86.6%) are enrolled in public schools. The age group of 3 to 4 year olds has the highest likelihood of being enrolled in private schools, with 40 (100.0% in the age bracket) enrolled. Conversely, the age group of 15 to 17 year olds has the lowest likelihood of being enrolled in a private school, with 324 (100.0% in the age bracket) attending a public institution.
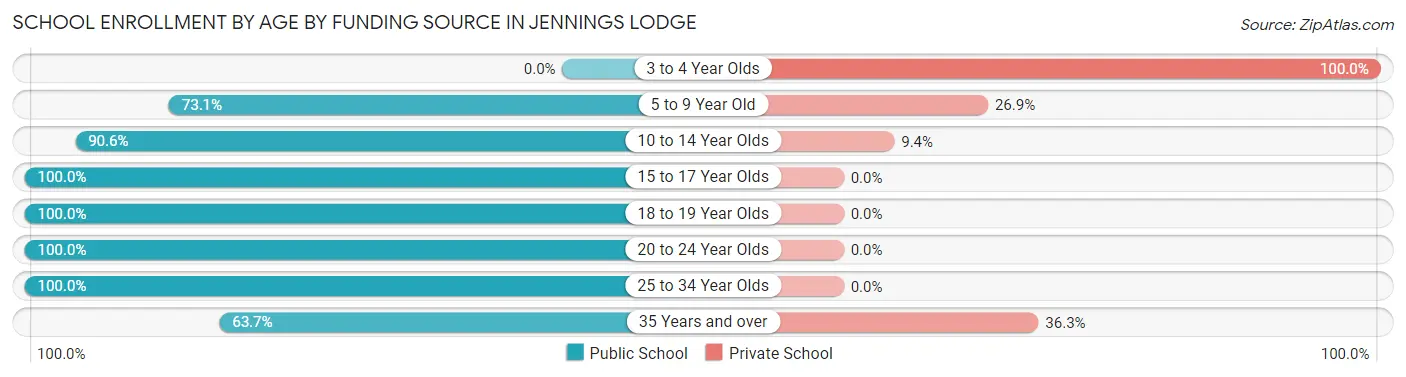
| Age Bracket | Public School | Private School |
| 3 to 4 Year Olds | 0 (0.0%) | 40 (100.0%) |
| 5 to 9 Year Old | 185 (73.1%) | 68 (26.9%) |
| 10 to 14 Year Olds | 413 (90.6%) | 43 (9.4%) |
| 15 to 17 Year Olds | 324 (100.0%) | 0 (0.0%) |
| 18 to 19 Year Olds | 89 (100.0%) | 0 (0.0%) |
| 20 to 24 Year Olds | 77 (100.0%) | 0 (0.0%) |
| 25 to 34 Year Olds | 63 (100.0%) | 0 (0.0%) |
| 35 Years and over | 65 (63.7%) | 37 (36.3%) |
| Total | 1,216 (86.6%) | 188 (13.4%) |
Educational Attainment by Field of Study in Jennings Lodge
Social sciences (376 | 19.5%), science & technology (284 | 14.7%), business (247 | 12.8%), bio, nature & agricultural (161 | 8.4%), and literature & languages (159 | 8.3%) are the most common fields of study among 1,928 individuals in Jennings Lodge who have obtained a bachelor's degree or higher.
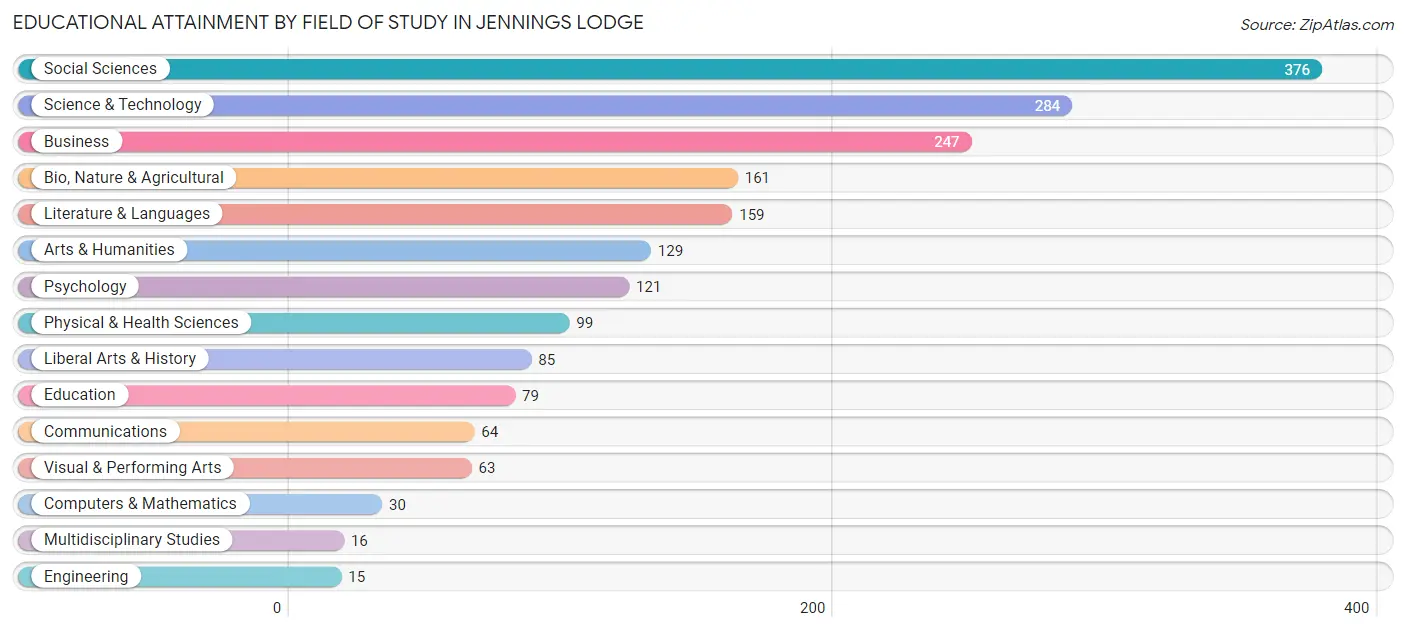
| Field of Study | # Graduates | % Graduates |
| Computers & Mathematics | 30 | 1.6% |
| Bio, Nature & Agricultural | 161 | 8.4% |
| Physical & Health Sciences | 99 | 5.1% |
| Psychology | 121 | 6.3% |
| Social Sciences | 376 | 19.5% |
| Engineering | 15 | 0.8% |
| Multidisciplinary Studies | 16 | 0.8% |
| Science & Technology | 284 | 14.7% |
| Business | 247 | 12.8% |
| Education | 79 | 4.1% |
| Literature & Languages | 159 | 8.3% |
| Liberal Arts & History | 85 | 4.4% |
| Visual & Performing Arts | 63 | 3.3% |
| Communications | 64 | 3.3% |
| Arts & Humanities | 129 | 6.7% |
| Total | 1,928 | 100.0% |
Transportation & Commute in Jennings Lodge
Vehicle Availability by Sex in Jennings Lodge
The most prevalent vehicle ownership categories in Jennings Lodge are males with 2 vehicles (705, accounting for 40.4%) and females with 2 vehicles (657, making up 35.2%).
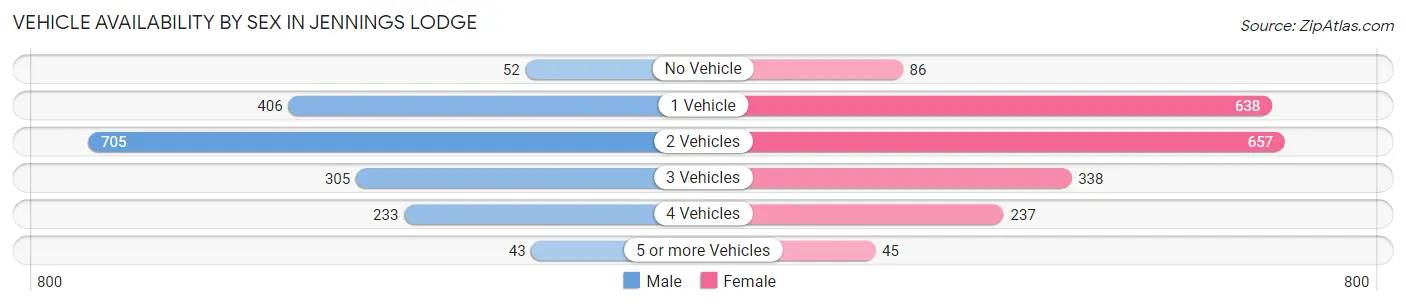
| Vehicles Available | Male | Female |
| No Vehicle | 52 (3.0%) | 86 (4.3%) |
| 1 Vehicle | 406 (23.3%) | 638 (31.9%) |
| 2 Vehicles | 705 (40.4%) | 657 (32.8%) |
| 3 Vehicles | 305 (17.5%) | 338 (16.9%) |
| 4 Vehicles | 233 (13.4%) | 237 (11.8%) |
| 5 or more Vehicles | 43 (2.5%) | 45 (2.2%) |
| Total | 1,744 (100.0%) | 2,001 (100.0%) |
Commute Time in Jennings Lodge
The most frequently occuring commute durations in Jennings Lodge are 15 to 19 minutes (619 commuters, 18.4%), 20 to 24 minutes (541 commuters, 16.1%), and 10 to 14 minutes (385 commuters, 11.4%).
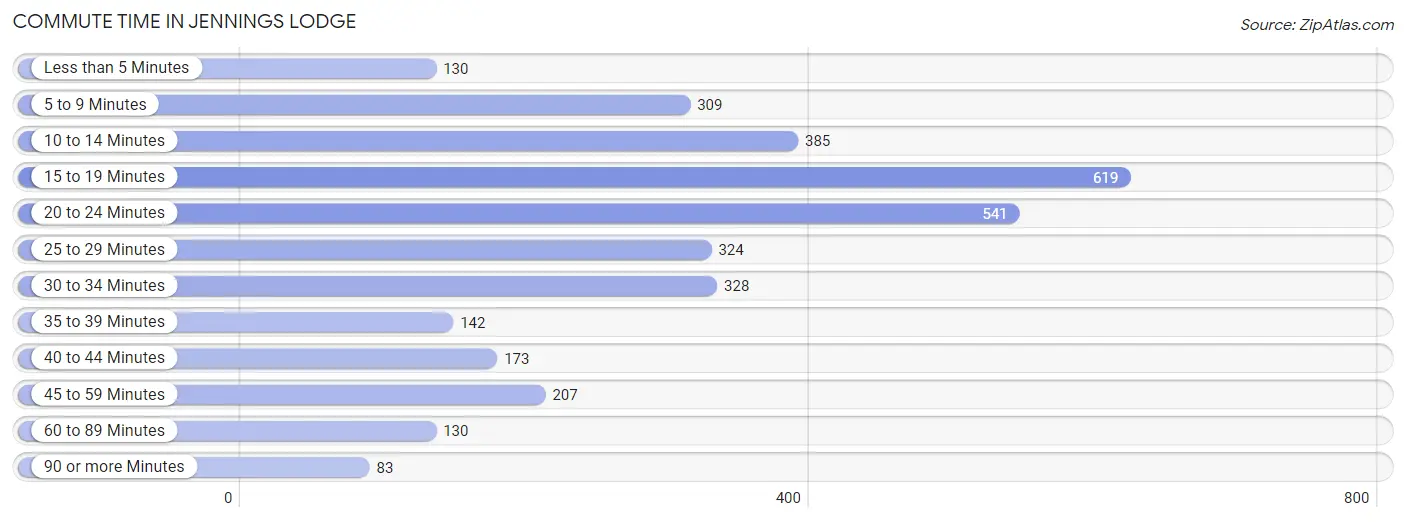
| Commute Time | # Commuters | % Commuters |
| Less than 5 Minutes | 130 | 3.9% |
| 5 to 9 Minutes | 309 | 9.2% |
| 10 to 14 Minutes | 385 | 11.4% |
| 15 to 19 Minutes | 619 | 18.4% |
| 20 to 24 Minutes | 541 | 16.1% |
| 25 to 29 Minutes | 324 | 9.6% |
| 30 to 34 Minutes | 328 | 9.7% |
| 35 to 39 Minutes | 142 | 4.2% |
| 40 to 44 Minutes | 173 | 5.1% |
| 45 to 59 Minutes | 207 | 6.1% |
| 60 to 89 Minutes | 130 | 3.9% |
| 90 or more Minutes | 83 | 2.5% |
Commute Time by Sex in Jennings Lodge
The most common commute times in Jennings Lodge are 15 to 19 minutes (268 commuters, 17.2%) for males and 15 to 19 minutes (351 commuters, 19.4%) for females.
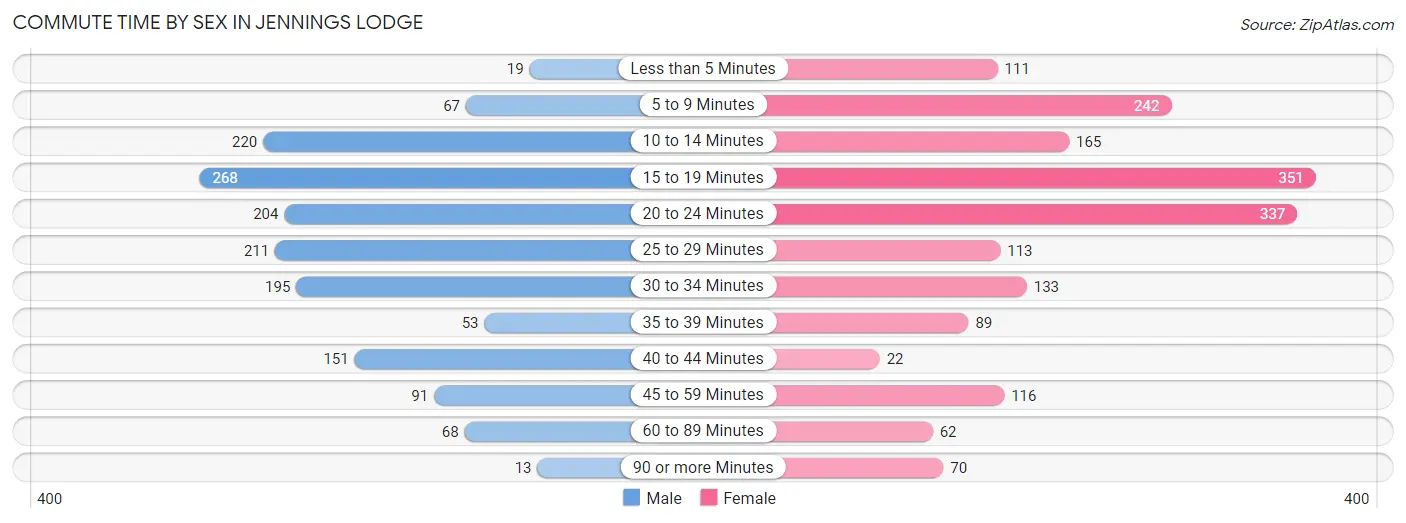
| Commute Time | Male | Female |
| Less than 5 Minutes | 19 (1.2%) | 111 (6.1%) |
| 5 to 9 Minutes | 67 (4.3%) | 242 (13.4%) |
| 10 to 14 Minutes | 220 (14.1%) | 165 (9.1%) |
| 15 to 19 Minutes | 268 (17.2%) | 351 (19.4%) |
| 20 to 24 Minutes | 204 (13.1%) | 337 (18.6%) |
| 25 to 29 Minutes | 211 (13.5%) | 113 (6.2%) |
| 30 to 34 Minutes | 195 (12.5%) | 133 (7.3%) |
| 35 to 39 Minutes | 53 (3.4%) | 89 (4.9%) |
| 40 to 44 Minutes | 151 (9.7%) | 22 (1.2%) |
| 45 to 59 Minutes | 91 (5.8%) | 116 (6.4%) |
| 60 to 89 Minutes | 68 (4.4%) | 62 (3.4%) |
| 90 or more Minutes | 13 (0.8%) | 70 (3.9%) |
Time of Departure to Work by Sex in Jennings Lodge
The most frequent times of departure to work in Jennings Lodge are 12:00 AM to 4:59 AM (208, 13.3%) for males and 8:30 AM to 8:59 AM (283, 15.6%) for females.
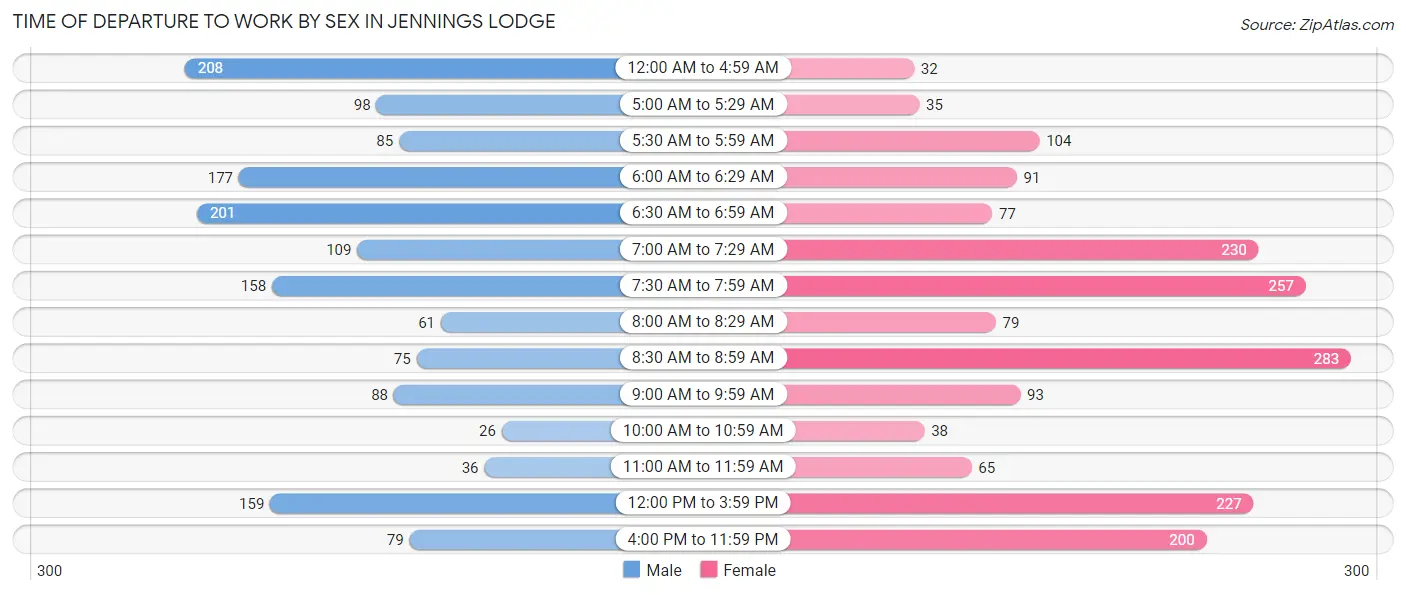
| Time of Departure | Male | Female |
| 12:00 AM to 4:59 AM | 208 (13.3%) | 32 (1.8%) |
| 5:00 AM to 5:29 AM | 98 (6.3%) | 35 (1.9%) |
| 5:30 AM to 5:59 AM | 85 (5.4%) | 104 (5.7%) |
| 6:00 AM to 6:29 AM | 177 (11.4%) | 91 (5.0%) |
| 6:30 AM to 6:59 AM | 201 (12.9%) | 77 (4.3%) |
| 7:00 AM to 7:29 AM | 109 (7.0%) | 230 (12.7%) |
| 7:30 AM to 7:59 AM | 158 (10.1%) | 257 (14.2%) |
| 8:00 AM to 8:29 AM | 61 (3.9%) | 79 (4.4%) |
| 8:30 AM to 8:59 AM | 75 (4.8%) | 283 (15.6%) |
| 9:00 AM to 9:59 AM | 88 (5.6%) | 93 (5.1%) |
| 10:00 AM to 10:59 AM | 26 (1.7%) | 38 (2.1%) |
| 11:00 AM to 11:59 AM | 36 (2.3%) | 65 (3.6%) |
| 12:00 PM to 3:59 PM | 159 (10.2%) | 227 (12.5%) |
| 4:00 PM to 11:59 PM | 79 (5.1%) | 200 (11.0%) |
| Total | 1,560 (100.0%) | 1,811 (100.0%) |
Housing Occupancy in Jennings Lodge
Occupancy by Ownership in Jennings Lodge
Of the total 3,413 dwellings in Jennings Lodge, owner-occupied units account for 1,861 (54.5%), while renter-occupied units make up 1,552 (45.5%).
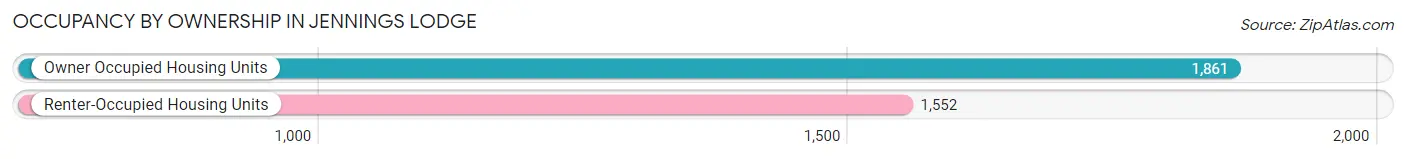
| Occupancy | # Housing Units | % Housing Units |
| Owner Occupied Housing Units | 1,861 | 54.5% |
| Renter-Occupied Housing Units | 1,552 | 45.5% |
| Total Occupied Housing Units | 3,413 | 100.0% |
Occupancy by Household Size in Jennings Lodge
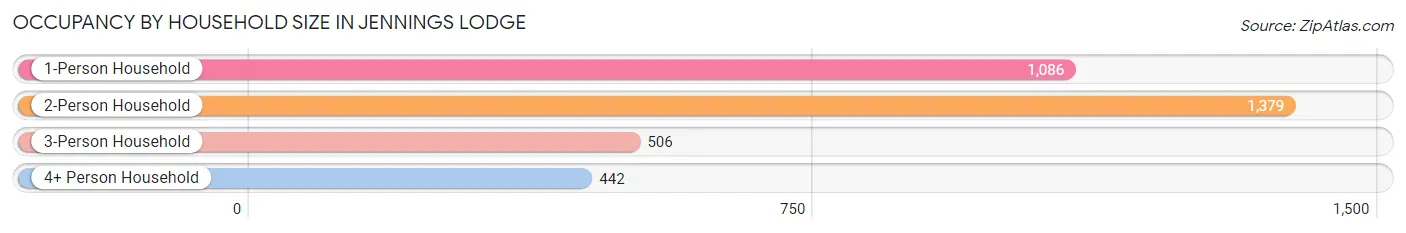
| Household Size | # Housing Units | % Housing Units |
| 1-Person Household | 1,086 | 31.8% |
| 2-Person Household | 1,379 | 40.4% |
| 3-Person Household | 506 | 14.8% |
| 4+ Person Household | 442 | 13.0% |
| Total Housing Units | 3,413 | 100.0% |
Occupancy by Ownership by Household Size in Jennings Lodge
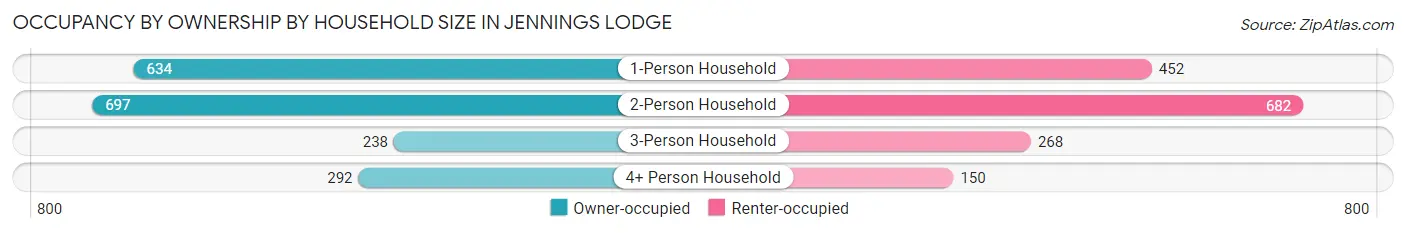
| Household Size | Owner-occupied | Renter-occupied |
| 1-Person Household | 634 (58.4%) | 452 (41.6%) |
| 2-Person Household | 697 (50.5%) | 682 (49.5%) |
| 3-Person Household | 238 (47.0%) | 268 (53.0%) |
| 4+ Person Household | 292 (66.1%) | 150 (33.9%) |
| Total Housing Units | 1,861 (54.5%) | 1,552 (45.5%) |
Occupancy by Educational Attainment in Jennings Lodge
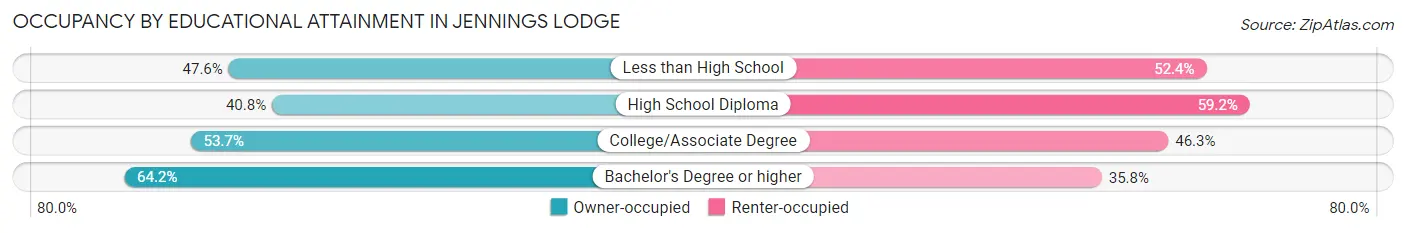
| Household Size | Owner-occupied | Renter-occupied |
| Less than High School | 101 (47.6%) | 111 (52.4%) |
| High School Diploma | 269 (40.8%) | 391 (59.2%) |
| College/Associate Degree | 716 (53.7%) | 618 (46.3%) |
| Bachelor's Degree or higher | 775 (64.2%) | 432 (35.8%) |
Occupancy by Age of Householder in Jennings Lodge
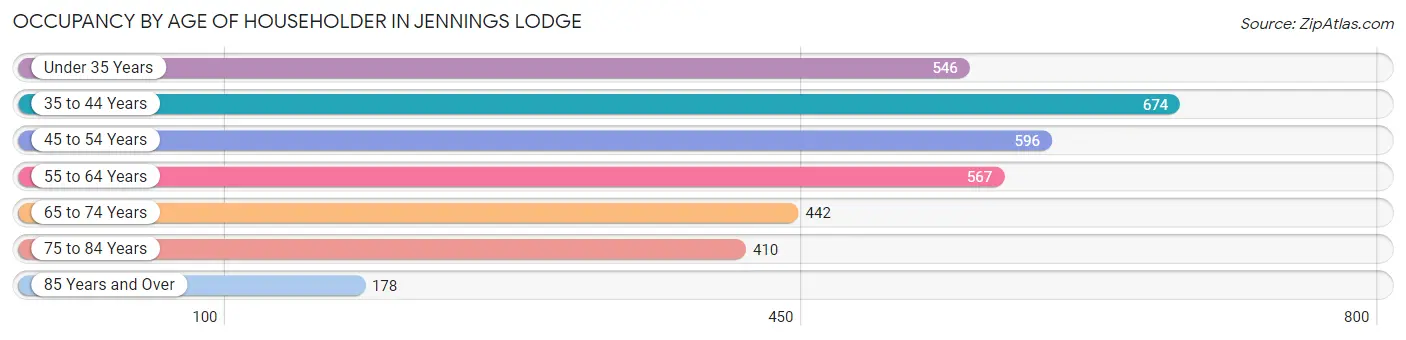
| Age Bracket | # Households | % Households |
| Under 35 Years | 546 | 16.0% |
| 35 to 44 Years | 674 | 19.8% |
| 45 to 54 Years | 596 | 17.5% |
| 55 to 64 Years | 567 | 16.6% |
| 65 to 74 Years | 442 | 13.0% |
| 75 to 84 Years | 410 | 12.0% |
| 85 Years and Over | 178 | 5.2% |
| Total | 3,413 | 100.0% |
Housing Finances in Jennings Lodge
Median Income by Occupancy in Jennings Lodge
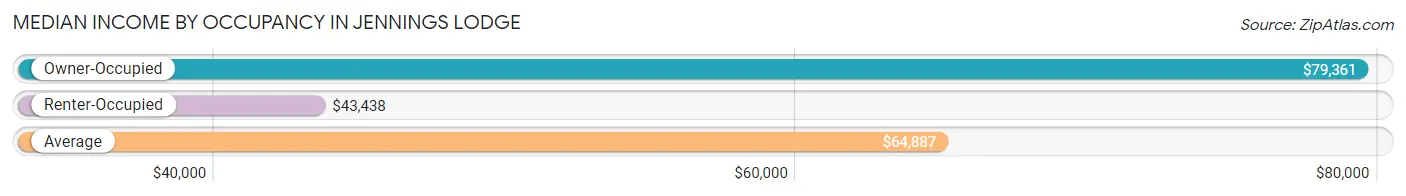
| Occupancy Type | # Households | Median Income |
| Owner-Occupied | 1,861 (54.5%) | $79,361 |
| Renter-Occupied | 1,552 (45.5%) | $43,438 |
| Average | 3,413 (100.0%) | $64,887 |
Occupancy by Householder Income Bracket in Jennings Lodge
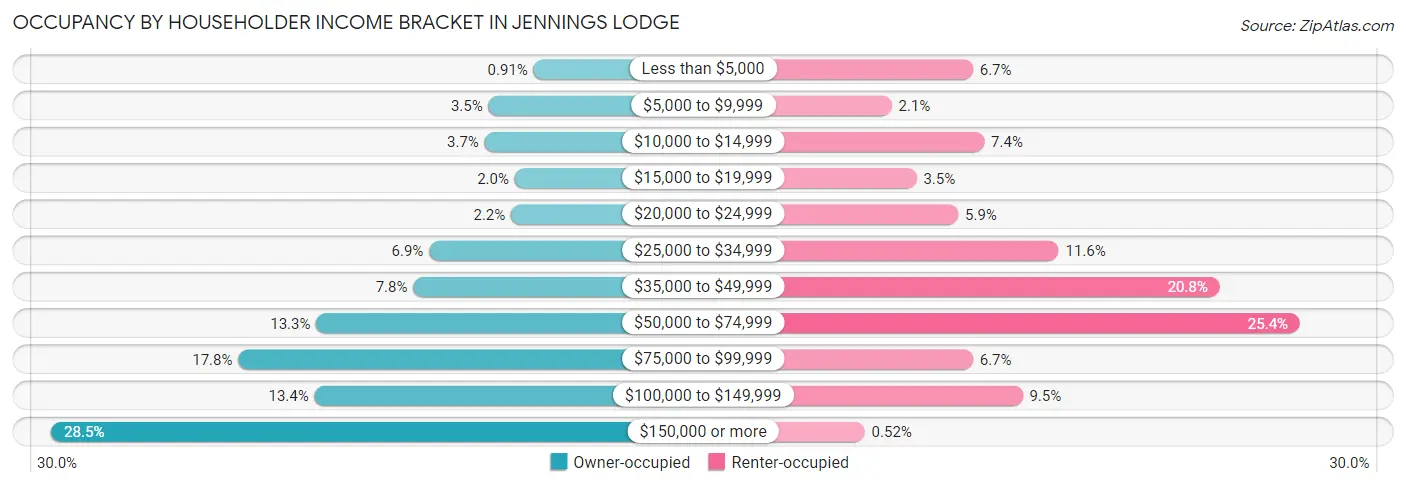
| Income Bracket | Owner-occupied | Renter-occupied |
| Less than $5,000 | 17 (0.9%) | 104 (6.7%) |
| $5,000 to $9,999 | 65 (3.5%) | 32 (2.1%) |
| $10,000 to $14,999 | 69 (3.7%) | 114 (7.3%) |
| $15,000 to $19,999 | 37 (2.0%) | 54 (3.5%) |
| $20,000 to $24,999 | 41 (2.2%) | 91 (5.9%) |
| $25,000 to $34,999 | 128 (6.9%) | 180 (11.6%) |
| $35,000 to $49,999 | 145 (7.8%) | 323 (20.8%) |
| $50,000 to $74,999 | 248 (13.3%) | 394 (25.4%) |
| $75,000 to $99,999 | 331 (17.8%) | 104 (6.7%) |
| $100,000 to $149,999 | 250 (13.4%) | 148 (9.5%) |
| $150,000 or more | 530 (28.5%) | 8 (0.5%) |
| Total | 1,861 (100.0%) | 1,552 (100.0%) |
Monthly Housing Cost Tiers in Jennings Lodge
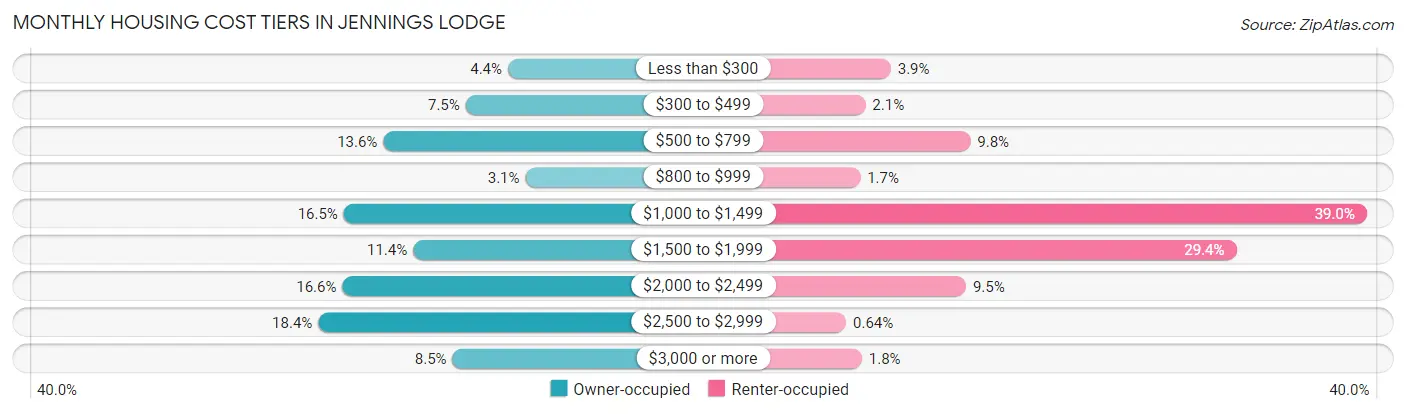
| Monthly Cost | Owner-occupied | Renter-occupied |
| Less than $300 | 82 (4.4%) | 61 (3.9%) |
| $300 to $499 | 140 (7.5%) | 32 (2.1%) |
| $500 to $799 | 253 (13.6%) | 152 (9.8%) |
| $800 to $999 | 58 (3.1%) | 26 (1.7%) |
| $1,000 to $1,499 | 307 (16.5%) | 605 (39.0%) |
| $1,500 to $1,999 | 212 (11.4%) | 456 (29.4%) |
| $2,000 to $2,499 | 309 (16.6%) | 147 (9.5%) |
| $2,500 to $2,999 | 342 (18.4%) | 10 (0.6%) |
| $3,000 or more | 158 (8.5%) | 28 (1.8%) |
| Total | 1,861 (100.0%) | 1,552 (100.0%) |
Physical Housing Characteristics in Jennings Lodge
Housing Structures in Jennings Lodge
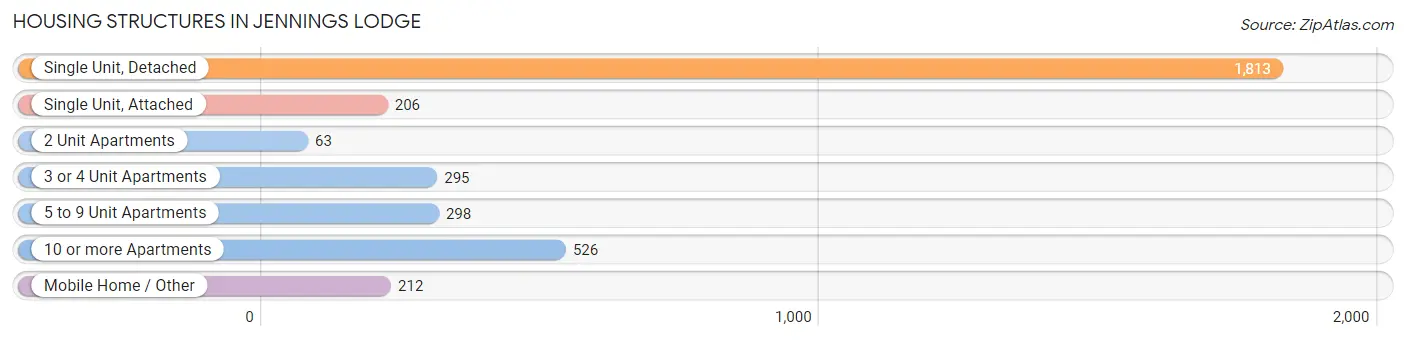
| Structure Type | # Housing Units | % Housing Units |
| Single Unit, Detached | 1,813 | 53.1% |
| Single Unit, Attached | 206 | 6.0% |
| 2 Unit Apartments | 63 | 1.8% |
| 3 or 4 Unit Apartments | 295 | 8.6% |
| 5 to 9 Unit Apartments | 298 | 8.7% |
| 10 or more Apartments | 526 | 15.4% |
| Mobile Home / Other | 212 | 6.2% |
| Total | 3,413 | 100.0% |
Housing Structures by Occupancy in Jennings Lodge
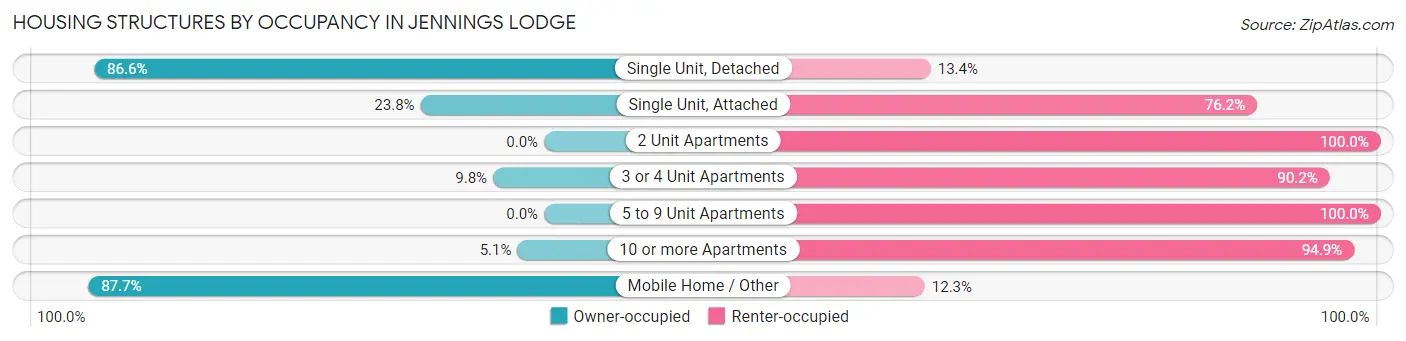
| Structure Type | Owner-occupied | Renter-occupied |
| Single Unit, Detached | 1,570 (86.6%) | 243 (13.4%) |
| Single Unit, Attached | 49 (23.8%) | 157 (76.2%) |
| 2 Unit Apartments | 0 (0.0%) | 63 (100.0%) |
| 3 or 4 Unit Apartments | 29 (9.8%) | 266 (90.2%) |
| 5 to 9 Unit Apartments | 0 (0.0%) | 298 (100.0%) |
| 10 or more Apartments | 27 (5.1%) | 499 (94.9%) |
| Mobile Home / Other | 186 (87.7%) | 26 (12.3%) |
| Total | 1,861 (54.5%) | 1,552 (45.5%) |
Housing Structures by Number of Rooms in Jennings Lodge
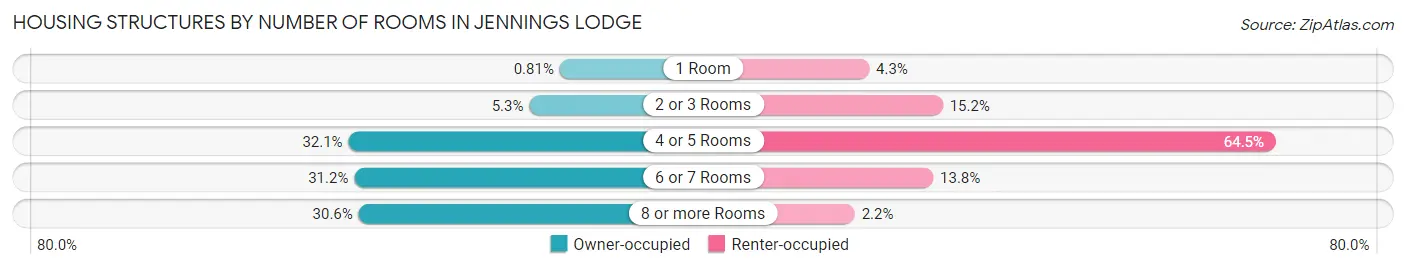
| Number of Rooms | Owner-occupied | Renter-occupied |
| 1 Room | 15 (0.8%) | 67 (4.3%) |
| 2 or 3 Rooms | 99 (5.3%) | 236 (15.2%) |
| 4 or 5 Rooms | 597 (32.1%) | 1,001 (64.5%) |
| 6 or 7 Rooms | 581 (31.2%) | 214 (13.8%) |
| 8 or more Rooms | 569 (30.6%) | 34 (2.2%) |
| Total | 1,861 (100.0%) | 1,552 (100.0%) |
Housing Structure by Heating Type in Jennings Lodge
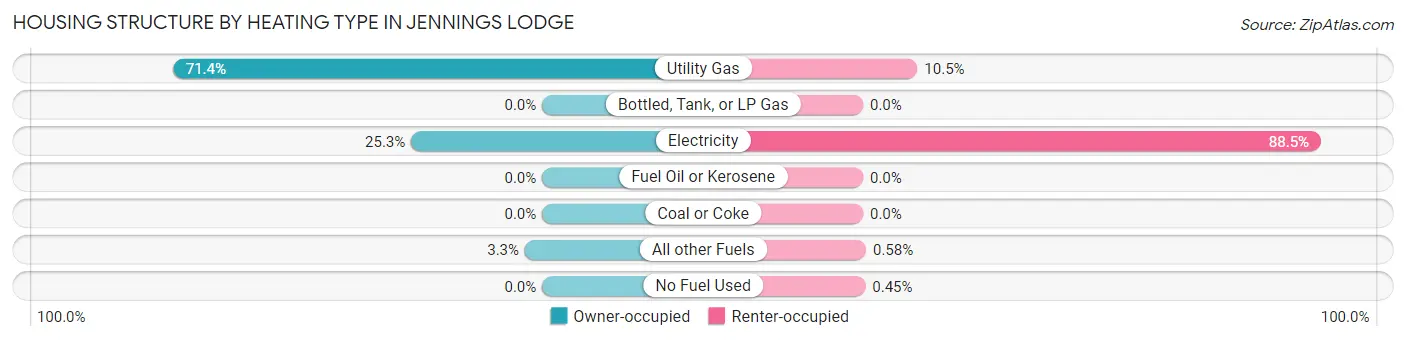
| Heating Type | Owner-occupied | Renter-occupied |
| Utility Gas | 1,328 (71.4%) | 163 (10.5%) |
| Bottled, Tank, or LP Gas | 0 (0.0%) | 0 (0.0%) |
| Electricity | 471 (25.3%) | 1,373 (88.5%) |
| Fuel Oil or Kerosene | 0 (0.0%) | 0 (0.0%) |
| Coal or Coke | 0 (0.0%) | 0 (0.0%) |
| All other Fuels | 62 (3.3%) | 9 (0.6%) |
| No Fuel Used | 0 (0.0%) | 7 (0.4%) |
| Total | 1,861 (100.0%) | 1,552 (100.0%) |
Household Vehicle Usage in Jennings Lodge
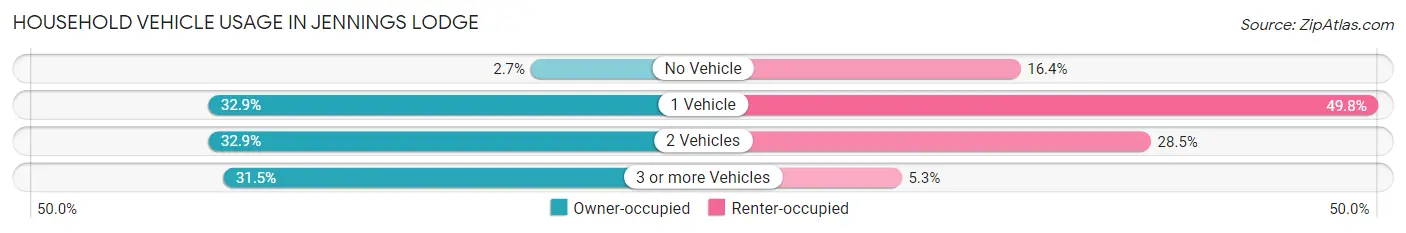
| Vehicles per Household | Owner-occupied | Renter-occupied |
| No Vehicle | 51 (2.7%) | 254 (16.4%) |
| 1 Vehicle | 612 (32.9%) | 773 (49.8%) |
| 2 Vehicles | 612 (32.9%) | 443 (28.5%) |
| 3 or more Vehicles | 586 (31.5%) | 82 (5.3%) |
| Total | 1,861 (100.0%) | 1,552 (100.0%) |
Real Estate & Mortgages in Jennings Lodge
Real Estate and Mortgage Overview in Jennings Lodge
| Characteristic | Without Mortgage | With Mortgage |
| Housing Units | 615 | 1,246 |
| Median Property Value | $342,700 | $442,500 |
| Median Household Income | $37,981 | $450 |
| Monthly Housing Costs | $608 | $158 |
| Real Estate Taxes | $2,814 | $0 |
Property Value by Mortgage Status in Jennings Lodge
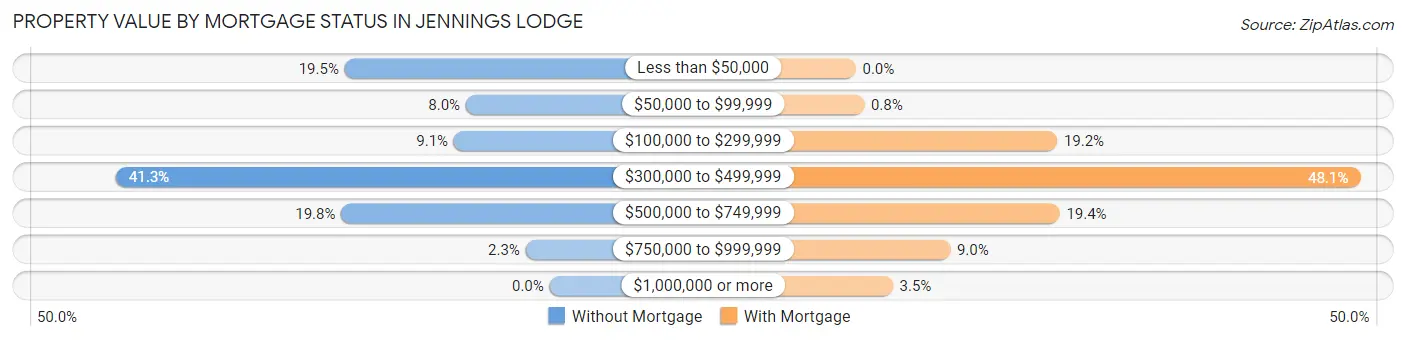
| Property Value | Without Mortgage | With Mortgage |
| Less than $50,000 | 120 (19.5%) | 0 (0.0%) |
| $50,000 to $99,999 | 49 (8.0%) | 10 (0.8%) |
| $100,000 to $299,999 | 56 (9.1%) | 239 (19.2%) |
| $300,000 to $499,999 | 254 (41.3%) | 599 (48.1%) |
| $500,000 to $749,999 | 122 (19.8%) | 242 (19.4%) |
| $750,000 to $999,999 | 14 (2.3%) | 112 (9.0%) |
| $1,000,000 or more | 0 (0.0%) | 44 (3.5%) |
| Total | 615 (100.0%) | 1,246 (100.0%) |
Household Income by Mortgage Status in Jennings Lodge
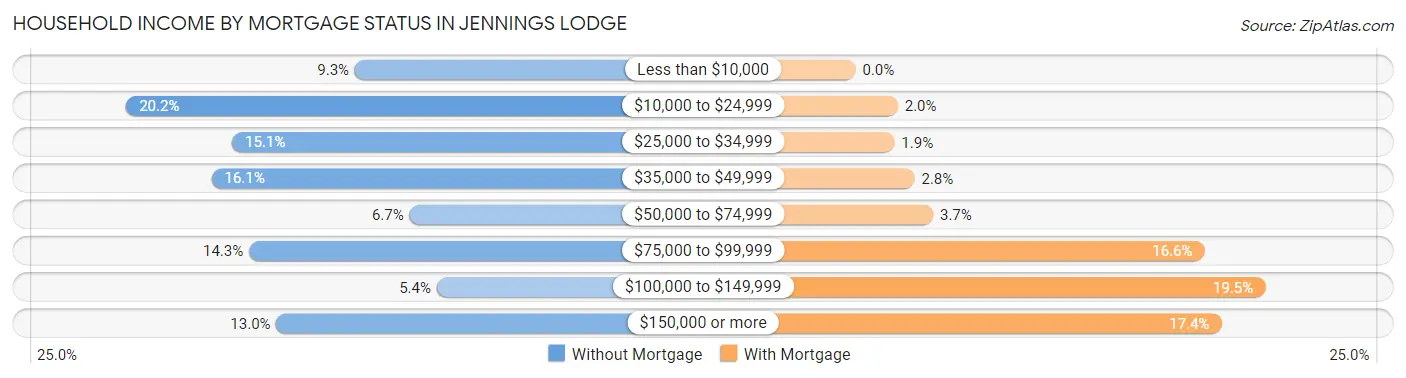
| Household Income | Without Mortgage | With Mortgage |
| Less than $10,000 | 57 (9.3%) | 0 (0.0%) |
| $10,000 to $24,999 | 124 (20.2%) | 25 (2.0%) |
| $25,000 to $34,999 | 93 (15.1%) | 23 (1.8%) |
| $35,000 to $49,999 | 99 (16.1%) | 35 (2.8%) |
| $50,000 to $74,999 | 41 (6.7%) | 46 (3.7%) |
| $75,000 to $99,999 | 88 (14.3%) | 207 (16.6%) |
| $100,000 to $149,999 | 33 (5.4%) | 243 (19.5%) |
| $150,000 or more | 80 (13.0%) | 217 (17.4%) |
| Total | 615 (100.0%) | 1,246 (100.0%) |
Property Value to Household Income Ratio in Jennings Lodge
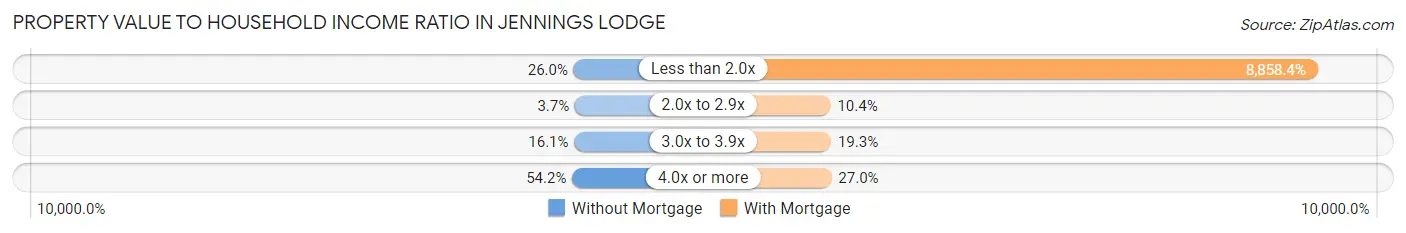
| Value-to-Income Ratio | Without Mortgage | With Mortgage |
| Less than 2.0x | 160 (26.0%) | 110,375 (8,858.4%) |
| 2.0x to 2.9x | 23 (3.7%) | 129 (10.3%) |
| 3.0x to 3.9x | 99 (16.1%) | 241 (19.3%) |
| 4.0x or more | 333 (54.1%) | 336 (27.0%) |
| Total | 615 (100.0%) | 1,246 (100.0%) |
Real Estate Taxes by Mortgage Status in Jennings Lodge
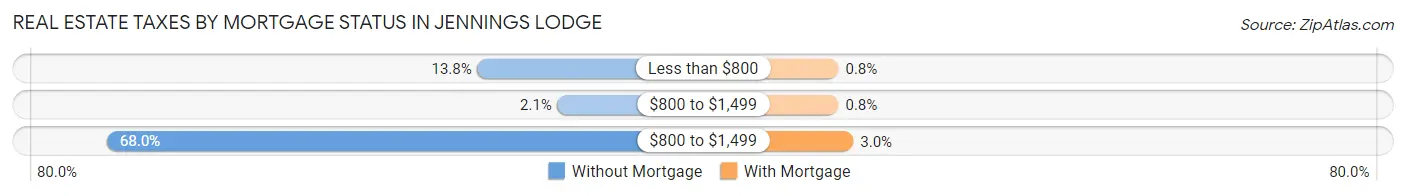
| Property Taxes | Without Mortgage | With Mortgage |
| Less than $800 | 85 (13.8%) | 10 (0.8%) |
| $800 to $1,499 | 13 (2.1%) | 10 (0.8%) |
| $800 to $1,499 | 418 (68.0%) | 37 (3.0%) |
| Total | 615 (100.0%) | 1,246 (100.0%) |
Health & Disability in Jennings Lodge
Health Insurance Coverage by Age in Jennings Lodge
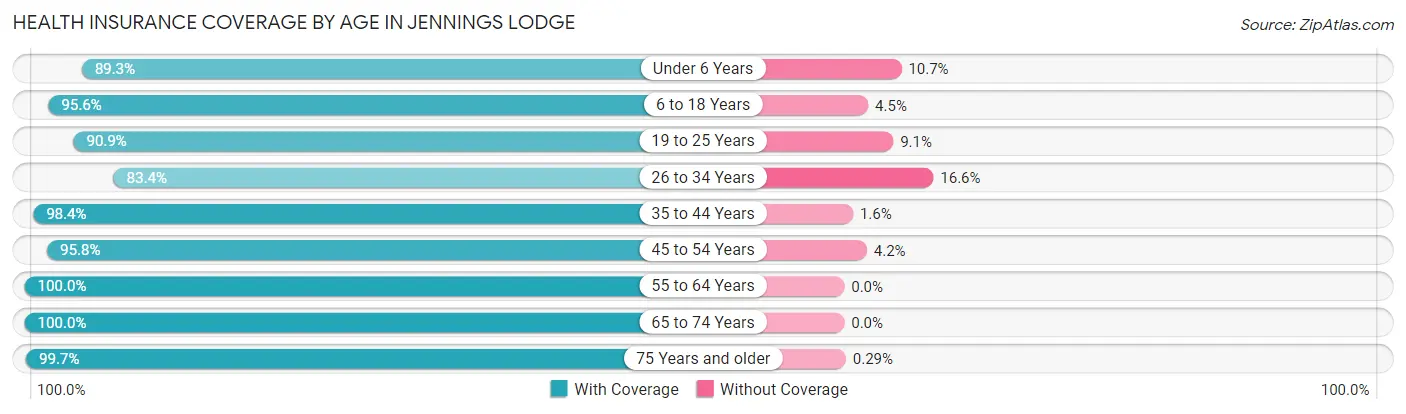
| Age Bracket | With Coverage | Without Coverage |
| Under 6 Years | 352 (89.3%) | 42 (10.7%) |
| 6 to 18 Years | 988 (95.6%) | 46 (4.4%) |
| 19 to 25 Years | 608 (90.9%) | 61 (9.1%) |
| 26 to 34 Years | 733 (83.4%) | 146 (16.6%) |
| 35 to 44 Years | 1,039 (98.4%) | 17 (1.6%) |
| 45 to 54 Years | 1,096 (95.8%) | 48 (4.2%) |
| 55 to 64 Years | 998 (100.0%) | 0 (0.0%) |
| 65 to 74 Years | 791 (100.0%) | 0 (0.0%) |
| 75 Years and older | 693 (99.7%) | 2 (0.3%) |
| Total | 7,298 (95.3%) | 362 (4.7%) |
Health Insurance Coverage by Citizenship Status in Jennings Lodge
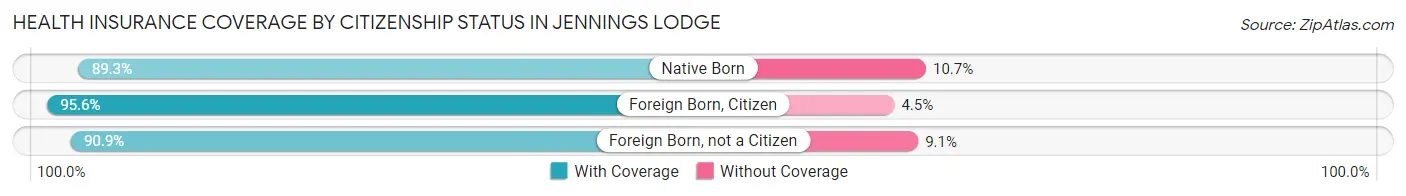
| Citizenship Status | With Coverage | Without Coverage |
| Native Born | 352 (89.3%) | 42 (10.7%) |
| Foreign Born, Citizen | 988 (95.6%) | 46 (4.4%) |
| Foreign Born, not a Citizen | 608 (90.9%) | 61 (9.1%) |
Health Insurance Coverage by Household Income in Jennings Lodge
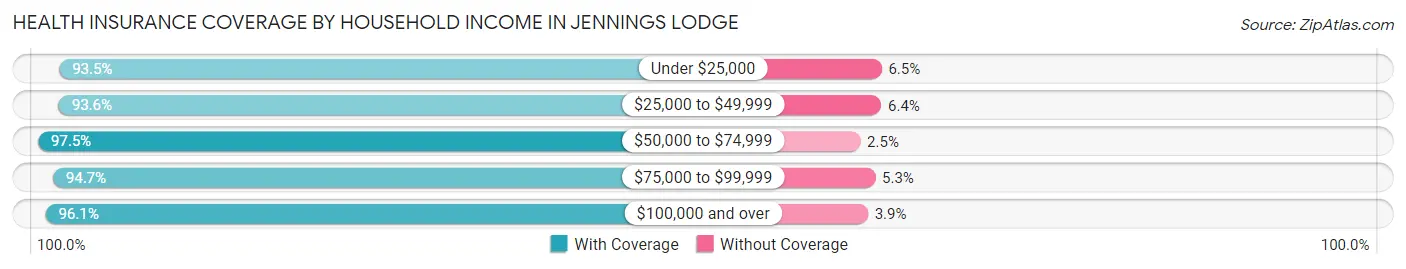
| Household Income | With Coverage | Without Coverage |
| Under $25,000 | 1,037 (93.5%) | 72 (6.5%) |
| $25,000 to $49,999 | 1,471 (93.6%) | 101 (6.4%) |
| $50,000 to $74,999 | 1,363 (97.5%) | 35 (2.5%) |
| $75,000 to $99,999 | 929 (94.7%) | 52 (5.3%) |
| $100,000 and over | 2,450 (96.1%) | 100 (3.9%) |
Public vs Private Health Insurance Coverage by Age in Jennings Lodge
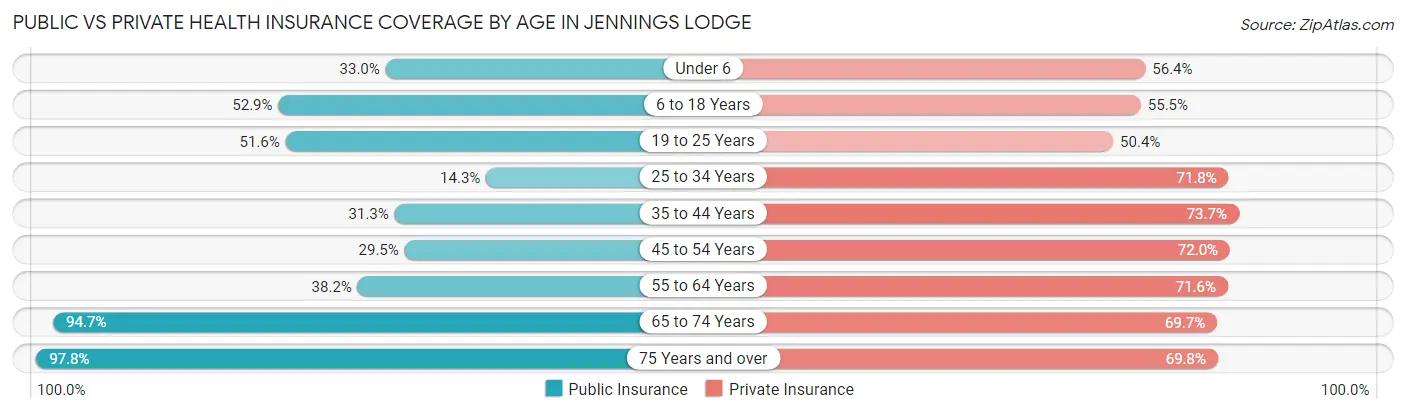
| Age Bracket | Public Insurance | Private Insurance |
| Under 6 | 130 (33.0%) | 222 (56.4%) |
| 6 to 18 Years | 547 (52.9%) | 574 (55.5%) |
| 19 to 25 Years | 345 (51.6%) | 337 (50.4%) |
| 25 to 34 Years | 126 (14.3%) | 631 (71.8%) |
| 35 to 44 Years | 331 (31.3%) | 778 (73.7%) |
| 45 to 54 Years | 337 (29.5%) | 824 (72.0%) |
| 55 to 64 Years | 381 (38.2%) | 715 (71.6%) |
| 65 to 74 Years | 749 (94.7%) | 551 (69.7%) |
| 75 Years and over | 680 (97.8%) | 485 (69.8%) |
| Total | 3,626 (47.3%) | 5,117 (66.8%) |
Disability Status by Sex by Age in Jennings Lodge
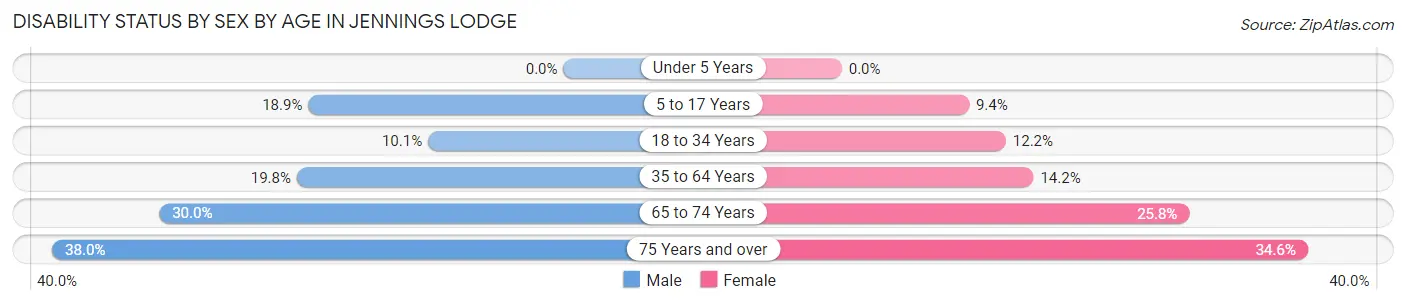
| Age Bracket | Male | Female |
| Under 5 Years | 0 (0.0%) | 0 (0.0%) |
| 5 to 17 Years | 100 (18.9%) | 52 (9.4%) |
| 18 to 34 Years | 65 (10.1%) | 115 (12.2%) |
| 35 to 64 Years | 288 (19.8%) | 248 (14.2%) |
| 65 to 74 Years | 114 (30.0%) | 106 (25.8%) |
| 75 Years and over | 63 (38.0%) | 183 (34.6%) |
Disability Class by Sex by Age in Jennings Lodge
Disability Class: Hearing Difficulty
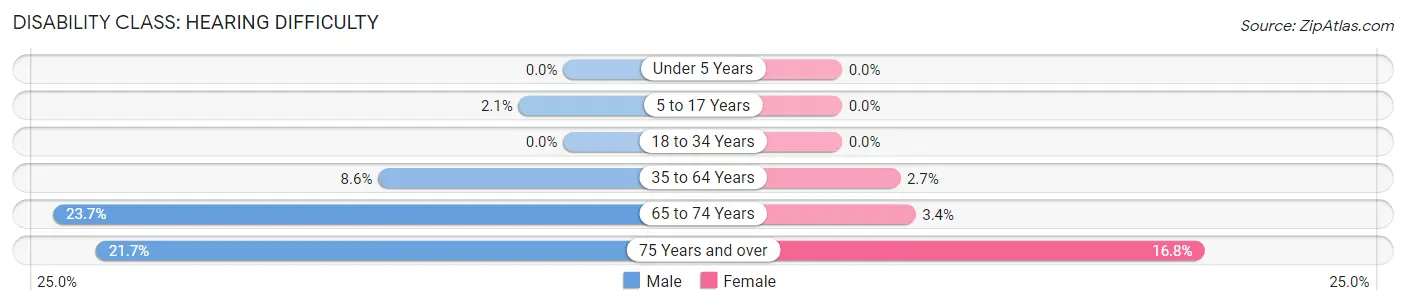
| Age Bracket | Male | Female |
| Under 5 Years | 0 (0.0%) | 0 (0.0%) |
| 5 to 17 Years | 11 (2.1%) | 0 (0.0%) |
| 18 to 34 Years | 0 (0.0%) | 0 (0.0%) |
| 35 to 64 Years | 125 (8.6%) | 47 (2.7%) |
| 65 to 74 Years | 90 (23.7%) | 14 (3.4%) |
| 75 Years and over | 36 (21.7%) | 89 (16.8%) |
Disability Class: Vision Difficulty
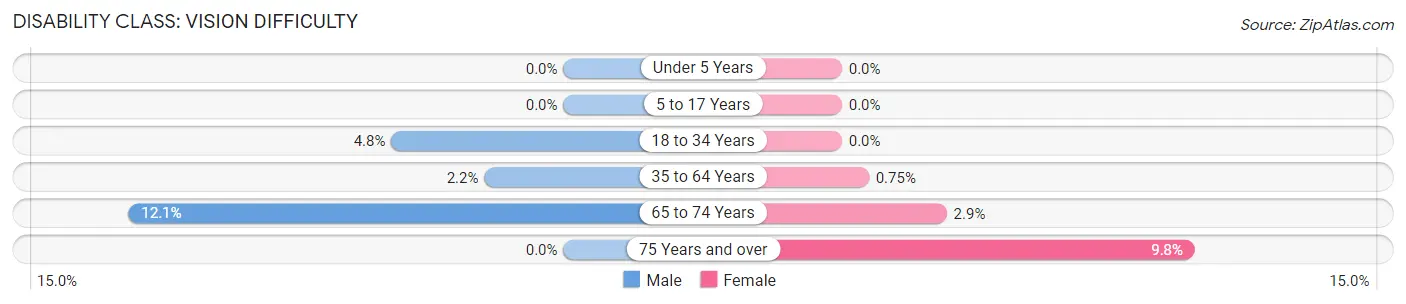
| Age Bracket | Male | Female |
| Under 5 Years | 0 (0.0%) | 0 (0.0%) |
| 5 to 17 Years | 0 (0.0%) | 0 (0.0%) |
| 18 to 34 Years | 31 (4.8%) | 0 (0.0%) |
| 35 to 64 Years | 32 (2.2%) | 13 (0.7%) |
| 65 to 74 Years | 46 (12.1%) | 12 (2.9%) |
| 75 Years and over | 0 (0.0%) | 52 (9.8%) |
Disability Class: Cognitive Difficulty
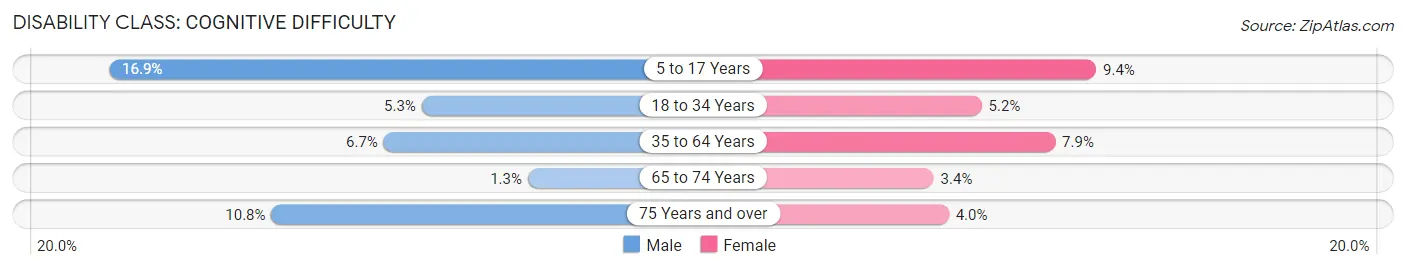
| Age Bracket | Male | Female |
| 5 to 17 Years | 89 (16.9%) | 52 (9.4%) |
| 18 to 34 Years | 34 (5.3%) | 49 (5.2%) |
| 35 to 64 Years | 97 (6.7%) | 138 (7.9%) |
| 65 to 74 Years | 5 (1.3%) | 14 (3.4%) |
| 75 Years and over | 18 (10.8%) | 21 (4.0%) |
Disability Class: Ambulatory Difficulty
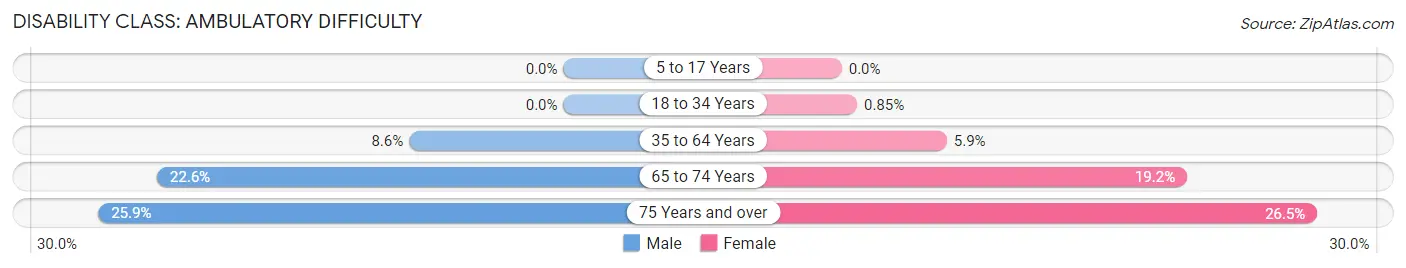
| Age Bracket | Male | Female |
| 5 to 17 Years | 0 (0.0%) | 0 (0.0%) |
| 18 to 34 Years | 0 (0.0%) | 8 (0.9%) |
| 35 to 64 Years | 125 (8.6%) | 102 (5.9%) |
| 65 to 74 Years | 86 (22.6%) | 79 (19.2%) |
| 75 Years and over | 43 (25.9%) | 140 (26.5%) |
Disability Class: Self-Care Difficulty
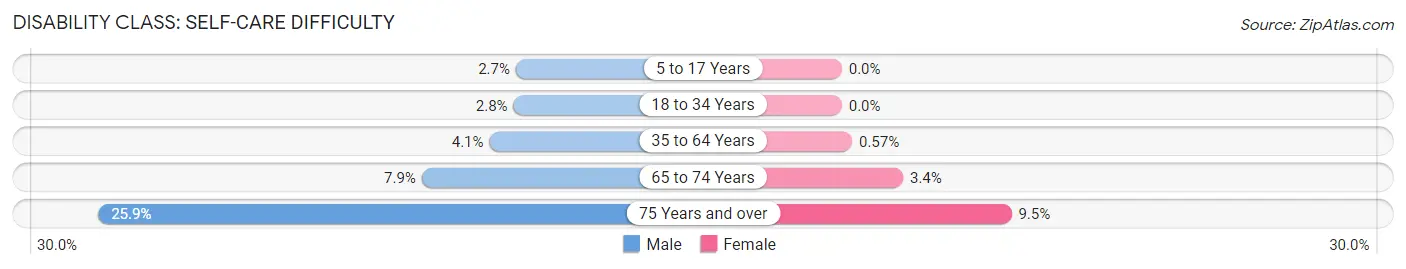
| Age Bracket | Male | Female |
| 5 to 17 Years | 14 (2.6%) | 0 (0.0%) |
| 18 to 34 Years | 18 (2.8%) | 0 (0.0%) |
| 35 to 64 Years | 60 (4.1%) | 10 (0.6%) |
| 65 to 74 Years | 30 (7.9%) | 14 (3.4%) |
| 75 Years and over | 43 (25.9%) | 50 (9.5%) |
Technology Access in Jennings Lodge
Computing Device Access in Jennings Lodge
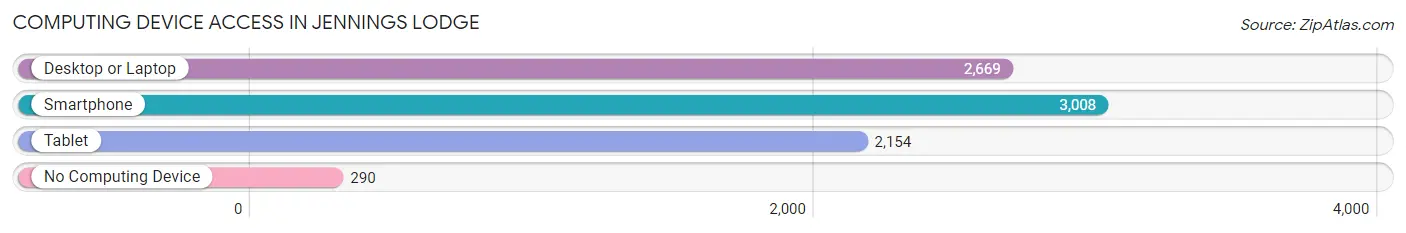
| Device Type | # Households | % Households |
| Desktop or Laptop | 2,669 | 78.2% |
| Smartphone | 3,008 | 88.1% |
| Tablet | 2,154 | 63.1% |
| No Computing Device | 290 | 8.5% |
| Total | 3,413 | 100.0% |
Internet Access in Jennings Lodge
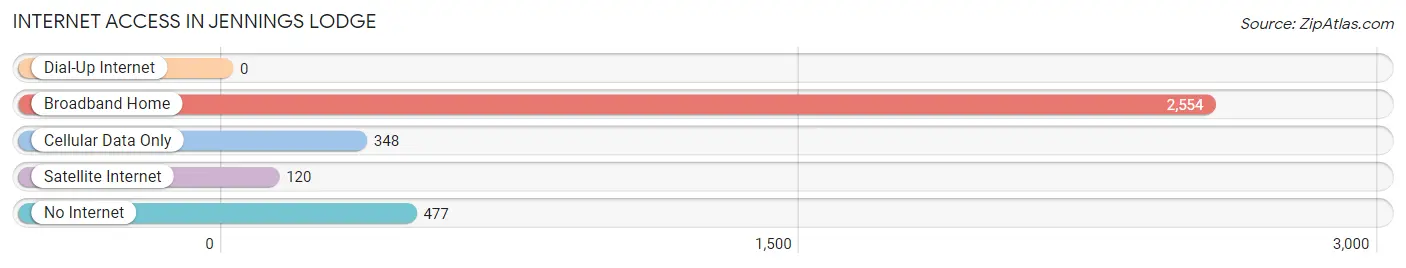
| Internet Type | # Households | % Households |
| Dial-Up Internet | 0 | 0.0% |
| Broadband Home | 2,554 | 74.8% |
| Cellular Data Only | 348 | 10.2% |
| Satellite Internet | 120 | 3.5% |
| No Internet | 477 | 14.0% |
| Total | 3,413 | 100.0% |
Jennings Lodge Summary
Jennings Lodge is a small unincorporated community located in Clackamas County, Oregon, United States. It is situated along the Clackamas River, approximately 10 miles southeast of Oregon City. The community is named after the Jennings family, who settled in the area in the late 1800s.
History
Jennings Lodge was first settled in the late 1800s by the Jennings family. The family was originally from Missouri and had moved to Oregon in search of a better life. The family purchased a large tract of land along the Clackamas River and began farming. The area was known as Jennings Landing, and the family built a small store and post office in the area.
In the early 1900s, the area began to grow as more settlers moved to the area. The community was officially incorporated in 1911 and was named after the Jennings family. The town was primarily a farming community, with the main crops being wheat, oats, and hay.
In the 1950s, the area began to experience a population boom as more people moved to the area. The population of Jennings Lodge grew to over 1,000 people by the 1960s. The town was primarily a bedroom community for people who worked in nearby Oregon City and Portland.
Geography
Jennings Lodge is located in Clackamas County, Oregon, approximately 10 miles southeast of Oregon City. The community is situated along the Clackamas River, which provides a scenic backdrop for the town. The area is mostly rural, with rolling hills and farmland. The town is surrounded by the Willamette National Forest, which provides a variety of outdoor activities for residents and visitors.
Economy
The economy of Jennings Lodge is primarily based on agriculture. The area is known for its production of wheat, oats, and hay. The town also has a few small businesses, including a grocery store, a hardware store, and a few restaurants.
Demographics
As of the 2010 census, the population of Jennings Lodge was 1,093. The racial makeup of the town was 94.3% White, 0.7% African American, 0.3% Native American, 0.7% Asian, 0.1% Pacific Islander, and 3.0% from other races. The median household income was $45,000, and the median family income was $50,000.
Conclusion
Jennings Lodge is a small unincorporated community located in Clackamas County, Oregon. The town was first settled in the late 1800s by the Jennings family and was officially incorporated in 1911. The economy of Jennings Lodge is primarily based on agriculture, with the main crops being wheat, oats, and hay. As of the 2010 census, the population of Jennings Lodge was 1,093. The town is a popular destination for outdoor activities, such as fishing, camping, and hiking.
Common Questions
What is the Total Population of Jennings Lodge?
Total Population of Jennings Lodge is 7,662.
What is the Total Male Population of Jennings Lodge?
Total Male Population of Jennings Lodge is 3,325.
What is the Total Female Population of Jennings Lodge?
Total Female Population of Jennings Lodge is 4,337.
What is the Ratio of Males per 100 Females in Jennings Lodge?
There are 76.67 Males per 100 Females in Jennings Lodge.
What is the Ratio of Females per 100 Males in Jennings Lodge?
There are 130.44 Females per 100 Males in Jennings Lodge.
What is the Median Population Age in Jennings Lodge?
Median Population Age in Jennings Lodge is 42.4 Years.
What is the Average Family Size in Jennings Lodge
Average Family Size in Jennings Lodge is 2.8 People.
What is the Average Household Size in Jennings Lodge
Average Household Size in Jennings Lodge is 2.2 People.
What is Per Capita Income in Jennings Lodge?
Per Capita income in Jennings Lodge is $37,887.
What is the Median Family Income in Jennings Lodge?
Median Family Income in Jennings Lodge is $68,925.
What is the Median Household income in Jennings Lodge?
Median Household Income in Jennings Lodge is $64,887.
What is Income or Wage Gap in Jennings Lodge?
Income or Wage Gap in Jennings Lodge is 31.3%.
Women in Jennings Lodge earn 68.7 cents for every dollar earned by a man.
What is Inequality or Gini Index in Jennings Lodge?
Inequality or Gini Index in Jennings Lodge is 0.46.
How Large is the Labor Force in Jennings Lodge?
There are 4,084 People in the Labor Forcein in Jennings Lodge.
What is the Percentage of People in the Labor Force in Jennings Lodge?
63.1% of People are in the Labor Force in Jennings Lodge.
What is the Unemployment Rate in Jennings Lodge?
Unemployment Rate in Jennings Lodge is 5.8%.