Taylor Creek, OH
Taylor Creek Map
Taylor Creek Overview
3,986
TOTAL POPULATION
1,976
MALE POPULATION
2,010
FEMALE POPULATION
98.31
MALES / 100 FEMALES
101.72
FEMALES / 100 MALES
38.8
MEDIAN AGE
3.1
AVG FAMILY SIZE
2.7
AVG HOUSEHOLD SIZE
$42,792
PER CAPITA INCOME
$110,228
AVG FAMILY INCOME
$92,174
AVG HOUSEHOLD INCOME
31.5%
WAGE / INCOME GAP [ % ]
68.5¢/ $1
WAGE / INCOME GAP [ $ ]
0.35
INEQUALITY / GINI INDEX
2,213
LABOR FORCE [ PEOPLE ]
70.6%
PERCENT IN LABOR FORCE
1.5%
UNEMPLOYMENT RATE
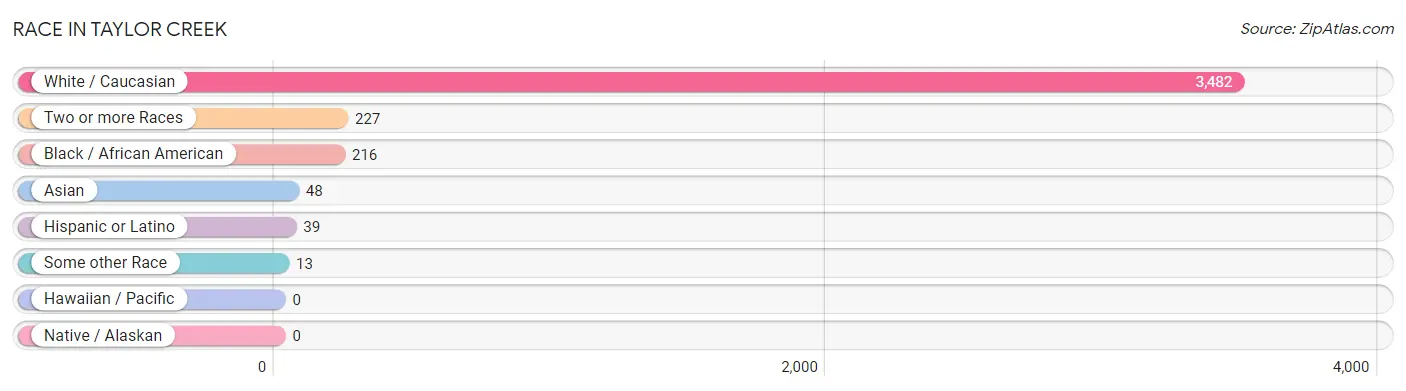
Race in Taylor Creek
The most populous races in Taylor Creek are White / Caucasian (3,482 | 87.4%), Two or more Races (227 | 5.7%), and Black / African American (216 | 5.4%).
| Race | # Population | % Population |
| Asian | 48 | 1.2% |
| Black / African American | 216 | 5.4% |
| Hawaiian / Pacific | 0 | 0.0% |
| Hispanic or Latino | 39 | 1.0% |
| Native / Alaskan | 0 | 0.0% |
| White / Caucasian | 3,482 | 87.4% |
| Two or more Races | 227 | 5.7% |
| Some other Race | 13 | 0.3% |
| Total | 3,986 | 100.0% |
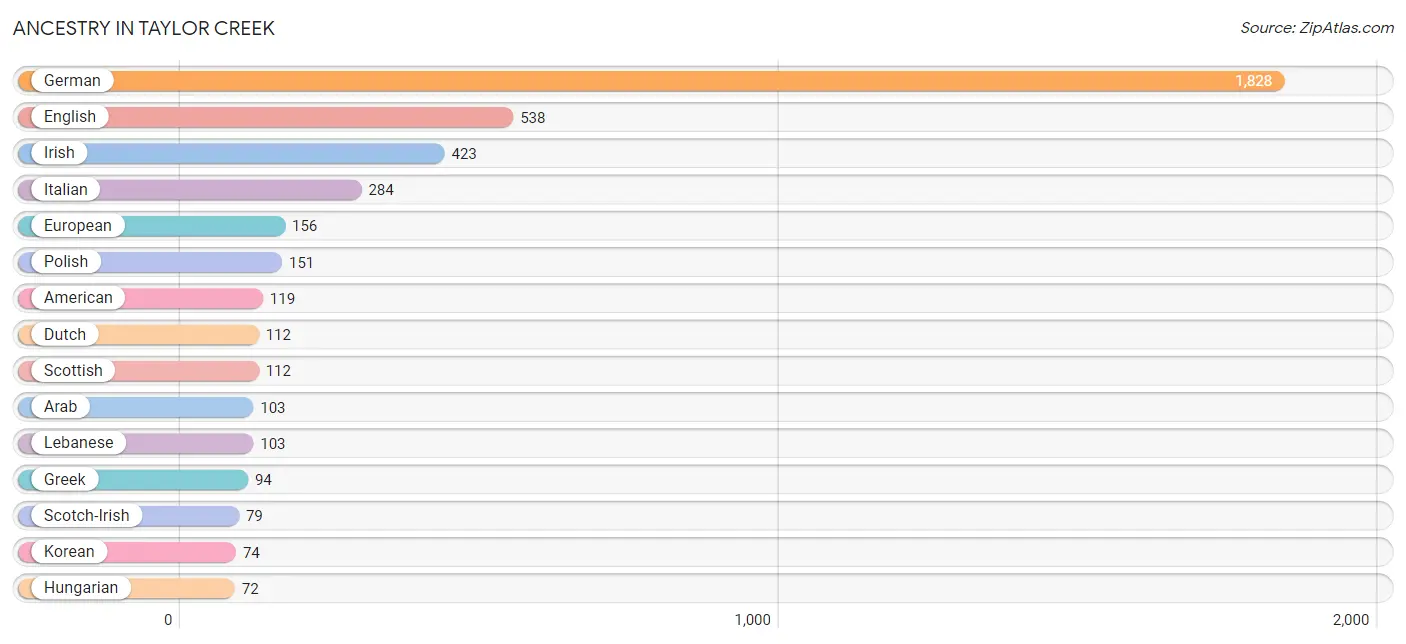
Ancestry in Taylor Creek
The most populous ancestries reported in Taylor Creek are German (1,828 | 45.9%), English (538 | 13.5%), Irish (423 | 10.6%), Italian (284 | 7.1%), and European (156 | 3.9%), together accounting for 81.0% of all Taylor Creek residents.
| Ancestry | # Population | % Population |
| African | 14 | 0.4% |
| American | 119 | 3.0% |
| Arab | 103 | 2.6% |
| Belgian | 52 | 1.3% |
| British | 63 | 1.6% |
| Burmese | 11 | 0.3% |
| Canadian | 7 | 0.2% |
| Colombian | 39 | 1.0% |
| Dutch | 112 | 2.8% |
| Eastern European | 10 | 0.3% |
| English | 538 | 13.5% |
| European | 156 | 3.9% |
| French | 28 | 0.7% |
| German | 1,828 | 45.9% |
| Greek | 94 | 2.4% |
| Hungarian | 72 | 1.8% |
| Irish | 423 | 10.6% |
| Italian | 284 | 7.1% |
| Korean | 74 | 1.9% |
| Lebanese | 103 | 2.6% |
| Polish | 151 | 3.8% |
| Scotch-Irish | 79 | 2.0% |
| Scottish | 112 | 2.8% |
| South American | 39 | 1.0% |
| Subsaharan African | 14 | 0.4% |
| Turkish | 7 | 0.2% |
| Welsh | 9 | 0.2% | View All 27 Rows |
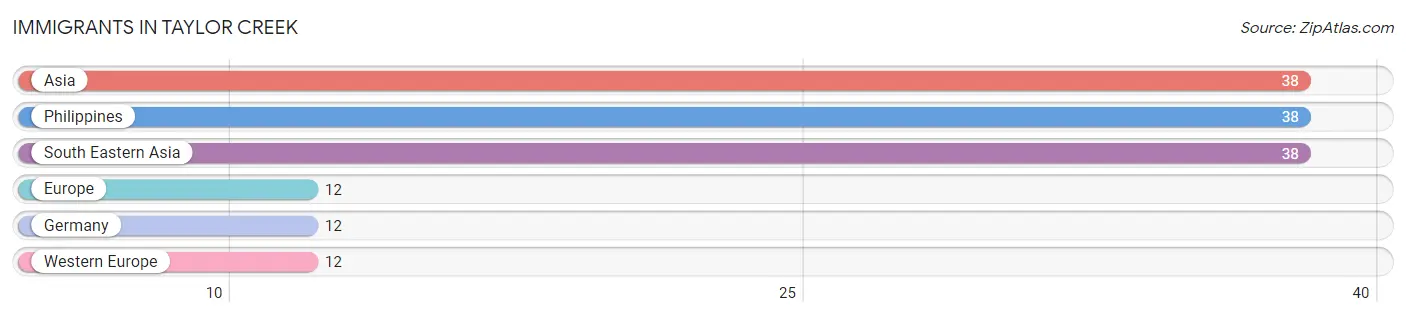
Immigrants in Taylor Creek
The most numerous immigrant groups reported in Taylor Creek came from Asia (38 | 0.9%), Philippines (38 | 0.9%), South Eastern Asia (38 | 0.9%), Europe (12 | 0.3%), and Germany (12 | 0.3%), together accounting for 3.5% of all Taylor Creek residents.
| Immigration Origin | # Population | % Population |
| Asia | 38 | 0.9% |
| Europe | 12 | 0.3% |
| Germany | 12 | 0.3% |
| Philippines | 38 | 0.9% |
| South Eastern Asia | 38 | 0.9% |
| Western Europe | 12 | 0.3% | View All 6 Rows |
Sex and Age in Taylor Creek
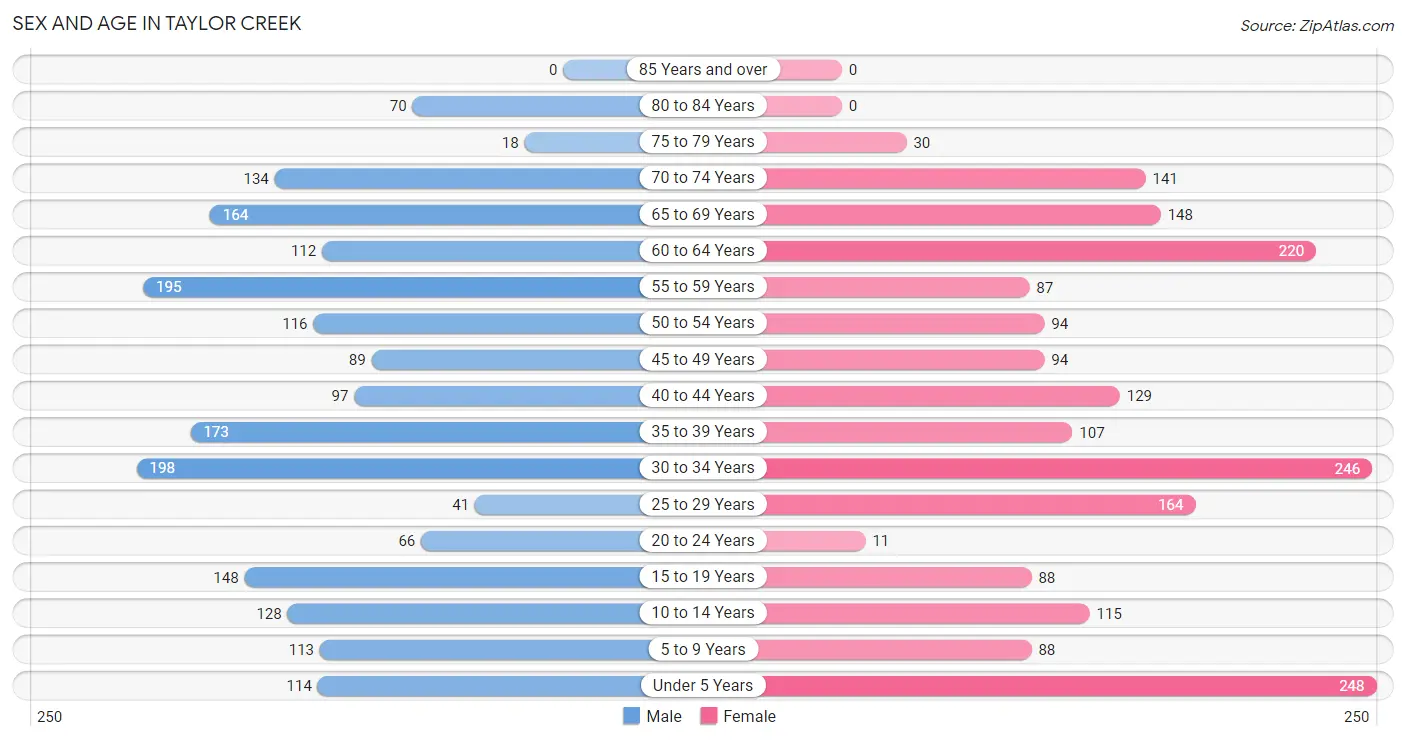
Sex and Age in Taylor Creek
The most populous age groups in Taylor Creek are 30 to 34 Years (198 | 10.0%) for men and Under 5 Years (248 | 12.3%) for women.
| Age Bracket | Male | Female |
| Under 5 Years | 114 (5.8%) | 248 (12.3%) |
| 5 to 9 Years | 113 (5.7%) | 88 (4.4%) |
| 10 to 14 Years | 128 (6.5%) | 115 (5.7%) |
| 15 to 19 Years | 148 (7.5%) | 88 (4.4%) |
| 20 to 24 Years | 66 (3.3%) | 11 (0.5%) |
| 25 to 29 Years | 41 (2.1%) | 164 (8.2%) |
| 30 to 34 Years | 198 (10.0%) | 246 (12.2%) |
| 35 to 39 Years | 173 (8.8%) | 107 (5.3%) |
| 40 to 44 Years | 97 (4.9%) | 129 (6.4%) |
| 45 to 49 Years | 89 (4.5%) | 94 (4.7%) |
| 50 to 54 Years | 116 (5.9%) | 94 (4.7%) |
| 55 to 59 Years | 195 (9.9%) | 87 (4.3%) |
| 60 to 64 Years | 112 (5.7%) | 220 (11.0%) |
| 65 to 69 Years | 164 (8.3%) | 148 (7.4%) |
| 70 to 74 Years | 134 (6.8%) | 141 (7.0%) |
| 75 to 79 Years | 18 (0.9%) | 30 (1.5%) |
| 80 to 84 Years | 70 (3.5%) | 0 (0.0%) |
| 85 Years and over | 0 (0.0%) | 0 (0.0%) |
| Total | 1,976 (100.0%) | 2,010 (100.0%) |
Families and Households in Taylor Creek
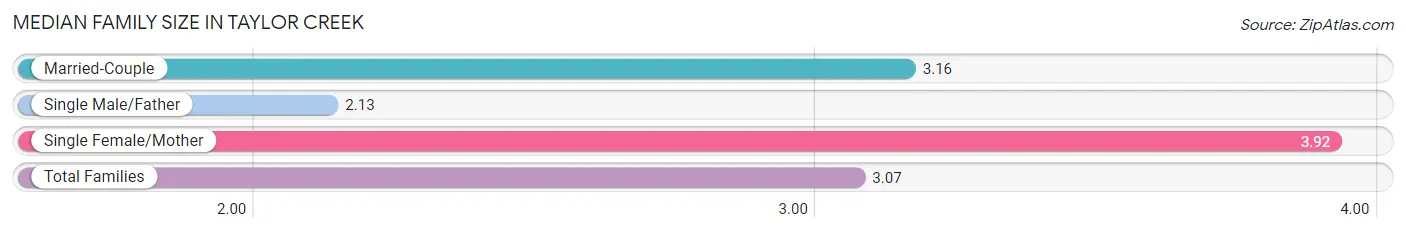
Median Family Size in Taylor Creek
The median family size in Taylor Creek is 3.07 persons per family, with single female/mother families (39 | 3.4%) accounting for the largest median family size of 3.92 persons per family. On the other hand, single male/father families (122 | 10.6%) represent the smallest median family size with 2.13 persons per family.
| Family Type | # Families | Family Size |
| Married-Couple | 986 (86.0%) | 3.16 |
| Single Male/Father | 122 (10.6%) | 2.13 |
| Single Female/Mother | 39 (3.4%) | 3.92 |
| Total Families | 1,147 (100.0%) | 3.07 |
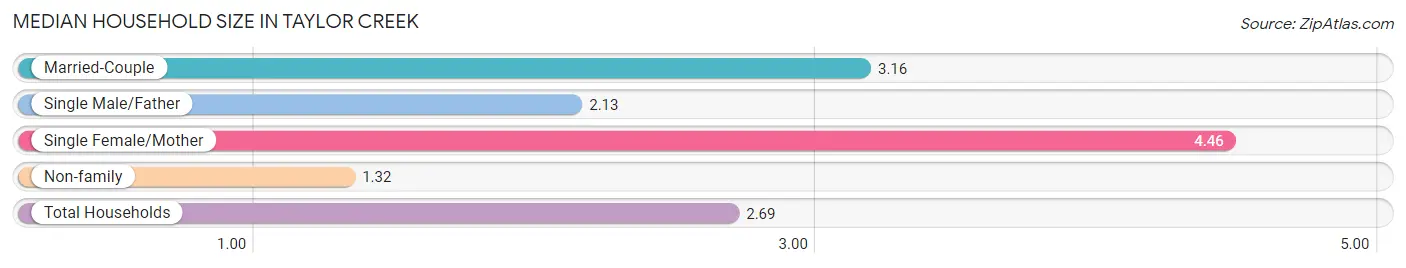
Median Household Size in Taylor Creek
The median household size in Taylor Creek is 2.69 persons per household, with single female/mother households (39 | 2.6%) accounting for the largest median household size of 4.46 persons per household. non-family households (333 | 22.5%) represent the smallest median household size with 1.32 persons per household.
| Household Type | # Households | Household Size |
| Married-Couple | 986 (66.6%) | 3.16 |
| Single Male/Father | 122 (8.2%) | 2.13 |
| Single Female/Mother | 39 (2.6%) | 4.46 |
| Non-family | 333 (22.5%) | 1.32 |
| Total Households | 1,480 (100.0%) | 2.69 |
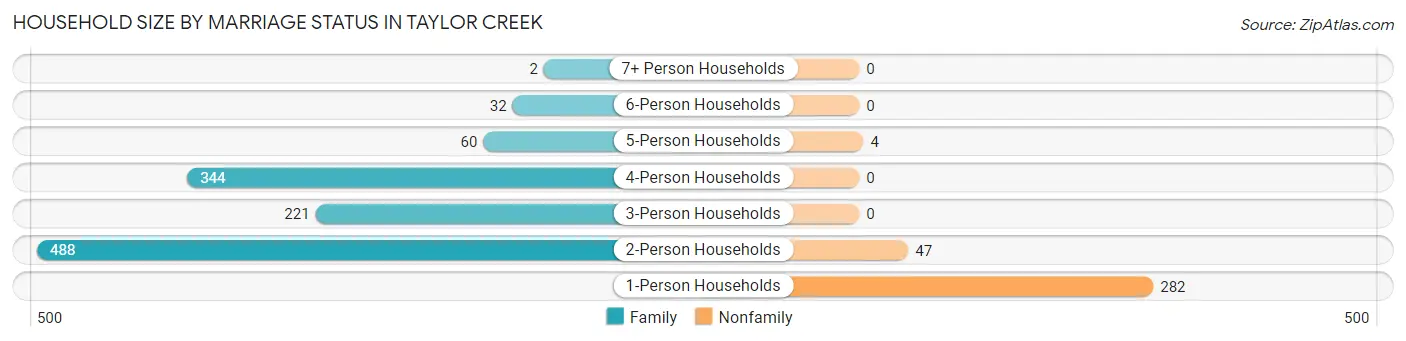
Household Size by Marriage Status in Taylor Creek
Out of a total of 1,480 households in Taylor Creek, 1,147 (77.5%) are family households, while 333 (22.5%) are nonfamily households. The most numerous type of family households are 2-person households, comprising 488, and the most common type of nonfamily households are 1-person households, comprising 282.
| Household Size | Family Households | Nonfamily Households |
| 1-Person Households | - | 282 (19.1%) |
| 2-Person Households | 488 (33.0%) | 47 (3.2%) |
| 3-Person Households | 221 (14.9%) | 0 (0.0%) |
| 4-Person Households | 344 (23.2%) | 0 (0.0%) |
| 5-Person Households | 60 (4.1%) | 4 (0.3%) |
| 6-Person Households | 32 (2.2%) | 0 (0.0%) |
| 7+ Person Households | 2 (0.1%) | 0 (0.0%) |
| Total | 1,147 (77.5%) | 333 (22.5%) |
Female Fertility in Taylor Creek
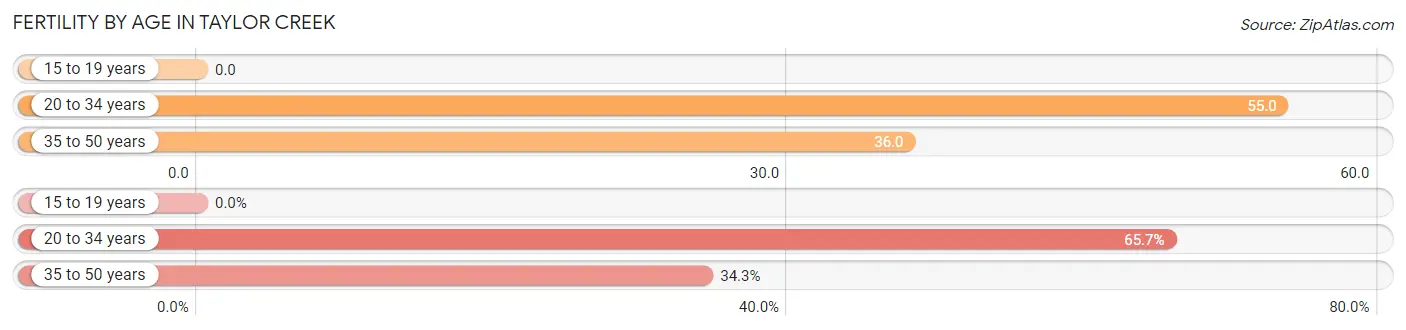
Fertility by Age in Taylor Creek
Average fertility rate in Taylor Creek is 42.0 births per 1,000 women. Women in the age bracket of 20 to 34 years have the highest fertility rate with 55.0 births per 1,000 women. Women in the age bracket of 20 to 34 years acount for 65.7% of all women with births.
| Age Bracket | Women with Births | Births / 1,000 Women |
| 15 to 19 years | 0 (0.0%) | 0.0 |
| 20 to 34 years | 23 (65.7%) | 55.0 |
| 35 to 50 years | 12 (34.3%) | 36.0 |
| Total | 35 (100.0%) | 42.0 |
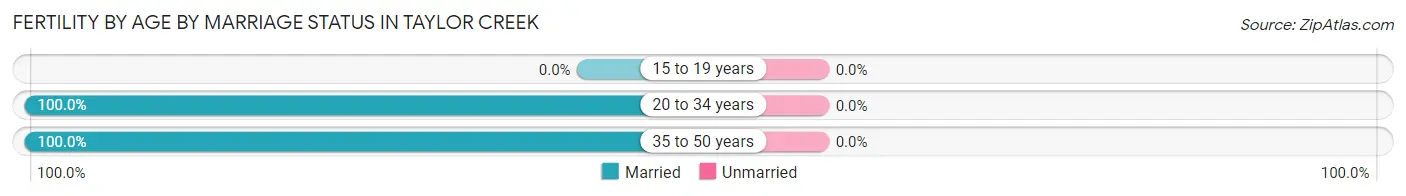
Fertility by Age by Marriage Status in Taylor Creek
| Age Bracket | Married | Unmarried |
| 15 to 19 years | 0 (0.0%) | 0 (0.0%) |
| 20 to 34 years | 23 (100.0%) | 0 (0.0%) |
| 35 to 50 years | 12 (100.0%) | 0 (0.0%) |
| Total | 35 (100.0%) | 0 (0.0%) |
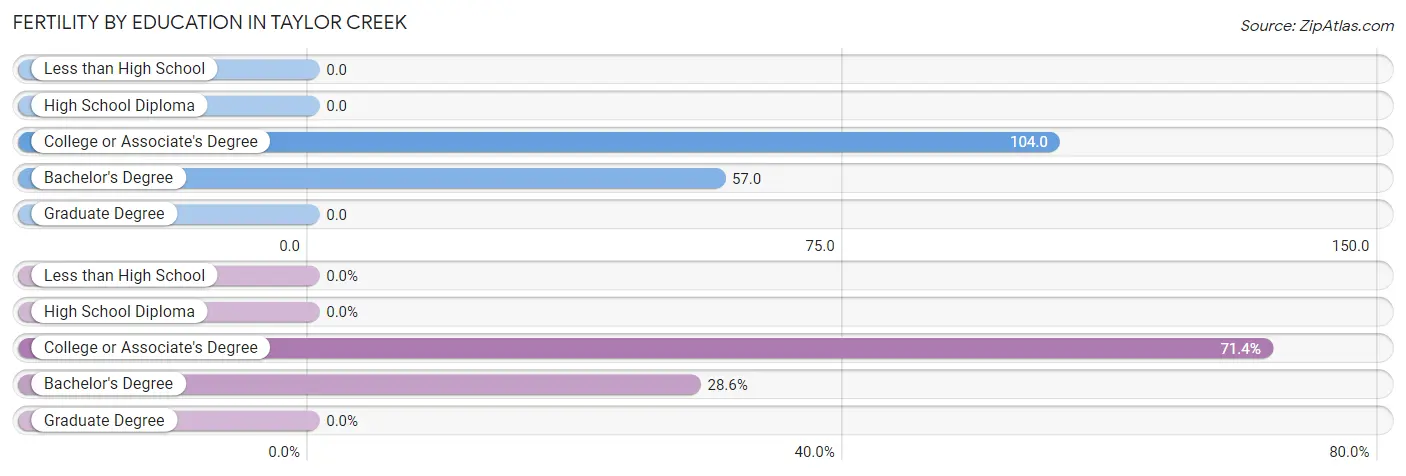
Fertility by Education in Taylor Creek
| Educational Attainment | Women with Births | Births / 1,000 Women |
| Less than High School | 0 (0.0%) | 0.0 |
| High School Diploma | 0 (0.0%) | 0.0 |
| College or Associate's Degree | 25 (71.4%) | 104.0 |
| Bachelor's Degree | 10 (28.6%) | 57.0 |
| Graduate Degree | 0 (0.0%) | 0.0 |
| Total | 35 (100.0%) | 42.0 |
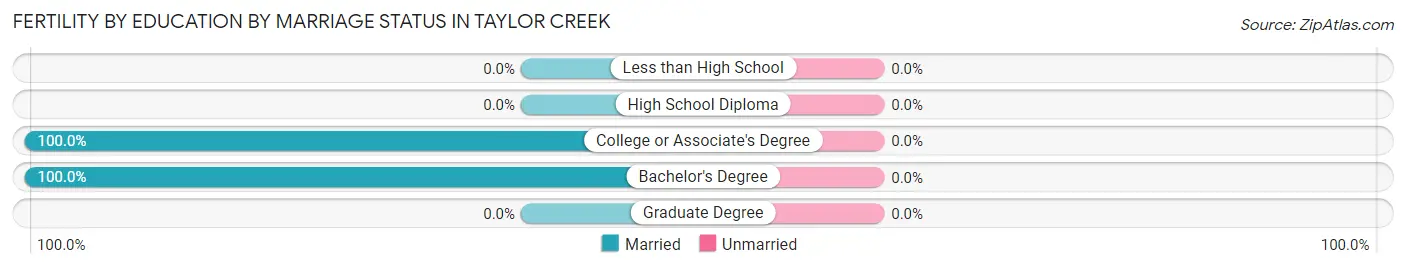
Fertility by Education by Marriage Status in Taylor Creek
| Educational Attainment | Married | Unmarried |
| Less than High School | 0 (0.0%) | 0 (0.0%) |
| High School Diploma | 0 (0.0%) | 0 (0.0%) |
| College or Associate's Degree | 25 (100.0%) | 0 (0.0%) |
| Bachelor's Degree | 10 (100.0%) | 0 (0.0%) |
| Graduate Degree | 0 (0.0%) | 0 (0.0%) |
| Total | 35 (100.0%) | 0 (0.0%) |
Income in Taylor Creek
Income Overview in Taylor Creek
Per Capita Income in Taylor Creek is $42,792, while median incomes of families and households are $110,228 and $92,174 respectively.
| Characteristic | Number | Measure |
| Per Capita Income | 3,986 | $42,792 |
| Median Family Income | 1,147 | $110,228 |
| Mean Family Income | 1,147 | $125,209 |
| Median Household Income | 1,480 | $92,174 |
| Mean Household Income | 1,480 | $112,392 |
| Income Deficit | 1,147 | $0 |
| Wage / Income Gap (%) | 3,986 | 31.46% |
| Wage / Income Gap ($) | 3,986 | 68.54¢ per $1 |
| Gini / Inequality Index | 3,986 | 0.35 |
Earnings by Sex in Taylor Creek
Average Earnings in Taylor Creek are $46,240, $56,143 for men and $38,478 for women, a difference of 31.5%.
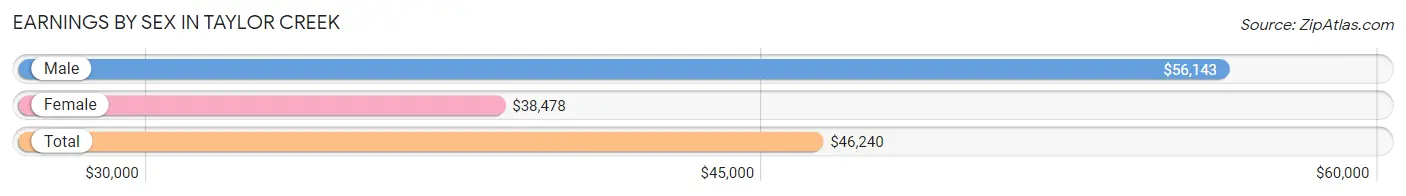
| Sex | Number | Average Earnings |
| Male | 1,200 (52.5%) | $56,143 |
| Female | 1,086 (47.5%) | $38,478 |
| Total | 2,286 (100.0%) | $46,240 |
Earnings by Sex by Income Bracket in Taylor Creek
The most common earnings brackets in Taylor Creek are $75,000 to $99,999 for men (226 | 18.8%) and $100,000+ for women (119 | 11.0%).
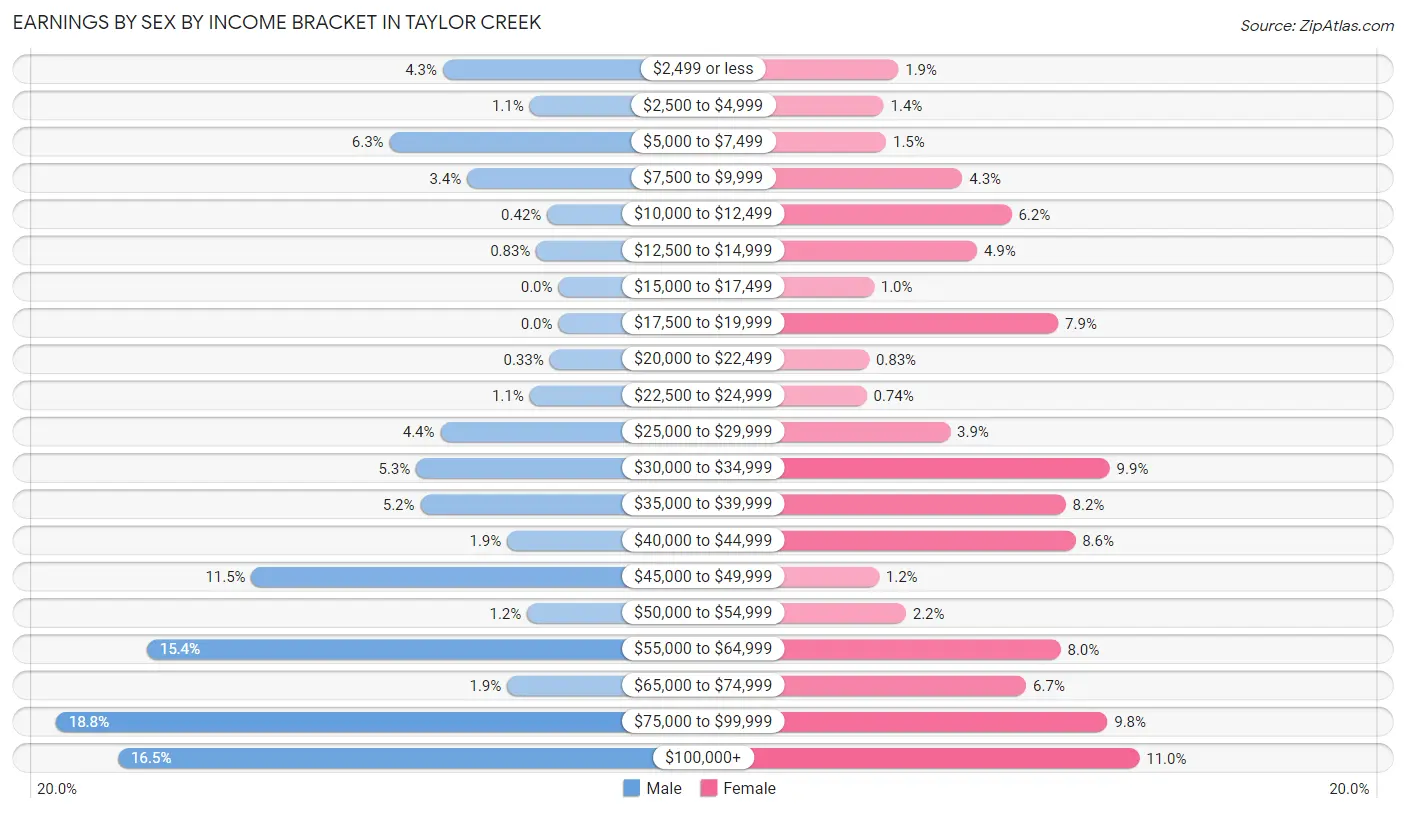
| Income | Male | Female |
| $2,499 or less | 52 (4.3%) | 21 (1.9%) |
| $2,500 to $4,999 | 13 (1.1%) | 15 (1.4%) |
| $5,000 to $7,499 | 76 (6.3%) | 16 (1.5%) |
| $7,500 to $9,999 | 41 (3.4%) | 47 (4.3%) |
| $10,000 to $12,499 | 5 (0.4%) | 67 (6.2%) |
| $12,500 to $14,999 | 10 (0.8%) | 53 (4.9%) |
| $15,000 to $17,499 | 0 (0.0%) | 11 (1.0%) |
| $17,500 to $19,999 | 0 (0.0%) | 86 (7.9%) |
| $20,000 to $22,499 | 4 (0.3%) | 9 (0.8%) |
| $22,500 to $24,999 | 13 (1.1%) | 8 (0.7%) |
| $25,000 to $29,999 | 53 (4.4%) | 42 (3.9%) |
| $30,000 to $34,999 | 64 (5.3%) | 107 (9.9%) |
| $35,000 to $39,999 | 62 (5.2%) | 89 (8.2%) |
| $40,000 to $44,999 | 23 (1.9%) | 93 (8.6%) |
| $45,000 to $49,999 | 138 (11.5%) | 13 (1.2%) |
| $50,000 to $54,999 | 14 (1.2%) | 24 (2.2%) |
| $55,000 to $64,999 | 185 (15.4%) | 87 (8.0%) |
| $65,000 to $74,999 | 23 (1.9%) | 73 (6.7%) |
| $75,000 to $99,999 | 226 (18.8%) | 106 (9.8%) |
| $100,000+ | 198 (16.5%) | 119 (11.0%) |
| Total | 1,200 (100.0%) | 1,086 (100.0%) |
Earnings by Sex by Educational Attainment in Taylor Creek
Average earnings in Taylor Creek are $60,263 for men and $39,837 for women, a difference of 33.9%. Men with an educational attainment of graduate degree enjoy the highest average annual earnings of $140,694, while those with high school diploma education earn the least with $46,752. Women with an educational attainment of bachelor's degree earn the most with the average annual earnings of $95,809, while those with less than high school education have the smallest earnings of $25,000.
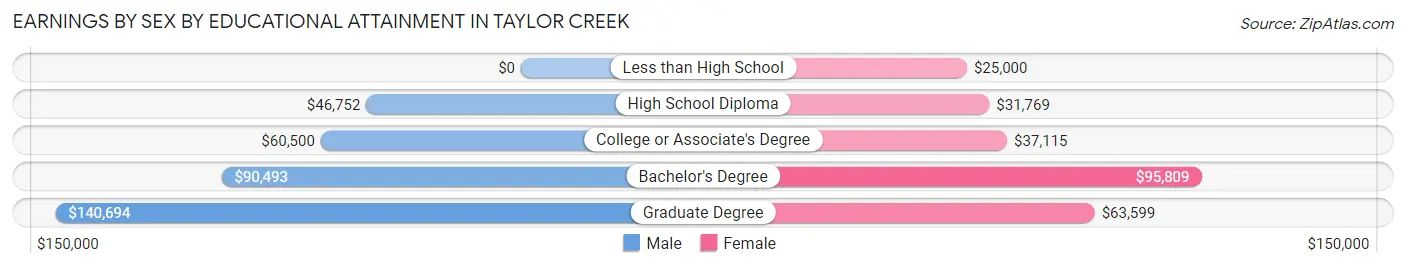
| Educational Attainment | Male Income | Female Income |
| Less than High School | - | - |
| High School Diploma | $46,752 | $31,769 |
| College or Associate's Degree | $60,500 | $37,115 |
| Bachelor's Degree | $90,493 | $95,809 |
| Graduate Degree | $140,694 | $63,599 |
| Total | $60,263 | $39,837 |
Family Income in Taylor Creek
Family Income Brackets in Taylor Creek
According to the Taylor Creek family income data, there are 295 families falling into the $100,000 to $149,999 income range, which is the most common income bracket and makes up 25.7% of all families.
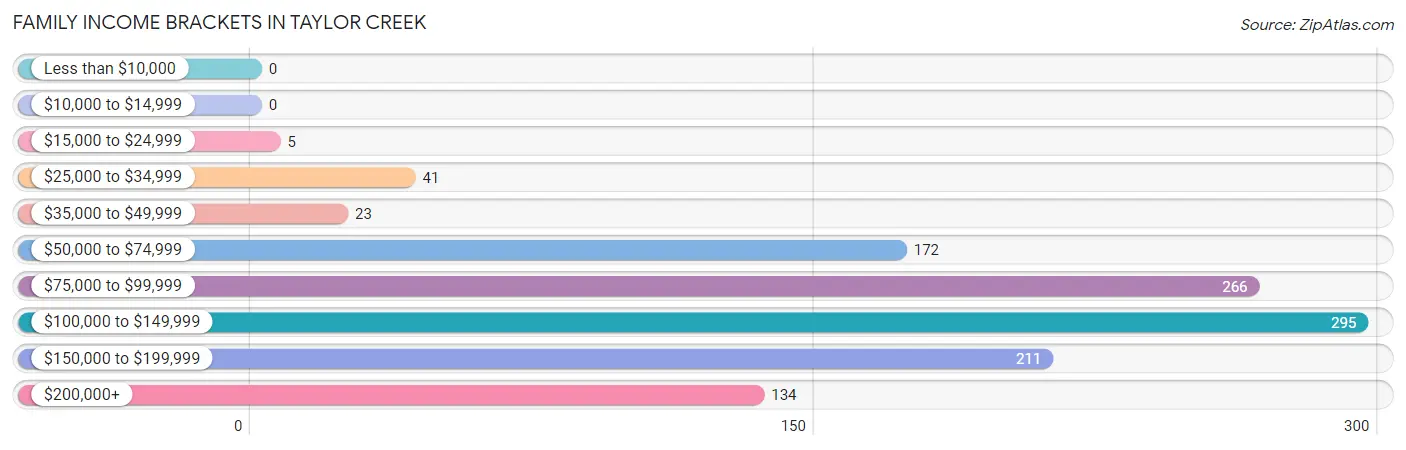
| Income Bracket | # Families | % Families |
| Less than $10,000 | 0 | 0.0% |
| $10,000 to $14,999 | 0 | 0.0% |
| $15,000 to $24,999 | 5 | 0.4% |
| $25,000 to $34,999 | 41 | 3.6% |
| $35,000 to $49,999 | 23 | 2.0% |
| $50,000 to $74,999 | 172 | 15.0% |
| $75,000 to $99,999 | 266 | 23.2% |
| $100,000 to $149,999 | 295 | 25.7% |
| $150,000 to $199,999 | 211 | 18.4% |
| $200,000+ | 134 | 11.7% |
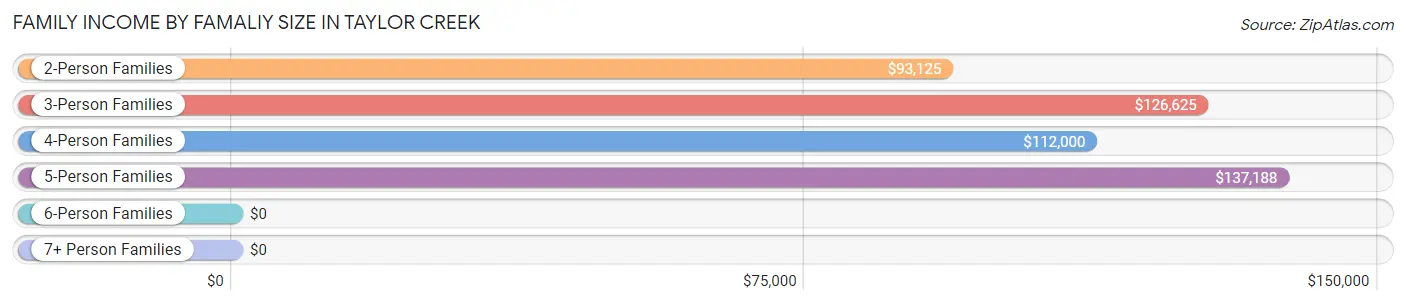
Family Income by Famaliy Size in Taylor Creek
5-person families (60 | 5.2%) account for the highest median family income in Taylor Creek with $137,188 per family, while 2-person families (488 | 42.5%) have the highest median income of $46,562 per family member.
| Income Bracket | # Families | Median Income |
| 2-Person Families | 488 (42.5%) | $93,125 |
| 3-Person Families | 221 (19.3%) | $126,625 |
| 4-Person Families | 354 (30.9%) | $112,000 |
| 5-Person Families | 60 (5.2%) | $137,188 |
| 6-Person Families | 22 (1.9%) | $0 |
| 7+ Person Families | 2 (0.2%) | $0 |
| Total | 1,147 (100.0%) | $110,228 |
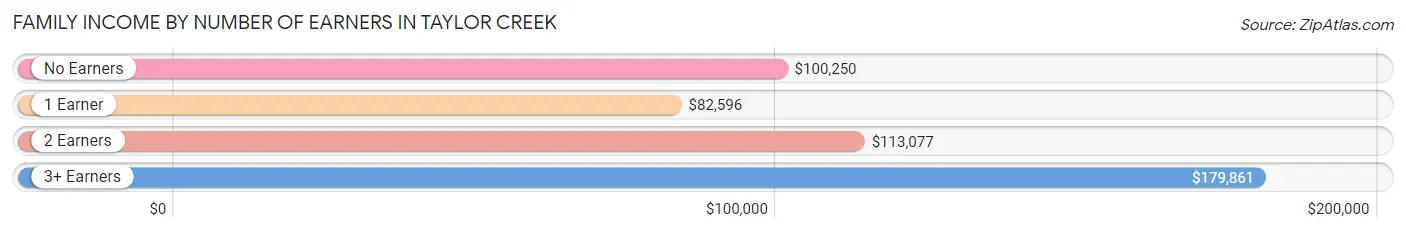
Family Income by Number of Earners in Taylor Creek
The median family income in Taylor Creek is $110,228, with families comprising 3+ earners (179) having the highest median family income of $179,861, while families with 1 earner (335) have the lowest median family income of $82,596, accounting for 15.6% and 29.2% of families, respectively.
| Number of Earners | # Families | Median Income |
| No Earners | 135 (11.8%) | $100,250 |
| 1 Earner | 335 (29.2%) | $82,596 |
| 2 Earners | 498 (43.4%) | $113,077 |
| 3+ Earners | 179 (15.6%) | $179,861 |
| Total | 1,147 (100.0%) | $110,228 |
Household Income in Taylor Creek
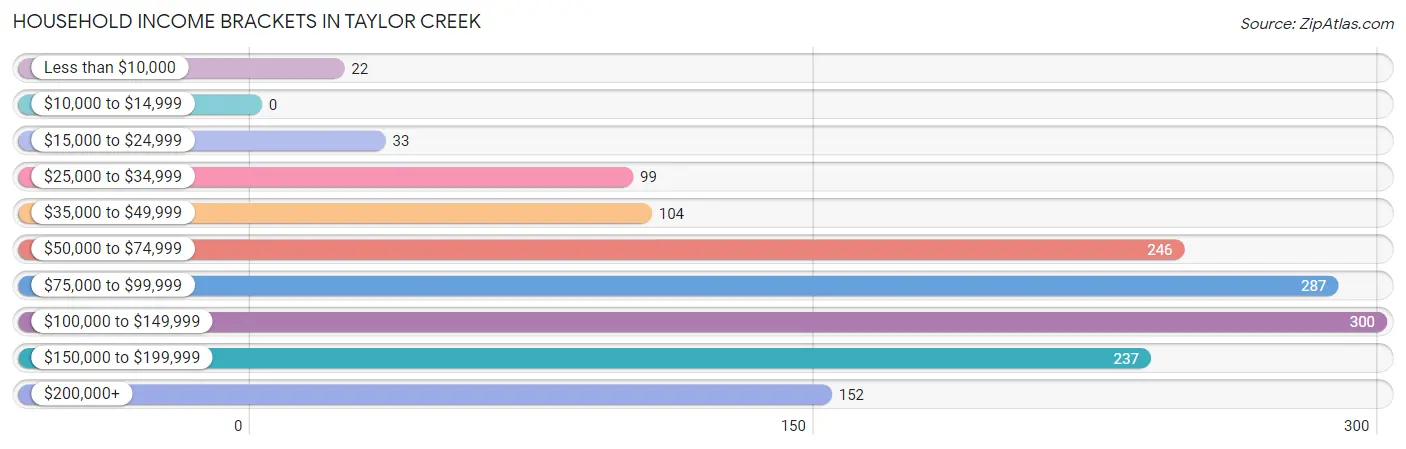
Household Income Brackets in Taylor Creek
With 300 households falling in the category, the $100,000 to $149,999 income range is the most frequent in Taylor Creek, accounting for 20.3% of all households.
| Income Bracket | # Households | % Households |
| Less than $10,000 | 22 | 1.5% |
| $10,000 to $14,999 | 0 | 0.0% |
| $15,000 to $24,999 | 33 | 2.2% |
| $25,000 to $34,999 | 99 | 6.7% |
| $35,000 to $49,999 | 104 | 7.0% |
| $50,000 to $74,999 | 246 | 16.6% |
| $75,000 to $99,999 | 287 | 19.4% |
| $100,000 to $149,999 | 300 | 20.3% |
| $150,000 to $199,999 | 237 | 16.0% |
| $200,000+ | 152 | 10.3% |
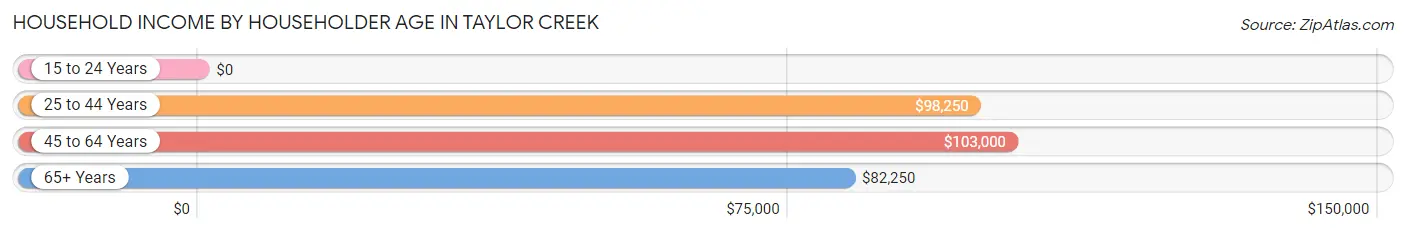
Household Income by Householder Age in Taylor Creek
The median household income in Taylor Creek is $92,174, with the highest median household income of $103,000 found in the 45 to 64 years age bracket for the primary householder. A total of 464 households (31.4%) fall into this category.
| Income Bracket | # Households | Median Income |
| 15 to 24 Years | 0 (0.0%) | $0 |
| 25 to 44 Years | 538 (36.3%) | $98,250 |
| 45 to 64 Years | 464 (31.4%) | $103,000 |
| 65+ Years | 478 (32.3%) | $82,250 |
| Total | 1,480 (100.0%) | $92,174 |
Poverty in Taylor Creek
Income Below Poverty by Sex and Age in Taylor Creek
With 2.2% poverty level for males and 2.9% for females among the residents of Taylor Creek, 6 to 11 year old males and 45 to 54 year old females are the most vulnerable to poverty, with 11 males (8.9%) and 11 females (5.9%) in their respective age groups living below the poverty level.
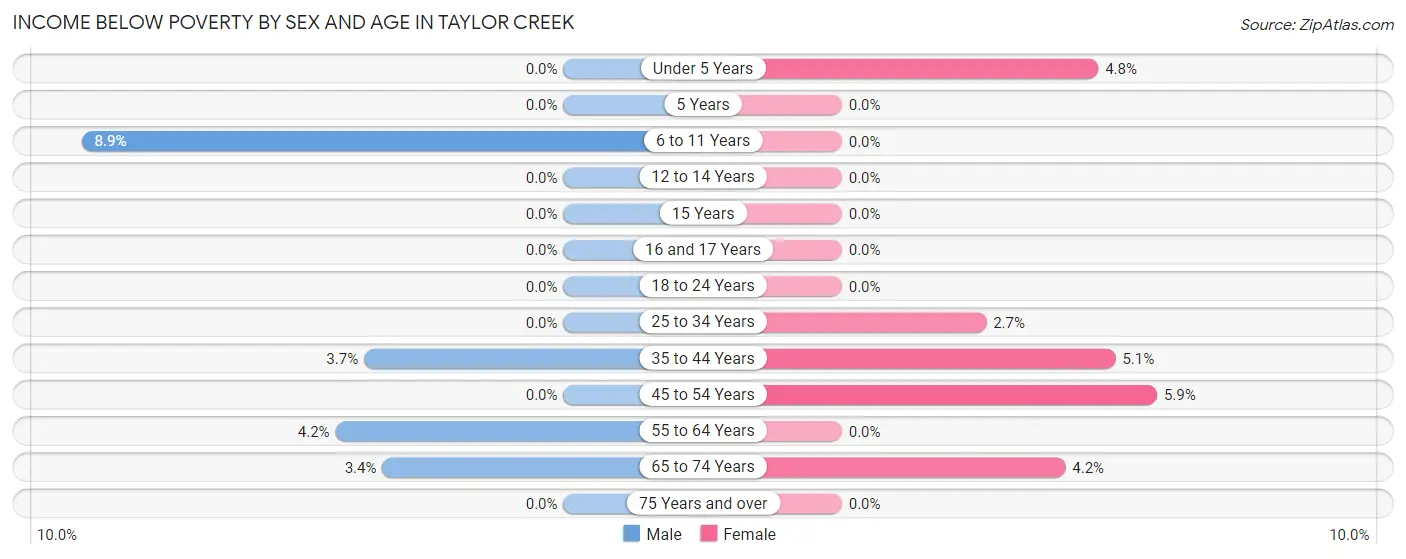
| Age Bracket | Male | Female |
| Under 5 Years | 0 (0.0%) | 11 (4.8%) |
| 5 Years | 0 (0.0%) | 0 (0.0%) |
| 6 to 11 Years | 11 (8.9%) | 0 (0.0%) |
| 12 to 14 Years | 0 (0.0%) | 0 (0.0%) |
| 15 Years | 0 (0.0%) | 0 (0.0%) |
| 16 and 17 Years | 0 (0.0%) | 0 (0.0%) |
| 18 to 24 Years | 0 (0.0%) | 0 (0.0%) |
| 25 to 34 Years | 0 (0.0%) | 11 (2.7%) |
| 35 to 44 Years | 10 (3.7%) | 12 (5.1%) |
| 45 to 54 Years | 0 (0.0%) | 11 (5.9%) |
| 55 to 64 Years | 13 (4.2%) | 0 (0.0%) |
| 65 to 74 Years | 10 (3.4%) | 12 (4.2%) |
| 75 Years and over | 0 (0.0%) | 0 (0.0%) |
| Total | 44 (2.2%) | 57 (2.9%) |
Income Above Poverty by Sex and Age in Taylor Creek
According to the poverty statistics in Taylor Creek, males aged under 5 years and females aged 6 to 11 years are the age groups that are most secure financially, with 100.0% of males and 100.0% of females in these age groups living above the poverty line.
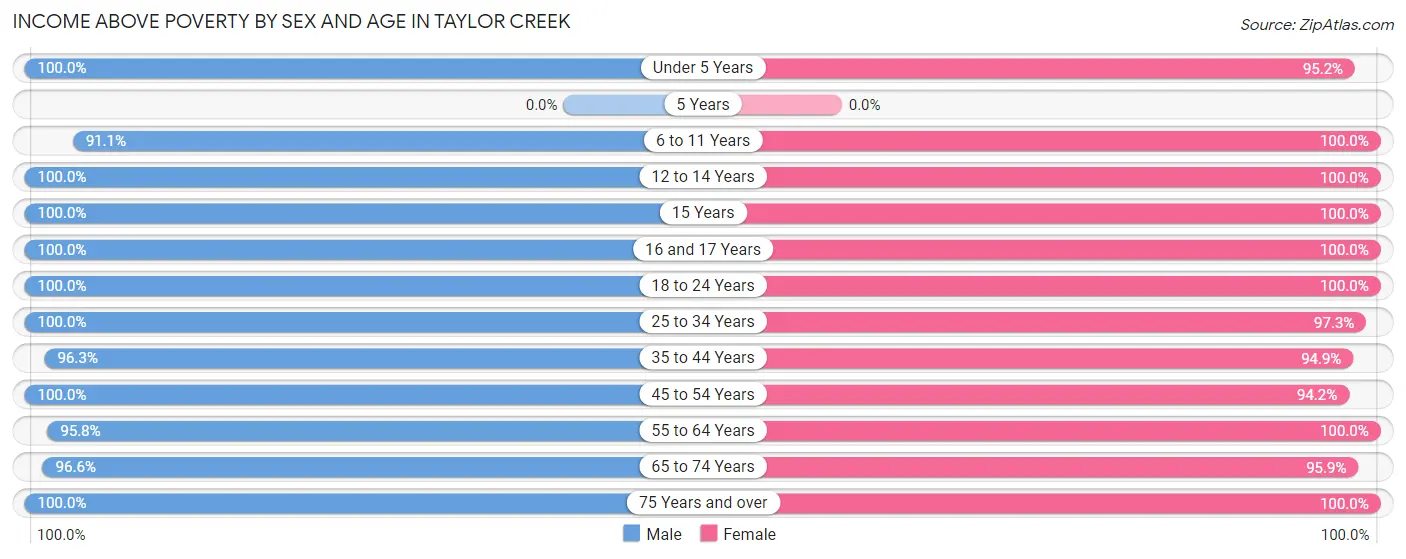
| Age Bracket | Male | Female |
| Under 5 Years | 114 (100.0%) | 220 (95.2%) |
| 5 Years | 0 (0.0%) | 0 (0.0%) |
| 6 to 11 Years | 112 (91.1%) | 149 (100.0%) |
| 12 to 14 Years | 105 (100.0%) | 54 (100.0%) |
| 15 Years | 10 (100.0%) | 36 (100.0%) |
| 16 and 17 Years | 85 (100.0%) | 1 (100.0%) |
| 18 to 24 Years | 119 (100.0%) | 62 (100.0%) |
| 25 to 34 Years | 239 (100.0%) | 399 (97.3%) |
| 35 to 44 Years | 260 (96.3%) | 224 (94.9%) |
| 45 to 54 Years | 205 (100.0%) | 177 (94.2%) |
| 55 to 64 Years | 294 (95.8%) | 307 (100.0%) |
| 65 to 74 Years | 288 (96.6%) | 277 (95.9%) |
| 75 Years and over | 88 (100.0%) | 30 (100.0%) |
| Total | 1,919 (97.8%) | 1,936 (97.1%) |
Income Below Poverty Among Married-Couple Families in Taylor Creek
The poverty statistics for married-couple families in Taylor Creek show that 1.0% or 10 of the total 986 families live below the poverty line. Families with 1 or 2 children have the highest poverty rate of 2.3%, comprising of 10 families. On the other hand, families with no children have the lowest poverty rate of 0.0%, which includes 0 families.
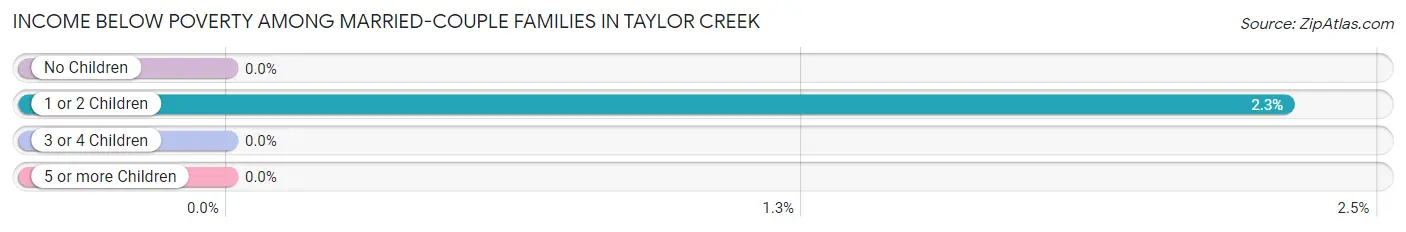
| Children | Above Poverty | Below Poverty |
| No Children | 501 (100.0%) | 0 (0.0%) |
| 1 or 2 Children | 425 (97.7%) | 10 (2.3%) |
| 3 or 4 Children | 48 (100.0%) | 0 (0.0%) |
| 5 or more Children | 2 (100.0%) | 0 (0.0%) |
| Total | 976 (99.0%) | 10 (1.0%) |
Income Below Poverty Among Single-Parent Households in Taylor Creek
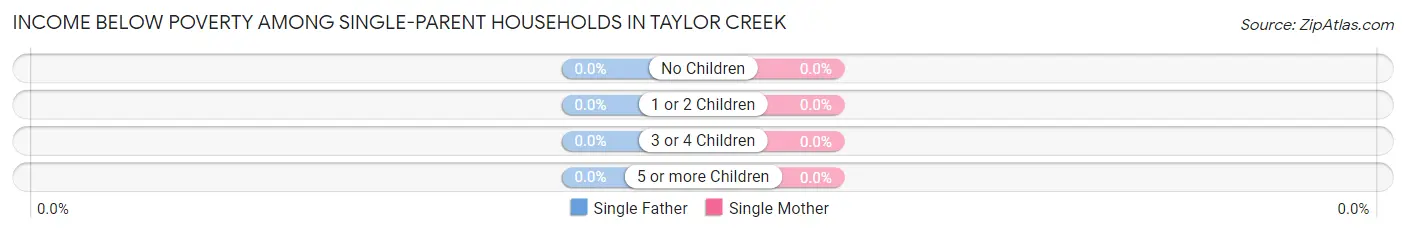
| Children | Single Father | Single Mother |
| No Children | 0 (0.0%) | 0 (0.0%) |
| 1 or 2 Children | 0 (0.0%) | 0 (0.0%) |
| 3 or 4 Children | 0 (0.0%) | 0 (0.0%) |
| 5 or more Children | 0 (0.0%) | 0 (0.0%) |
| Total | 0 (0.0%) | 0 (0.0%) |
Income Below Poverty Among Married-Couple vs Single-Parent Households in Taylor Creek
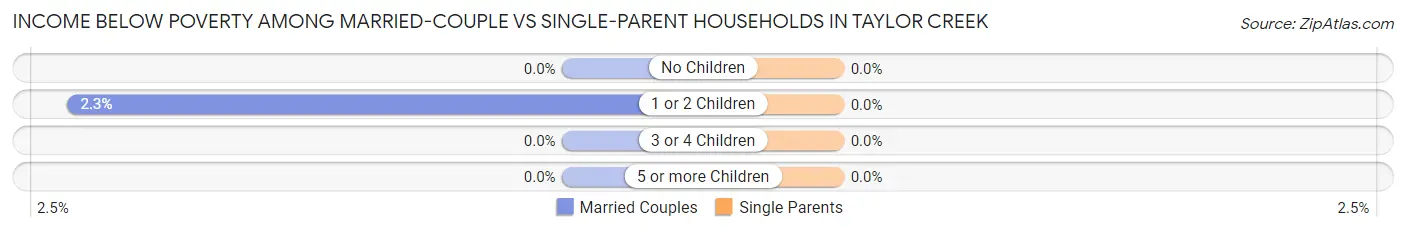
| Children | Married-Couple Families | Single-Parent Households |
| No Children | 0 (0.0%) | 0 (0.0%) |
| 1 or 2 Children | 10 (2.3%) | 0 (0.0%) |
| 3 or 4 Children | 0 (0.0%) | 0 (0.0%) |
| 5 or more Children | 0 (0.0%) | 0 (0.0%) |
| Total | 10 (1.0%) | 0 (0.0%) |
Employment Characteristics in Taylor Creek
Employment by Class of Employer in Taylor Creek
Among the 2,060 employed individuals in Taylor Creek, private company employees (1,556 | 75.5%), not-for-profit organizations (167 | 8.1%), and local government employees (125 | 6.1%) make up the most common classes of employment.
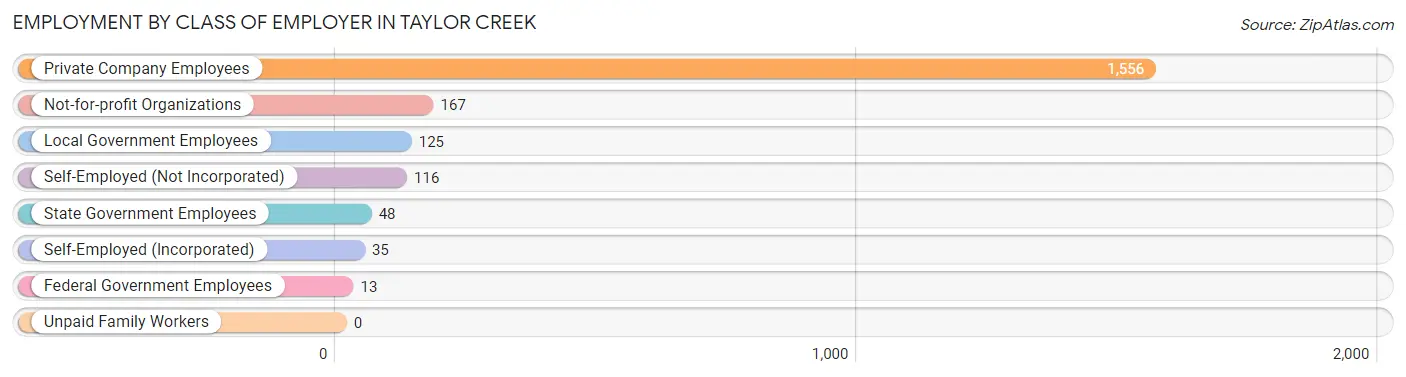
| Employer Class | # Employees | % Employees |
| Private Company Employees | 1,556 | 75.5% |
| Self-Employed (Incorporated) | 35 | 1.7% |
| Self-Employed (Not Incorporated) | 116 | 5.6% |
| Not-for-profit Organizations | 167 | 8.1% |
| Local Government Employees | 125 | 6.1% |
| State Government Employees | 48 | 2.3% |
| Federal Government Employees | 13 | 0.6% |
| Unpaid Family Workers | 0 | 0.0% |
| Total | 2,060 | 100.0% |
Employment Status by Age in Taylor Creek
According to the labor force statistics for Taylor Creek, out of the total population over 16 years of age (3,134), 70.6% or 2,213 individuals are in the labor force, with 1.5% or 33 of them unemployed. The age group with the highest labor force participation rate is 25 to 29 years, with 100.0% or 205 individuals in the labor force. Within the labor force, the 16 to 19 years age range has the highest percentage of unemployed individuals, with 9.2% or 12 of them being unemployed.
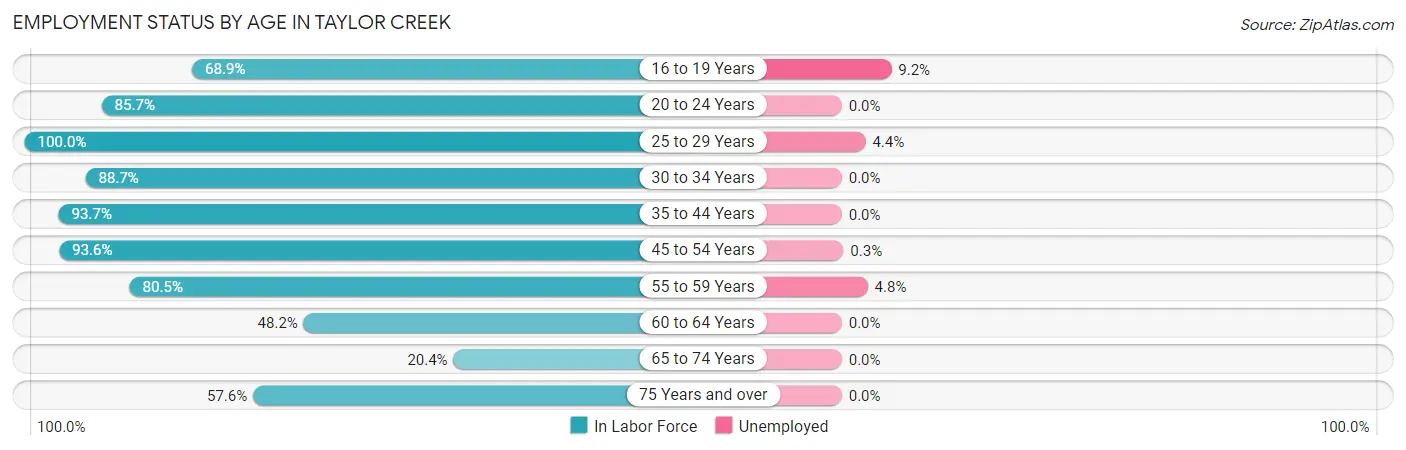
| Age Bracket | In Labor Force | Unemployed |
| 16 to 19 Years | 131 (68.9%) | 12 (9.2%) |
| 20 to 24 Years | 66 (85.7%) | 0 (0.0%) |
| 25 to 29 Years | 205 (100.0%) | 9 (4.4%) |
| 30 to 34 Years | 394 (88.7%) | 0 (0.0%) |
| 35 to 44 Years | 474 (93.7%) | 0 (0.0%) |
| 45 to 54 Years | 368 (93.6%) | 1 (0.3%) |
| 55 to 59 Years | 227 (80.5%) | 11 (4.8%) |
| 60 to 64 Years | 160 (48.2%) | 0 (0.0%) |
| 65 to 74 Years | 120 (20.4%) | 0 (0.0%) |
| 75 Years and over | 68 (57.6%) | 0 (0.0%) |
| Total | 2,213 (70.6%) | 33 (1.5%) |
Employment Status by Educational Attainment in Taylor Creek
According to labor force statistics for Taylor Creek, 84.6% of individuals (1,829) out of the total population between 25 and 64 years of age (2,162) are in the labor force, with 1.1% or 20 of them being unemployed. The group with the highest labor force participation rate are those with the educational attainment of college / associate degree, with 87.6% or 502 individuals in the labor force. Within the labor force, individuals with less than high school education have the highest percentage of unemployment, with 4.0% or 1 of them being unemployed.
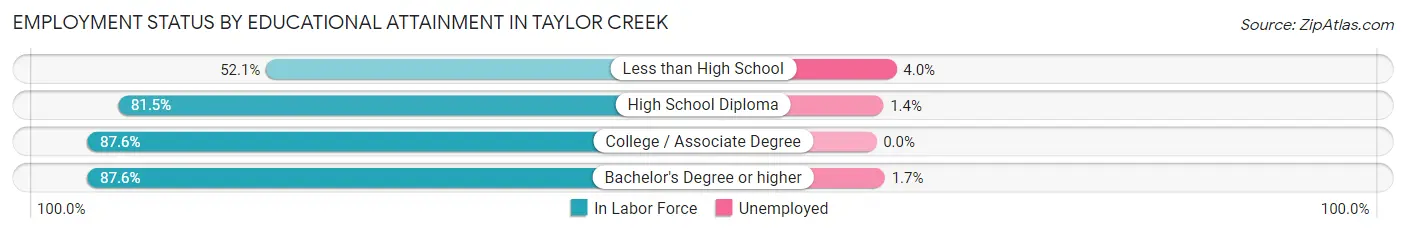
| Educational Attainment | In Labor Force | Unemployed |
| Less than High School | 25 (52.1%) | 2 (4.0%) |
| High School Diploma | 646 (81.5%) | 11 (1.4%) |
| College / Associate Degree | 502 (87.6%) | 0 (0.0%) |
| Bachelor's Degree or higher | 655 (87.6%) | 13 (1.7%) |
| Total | 1,829 (84.6%) | 24 (1.1%) |
Employment Occupations by Sex in Taylor Creek
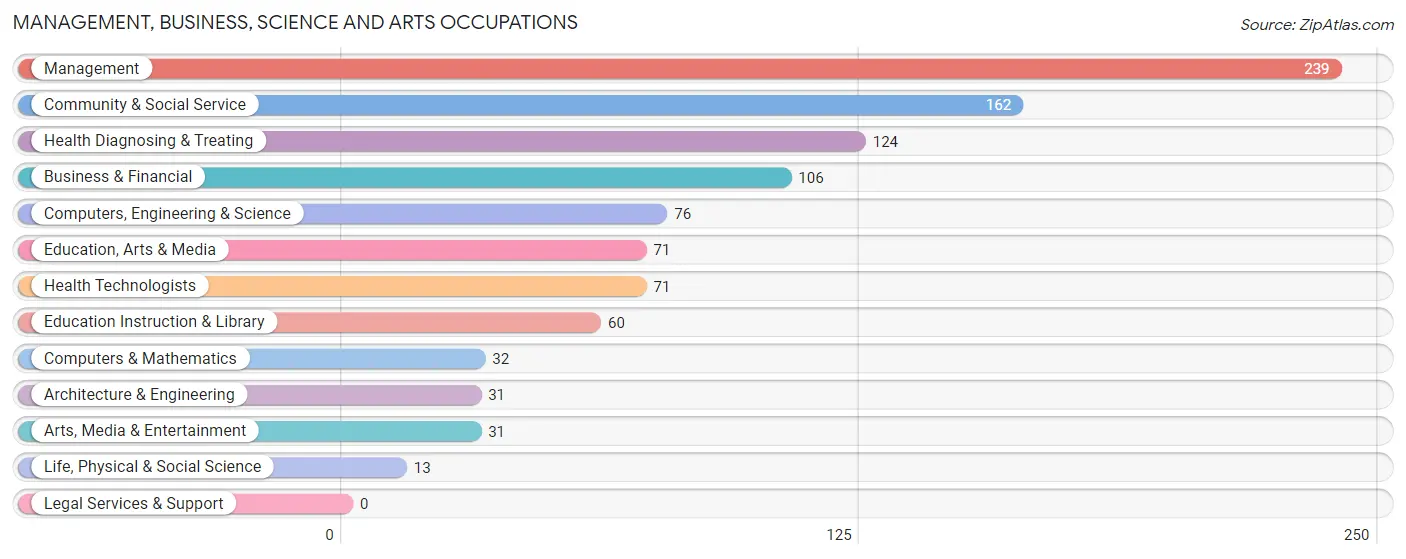
Management, Business, Science and Arts Occupations
The most common Management, Business, Science and Arts occupations in Taylor Creek are Management (239 | 11.0%), Community & Social Service (162 | 7.4%), Health Diagnosing & Treating (124 | 5.7%), Business & Financial (106 | 4.9%), and Computers, Engineering & Science (76 | 3.5%).
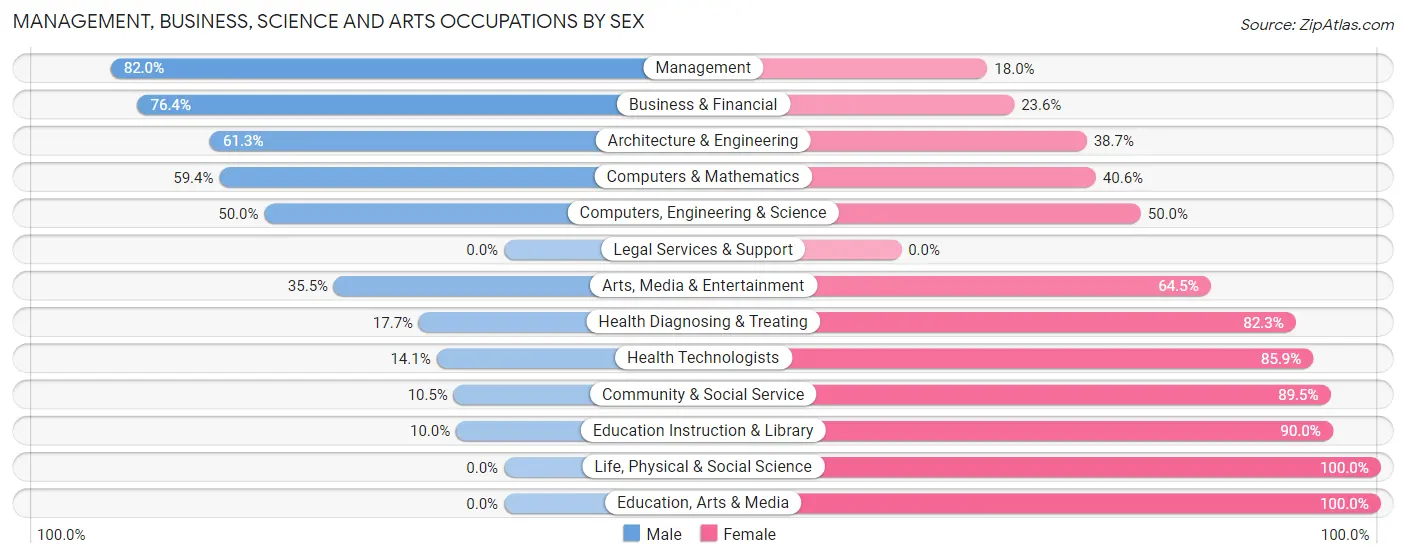
Management, Business, Science and Arts Occupations by Sex
Within the Management, Business, Science and Arts occupations in Taylor Creek, the most male-oriented occupations are Management (82.0%), Business & Financial (76.4%), and Architecture & Engineering (61.3%), while the most female-oriented occupations are Life, Physical & Social Science (100.0%), Education, Arts & Media (100.0%), and Education Instruction & Library (90.0%).
| Occupation | Male | Female |
| Management | 196 (82.0%) | 43 (18.0%) |
| Business & Financial | 81 (76.4%) | 25 (23.6%) |
| Computers, Engineering & Science | 38 (50.0%) | 38 (50.0%) |
| Computers & Mathematics | 19 (59.4%) | 13 (40.6%) |
| Architecture & Engineering | 19 (61.3%) | 12 (38.7%) |
| Life, Physical & Social Science | 0 (0.0%) | 13 (100.0%) |
| Community & Social Service | 17 (10.5%) | 145 (89.5%) |
| Education, Arts & Media | 0 (0.0%) | 71 (100.0%) |
| Legal Services & Support | 0 (0.0%) | 0 (0.0%) |
| Education Instruction & Library | 6 (10.0%) | 54 (90.0%) |
| Arts, Media & Entertainment | 11 (35.5%) | 20 (64.5%) |
| Health Diagnosing & Treating | 22 (17.7%) | 102 (82.3%) |
| Health Technologists | 10 (14.1%) | 61 (85.9%) |
| Total (Category) | 354 (50.1%) | 353 (49.9%) |
| Total (Overall) | 1,122 (51.5%) | 1,058 (48.5%) |
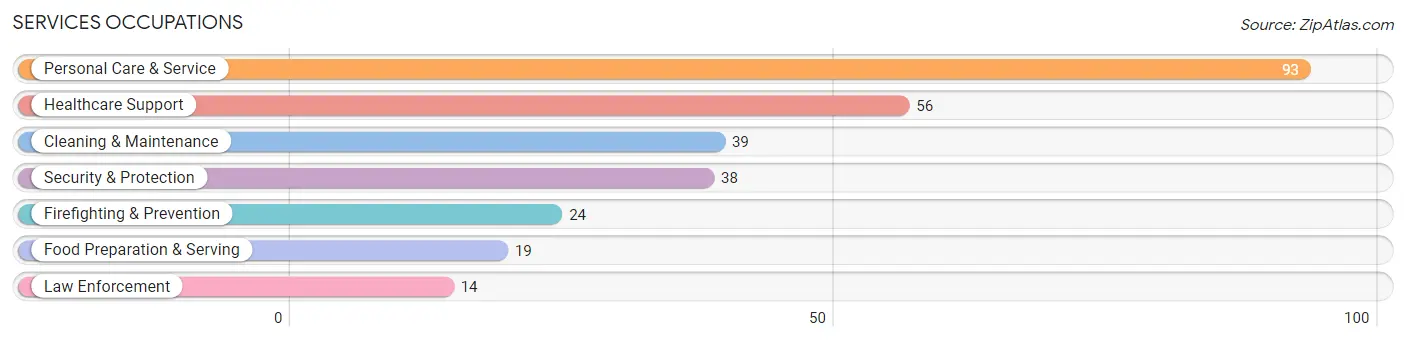
Services Occupations
The most common Services occupations in Taylor Creek are Personal Care & Service (93 | 4.3%), Healthcare Support (56 | 2.6%), Cleaning & Maintenance (39 | 1.8%), Security & Protection (38 | 1.7%), and Firefighting & Prevention (24 | 1.1%).
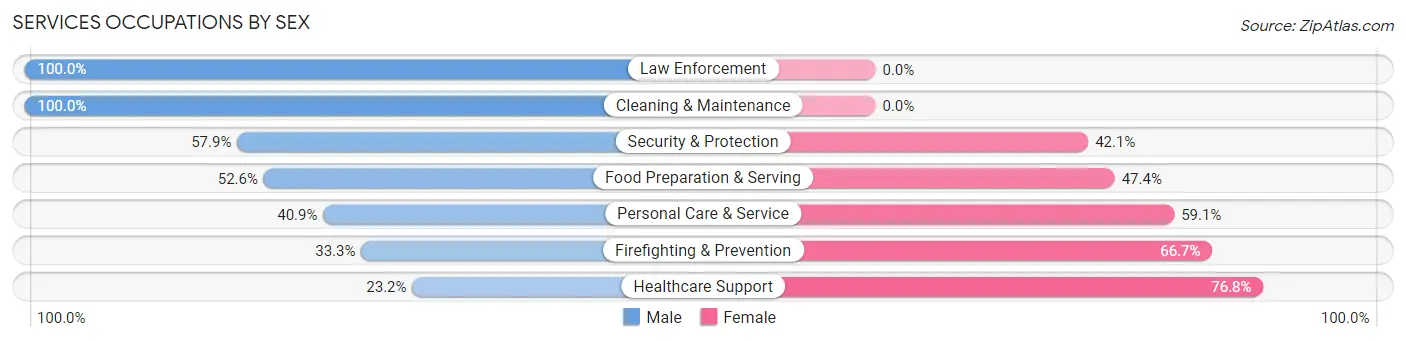
Services Occupations by Sex
Within the Services occupations in Taylor Creek, the most male-oriented occupations are Law Enforcement (100.0%), Cleaning & Maintenance (100.0%), and Security & Protection (57.9%), while the most female-oriented occupations are Healthcare Support (76.8%), Firefighting & Prevention (66.7%), and Personal Care & Service (59.1%).
| Occupation | Male | Female |
| Healthcare Support | 13 (23.2%) | 43 (76.8%) |
| Security & Protection | 22 (57.9%) | 16 (42.1%) |
| Firefighting & Prevention | 8 (33.3%) | 16 (66.7%) |
| Law Enforcement | 14 (100.0%) | 0 (0.0%) |
| Food Preparation & Serving | 10 (52.6%) | 9 (47.4%) |
| Cleaning & Maintenance | 39 (100.0%) | 0 (0.0%) |
| Personal Care & Service | 38 (40.9%) | 55 (59.1%) |
| Total (Category) | 122 (49.8%) | 123 (50.2%) |
| Total (Overall) | 1,122 (51.5%) | 1,058 (48.5%) |
Sales and Office Occupations
The most common Sales and Office occupations in Taylor Creek are Sales & Related (318 | 14.6%), and Office & Administration (247 | 11.3%).
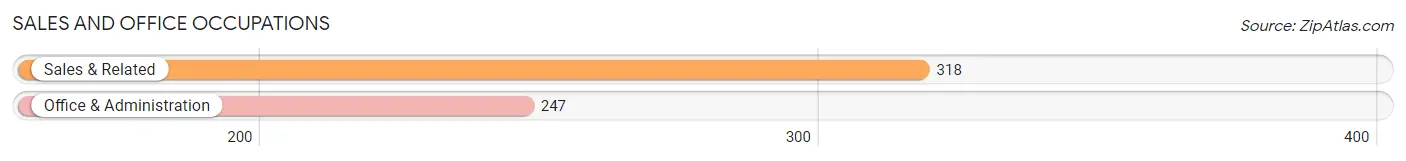
Sales and Office Occupations by Sex

| Occupation | Male | Female |
| Sales & Related | 219 (68.9%) | 99 (31.1%) |
| Office & Administration | 46 (18.6%) | 201 (81.4%) |
| Total (Category) | 265 (46.9%) | 300 (53.1%) |
| Total (Overall) | 1,122 (51.5%) | 1,058 (48.5%) |
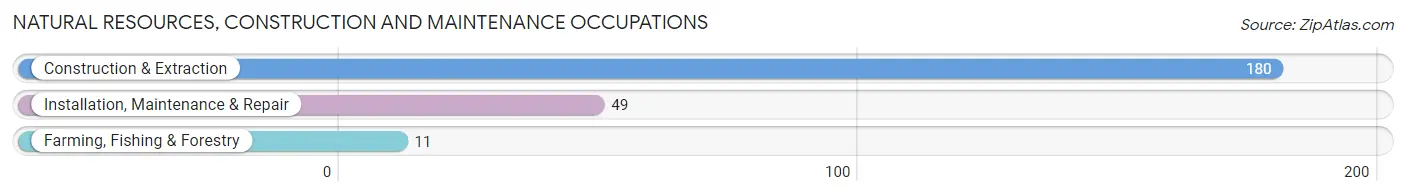
Natural Resources, Construction and Maintenance Occupations
The most common Natural Resources, Construction and Maintenance occupations in Taylor Creek are Construction & Extraction (180 | 8.3%), Installation, Maintenance & Repair (49 | 2.2%), and Farming, Fishing & Forestry (11 | 0.5%).
Natural Resources, Construction and Maintenance Occupations by Sex
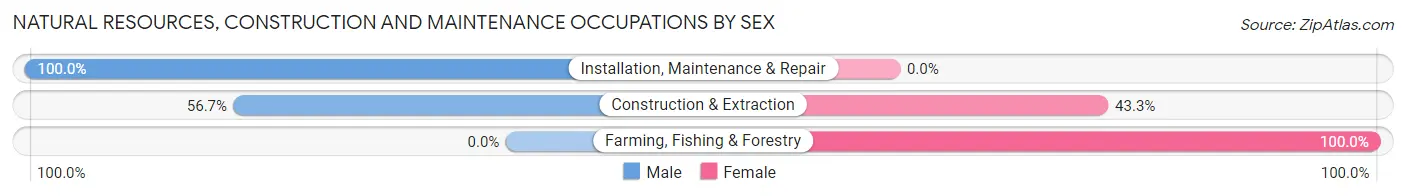
| Occupation | Male | Female |
| Farming, Fishing & Forestry | 0 (0.0%) | 11 (100.0%) |
| Construction & Extraction | 102 (56.7%) | 78 (43.3%) |
| Installation, Maintenance & Repair | 49 (100.0%) | 0 (0.0%) |
| Total (Category) | 151 (62.9%) | 89 (37.1%) |
| Total (Overall) | 1,122 (51.5%) | 1,058 (48.5%) |
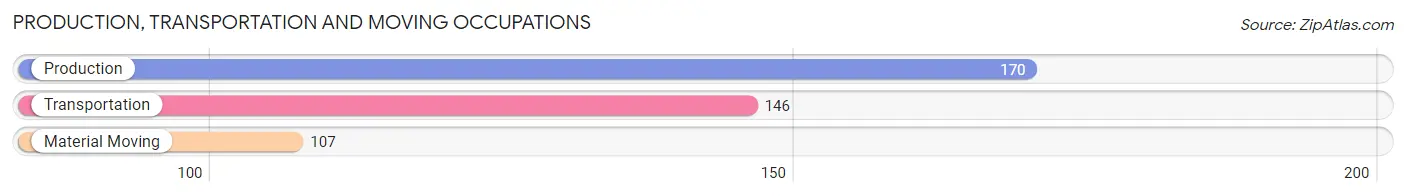
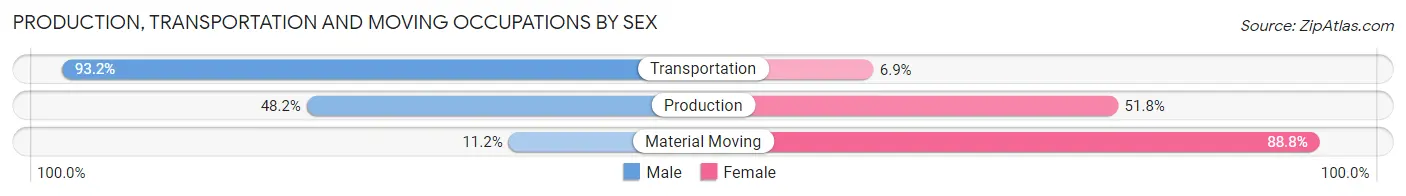
Production, Transportation and Moving Occupations
The most common Production, Transportation and Moving occupations in Taylor Creek are Production (170 | 7.8%), Transportation (146 | 6.7%), and Material Moving (107 | 4.9%).
Production, Transportation and Moving Occupations by Sex
| Occupation | Male | Female |
| Production | 82 (48.2%) | 88 (51.8%) |
| Transportation | 136 (93.1%) | 10 (6.9%) |
| Material Moving | 12 (11.2%) | 95 (88.8%) |
| Total (Category) | 230 (54.4%) | 193 (45.6%) |
| Total (Overall) | 1,122 (51.5%) | 1,058 (48.5%) |
Employment Industries by Sex in Taylor Creek
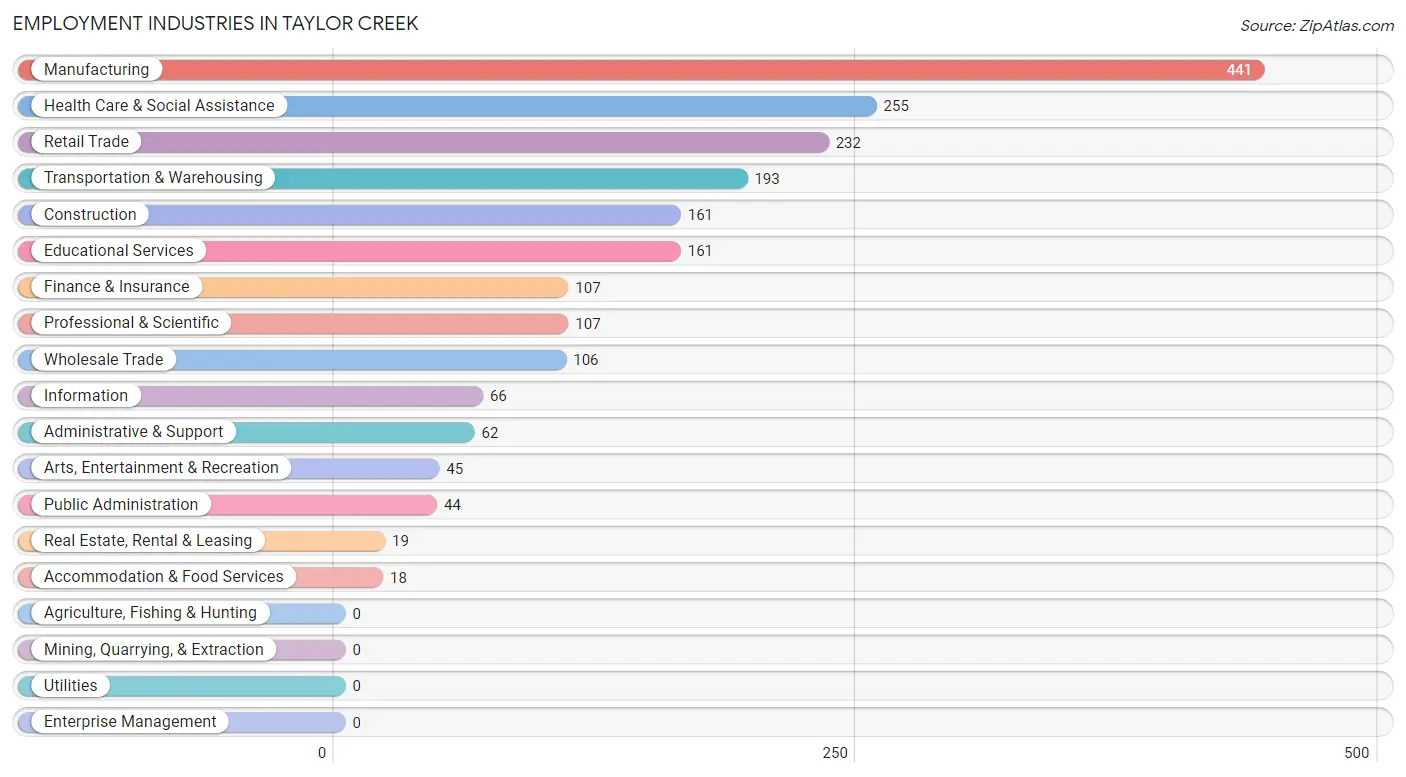
Employment Industries in Taylor Creek
The major employment industries in Taylor Creek include Manufacturing (441 | 20.2%), Health Care & Social Assistance (255 | 11.7%), Retail Trade (232 | 10.6%), Transportation & Warehousing (193 | 8.8%), and Construction (161 | 7.4%).
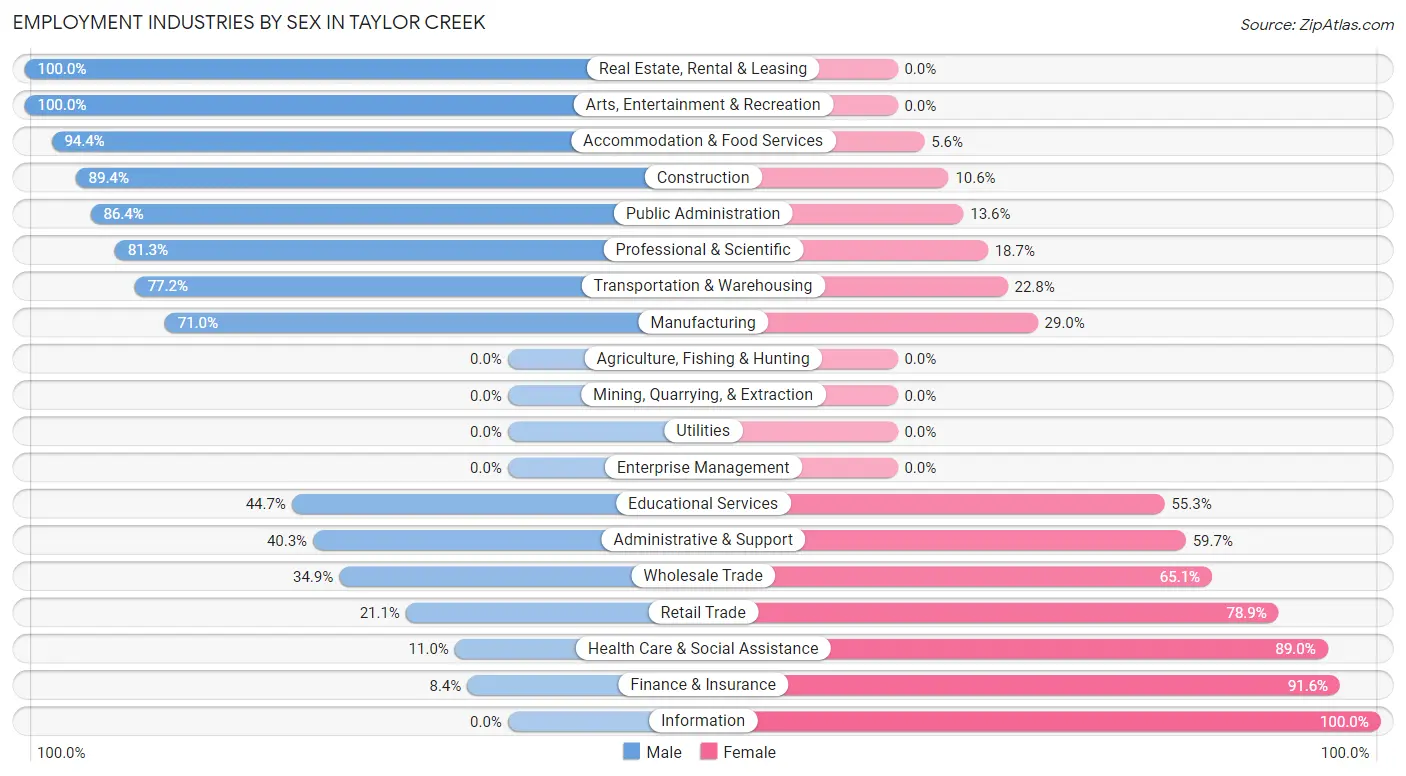
Employment Industries by Sex in Taylor Creek
The Taylor Creek industries that see more men than women are Real Estate, Rental & Leasing (100.0%), Arts, Entertainment & Recreation (100.0%), and Accommodation & Food Services (94.4%), whereas the industries that tend to have a higher number of women are Information (100.0%), Finance & Insurance (91.6%), and Health Care & Social Assistance (89.0%).
| Industry | Male | Female |
| Agriculture, Fishing & Hunting | 0 (0.0%) | 0 (0.0%) |
| Mining, Quarrying, & Extraction | 0 (0.0%) | 0 (0.0%) |
| Construction | 144 (89.4%) | 17 (10.6%) |
| Manufacturing | 313 (71.0%) | 128 (29.0%) |
| Wholesale Trade | 37 (34.9%) | 69 (65.1%) |
| Retail Trade | 49 (21.1%) | 183 (78.9%) |
| Transportation & Warehousing | 149 (77.2%) | 44 (22.8%) |
| Utilities | 0 (0.0%) | 0 (0.0%) |
| Information | 0 (0.0%) | 66 (100.0%) |
| Finance & Insurance | 9 (8.4%) | 98 (91.6%) |
| Real Estate, Rental & Leasing | 19 (100.0%) | 0 (0.0%) |
| Professional & Scientific | 87 (81.3%) | 20 (18.7%) |
| Enterprise Management | 0 (0.0%) | 0 (0.0%) |
| Administrative & Support | 25 (40.3%) | 37 (59.7%) |
| Educational Services | 72 (44.7%) | 89 (55.3%) |
| Health Care & Social Assistance | 28 (11.0%) | 227 (89.0%) |
| Arts, Entertainment & Recreation | 45 (100.0%) | 0 (0.0%) |
| Accommodation & Food Services | 17 (94.4%) | 1 (5.6%) |
| Public Administration | 38 (86.4%) | 6 (13.6%) |
| Total | 1,122 (51.5%) | 1,058 (48.5%) |
Education in Taylor Creek
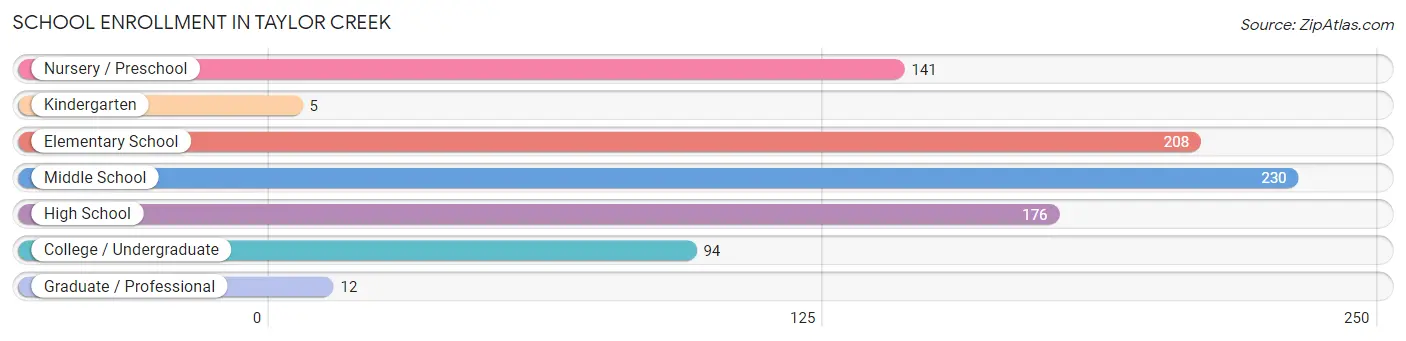
School Enrollment in Taylor Creek
The most common levels of schooling among the 866 students in Taylor Creek are middle school (230 | 26.6%), elementary school (208 | 24.0%), and high school (176 | 20.3%).
| School Level | # Students | % Students |
| Nursery / Preschool | 141 | 16.3% |
| Kindergarten | 5 | 0.6% |
| Elementary School | 208 | 24.0% |
| Middle School | 230 | 26.6% |
| High School | 176 | 20.3% |
| College / Undergraduate | 94 | 10.8% |
| Graduate / Professional | 12 | 1.4% |
| Total | 866 | 100.0% |
School Enrollment by Age by Funding Source in Taylor Creek
Out of a total of 866 students who are enrolled in schools in Taylor Creek, 384 (44.3%) attend a private institution, while the remaining 482 (55.7%) are enrolled in public schools. The age group of 3 to 4 year olds has the highest likelihood of being enrolled in private schools, with 114 (80.8% in the age bracket) enrolled. Conversely, the age group of 20 to 24 year olds has the lowest likelihood of being enrolled in a private school, with 8 (100.0% in the age bracket) attending a public institution.
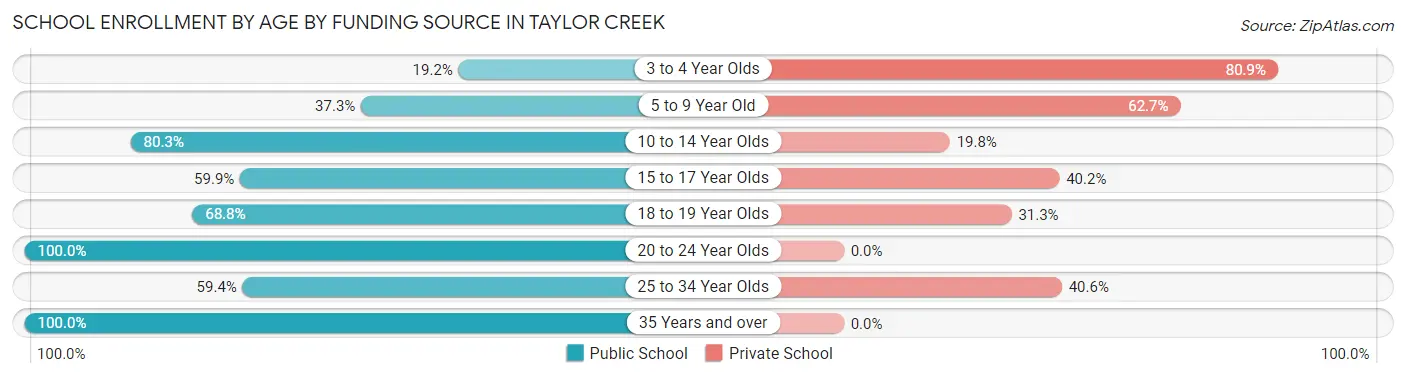
| Age Bracket | Public School | Private School |
| 3 to 4 Year Olds | 27 (19.2%) | 114 (80.8%) |
| 5 to 9 Year Old | 75 (37.3%) | 126 (62.7%) |
| 10 to 14 Year Olds | 195 (80.2%) | 48 (19.8%) |
| 15 to 17 Year Olds | 79 (59.9%) | 53 (40.2%) |
| 18 to 19 Year Olds | 66 (68.8%) | 30 (31.2%) |
| 20 to 24 Year Olds | 8 (100.0%) | 0 (0.0%) |
| 25 to 34 Year Olds | 19 (59.4%) | 13 (40.6%) |
| 35 Years and over | 13 (100.0%) | 0 (0.0%) |
| Total | 482 (55.7%) | 384 (44.3%) |
Educational Attainment by Field of Study in Taylor Creek
Business (286 | 30.9%), education (108 | 11.7%), engineering (101 | 10.9%), science & technology (95 | 10.3%), and arts & humanities (95 | 10.3%) are the most common fields of study among 924 individuals in Taylor Creek who have obtained a bachelor's degree or higher.
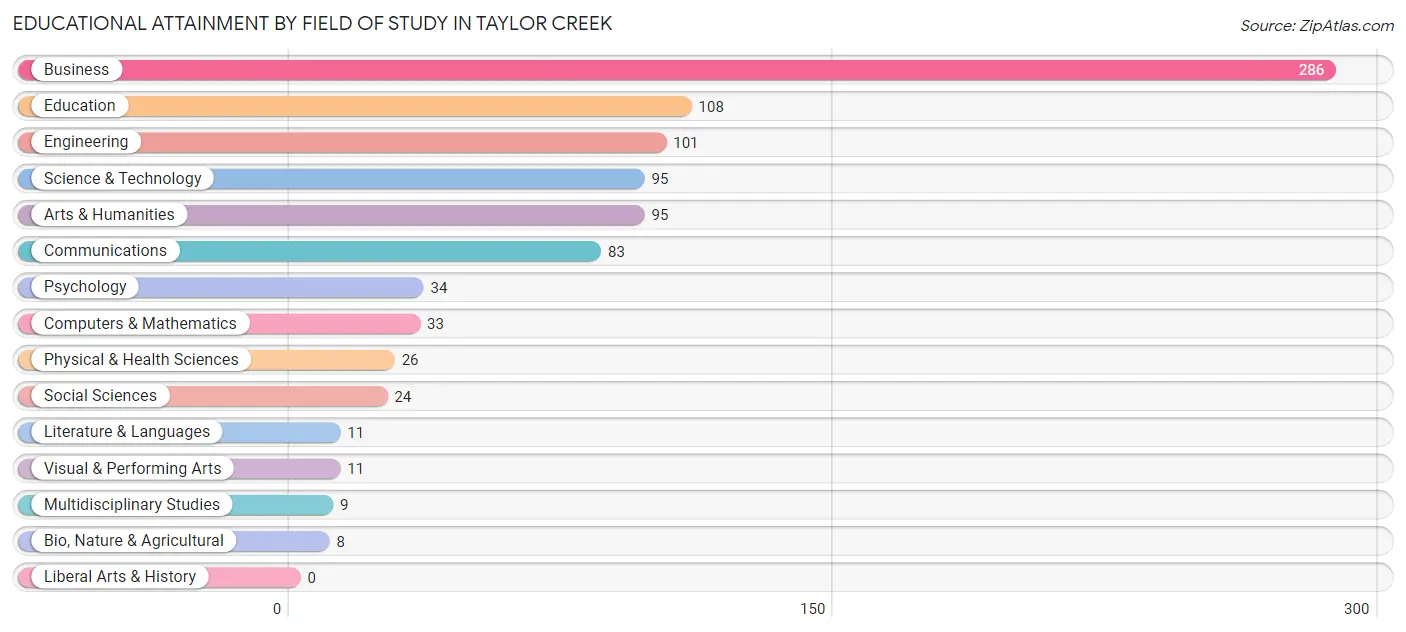
| Field of Study | # Graduates | % Graduates |
| Computers & Mathematics | 33 | 3.6% |
| Bio, Nature & Agricultural | 8 | 0.9% |
| Physical & Health Sciences | 26 | 2.8% |
| Psychology | 34 | 3.7% |
| Social Sciences | 24 | 2.6% |
| Engineering | 101 | 10.9% |
| Multidisciplinary Studies | 9 | 1.0% |
| Science & Technology | 95 | 10.3% |
| Business | 286 | 30.9% |
| Education | 108 | 11.7% |
| Literature & Languages | 11 | 1.2% |
| Liberal Arts & History | 0 | 0.0% |
| Visual & Performing Arts | 11 | 1.2% |
| Communications | 83 | 9.0% |
| Arts & Humanities | 95 | 10.3% |
| Total | 924 | 100.0% |
Transportation & Commute in Taylor Creek
Vehicle Availability by Sex in Taylor Creek
The most prevalent vehicle ownership categories in Taylor Creek are males with 2 vehicles (416, accounting for 39.1%) and females with 2 vehicles (417, making up 41.8%).
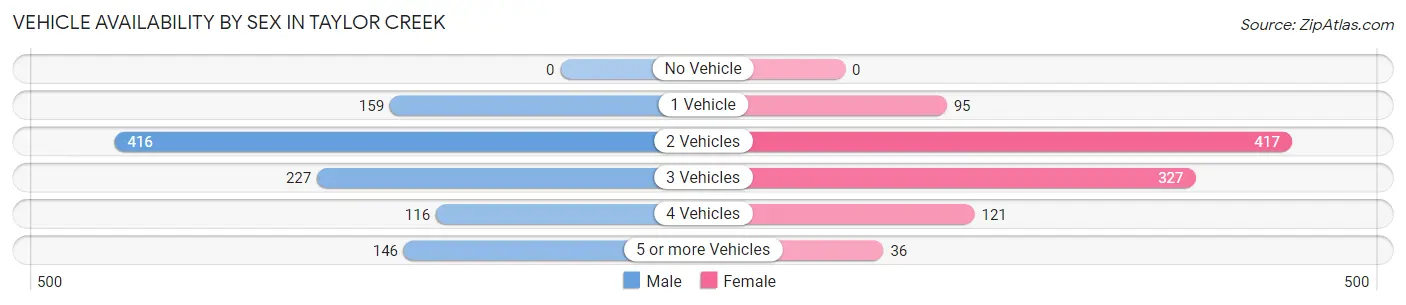
| Vehicles Available | Male | Female |
| No Vehicle | 0 (0.0%) | 0 (0.0%) |
| 1 Vehicle | 159 (14.9%) | 95 (9.5%) |
| 2 Vehicles | 416 (39.1%) | 417 (41.9%) |
| 3 Vehicles | 227 (21.3%) | 327 (32.8%) |
| 4 Vehicles | 116 (10.9%) | 121 (12.1%) |
| 5 or more Vehicles | 146 (13.7%) | 36 (3.6%) |
| Total | 1,064 (100.0%) | 996 (100.0%) |
Commute Time in Taylor Creek
The most frequently occuring commute durations in Taylor Creek are 20 to 24 minutes (367 commuters, 21.5%), 25 to 29 minutes (318 commuters, 18.6%), and 30 to 34 minutes (283 commuters, 16.6%).
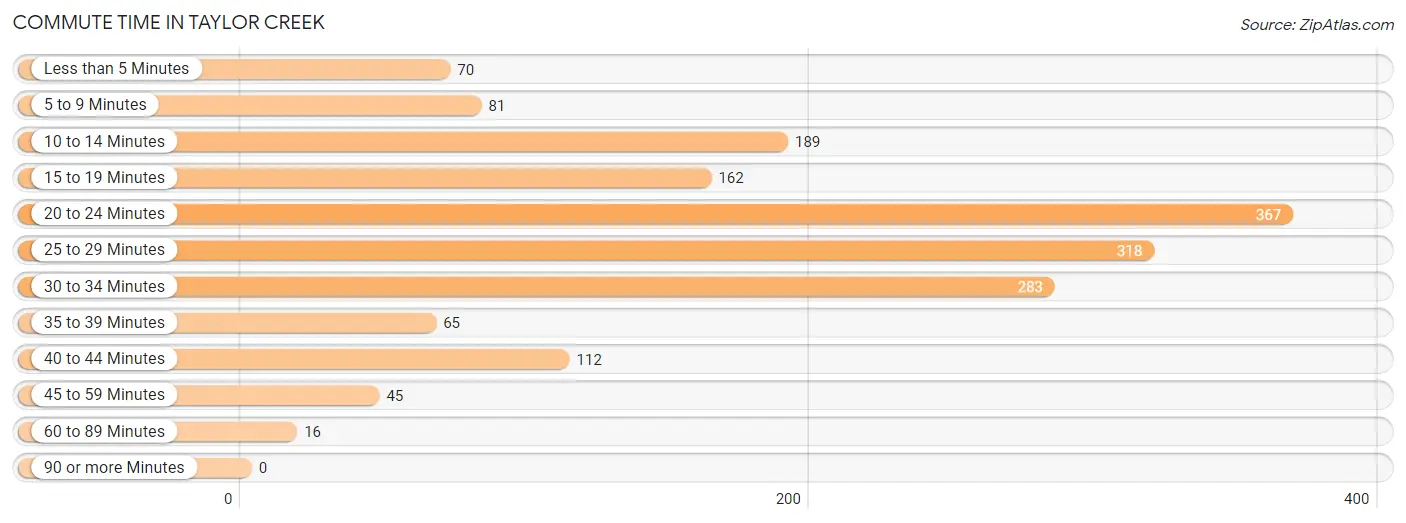
| Commute Time | # Commuters | % Commuters |
| Less than 5 Minutes | 70 | 4.1% |
| 5 to 9 Minutes | 81 | 4.7% |
| 10 to 14 Minutes | 189 | 11.1% |
| 15 to 19 Minutes | 162 | 9.5% |
| 20 to 24 Minutes | 367 | 21.5% |
| 25 to 29 Minutes | 318 | 18.6% |
| 30 to 34 Minutes | 283 | 16.6% |
| 35 to 39 Minutes | 65 | 3.8% |
| 40 to 44 Minutes | 112 | 6.6% |
| 45 to 59 Minutes | 45 | 2.6% |
| 60 to 89 Minutes | 16 | 0.9% |
| 90 or more Minutes | 0 | 0.0% |
Commute Time by Sex in Taylor Creek
The most common commute times in Taylor Creek are 25 to 29 minutes (168 commuters, 18.3%) for males and 20 to 24 minutes (208 commuters, 26.3%) for females.
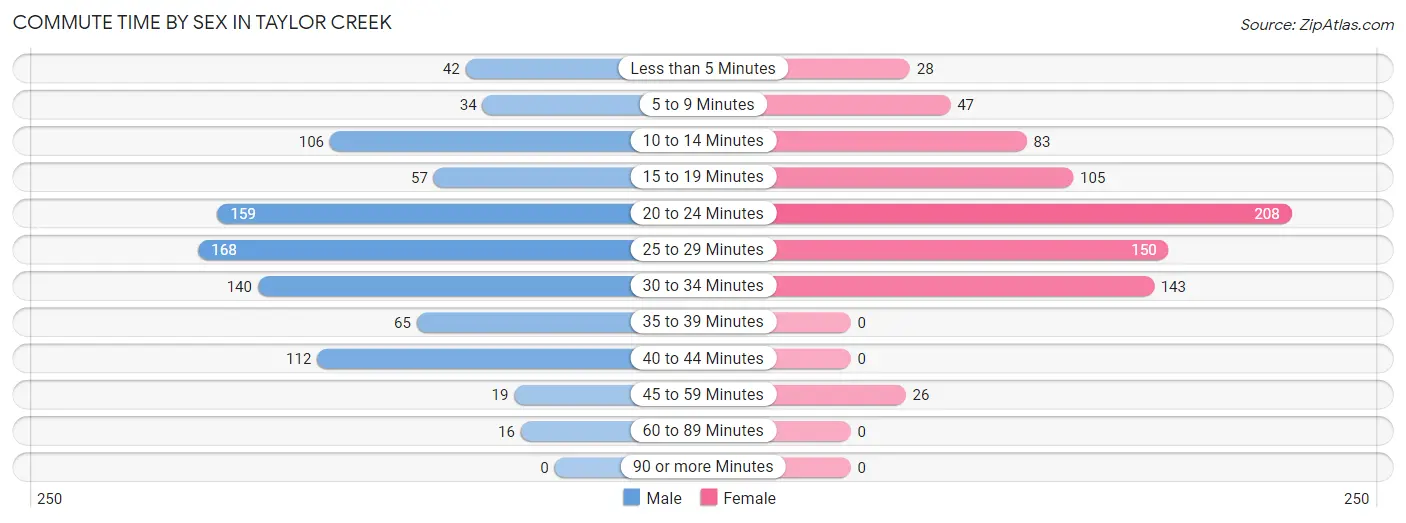
| Commute Time | Male | Female |
| Less than 5 Minutes | 42 (4.6%) | 28 (3.5%) |
| 5 to 9 Minutes | 34 (3.7%) | 47 (5.9%) |
| 10 to 14 Minutes | 106 (11.6%) | 83 (10.5%) |
| 15 to 19 Minutes | 57 (6.2%) | 105 (13.3%) |
| 20 to 24 Minutes | 159 (17.3%) | 208 (26.3%) |
| 25 to 29 Minutes | 168 (18.3%) | 150 (19.0%) |
| 30 to 34 Minutes | 140 (15.2%) | 143 (18.1%) |
| 35 to 39 Minutes | 65 (7.1%) | 0 (0.0%) |
| 40 to 44 Minutes | 112 (12.2%) | 0 (0.0%) |
| 45 to 59 Minutes | 19 (2.1%) | 26 (3.3%) |
| 60 to 89 Minutes | 16 (1.7%) | 0 (0.0%) |
| 90 or more Minutes | 0 (0.0%) | 0 (0.0%) |
Time of Departure to Work by Sex in Taylor Creek
The most frequent times of departure to work in Taylor Creek are 7:30 AM to 7:59 AM (198, 21.6%) for males and 8:00 AM to 8:29 AM (194, 24.6%) for females.
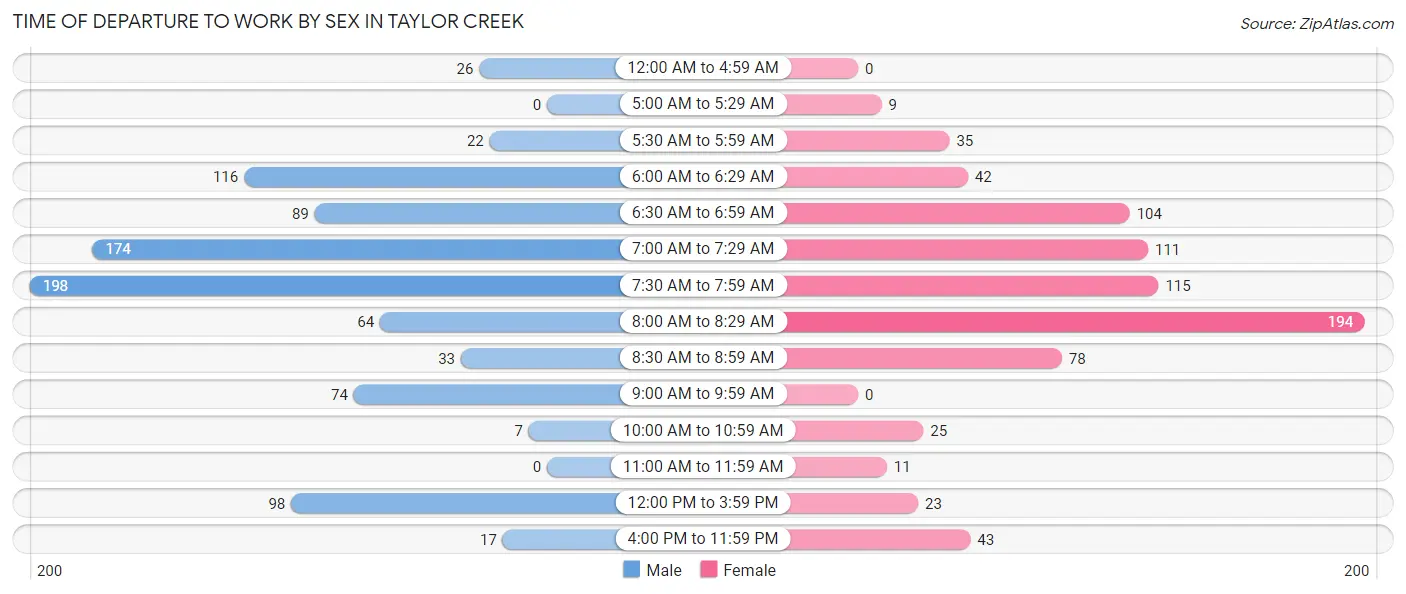
| Time of Departure | Male | Female |
| 12:00 AM to 4:59 AM | 26 (2.8%) | 0 (0.0%) |
| 5:00 AM to 5:29 AM | 0 (0.0%) | 9 (1.1%) |
| 5:30 AM to 5:59 AM | 22 (2.4%) | 35 (4.4%) |
| 6:00 AM to 6:29 AM | 116 (12.6%) | 42 (5.3%) |
| 6:30 AM to 6:59 AM | 89 (9.7%) | 104 (13.2%) |
| 7:00 AM to 7:29 AM | 174 (19.0%) | 111 (14.1%) |
| 7:30 AM to 7:59 AM | 198 (21.6%) | 115 (14.6%) |
| 8:00 AM to 8:29 AM | 64 (7.0%) | 194 (24.6%) |
| 8:30 AM to 8:59 AM | 33 (3.6%) | 78 (9.9%) |
| 9:00 AM to 9:59 AM | 74 (8.1%) | 0 (0.0%) |
| 10:00 AM to 10:59 AM | 7 (0.8%) | 25 (3.2%) |
| 11:00 AM to 11:59 AM | 0 (0.0%) | 11 (1.4%) |
| 12:00 PM to 3:59 PM | 98 (10.7%) | 23 (2.9%) |
| 4:00 PM to 11:59 PM | 17 (1.8%) | 43 (5.4%) |
| Total | 918 (100.0%) | 790 (100.0%) |
Housing Occupancy in Taylor Creek
Occupancy by Ownership in Taylor Creek
Of the total 1,480 dwellings in Taylor Creek, owner-occupied units account for 1,315 (88.8%), while renter-occupied units make up 165 (11.2%).
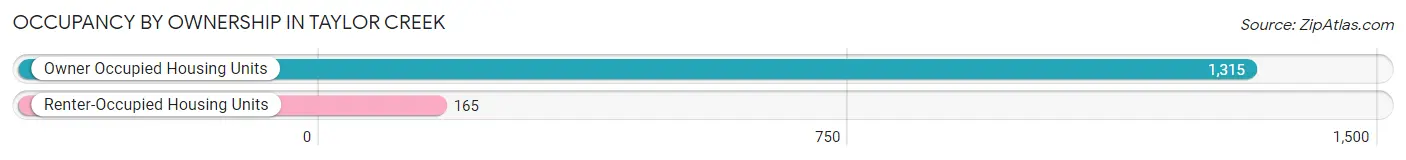
| Occupancy | # Housing Units | % Housing Units |
| Owner Occupied Housing Units | 1,315 | 88.8% |
| Renter-Occupied Housing Units | 165 | 11.2% |
| Total Occupied Housing Units | 1,480 | 100.0% |
Occupancy by Household Size in Taylor Creek
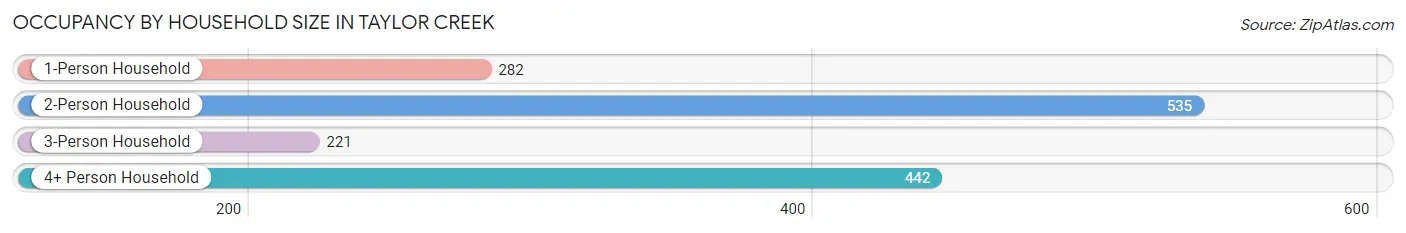
| Household Size | # Housing Units | % Housing Units |
| 1-Person Household | 282 | 19.1% |
| 2-Person Household | 535 | 36.1% |
| 3-Person Household | 221 | 14.9% |
| 4+ Person Household | 442 | 29.9% |
| Total Housing Units | 1,480 | 100.0% |
Occupancy by Ownership by Household Size in Taylor Creek
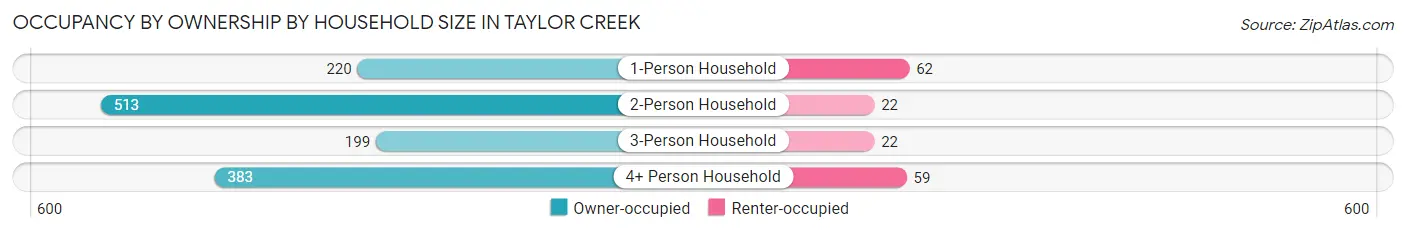
| Household Size | Owner-occupied | Renter-occupied |
| 1-Person Household | 220 (78.0%) | 62 (22.0%) |
| 2-Person Household | 513 (95.9%) | 22 (4.1%) |
| 3-Person Household | 199 (90.0%) | 22 (10.0%) |
| 4+ Person Household | 383 (86.7%) | 59 (13.4%) |
| Total Housing Units | 1,315 (88.8%) | 165 (11.2%) |
Occupancy by Educational Attainment in Taylor Creek
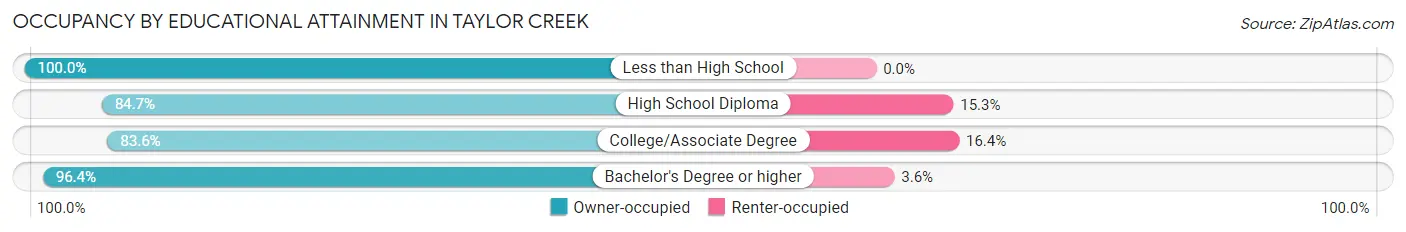
| Household Size | Owner-occupied | Renter-occupied |
| Less than High School | 30 (100.0%) | 0 (0.0%) |
| High School Diploma | 421 (84.7%) | 76 (15.3%) |
| College/Associate Degree | 356 (83.6%) | 70 (16.4%) |
| Bachelor's Degree or higher | 508 (96.4%) | 19 (3.6%) |
Occupancy by Age of Householder in Taylor Creek
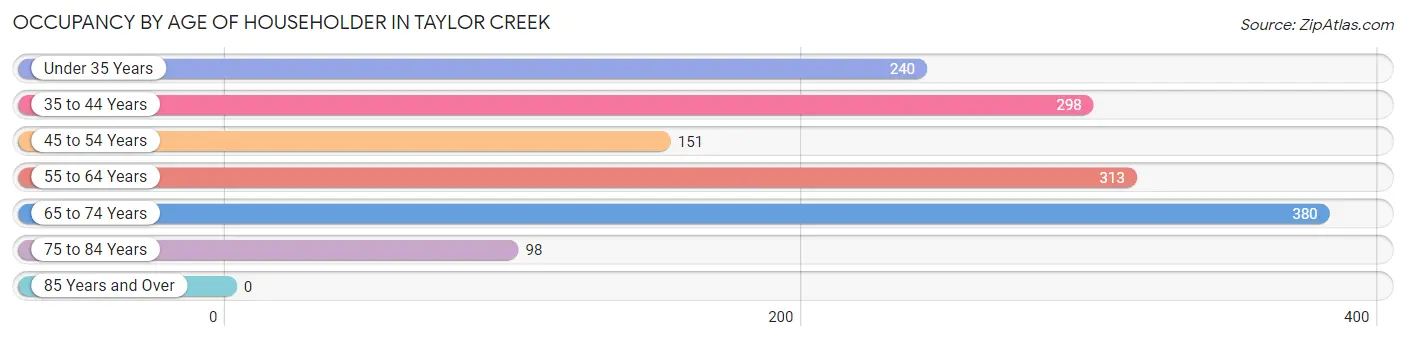
| Age Bracket | # Households | % Households |
| Under 35 Years | 240 | 16.2% |
| 35 to 44 Years | 298 | 20.1% |
| 45 to 54 Years | 151 | 10.2% |
| 55 to 64 Years | 313 | 21.1% |
| 65 to 74 Years | 380 | 25.7% |
| 75 to 84 Years | 98 | 6.6% |
| 85 Years and Over | 0 | 0.0% |
| Total | 1,480 | 100.0% |
Housing Finances in Taylor Creek
Median Income by Occupancy in Taylor Creek
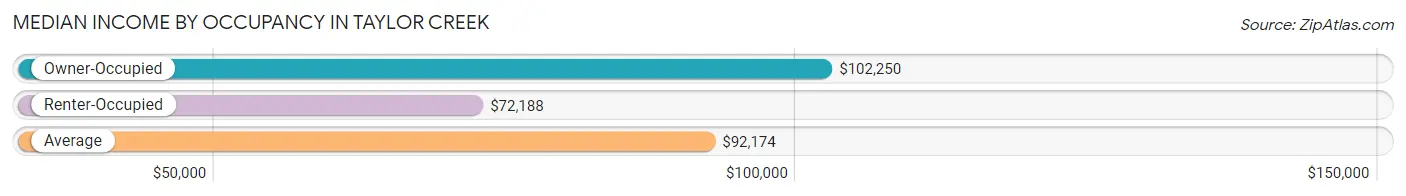
| Occupancy Type | # Households | Median Income |
| Owner-Occupied | 1,315 (88.8%) | $102,250 |
| Renter-Occupied | 165 (11.2%) | $72,188 |
| Average | 1,480 (100.0%) | $92,174 |
Occupancy by Householder Income Bracket in Taylor Creek
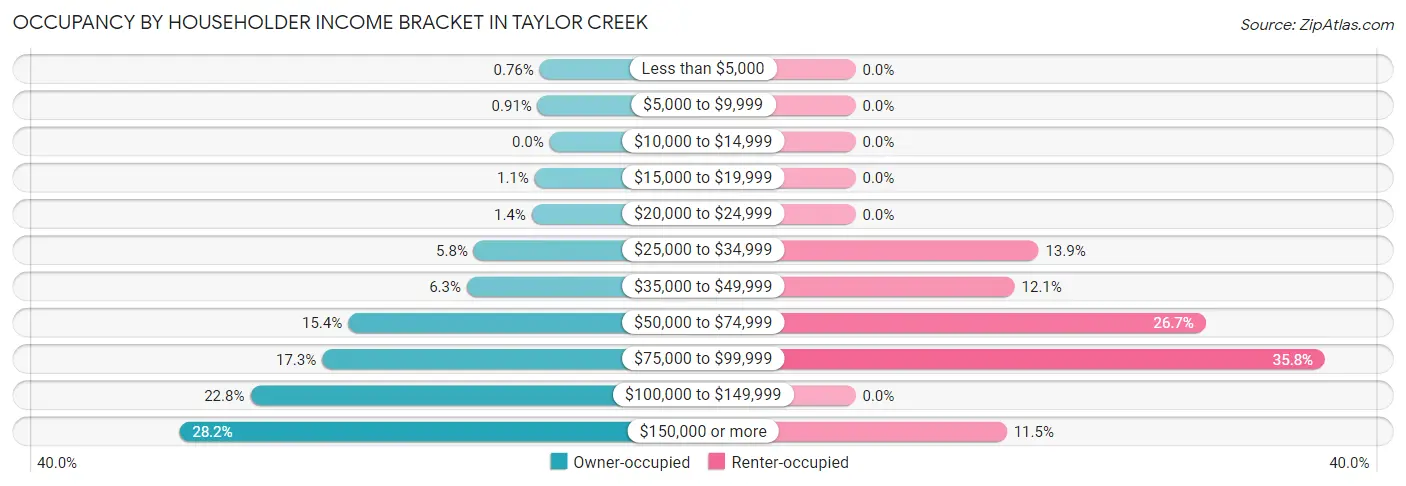
| Income Bracket | Owner-occupied | Renter-occupied |
| Less than $5,000 | 10 (0.8%) | 0 (0.0%) |
| $5,000 to $9,999 | 12 (0.9%) | 0 (0.0%) |
| $10,000 to $14,999 | 0 (0.0%) | 0 (0.0%) |
| $15,000 to $19,999 | 15 (1.1%) | 0 (0.0%) |
| $20,000 to $24,999 | 18 (1.4%) | 0 (0.0%) |
| $25,000 to $34,999 | 76 (5.8%) | 23 (13.9%) |
| $35,000 to $49,999 | 83 (6.3%) | 20 (12.1%) |
| $50,000 to $74,999 | 202 (15.4%) | 44 (26.7%) |
| $75,000 to $99,999 | 228 (17.3%) | 59 (35.8%) |
| $100,000 to $149,999 | 300 (22.8%) | 0 (0.0%) |
| $150,000 or more | 371 (28.2%) | 19 (11.5%) |
| Total | 1,315 (100.0%) | 165 (100.0%) |
Monthly Housing Cost Tiers in Taylor Creek
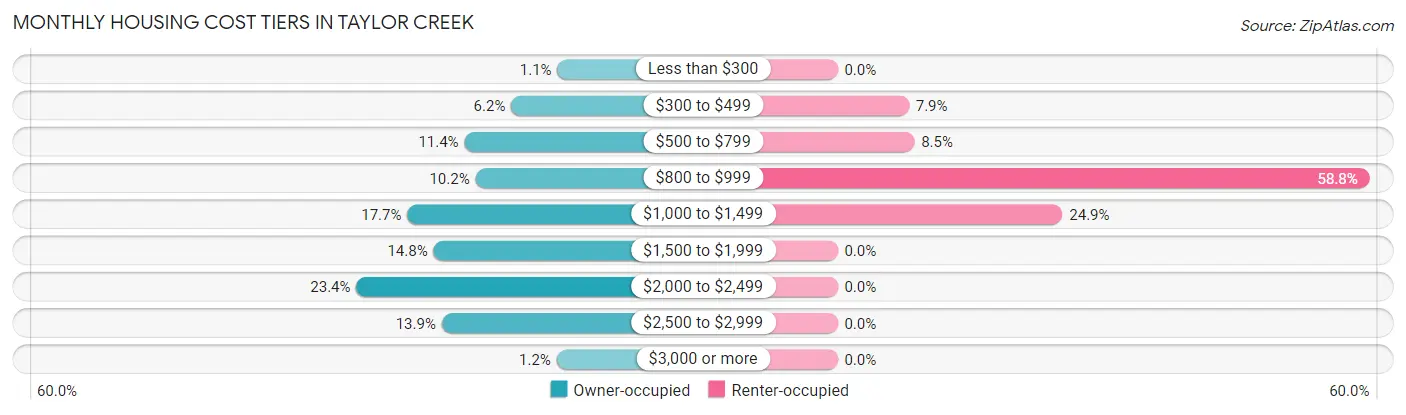
| Monthly Cost | Owner-occupied | Renter-occupied |
| Less than $300 | 15 (1.1%) | 0 (0.0%) |
| $300 to $499 | 82 (6.2%) | 13 (7.9%) |
| $500 to $799 | 150 (11.4%) | 14 (8.5%) |
| $800 to $999 | 134 (10.2%) | 97 (58.8%) |
| $1,000 to $1,499 | 233 (17.7%) | 41 (24.8%) |
| $1,500 to $1,999 | 195 (14.8%) | 0 (0.0%) |
| $2,000 to $2,499 | 307 (23.4%) | 0 (0.0%) |
| $2,500 to $2,999 | 183 (13.9%) | 0 (0.0%) |
| $3,000 or more | 16 (1.2%) | 0 (0.0%) |
| Total | 1,315 (100.0%) | 165 (100.0%) |
Physical Housing Characteristics in Taylor Creek
Housing Structures in Taylor Creek
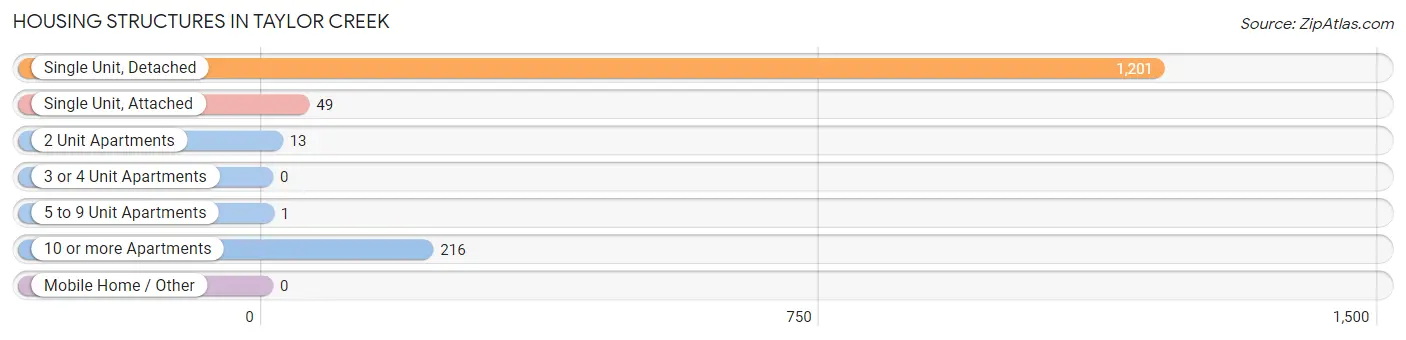
| Structure Type | # Housing Units | % Housing Units |
| Single Unit, Detached | 1,201 | 81.1% |
| Single Unit, Attached | 49 | 3.3% |
| 2 Unit Apartments | 13 | 0.9% |
| 3 or 4 Unit Apartments | 0 | 0.0% |
| 5 to 9 Unit Apartments | 1 | 0.1% |
| 10 or more Apartments | 216 | 14.6% |
| Mobile Home / Other | 0 | 0.0% |
| Total | 1,480 | 100.0% |
Housing Structures by Occupancy in Taylor Creek
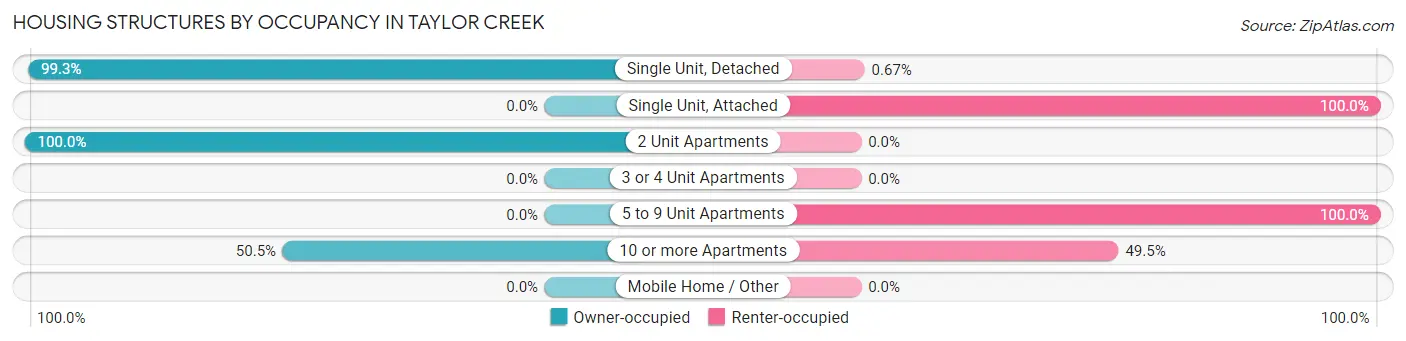
| Structure Type | Owner-occupied | Renter-occupied |
| Single Unit, Detached | 1,193 (99.3%) | 8 (0.7%) |
| Single Unit, Attached | 0 (0.0%) | 49 (100.0%) |
| 2 Unit Apartments | 13 (100.0%) | 0 (0.0%) |
| 3 or 4 Unit Apartments | 0 (0.0%) | 0 (0.0%) |
| 5 to 9 Unit Apartments | 0 (0.0%) | 1 (100.0%) |
| 10 or more Apartments | 109 (50.5%) | 107 (49.5%) |
| Mobile Home / Other | 0 (0.0%) | 0 (0.0%) |
| Total | 1,315 (88.8%) | 165 (11.2%) |
Housing Structures by Number of Rooms in Taylor Creek
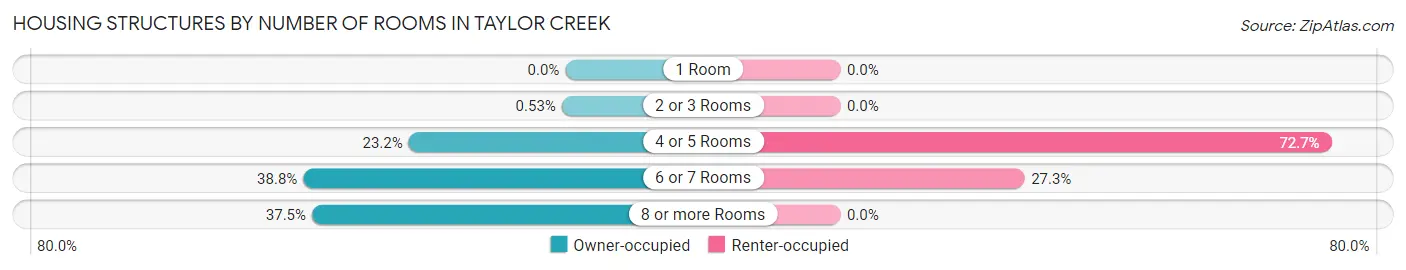
| Number of Rooms | Owner-occupied | Renter-occupied |
| 1 Room | 0 (0.0%) | 0 (0.0%) |
| 2 or 3 Rooms | 7 (0.5%) | 0 (0.0%) |
| 4 or 5 Rooms | 305 (23.2%) | 120 (72.7%) |
| 6 or 7 Rooms | 510 (38.8%) | 45 (27.3%) |
| 8 or more Rooms | 493 (37.5%) | 0 (0.0%) |
| Total | 1,315 (100.0%) | 165 (100.0%) |
Housing Structure by Heating Type in Taylor Creek
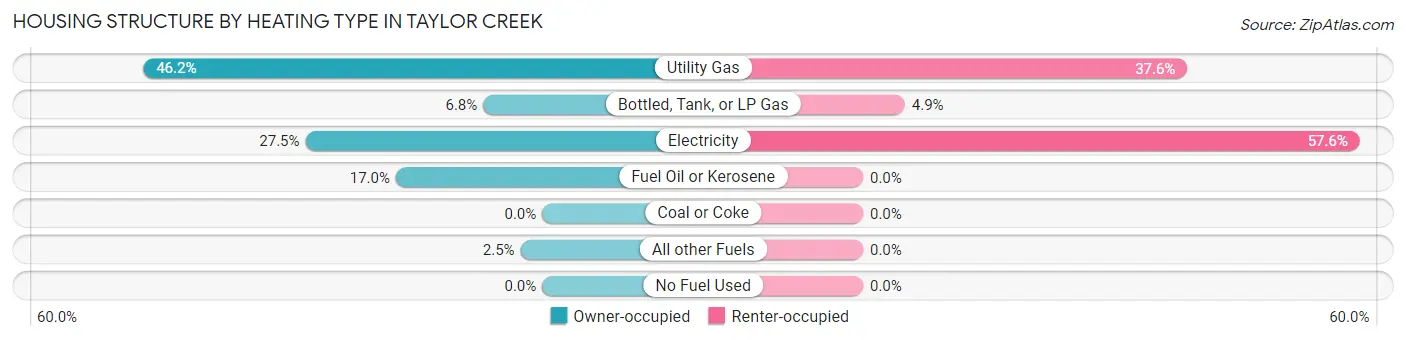
| Heating Type | Owner-occupied | Renter-occupied |
| Utility Gas | 608 (46.2%) | 62 (37.6%) |
| Bottled, Tank, or LP Gas | 90 (6.8%) | 8 (4.9%) |
| Electricity | 361 (27.5%) | 95 (57.6%) |
| Fuel Oil or Kerosene | 223 (17.0%) | 0 (0.0%) |
| Coal or Coke | 0 (0.0%) | 0 (0.0%) |
| All other Fuels | 33 (2.5%) | 0 (0.0%) |
| No Fuel Used | 0 (0.0%) | 0 (0.0%) |
| Total | 1,315 (100.0%) | 165 (100.0%) |
Household Vehicle Usage in Taylor Creek
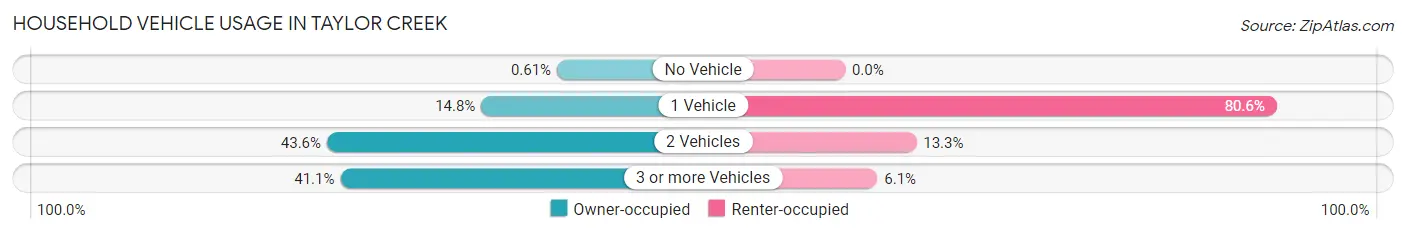
| Vehicles per Household | Owner-occupied | Renter-occupied |
| No Vehicle | 8 (0.6%) | 0 (0.0%) |
| 1 Vehicle | 194 (14.7%) | 133 (80.6%) |
| 2 Vehicles | 573 (43.6%) | 22 (13.3%) |
| 3 or more Vehicles | 540 (41.1%) | 10 (6.1%) |
| Total | 1,315 (100.0%) | 165 (100.0%) |
Real Estate & Mortgages in Taylor Creek
Real Estate and Mortgage Overview in Taylor Creek
| Characteristic | Without Mortgage | With Mortgage |
| Housing Units | 310 | 1,005 |
| Median Property Value | $265,600 | $282,600 |
| Median Household Income | $61,250 | $299 |
| Monthly Housing Costs | $714 | $16 |
| Real Estate Taxes | $4,945 | $22 |
Property Value by Mortgage Status in Taylor Creek
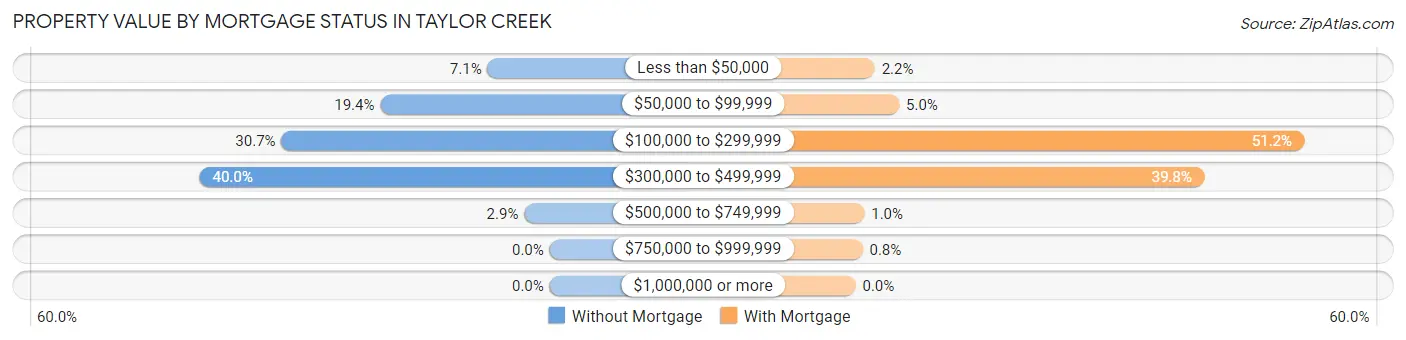
| Property Value | Without Mortgage | With Mortgage |
| Less than $50,000 | 22 (7.1%) | 22 (2.2%) |
| $50,000 to $99,999 | 60 (19.4%) | 50 (5.0%) |
| $100,000 to $299,999 | 95 (30.6%) | 515 (51.2%) |
| $300,000 to $499,999 | 124 (40.0%) | 400 (39.8%) |
| $500,000 to $749,999 | 9 (2.9%) | 10 (1.0%) |
| $750,000 to $999,999 | 0 (0.0%) | 8 (0.8%) |
| $1,000,000 or more | 0 (0.0%) | 0 (0.0%) |
| Total | 310 (100.0%) | 1,005 (100.0%) |
Household Income by Mortgage Status in Taylor Creek
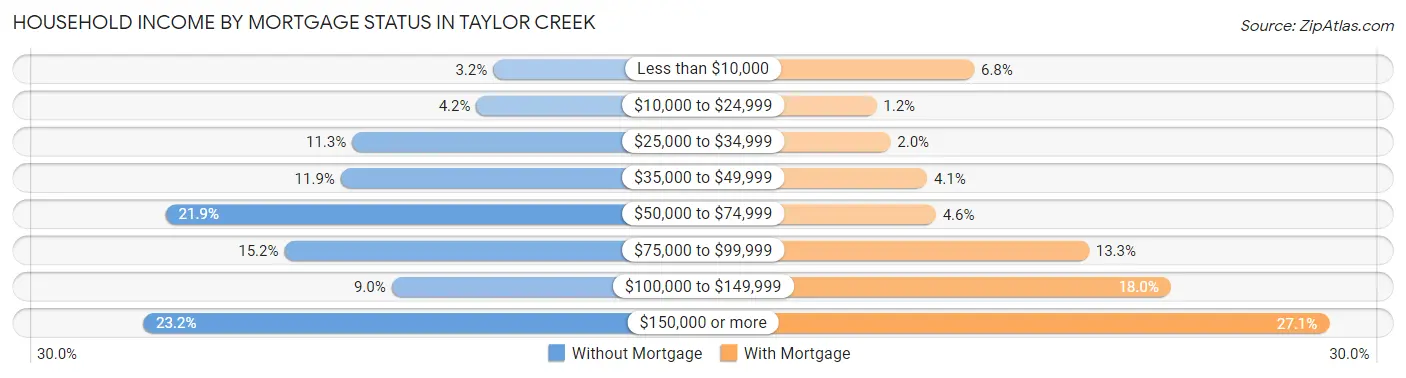
| Household Income | Without Mortgage | With Mortgage |
| Less than $10,000 | 10 (3.2%) | 68 (6.8%) |
| $10,000 to $24,999 | 13 (4.2%) | 12 (1.2%) |
| $25,000 to $34,999 | 35 (11.3%) | 20 (2.0%) |
| $35,000 to $49,999 | 37 (11.9%) | 41 (4.1%) |
| $50,000 to $74,999 | 68 (21.9%) | 46 (4.6%) |
| $75,000 to $99,999 | 47 (15.2%) | 134 (13.3%) |
| $100,000 to $149,999 | 28 (9.0%) | 181 (18.0%) |
| $150,000 or more | 72 (23.2%) | 272 (27.1%) |
| Total | 310 (100.0%) | 1,005 (100.0%) |
Property Value to Household Income Ratio in Taylor Creek
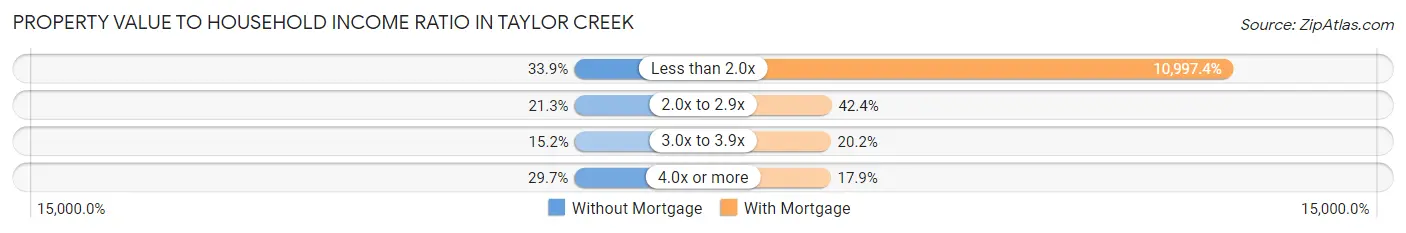
| Value-to-Income Ratio | Without Mortgage | With Mortgage |
| Less than 2.0x | 105 (33.9%) | 110,524 (10,997.4%) |
| 2.0x to 2.9x | 66 (21.3%) | 426 (42.4%) |
| 3.0x to 3.9x | 47 (15.2%) | 203 (20.2%) |
| 4.0x or more | 92 (29.7%) | 180 (17.9%) |
| Total | 310 (100.0%) | 1,005 (100.0%) |
Real Estate Taxes by Mortgage Status in Taylor Creek
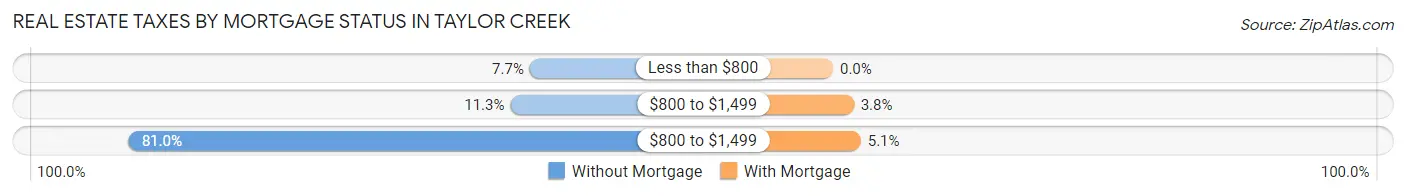
| Property Taxes | Without Mortgage | With Mortgage |
| Less than $800 | 24 (7.7%) | 0 (0.0%) |
| $800 to $1,499 | 35 (11.3%) | 38 (3.8%) |
| $800 to $1,499 | 251 (81.0%) | 51 (5.1%) |
| Total | 310 (100.0%) | 1,005 (100.0%) |
Health & Disability in Taylor Creek
Health Insurance Coverage by Age in Taylor Creek
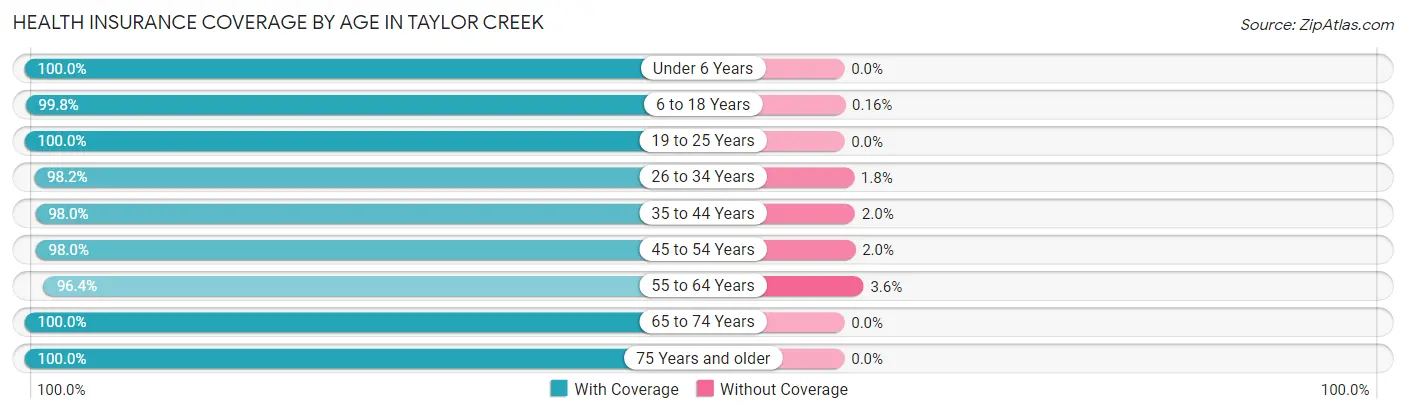
| Age Bracket | With Coverage | Without Coverage |
| Under 6 Years | 362 (100.0%) | 0 (0.0%) |
| 6 to 18 Years | 624 (99.8%) | 1 (0.2%) |
| 19 to 25 Years | 167 (100.0%) | 0 (0.0%) |
| 26 to 34 Years | 603 (98.2%) | 11 (1.8%) |
| 35 to 44 Years | 496 (98.0%) | 10 (2.0%) |
| 45 to 54 Years | 385 (98.0%) | 8 (2.0%) |
| 55 to 64 Years | 592 (96.4%) | 22 (3.6%) |
| 65 to 74 Years | 587 (100.0%) | 0 (0.0%) |
| 75 Years and older | 118 (100.0%) | 0 (0.0%) |
| Total | 3,934 (98.7%) | 52 (1.3%) |
Health Insurance Coverage by Citizenship Status in Taylor Creek
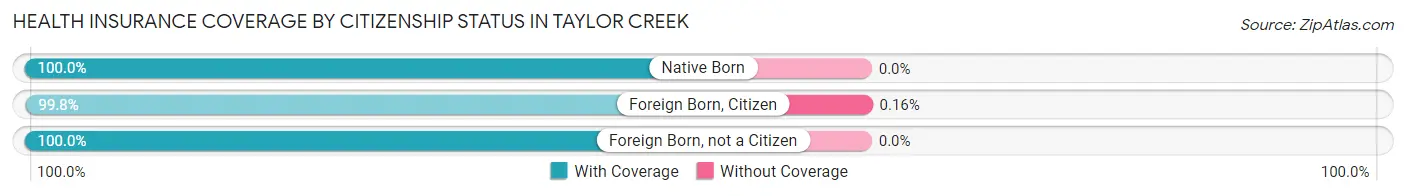
| Citizenship Status | With Coverage | Without Coverage |
| Native Born | 362 (100.0%) | 0 (0.0%) |
| Foreign Born, Citizen | 624 (99.8%) | 1 (0.2%) |
| Foreign Born, not a Citizen | 167 (100.0%) | 0 (0.0%) |
Health Insurance Coverage by Household Income in Taylor Creek
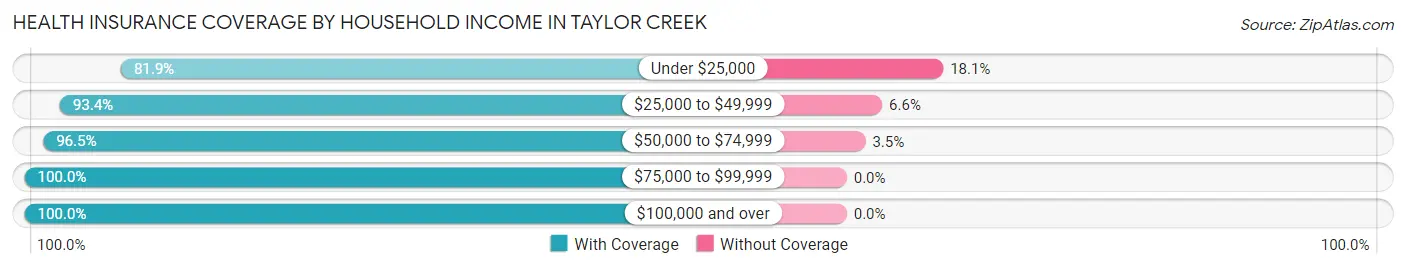
| Household Income | With Coverage | Without Coverage |
| Under $25,000 | 59 (81.9%) | 13 (18.1%) |
| $25,000 to $49,999 | 296 (93.4%) | 21 (6.6%) |
| $50,000 to $74,999 | 496 (96.5%) | 18 (3.5%) |
| $75,000 to $99,999 | 850 (100.0%) | 0 (0.0%) |
| $100,000 and over | 2,233 (100.0%) | 0 (0.0%) |
Public vs Private Health Insurance Coverage by Age in Taylor Creek
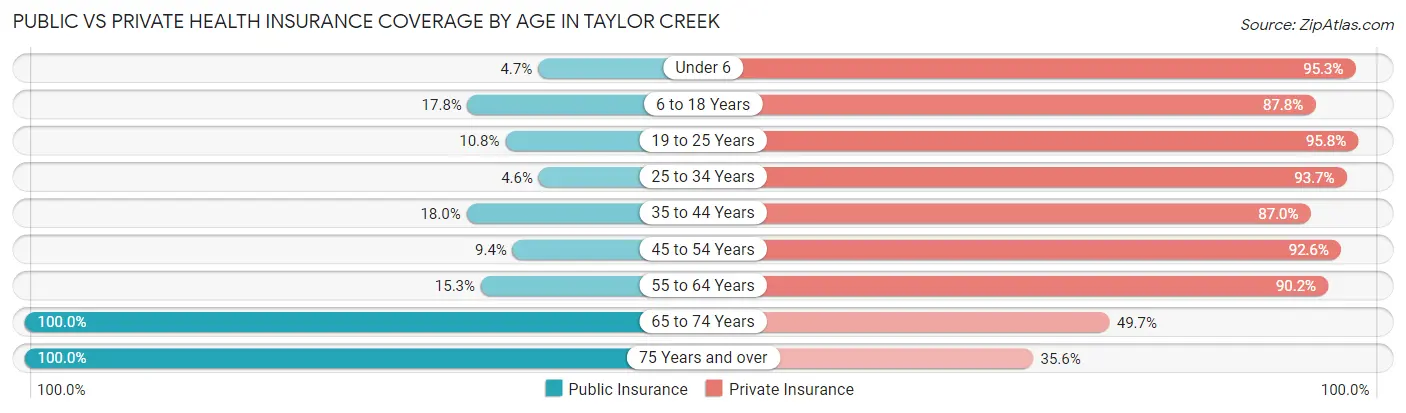
| Age Bracket | Public Insurance | Private Insurance |
| Under 6 | 17 (4.7%) | 345 (95.3%) |
| 6 to 18 Years | 111 (17.8%) | 549 (87.8%) |
| 19 to 25 Years | 18 (10.8%) | 160 (95.8%) |
| 25 to 34 Years | 28 (4.6%) | 575 (93.6%) |
| 35 to 44 Years | 91 (18.0%) | 440 (87.0%) |
| 45 to 54 Years | 37 (9.4%) | 364 (92.6%) |
| 55 to 64 Years | 94 (15.3%) | 554 (90.2%) |
| 65 to 74 Years | 587 (100.0%) | 292 (49.7%) |
| 75 Years and over | 118 (100.0%) | 42 (35.6%) |
| Total | 1,101 (27.6%) | 3,321 (83.3%) |
Disability Status by Sex by Age in Taylor Creek
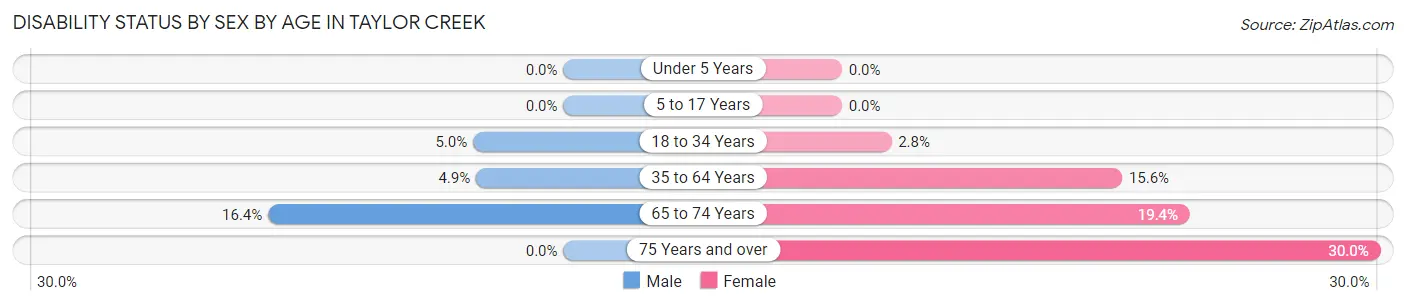
| Age Bracket | Male | Female |
| Under 5 Years | 0 (0.0%) | 0 (0.0%) |
| 5 to 17 Years | 0 (0.0%) | 0 (0.0%) |
| 18 to 34 Years | 18 (5.0%) | 13 (2.8%) |
| 35 to 64 Years | 38 (4.9%) | 114 (15.6%) |
| 65 to 74 Years | 49 (16.4%) | 56 (19.4%) |
| 75 Years and over | 0 (0.0%) | 9 (30.0%) |
Disability Class by Sex by Age in Taylor Creek
Disability Class: Hearing Difficulty
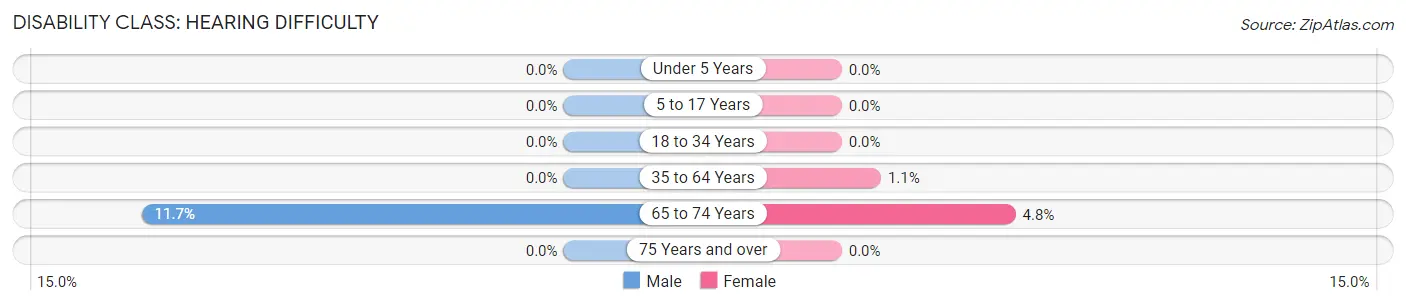
| Age Bracket | Male | Female |
| Under 5 Years | 0 (0.0%) | 0 (0.0%) |
| 5 to 17 Years | 0 (0.0%) | 0 (0.0%) |
| 18 to 34 Years | 0 (0.0%) | 0 (0.0%) |
| 35 to 64 Years | 0 (0.0%) | 8 (1.1%) |
| 65 to 74 Years | 35 (11.7%) | 14 (4.8%) |
| 75 Years and over | 0 (0.0%) | 0 (0.0%) |
Disability Class: Vision Difficulty
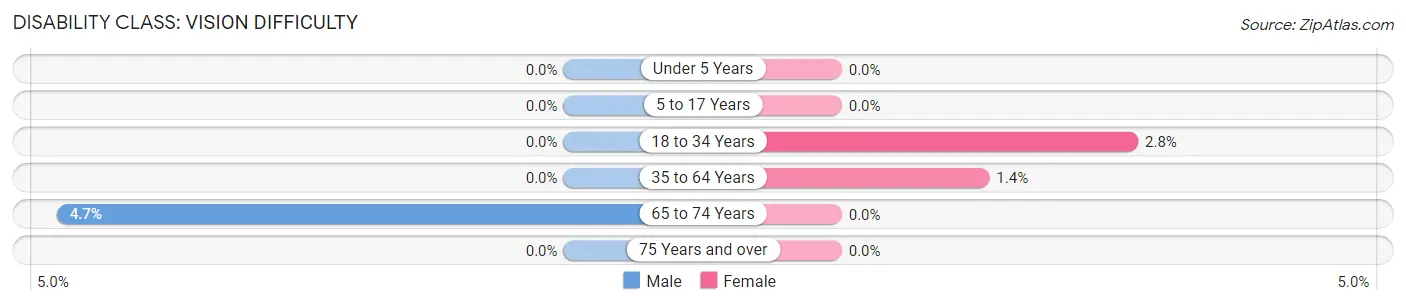
| Age Bracket | Male | Female |
| Under 5 Years | 0 (0.0%) | 0 (0.0%) |
| 5 to 17 Years | 0 (0.0%) | 0 (0.0%) |
| 18 to 34 Years | 0 (0.0%) | 13 (2.8%) |
| 35 to 64 Years | 0 (0.0%) | 10 (1.4%) |
| 65 to 74 Years | 14 (4.7%) | 0 (0.0%) |
| 75 Years and over | 0 (0.0%) | 0 (0.0%) |
Disability Class: Cognitive Difficulty
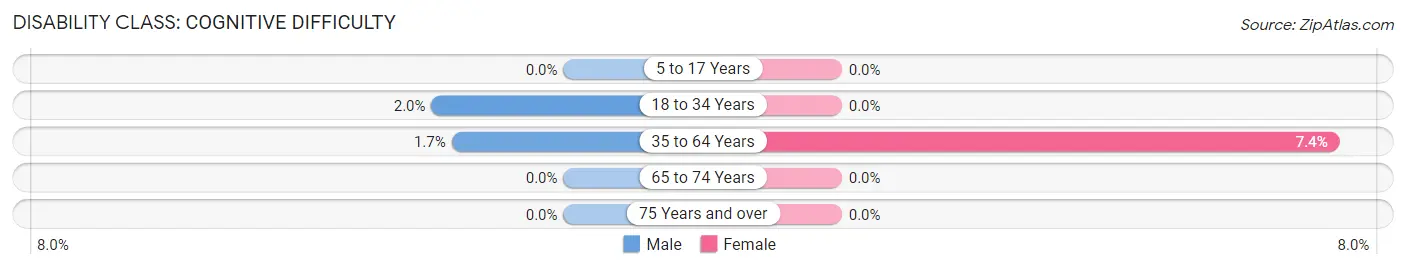
| Age Bracket | Male | Female |
| 5 to 17 Years | 0 (0.0%) | 0 (0.0%) |
| 18 to 34 Years | 7 (2.0%) | 0 (0.0%) |
| 35 to 64 Years | 13 (1.7%) | 54 (7.4%) |
| 65 to 74 Years | 0 (0.0%) | 0 (0.0%) |
| 75 Years and over | 0 (0.0%) | 0 (0.0%) |
Disability Class: Ambulatory Difficulty
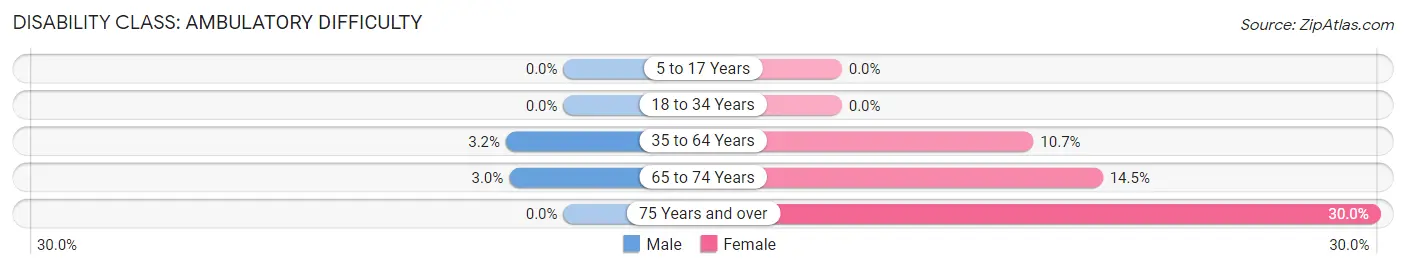
| Age Bracket | Male | Female |
| 5 to 17 Years | 0 (0.0%) | 0 (0.0%) |
| 18 to 34 Years | 0 (0.0%) | 0 (0.0%) |
| 35 to 64 Years | 25 (3.2%) | 78 (10.7%) |
| 65 to 74 Years | 9 (3.0%) | 42 (14.5%) |
| 75 Years and over | 0 (0.0%) | 9 (30.0%) |
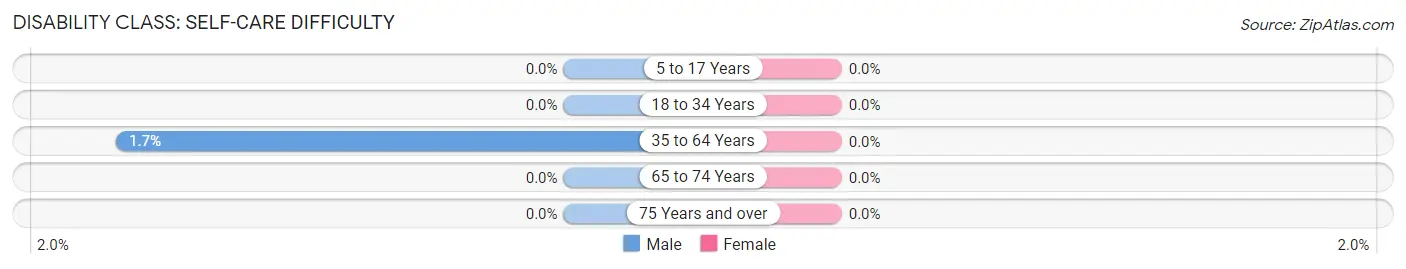
Disability Class: Self-Care Difficulty
| Age Bracket | Male | Female |
| 5 to 17 Years | 0 (0.0%) | 0 (0.0%) |
| 18 to 34 Years | 0 (0.0%) | 0 (0.0%) |
| 35 to 64 Years | 13 (1.7%) | 0 (0.0%) |
| 65 to 74 Years | 0 (0.0%) | 0 (0.0%) |
| 75 Years and over | 0 (0.0%) | 0 (0.0%) |
Technology Access in Taylor Creek
Computing Device Access in Taylor Creek
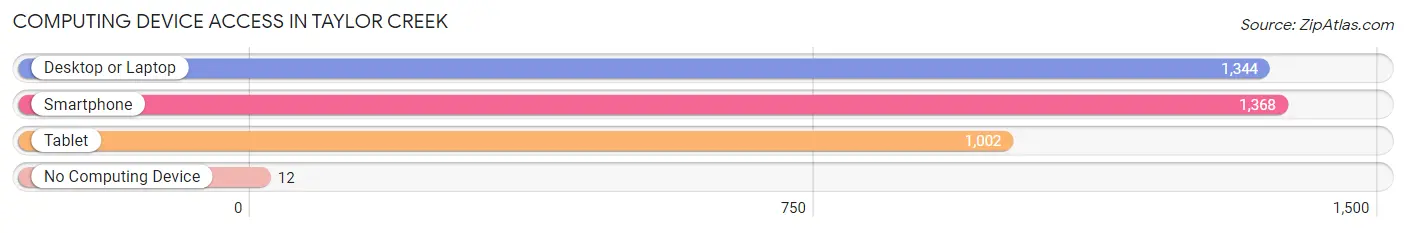
| Device Type | # Households | % Households |
| Desktop or Laptop | 1,344 | 90.8% |
| Smartphone | 1,368 | 92.4% |
| Tablet | 1,002 | 67.7% |
| No Computing Device | 12 | 0.8% |
| Total | 1,480 | 100.0% |
Internet Access in Taylor Creek
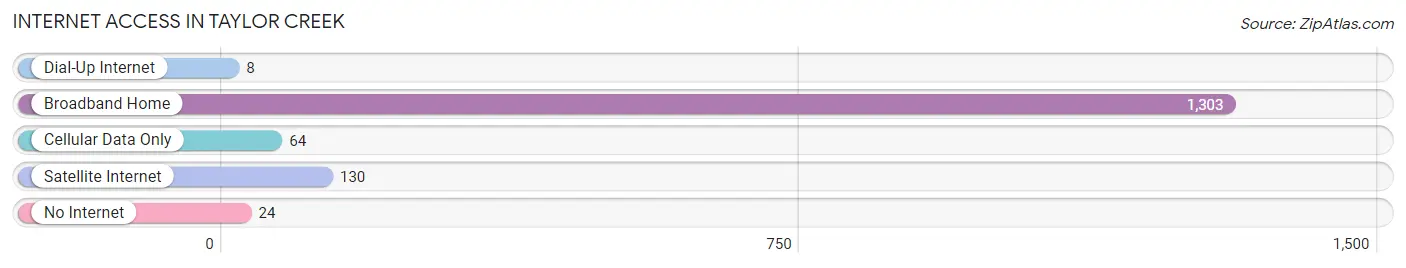
| Internet Type | # Households | % Households |
| Dial-Up Internet | 8 | 0.5% |
| Broadband Home | 1,303 | 88.0% |
| Cellular Data Only | 64 | 4.3% |
| Satellite Internet | 130 | 8.8% |
| No Internet | 24 | 1.6% |
| Total | 1,480 | 100.0% |
Taylor Creek Summary
History
Taylor Creek is a small unincorporated community located in the southeastern corner of Ohio, in the county of Muskingum. It is situated on the banks of the Muskingum River, and is surrounded by rolling hills and lush forests. The area was first settled in the early 1800s by a group of settlers from Pennsylvania. The settlers were attracted to the area due to its abundance of natural resources, including timber, coal, and limestone. The community was named after a local settler, John Taylor, who owned a large tract of land in the area.
The early settlers of Taylor Creek were mostly farmers, and the area was known for its production of corn, wheat, and other grains. The community also had a thriving lumber industry, and the local sawmill was a major source of employment for the residents. In the late 1800s, the railroad came to Taylor Creek, connecting the community to the larger cities of Zanesville and Columbus. This allowed the residents to easily transport their goods to the larger markets.
In the early 1900s, the community began to experience a period of growth and prosperity. The local economy was bolstered by the construction of a number of factories, including a brickyard, a canning factory, and a furniture factory. The population of Taylor Creek grew steadily throughout the first half of the 20th century, reaching a peak of around 500 people in the 1950s.
Geography
Taylor Creek is located in southeastern Ohio, in Muskingum County. It is situated on the banks of the Muskingum River, and is surrounded by rolling hills and lush forests. The area is known for its abundance of natural resources, including timber, coal, and limestone. The climate in the area is generally mild, with hot summers and cold winters.
The nearest major city is Zanesville, which is located about 20 miles to the northwest. The city of Columbus is located about 50 miles to the south.
Economy
The economy of Taylor Creek is largely based on agriculture and forestry. The area is known for its production of corn, wheat, and other grains. The local sawmill is a major source of employment for the residents, and the lumber industry is a major contributor to the local economy.
In addition to agriculture and forestry, the community also has a number of small businesses, including a grocery store, a hardware store, and a few restaurants. The nearest major city, Zanesville, is home to a number of larger businesses, including a hospital, a university, and a number of manufacturing plants.
Demographics
As of the 2010 census, the population of Taylor Creek was estimated to be around 400 people. The population is predominantly white, with a small minority of African Americans. The median household income in the area is around $35,000, and the median age is around 40 years old. The majority of the population is employed in the agricultural and forestry industries.
Common Questions
What is the Total Population of Taylor Creek?
Total Population of Taylor Creek is 3,986.
What is the Total Male Population of Taylor Creek?
Total Male Population of Taylor Creek is 1,976.
What is the Total Female Population of Taylor Creek?
Total Female Population of Taylor Creek is 2,010.
What is the Ratio of Males per 100 Females in Taylor Creek?
There are 98.31 Males per 100 Females in Taylor Creek.
What is the Ratio of Females per 100 Males in Taylor Creek?
There are 101.72 Females per 100 Males in Taylor Creek.
What is the Median Population Age in Taylor Creek?
Median Population Age in Taylor Creek is 38.8 Years.
What is the Average Family Size in Taylor Creek
Average Family Size in Taylor Creek is 3.1 People.
What is the Average Household Size in Taylor Creek
Average Household Size in Taylor Creek is 2.7 People.
What is Per Capita Income in Taylor Creek?
Per Capita income in Taylor Creek is $42,792.
What is the Median Family Income in Taylor Creek?
Median Family Income in Taylor Creek is $110,228.
What is the Median Household income in Taylor Creek?
Median Household Income in Taylor Creek is $92,174.
What is Income or Wage Gap in Taylor Creek?
Income or Wage Gap in Taylor Creek is 31.5%.
Women in Taylor Creek earn 68.5 cents for every dollar earned by a man.
What is Inequality or Gini Index in Taylor Creek?
Inequality or Gini Index in Taylor Creek is 0.35.
How Large is the Labor Force in Taylor Creek?
There are 2,213 People in the Labor Forcein in Taylor Creek.
What is the Percentage of People in the Labor Force in Taylor Creek?
70.6% of People are in the Labor Force in Taylor Creek.
What is the Unemployment Rate in Taylor Creek?
Unemployment Rate in Taylor Creek is 1.5%.