Swanton, OH
Swanton Map
Swanton Overview
4,133
TOTAL POPULATION
2,108
MALE POPULATION
2,025
FEMALE POPULATION
104.10
MALES / 100 FEMALES
96.06
FEMALES / 100 MALES
39.1
MEDIAN AGE
3.0
AVG FAMILY SIZE
2.4
AVG HOUSEHOLD SIZE
$31,705
PER CAPITA INCOME
$67,958
AVG FAMILY INCOME
$67,367
AVG HOUSEHOLD INCOME
22.8%
WAGE / INCOME GAP [ % ]
77.2¢/ $1
WAGE / INCOME GAP [ $ ]
0.35
INEQUALITY / GINI INDEX
1,920
LABOR FORCE [ PEOPLE ]
59.2%
PERCENT IN LABOR FORCE
2.0%
UNEMPLOYMENT RATE
Swanton Zip Codes
Swanton Area Codes
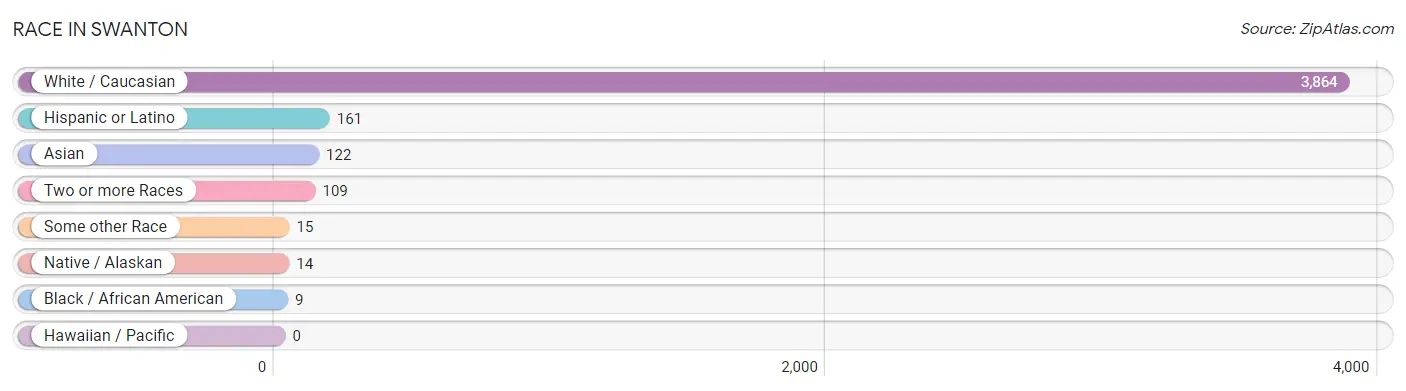
Race in Swanton
The most populous races in Swanton are White / Caucasian (3,864 | 93.5%), Hispanic or Latino (161 | 3.9%), and Asian (122 | 2.9%).
| Race | # Population | % Population |
| Asian | 122 | 2.9% |
| Black / African American | 9 | 0.2% |
| Hawaiian / Pacific | 0 | 0.0% |
| Hispanic or Latino | 161 | 3.9% |
| Native / Alaskan | 14 | 0.3% |
| White / Caucasian | 3,864 | 93.5% |
| Two or more Races | 109 | 2.6% |
| Some other Race | 15 | 0.4% |
| Total | 4,133 | 100.0% |
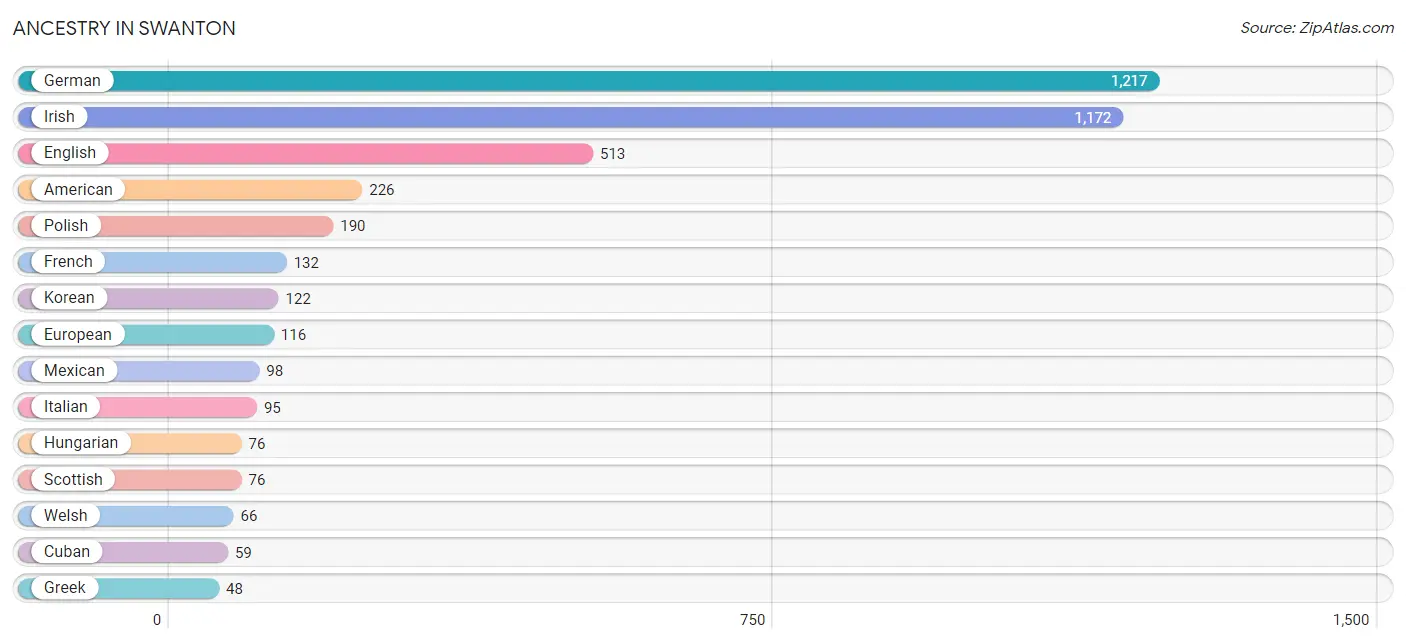
Ancestry in Swanton
The most populous ancestries reported in Swanton are German (1,217 | 29.4%), Irish (1,172 | 28.4%), English (513 | 12.4%), American (226 | 5.5%), and Polish (190 | 4.6%), together accounting for 80.3% of all Swanton residents.
| Ancestry | # Population | % Population |
| American | 226 | 5.5% |
| Arab | 22 | 0.5% |
| Austrian | 5 | 0.1% |
| British | 36 | 0.9% |
| Celtic | 5 | 0.1% |
| Cuban | 59 | 1.4% |
| Czechoslovakian | 23 | 0.6% |
| English | 513 | 12.4% |
| European | 116 | 2.8% |
| French | 132 | 3.2% |
| French Canadian | 7 | 0.2% |
| German | 1,217 | 29.4% |
| Greek | 48 | 1.2% |
| Hungarian | 76 | 1.8% |
| Irish | 1,172 | 28.4% |
| Italian | 95 | 2.3% |
| Korean | 122 | 2.9% |
| Lebanese | 22 | 0.5% |
| Macedonian | 8 | 0.2% |
| Mexican | 98 | 2.4% |
| Polish | 190 | 4.6% |
| Romanian | 8 | 0.2% |
| Russian | 14 | 0.3% |
| Scotch-Irish | 9 | 0.2% |
| Scottish | 76 | 1.8% |
| Slovak | 23 | 0.6% |
| Spanish | 4 | 0.1% |
| Swiss | 26 | 0.6% |
| Welsh | 66 | 1.6% |
| Yugoslavian | 11 | 0.3% | View All 30 Rows |
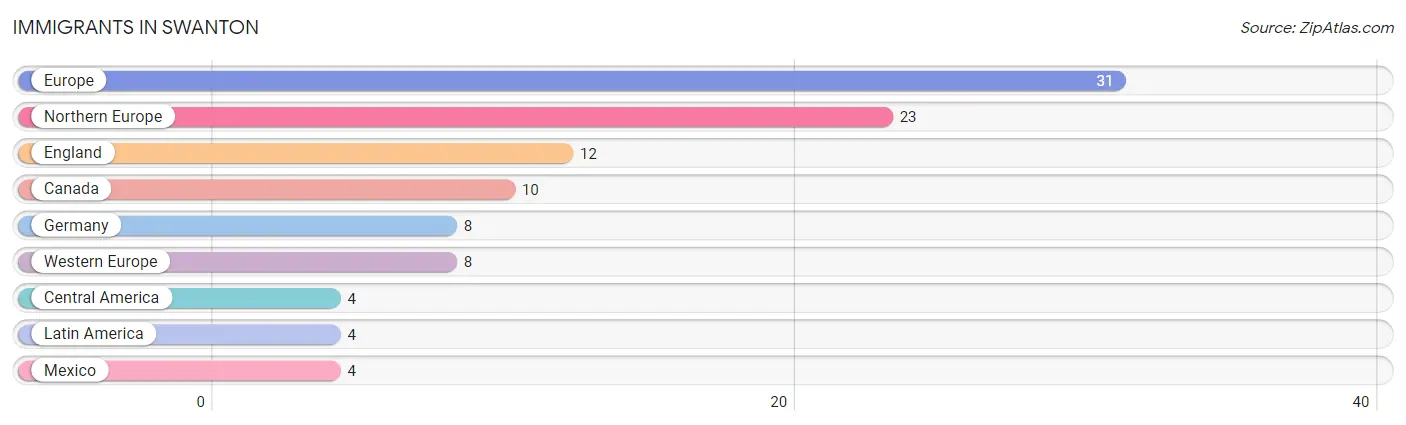
Immigrants in Swanton
The most numerous immigrant groups reported in Swanton came from Europe (31 | 0.7%), Northern Europe (23 | 0.6%), England (12 | 0.3%), Canada (10 | 0.2%), and Germany (8 | 0.2%), together accounting for 2.0% of all Swanton residents.
| Immigration Origin | # Population | % Population |
| Canada | 10 | 0.2% |
| Central America | 4 | 0.1% |
| England | 12 | 0.3% |
| Europe | 31 | 0.7% |
| Germany | 8 | 0.2% |
| Latin America | 4 | 0.1% |
| Mexico | 4 | 0.1% |
| Northern Europe | 23 | 0.6% |
| Western Europe | 8 | 0.2% | View All 9 Rows |
Sex and Age in Swanton
Sex and Age in Swanton
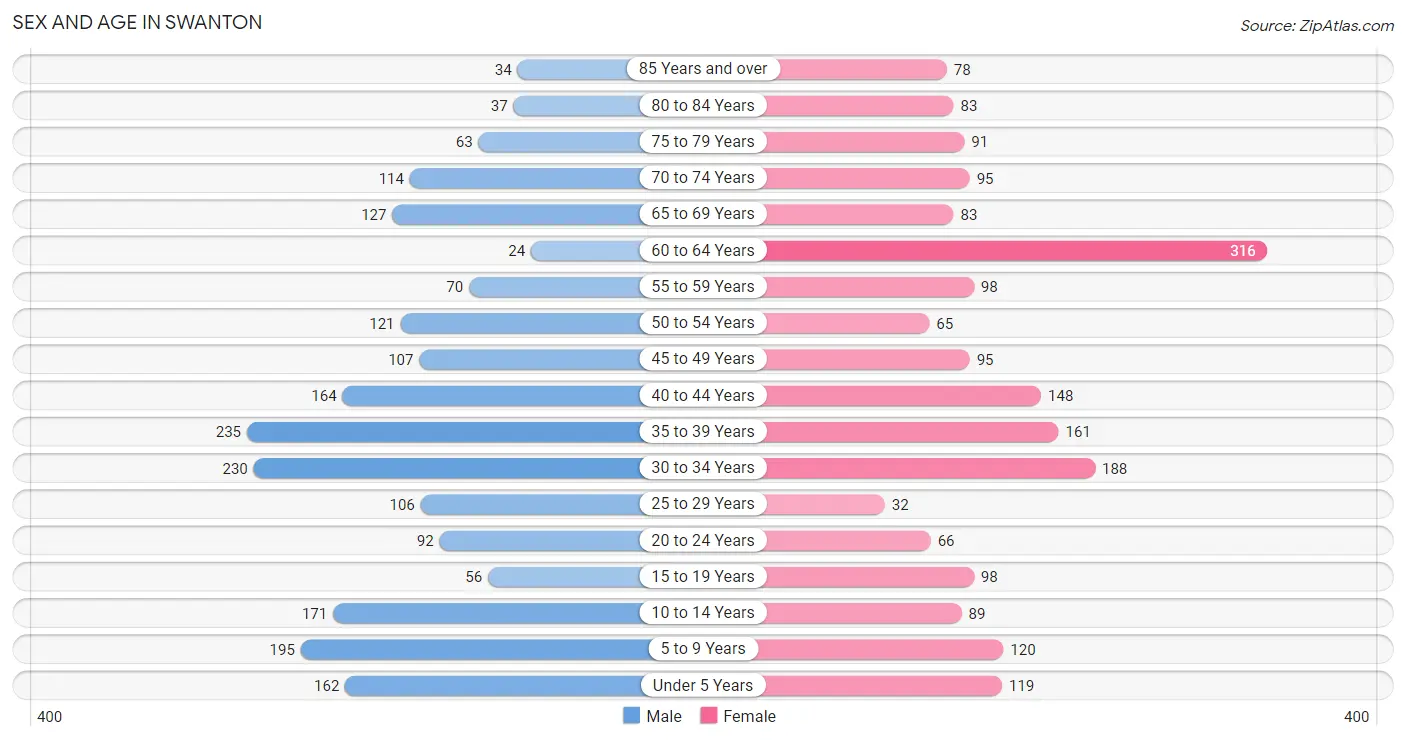
The most populous age groups in Swanton are 35 to 39 Years (235 | 11.2%) for men and 60 to 64 Years (316 | 15.6%) for women.
| Age Bracket | Male | Female |
| Under 5 Years | 162 (7.7%) | 119 (5.9%) |
| 5 to 9 Years | 195 (9.2%) | 120 (5.9%) |
| 10 to 14 Years | 171 (8.1%) | 89 (4.4%) |
| 15 to 19 Years | 56 (2.7%) | 98 (4.8%) |
| 20 to 24 Years | 92 (4.4%) | 66 (3.3%) |
| 25 to 29 Years | 106 (5.0%) | 32 (1.6%) |
| 30 to 34 Years | 230 (10.9%) | 188 (9.3%) |
| 35 to 39 Years | 235 (11.2%) | 161 (8.0%) |
| 40 to 44 Years | 164 (7.8%) | 148 (7.3%) |
| 45 to 49 Years | 107 (5.1%) | 95 (4.7%) |
| 50 to 54 Years | 121 (5.7%) | 65 (3.2%) |
| 55 to 59 Years | 70 (3.3%) | 98 (4.8%) |
| 60 to 64 Years | 24 (1.1%) | 316 (15.6%) |
| 65 to 69 Years | 127 (6.0%) | 83 (4.1%) |
| 70 to 74 Years | 114 (5.4%) | 95 (4.7%) |
| 75 to 79 Years | 63 (3.0%) | 91 (4.5%) |
| 80 to 84 Years | 37 (1.8%) | 83 (4.1%) |
| 85 Years and over | 34 (1.6%) | 78 (3.8%) |
| Total | 2,108 (100.0%) | 2,025 (100.0%) |
Families and Households in Swanton
Median Family Size in Swanton
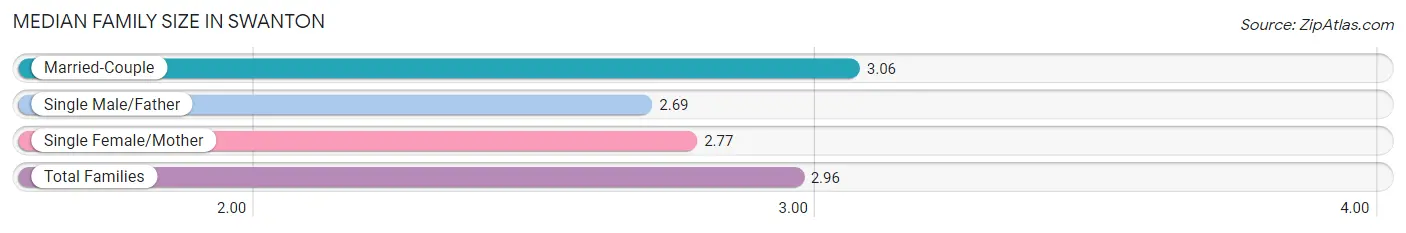
The median family size in Swanton is 2.96 persons per family, with married-couple families (721 | 64.5%) accounting for the largest median family size of 3.06 persons per family. On the other hand, single male/father families (45 | 4.0%) represent the smallest median family size with 2.69 persons per family.
| Family Type | # Families | Family Size |
| Married-Couple | 721 (64.5%) | 3.06 |
| Single Male/Father | 45 (4.0%) | 2.69 |
| Single Female/Mother | 352 (31.5%) | 2.77 |
| Total Families | 1,118 (100.0%) | 2.96 |
Median Household Size in Swanton
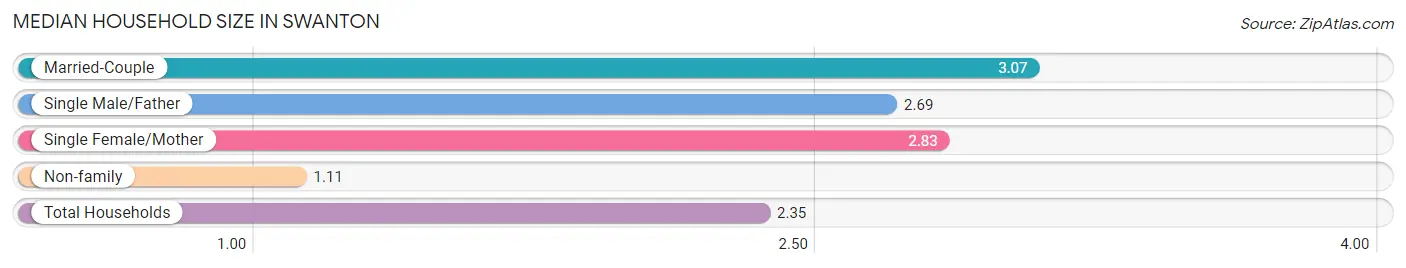
The median household size in Swanton is 2.35 persons per household, with married-couple households (721 | 42.6%) accounting for the largest median household size of 3.07 persons per household. non-family households (574 | 33.9%) represent the smallest median household size with 1.11 persons per household.
| Household Type | # Households | Household Size |
| Married-Couple | 721 (42.6%) | 3.07 |
| Single Male/Father | 45 (2.7%) | 2.69 |
| Single Female/Mother | 352 (20.8%) | 2.83 |
| Non-family | 574 (33.9%) | 1.11 |
| Total Households | 1,692 (100.0%) | 2.35 |
Household Size by Marriage Status in Swanton
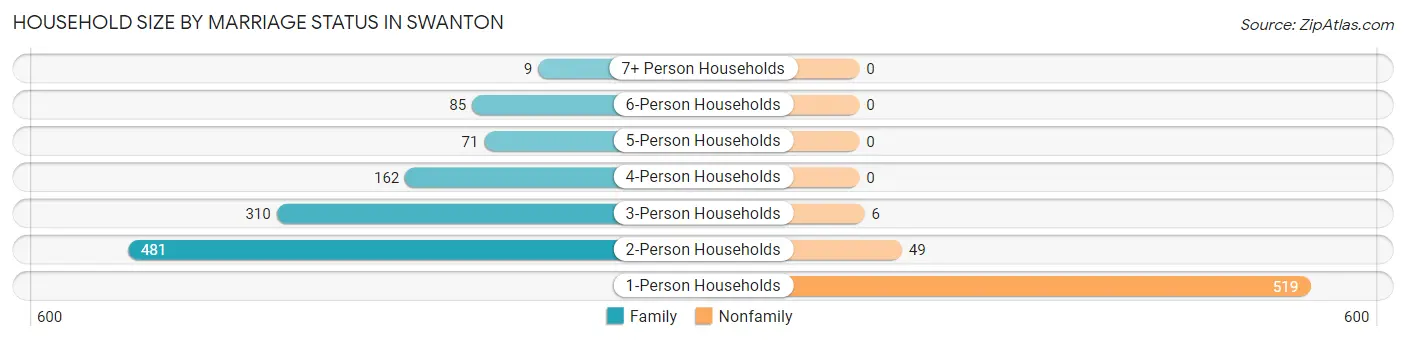
Out of a total of 1,692 households in Swanton, 1,118 (66.1%) are family households, while 574 (33.9%) are nonfamily households. The most numerous type of family households are 2-person households, comprising 481, and the most common type of nonfamily households are 1-person households, comprising 519.
| Household Size | Family Households | Nonfamily Households |
| 1-Person Households | - | 519 (30.7%) |
| 2-Person Households | 481 (28.4%) | 49 (2.9%) |
| 3-Person Households | 310 (18.3%) | 6 (0.4%) |
| 4-Person Households | 162 (9.6%) | 0 (0.0%) |
| 5-Person Households | 71 (4.2%) | 0 (0.0%) |
| 6-Person Households | 85 (5.0%) | 0 (0.0%) |
| 7+ Person Households | 9 (0.5%) | 0 (0.0%) |
| Total | 1,118 (66.1%) | 574 (33.9%) |
Female Fertility in Swanton
Fertility by Age in Swanton
| Age Bracket | Women with Births | Births / 1,000 Women |
| 15 to 19 years | 0 (0.0%) | 0.0 |
| 20 to 34 years | 0 (0.0%) | 0.0 |
| 35 to 50 years | 0 (0.0%) | 0.0 |
| Total | 0 (0.0%) | 0.0 |
Fertility by Age by Marriage Status in Swanton
| Age Bracket | Married | Unmarried |
| 15 to 19 years | 0 (0.0%) | 0 (0.0%) |
| 20 to 34 years | 0 (0.0%) | 0 (0.0%) |
| 35 to 50 years | 0 (0.0%) | 0 (0.0%) |
| Total | 0 (0.0%) | 0 (0.0%) |
Fertility by Education in Swanton
| Educational Attainment | Women with Births | Births / 1,000 Women |
| Less than High School | 0 (0.0%) | 0.0 |
| High School Diploma | 0 (0.0%) | 0.0 |
| College or Associate's Degree | 0 (0.0%) | 0.0 |
| Bachelor's Degree | 0 (0.0%) | 0.0 |
| Graduate Degree | 0 (0.0%) | 0.0 |
| Total | 0 (0.0%) | 0.0 |
Fertility by Education by Marriage Status in Swanton
| Educational Attainment | Married | Unmarried |
| Less than High School | 0 (0.0%) | 0 (0.0%) |
| High School Diploma | 0 (0.0%) | 0 (0.0%) |
| College or Associate's Degree | 0 (0.0%) | 0 (0.0%) |
| Bachelor's Degree | 0 (0.0%) | 0 (0.0%) |
| Graduate Degree | 0 (0.0%) | 0 (0.0%) |
| Total | 0 (0.0%) | 0 (0.0%) |
Income in Swanton
Income Overview in Swanton
Per Capita Income in Swanton is $31,705, while median incomes of families and households are $67,958 and $67,367 respectively.
| Characteristic | Number | Measure |
| Per Capita Income | 4,133 | $31,705 |
| Median Family Income | 1,118 | $67,958 |
| Mean Family Income | 1,118 | $79,862 |
| Median Household Income | 1,692 | $67,367 |
| Mean Household Income | 1,692 | $76,898 |
| Income Deficit | 1,118 | $0 |
| Wage / Income Gap (%) | 4,133 | 22.84% |
| Wage / Income Gap ($) | 4,133 | 77.16¢ per $1 |
| Gini / Inequality Index | 4,133 | 0.35 |
Earnings by Sex in Swanton
Average Earnings in Swanton are $34,009, $38,547 for men and $29,742 for women, a difference of 22.8%.
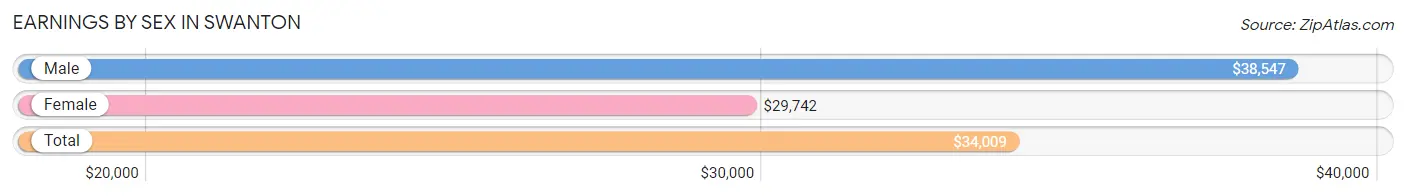
| Sex | Number | Average Earnings |
| Male | 1,114 (57.5%) | $38,547 |
| Female | 824 (42.5%) | $29,742 |
| Total | 1,938 (100.0%) | $34,009 |
Earnings by Sex by Income Bracket in Swanton
The most common earnings brackets in Swanton are $20,000 to $22,499 for men (162 | 14.5%) and $45,000 to $49,999 for women (103 | 12.5%).
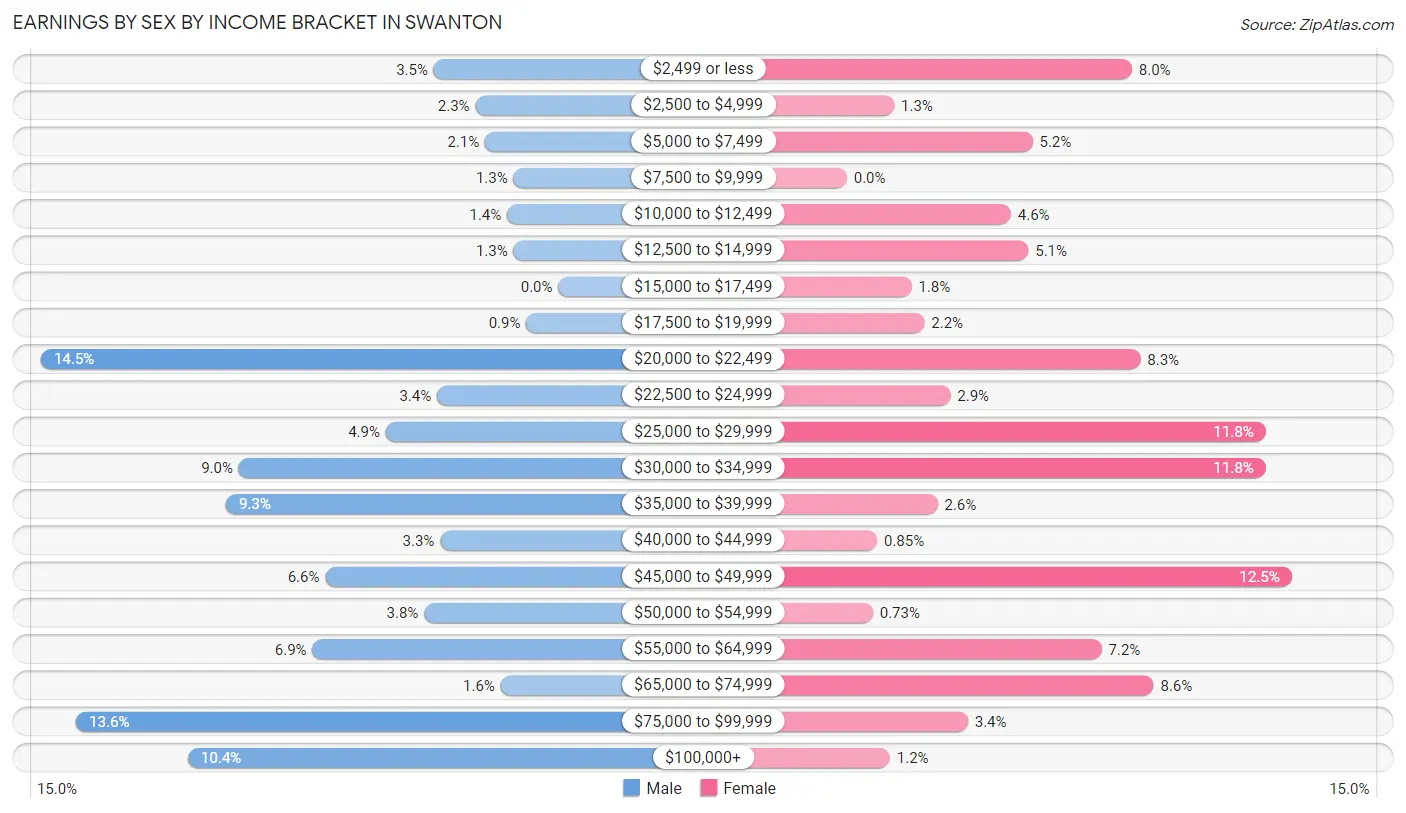
| Income | Male | Female |
| $2,499 or less | 39 (3.5%) | 66 (8.0%) |
| $2,500 to $4,999 | 26 (2.3%) | 11 (1.3%) |
| $5,000 to $7,499 | 23 (2.1%) | 43 (5.2%) |
| $7,500 to $9,999 | 14 (1.3%) | 0 (0.0%) |
| $10,000 to $12,499 | 16 (1.4%) | 38 (4.6%) |
| $12,500 to $14,999 | 14 (1.3%) | 42 (5.1%) |
| $15,000 to $17,499 | 0 (0.0%) | 15 (1.8%) |
| $17,500 to $19,999 | 10 (0.9%) | 18 (2.2%) |
| $20,000 to $22,499 | 162 (14.5%) | 68 (8.3%) |
| $22,500 to $24,999 | 38 (3.4%) | 24 (2.9%) |
| $25,000 to $29,999 | 54 (4.9%) | 97 (11.8%) |
| $30,000 to $34,999 | 100 (9.0%) | 97 (11.8%) |
| $35,000 to $39,999 | 104 (9.3%) | 21 (2.5%) |
| $40,000 to $44,999 | 37 (3.3%) | 7 (0.9%) |
| $45,000 to $49,999 | 73 (6.6%) | 103 (12.5%) |
| $50,000 to $54,999 | 42 (3.8%) | 6 (0.7%) |
| $55,000 to $64,999 | 77 (6.9%) | 59 (7.2%) |
| $65,000 to $74,999 | 18 (1.6%) | 71 (8.6%) |
| $75,000 to $99,999 | 151 (13.6%) | 28 (3.4%) |
| $100,000+ | 116 (10.4%) | 10 (1.2%) |
| Total | 1,114 (100.0%) | 824 (100.0%) |
Earnings by Sex by Educational Attainment in Swanton
Average earnings in Swanton are $43,261 for men and $31,017 for women, a difference of 28.3%. Men with an educational attainment of graduate degree enjoy the highest average annual earnings of $101,667, while those with high school diploma education earn the least with $37,250. Women with an educational attainment of graduate degree earn the most with the average annual earnings of $73,417, while those with high school diploma education have the smallest earnings of $24,821.
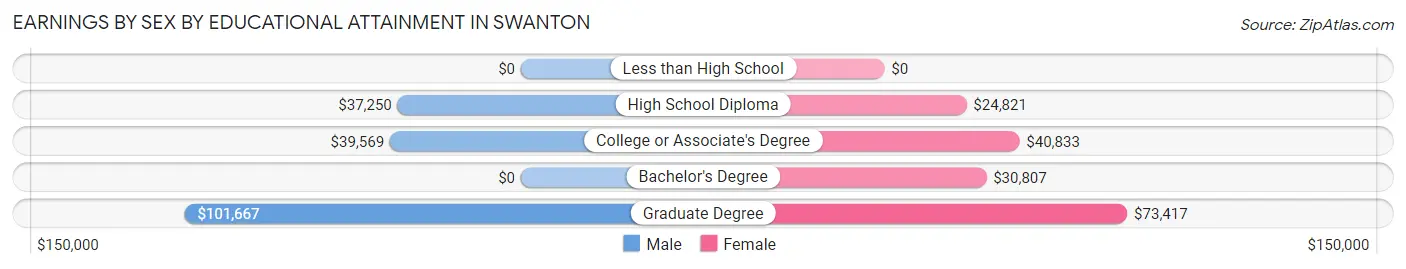
| Educational Attainment | Male Income | Female Income |
| Less than High School | - | - |
| High School Diploma | $37,250 | $24,821 |
| College or Associate's Degree | $39,569 | $40,833 |
| Bachelor's Degree | - | - |
| Graduate Degree | $101,667 | $73,417 |
| Total | $43,261 | $31,017 |
Family Income in Swanton
Family Income Brackets in Swanton
According to the Swanton family income data, there are 410 families falling into the $50,000 to $74,999 income range, which is the most common income bracket and makes up 36.7% of all families. Conversely, the less than $10,000 income bracket is the least frequent group with only 7 families (0.6%) belonging to this category.
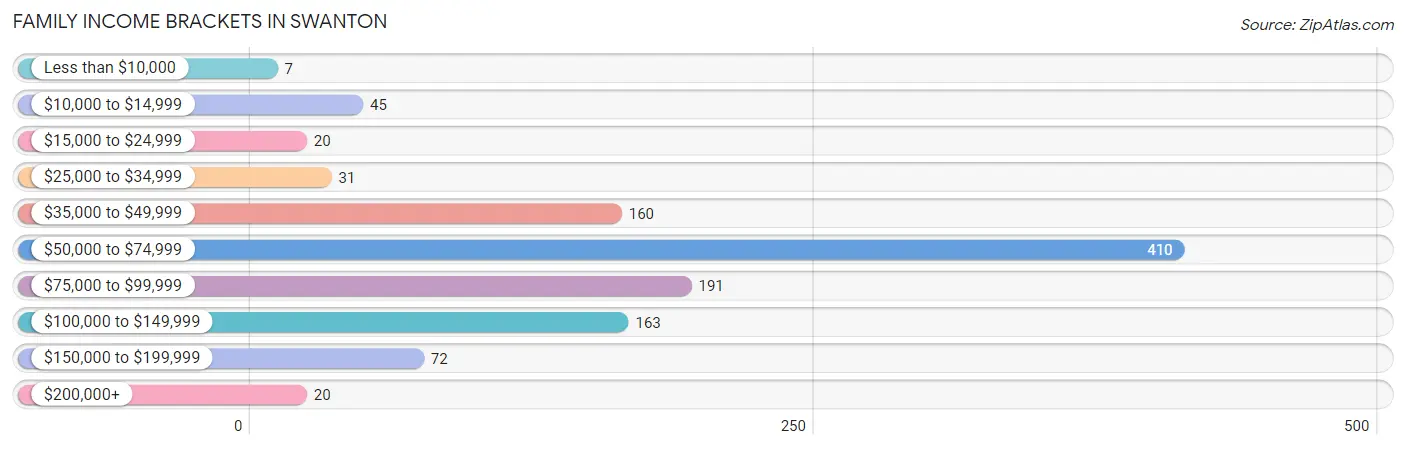
| Income Bracket | # Families | % Families |
| Less than $10,000 | 7 | 0.6% |
| $10,000 to $14,999 | 45 | 4.0% |
| $15,000 to $24,999 | 20 | 1.8% |
| $25,000 to $34,999 | 31 | 2.8% |
| $35,000 to $49,999 | 160 | 14.3% |
| $50,000 to $74,999 | 410 | 36.7% |
| $75,000 to $99,999 | 191 | 17.1% |
| $100,000 to $149,999 | 163 | 14.6% |
| $150,000 to $199,999 | 72 | 6.4% |
| $200,000+ | 20 | 1.8% |
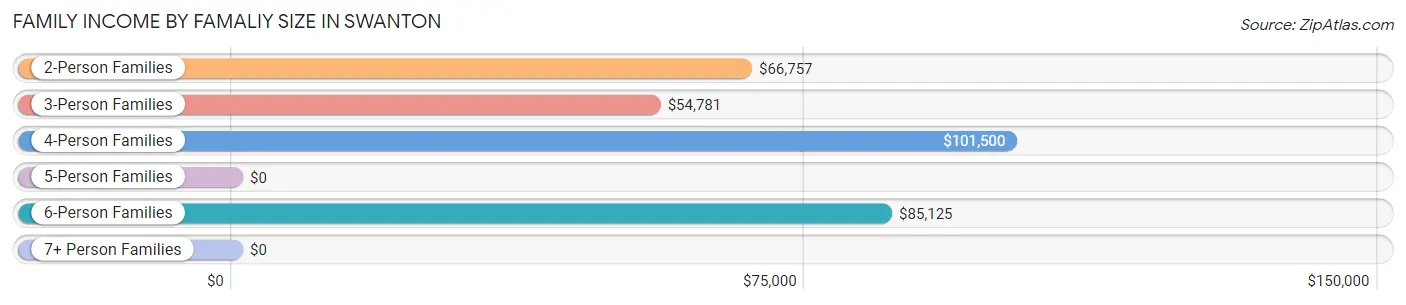
Family Income by Famaliy Size in Swanton
4-person families (168 | 15.0%) account for the highest median family income in Swanton with $101,500 per family, while 2-person families (481 | 43.0%) have the highest median income of $33,378 per family member.
| Income Bracket | # Families | Median Income |
| 2-Person Families | 481 (43.0%) | $66,757 |
| 3-Person Families | 322 (28.8%) | $54,781 |
| 4-Person Families | 168 (15.0%) | $101,500 |
| 5-Person Families | 53 (4.7%) | $0 |
| 6-Person Families | 85 (7.6%) | $85,125 |
| 7+ Person Families | 9 (0.8%) | $0 |
| Total | 1,118 (100.0%) | $67,958 |
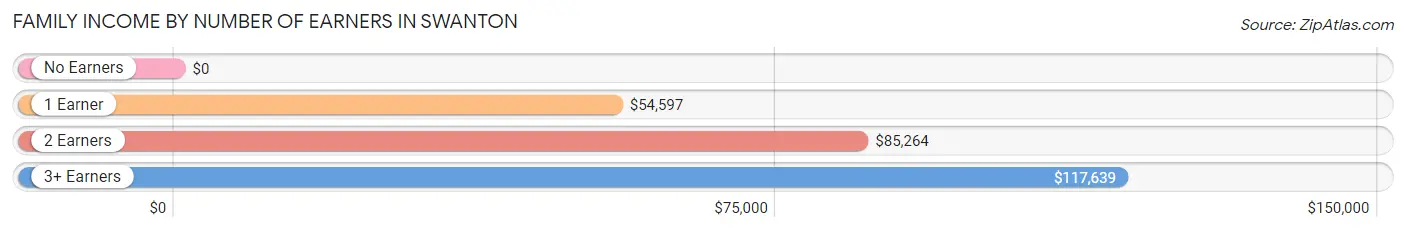
Family Income by Number of Earners in Swanton
| Number of Earners | # Families | Median Income |
| No Earners | 112 (10.0%) | $0 |
| 1 Earner | 522 (46.7%) | $54,597 |
| 2 Earners | 407 (36.4%) | $85,264 |
| 3+ Earners | 77 (6.9%) | $117,639 |
| Total | 1,118 (100.0%) | $67,958 |
Household Income in Swanton
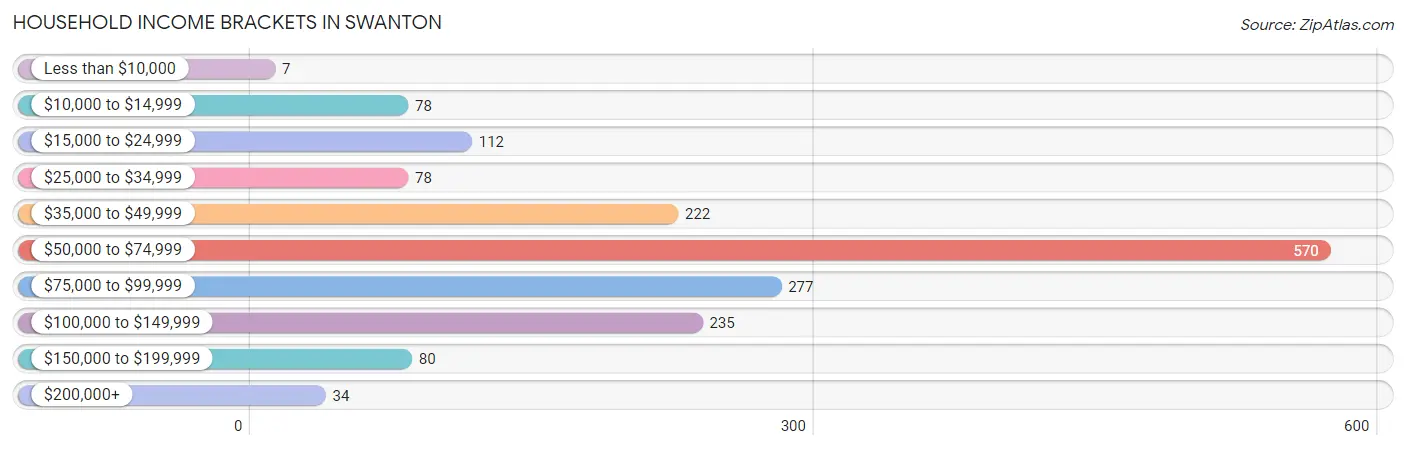
Household Income Brackets in Swanton
With 570 households falling in the category, the $50,000 to $74,999 income range is the most frequent in Swanton, accounting for 33.7% of all households. In contrast, only 7 households (0.4%) fall into the less than $10,000 income bracket, making it the least populous group.
| Income Bracket | # Households | % Households |
| Less than $10,000 | 7 | 0.4% |
| $10,000 to $14,999 | 78 | 4.6% |
| $15,000 to $24,999 | 112 | 6.6% |
| $25,000 to $34,999 | 78 | 4.6% |
| $35,000 to $49,999 | 222 | 13.1% |
| $50,000 to $74,999 | 570 | 33.7% |
| $75,000 to $99,999 | 277 | 16.4% |
| $100,000 to $149,999 | 235 | 13.9% |
| $150,000 to $199,999 | 80 | 4.7% |
| $200,000+ | 34 | 2.0% |
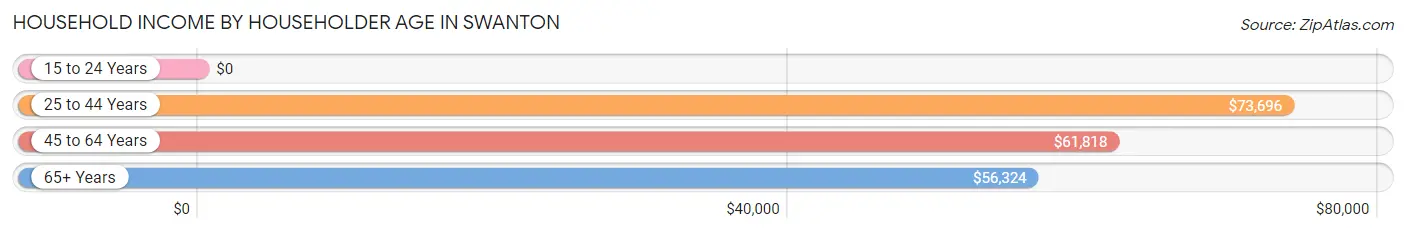
Household Income by Householder Age in Swanton
The median household income in Swanton is $67,367, with the highest median household income of $73,696 found in the 25 to 44 years age bracket for the primary householder. A total of 552 households (32.6%) fall into this category. Meanwhile, the 15 to 24 years age bracket for the primary householder has the lowest median household income of $0, with 18 households (1.1%) in this group.
| Income Bracket | # Households | Median Income |
| 15 to 24 Years | 18 (1.1%) | $0 |
| 25 to 44 Years | 552 (32.6%) | $73,696 |
| 45 to 64 Years | 632 (37.3%) | $61,818 |
| 65+ Years | 490 (29.0%) | $56,324 |
| Total | 1,692 (100.0%) | $67,367 |
Poverty in Swanton
Income Below Poverty by Sex and Age in Swanton
With 6.6% poverty level for males and 9.1% for females among the residents of Swanton, 6 to 11 year old males and 5 year old females are the most vulnerable to poverty, with 53 males (22.1%) and 8 females (44.4%) in their respective age groups living below the poverty level.
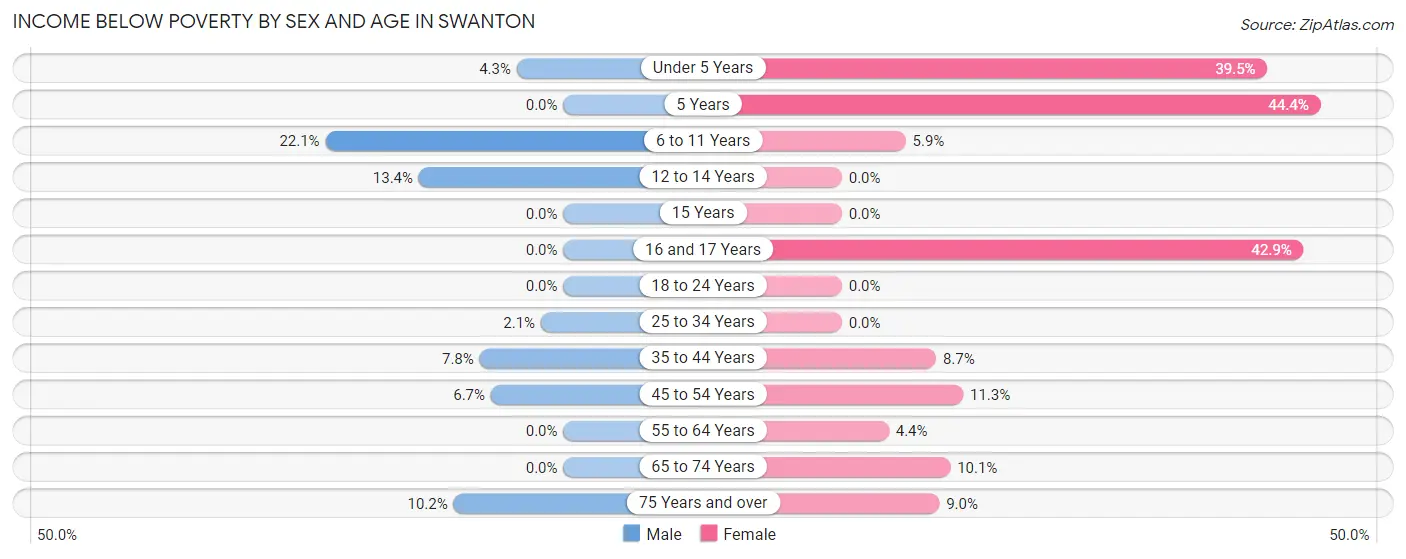
| Age Bracket | Male | Female |
| Under 5 Years | 7 (4.3%) | 47 (39.5%) |
| 5 Years | 0 (0.0%) | 8 (44.4%) |
| 6 to 11 Years | 53 (22.1%) | 9 (5.9%) |
| 12 to 14 Years | 11 (13.4%) | 0 (0.0%) |
| 15 Years | 0 (0.0%) | 0 (0.0%) |
| 16 and 17 Years | 0 (0.0%) | 15 (42.9%) |
| 18 to 24 Years | 0 (0.0%) | 0 (0.0%) |
| 25 to 34 Years | 7 (2.1%) | 0 (0.0%) |
| 35 to 44 Years | 31 (7.8%) | 27 (8.7%) |
| 45 to 54 Years | 15 (6.7%) | 18 (11.3%) |
| 55 to 64 Years | 0 (0.0%) | 17 (4.4%) |
| 65 to 74 Years | 0 (0.0%) | 16 (10.1%) |
| 75 Years and over | 11 (10.2%) | 16 (9.0%) |
| Total | 135 (6.6%) | 173 (9.1%) |
Income Above Poverty by Sex and Age in Swanton
According to the poverty statistics in Swanton, males aged 5 years and females aged 12 to 14 years are the age groups that are most secure financially, with 100.0% of males and 100.0% of females in these age groups living above the poverty line.
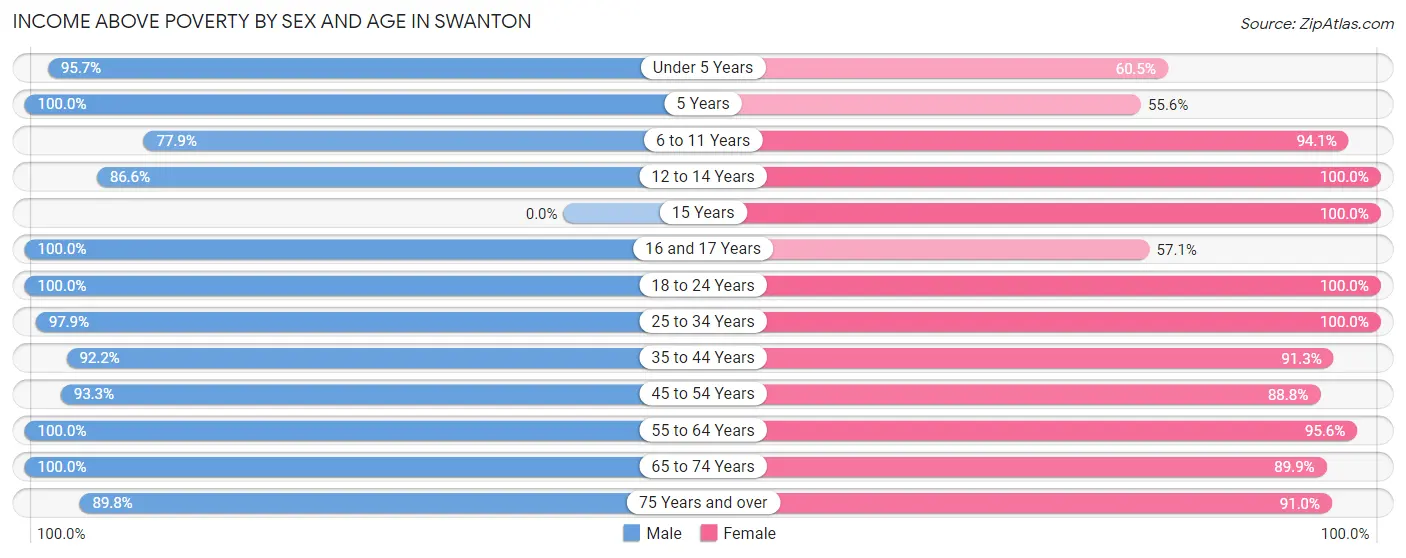
| Age Bracket | Male | Female |
| Under 5 Years | 155 (95.7%) | 72 (60.5%) |
| 5 Years | 44 (100.0%) | 10 (55.6%) |
| 6 to 11 Years | 187 (77.9%) | 143 (94.1%) |
| 12 to 14 Years | 71 (86.6%) | 39 (100.0%) |
| 15 Years | 0 (0.0%) | 33 (100.0%) |
| 16 and 17 Years | 49 (100.0%) | 20 (57.1%) |
| 18 to 24 Years | 99 (100.0%) | 96 (100.0%) |
| 25 to 34 Years | 329 (97.9%) | 220 (100.0%) |
| 35 to 44 Years | 368 (92.2%) | 282 (91.3%) |
| 45 to 54 Years | 208 (93.3%) | 142 (88.7%) |
| 55 to 64 Years | 89 (100.0%) | 373 (95.6%) |
| 65 to 74 Years | 230 (100.0%) | 143 (89.9%) |
| 75 Years and over | 97 (89.8%) | 161 (91.0%) |
| Total | 1,926 (93.4%) | 1,734 (90.9%) |
Income Below Poverty Among Married-Couple Families in Swanton
The poverty statistics for married-couple families in Swanton show that 5.0% or 36 of the total 721 families live below the poverty line. Families with 5 or more children have the highest poverty rate of 100.0%, comprising of 9 families. On the other hand, families with 1 or 2 children have the lowest poverty rate of 0.0%, which includes 0 families.
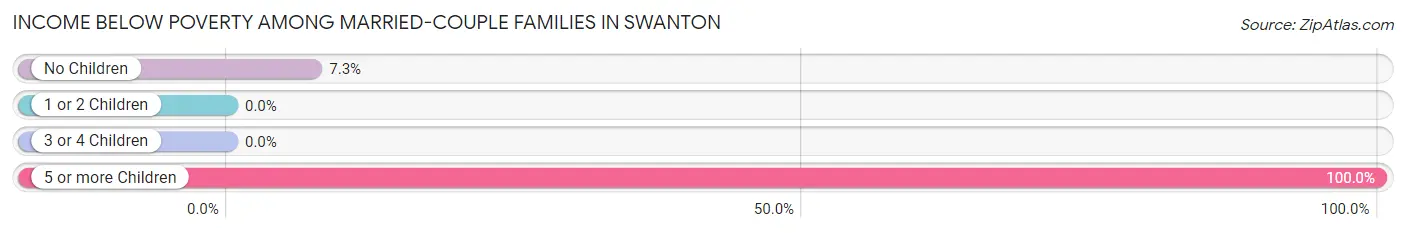
| Children | Above Poverty | Below Poverty |
| No Children | 341 (92.7%) | 27 (7.3%) |
| 1 or 2 Children | 258 (100.0%) | 0 (0.0%) |
| 3 or 4 Children | 86 (100.0%) | 0 (0.0%) |
| 5 or more Children | 0 (0.0%) | 9 (100.0%) |
| Total | 685 (95.0%) | 36 (5.0%) |
Income Below Poverty Among Single-Parent Households in Swanton
According to the poverty data in Swanton, 15.6% or 7 single-father households and 5.1% or 18 single-mother households are living below the poverty line. Among single-father households, those with 1 or 2 children have the highest poverty rate, with 7 households (41.2%) experiencing poverty. Likewise, among single-mother households, those with 3 or 4 children have the highest poverty rate, with 18 households (50.0%) falling below the poverty line.
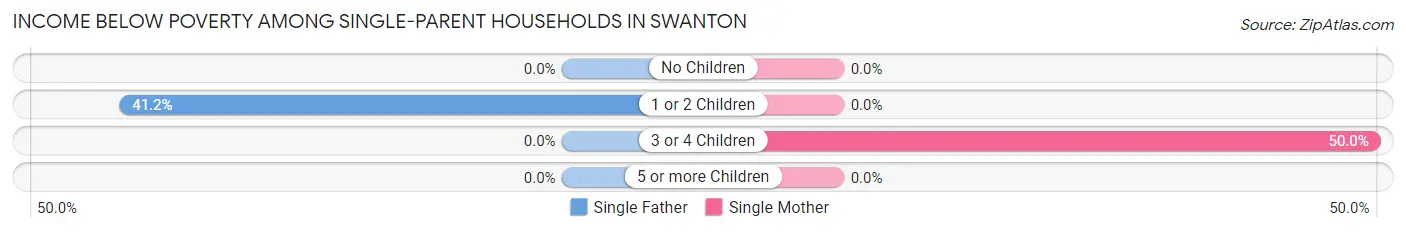
| Children | Single Father | Single Mother |
| No Children | 0 (0.0%) | 0 (0.0%) |
| 1 or 2 Children | 7 (41.2%) | 0 (0.0%) |
| 3 or 4 Children | 0 (0.0%) | 18 (50.0%) |
| 5 or more Children | 0 (0.0%) | 0 (0.0%) |
| Total | 7 (15.6%) | 18 (5.1%) |
Income Below Poverty Among Married-Couple vs Single-Parent Households in Swanton
The poverty data for Swanton shows that 36 of the married-couple family households (5.0%) and 25 of the single-parent households (6.3%) are living below the poverty level. Within the married-couple family households, those with 5 or more children have the highest poverty rate, with 9 households (100.0%) falling below the poverty line. Among the single-parent households, those with 3 or 4 children have the highest poverty rate, with 18 household (41.9%) living below poverty.
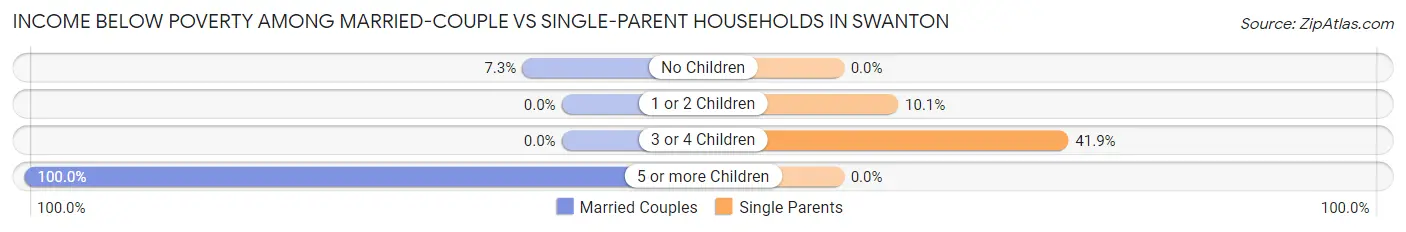
| Children | Married-Couple Families | Single-Parent Households |
| No Children | 27 (7.3%) | 0 (0.0%) |
| 1 or 2 Children | 0 (0.0%) | 7 (10.1%) |
| 3 or 4 Children | 0 (0.0%) | 18 (41.9%) |
| 5 or more Children | 9 (100.0%) | 0 (0.0%) |
| Total | 36 (5.0%) | 25 (6.3%) |
Employment Characteristics in Swanton
Employment by Class of Employer in Swanton
Among the 1,866 employed individuals in Swanton, private company employees (1,255 | 67.3%), not-for-profit organizations (150 | 8.0%), and local government employees (141 | 7.6%) make up the most common classes of employment.
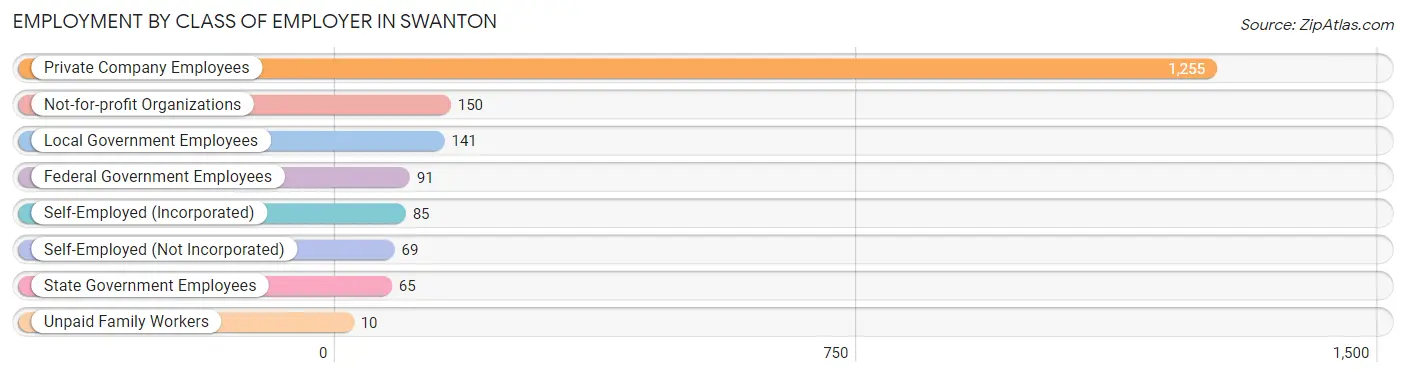
| Employer Class | # Employees | % Employees |
| Private Company Employees | 1,255 | 67.3% |
| Self-Employed (Incorporated) | 85 | 4.6% |
| Self-Employed (Not Incorporated) | 69 | 3.7% |
| Not-for-profit Organizations | 150 | 8.0% |
| Local Government Employees | 141 | 7.6% |
| State Government Employees | 65 | 3.5% |
| Federal Government Employees | 91 | 4.9% |
| Unpaid Family Workers | 10 | 0.5% |
| Total | 1,866 | 100.0% |
Employment Status by Age in Swanton
According to the labor force statistics for Swanton, out of the total population over 16 years of age (3,244), 59.2% or 1,920 individuals are in the labor force, with 2.0% or 38 of them unemployed. The age group with the highest labor force participation rate is 20 to 24 years, with 88.6% or 140 individuals in the labor force. Within the labor force, the 25 to 29 years age range has the highest percentage of unemployed individuals, with 17.9% or 7 of them being unemployed.
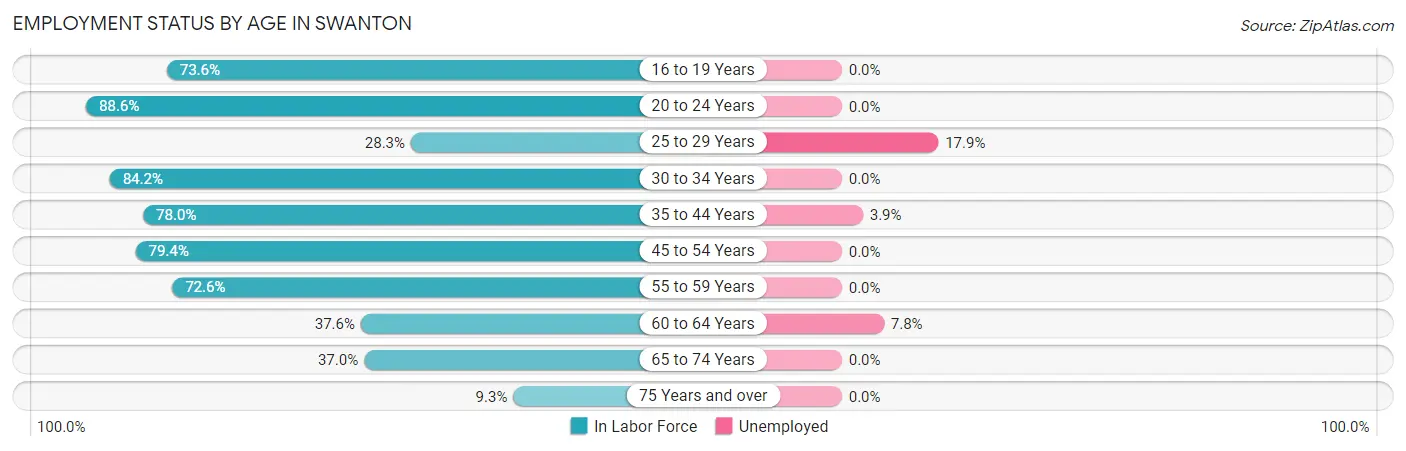
| Age Bracket | In Labor Force | Unemployed |
| 16 to 19 Years | 89 (73.6%) | 0 (0.0%) |
| 20 to 24 Years | 140 (88.6%) | 0 (0.0%) |
| 25 to 29 Years | 39 (28.3%) | 7 (17.9%) |
| 30 to 34 Years | 352 (84.2%) | 0 (0.0%) |
| 35 to 44 Years | 552 (78.0%) | 22 (3.9%) |
| 45 to 54 Years | 308 (79.4%) | 0 (0.0%) |
| 55 to 59 Years | 122 (72.6%) | 0 (0.0%) |
| 60 to 64 Years | 128 (37.6%) | 10 (7.8%) |
| 65 to 74 Years | 155 (37.0%) | 0 (0.0%) |
| 75 Years and over | 36 (9.3%) | 0 (0.0%) |
| Total | 1,920 (59.2%) | 38 (2.0%) |
Employment Status by Educational Attainment in Swanton
According to labor force statistics for Swanton, 69.5% of individuals (1,501) out of the total population between 25 and 64 years of age (2,160) are in the labor force, with 2.6% or 39 of them being unemployed. The group with the highest labor force participation rate are those with the educational attainment of bachelor's degree or higher, with 91.3% or 335 individuals in the labor force. Within the labor force, individuals with college / associate degree education have the highest percentage of unemployment, with 3.2% or 21 of them being unemployed.
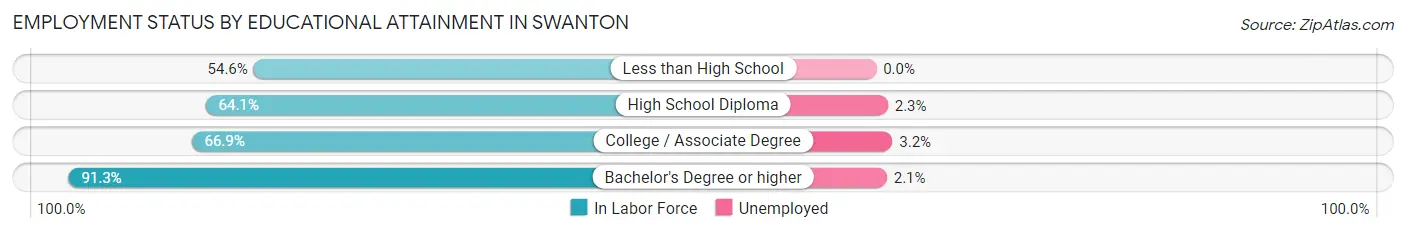
| Educational Attainment | In Labor Force | Unemployed |
| Less than High School | 65 (54.6%) | 0 (0.0%) |
| High School Diploma | 441 (64.1%) | 16 (2.3%) |
| College / Associate Degree | 660 (66.9%) | 32 (3.2%) |
| Bachelor's Degree or higher | 335 (91.3%) | 8 (2.1%) |
| Total | 1,501 (69.5%) | 56 (2.6%) |
Employment Occupations by Sex in Swanton
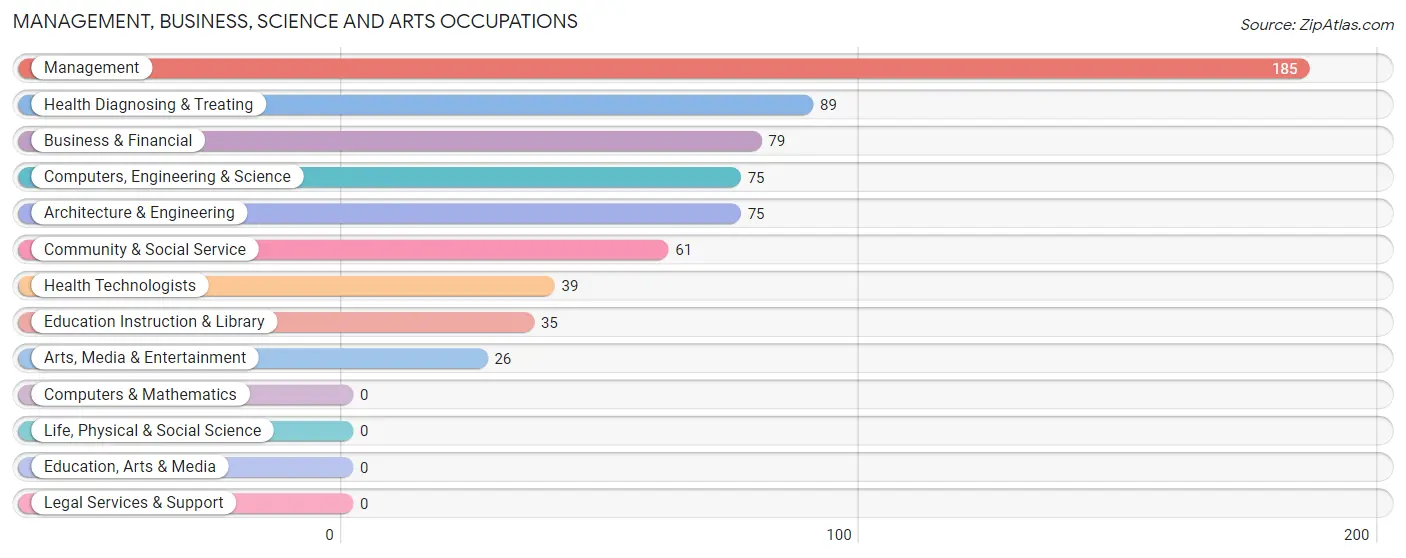
Management, Business, Science and Arts Occupations
The most common Management, Business, Science and Arts occupations in Swanton are Management (185 | 9.9%), Health Diagnosing & Treating (89 | 4.8%), Business & Financial (79 | 4.2%), Computers, Engineering & Science (75 | 4.0%), and Architecture & Engineering (75 | 4.0%).
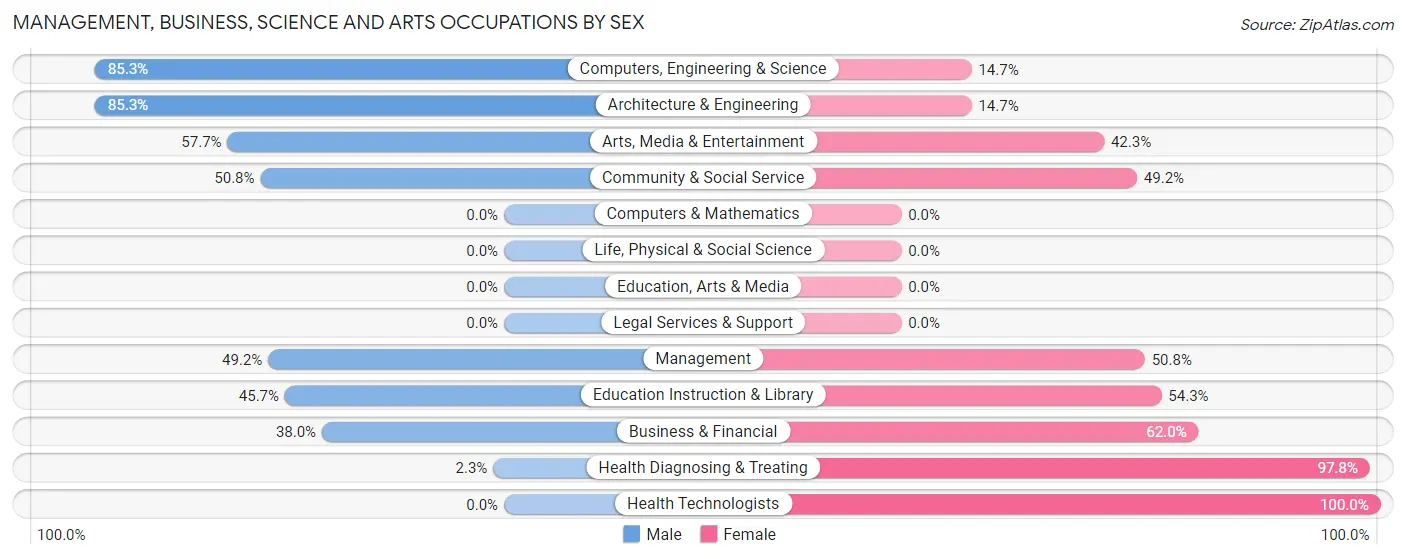
Management, Business, Science and Arts Occupations by Sex
Within the Management, Business, Science and Arts occupations in Swanton, the most male-oriented occupations are Computers, Engineering & Science (85.3%), Architecture & Engineering (85.3%), and Arts, Media & Entertainment (57.7%), while the most female-oriented occupations are Health Technologists (100.0%), Health Diagnosing & Treating (97.8%), and Business & Financial (62.0%).
| Occupation | Male | Female |
| Management | 91 (49.2%) | 94 (50.8%) |
| Business & Financial | 30 (38.0%) | 49 (62.0%) |
| Computers, Engineering & Science | 64 (85.3%) | 11 (14.7%) |
| Computers & Mathematics | 0 (0.0%) | 0 (0.0%) |
| Architecture & Engineering | 64 (85.3%) | 11 (14.7%) |
| Life, Physical & Social Science | 0 (0.0%) | 0 (0.0%) |
| Community & Social Service | 31 (50.8%) | 30 (49.2%) |
| Education, Arts & Media | 0 (0.0%) | 0 (0.0%) |
| Legal Services & Support | 0 (0.0%) | 0 (0.0%) |
| Education Instruction & Library | 16 (45.7%) | 19 (54.3%) |
| Arts, Media & Entertainment | 15 (57.7%) | 11 (42.3%) |
| Health Diagnosing & Treating | 2 (2.2%) | 87 (97.8%) |
| Health Technologists | 0 (0.0%) | 39 (100.0%) |
| Total (Category) | 218 (44.6%) | 271 (55.4%) |
| Total (Overall) | 1,097 (58.7%) | 773 (41.3%) |
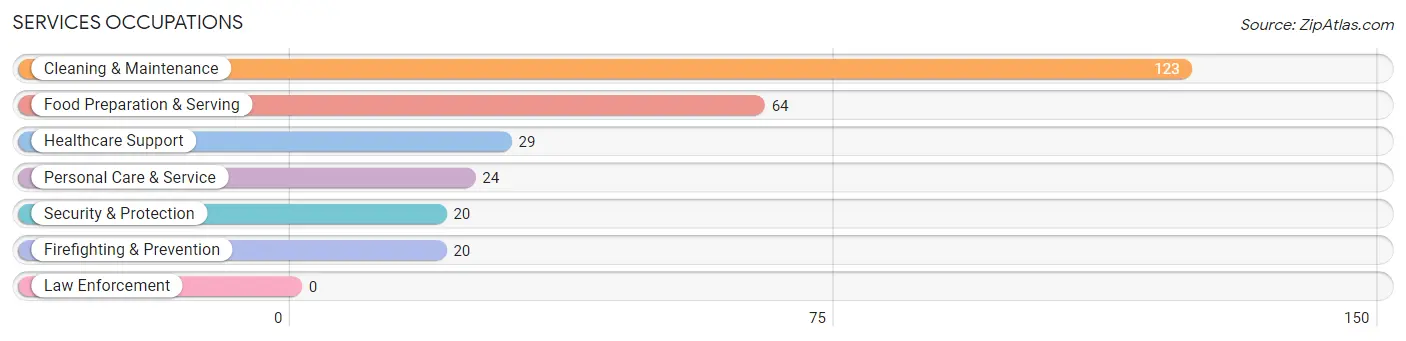
Services Occupations
The most common Services occupations in Swanton are Cleaning & Maintenance (123 | 6.6%), Food Preparation & Serving (64 | 3.4%), Healthcare Support (29 | 1.5%), Personal Care & Service (24 | 1.3%), and Security & Protection (20 | 1.1%).
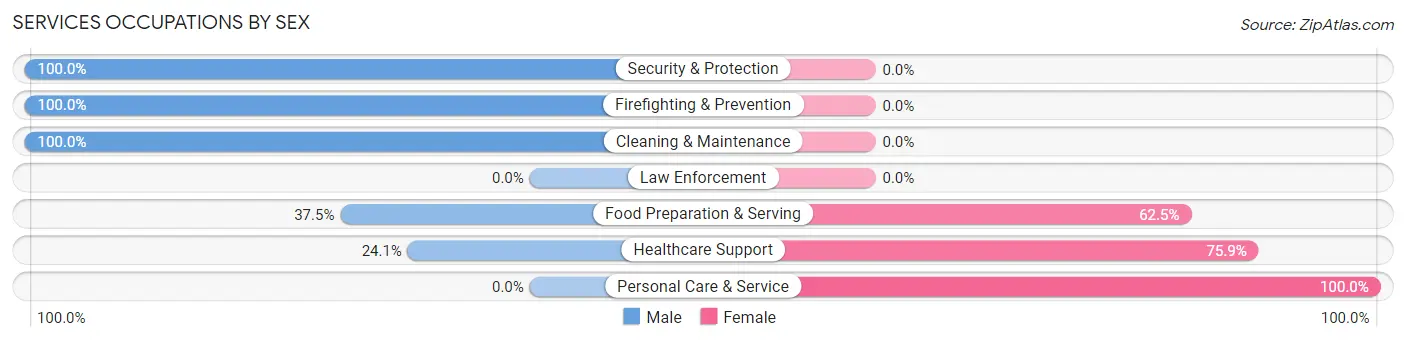
Services Occupations by Sex
Within the Services occupations in Swanton, the most male-oriented occupations are Security & Protection (100.0%), Firefighting & Prevention (100.0%), and Cleaning & Maintenance (100.0%), while the most female-oriented occupations are Personal Care & Service (100.0%), Healthcare Support (75.9%), and Food Preparation & Serving (62.5%).
| Occupation | Male | Female |
| Healthcare Support | 7 (24.1%) | 22 (75.9%) |
| Security & Protection | 20 (100.0%) | 0 (0.0%) |
| Firefighting & Prevention | 20 (100.0%) | 0 (0.0%) |
| Law Enforcement | 0 (0.0%) | 0 (0.0%) |
| Food Preparation & Serving | 24 (37.5%) | 40 (62.5%) |
| Cleaning & Maintenance | 123 (100.0%) | 0 (0.0%) |
| Personal Care & Service | 0 (0.0%) | 24 (100.0%) |
| Total (Category) | 174 (66.9%) | 86 (33.1%) |
| Total (Overall) | 1,097 (58.7%) | 773 (41.3%) |
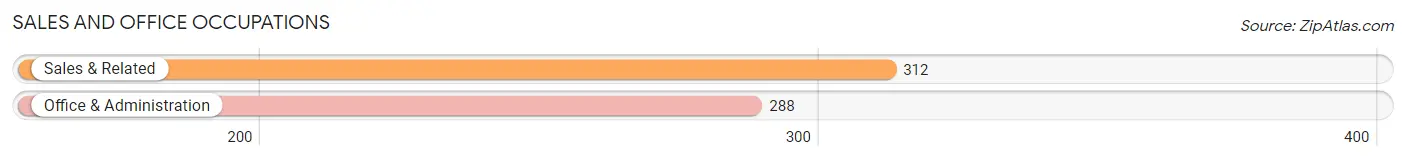
Sales and Office Occupations
The most common Sales and Office occupations in Swanton are Sales & Related (312 | 16.7%), and Office & Administration (288 | 15.4%).
Sales and Office Occupations by Sex
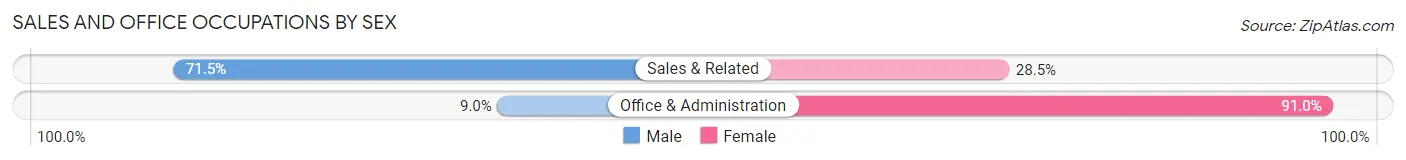
| Occupation | Male | Female |
| Sales & Related | 223 (71.5%) | 89 (28.5%) |
| Office & Administration | 26 (9.0%) | 262 (91.0%) |
| Total (Category) | 249 (41.5%) | 351 (58.5%) |
| Total (Overall) | 1,097 (58.7%) | 773 (41.3%) |
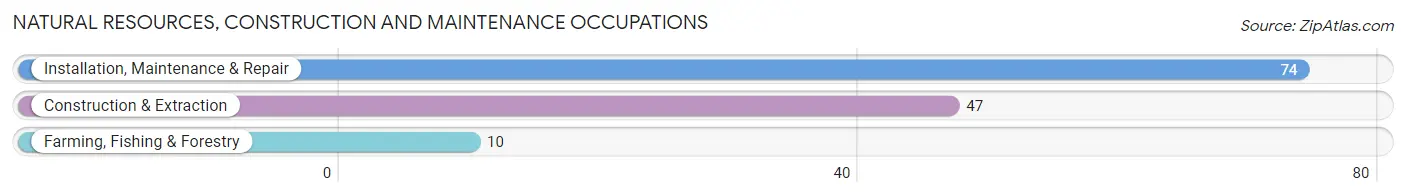
Natural Resources, Construction and Maintenance Occupations
The most common Natural Resources, Construction and Maintenance occupations in Swanton are Installation, Maintenance & Repair (74 | 4.0%), Construction & Extraction (47 | 2.5%), and Farming, Fishing & Forestry (10 | 0.5%).
Natural Resources, Construction and Maintenance Occupations by Sex
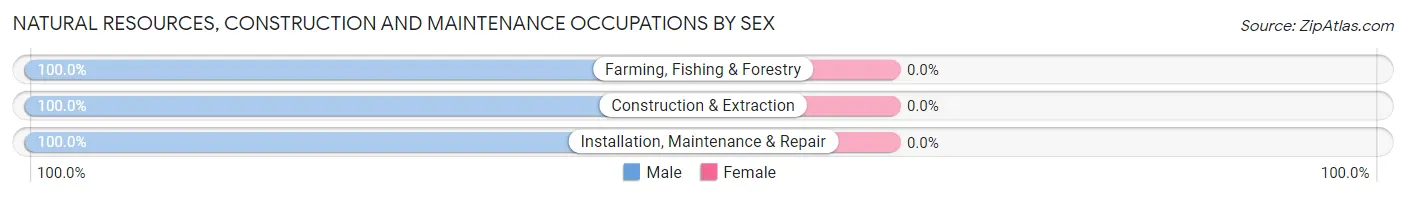
| Occupation | Male | Female |
| Farming, Fishing & Forestry | 10 (100.0%) | 0 (0.0%) |
| Construction & Extraction | 47 (100.0%) | 0 (0.0%) |
| Installation, Maintenance & Repair | 74 (100.0%) | 0 (0.0%) |
| Total (Category) | 131 (100.0%) | 0 (0.0%) |
| Total (Overall) | 1,097 (58.7%) | 773 (41.3%) |
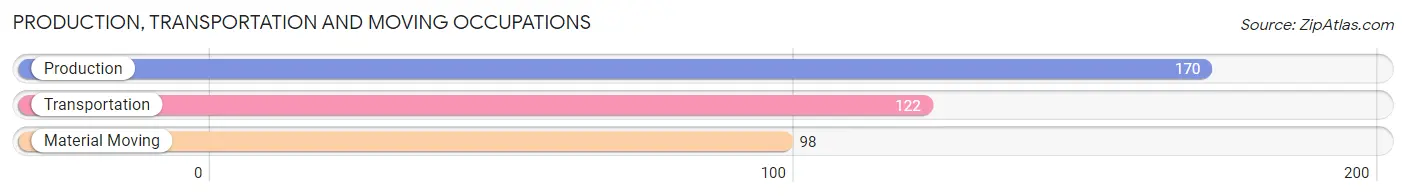
Production, Transportation and Moving Occupations
The most common Production, Transportation and Moving occupations in Swanton are Production (170 | 9.1%), Transportation (122 | 6.5%), and Material Moving (98 | 5.2%).
Production, Transportation and Moving Occupations by Sex
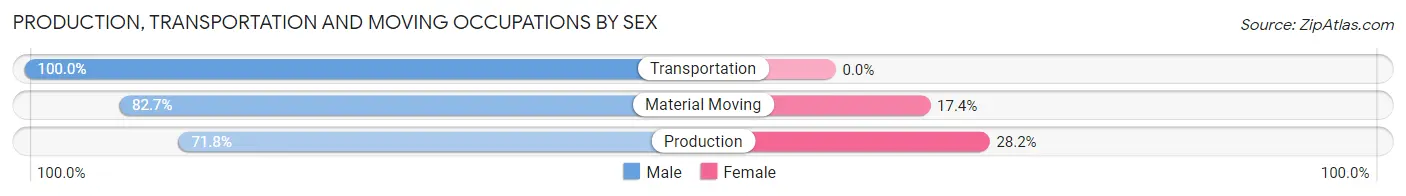
| Occupation | Male | Female |
| Production | 122 (71.8%) | 48 (28.2%) |
| Transportation | 122 (100.0%) | 0 (0.0%) |
| Material Moving | 81 (82.7%) | 17 (17.3%) |
| Total (Category) | 325 (83.3%) | 65 (16.7%) |
| Total (Overall) | 1,097 (58.7%) | 773 (41.3%) |
Employment Industries by Sex in Swanton
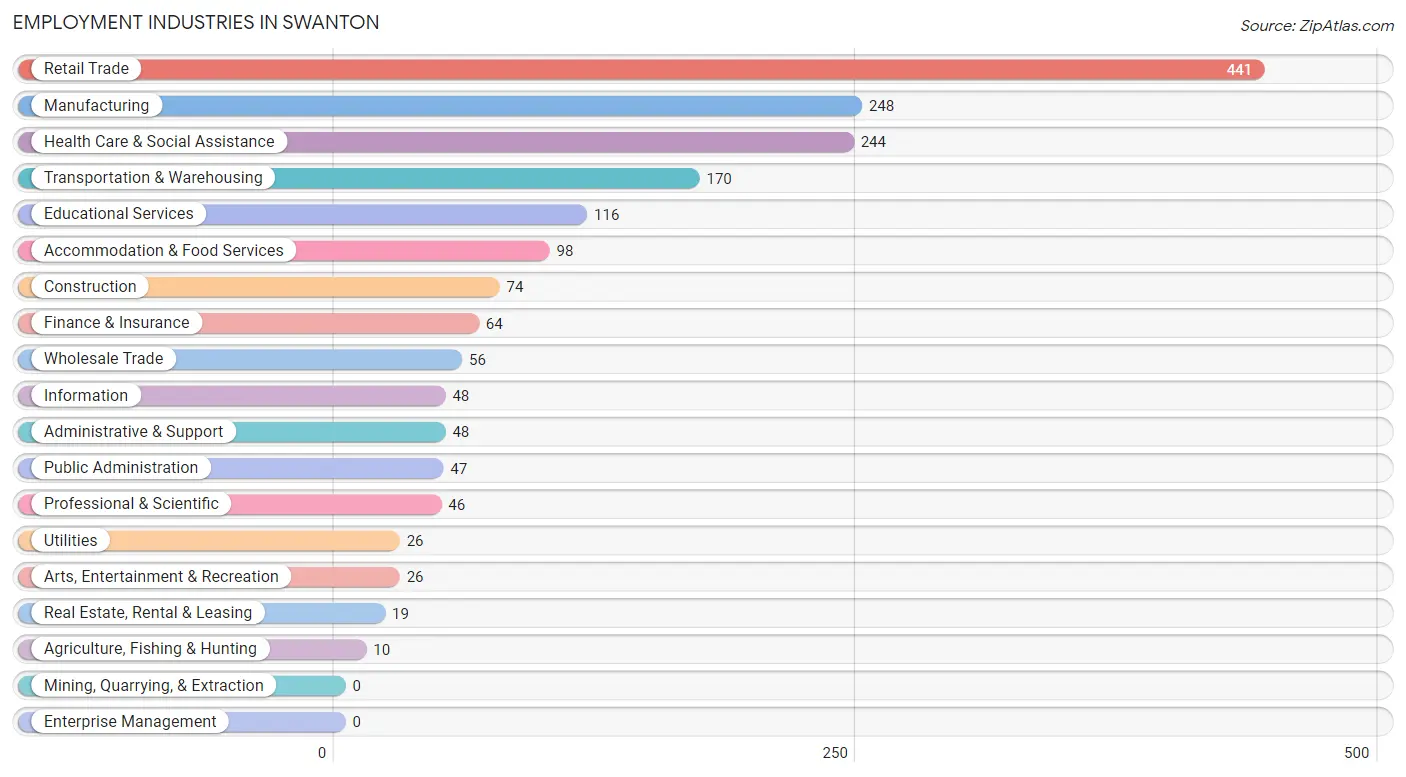
Employment Industries in Swanton
The major employment industries in Swanton include Retail Trade (441 | 23.6%), Manufacturing (248 | 13.3%), Health Care & Social Assistance (244 | 13.1%), Transportation & Warehousing (170 | 9.1%), and Educational Services (116 | 6.2%).
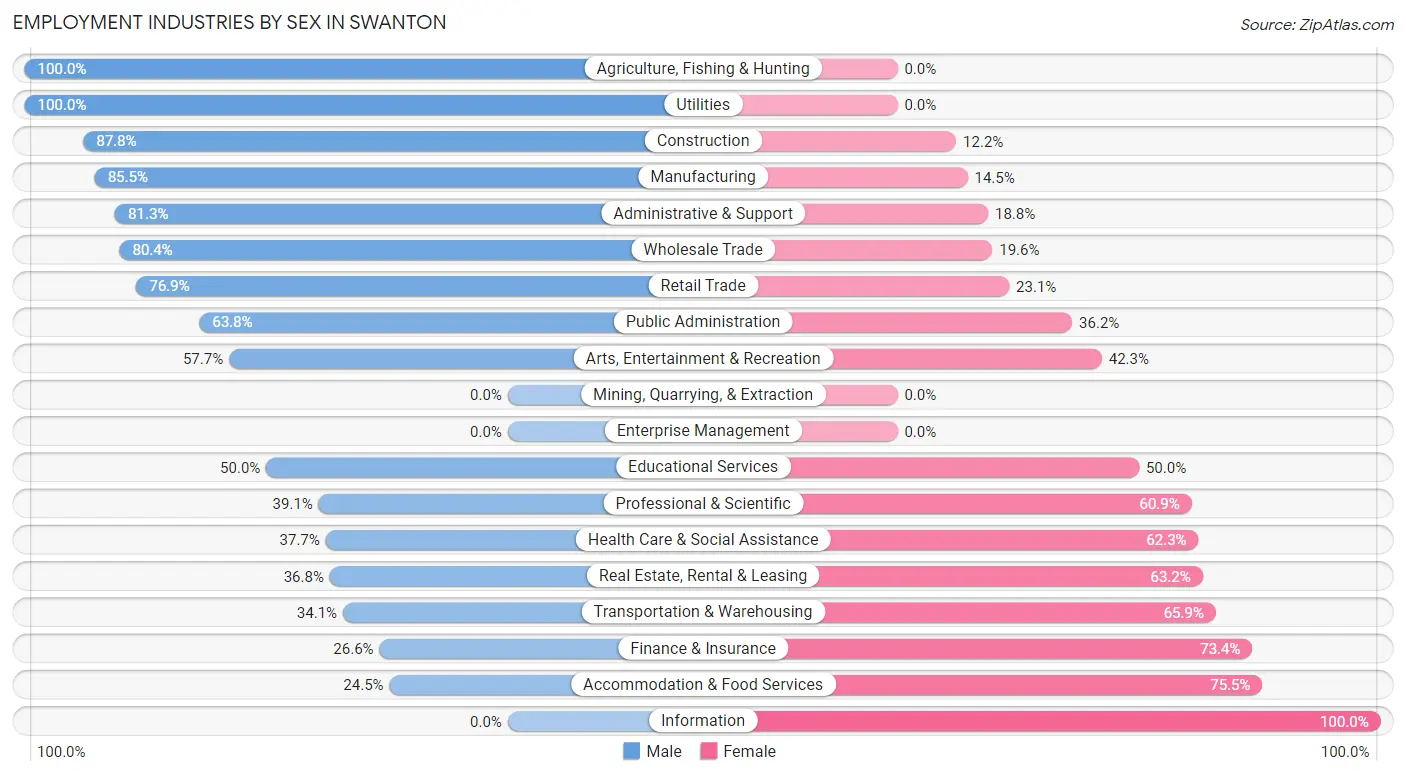
Employment Industries by Sex in Swanton
The Swanton industries that see more men than women are Agriculture, Fishing & Hunting (100.0%), Utilities (100.0%), and Construction (87.8%), whereas the industries that tend to have a higher number of women are Information (100.0%), Accommodation & Food Services (75.5%), and Finance & Insurance (73.4%).
| Industry | Male | Female |
| Agriculture, Fishing & Hunting | 10 (100.0%) | 0 (0.0%) |
| Mining, Quarrying, & Extraction | 0 (0.0%) | 0 (0.0%) |
| Construction | 65 (87.8%) | 9 (12.2%) |
| Manufacturing | 212 (85.5%) | 36 (14.5%) |
| Wholesale Trade | 45 (80.4%) | 11 (19.6%) |
| Retail Trade | 339 (76.9%) | 102 (23.1%) |
| Transportation & Warehousing | 58 (34.1%) | 112 (65.9%) |
| Utilities | 26 (100.0%) | 0 (0.0%) |
| Information | 0 (0.0%) | 48 (100.0%) |
| Finance & Insurance | 17 (26.6%) | 47 (73.4%) |
| Real Estate, Rental & Leasing | 7 (36.8%) | 12 (63.2%) |
| Professional & Scientific | 18 (39.1%) | 28 (60.9%) |
| Enterprise Management | 0 (0.0%) | 0 (0.0%) |
| Administrative & Support | 39 (81.2%) | 9 (18.8%) |
| Educational Services | 58 (50.0%) | 58 (50.0%) |
| Health Care & Social Assistance | 92 (37.7%) | 152 (62.3%) |
| Arts, Entertainment & Recreation | 15 (57.7%) | 11 (42.3%) |
| Accommodation & Food Services | 24 (24.5%) | 74 (75.5%) |
| Public Administration | 30 (63.8%) | 17 (36.2%) |
| Total | 1,097 (58.7%) | 773 (41.3%) |
Education in Swanton
School Enrollment in Swanton
The most common levels of schooling among the 889 students in Swanton are elementary school (243 | 27.3%), middle school (219 | 24.6%), and college / undergraduate (131 | 14.7%).
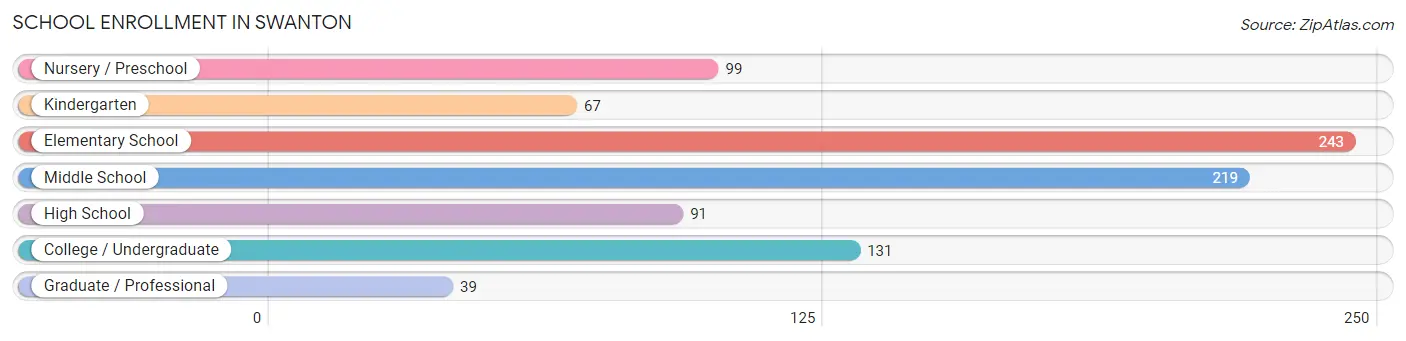
| School Level | # Students | % Students |
| Nursery / Preschool | 99 | 11.1% |
| Kindergarten | 67 | 7.5% |
| Elementary School | 243 | 27.3% |
| Middle School | 219 | 24.6% |
| High School | 91 | 10.2% |
| College / Undergraduate | 131 | 14.7% |
| Graduate / Professional | 39 | 4.4% |
| Total | 889 | 100.0% |
School Enrollment by Age by Funding Source in Swanton
Out of a total of 889 students who are enrolled in schools in Swanton, 132 (14.8%) attend a private institution, while the remaining 757 (85.2%) are enrolled in public schools. The age group of 25 to 34 year olds has the highest likelihood of being enrolled in private schools, with 7 (100.0% in the age bracket) enrolled. Conversely, the age group of 15 to 17 year olds has the lowest likelihood of being enrolled in a private school, with 85 (100.0% in the age bracket) attending a public institution.
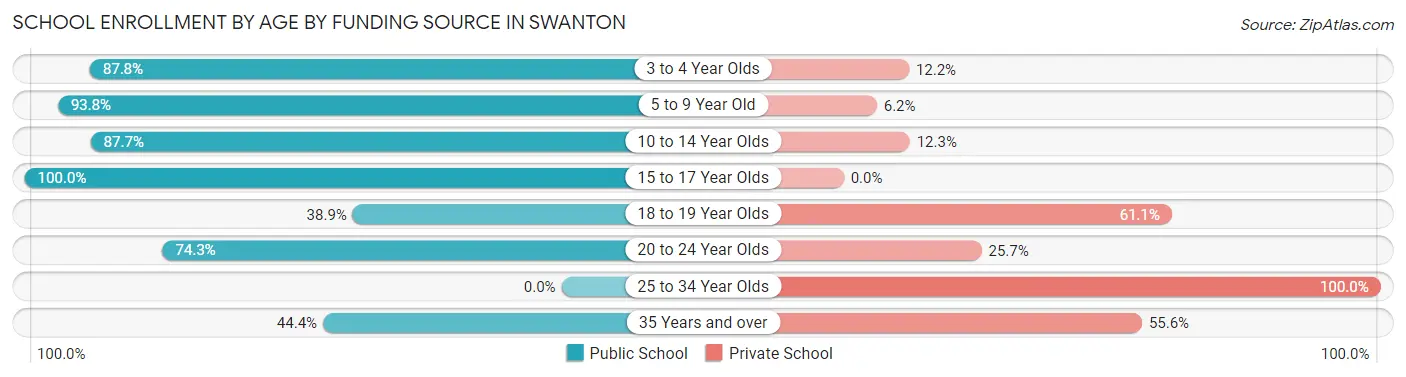
| Age Bracket | Public School | Private School |
| 3 to 4 Year Olds | 65 (87.8%) | 9 (12.2%) |
| 5 to 9 Year Old | 289 (93.8%) | 19 (6.2%) |
| 10 to 14 Year Olds | 228 (87.7%) | 32 (12.3%) |
| 15 to 17 Year Olds | 85 (100.0%) | 0 (0.0%) |
| 18 to 19 Year Olds | 7 (38.9%) | 11 (61.1%) |
| 20 to 24 Year Olds | 55 (74.3%) | 19 (25.7%) |
| 25 to 34 Year Olds | 0 (0.0%) | 7 (100.0%) |
| 35 Years and over | 28 (44.4%) | 35 (55.6%) |
| Total | 757 (85.2%) | 132 (14.8%) |
Educational Attainment by Field of Study in Swanton
Literature & languages (73 | 15.0%), education (72 | 14.7%), computers & mathematics (51 | 10.4%), engineering (48 | 9.8%), and physical & health sciences (45 | 9.2%) are the most common fields of study among 488 individuals in Swanton who have obtained a bachelor's degree or higher.
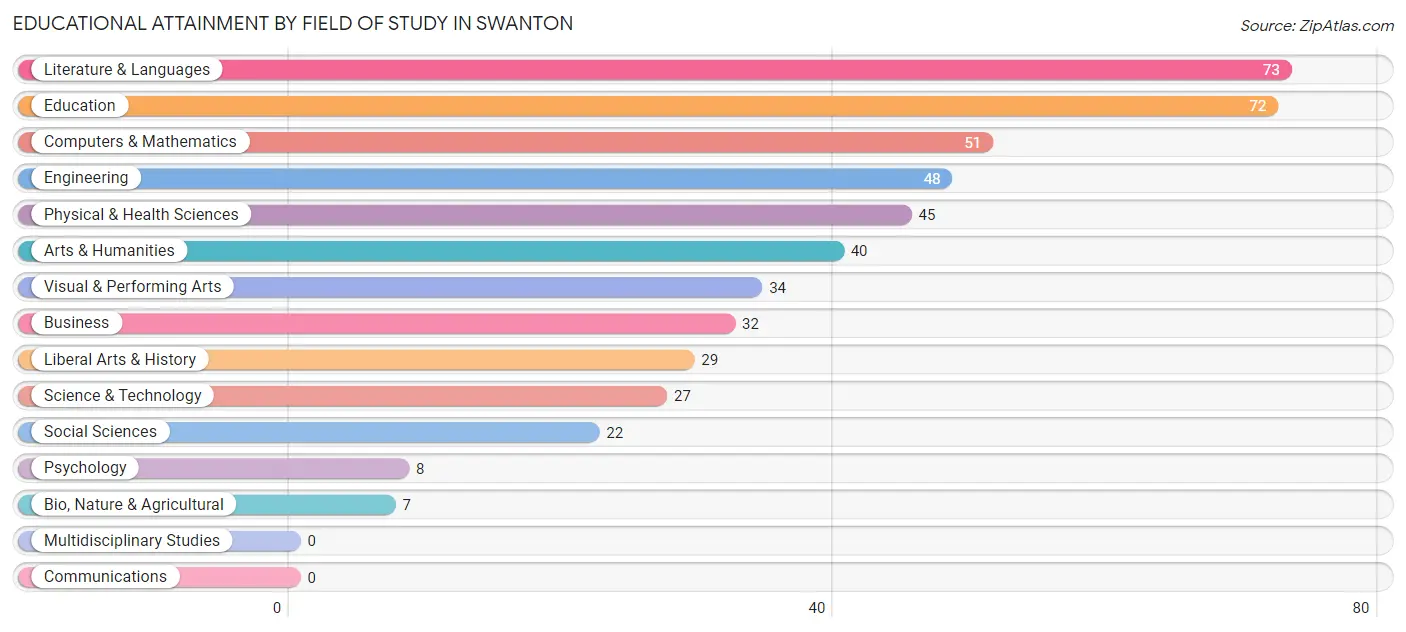
| Field of Study | # Graduates | % Graduates |
| Computers & Mathematics | 51 | 10.4% |
| Bio, Nature & Agricultural | 7 | 1.4% |
| Physical & Health Sciences | 45 | 9.2% |
| Psychology | 8 | 1.6% |
| Social Sciences | 22 | 4.5% |
| Engineering | 48 | 9.8% |
| Multidisciplinary Studies | 0 | 0.0% |
| Science & Technology | 27 | 5.5% |
| Business | 32 | 6.6% |
| Education | 72 | 14.7% |
| Literature & Languages | 73 | 15.0% |
| Liberal Arts & History | 29 | 5.9% |
| Visual & Performing Arts | 34 | 7.0% |
| Communications | 0 | 0.0% |
| Arts & Humanities | 40 | 8.2% |
| Total | 488 | 100.0% |
Transportation & Commute in Swanton
Vehicle Availability by Sex in Swanton
The most prevalent vehicle ownership categories in Swanton are males with 2 vehicles (644, accounting for 58.9%) and females with 2 vehicles (354, making up 83.3%).
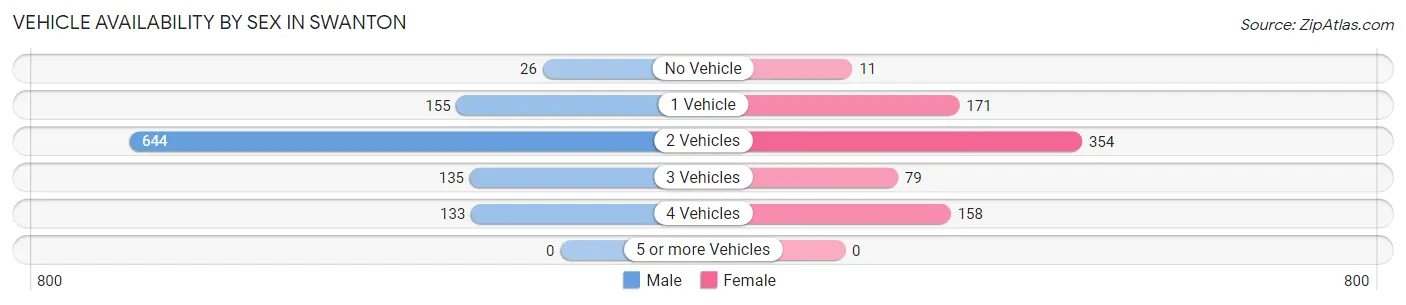
| Vehicles Available | Male | Female |
| No Vehicle | 26 (2.4%) | 11 (1.4%) |
| 1 Vehicle | 155 (14.2%) | 171 (22.1%) |
| 2 Vehicles | 644 (58.9%) | 354 (45.8%) |
| 3 Vehicles | 135 (12.3%) | 79 (10.2%) |
| 4 Vehicles | 133 (12.2%) | 158 (20.4%) |
| 5 or more Vehicles | 0 (0.0%) | 0 (0.0%) |
| Total | 1,093 (100.0%) | 773 (100.0%) |
Commute Time in Swanton
The most frequently occuring commute durations in Swanton are 5 to 9 minutes (357 commuters, 20.3%), 30 to 34 minutes (298 commuters, 16.9%), and 10 to 14 minutes (169 commuters, 9.6%).
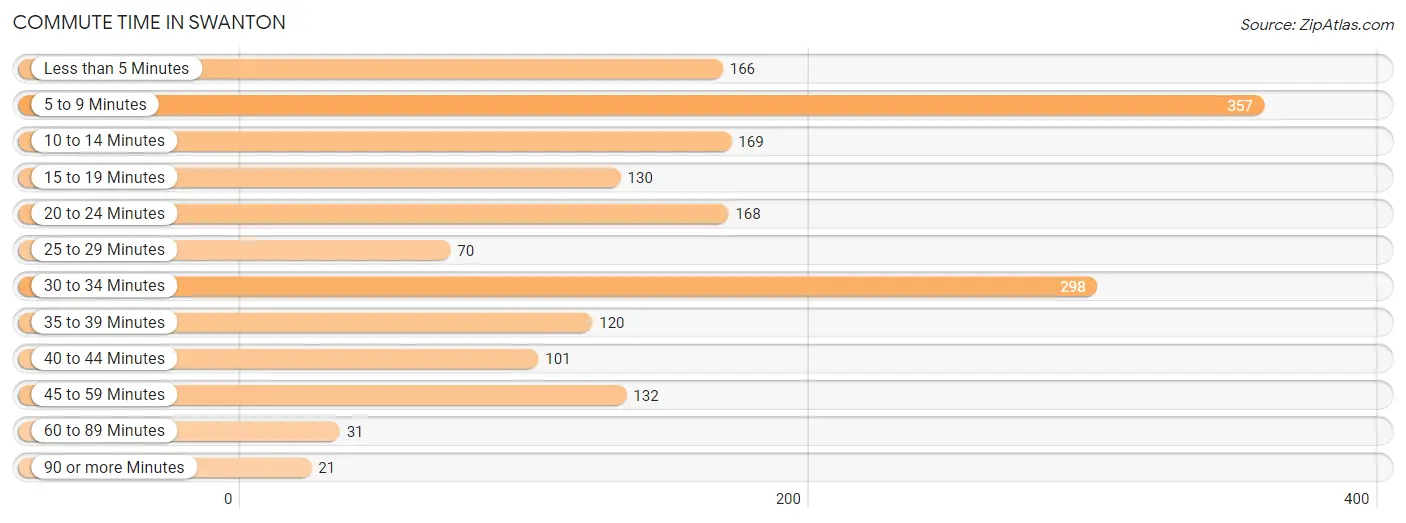
| Commute Time | # Commuters | % Commuters |
| Less than 5 Minutes | 166 | 9.4% |
| 5 to 9 Minutes | 357 | 20.3% |
| 10 to 14 Minutes | 169 | 9.6% |
| 15 to 19 Minutes | 130 | 7.4% |
| 20 to 24 Minutes | 168 | 9.5% |
| 25 to 29 Minutes | 70 | 4.0% |
| 30 to 34 Minutes | 298 | 16.9% |
| 35 to 39 Minutes | 120 | 6.8% |
| 40 to 44 Minutes | 101 | 5.7% |
| 45 to 59 Minutes | 132 | 7.5% |
| 60 to 89 Minutes | 31 | 1.8% |
| 90 or more Minutes | 21 | 1.2% |
Commute Time by Sex in Swanton
The most common commute times in Swanton are 5 to 9 minutes (257 commuters, 24.6%) for males and 30 to 34 minutes (167 commuters, 23.3%) for females.

| Commute Time | Male | Female |
| Less than 5 Minutes | 123 (11.8%) | 43 (6.0%) |
| 5 to 9 Minutes | 257 (24.6%) | 100 (14.0%) |
| 10 to 14 Minutes | 70 (6.7%) | 99 (13.8%) |
| 15 to 19 Minutes | 43 (4.1%) | 87 (12.1%) |
| 20 to 24 Minutes | 106 (10.1%) | 62 (8.6%) |
| 25 to 29 Minutes | 26 (2.5%) | 44 (6.1%) |
| 30 to 34 Minutes | 131 (12.5%) | 167 (23.3%) |
| 35 to 39 Minutes | 58 (5.5%) | 62 (8.6%) |
| 40 to 44 Minutes | 67 (6.4%) | 34 (4.7%) |
| 45 to 59 Minutes | 113 (10.8%) | 19 (2.6%) |
| 60 to 89 Minutes | 31 (3.0%) | 0 (0.0%) |
| 90 or more Minutes | 21 (2.0%) | 0 (0.0%) |
Time of Departure to Work by Sex in Swanton
The most frequent times of departure to work in Swanton are 6:30 AM to 6:59 AM (197, 18.8%) for males and 8:00 AM to 8:29 AM (144, 20.1%) for females.
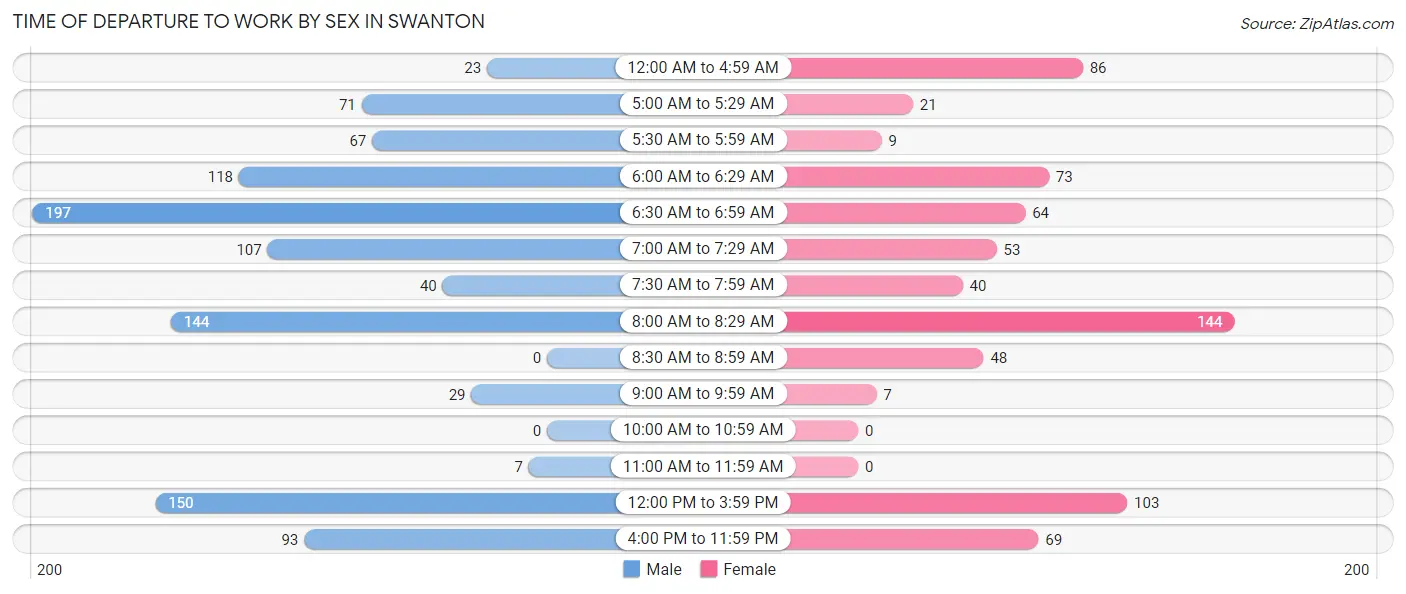
| Time of Departure | Male | Female |
| 12:00 AM to 4:59 AM | 23 (2.2%) | 86 (12.0%) |
| 5:00 AM to 5:29 AM | 71 (6.8%) | 21 (2.9%) |
| 5:30 AM to 5:59 AM | 67 (6.4%) | 9 (1.3%) |
| 6:00 AM to 6:29 AM | 118 (11.3%) | 73 (10.2%) |
| 6:30 AM to 6:59 AM | 197 (18.8%) | 64 (8.9%) |
| 7:00 AM to 7:29 AM | 107 (10.2%) | 53 (7.4%) |
| 7:30 AM to 7:59 AM | 40 (3.8%) | 40 (5.6%) |
| 8:00 AM to 8:29 AM | 144 (13.8%) | 144 (20.1%) |
| 8:30 AM to 8:59 AM | 0 (0.0%) | 48 (6.7%) |
| 9:00 AM to 9:59 AM | 29 (2.8%) | 7 (1.0%) |
| 10:00 AM to 10:59 AM | 0 (0.0%) | 0 (0.0%) |
| 11:00 AM to 11:59 AM | 7 (0.7%) | 0 (0.0%) |
| 12:00 PM to 3:59 PM | 150 (14.3%) | 103 (14.4%) |
| 4:00 PM to 11:59 PM | 93 (8.9%) | 69 (9.6%) |
| Total | 1,046 (100.0%) | 717 (100.0%) |
Housing Occupancy in Swanton
Occupancy by Ownership in Swanton
Of the total 1,692 dwellings in Swanton, owner-occupied units account for 1,197 (70.7%), while renter-occupied units make up 495 (29.3%).
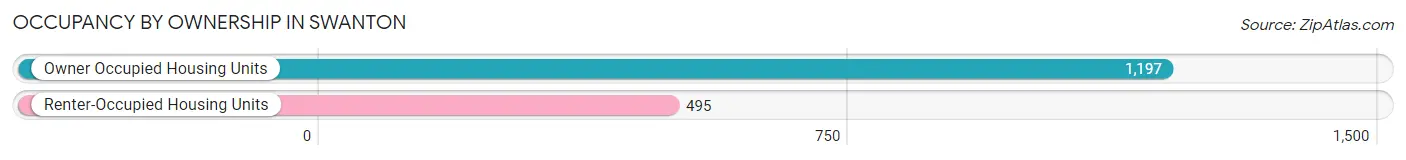
| Occupancy | # Housing Units | % Housing Units |
| Owner Occupied Housing Units | 1,197 | 70.7% |
| Renter-Occupied Housing Units | 495 | 29.3% |
| Total Occupied Housing Units | 1,692 | 100.0% |
Occupancy by Household Size in Swanton
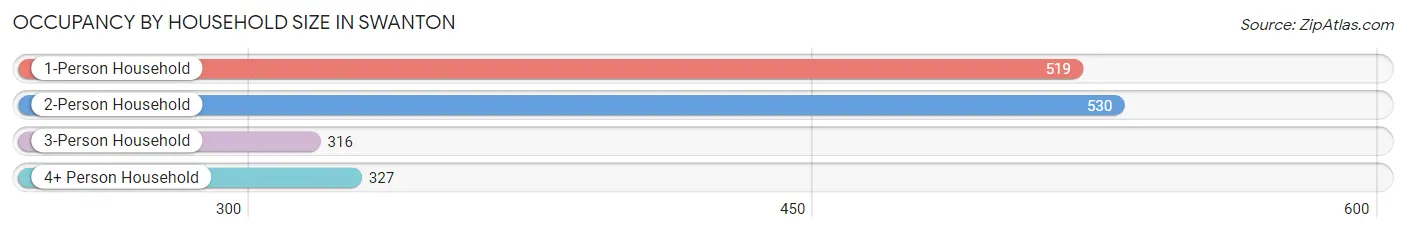
| Household Size | # Housing Units | % Housing Units |
| 1-Person Household | 519 | 30.7% |
| 2-Person Household | 530 | 31.3% |
| 3-Person Household | 316 | 18.7% |
| 4+ Person Household | 327 | 19.3% |
| Total Housing Units | 1,692 | 100.0% |
Occupancy by Ownership by Household Size in Swanton
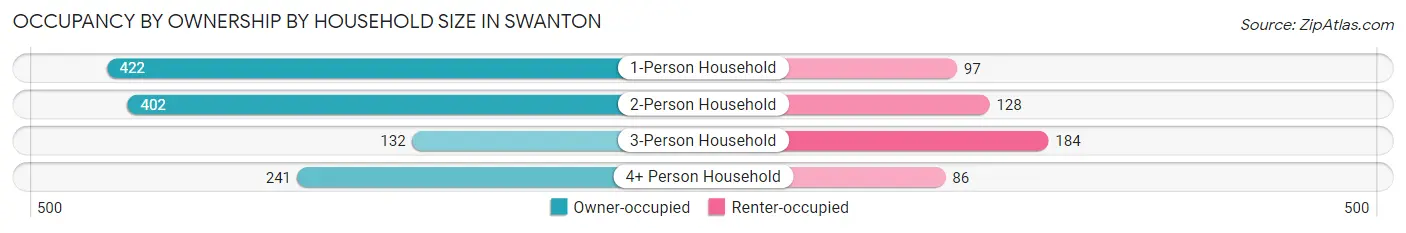
| Household Size | Owner-occupied | Renter-occupied |
| 1-Person Household | 422 (81.3%) | 97 (18.7%) |
| 2-Person Household | 402 (75.8%) | 128 (24.1%) |
| 3-Person Household | 132 (41.8%) | 184 (58.2%) |
| 4+ Person Household | 241 (73.7%) | 86 (26.3%) |
| Total Housing Units | 1,197 (70.7%) | 495 (29.3%) |
Occupancy by Educational Attainment in Swanton
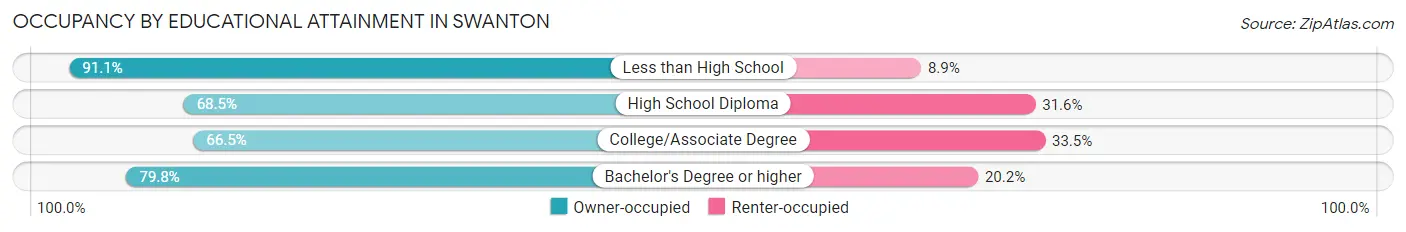
| Household Size | Owner-occupied | Renter-occupied |
| Less than High School | 82 (91.1%) | 8 (8.9%) |
| High School Diploma | 256 (68.4%) | 118 (31.6%) |
| College/Associate Degree | 606 (66.5%) | 305 (33.5%) |
| Bachelor's Degree or higher | 253 (79.8%) | 64 (20.2%) |
Occupancy by Age of Householder in Swanton
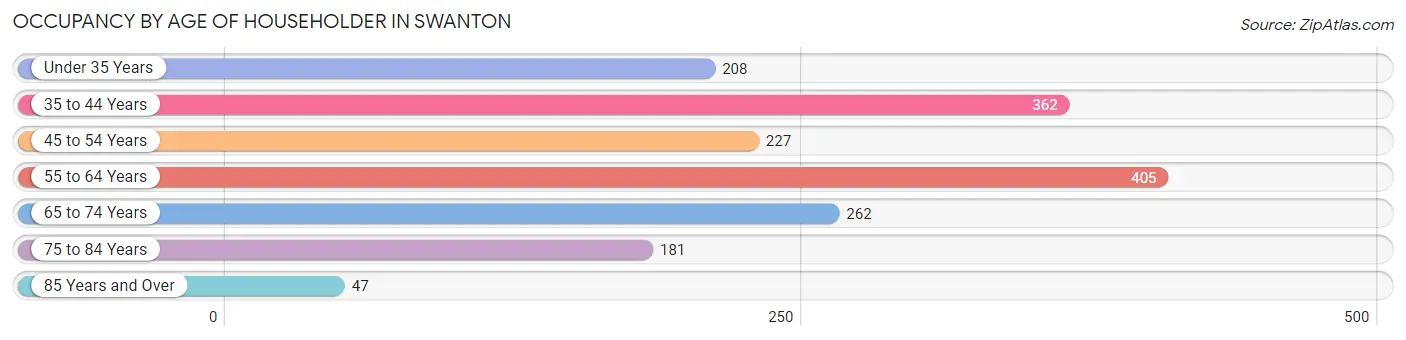
| Age Bracket | # Households | % Households |
| Under 35 Years | 208 | 12.3% |
| 35 to 44 Years | 362 | 21.4% |
| 45 to 54 Years | 227 | 13.4% |
| 55 to 64 Years | 405 | 23.9% |
| 65 to 74 Years | 262 | 15.5% |
| 75 to 84 Years | 181 | 10.7% |
| 85 Years and Over | 47 | 2.8% |
| Total | 1,692 | 100.0% |
Housing Finances in Swanton
Median Income by Occupancy in Swanton
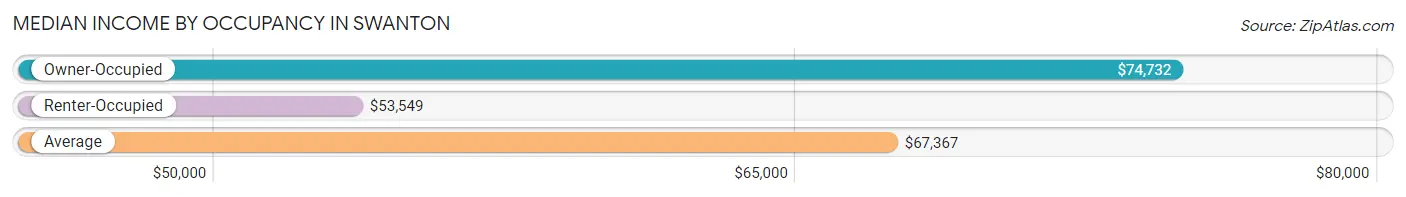
| Occupancy Type | # Households | Median Income |
| Owner-Occupied | 1,197 (70.7%) | $74,732 |
| Renter-Occupied | 495 (29.3%) | $53,549 |
| Average | 1,692 (100.0%) | $67,367 |
Occupancy by Householder Income Bracket in Swanton
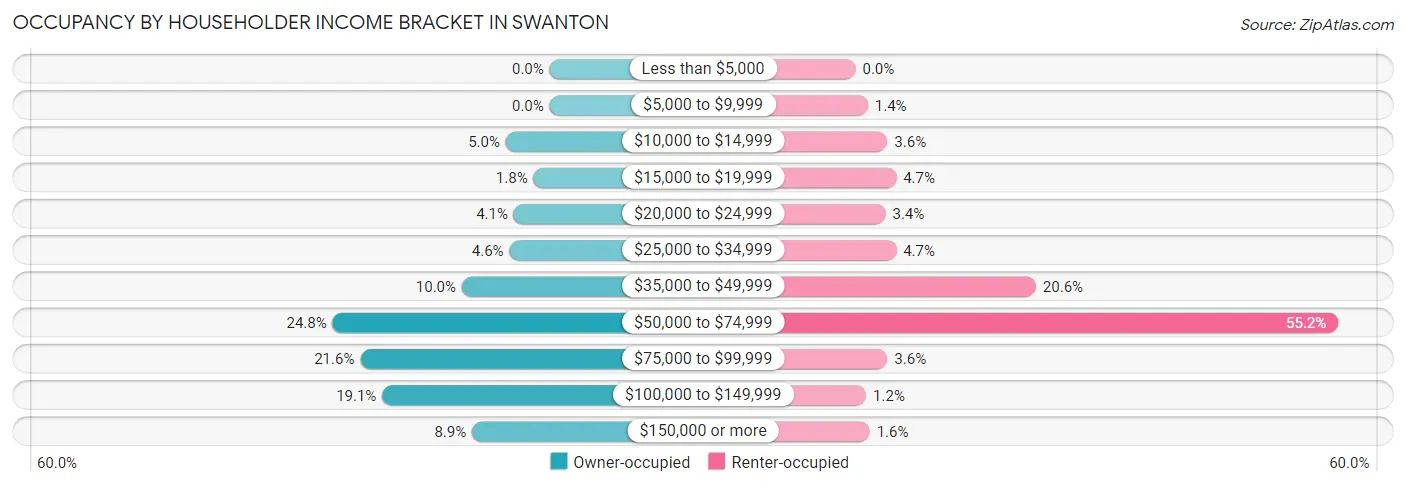
| Income Bracket | Owner-occupied | Renter-occupied |
| Less than $5,000 | 0 (0.0%) | 0 (0.0%) |
| $5,000 to $9,999 | 0 (0.0%) | 7 (1.4%) |
| $10,000 to $14,999 | 60 (5.0%) | 18 (3.6%) |
| $15,000 to $19,999 | 22 (1.8%) | 23 (4.6%) |
| $20,000 to $24,999 | 49 (4.1%) | 17 (3.4%) |
| $25,000 to $34,999 | 55 (4.6%) | 23 (4.6%) |
| $35,000 to $49,999 | 120 (10.0%) | 102 (20.6%) |
| $50,000 to $74,999 | 297 (24.8%) | 273 (55.1%) |
| $75,000 to $99,999 | 259 (21.6%) | 18 (3.6%) |
| $100,000 to $149,999 | 229 (19.1%) | 6 (1.2%) |
| $150,000 or more | 106 (8.9%) | 8 (1.6%) |
| Total | 1,197 (100.0%) | 495 (100.0%) |
Monthly Housing Cost Tiers in Swanton
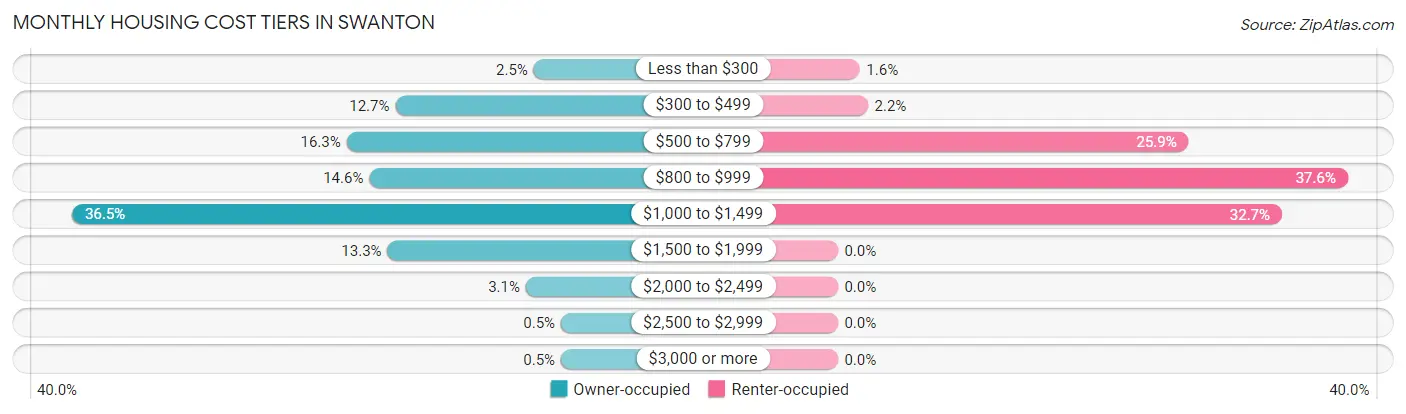
| Monthly Cost | Owner-occupied | Renter-occupied |
| Less than $300 | 30 (2.5%) | 8 (1.6%) |
| $300 to $499 | 152 (12.7%) | 11 (2.2%) |
| $500 to $799 | 195 (16.3%) | 128 (25.9%) |
| $800 to $999 | 175 (14.6%) | 186 (37.6%) |
| $1,000 to $1,499 | 437 (36.5%) | 162 (32.7%) |
| $1,500 to $1,999 | 159 (13.3%) | 0 (0.0%) |
| $2,000 to $2,499 | 37 (3.1%) | 0 (0.0%) |
| $2,500 to $2,999 | 6 (0.5%) | 0 (0.0%) |
| $3,000 or more | 6 (0.5%) | 0 (0.0%) |
| Total | 1,197 (100.0%) | 495 (100.0%) |
Physical Housing Characteristics in Swanton
Housing Structures in Swanton
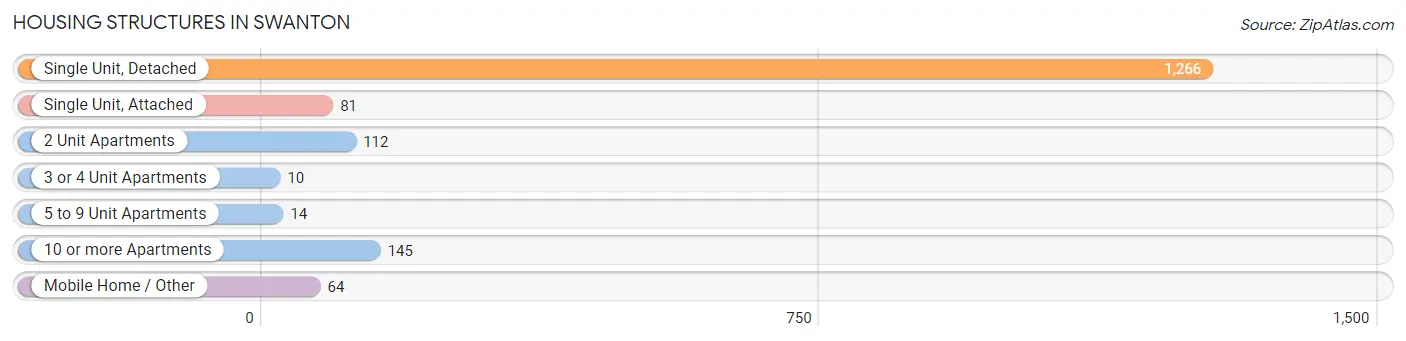
| Structure Type | # Housing Units | % Housing Units |
| Single Unit, Detached | 1,266 | 74.8% |
| Single Unit, Attached | 81 | 4.8% |
| 2 Unit Apartments | 112 | 6.6% |
| 3 or 4 Unit Apartments | 10 | 0.6% |
| 5 to 9 Unit Apartments | 14 | 0.8% |
| 10 or more Apartments | 145 | 8.6% |
| Mobile Home / Other | 64 | 3.8% |
| Total | 1,692 | 100.0% |
Housing Structures by Occupancy in Swanton
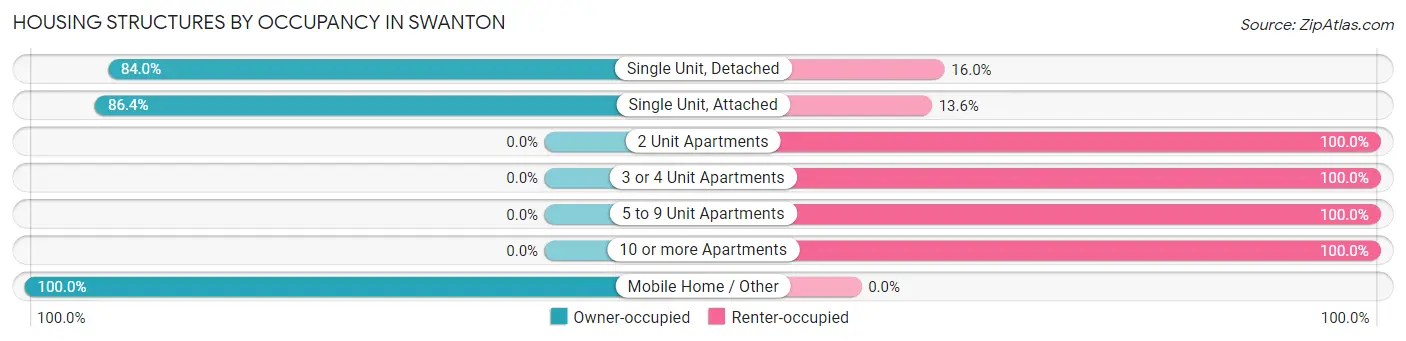
| Structure Type | Owner-occupied | Renter-occupied |
| Single Unit, Detached | 1,063 (84.0%) | 203 (16.0%) |
| Single Unit, Attached | 70 (86.4%) | 11 (13.6%) |
| 2 Unit Apartments | 0 (0.0%) | 112 (100.0%) |
| 3 or 4 Unit Apartments | 0 (0.0%) | 10 (100.0%) |
| 5 to 9 Unit Apartments | 0 (0.0%) | 14 (100.0%) |
| 10 or more Apartments | 0 (0.0%) | 145 (100.0%) |
| Mobile Home / Other | 64 (100.0%) | 0 (0.0%) |
| Total | 1,197 (70.7%) | 495 (29.3%) |
Housing Structures by Number of Rooms in Swanton
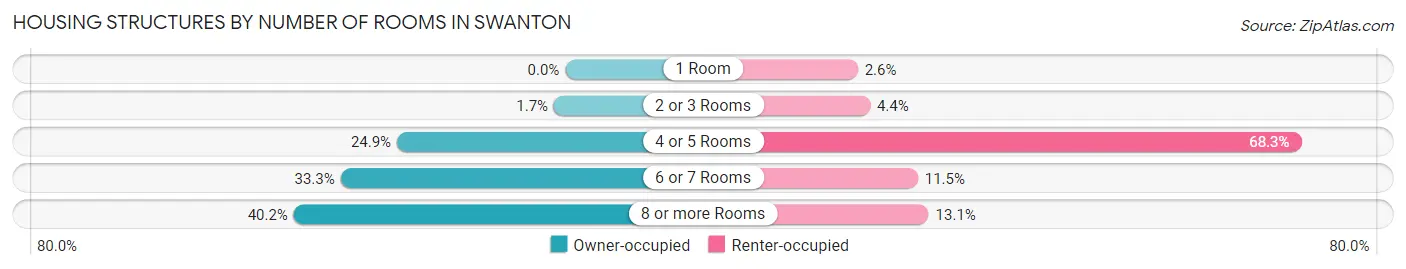
| Number of Rooms | Owner-occupied | Renter-occupied |
| 1 Room | 0 (0.0%) | 13 (2.6%) |
| 2 or 3 Rooms | 20 (1.7%) | 22 (4.4%) |
| 4 or 5 Rooms | 298 (24.9%) | 338 (68.3%) |
| 6 or 7 Rooms | 398 (33.3%) | 57 (11.5%) |
| 8 or more Rooms | 481 (40.2%) | 65 (13.1%) |
| Total | 1,197 (100.0%) | 495 (100.0%) |
Housing Structure by Heating Type in Swanton
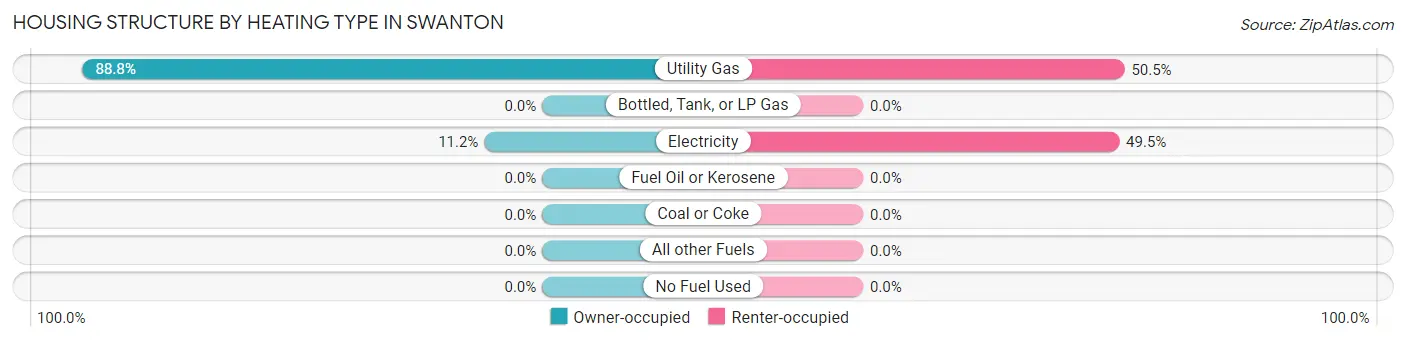
| Heating Type | Owner-occupied | Renter-occupied |
| Utility Gas | 1,063 (88.8%) | 250 (50.5%) |
| Bottled, Tank, or LP Gas | 0 (0.0%) | 0 (0.0%) |
| Electricity | 134 (11.2%) | 245 (49.5%) |
| Fuel Oil or Kerosene | 0 (0.0%) | 0 (0.0%) |
| Coal or Coke | 0 (0.0%) | 0 (0.0%) |
| All other Fuels | 0 (0.0%) | 0 (0.0%) |
| No Fuel Used | 0 (0.0%) | 0 (0.0%) |
| Total | 1,197 (100.0%) | 495 (100.0%) |
Household Vehicle Usage in Swanton
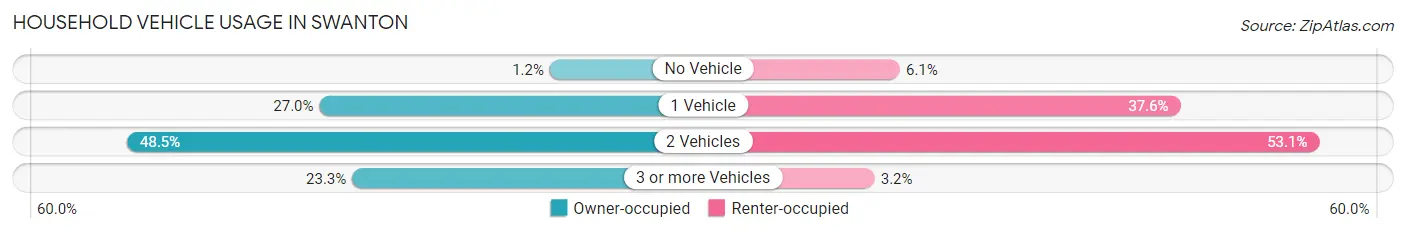
| Vehicles per Household | Owner-occupied | Renter-occupied |
| No Vehicle | 14 (1.2%) | 30 (6.1%) |
| 1 Vehicle | 323 (27.0%) | 186 (37.6%) |
| 2 Vehicles | 581 (48.5%) | 263 (53.1%) |
| 3 or more Vehicles | 279 (23.3%) | 16 (3.2%) |
| Total | 1,197 (100.0%) | 495 (100.0%) |
Real Estate & Mortgages in Swanton
Real Estate and Mortgage Overview in Swanton
| Characteristic | Without Mortgage | With Mortgage |
| Housing Units | 413 | 784 |
| Median Property Value | $162,100 | $154,900 |
| Median Household Income | $61,908 | $48 |
| Monthly Housing Costs | $527 | $6 |
| Real Estate Taxes | $2,345 | $10 |
Property Value by Mortgage Status in Swanton
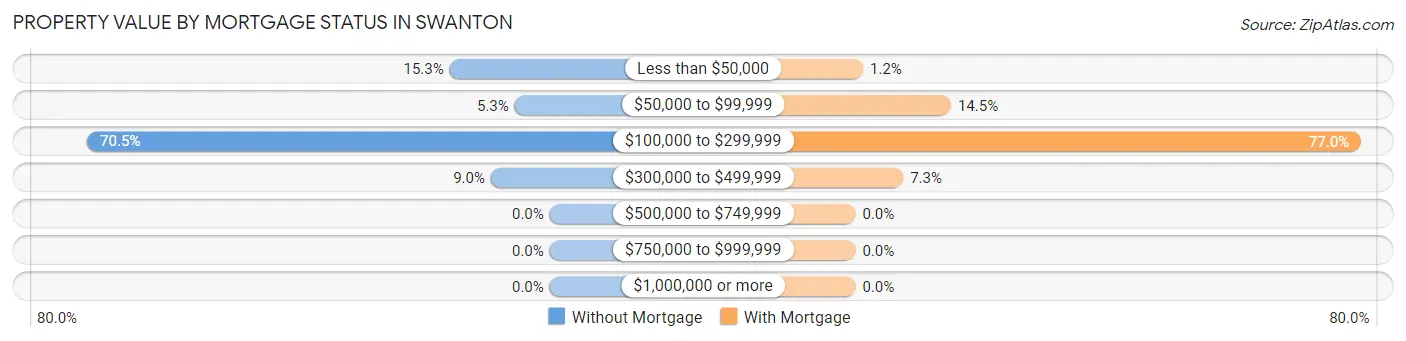
| Property Value | Without Mortgage | With Mortgage |
| Less than $50,000 | 63 (15.2%) | 9 (1.1%) |
| $50,000 to $99,999 | 22 (5.3%) | 114 (14.5%) |
| $100,000 to $299,999 | 291 (70.5%) | 604 (77.0%) |
| $300,000 to $499,999 | 37 (9.0%) | 57 (7.3%) |
| $500,000 to $749,999 | 0 (0.0%) | 0 (0.0%) |
| $750,000 to $999,999 | 0 (0.0%) | 0 (0.0%) |
| $1,000,000 or more | 0 (0.0%) | 0 (0.0%) |
| Total | 413 (100.0%) | 784 (100.0%) |
Household Income by Mortgage Status in Swanton
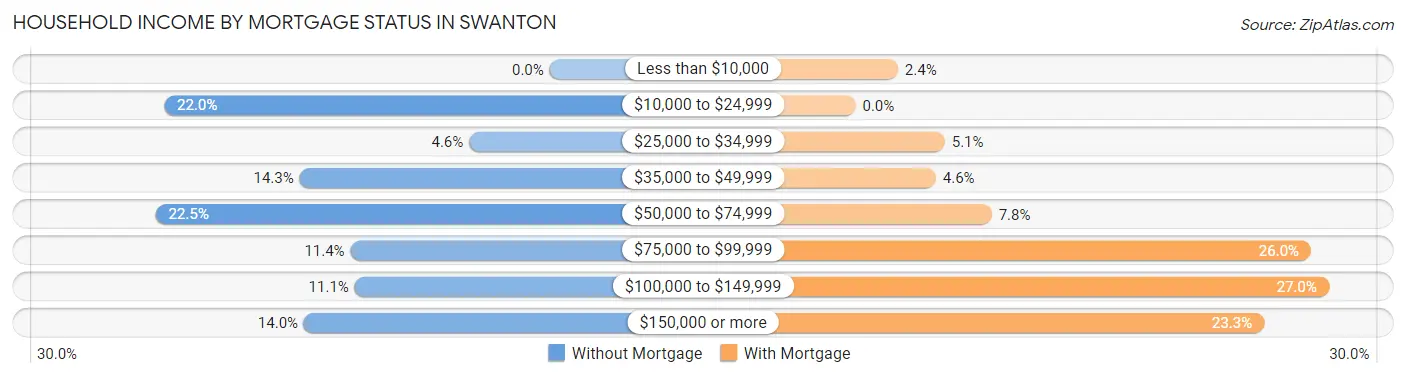
| Household Income | Without Mortgage | With Mortgage |
| Less than $10,000 | 0 (0.0%) | 19 (2.4%) |
| $10,000 to $24,999 | 91 (22.0%) | 0 (0.0%) |
| $25,000 to $34,999 | 19 (4.6%) | 40 (5.1%) |
| $35,000 to $49,999 | 59 (14.3%) | 36 (4.6%) |
| $50,000 to $74,999 | 93 (22.5%) | 61 (7.8%) |
| $75,000 to $99,999 | 47 (11.4%) | 204 (26.0%) |
| $100,000 to $149,999 | 46 (11.1%) | 212 (27.0%) |
| $150,000 or more | 58 (14.0%) | 183 (23.3%) |
| Total | 413 (100.0%) | 784 (100.0%) |
Property Value to Household Income Ratio in Swanton
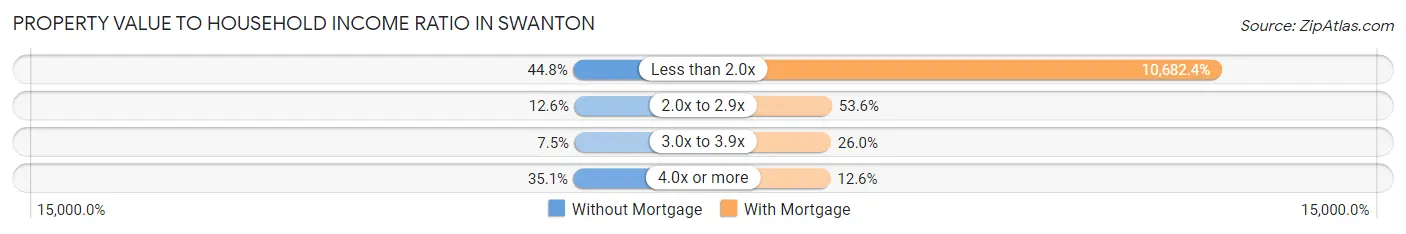
| Value-to-Income Ratio | Without Mortgage | With Mortgage |
| Less than 2.0x | 185 (44.8%) | 83,750 (10,682.4%) |
| 2.0x to 2.9x | 52 (12.6%) | 420 (53.6%) |
| 3.0x to 3.9x | 31 (7.5%) | 204 (26.0%) |
| 4.0x or more | 145 (35.1%) | 99 (12.6%) |
| Total | 413 (100.0%) | 784 (100.0%) |
Real Estate Taxes by Mortgage Status in Swanton
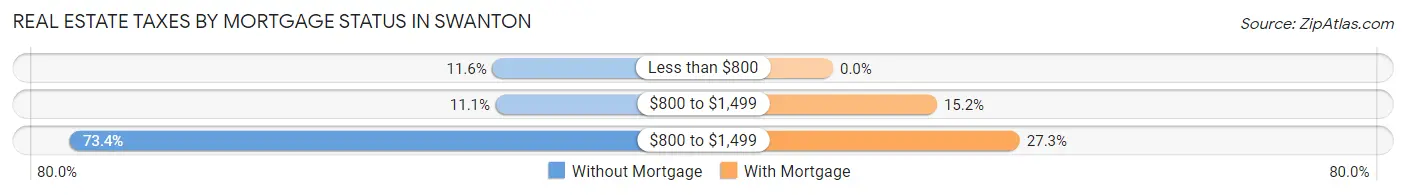
| Property Taxes | Without Mortgage | With Mortgage |
| Less than $800 | 48 (11.6%) | 0 (0.0%) |
| $800 to $1,499 | 46 (11.1%) | 119 (15.2%) |
| $800 to $1,499 | 303 (73.4%) | 214 (27.3%) |
| Total | 413 (100.0%) | 784 (100.0%) |
Health & Disability in Swanton
Health Insurance Coverage by Age in Swanton
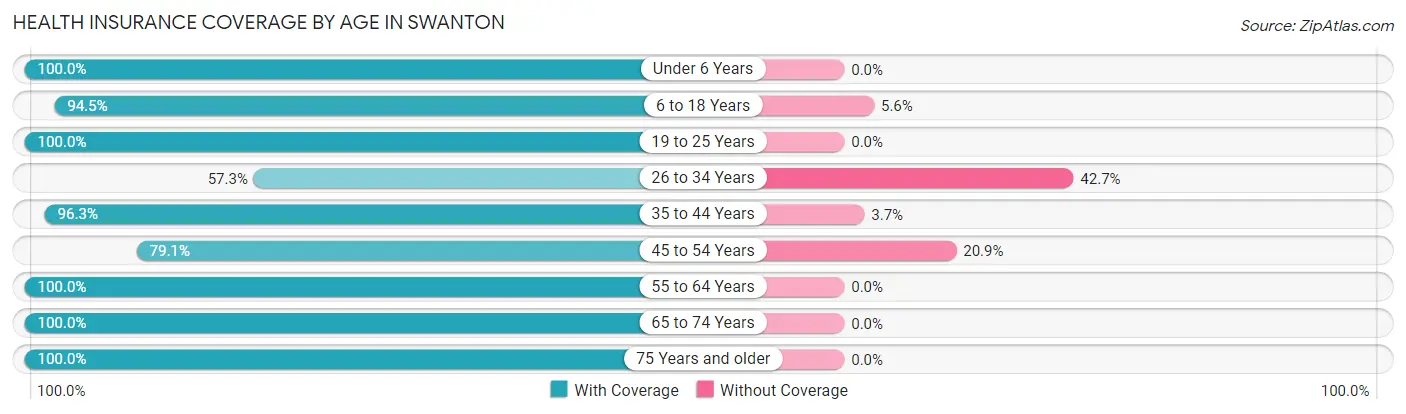
| Age Bracket | With Coverage | Without Coverage |
| Under 6 Years | 343 (100.0%) | 0 (0.0%) |
| 6 to 18 Years | 613 (94.5%) | 36 (5.6%) |
| 19 to 25 Years | 182 (100.0%) | 0 (0.0%) |
| 26 to 34 Years | 315 (57.3%) | 235 (42.7%) |
| 35 to 44 Years | 669 (96.3%) | 26 (3.7%) |
| 45 to 54 Years | 303 (79.1%) | 80 (20.9%) |
| 55 to 64 Years | 479 (100.0%) | 0 (0.0%) |
| 65 to 74 Years | 389 (100.0%) | 0 (0.0%) |
| 75 Years and older | 285 (100.0%) | 0 (0.0%) |
| Total | 3,578 (90.5%) | 377 (9.5%) |
Health Insurance Coverage by Citizenship Status in Swanton
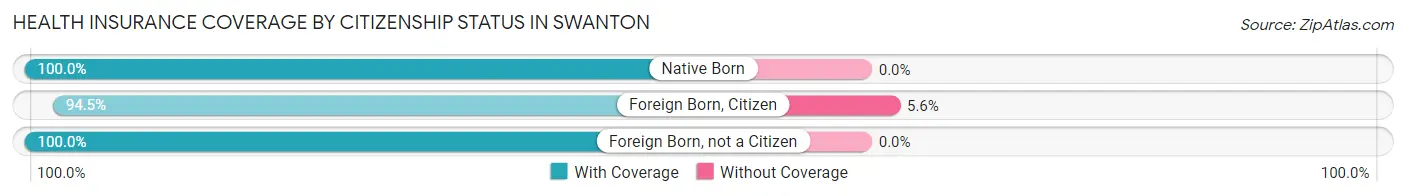
| Citizenship Status | With Coverage | Without Coverage |
| Native Born | 343 (100.0%) | 0 (0.0%) |
| Foreign Born, Citizen | 613 (94.5%) | 36 (5.6%) |
| Foreign Born, not a Citizen | 182 (100.0%) | 0 (0.0%) |
Health Insurance Coverage by Household Income in Swanton
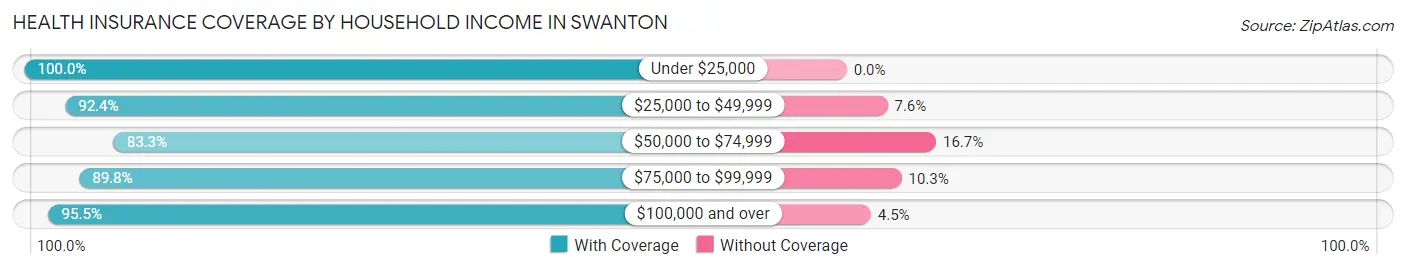
| Household Income | With Coverage | Without Coverage |
| Under $25,000 | 354 (100.0%) | 0 (0.0%) |
| $25,000 to $49,999 | 690 (92.4%) | 57 (7.6%) |
| $50,000 to $74,999 | 1,040 (83.3%) | 209 (16.7%) |
| $75,000 to $99,999 | 604 (89.7%) | 69 (10.2%) |
| $100,000 and over | 890 (95.5%) | 42 (4.5%) |
Public vs Private Health Insurance Coverage by Age in Swanton
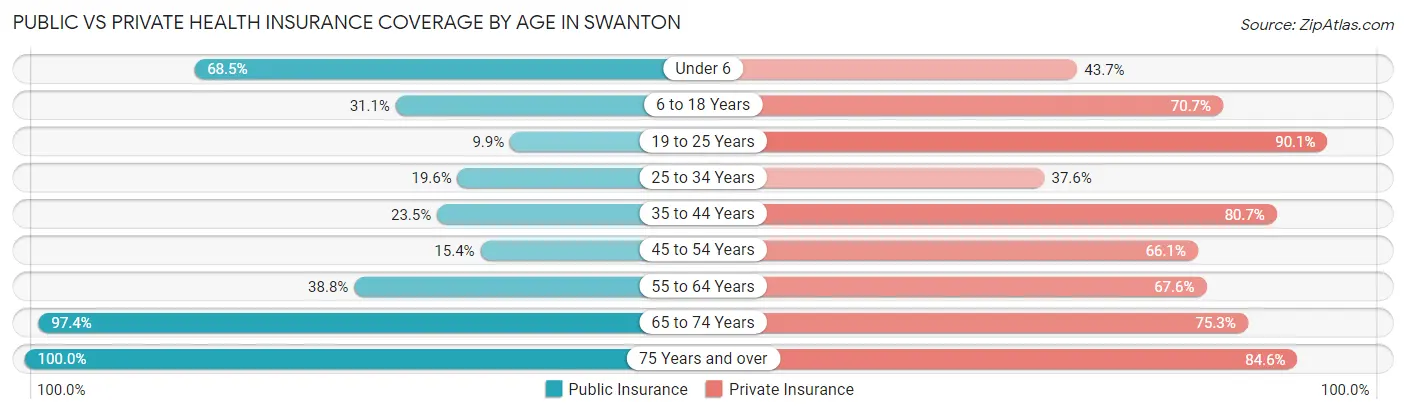
| Age Bracket | Public Insurance | Private Insurance |
| Under 6 | 235 (68.5%) | 150 (43.7%) |
| 6 to 18 Years | 202 (31.1%) | 459 (70.7%) |
| 19 to 25 Years | 18 (9.9%) | 164 (90.1%) |
| 25 to 34 Years | 108 (19.6%) | 207 (37.6%) |
| 35 to 44 Years | 163 (23.4%) | 561 (80.7%) |
| 45 to 54 Years | 59 (15.4%) | 253 (66.1%) |
| 55 to 64 Years | 186 (38.8%) | 324 (67.6%) |
| 65 to 74 Years | 379 (97.4%) | 293 (75.3%) |
| 75 Years and over | 285 (100.0%) | 241 (84.6%) |
| Total | 1,635 (41.3%) | 2,652 (67.0%) |
Disability Status by Sex by Age in Swanton
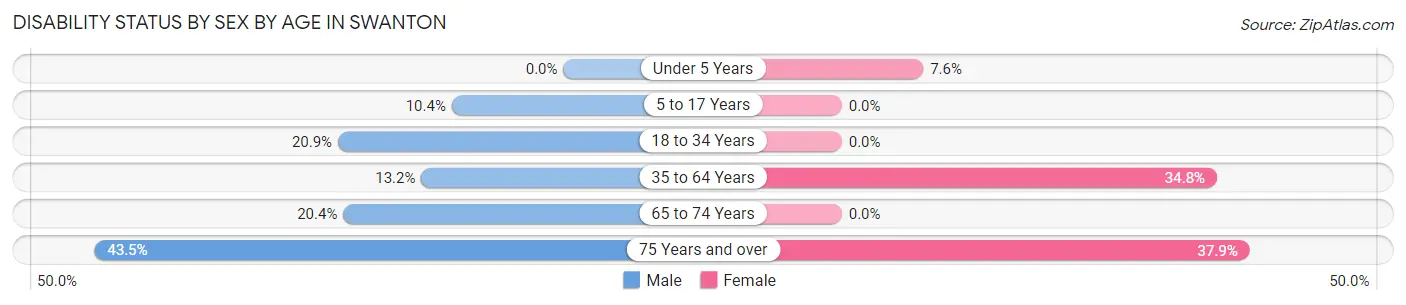
| Age Bracket | Male | Female |
| Under 5 Years | 0 (0.0%) | 9 (7.6%) |
| 5 to 17 Years | 43 (10.4%) | 0 (0.0%) |
| 18 to 34 Years | 91 (20.9%) | 0 (0.0%) |
| 35 to 64 Years | 92 (13.2%) | 299 (34.8%) |
| 65 to 74 Years | 47 (20.4%) | 0 (0.0%) |
| 75 Years and over | 47 (43.5%) | 67 (37.9%) |
Disability Class by Sex by Age in Swanton
Disability Class: Hearing Difficulty
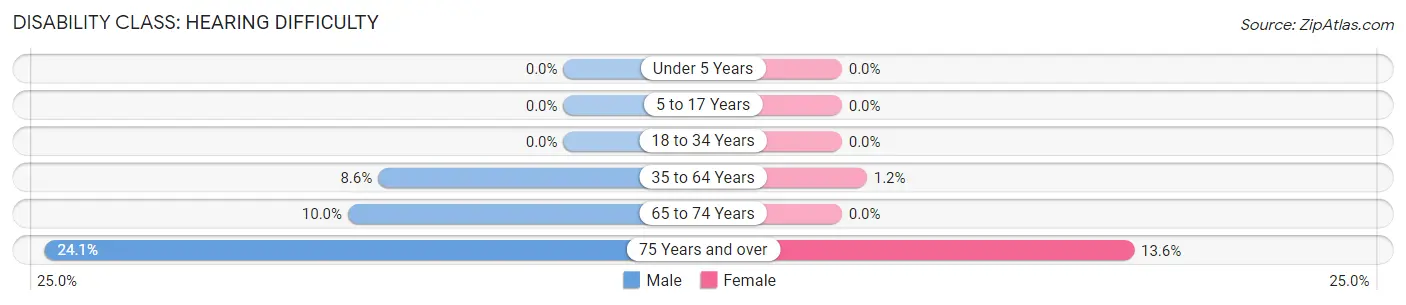
| Age Bracket | Male | Female |
| Under 5 Years | 0 (0.0%) | 0 (0.0%) |
| 5 to 17 Years | 0 (0.0%) | 0 (0.0%) |
| 18 to 34 Years | 0 (0.0%) | 0 (0.0%) |
| 35 to 64 Years | 60 (8.6%) | 10 (1.2%) |
| 65 to 74 Years | 23 (10.0%) | 0 (0.0%) |
| 75 Years and over | 26 (24.1%) | 24 (13.6%) |
Disability Class: Vision Difficulty
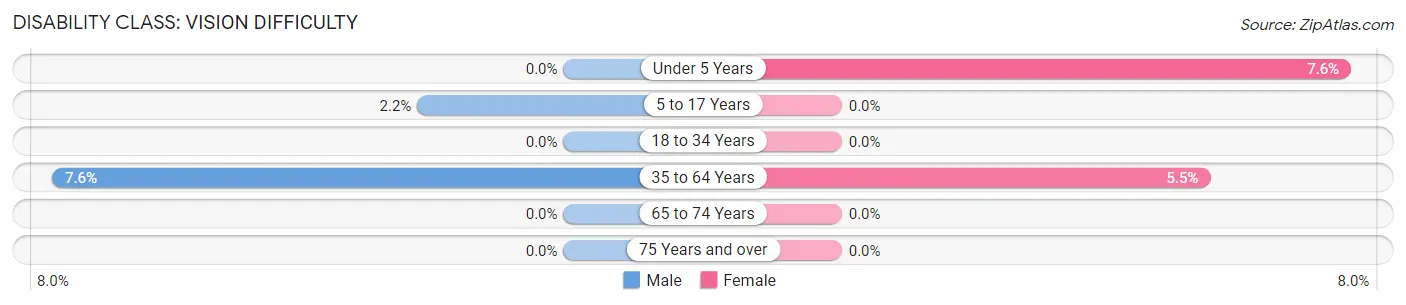
| Age Bracket | Male | Female |
| Under 5 Years | 0 (0.0%) | 9 (7.6%) |
| 5 to 17 Years | 9 (2.2%) | 0 (0.0%) |
| 18 to 34 Years | 0 (0.0%) | 0 (0.0%) |
| 35 to 64 Years | 53 (7.6%) | 47 (5.5%) |
| 65 to 74 Years | 0 (0.0%) | 0 (0.0%) |
| 75 Years and over | 0 (0.0%) | 0 (0.0%) |
Disability Class: Cognitive Difficulty
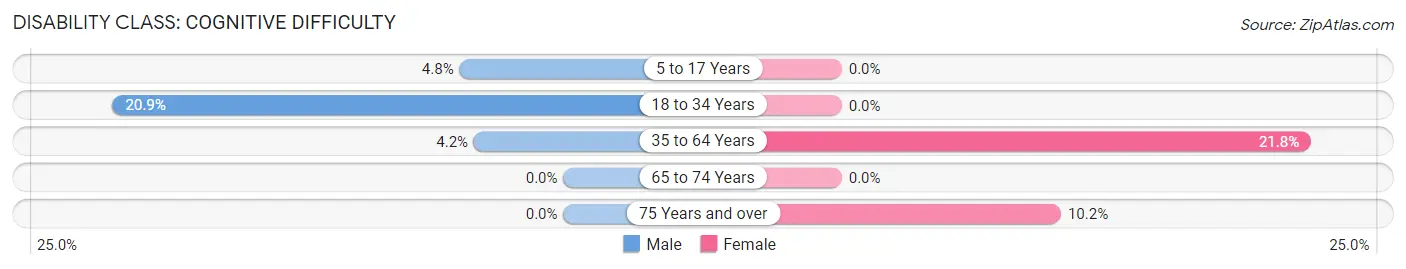
| Age Bracket | Male | Female |
| 5 to 17 Years | 20 (4.8%) | 0 (0.0%) |
| 18 to 34 Years | 91 (20.9%) | 0 (0.0%) |
| 35 to 64 Years | 29 (4.2%) | 187 (21.8%) |
| 65 to 74 Years | 0 (0.0%) | 0 (0.0%) |
| 75 Years and over | 0 (0.0%) | 18 (10.2%) |
Disability Class: Ambulatory Difficulty
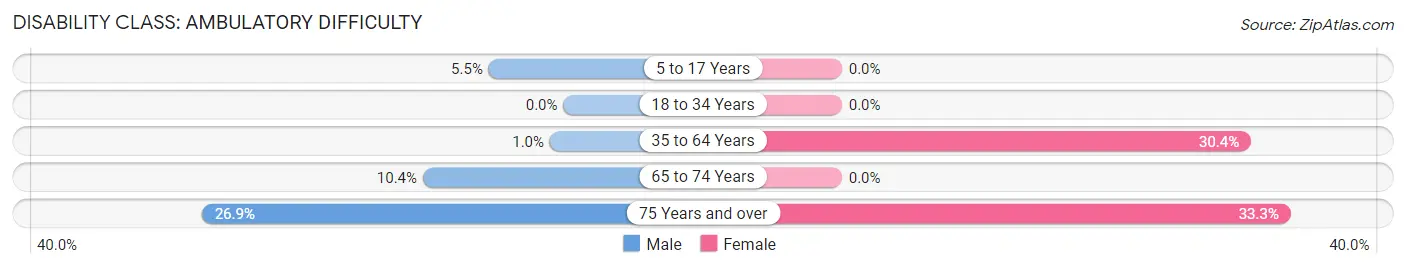
| Age Bracket | Male | Female |
| 5 to 17 Years | 23 (5.5%) | 0 (0.0%) |
| 18 to 34 Years | 0 (0.0%) | 0 (0.0%) |
| 35 to 64 Years | 7 (1.0%) | 261 (30.4%) |
| 65 to 74 Years | 24 (10.4%) | 0 (0.0%) |
| 75 Years and over | 29 (26.9%) | 59 (33.3%) |
Disability Class: Self-Care Difficulty
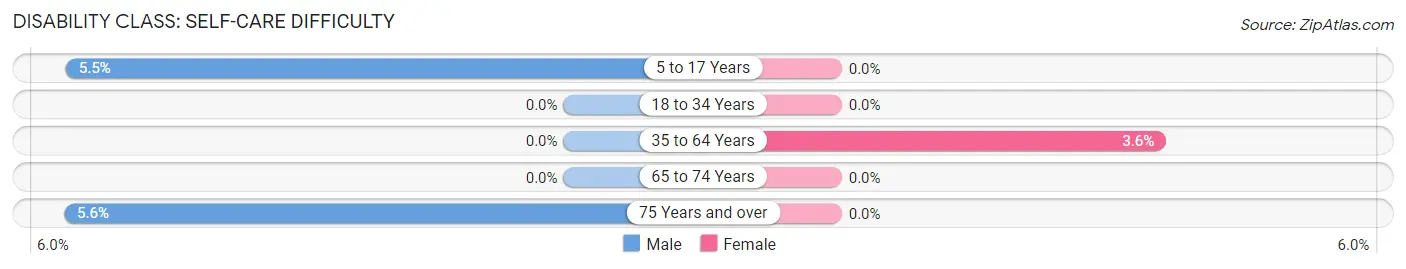
| Age Bracket | Male | Female |
| 5 to 17 Years | 23 (5.5%) | 0 (0.0%) |
| 18 to 34 Years | 0 (0.0%) | 0 (0.0%) |
| 35 to 64 Years | 0 (0.0%) | 31 (3.6%) |
| 65 to 74 Years | 0 (0.0%) | 0 (0.0%) |
| 75 Years and over | 6 (5.6%) | 0 (0.0%) |
Technology Access in Swanton
Computing Device Access in Swanton
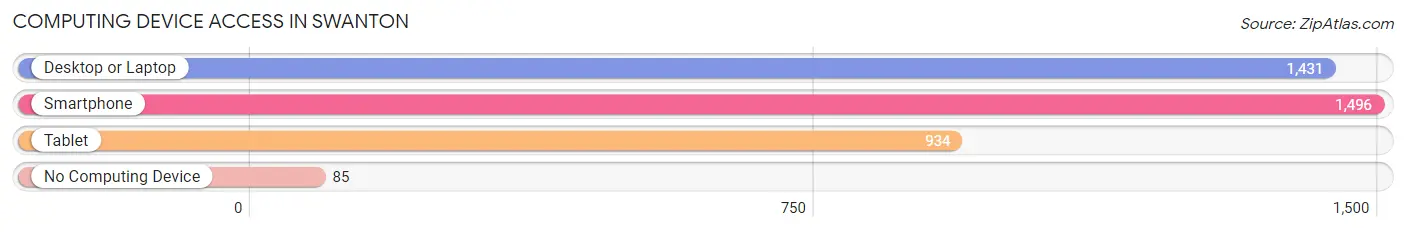
| Device Type | # Households | % Households |
| Desktop or Laptop | 1,431 | 84.6% |
| Smartphone | 1,496 | 88.4% |
| Tablet | 934 | 55.2% |
| No Computing Device | 85 | 5.0% |
| Total | 1,692 | 100.0% |
Internet Access in Swanton
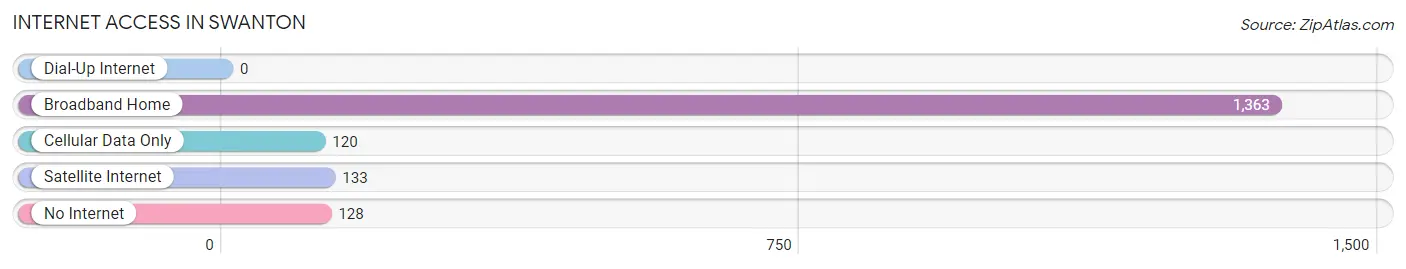
| Internet Type | # Households | % Households |
| Dial-Up Internet | 0 | 0.0% |
| Broadband Home | 1,363 | 80.6% |
| Cellular Data Only | 120 | 7.1% |
| Satellite Internet | 133 | 7.9% |
| No Internet | 128 | 7.6% |
| Total | 1,692 | 100.0% |
Swanton Summary
Swanton, Ohio is a small village located in Fulton County, Ohio. It is situated on the banks of the Maumee River, approximately 20 miles west of Toledo. The village has a population of approximately 4,500 people and is part of the Toledo Metropolitan Statistical Area.
History
Swanton was founded in 1836 by a group of settlers from New York. The village was named after the Swanton family, who were among the first settlers. The village was incorporated in 1867 and has remained a small, rural community ever since.
The village was an important stop on the Toledo and Ohio Central Railroad, which ran through the village from 1881 to 1971. The railroad was a major factor in the growth of the village, as it allowed for the transportation of goods and people to and from the village.
Geography
Swanton is located in northwestern Ohio, approximately 20 miles west of Toledo. The village is situated on the banks of the Maumee River, which is a major tributary of Lake Erie. The village is surrounded by farmland and is located in the Great Black Swamp region of Ohio.
The village has a total area of 2.2 square miles, all of which is land. The village is located at an elevation of 745 feet above sea level.
Economy
The economy of Swanton is largely based on agriculture and manufacturing. The village is home to several small businesses, including a grocery store, a hardware store, and a few restaurants. The village also has a few small industrial parks, which are home to several manufacturing companies.
The village is also home to a few large employers, including the Swanton School District, the Swanton Public Library, and the Swanton Health Center.
Demographics
As of the 2010 census, the population of Swanton was 4,521. The racial makeup of the village was 97.2% White, 0.7% African American, 0.2% Native American, 0.3% Asian, 0.1% Pacific Islander, 0.4% from other races, and 1.1% from two or more races. Hispanic or Latino of any race were 1.7% of the population.
The median household income in Swanton was $45,938, and the median family income was $54,844. The per capita income for the village was $20,945. About 8.2% of families and 10.2% of the population were below the poverty line, including 14.2% of those under age 18 and 5.2% of those age 65 or over.
Swanton is a small, rural village with a rich history and a strong sense of community. The village is home to a variety of businesses and industries, and the economy is largely based on agriculture and manufacturing. The village has a diverse population and is a great place to live and work.
Common Questions
What is the Total Population of Swanton?
Total Population of Swanton is 4,133.
What is the Total Male Population of Swanton?
Total Male Population of Swanton is 2,108.
What is the Total Female Population of Swanton?
Total Female Population of Swanton is 2,025.
What is the Ratio of Males per 100 Females in Swanton?
There are 104.10 Males per 100 Females in Swanton.
What is the Ratio of Females per 100 Males in Swanton?
There are 96.06 Females per 100 Males in Swanton.
What is the Median Population Age in Swanton?
Median Population Age in Swanton is 39.1 Years.
What is the Average Family Size in Swanton
Average Family Size in Swanton is 3.0 People.
What is the Average Household Size in Swanton
Average Household Size in Swanton is 2.4 People.
What is Per Capita Income in Swanton?
Per Capita income in Swanton is $31,705.
What is the Median Family Income in Swanton?
Median Family Income in Swanton is $67,958.
What is the Median Household income in Swanton?
Median Household Income in Swanton is $67,367.
What is Income or Wage Gap in Swanton?
Income or Wage Gap in Swanton is 22.8%.
Women in Swanton earn 77.2 cents for every dollar earned by a man.
What is Inequality or Gini Index in Swanton?
Inequality or Gini Index in Swanton is 0.35.
How Large is the Labor Force in Swanton?
There are 1,920 People in the Labor Forcein in Swanton.
What is the Percentage of People in the Labor Force in Swanton?
59.2% of People are in the Labor Force in Swanton.
What is the Unemployment Rate in Swanton?
Unemployment Rate in Swanton is 2.0%.