Devola, OH
Devola Map
Devola Overview
2,669
TOTAL POPULATION
1,412
MALE POPULATION
1,257
FEMALE POPULATION
112.33
MALES / 100 FEMALES
89.02
FEMALES / 100 MALES
46.9
MEDIAN AGE
2.9
AVG FAMILY SIZE
2.2
AVG HOUSEHOLD SIZE
$47,163
PER CAPITA INCOME
$97,127
AVG FAMILY INCOME
$79,290
AVG HOUSEHOLD INCOME
42.4%
WAGE / INCOME GAP [ % ]
57.6¢/ $1
WAGE / INCOME GAP [ $ ]
0.48
INEQUALITY / GINI INDEX
1,351
LABOR FORCE [ PEOPLE ]
58.9%
PERCENT IN LABOR FORCE
4.4%
UNEMPLOYMENT RATE
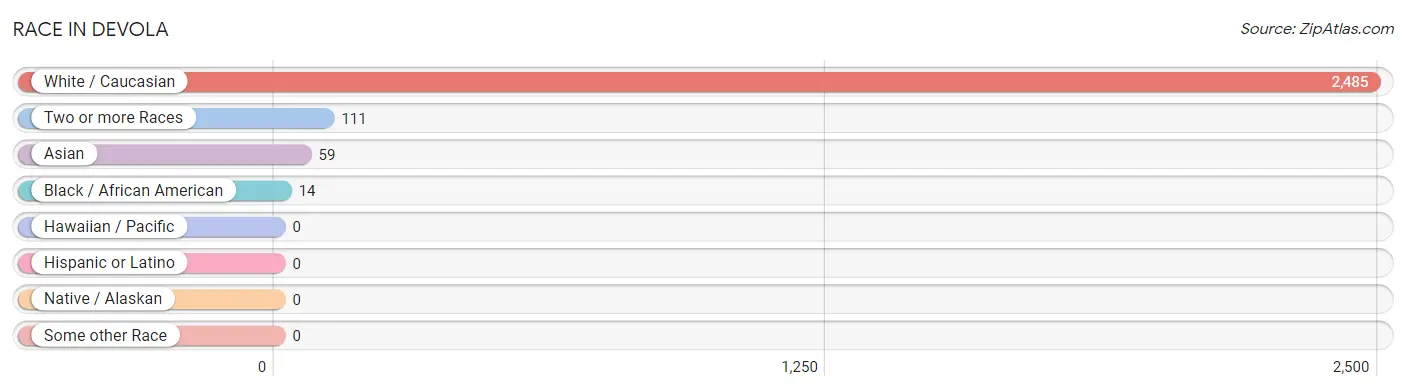
Race in Devola
The most populous races in Devola are White / Caucasian (2,485 | 93.1%), Two or more Races (111 | 4.2%), and Asian (59 | 2.2%).
| Race | # Population | % Population |
| Asian | 59 | 2.2% |
| Black / African American | 14 | 0.5% |
| Hawaiian / Pacific | 0 | 0.0% |
| Hispanic or Latino | 0 | 0.0% |
| Native / Alaskan | 0 | 0.0% |
| White / Caucasian | 2,485 | 93.1% |
| Two or more Races | 111 | 4.2% |
| Some other Race | 0 | 0.0% |
| Total | 2,669 | 100.0% |
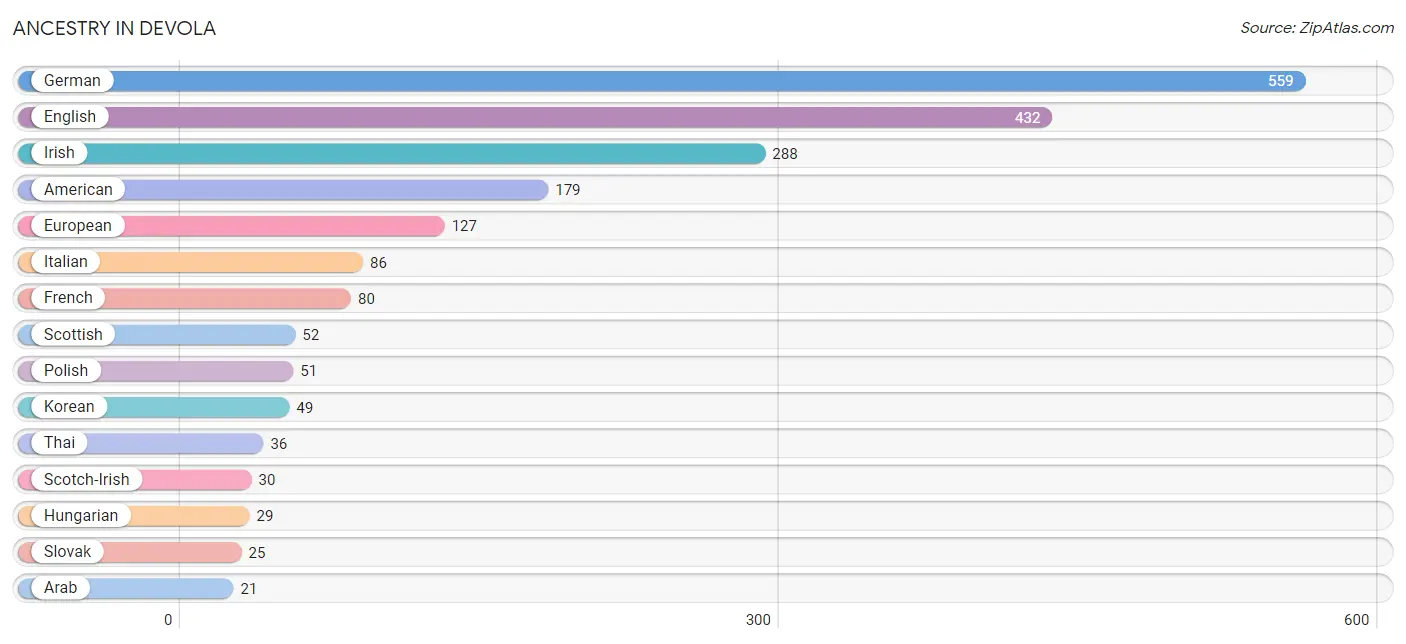
Ancestry in Devola
The most populous ancestries reported in Devola are German (559 | 20.9%), English (432 | 16.2%), Irish (288 | 10.8%), American (179 | 6.7%), and European (127 | 4.8%), together accounting for 59.4% of all Devola residents.
| Ancestry | # Population | % Population |
| African | 1 | 0.0% |
| American | 179 | 6.7% |
| Arab | 21 | 0.8% |
| Brazilian | 19 | 0.7% |
| British | 3 | 0.1% |
| Czech | 7 | 0.3% |
| Dutch | 15 | 0.6% |
| English | 432 | 16.2% |
| European | 127 | 4.8% |
| French | 80 | 3.0% |
| German | 559 | 20.9% |
| Hungarian | 29 | 1.1% |
| Indian (Asian) | 8 | 0.3% |
| Irish | 288 | 10.8% |
| Italian | 86 | 3.2% |
| Korean | 49 | 1.8% |
| Lebanese | 21 | 0.8% |
| Polish | 51 | 1.9% |
| Romanian | 8 | 0.3% |
| Scotch-Irish | 30 | 1.1% |
| Scottish | 52 | 1.9% |
| Slovak | 25 | 0.9% |
| Subsaharan African | 1 | 0.0% |
| Swedish | 1 | 0.0% |
| Swiss | 11 | 0.4% |
| Thai | 36 | 1.3% |
| Welsh | 9 | 0.3% | View All 27 Rows |
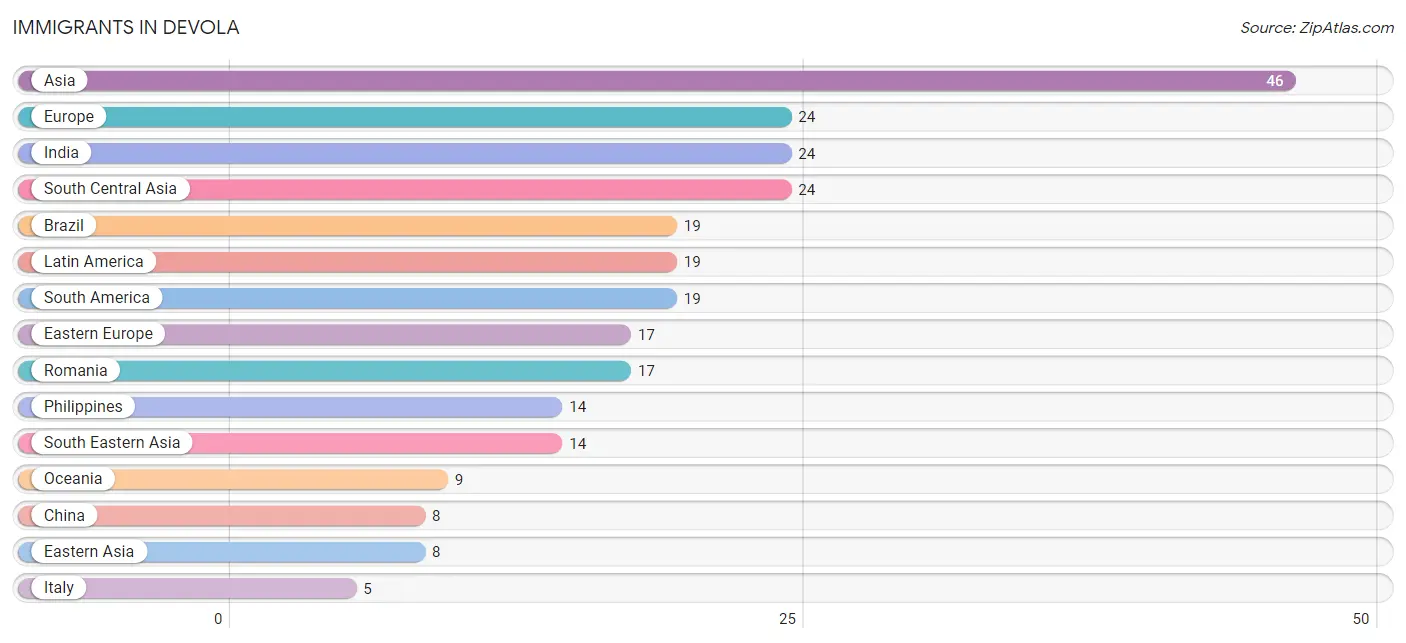
Immigrants in Devola
The most numerous immigrant groups reported in Devola came from Asia (46 | 1.7%), Europe (24 | 0.9%), India (24 | 0.9%), South Central Asia (24 | 0.9%), and Brazil (19 | 0.7%), together accounting for 5.1% of all Devola residents.
| Immigration Origin | # Population | % Population |
| Asia | 46 | 1.7% |
| Brazil | 19 | 0.7% |
| China | 8 | 0.3% |
| Eastern Asia | 8 | 0.3% |
| Eastern Europe | 17 | 0.6% |
| Europe | 24 | 0.9% |
| Germany | 2 | 0.1% |
| India | 24 | 0.9% |
| Italy | 5 | 0.2% |
| Latin America | 19 | 0.7% |
| Oceania | 9 | 0.3% |
| Philippines | 14 | 0.5% |
| Romania | 17 | 0.6% |
| South America | 19 | 0.7% |
| South Central Asia | 24 | 0.9% |
| South Eastern Asia | 14 | 0.5% |
| Southern Europe | 5 | 0.2% |
| Western Europe | 2 | 0.1% | View All 18 Rows |
Sex and Age in Devola
Sex and Age in Devola
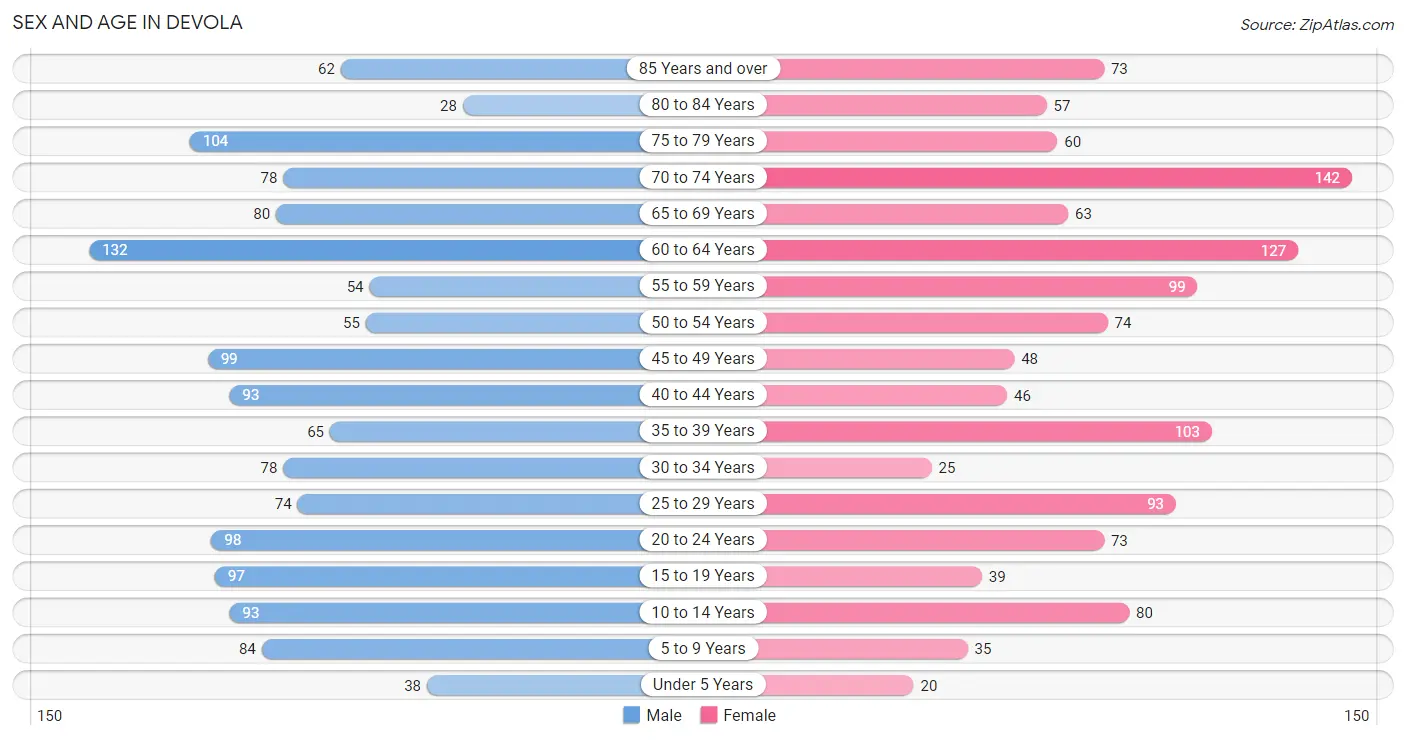
The most populous age groups in Devola are 60 to 64 Years (132 | 9.3%) for men and 70 to 74 Years (142 | 11.3%) for women.
| Age Bracket | Male | Female |
| Under 5 Years | 38 (2.7%) | 20 (1.6%) |
| 5 to 9 Years | 84 (5.9%) | 35 (2.8%) |
| 10 to 14 Years | 93 (6.6%) | 80 (6.4%) |
| 15 to 19 Years | 97 (6.9%) | 39 (3.1%) |
| 20 to 24 Years | 98 (6.9%) | 73 (5.8%) |
| 25 to 29 Years | 74 (5.2%) | 93 (7.4%) |
| 30 to 34 Years | 78 (5.5%) | 25 (2.0%) |
| 35 to 39 Years | 65 (4.6%) | 103 (8.2%) |
| 40 to 44 Years | 93 (6.6%) | 46 (3.7%) |
| 45 to 49 Years | 99 (7.0%) | 48 (3.8%) |
| 50 to 54 Years | 55 (3.9%) | 74 (5.9%) |
| 55 to 59 Years | 54 (3.8%) | 99 (7.9%) |
| 60 to 64 Years | 132 (9.3%) | 127 (10.1%) |
| 65 to 69 Years | 80 (5.7%) | 63 (5.0%) |
| 70 to 74 Years | 78 (5.5%) | 142 (11.3%) |
| 75 to 79 Years | 104 (7.4%) | 60 (4.8%) |
| 80 to 84 Years | 28 (2.0%) | 57 (4.5%) |
| 85 Years and over | 62 (4.4%) | 73 (5.8%) |
| Total | 1,412 (100.0%) | 1,257 (100.0%) |
Families and Households in Devola
Median Family Size in Devola
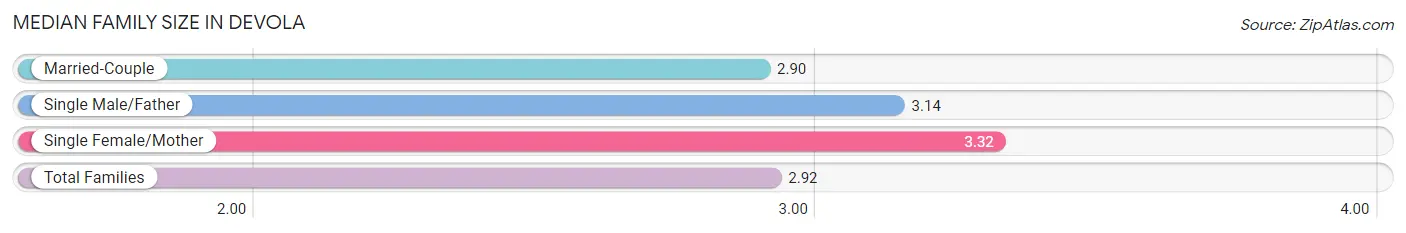
The median family size in Devola is 2.92 persons per family, with single female/mother families (19 | 2.8%) accounting for the largest median family size of 3.32 persons per family. On the other hand, married-couple families (625 | 92.0%) represent the smallest median family size with 2.90 persons per family.
| Family Type | # Families | Family Size |
| Married-Couple | 625 (92.0%) | 2.90 |
| Single Male/Father | 35 (5.1%) | 3.14 |
| Single Female/Mother | 19 (2.8%) | 3.32 |
| Total Families | 679 (100.0%) | 2.92 |
Median Household Size in Devola
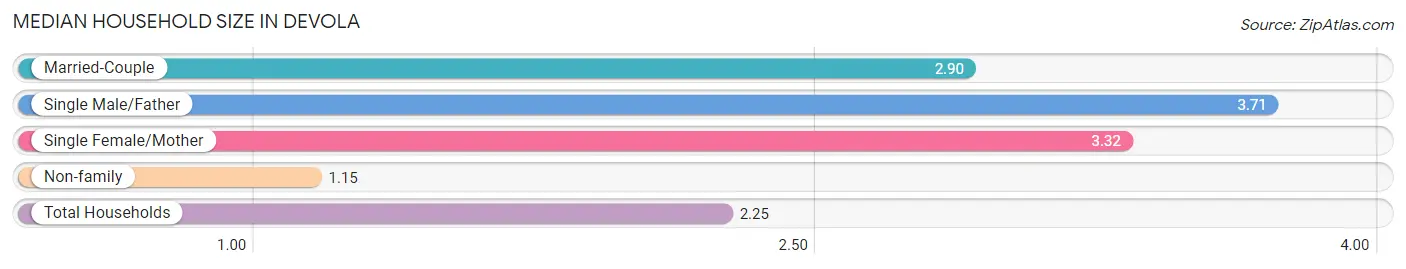
The median household size in Devola is 2.25 persons per household, with single male/father households (35 | 3.1%) accounting for the largest median household size of 3.71 persons per household. non-family households (436 | 39.1%) represent the smallest median household size with 1.15 persons per household.
| Household Type | # Households | Household Size |
| Married-Couple | 625 (56.0%) | 2.90 |
| Single Male/Father | 35 (3.1%) | 3.71 |
| Single Female/Mother | 19 (1.7%) | 3.32 |
| Non-family | 436 (39.1%) | 1.15 |
| Total Households | 1,115 (100.0%) | 2.25 |
Household Size by Marriage Status in Devola
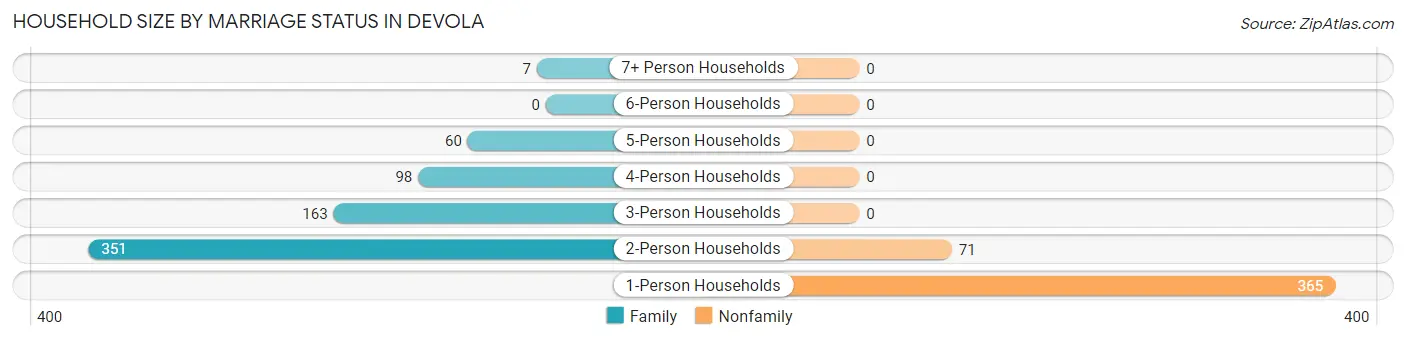
Out of a total of 1,115 households in Devola, 679 (60.9%) are family households, while 436 (39.1%) are nonfamily households. The most numerous type of family households are 2-person households, comprising 351, and the most common type of nonfamily households are 1-person households, comprising 365.
| Household Size | Family Households | Nonfamily Households |
| 1-Person Households | - | 365 (32.7%) |
| 2-Person Households | 351 (31.5%) | 71 (6.4%) |
| 3-Person Households | 163 (14.6%) | 0 (0.0%) |
| 4-Person Households | 98 (8.8%) | 0 (0.0%) |
| 5-Person Households | 60 (5.4%) | 0 (0.0%) |
| 6-Person Households | 0 (0.0%) | 0 (0.0%) |
| 7+ Person Households | 7 (0.6%) | 0 (0.0%) |
| Total | 679 (60.9%) | 436 (39.1%) |
Female Fertility in Devola
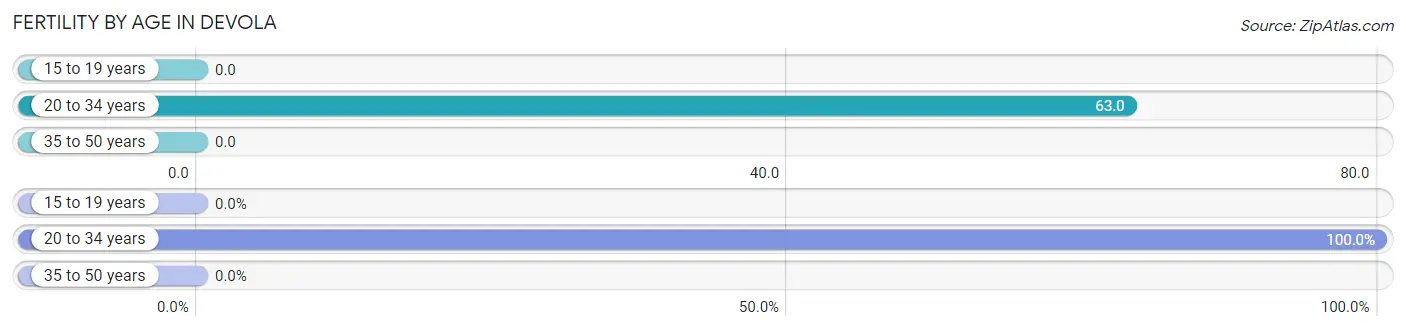
Fertility by Age in Devola
Average fertility rate in Devola is 28.0 births per 1,000 women. Women in the age bracket of 20 to 34 years have the highest fertility rate with 63.0 births per 1,000 women. Women in the age bracket of 20 to 34 years acount for 100.0% of all women with births.
| Age Bracket | Women with Births | Births / 1,000 Women |
| 15 to 19 years | 0 (0.0%) | 0.0 |
| 20 to 34 years | 12 (100.0%) | 63.0 |
| 35 to 50 years | 0 (0.0%) | 0.0 |
| Total | 12 (100.0%) | 28.0 |
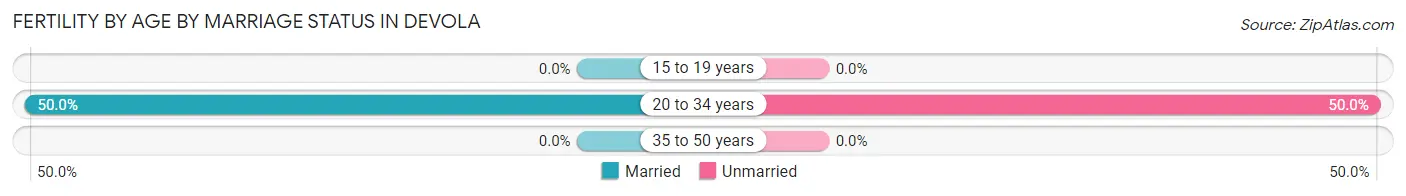
Fertility by Age by Marriage Status in Devola
50.0% of women with births (12) in Devola are married. The highest percentage of unmarried women with births falls into 20 to 34 years age bracket with 50.0% of them unmarried at the time of birth, while the lowest percentage of unmarried women with births belong to 20 to 34 years age bracket with 50.0% of them unmarried.
| Age Bracket | Married | Unmarried |
| 15 to 19 years | 0 (0.0%) | 0 (0.0%) |
| 20 to 34 years | 6 (50.0%) | 6 (50.0%) |
| 35 to 50 years | 0 (0.0%) | 0 (0.0%) |
| Total | 6 (50.0%) | 6 (50.0%) |
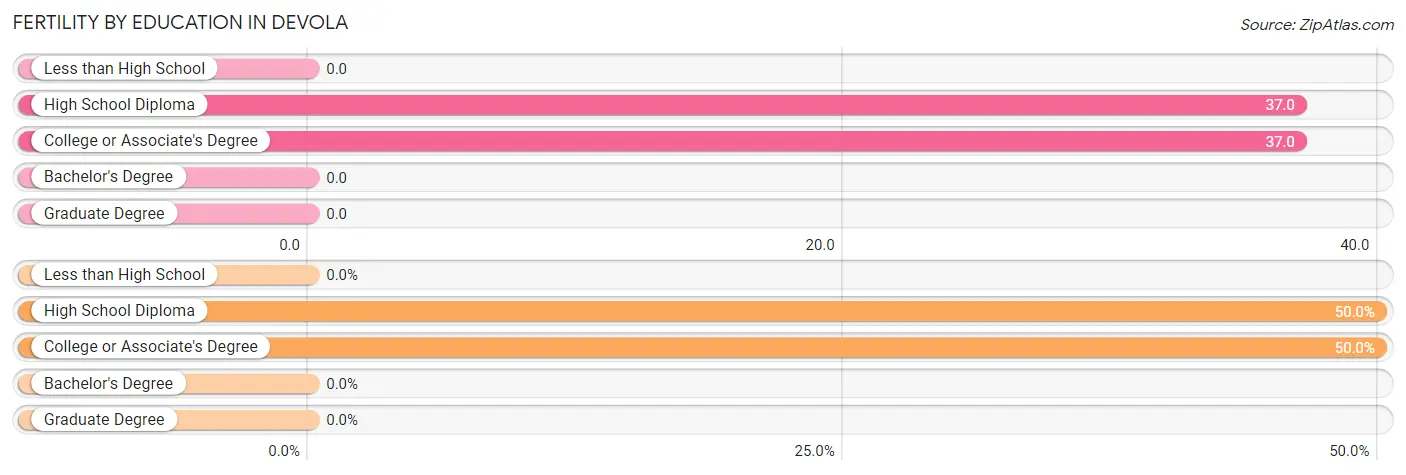
Fertility by Education in Devola
| Educational Attainment | Women with Births | Births / 1,000 Women |
| Less than High School | 0 (0.0%) | 0.0 |
| High School Diploma | 6 (50.0%) | 37.0 |
| College or Associate's Degree | 6 (50.0%) | 37.0 |
| Bachelor's Degree | 0 (0.0%) | 0.0 |
| Graduate Degree | 0 (0.0%) | 0.0 |
| Total | 12 (100.0%) | 28.0 |
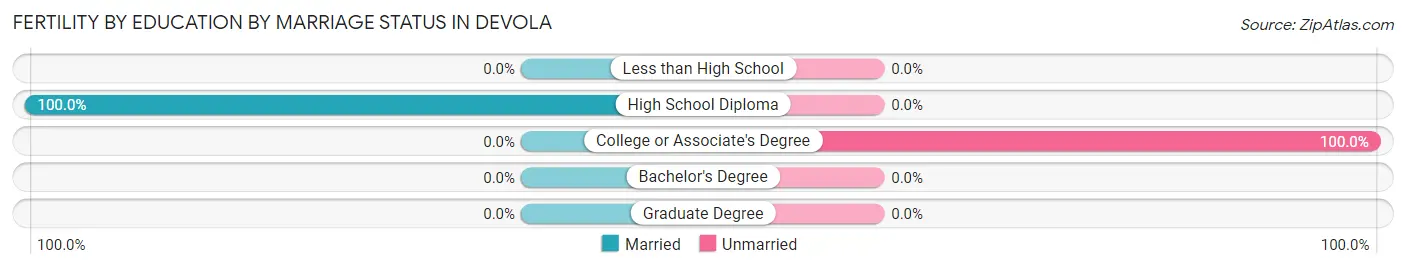
Fertility by Education by Marriage Status in Devola
50.0% of women with births in Devola are unmarried. Women with the educational attainment of high school diploma are most likely to be married with 100.0% of them married at childbirth, while women with the educational attainment of college or associate's degree are least likely to be married with 100.0% of them unmarried at childbirth.
| Educational Attainment | Married | Unmarried |
| Less than High School | 0 (0.0%) | 0 (0.0%) |
| High School Diploma | 6 (100.0%) | 0 (0.0%) |
| College or Associate's Degree | 0 (0.0%) | 6 (100.0%) |
| Bachelor's Degree | 0 (0.0%) | 0 (0.0%) |
| Graduate Degree | 0 (0.0%) | 0 (0.0%) |
| Total | 6 (50.0%) | 6 (50.0%) |
Income in Devola
Income Overview in Devola
Per Capita Income in Devola is $47,163, while median incomes of families and households are $97,127 and $79,290 respectively.
| Characteristic | Number | Measure |
| Per Capita Income | 2,669 | $47,163 |
| Median Family Income | 679 | $97,127 |
| Mean Family Income | 679 | $142,776 |
| Median Household Income | 1,115 | $79,290 |
| Mean Household Income | 1,115 | $110,389 |
| Income Deficit | 679 | $0 |
| Wage / Income Gap (%) | 2,669 | 42.36% |
| Wage / Income Gap ($) | 2,669 | 57.64¢ per $1 |
| Gini / Inequality Index | 2,669 | 0.48 |
Earnings by Sex in Devola
Average Earnings in Devola are $42,400, $58,819 for men and $33,904 for women, a difference of 42.4%.
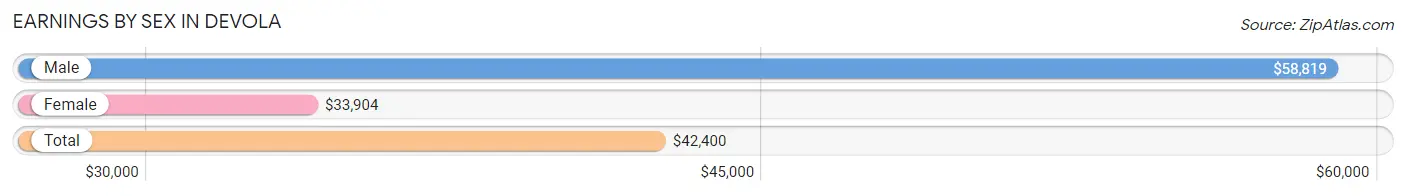
| Sex | Number | Average Earnings |
| Male | 788 (54.9%) | $58,819 |
| Female | 648 (45.1%) | $33,904 |
| Total | 1,436 (100.0%) | $42,400 |
Earnings by Sex by Income Bracket in Devola
The most common earnings brackets in Devola are $100,000+ for men (189 | 24.0%) and $30,000 to $34,999 for women (86 | 13.3%).
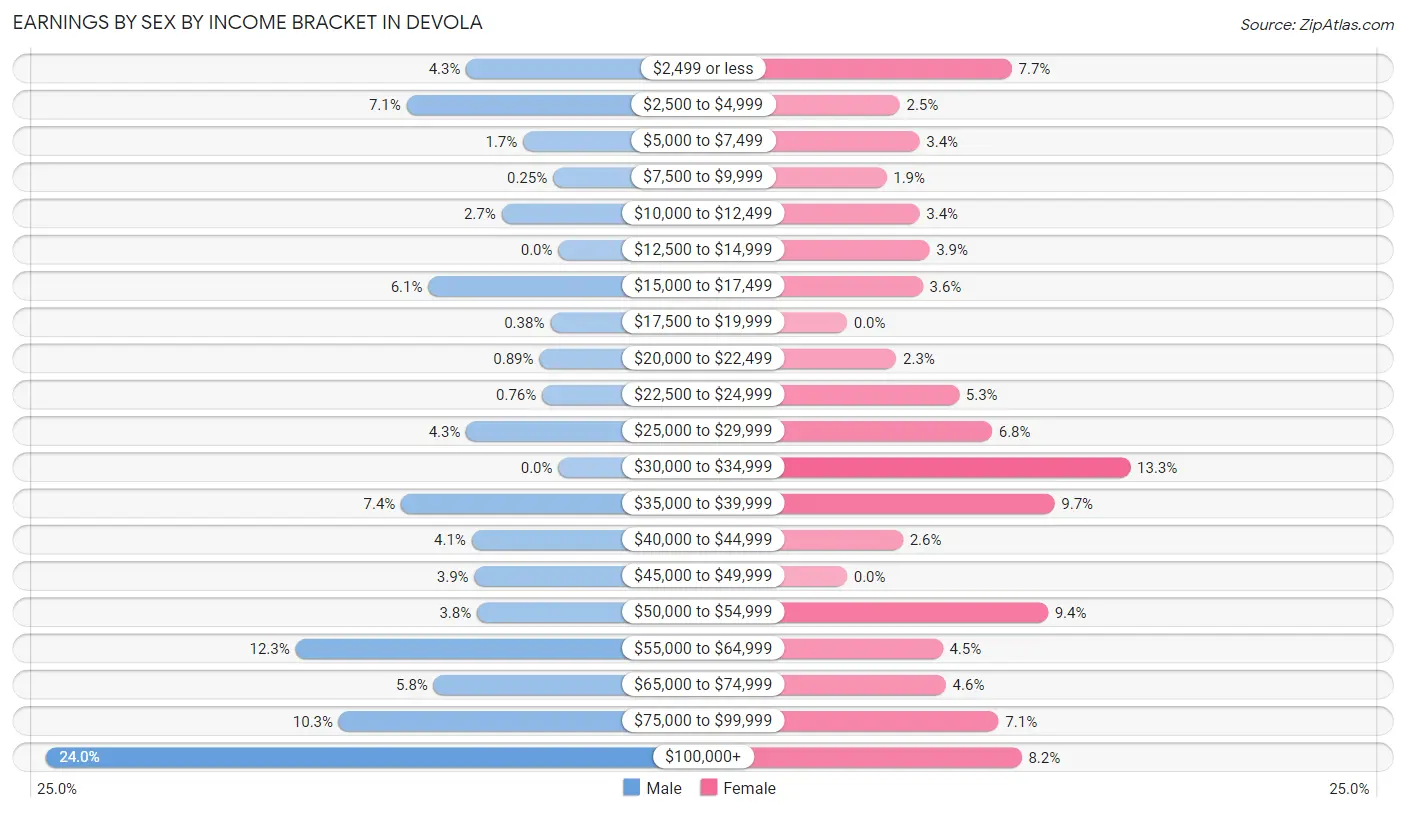
| Income | Male | Female |
| $2,499 or less | 34 (4.3%) | 50 (7.7%) |
| $2,500 to $4,999 | 56 (7.1%) | 16 (2.5%) |
| $5,000 to $7,499 | 13 (1.7%) | 22 (3.4%) |
| $7,500 to $9,999 | 2 (0.3%) | 12 (1.8%) |
| $10,000 to $12,499 | 21 (2.7%) | 22 (3.4%) |
| $12,500 to $14,999 | 0 (0.0%) | 25 (3.9%) |
| $15,000 to $17,499 | 48 (6.1%) | 23 (3.5%) |
| $17,500 to $19,999 | 3 (0.4%) | 0 (0.0%) |
| $20,000 to $22,499 | 7 (0.9%) | 15 (2.3%) |
| $22,500 to $24,999 | 6 (0.8%) | 34 (5.2%) |
| $25,000 to $29,999 | 34 (4.3%) | 44 (6.8%) |
| $30,000 to $34,999 | 0 (0.0%) | 86 (13.3%) |
| $35,000 to $39,999 | 58 (7.4%) | 63 (9.7%) |
| $40,000 to $44,999 | 32 (4.1%) | 17 (2.6%) |
| $45,000 to $49,999 | 31 (3.9%) | 0 (0.0%) |
| $50,000 to $54,999 | 30 (3.8%) | 61 (9.4%) |
| $55,000 to $64,999 | 97 (12.3%) | 29 (4.5%) |
| $65,000 to $74,999 | 46 (5.8%) | 30 (4.6%) |
| $75,000 to $99,999 | 81 (10.3%) | 46 (7.1%) |
| $100,000+ | 189 (24.0%) | 53 (8.2%) |
| Total | 788 (100.0%) | 648 (100.0%) |
Earnings by Sex by Educational Attainment in Devola
Average earnings in Devola are $64,180 for men and $35,000 for women, a difference of 45.5%. Men with an educational attainment of graduate degree enjoy the highest average annual earnings of $116,080, while those with high school diploma education earn the least with $46,667. Women with an educational attainment of graduate degree earn the most with the average annual earnings of $72,708, while those with college or associate's degree education have the smallest earnings of $31,989.
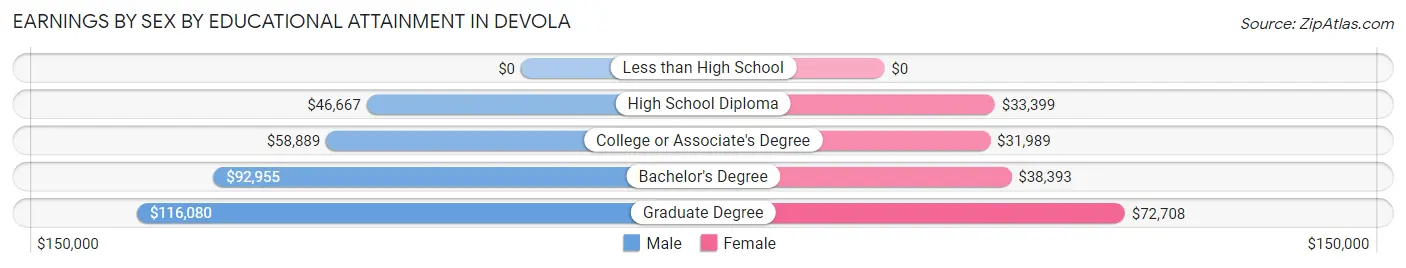
| Educational Attainment | Male Income | Female Income |
| Less than High School | - | - |
| High School Diploma | $46,667 | $33,399 |
| College or Associate's Degree | $58,889 | $31,989 |
| Bachelor's Degree | $92,955 | $38,393 |
| Graduate Degree | $116,080 | $72,708 |
| Total | $64,180 | $35,000 |
Family Income in Devola
Family Income Brackets in Devola
According to the Devola family income data, there are 159 families falling into the $100,000 to $149,999 income range, which is the most common income bracket and makes up 23.4% of all families.
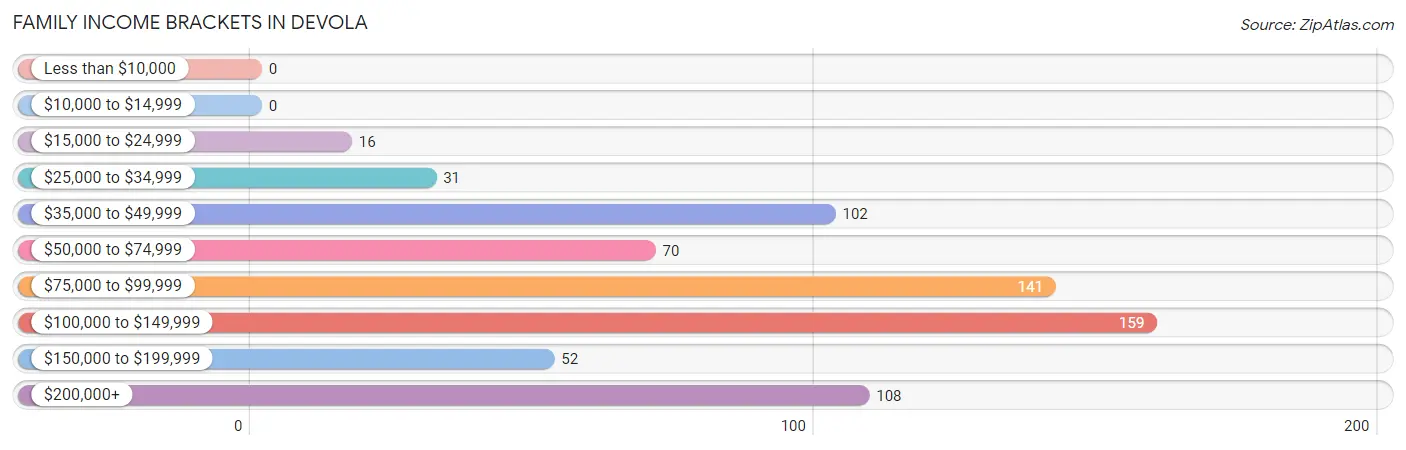
| Income Bracket | # Families | % Families |
| Less than $10,000 | 0 | 0.0% |
| $10,000 to $14,999 | 0 | 0.0% |
| $15,000 to $24,999 | 16 | 2.4% |
| $25,000 to $34,999 | 31 | 4.6% |
| $35,000 to $49,999 | 102 | 15.0% |
| $50,000 to $74,999 | 70 | 10.3% |
| $75,000 to $99,999 | 141 | 20.8% |
| $100,000 to $149,999 | 159 | 23.4% |
| $150,000 to $199,999 | 52 | 7.7% |
| $200,000+ | 108 | 15.9% |
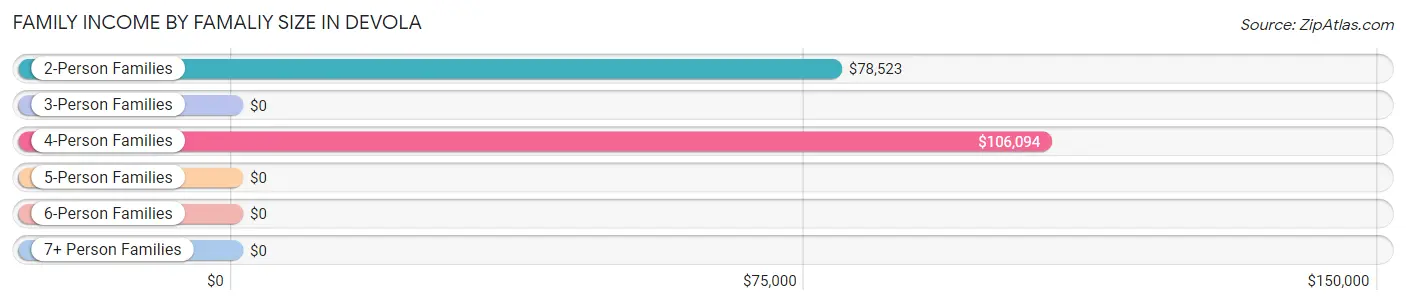
Family Income by Famaliy Size in Devola
4-person families (99 | 14.6%) account for the highest median family income in Devola with $106,094 per family, while 2-person families (356 | 52.4%) have the highest median income of $39,262 per family member.
| Income Bracket | # Families | Median Income |
| 2-Person Families | 356 (52.4%) | $78,523 |
| 3-Person Families | 165 (24.3%) | $0 |
| 4-Person Families | 99 (14.6%) | $106,094 |
| 5-Person Families | 52 (7.7%) | $0 |
| 6-Person Families | 0 (0.0%) | $0 |
| 7+ Person Families | 7 (1.0%) | $0 |
| Total | 679 (100.0%) | $97,127 |
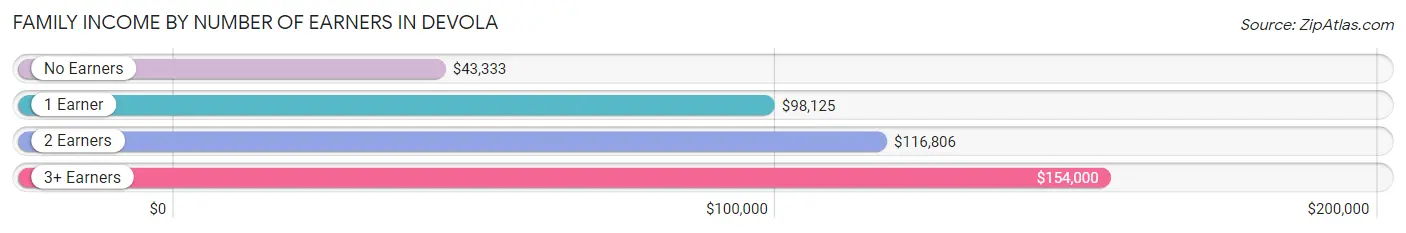
Family Income by Number of Earners in Devola
The median family income in Devola is $97,127, with families comprising 3+ earners (98) having the highest median family income of $154,000, while families with no earners (142) have the lowest median family income of $43,333, accounting for 14.4% and 20.9% of families, respectively.
| Number of Earners | # Families | Median Income |
| No Earners | 142 (20.9%) | $43,333 |
| 1 Earner | 170 (25.0%) | $98,125 |
| 2 Earners | 269 (39.6%) | $116,806 |
| 3+ Earners | 98 (14.4%) | $154,000 |
| Total | 679 (100.0%) | $97,127 |
Household Income in Devola
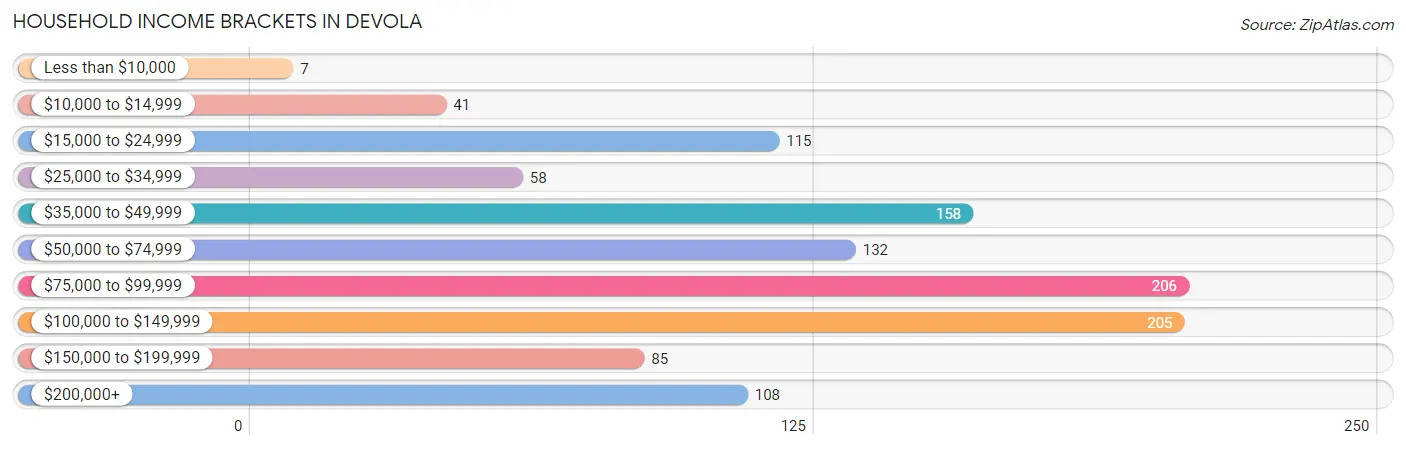
Household Income Brackets in Devola
With 206 households falling in the category, the $75,000 to $99,999 income range is the most frequent in Devola, accounting for 18.5% of all households. In contrast, only 7 households (0.6%) fall into the less than $10,000 income bracket, making it the least populous group.
| Income Bracket | # Households | % Households |
| Less than $10,000 | 7 | 0.6% |
| $10,000 to $14,999 | 41 | 3.7% |
| $15,000 to $24,999 | 115 | 10.3% |
| $25,000 to $34,999 | 58 | 5.2% |
| $35,000 to $49,999 | 158 | 14.2% |
| $50,000 to $74,999 | 132 | 11.8% |
| $75,000 to $99,999 | 206 | 18.5% |
| $100,000 to $149,999 | 205 | 18.4% |
| $150,000 to $199,999 | 85 | 7.6% |
| $200,000+ | 108 | 9.7% |
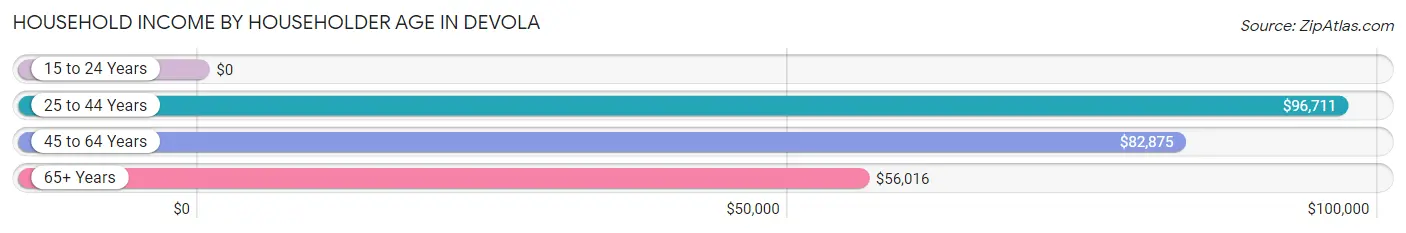
Household Income by Householder Age in Devola
The median household income in Devola is $79,290, with the highest median household income of $96,711 found in the 25 to 44 years age bracket for the primary householder. A total of 298 households (26.7%) fall into this category. Meanwhile, the 15 to 24 years age bracket for the primary householder has the lowest median household income of $0, with 1 households (0.1%) in this group.
| Income Bracket | # Households | Median Income |
| 15 to 24 Years | 1 (0.1%) | $0 |
| 25 to 44 Years | 298 (26.7%) | $96,711 |
| 45 to 64 Years | 389 (34.9%) | $82,875 |
| 65+ Years | 427 (38.3%) | $56,016 |
| Total | 1,115 (100.0%) | $79,290 |
Poverty in Devola
Income Below Poverty by Sex and Age in Devola
With 4.5% poverty level for males and 7.2% for females among the residents of Devola, under 5 year old males and under 5 year old females are the most vulnerable to poverty, with 16 males (42.1%) and 7 females (35.0%) in their respective age groups living below the poverty level.
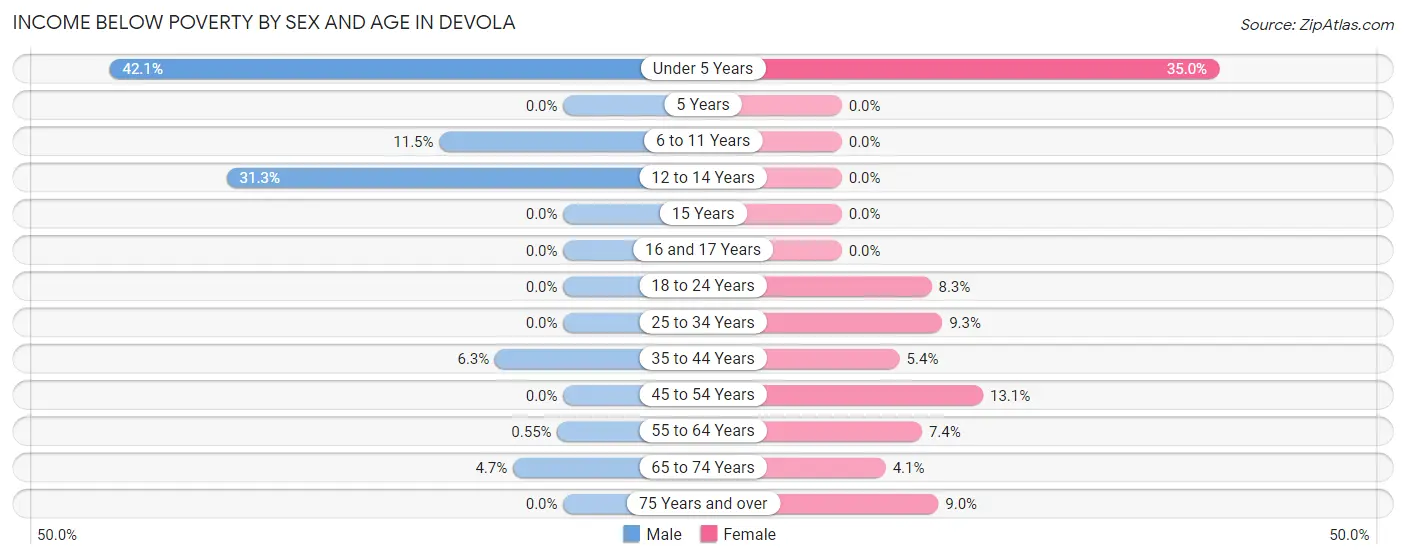
| Age Bracket | Male | Female |
| Under 5 Years | 16 (42.1%) | 7 (35.0%) |
| 5 Years | 0 (0.0%) | 0 (0.0%) |
| 6 to 11 Years | 16 (11.5%) | 0 (0.0%) |
| 12 to 14 Years | 10 (31.2%) | 0 (0.0%) |
| 15 Years | 0 (0.0%) | 0 (0.0%) |
| 16 and 17 Years | 0 (0.0%) | 0 (0.0%) |
| 18 to 24 Years | 0 (0.0%) | 6 (8.3%) |
| 25 to 34 Years | 0 (0.0%) | 11 (9.3%) |
| 35 to 44 Years | 10 (6.3%) | 8 (5.4%) |
| 45 to 54 Years | 0 (0.0%) | 16 (13.1%) |
| 55 to 64 Years | 1 (0.5%) | 16 (7.4%) |
| 65 to 74 Years | 7 (4.7%) | 8 (4.1%) |
| 75 Years and over | 0 (0.0%) | 12 (9.0%) |
| Total | 60 (4.5%) | 84 (7.2%) |
Income Above Poverty by Sex and Age in Devola
According to the poverty statistics in Devola, males aged 5 years and females aged 5 years are the age groups that are most secure financially, with 100.0% of males and 100.0% of females in these age groups living above the poverty line.
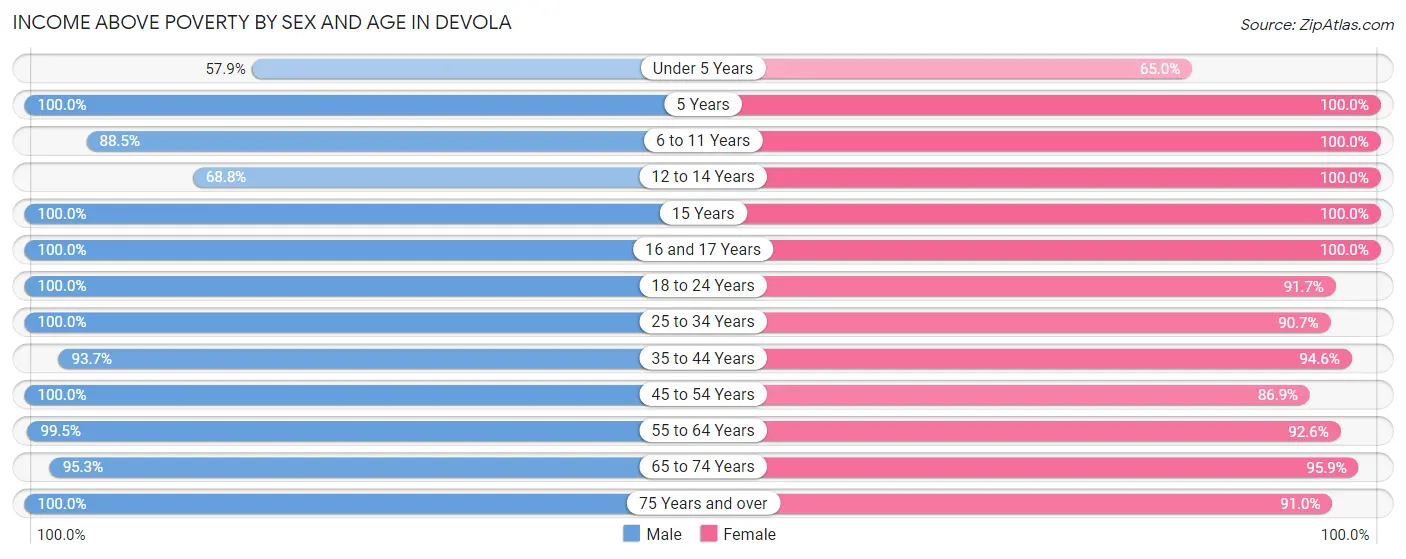
| Age Bracket | Male | Female |
| Under 5 Years | 22 (57.9%) | 13 (65.0%) |
| 5 Years | 6 (100.0%) | 8 (100.0%) |
| 6 to 11 Years | 123 (88.5%) | 68 (100.0%) |
| 12 to 14 Years | 22 (68.8%) | 39 (100.0%) |
| 15 Years | 12 (100.0%) | 14 (100.0%) |
| 16 and 17 Years | 12 (100.0%) | 17 (100.0%) |
| 18 to 24 Years | 131 (100.0%) | 66 (91.7%) |
| 25 to 34 Years | 138 (100.0%) | 107 (90.7%) |
| 35 to 44 Years | 148 (93.7%) | 141 (94.6%) |
| 45 to 54 Years | 154 (100.0%) | 106 (86.9%) |
| 55 to 64 Years | 180 (99.5%) | 199 (92.6%) |
| 65 to 74 Years | 143 (95.3%) | 188 (95.9%) |
| 75 Years and over | 185 (100.0%) | 122 (91.0%) |
| Total | 1,276 (95.5%) | 1,088 (92.8%) |
Income Below Poverty Among Married-Couple Families in Devola
The poverty statistics for married-couple families in Devola show that 1.6% or 10 of the total 625 families live below the poverty line. Families with 1 or 2 children have the highest poverty rate of 4.6%, comprising of 10 families. On the other hand, families with no children have the lowest poverty rate of 0.0%, which includes 0 families.
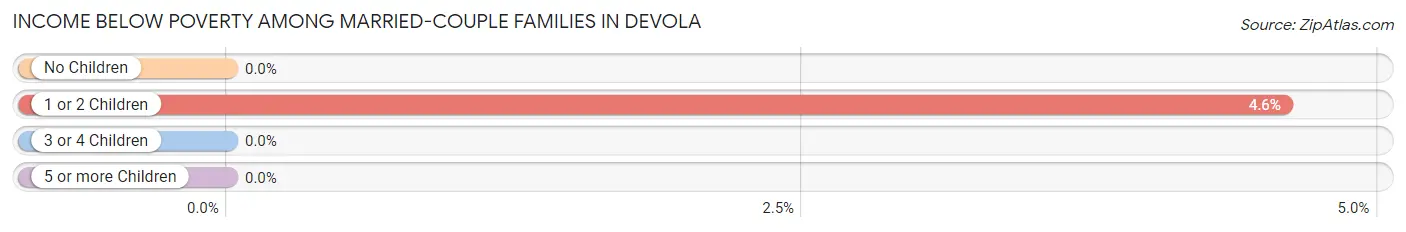
| Children | Above Poverty | Below Poverty |
| No Children | 382 (100.0%) | 0 (0.0%) |
| 1 or 2 Children | 208 (95.4%) | 10 (4.6%) |
| 3 or 4 Children | 25 (100.0%) | 0 (0.0%) |
| 5 or more Children | 0 (0.0%) | 0 (0.0%) |
| Total | 615 (98.4%) | 10 (1.6%) |
Income Below Poverty Among Single-Parent Households in Devola
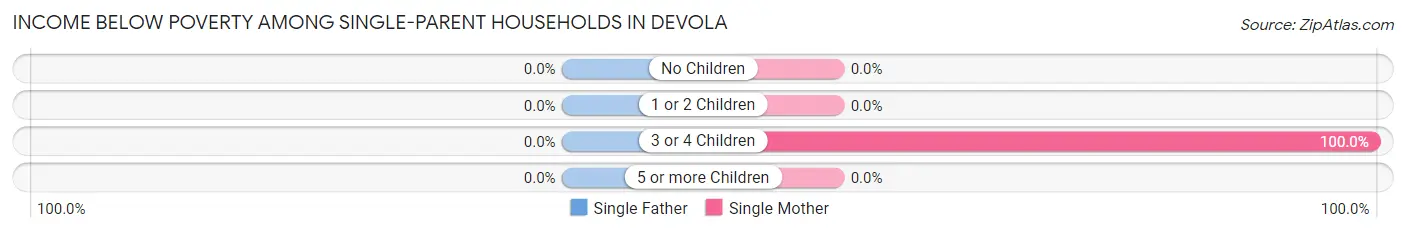
| Children | Single Father | Single Mother |
| No Children | 0 (0.0%) | 0 (0.0%) |
| 1 or 2 Children | 0 (0.0%) | 0 (0.0%) |
| 3 or 4 Children | 0 (0.0%) | 8 (100.0%) |
| 5 or more Children | 0 (0.0%) | 0 (0.0%) |
| Total | 0 (0.0%) | 8 (42.1%) |
Income Below Poverty Among Married-Couple vs Single-Parent Households in Devola
The poverty data for Devola shows that 10 of the married-couple family households (1.6%) and 8 of the single-parent households (14.8%) are living below the poverty level. Within the married-couple family households, those with 1 or 2 children have the highest poverty rate, with 10 households (4.6%) falling below the poverty line. Among the single-parent households, those with 3 or 4 children have the highest poverty rate, with 8 household (100.0%) living below poverty.
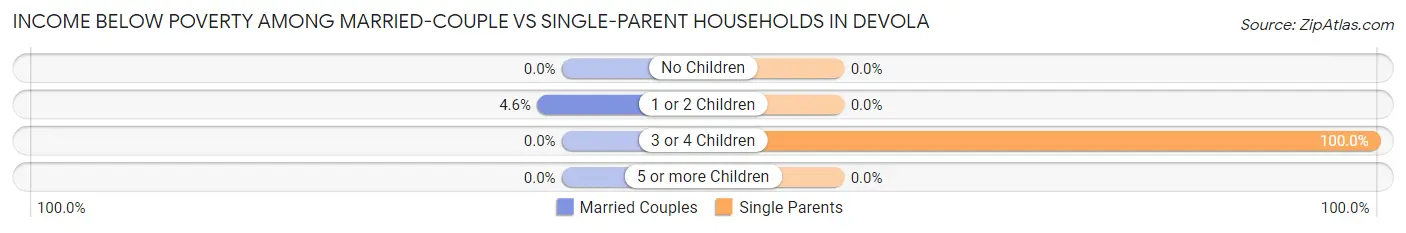
| Children | Married-Couple Families | Single-Parent Households |
| No Children | 0 (0.0%) | 0 (0.0%) |
| 1 or 2 Children | 10 (4.6%) | 0 (0.0%) |
| 3 or 4 Children | 0 (0.0%) | 8 (100.0%) |
| 5 or more Children | 0 (0.0%) | 0 (0.0%) |
| Total | 10 (1.6%) | 8 (14.8%) |
Employment Characteristics in Devola
Employment by Class of Employer in Devola
Among the 1,275 employed individuals in Devola, private company employees (765 | 60.0%), self-employed (not incorporated) (141 | 11.1%), and not-for-profit organizations (119 | 9.3%) make up the most common classes of employment.
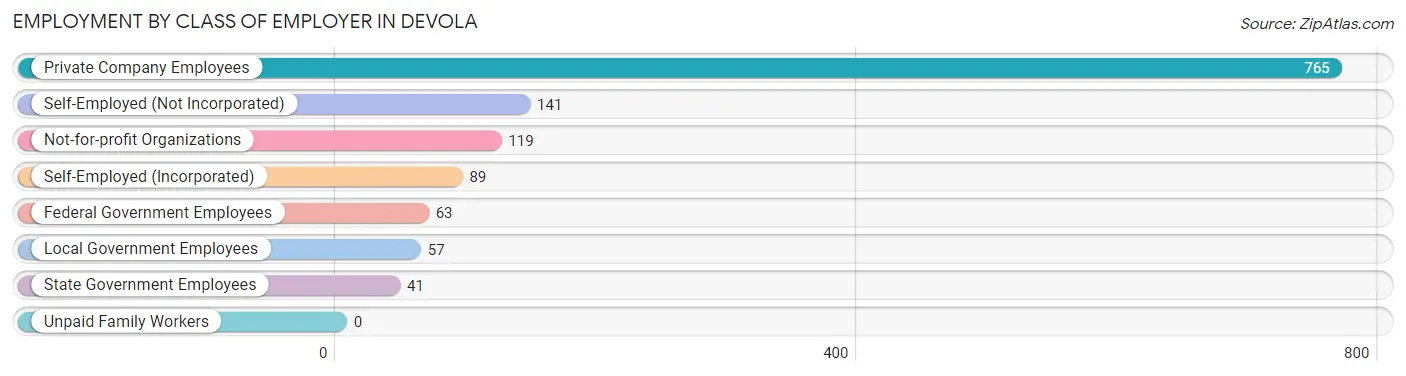
| Employer Class | # Employees | % Employees |
| Private Company Employees | 765 | 60.0% |
| Self-Employed (Incorporated) | 89 | 7.0% |
| Self-Employed (Not Incorporated) | 141 | 11.1% |
| Not-for-profit Organizations | 119 | 9.3% |
| Local Government Employees | 57 | 4.5% |
| State Government Employees | 41 | 3.2% |
| Federal Government Employees | 63 | 4.9% |
| Unpaid Family Workers | 0 | 0.0% |
| Total | 1,275 | 100.0% |
Employment Status by Age in Devola
According to the labor force statistics for Devola, out of the total population over 16 years of age (2,293), 58.9% or 1,351 individuals are in the labor force, with 4.4% or 59 of them unemployed. The age group with the highest labor force participation rate is 30 to 34 years, with 97.1% or 100 individuals in the labor force. Within the labor force, the 20 to 24 years age range has the highest percentage of unemployed individuals, with 44.8% or 47 of them being unemployed.
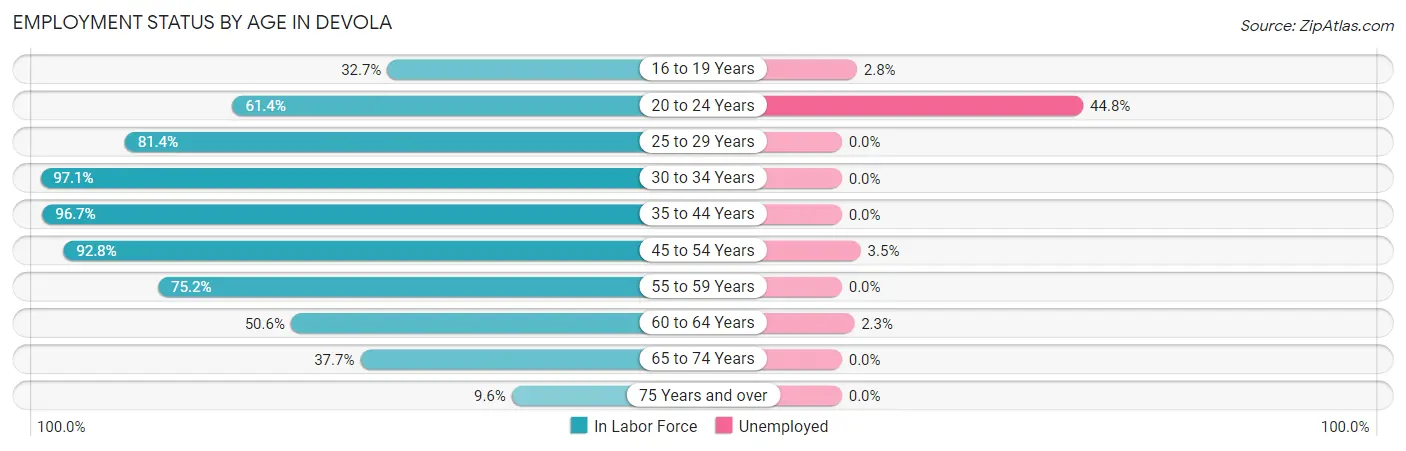
| Age Bracket | In Labor Force | Unemployed |
| 16 to 19 Years | 36 (32.7%) | 1 (2.8%) |
| 20 to 24 Years | 105 (61.4%) | 47 (44.8%) |
| 25 to 29 Years | 136 (81.4%) | 0 (0.0%) |
| 30 to 34 Years | 100 (97.1%) | 0 (0.0%) |
| 35 to 44 Years | 297 (96.7%) | 0 (0.0%) |
| 45 to 54 Years | 256 (92.8%) | 9 (3.5%) |
| 55 to 59 Years | 115 (75.2%) | 0 (0.0%) |
| 60 to 64 Years | 131 (50.6%) | 3 (2.3%) |
| 65 to 74 Years | 137 (37.7%) | 0 (0.0%) |
| 75 Years and over | 37 (9.6%) | 0 (0.0%) |
| Total | 1,351 (58.9%) | 59 (4.4%) |
Employment Status by Educational Attainment in Devola
According to labor force statistics for Devola, 81.8% of individuals (1,035) out of the total population between 25 and 64 years of age (1,265) are in the labor force, with 1.2% or 12 of them being unemployed. The group with the highest labor force participation rate are those with the educational attainment of less than high school, with 92.3% or 12 individuals in the labor force. Within the labor force, individuals with less than high school education have the highest percentage of unemployment, with 25.0% or 3 of them being unemployed.
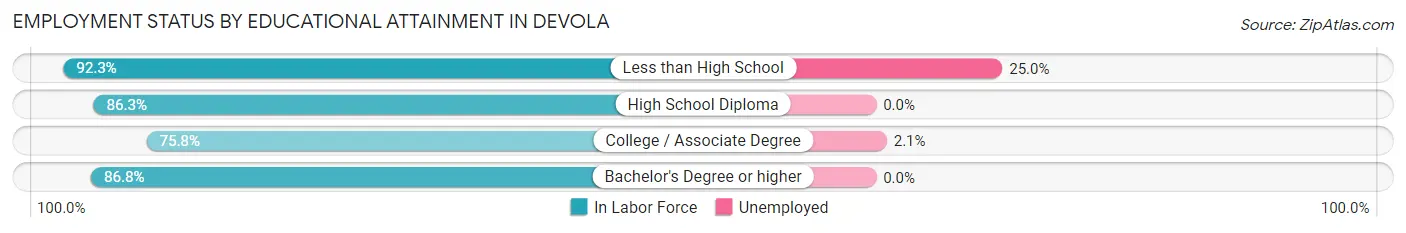
| Educational Attainment | In Labor Force | Unemployed |
| Less than High School | 12 (92.3%) | 3 (25.0%) |
| High School Diploma | 245 (86.3%) | 0 (0.0%) |
| College / Associate Degree | 428 (75.8%) | 12 (2.1%) |
| Bachelor's Degree or higher | 350 (86.8%) | 0 (0.0%) |
| Total | 1,035 (81.8%) | 15 (1.2%) |
Employment Occupations by Sex in Devola
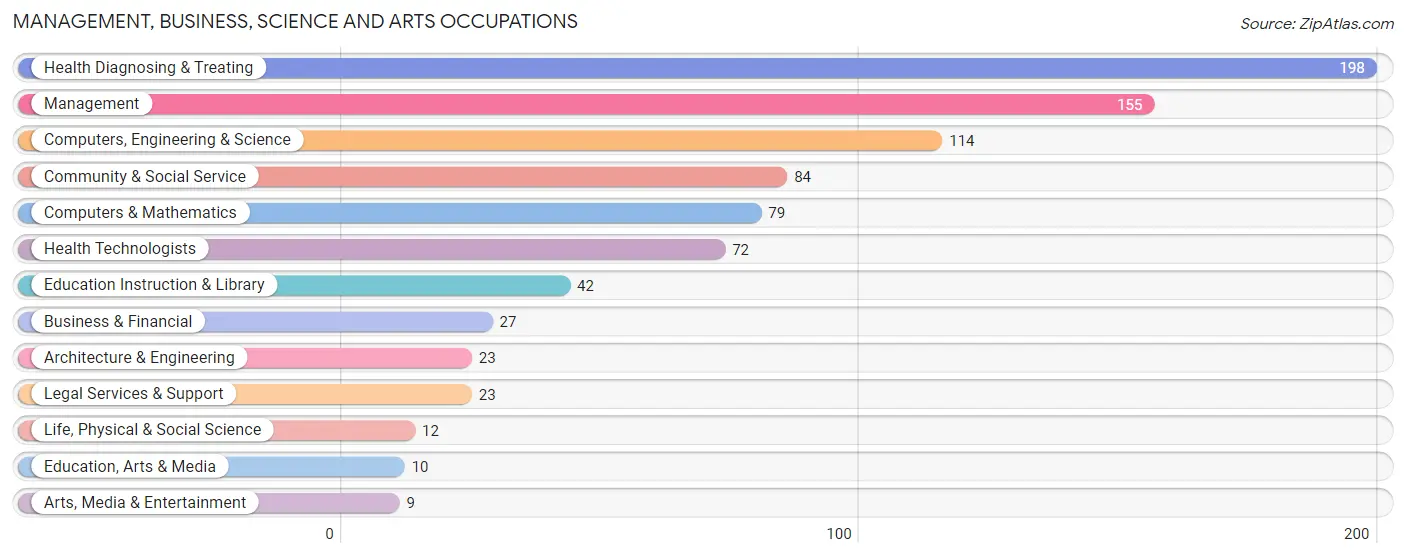
Management, Business, Science and Arts Occupations
The most common Management, Business, Science and Arts occupations in Devola are Health Diagnosing & Treating (198 | 15.3%), Management (155 | 12.0%), Computers, Engineering & Science (114 | 8.8%), Community & Social Service (84 | 6.5%), and Computers & Mathematics (79 | 6.1%).
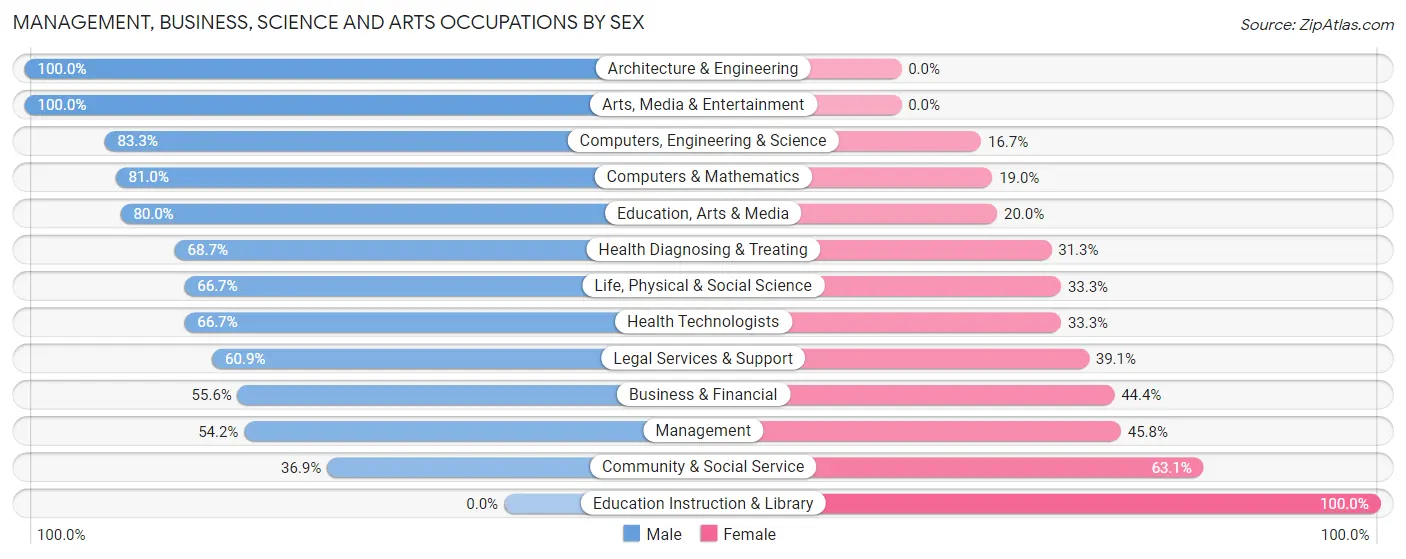
Management, Business, Science and Arts Occupations by Sex
Within the Management, Business, Science and Arts occupations in Devola, the most male-oriented occupations are Architecture & Engineering (100.0%), Arts, Media & Entertainment (100.0%), and Computers, Engineering & Science (83.3%), while the most female-oriented occupations are Education Instruction & Library (100.0%), Community & Social Service (63.1%), and Management (45.8%).
| Occupation | Male | Female |
| Management | 84 (54.2%) | 71 (45.8%) |
| Business & Financial | 15 (55.6%) | 12 (44.4%) |
| Computers, Engineering & Science | 95 (83.3%) | 19 (16.7%) |
| Computers & Mathematics | 64 (81.0%) | 15 (19.0%) |
| Architecture & Engineering | 23 (100.0%) | 0 (0.0%) |
| Life, Physical & Social Science | 8 (66.7%) | 4 (33.3%) |
| Community & Social Service | 31 (36.9%) | 53 (63.1%) |
| Education, Arts & Media | 8 (80.0%) | 2 (20.0%) |
| Legal Services & Support | 14 (60.9%) | 9 (39.1%) |
| Education Instruction & Library | 0 (0.0%) | 42 (100.0%) |
| Arts, Media & Entertainment | 9 (100.0%) | 0 (0.0%) |
| Health Diagnosing & Treating | 136 (68.7%) | 62 (31.3%) |
| Health Technologists | 48 (66.7%) | 24 (33.3%) |
| Total (Category) | 361 (62.5%) | 217 (37.5%) |
| Total (Overall) | 710 (55.0%) | 580 (45.0%) |
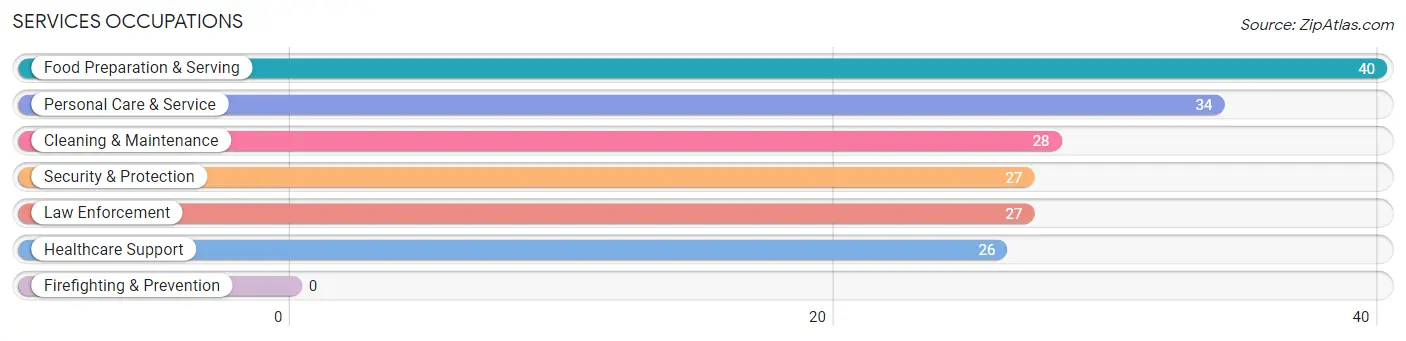
Services Occupations
The most common Services occupations in Devola are Food Preparation & Serving (40 | 3.1%), Personal Care & Service (34 | 2.6%), Cleaning & Maintenance (28 | 2.2%), Security & Protection (27 | 2.1%), and Law Enforcement (27 | 2.1%).
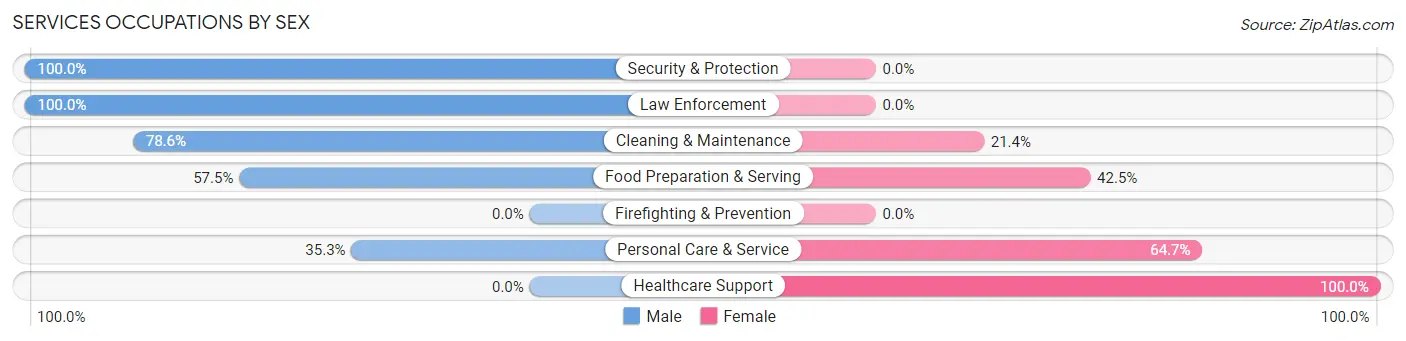
Services Occupations by Sex
Within the Services occupations in Devola, the most male-oriented occupations are Security & Protection (100.0%), Law Enforcement (100.0%), and Cleaning & Maintenance (78.6%), while the most female-oriented occupations are Healthcare Support (100.0%), Personal Care & Service (64.7%), and Food Preparation & Serving (42.5%).
| Occupation | Male | Female |
| Healthcare Support | 0 (0.0%) | 26 (100.0%) |
| Security & Protection | 27 (100.0%) | 0 (0.0%) |
| Firefighting & Prevention | 0 (0.0%) | 0 (0.0%) |
| Law Enforcement | 27 (100.0%) | 0 (0.0%) |
| Food Preparation & Serving | 23 (57.5%) | 17 (42.5%) |
| Cleaning & Maintenance | 22 (78.6%) | 6 (21.4%) |
| Personal Care & Service | 12 (35.3%) | 22 (64.7%) |
| Total (Category) | 84 (54.2%) | 71 (45.8%) |
| Total (Overall) | 710 (55.0%) | 580 (45.0%) |
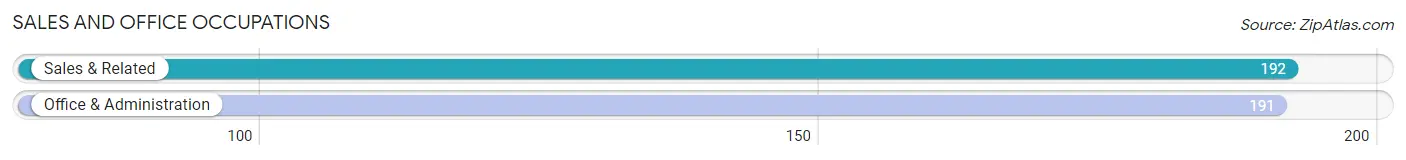
Sales and Office Occupations
The most common Sales and Office occupations in Devola are Sales & Related (192 | 14.9%), and Office & Administration (191 | 14.8%).
Sales and Office Occupations by Sex
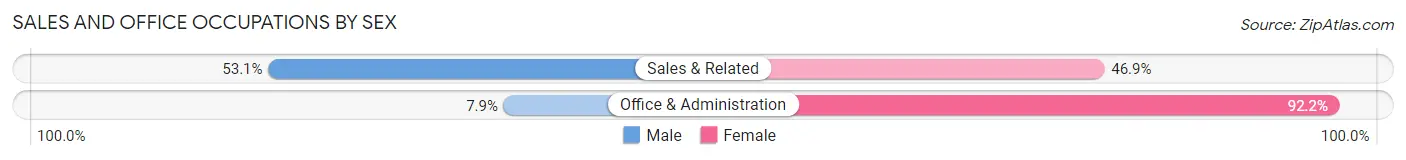
| Occupation | Male | Female |
| Sales & Related | 102 (53.1%) | 90 (46.9%) |
| Office & Administration | 15 (7.9%) | 176 (92.1%) |
| Total (Category) | 117 (30.5%) | 266 (69.5%) |
| Total (Overall) | 710 (55.0%) | 580 (45.0%) |
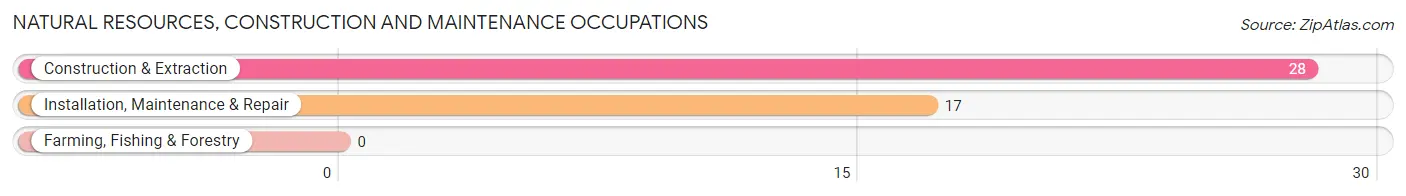
Natural Resources, Construction and Maintenance Occupations
The most common Natural Resources, Construction and Maintenance occupations in Devola are Construction & Extraction (28 | 2.2%), and Installation, Maintenance & Repair (17 | 1.3%).
Natural Resources, Construction and Maintenance Occupations by Sex
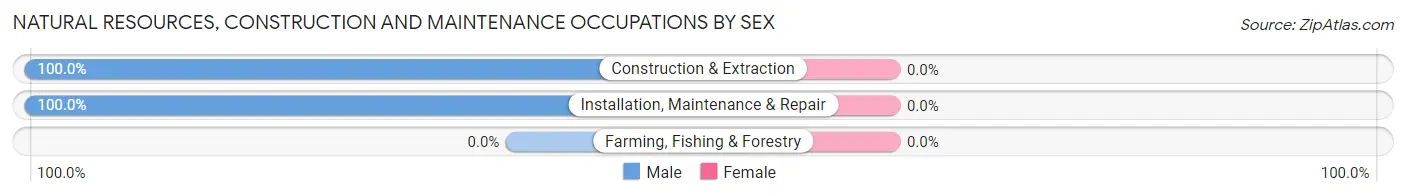
| Occupation | Male | Female |
| Farming, Fishing & Forestry | 0 (0.0%) | 0 (0.0%) |
| Construction & Extraction | 28 (100.0%) | 0 (0.0%) |
| Installation, Maintenance & Repair | 17 (100.0%) | 0 (0.0%) |
| Total (Category) | 45 (100.0%) | 0 (0.0%) |
| Total (Overall) | 710 (55.0%) | 580 (45.0%) |
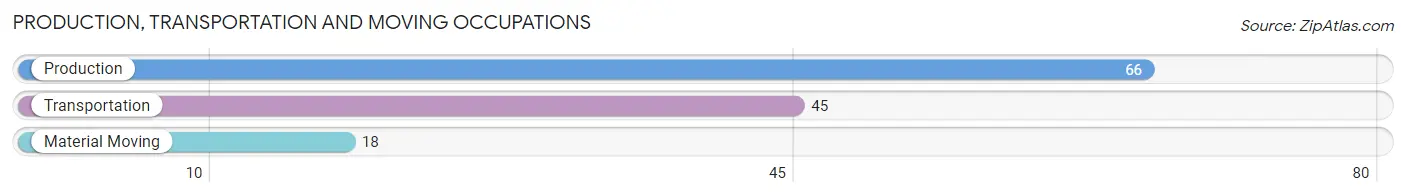
Production, Transportation and Moving Occupations
The most common Production, Transportation and Moving occupations in Devola are Production (66 | 5.1%), Transportation (45 | 3.5%), and Material Moving (18 | 1.4%).
Production, Transportation and Moving Occupations by Sex
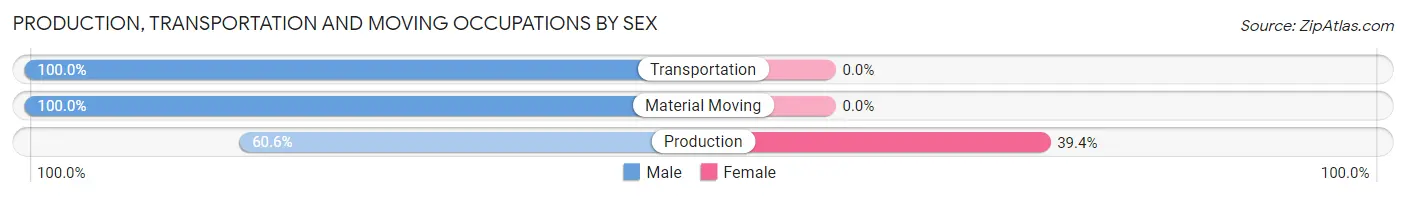
| Occupation | Male | Female |
| Production | 40 (60.6%) | 26 (39.4%) |
| Transportation | 45 (100.0%) | 0 (0.0%) |
| Material Moving | 18 (100.0%) | 0 (0.0%) |
| Total (Category) | 103 (79.8%) | 26 (20.2%) |
| Total (Overall) | 710 (55.0%) | 580 (45.0%) |
Employment Industries by Sex in Devola
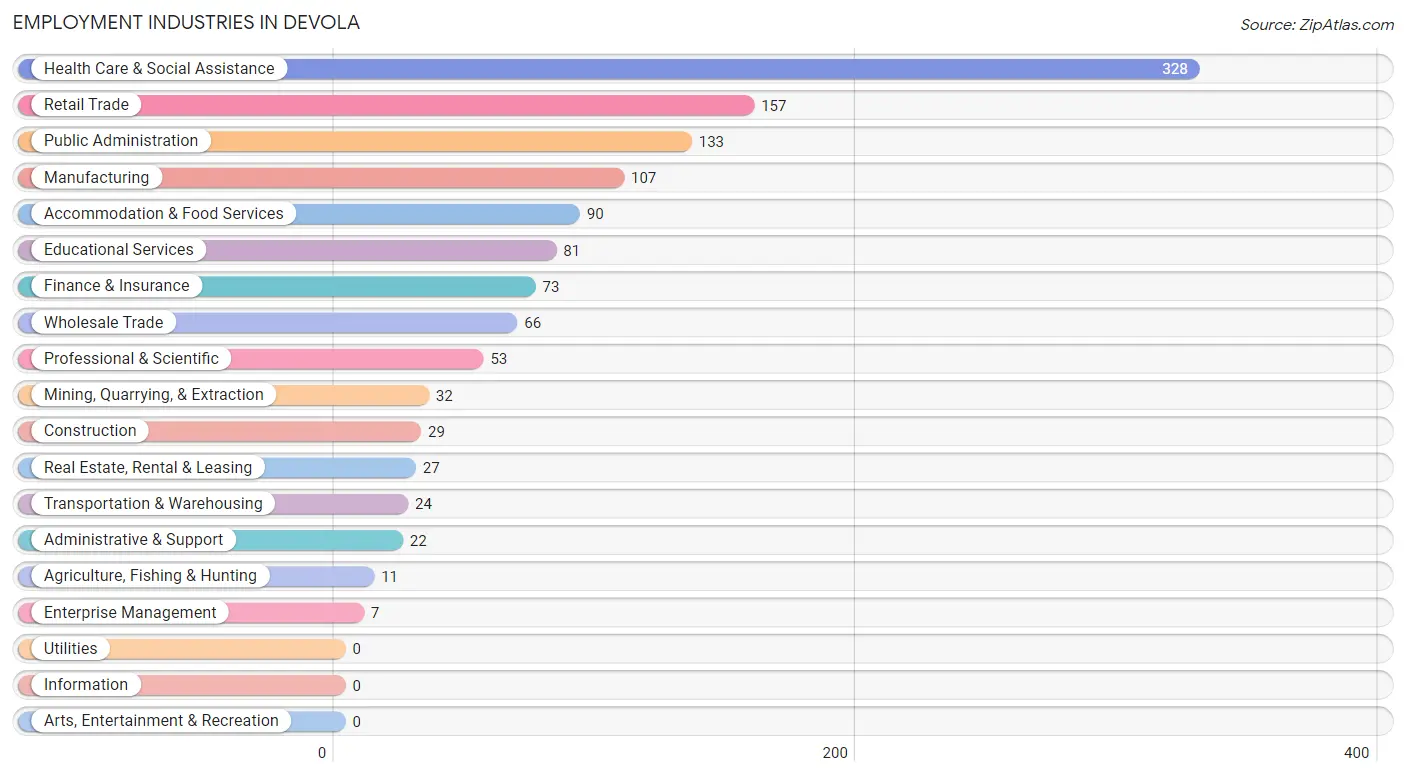
Employment Industries in Devola
The major employment industries in Devola include Health Care & Social Assistance (328 | 25.4%), Retail Trade (157 | 12.2%), Public Administration (133 | 10.3%), Manufacturing (107 | 8.3%), and Accommodation & Food Services (90 | 7.0%).
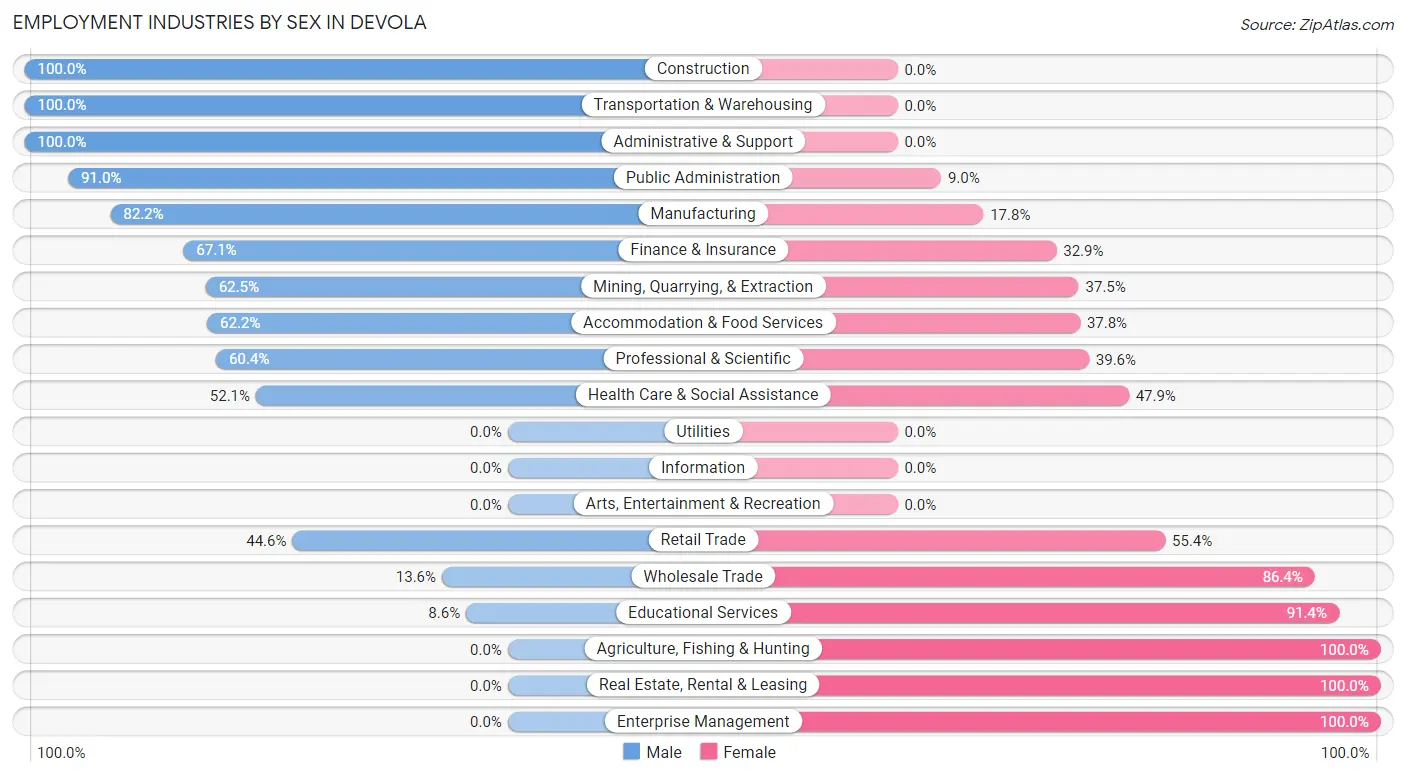
Employment Industries by Sex in Devola
The Devola industries that see more men than women are Construction (100.0%), Transportation & Warehousing (100.0%), and Administrative & Support (100.0%), whereas the industries that tend to have a higher number of women are Agriculture, Fishing & Hunting (100.0%), Real Estate, Rental & Leasing (100.0%), and Enterprise Management (100.0%).
| Industry | Male | Female |
| Agriculture, Fishing & Hunting | 0 (0.0%) | 11 (100.0%) |
| Mining, Quarrying, & Extraction | 20 (62.5%) | 12 (37.5%) |
| Construction | 29 (100.0%) | 0 (0.0%) |
| Manufacturing | 88 (82.2%) | 19 (17.8%) |
| Wholesale Trade | 9 (13.6%) | 57 (86.4%) |
| Retail Trade | 70 (44.6%) | 87 (55.4%) |
| Transportation & Warehousing | 24 (100.0%) | 0 (0.0%) |
| Utilities | 0 (0.0%) | 0 (0.0%) |
| Information | 0 (0.0%) | 0 (0.0%) |
| Finance & Insurance | 49 (67.1%) | 24 (32.9%) |
| Real Estate, Rental & Leasing | 0 (0.0%) | 27 (100.0%) |
| Professional & Scientific | 32 (60.4%) | 21 (39.6%) |
| Enterprise Management | 0 (0.0%) | 7 (100.0%) |
| Administrative & Support | 22 (100.0%) | 0 (0.0%) |
| Educational Services | 7 (8.6%) | 74 (91.4%) |
| Health Care & Social Assistance | 171 (52.1%) | 157 (47.9%) |
| Arts, Entertainment & Recreation | 0 (0.0%) | 0 (0.0%) |
| Accommodation & Food Services | 56 (62.2%) | 34 (37.8%) |
| Public Administration | 121 (91.0%) | 12 (9.0%) |
| Total | 710 (55.0%) | 580 (45.0%) |
Education in Devola
School Enrollment in Devola
The most common levels of schooling among the 611 students in Devola are college / undergraduate (163 | 26.7%), middle school (149 | 24.4%), and elementary school (99 | 16.2%).
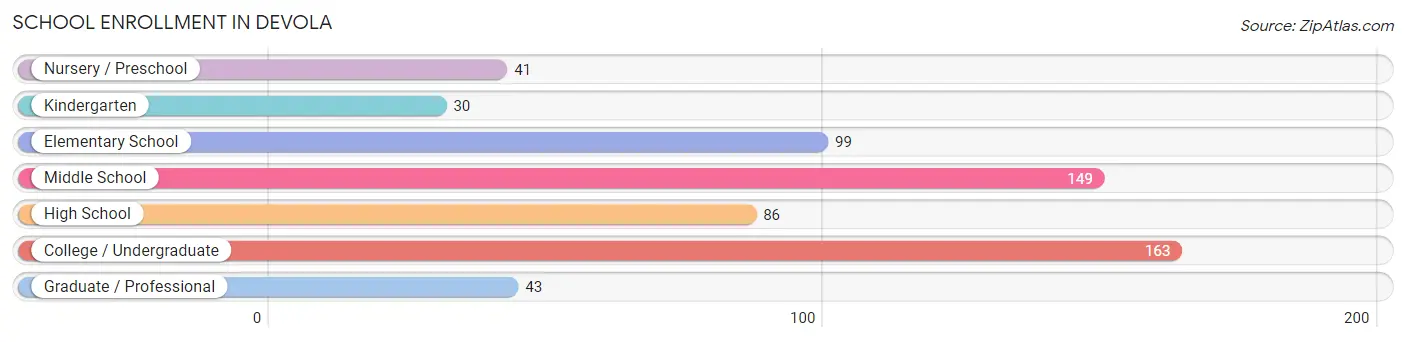
| School Level | # Students | % Students |
| Nursery / Preschool | 41 | 6.7% |
| Kindergarten | 30 | 4.9% |
| Elementary School | 99 | 16.2% |
| Middle School | 149 | 24.4% |
| High School | 86 | 14.1% |
| College / Undergraduate | 163 | 26.7% |
| Graduate / Professional | 43 | 7.0% |
| Total | 611 | 100.0% |
School Enrollment by Age by Funding Source in Devola
Out of a total of 611 students who are enrolled in schools in Devola, 133 (21.8%) attend a private institution, while the remaining 478 (78.2%) are enrolled in public schools. The age group of 3 to 4 year olds has the highest likelihood of being enrolled in private schools, with 27 (100.0% in the age bracket) enrolled. Conversely, the age group of 10 to 14 year olds has the lowest likelihood of being enrolled in a private school, with 173 (100.0% in the age bracket) attending a public institution.
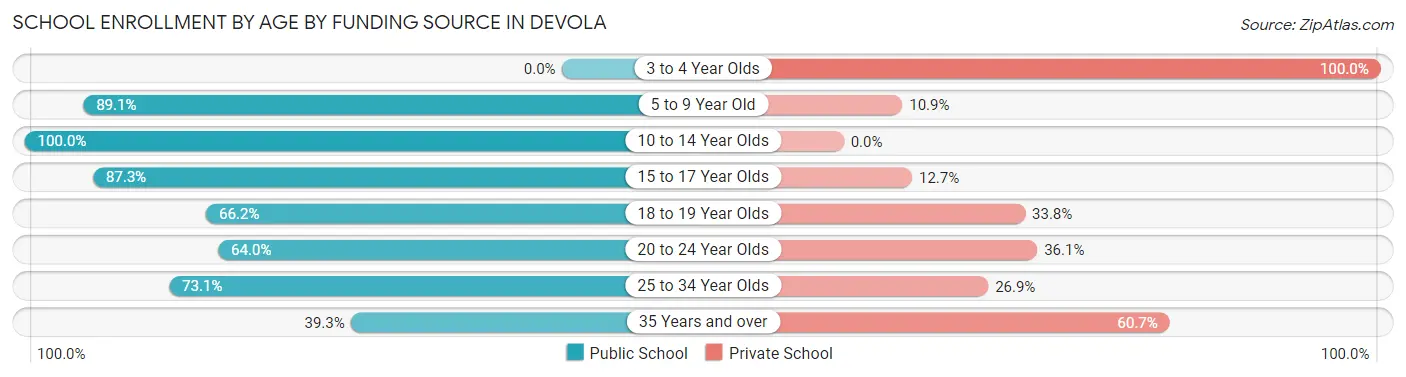
| Age Bracket | Public School | Private School |
| 3 to 4 Year Olds | 0 (0.0%) | 27 (100.0%) |
| 5 to 9 Year Old | 106 (89.1%) | 13 (10.9%) |
| 10 to 14 Year Olds | 173 (100.0%) | 0 (0.0%) |
| 15 to 17 Year Olds | 48 (87.3%) | 7 (12.7%) |
| 18 to 19 Year Olds | 47 (66.2%) | 24 (33.8%) |
| 20 to 24 Year Olds | 55 (63.9%) | 31 (36.0%) |
| 25 to 34 Year Olds | 38 (73.1%) | 14 (26.9%) |
| 35 Years and over | 11 (39.3%) | 17 (60.7%) |
| Total | 478 (78.2%) | 133 (21.8%) |
Educational Attainment by Field of Study in Devola
Business (139 | 21.0%), science & technology (94 | 14.2%), engineering (91 | 13.8%), education (75 | 11.4%), and arts & humanities (51 | 7.7%) are the most common fields of study among 661 individuals in Devola who have obtained a bachelor's degree or higher.
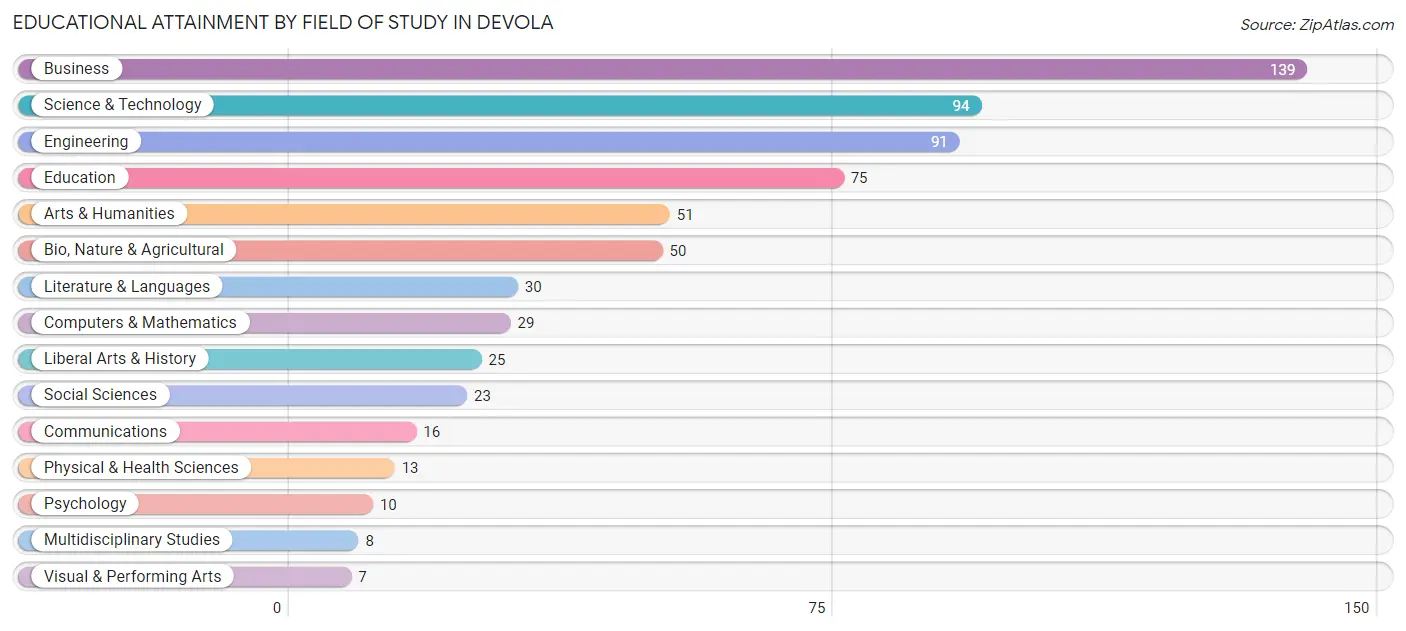
| Field of Study | # Graduates | % Graduates |
| Computers & Mathematics | 29 | 4.4% |
| Bio, Nature & Agricultural | 50 | 7.6% |
| Physical & Health Sciences | 13 | 2.0% |
| Psychology | 10 | 1.5% |
| Social Sciences | 23 | 3.5% |
| Engineering | 91 | 13.8% |
| Multidisciplinary Studies | 8 | 1.2% |
| Science & Technology | 94 | 14.2% |
| Business | 139 | 21.0% |
| Education | 75 | 11.4% |
| Literature & Languages | 30 | 4.5% |
| Liberal Arts & History | 25 | 3.8% |
| Visual & Performing Arts | 7 | 1.1% |
| Communications | 16 | 2.4% |
| Arts & Humanities | 51 | 7.7% |
| Total | 661 | 100.0% |
Transportation & Commute in Devola
Vehicle Availability by Sex in Devola
The most prevalent vehicle ownership categories in Devola are males with 2 vehicles (318, accounting for 44.8%) and females with 2 vehicles (219, making up 56.3%).
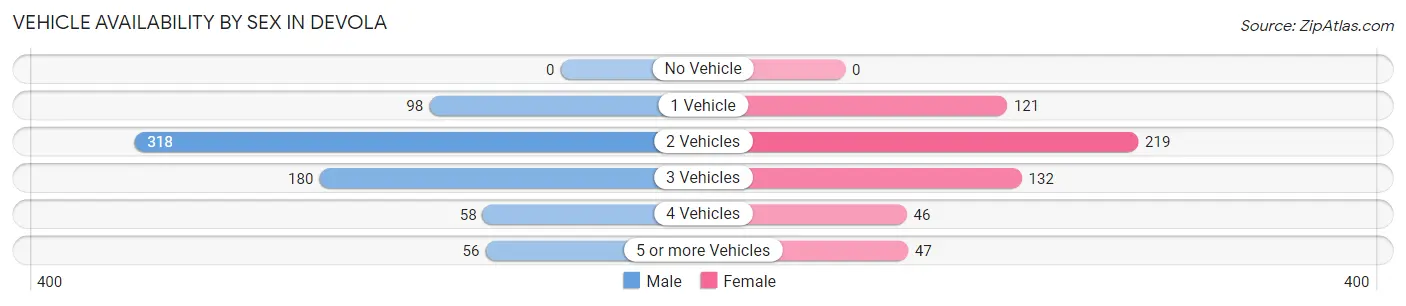
| Vehicles Available | Male | Female |
| No Vehicle | 0 (0.0%) | 0 (0.0%) |
| 1 Vehicle | 98 (13.8%) | 121 (21.4%) |
| 2 Vehicles | 318 (44.8%) | 219 (38.8%) |
| 3 Vehicles | 180 (25.4%) | 132 (23.4%) |
| 4 Vehicles | 58 (8.2%) | 46 (8.1%) |
| 5 or more Vehicles | 56 (7.9%) | 47 (8.3%) |
| Total | 710 (100.0%) | 565 (100.0%) |
Commute Time in Devola
The most frequently occuring commute durations in Devola are 10 to 14 minutes (258 commuters, 22.2%), 15 to 19 minutes (209 commuters, 18.0%), and 5 to 9 minutes (171 commuters, 14.7%).
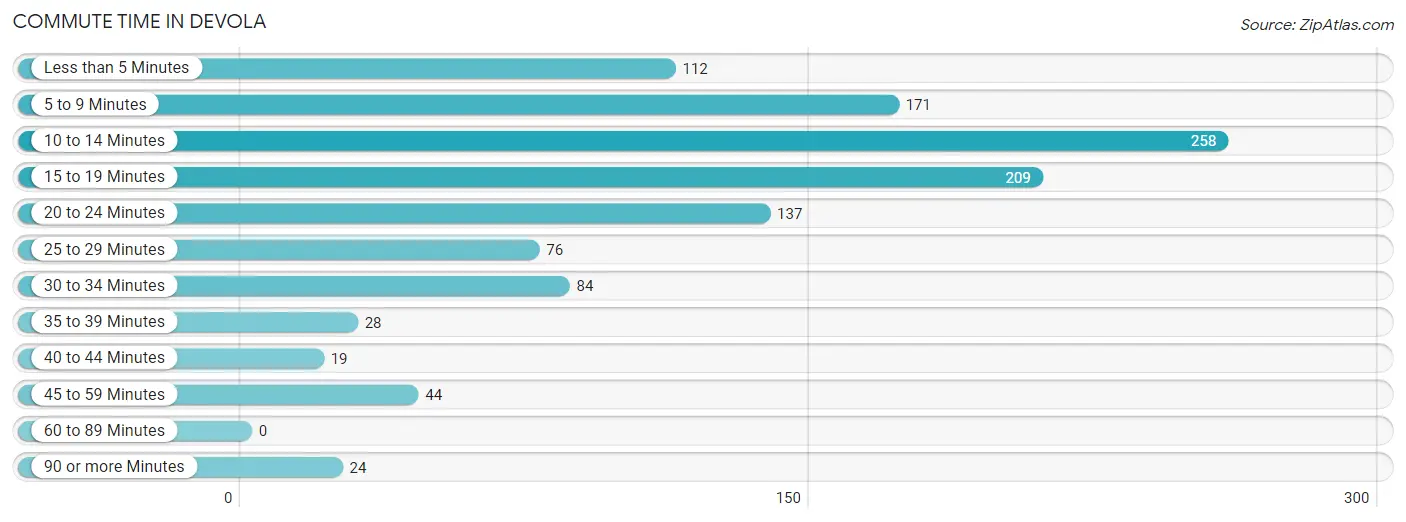
| Commute Time | # Commuters | % Commuters |
| Less than 5 Minutes | 112 | 9.6% |
| 5 to 9 Minutes | 171 | 14.7% |
| 10 to 14 Minutes | 258 | 22.2% |
| 15 to 19 Minutes | 209 | 18.0% |
| 20 to 24 Minutes | 137 | 11.8% |
| 25 to 29 Minutes | 76 | 6.5% |
| 30 to 34 Minutes | 84 | 7.2% |
| 35 to 39 Minutes | 28 | 2.4% |
| 40 to 44 Minutes | 19 | 1.6% |
| 45 to 59 Minutes | 44 | 3.8% |
| 60 to 89 Minutes | 0 | 0.0% |
| 90 or more Minutes | 24 | 2.1% |
Commute Time by Sex in Devola
The most common commute times in Devola are 10 to 14 minutes (145 commuters, 22.5%) for males and 10 to 14 minutes (113 commuters, 21.9%) for females.
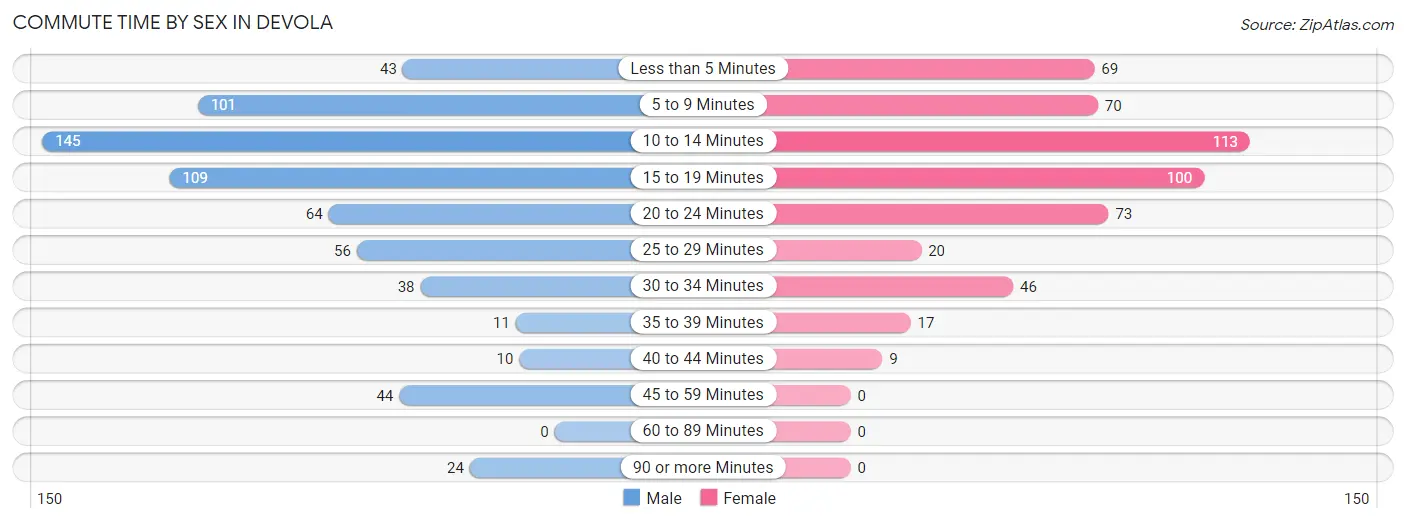
| Commute Time | Male | Female |
| Less than 5 Minutes | 43 (6.7%) | 69 (13.4%) |
| 5 to 9 Minutes | 101 (15.7%) | 70 (13.5%) |
| 10 to 14 Minutes | 145 (22.5%) | 113 (21.9%) |
| 15 to 19 Minutes | 109 (16.9%) | 100 (19.3%) |
| 20 to 24 Minutes | 64 (9.9%) | 73 (14.1%) |
| 25 to 29 Minutes | 56 (8.7%) | 20 (3.9%) |
| 30 to 34 Minutes | 38 (5.9%) | 46 (8.9%) |
| 35 to 39 Minutes | 11 (1.7%) | 17 (3.3%) |
| 40 to 44 Minutes | 10 (1.5%) | 9 (1.7%) |
| 45 to 59 Minutes | 44 (6.8%) | 0 (0.0%) |
| 60 to 89 Minutes | 0 (0.0%) | 0 (0.0%) |
| 90 or more Minutes | 24 (3.7%) | 0 (0.0%) |
Time of Departure to Work by Sex in Devola
The most frequent times of departure to work in Devola are 10:00 AM to 10:59 AM (138, 21.4%) for males and 7:30 AM to 7:59 AM (166, 32.1%) for females.
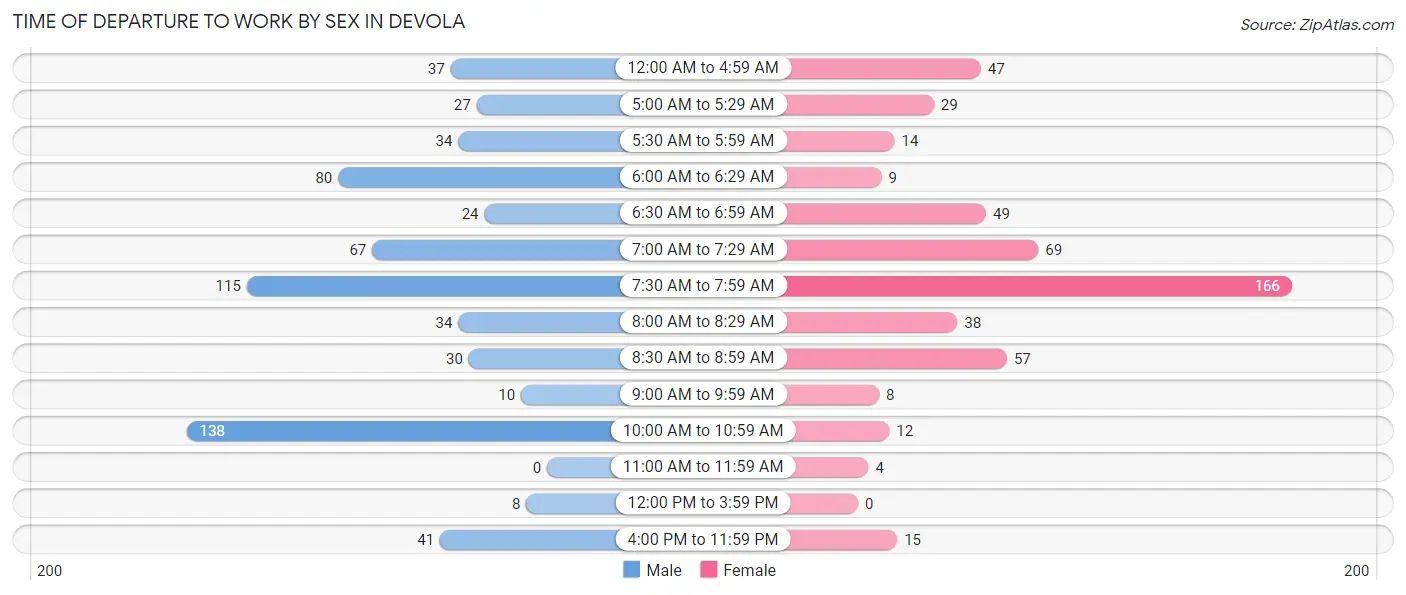
| Time of Departure | Male | Female |
| 12:00 AM to 4:59 AM | 37 (5.7%) | 47 (9.1%) |
| 5:00 AM to 5:29 AM | 27 (4.2%) | 29 (5.6%) |
| 5:30 AM to 5:59 AM | 34 (5.3%) | 14 (2.7%) |
| 6:00 AM to 6:29 AM | 80 (12.4%) | 9 (1.7%) |
| 6:30 AM to 6:59 AM | 24 (3.7%) | 49 (9.5%) |
| 7:00 AM to 7:29 AM | 67 (10.4%) | 69 (13.4%) |
| 7:30 AM to 7:59 AM | 115 (17.8%) | 166 (32.1%) |
| 8:00 AM to 8:29 AM | 34 (5.3%) | 38 (7.3%) |
| 8:30 AM to 8:59 AM | 30 (4.6%) | 57 (11.0%) |
| 9:00 AM to 9:59 AM | 10 (1.5%) | 8 (1.5%) |
| 10:00 AM to 10:59 AM | 138 (21.4%) | 12 (2.3%) |
| 11:00 AM to 11:59 AM | 0 (0.0%) | 4 (0.8%) |
| 12:00 PM to 3:59 PM | 8 (1.2%) | 0 (0.0%) |
| 4:00 PM to 11:59 PM | 41 (6.4%) | 15 (2.9%) |
| Total | 645 (100.0%) | 517 (100.0%) |
Housing Occupancy in Devola
Occupancy by Ownership in Devola
Of the total 1,115 dwellings in Devola, owner-occupied units account for 891 (79.9%), while renter-occupied units make up 224 (20.1%).
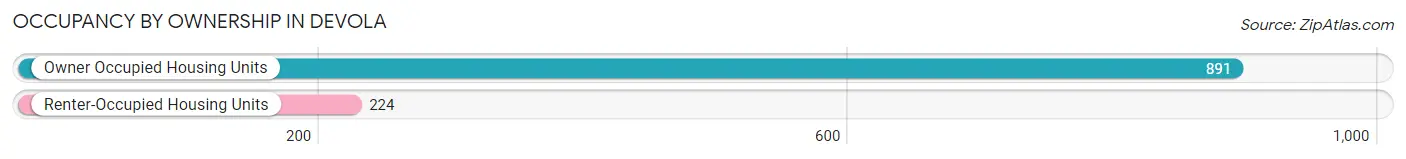
| Occupancy | # Housing Units | % Housing Units |
| Owner Occupied Housing Units | 891 | 79.9% |
| Renter-Occupied Housing Units | 224 | 20.1% |
| Total Occupied Housing Units | 1,115 | 100.0% |
Occupancy by Household Size in Devola
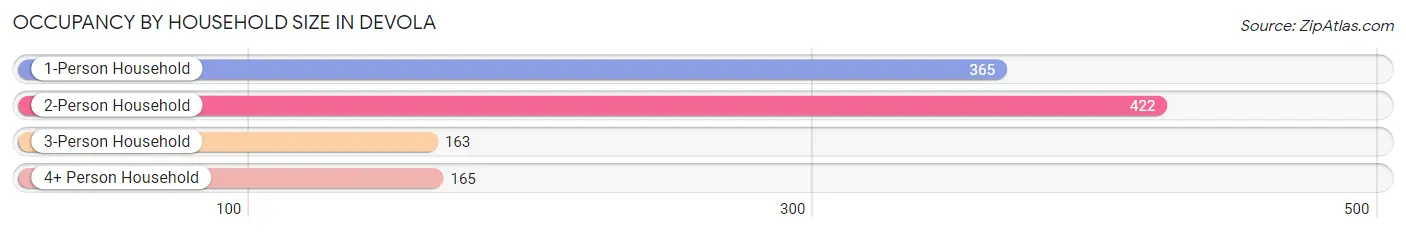
| Household Size | # Housing Units | % Housing Units |
| 1-Person Household | 365 | 32.7% |
| 2-Person Household | 422 | 37.9% |
| 3-Person Household | 163 | 14.6% |
| 4+ Person Household | 165 | 14.8% |
| Total Housing Units | 1,115 | 100.0% |
Occupancy by Ownership by Household Size in Devola
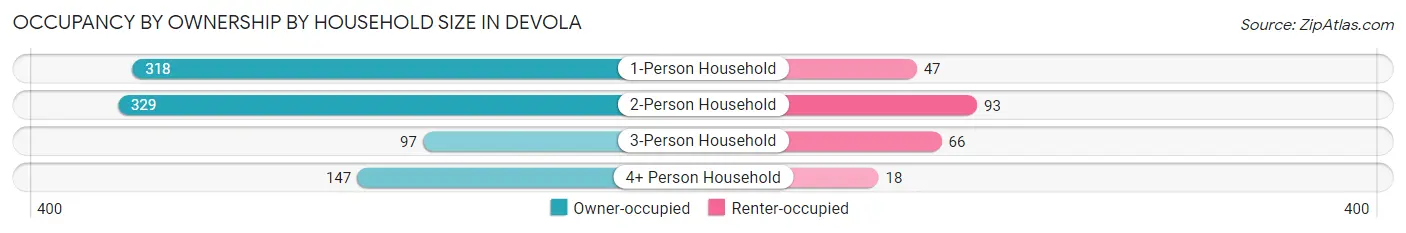
| Household Size | Owner-occupied | Renter-occupied |
| 1-Person Household | 318 (87.1%) | 47 (12.9%) |
| 2-Person Household | 329 (78.0%) | 93 (22.0%) |
| 3-Person Household | 97 (59.5%) | 66 (40.5%) |
| 4+ Person Household | 147 (89.1%) | 18 (10.9%) |
| Total Housing Units | 891 (79.9%) | 224 (20.1%) |
Occupancy by Educational Attainment in Devola
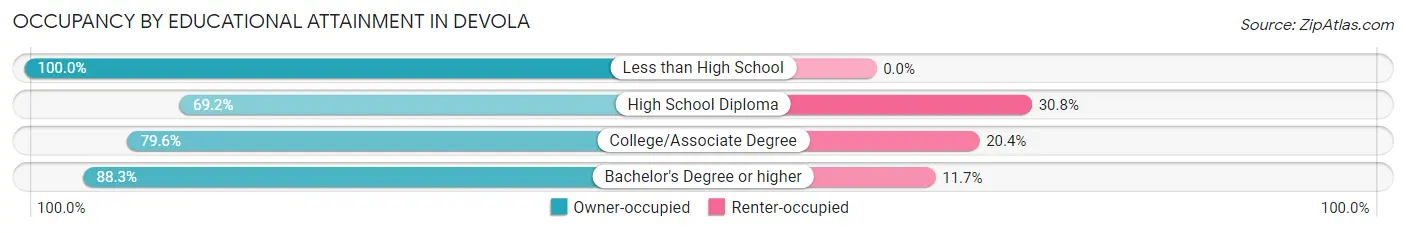
| Household Size | Owner-occupied | Renter-occupied |
| Less than High School | 4 (100.0%) | 0 (0.0%) |
| High School Diploma | 222 (69.2%) | 99 (30.8%) |
| College/Associate Degree | 296 (79.6%) | 76 (20.4%) |
| Bachelor's Degree or higher | 369 (88.3%) | 49 (11.7%) |
Occupancy by Age of Householder in Devola
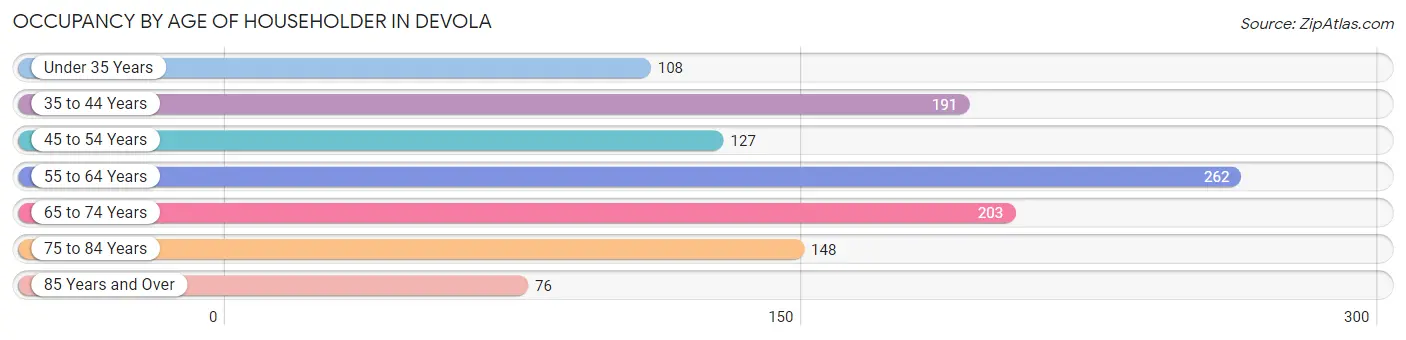
| Age Bracket | # Households | % Households |
| Under 35 Years | 108 | 9.7% |
| 35 to 44 Years | 191 | 17.1% |
| 45 to 54 Years | 127 | 11.4% |
| 55 to 64 Years | 262 | 23.5% |
| 65 to 74 Years | 203 | 18.2% |
| 75 to 84 Years | 148 | 13.3% |
| 85 Years and Over | 76 | 6.8% |
| Total | 1,115 | 100.0% |
Housing Finances in Devola
Median Income by Occupancy in Devola
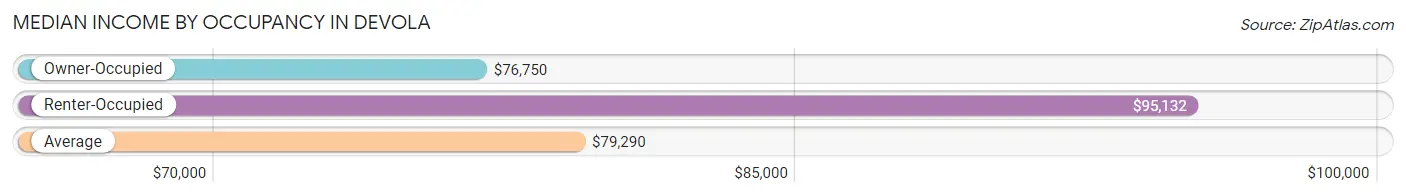
| Occupancy Type | # Households | Median Income |
| Owner-Occupied | 891 (79.9%) | $76,750 |
| Renter-Occupied | 224 (20.1%) | $95,132 |
| Average | 1,115 (100.0%) | $79,290 |
Occupancy by Householder Income Bracket in Devola
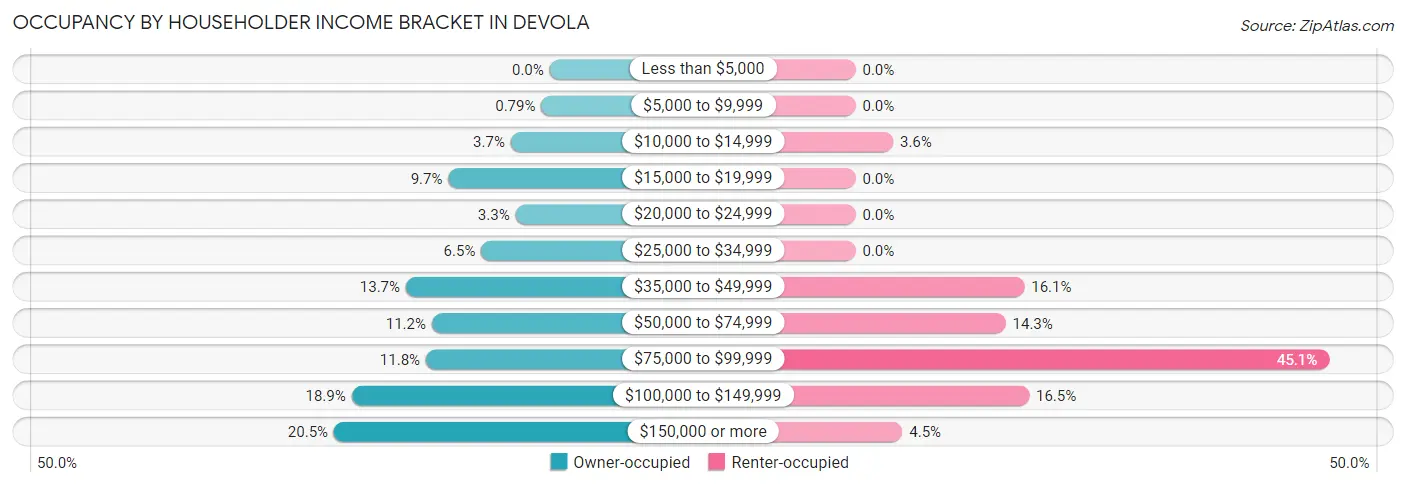
| Income Bracket | Owner-occupied | Renter-occupied |
| Less than $5,000 | 0 (0.0%) | 0 (0.0%) |
| $5,000 to $9,999 | 7 (0.8%) | 0 (0.0%) |
| $10,000 to $14,999 | 33 (3.7%) | 8 (3.6%) |
| $15,000 to $19,999 | 86 (9.7%) | 0 (0.0%) |
| $20,000 to $24,999 | 29 (3.3%) | 0 (0.0%) |
| $25,000 to $34,999 | 58 (6.5%) | 0 (0.0%) |
| $35,000 to $49,999 | 122 (13.7%) | 36 (16.1%) |
| $50,000 to $74,999 | 100 (11.2%) | 32 (14.3%) |
| $75,000 to $99,999 | 105 (11.8%) | 101 (45.1%) |
| $100,000 to $149,999 | 168 (18.9%) | 37 (16.5%) |
| $150,000 or more | 183 (20.5%) | 10 (4.5%) |
| Total | 891 (100.0%) | 224 (100.0%) |
Monthly Housing Cost Tiers in Devola
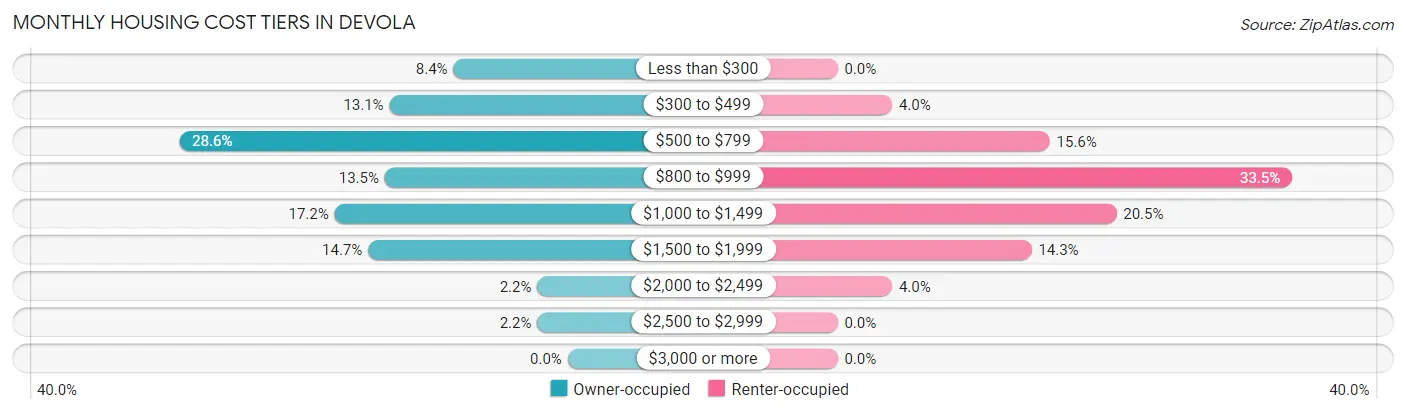
| Monthly Cost | Owner-occupied | Renter-occupied |
| Less than $300 | 75 (8.4%) | 0 (0.0%) |
| $300 to $499 | 117 (13.1%) | 9 (4.0%) |
| $500 to $799 | 255 (28.6%) | 35 (15.6%) |
| $800 to $999 | 120 (13.5%) | 75 (33.5%) |
| $1,000 to $1,499 | 153 (17.2%) | 46 (20.5%) |
| $1,500 to $1,999 | 131 (14.7%) | 32 (14.3%) |
| $2,000 to $2,499 | 20 (2.2%) | 9 (4.0%) |
| $2,500 to $2,999 | 20 (2.2%) | 0 (0.0%) |
| $3,000 or more | 0 (0.0%) | 0 (0.0%) |
| Total | 891 (100.0%) | 224 (100.0%) |
Physical Housing Characteristics in Devola
Housing Structures in Devola
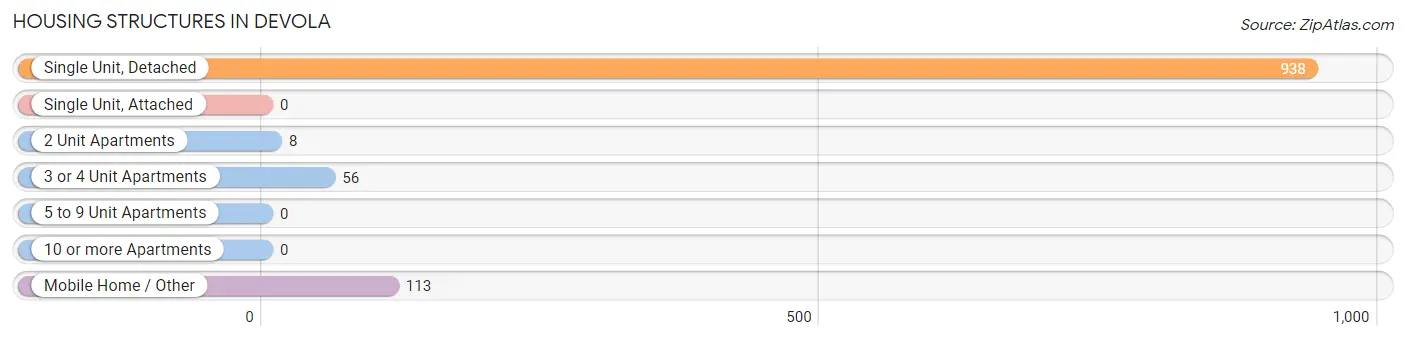
| Structure Type | # Housing Units | % Housing Units |
| Single Unit, Detached | 938 | 84.1% |
| Single Unit, Attached | 0 | 0.0% |
| 2 Unit Apartments | 8 | 0.7% |
| 3 or 4 Unit Apartments | 56 | 5.0% |
| 5 to 9 Unit Apartments | 0 | 0.0% |
| 10 or more Apartments | 0 | 0.0% |
| Mobile Home / Other | 113 | 10.1% |
| Total | 1,115 | 100.0% |
Housing Structures by Occupancy in Devola
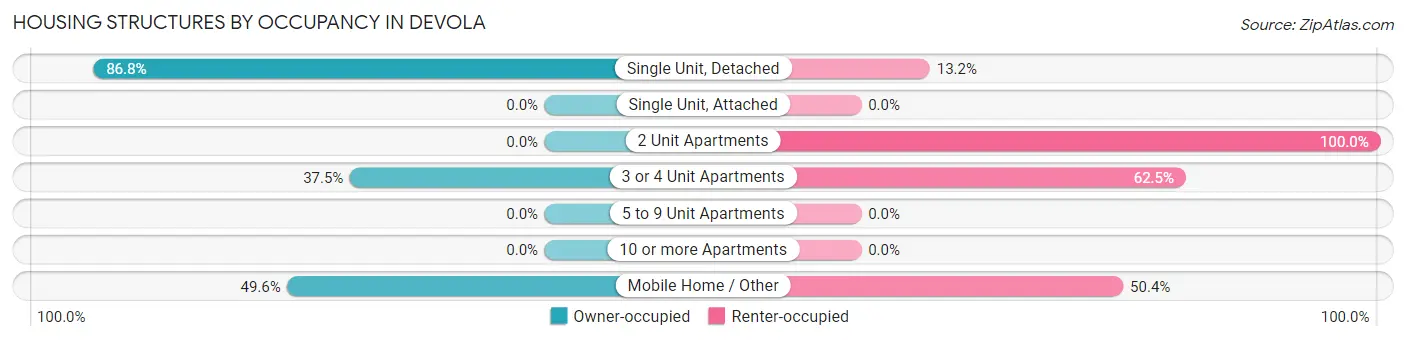
| Structure Type | Owner-occupied | Renter-occupied |
| Single Unit, Detached | 814 (86.8%) | 124 (13.2%) |
| Single Unit, Attached | 0 (0.0%) | 0 (0.0%) |
| 2 Unit Apartments | 0 (0.0%) | 8 (100.0%) |
| 3 or 4 Unit Apartments | 21 (37.5%) | 35 (62.5%) |
| 5 to 9 Unit Apartments | 0 (0.0%) | 0 (0.0%) |
| 10 or more Apartments | 0 (0.0%) | 0 (0.0%) |
| Mobile Home / Other | 56 (49.6%) | 57 (50.4%) |
| Total | 891 (79.9%) | 224 (20.1%) |
Housing Structures by Number of Rooms in Devola
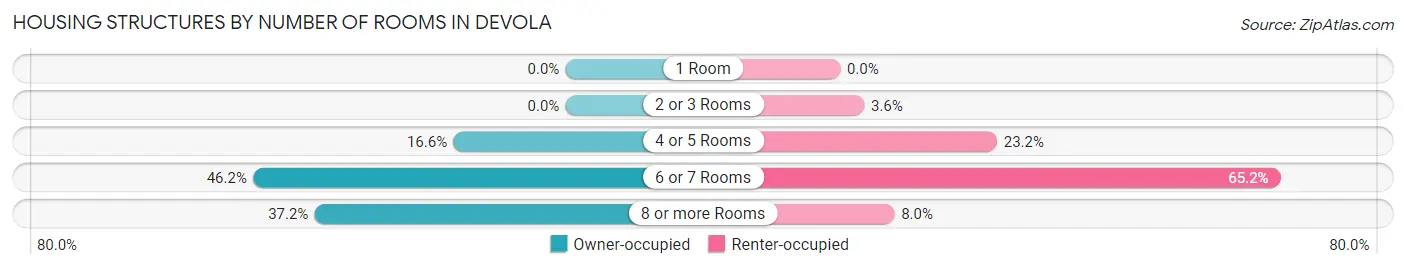
| Number of Rooms | Owner-occupied | Renter-occupied |
| 1 Room | 0 (0.0%) | 0 (0.0%) |
| 2 or 3 Rooms | 0 (0.0%) | 8 (3.6%) |
| 4 or 5 Rooms | 148 (16.6%) | 52 (23.2%) |
| 6 or 7 Rooms | 412 (46.2%) | 146 (65.2%) |
| 8 or more Rooms | 331 (37.1%) | 18 (8.0%) |
| Total | 891 (100.0%) | 224 (100.0%) |
Housing Structure by Heating Type in Devola
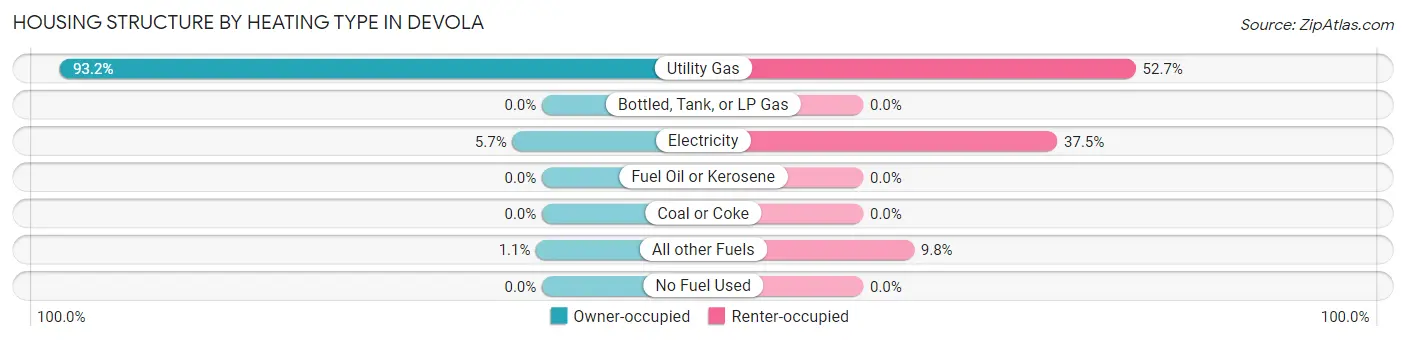
| Heating Type | Owner-occupied | Renter-occupied |
| Utility Gas | 830 (93.1%) | 118 (52.7%) |
| Bottled, Tank, or LP Gas | 0 (0.0%) | 0 (0.0%) |
| Electricity | 51 (5.7%) | 84 (37.5%) |
| Fuel Oil or Kerosene | 0 (0.0%) | 0 (0.0%) |
| Coal or Coke | 0 (0.0%) | 0 (0.0%) |
| All other Fuels | 10 (1.1%) | 22 (9.8%) |
| No Fuel Used | 0 (0.0%) | 0 (0.0%) |
| Total | 891 (100.0%) | 224 (100.0%) |
Household Vehicle Usage in Devola
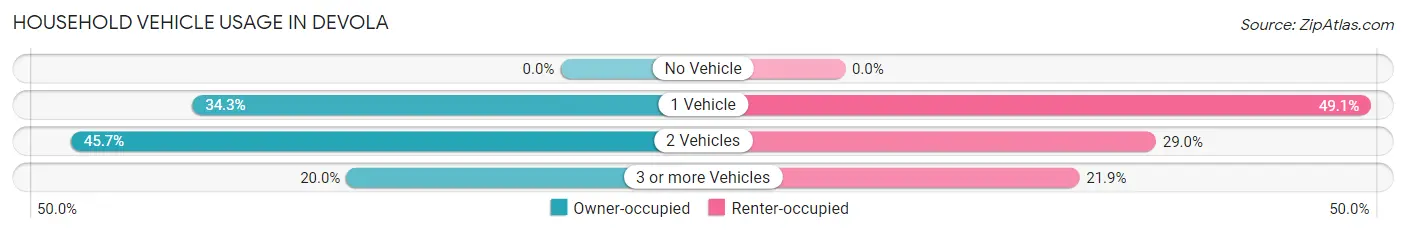
| Vehicles per Household | Owner-occupied | Renter-occupied |
| No Vehicle | 0 (0.0%) | 0 (0.0%) |
| 1 Vehicle | 306 (34.3%) | 110 (49.1%) |
| 2 Vehicles | 407 (45.7%) | 65 (29.0%) |
| 3 or more Vehicles | 178 (20.0%) | 49 (21.9%) |
| Total | 891 (100.0%) | 224 (100.0%) |
Real Estate & Mortgages in Devola
Real Estate and Mortgage Overview in Devola
| Characteristic | Without Mortgage | With Mortgage |
| Housing Units | 490 | 401 |
| Median Property Value | $200,500 | $212,000 |
| Median Household Income | $49,844 | $131 |
| Monthly Housing Costs | $547 | $0 |
| Real Estate Taxes | $2,077 | $0 |
Property Value by Mortgage Status in Devola
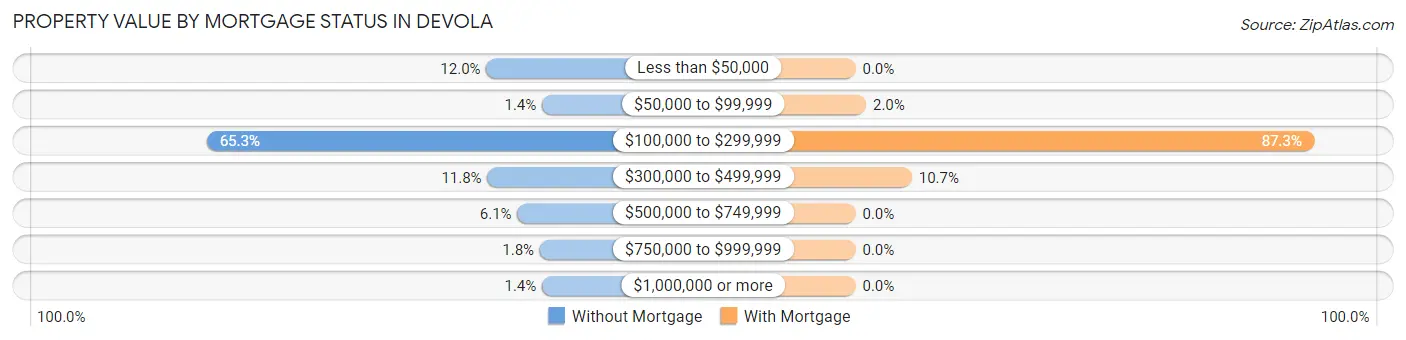
| Property Value | Without Mortgage | With Mortgage |
| Less than $50,000 | 59 (12.0%) | 0 (0.0%) |
| $50,000 to $99,999 | 7 (1.4%) | 8 (2.0%) |
| $100,000 to $299,999 | 320 (65.3%) | 350 (87.3%) |
| $300,000 to $499,999 | 58 (11.8%) | 43 (10.7%) |
| $500,000 to $749,999 | 30 (6.1%) | 0 (0.0%) |
| $750,000 to $999,999 | 9 (1.8%) | 0 (0.0%) |
| $1,000,000 or more | 7 (1.4%) | 0 (0.0%) |
| Total | 490 (100.0%) | 401 (100.0%) |
Household Income by Mortgage Status in Devola
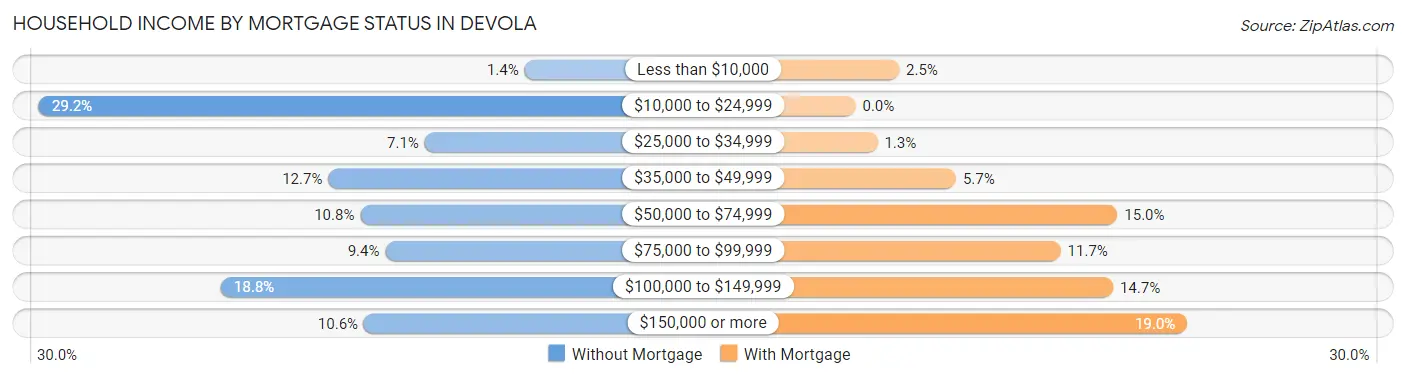
| Household Income | Without Mortgage | With Mortgage |
| Less than $10,000 | 7 (1.4%) | 10 (2.5%) |
| $10,000 to $24,999 | 143 (29.2%) | 0 (0.0%) |
| $25,000 to $34,999 | 35 (7.1%) | 5 (1.3%) |
| $35,000 to $49,999 | 62 (12.7%) | 23 (5.7%) |
| $50,000 to $74,999 | 53 (10.8%) | 60 (15.0%) |
| $75,000 to $99,999 | 46 (9.4%) | 47 (11.7%) |
| $100,000 to $149,999 | 92 (18.8%) | 59 (14.7%) |
| $150,000 or more | 52 (10.6%) | 76 (19.0%) |
| Total | 490 (100.0%) | 401 (100.0%) |
Property Value to Household Income Ratio in Devola
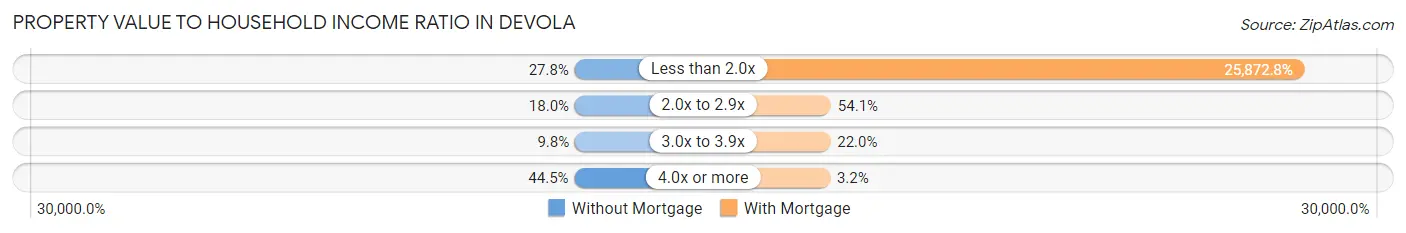
| Value-to-Income Ratio | Without Mortgage | With Mortgage |
| Less than 2.0x | 136 (27.8%) | 103,750 (25,872.8%) |
| 2.0x to 2.9x | 88 (18.0%) | 217 (54.1%) |
| 3.0x to 3.9x | 48 (9.8%) | 88 (22.0%) |
| 4.0x or more | 218 (44.5%) | 13 (3.2%) |
| Total | 490 (100.0%) | 401 (100.0%) |
Real Estate Taxes by Mortgage Status in Devola
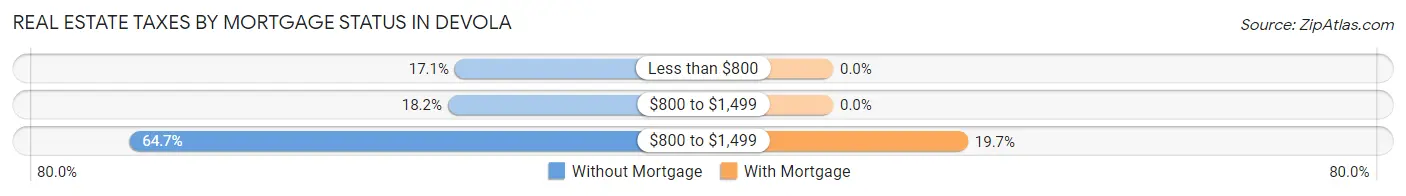
| Property Taxes | Without Mortgage | With Mortgage |
| Less than $800 | 84 (17.1%) | 0 (0.0%) |
| $800 to $1,499 | 89 (18.2%) | 0 (0.0%) |
| $800 to $1,499 | 317 (64.7%) | 79 (19.7%) |
| Total | 490 (100.0%) | 401 (100.0%) |
Health & Disability in Devola
Health Insurance Coverage by Age in Devola
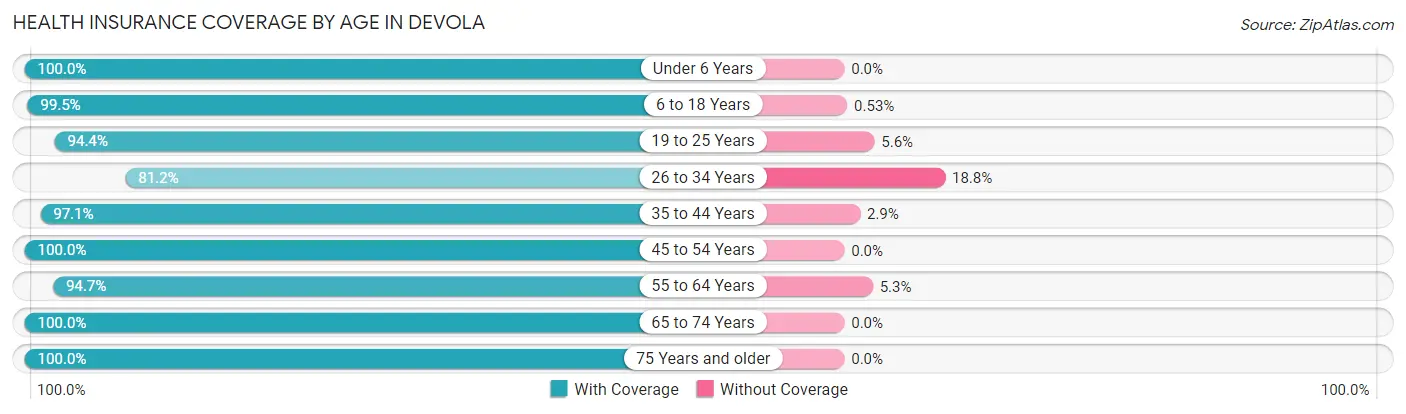
| Age Bracket | With Coverage | Without Coverage |
| Under 6 Years | 72 (100.0%) | 0 (0.0%) |
| 6 to 18 Years | 372 (99.5%) | 2 (0.5%) |
| 19 to 25 Years | 253 (94.4%) | 15 (5.6%) |
| 26 to 34 Years | 173 (81.2%) | 40 (18.8%) |
| 35 to 44 Years | 298 (97.1%) | 9 (2.9%) |
| 45 to 54 Years | 276 (100.0%) | 0 (0.0%) |
| 55 to 64 Years | 375 (94.7%) | 21 (5.3%) |
| 65 to 74 Years | 346 (100.0%) | 0 (0.0%) |
| 75 Years and older | 319 (100.0%) | 0 (0.0%) |
| Total | 2,484 (96.6%) | 87 (3.4%) |
Health Insurance Coverage by Citizenship Status in Devola
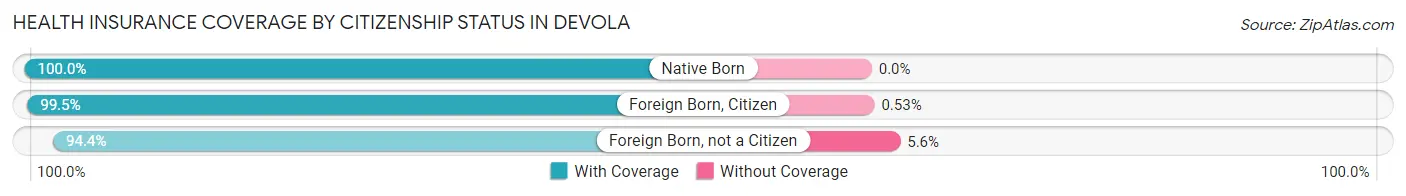
| Citizenship Status | With Coverage | Without Coverage |
| Native Born | 72 (100.0%) | 0 (0.0%) |
| Foreign Born, Citizen | 372 (99.5%) | 2 (0.5%) |
| Foreign Born, not a Citizen | 253 (94.4%) | 15 (5.6%) |
Health Insurance Coverage by Household Income in Devola
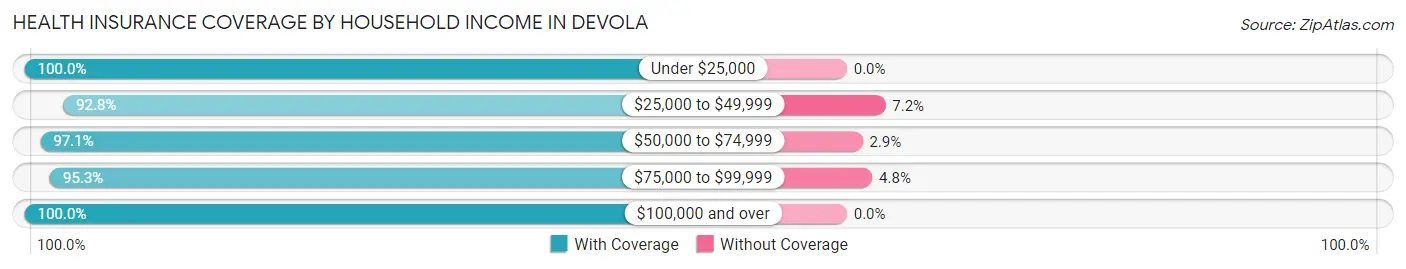
| Household Income | With Coverage | Without Coverage |
| Under $25,000 | 199 (100.0%) | 0 (0.0%) |
| $25,000 to $49,999 | 360 (92.8%) | 28 (7.2%) |
| $50,000 to $74,999 | 330 (97.1%) | 10 (2.9%) |
| $75,000 to $99,999 | 441 (95.3%) | 22 (4.8%) |
| $100,000 and over | 1,115 (100.0%) | 0 (0.0%) |
Public vs Private Health Insurance Coverage by Age in Devola
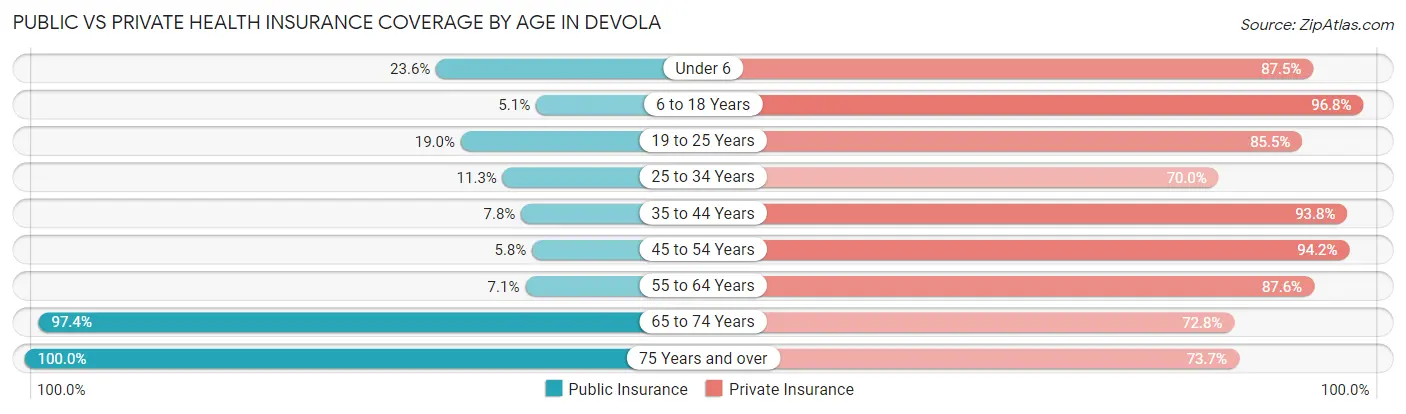
| Age Bracket | Public Insurance | Private Insurance |
| Under 6 | 17 (23.6%) | 63 (87.5%) |
| 6 to 18 Years | 19 (5.1%) | 362 (96.8%) |
| 19 to 25 Years | 51 (19.0%) | 229 (85.5%) |
| 25 to 34 Years | 24 (11.3%) | 149 (70.0%) |
| 35 to 44 Years | 24 (7.8%) | 288 (93.8%) |
| 45 to 54 Years | 16 (5.8%) | 260 (94.2%) |
| 55 to 64 Years | 28 (7.1%) | 347 (87.6%) |
| 65 to 74 Years | 337 (97.4%) | 252 (72.8%) |
| 75 Years and over | 319 (100.0%) | 235 (73.7%) |
| Total | 835 (32.5%) | 2,185 (85.0%) |
Disability Status by Sex by Age in Devola
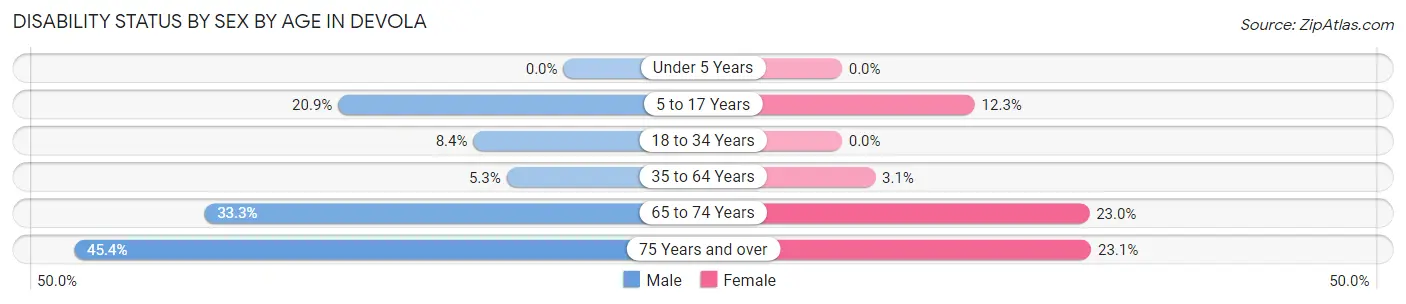
| Age Bracket | Male | Female |
| Under 5 Years | 0 (0.0%) | 0 (0.0%) |
| 5 to 17 Years | 42 (20.9%) | 18 (12.3%) |
| 18 to 34 Years | 27 (8.4%) | 0 (0.0%) |
| 35 to 64 Years | 26 (5.3%) | 15 (3.1%) |
| 65 to 74 Years | 50 (33.3%) | 45 (23.0%) |
| 75 Years and over | 84 (45.4%) | 31 (23.1%) |
Disability Class by Sex by Age in Devola
Disability Class: Hearing Difficulty
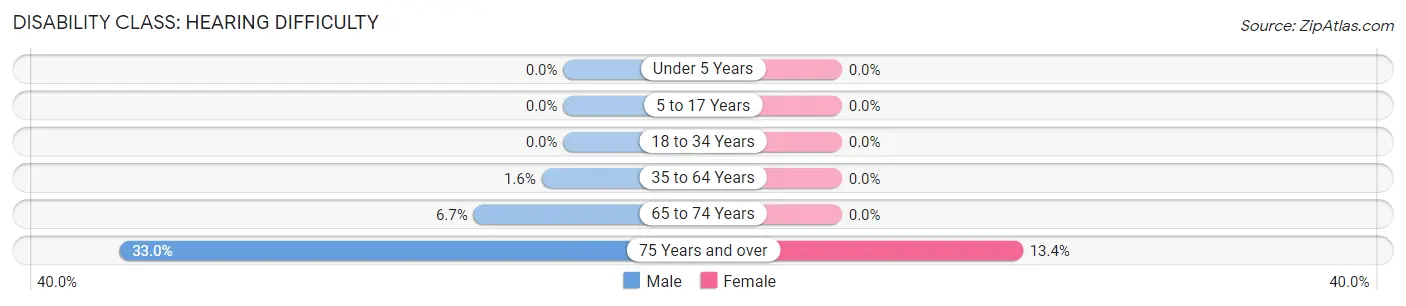
| Age Bracket | Male | Female |
| Under 5 Years | 0 (0.0%) | 0 (0.0%) |
| 5 to 17 Years | 0 (0.0%) | 0 (0.0%) |
| 18 to 34 Years | 0 (0.0%) | 0 (0.0%) |
| 35 to 64 Years | 8 (1.6%) | 0 (0.0%) |
| 65 to 74 Years | 10 (6.7%) | 0 (0.0%) |
| 75 Years and over | 61 (33.0%) | 18 (13.4%) |
Disability Class: Vision Difficulty
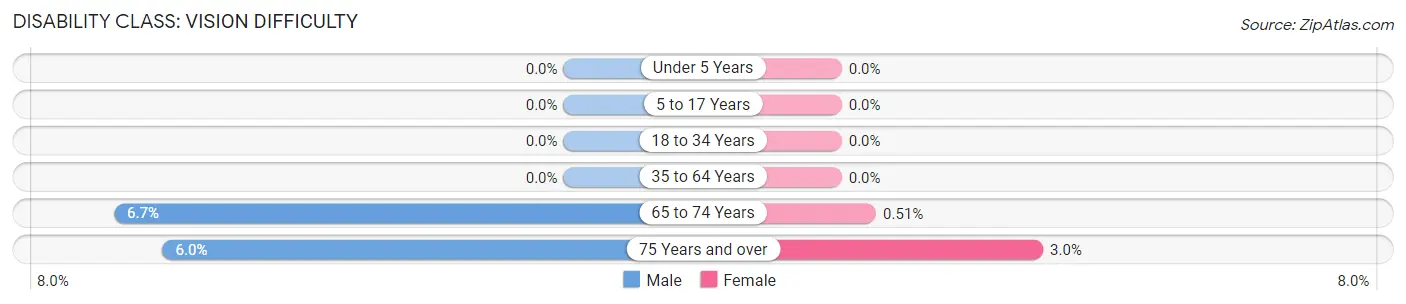
| Age Bracket | Male | Female |
| Under 5 Years | 0 (0.0%) | 0 (0.0%) |
| 5 to 17 Years | 0 (0.0%) | 0 (0.0%) |
| 18 to 34 Years | 0 (0.0%) | 0 (0.0%) |
| 35 to 64 Years | 0 (0.0%) | 0 (0.0%) |
| 65 to 74 Years | 10 (6.7%) | 1 (0.5%) |
| 75 Years and over | 11 (5.9%) | 4 (3.0%) |
Disability Class: Cognitive Difficulty
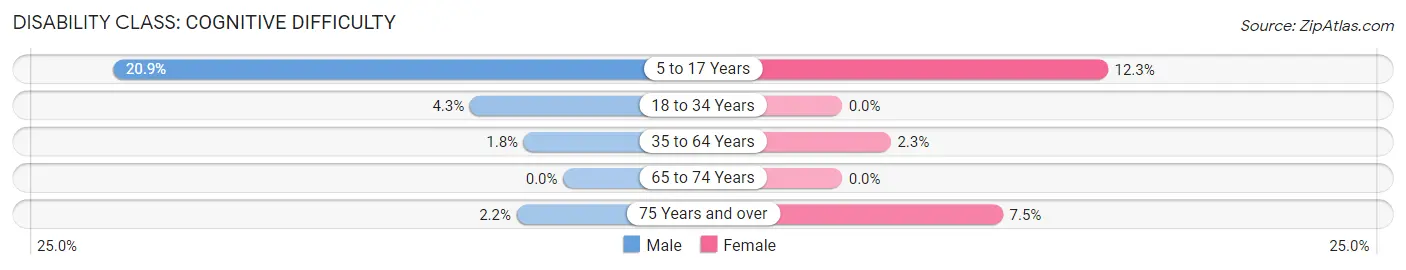
| Age Bracket | Male | Female |
| 5 to 17 Years | 42 (20.9%) | 18 (12.3%) |
| 18 to 34 Years | 14 (4.3%) | 0 (0.0%) |
| 35 to 64 Years | 9 (1.8%) | 11 (2.3%) |
| 65 to 74 Years | 0 (0.0%) | 0 (0.0%) |
| 75 Years and over | 4 (2.2%) | 10 (7.5%) |
Disability Class: Ambulatory Difficulty
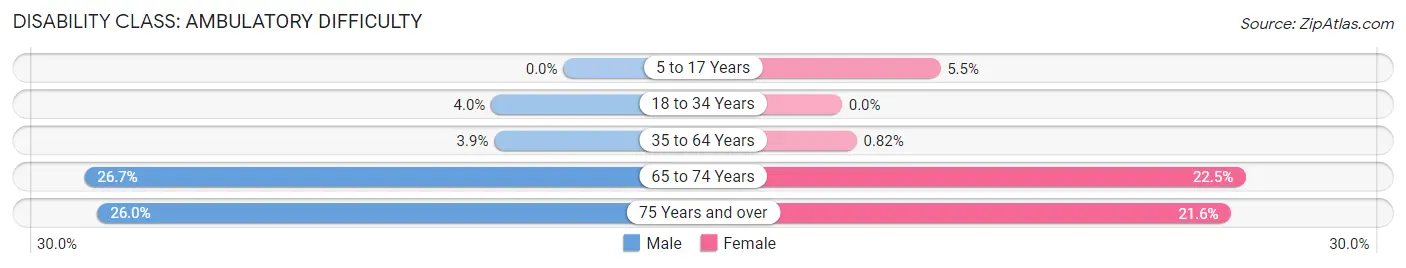
| Age Bracket | Male | Female |
| 5 to 17 Years | 0 (0.0%) | 8 (5.5%) |
| 18 to 34 Years | 13 (4.0%) | 0 (0.0%) |
| 35 to 64 Years | 19 (3.8%) | 4 (0.8%) |
| 65 to 74 Years | 40 (26.7%) | 44 (22.5%) |
| 75 Years and over | 48 (26.0%) | 29 (21.6%) |
Disability Class: Self-Care Difficulty
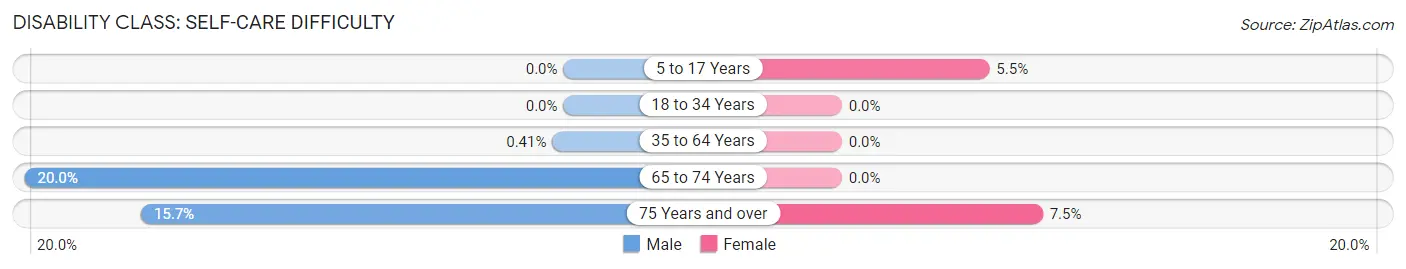
| Age Bracket | Male | Female |
| 5 to 17 Years | 0 (0.0%) | 8 (5.5%) |
| 18 to 34 Years | 0 (0.0%) | 0 (0.0%) |
| 35 to 64 Years | 2 (0.4%) | 0 (0.0%) |
| 65 to 74 Years | 30 (20.0%) | 0 (0.0%) |
| 75 Years and over | 29 (15.7%) | 10 (7.5%) |
Technology Access in Devola
Computing Device Access in Devola
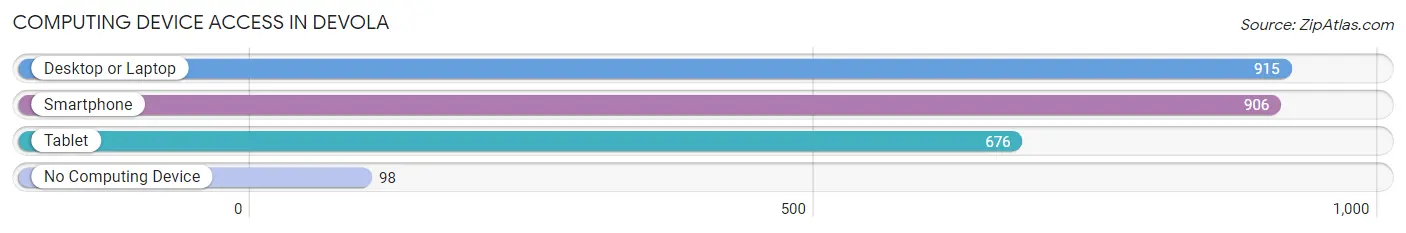
| Device Type | # Households | % Households |
| Desktop or Laptop | 915 | 82.1% |
| Smartphone | 906 | 81.3% |
| Tablet | 676 | 60.6% |
| No Computing Device | 98 | 8.8% |
| Total | 1,115 | 100.0% |
Internet Access in Devola
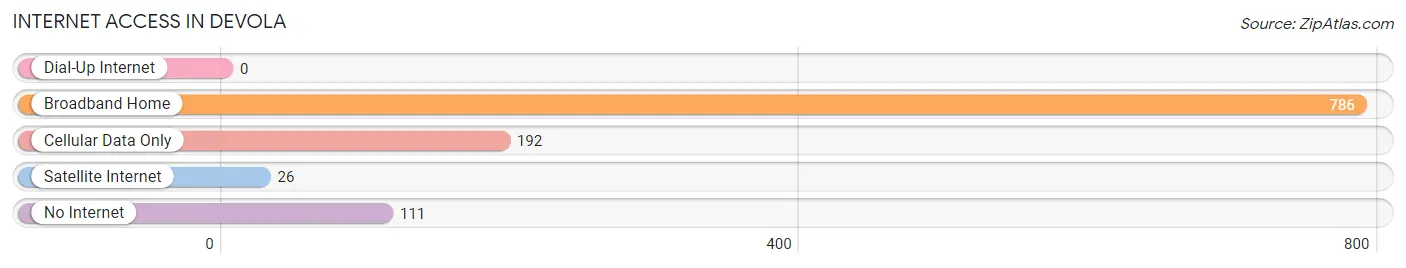
| Internet Type | # Households | % Households |
| Dial-Up Internet | 0 | 0.0% |
| Broadband Home | 786 | 70.5% |
| Cellular Data Only | 192 | 17.2% |
| Satellite Internet | 26 | 2.3% |
| No Internet | 111 | 10.0% |
| Total | 1,115 | 100.0% |
Devola Summary
Devola, Ohio is a small village located in Washington County, Ohio. It is situated along the Muskingum River, approximately five miles south of Marietta. The village was founded in 1817 and is named after the Devola family, who were among the first settlers in the area.
Geography
Devola is located in the Appalachian Plateau region of Ohio. The village is situated along the Muskingum River, which is a tributary of the Ohio River. The village is surrounded by rolling hills and wooded areas, and is located in a rural area. The village is located approximately five miles south of Marietta, the county seat of Washington County.
The village has a total area of 0.3 square miles, all of which is land. The village is located at an elevation of 690 feet above sea level. The climate in Devola is humid continental, with hot summers and cold winters.
Demographics
As of the 2010 census, the population of Devola was 1,068. The population density was 3,541 people per square mile. The racial makeup of the village was 97.3% White, 0.7% African American, 0.2% Native American, 0.2% Asian, 0.2% from other races, and 1.6% from two or more races. Hispanic or Latino of any race were 0.7% of the population.
The median age in Devola was 43.2 years. 22.2% of residents were under the age of 18; 6.7% were between the ages of 18 and 24; 22.7% were from 25 to 44; 28.2% were from 45 to 64; and 20.2% were 65 years of age or older. The gender makeup of the village was 48.2% male and 51.8% female.
Economy
Devola is a small, rural village with a limited economy. The village is home to several small businesses, including a grocery store, a hardware store, a restaurant, and a few other small shops. The village is also home to a few manufacturing companies, including a plastics manufacturer and a metal fabrication company.
The village is served by the Marietta-Washington County Airport, which is located approximately five miles north of the village. The airport provides general aviation services, as well as charter flights.
Education
Devola is served by the Marietta City School District. The village is home to Devola Elementary School, which serves students in grades K-5. Students in grades 6-12 attend Marietta High School. The village is also home to Washington State Community College, which offers a variety of associate degree and certificate programs.
Conclusion
Devola, Ohio is a small village located in Washington County, Ohio. It is situated along the Muskingum River, approximately five miles south of Marietta. The village was founded in 1817 and is named after the Devola family, who were among the first settlers in the area. As of the 2010 census, the population of Devola was 1,068. The village is home to several small businesses, and is served by the Marietta-Washington County Airport. The village is served by the Marietta City School District, and is home to Devola Elementary School and Washington State Community College.
Common Questions
What is the Total Population of Devola?
Total Population of Devola is 2,669.
What is the Total Male Population of Devola?
Total Male Population of Devola is 1,412.
What is the Total Female Population of Devola?
Total Female Population of Devola is 1,257.
What is the Ratio of Males per 100 Females in Devola?
There are 112.33 Males per 100 Females in Devola.
What is the Ratio of Females per 100 Males in Devola?
There are 89.02 Females per 100 Males in Devola.
What is the Median Population Age in Devola?
Median Population Age in Devola is 46.9 Years.
What is the Average Family Size in Devola
Average Family Size in Devola is 2.9 People.
What is the Average Household Size in Devola
Average Household Size in Devola is 2.2 People.
What is Per Capita Income in Devola?
Per Capita income in Devola is $47,163.
What is the Median Family Income in Devola?
Median Family Income in Devola is $97,127.
What is the Median Household income in Devola?
Median Household Income in Devola is $79,290.
What is Income or Wage Gap in Devola?
Income or Wage Gap in Devola is 42.4%.
Women in Devola earn 57.6 cents for every dollar earned by a man.
What is Inequality or Gini Index in Devola?
Inequality or Gini Index in Devola is 0.48.
How Large is the Labor Force in Devola?
There are 1,351 People in the Labor Forcein in Devola.
What is the Percentage of People in the Labor Force in Devola?
58.9% of People are in the Labor Force in Devola.
What is the Unemployment Rate in Devola?
Unemployment Rate in Devola is 4.4%.