Jackson, OH
Jackson Map
Jackson Overview
6,222
TOTAL POPULATION
3,087
MALE POPULATION
3,135
FEMALE POPULATION
98.47
MALES / 100 FEMALES
101.55
FEMALES / 100 MALES
34.5
MEDIAN AGE
3.1
AVG FAMILY SIZE
2.4
AVG HOUSEHOLD SIZE
$35,310
PER CAPITA INCOME
$71,865
AVG FAMILY INCOME
$51,864
AVG HOUSEHOLD INCOME
32.3%
WAGE / INCOME GAP [ % ]
67.7¢/ $1
WAGE / INCOME GAP [ $ ]
0.56
INEQUALITY / GINI INDEX
3,237
LABOR FORCE [ PEOPLE ]
65.4%
PERCENT IN LABOR FORCE
4.8%
UNEMPLOYMENT RATE
Jackson Zip Codes
Jackson Area Codes
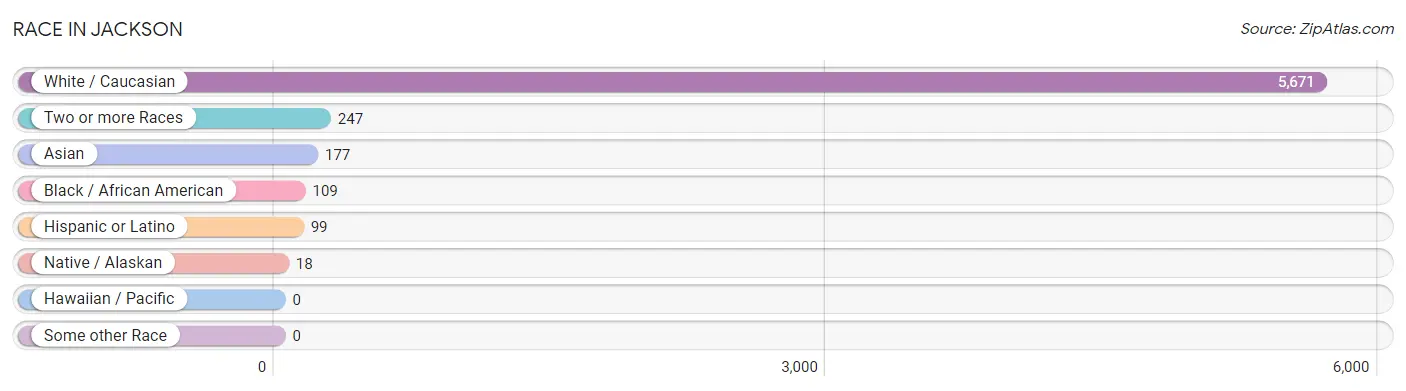
Race in Jackson
The most populous races in Jackson are White / Caucasian (5,671 | 91.1%), Two or more Races (247 | 4.0%), and Asian (177 | 2.8%).
| Race | # Population | % Population |
| Asian | 177 | 2.8% |
| Black / African American | 109 | 1.8% |
| Hawaiian / Pacific | 0 | 0.0% |
| Hispanic or Latino | 99 | 1.6% |
| Native / Alaskan | 18 | 0.3% |
| White / Caucasian | 5,671 | 91.1% |
| Two or more Races | 247 | 4.0% |
| Some other Race | 0 | 0.0% |
| Total | 6,222 | 100.0% |
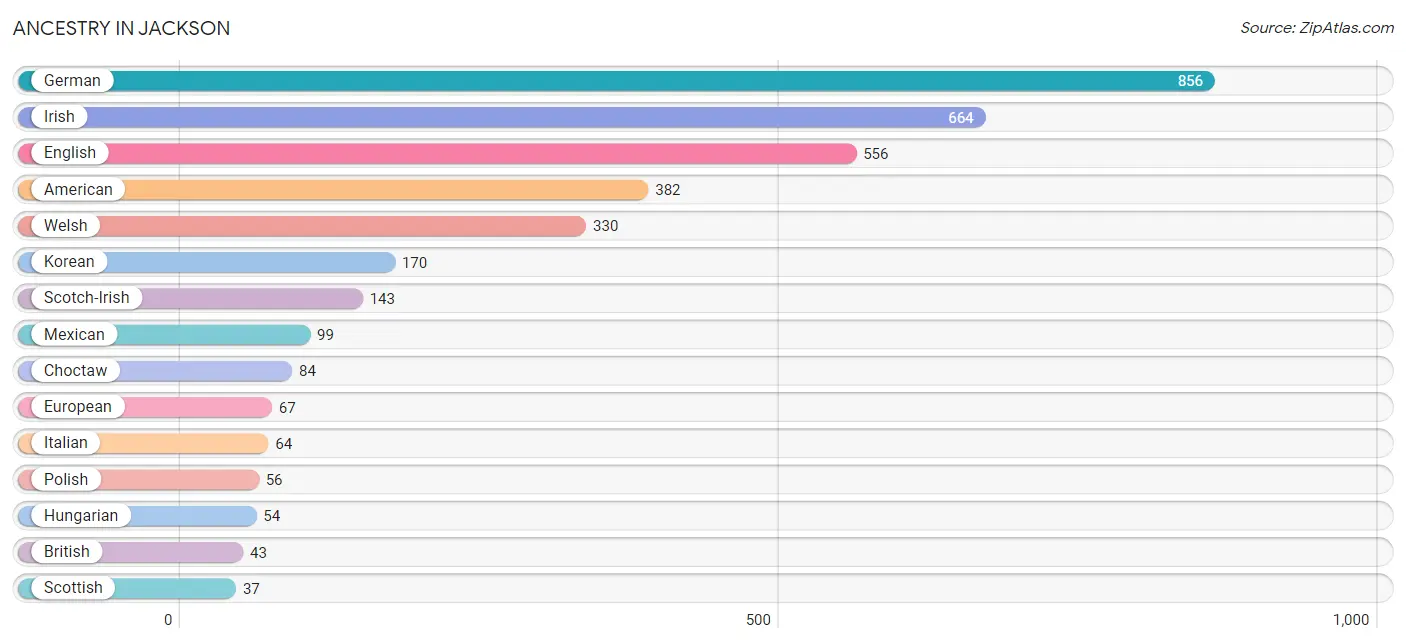
Ancestry in Jackson
The most populous ancestries reported in Jackson are German (856 | 13.8%), Irish (664 | 10.7%), English (556 | 8.9%), American (382 | 6.1%), and Welsh (330 | 5.3%), together accounting for 44.8% of all Jackson residents.
| Ancestry | # Population | % Population |
| American | 382 | 6.1% |
| Austrian | 4 | 0.1% |
| British | 43 | 0.7% |
| Canadian | 36 | 0.6% |
| Celtic | 7 | 0.1% |
| Choctaw | 84 | 1.3% |
| Dutch | 22 | 0.4% |
| English | 556 | 8.9% |
| European | 67 | 1.1% |
| French Canadian | 19 | 0.3% |
| German | 856 | 13.8% |
| Hungarian | 54 | 0.9% |
| Irish | 664 | 10.7% |
| Italian | 64 | 1.0% |
| Korean | 170 | 2.7% |
| Mexican | 99 | 1.6% |
| Northern European | 13 | 0.2% |
| Norwegian | 8 | 0.1% |
| Polish | 56 | 0.9% |
| Scandinavian | 8 | 0.1% |
| Scotch-Irish | 143 | 2.3% |
| Scottish | 37 | 0.6% |
| Welsh | 330 | 5.3% | View All 23 Rows |
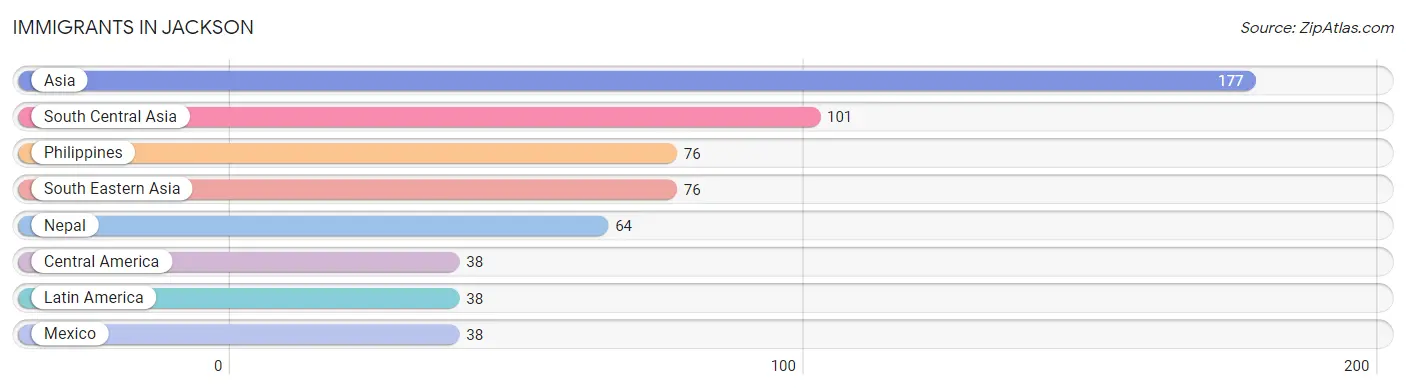
Immigrants in Jackson
The most numerous immigrant groups reported in Jackson came from Asia (177 | 2.8%), South Central Asia (101 | 1.6%), Philippines (76 | 1.2%), South Eastern Asia (76 | 1.2%), and Nepal (64 | 1.0%), together accounting for 7.9% of all Jackson residents.
| Immigration Origin | # Population | % Population |
| Asia | 177 | 2.8% |
| Central America | 38 | 0.6% |
| Latin America | 38 | 0.6% |
| Mexico | 38 | 0.6% |
| Nepal | 64 | 1.0% |
| Philippines | 76 | 1.2% |
| South Central Asia | 101 | 1.6% |
| South Eastern Asia | 76 | 1.2% | View All 8 Rows |
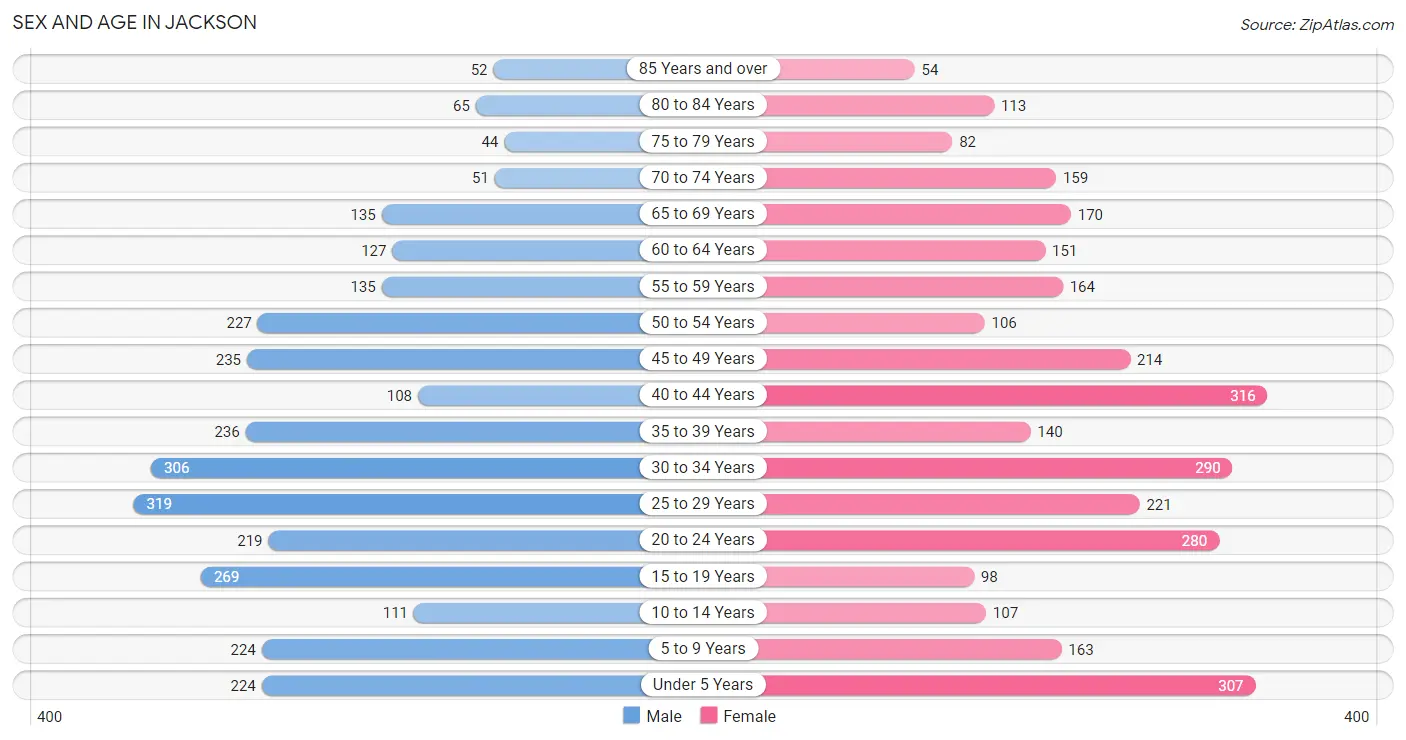
Sex and Age in Jackson
Sex and Age in Jackson
The most populous age groups in Jackson are 25 to 29 Years (319 | 10.3%) for men and 40 to 44 Years (316 | 10.1%) for women.
| Age Bracket | Male | Female |
| Under 5 Years | 224 (7.3%) | 307 (9.8%) |
| 5 to 9 Years | 224 (7.3%) | 163 (5.2%) |
| 10 to 14 Years | 111 (3.6%) | 107 (3.4%) |
| 15 to 19 Years | 269 (8.7%) | 98 (3.1%) |
| 20 to 24 Years | 219 (7.1%) | 280 (8.9%) |
| 25 to 29 Years | 319 (10.3%) | 221 (7.0%) |
| 30 to 34 Years | 306 (9.9%) | 290 (9.2%) |
| 35 to 39 Years | 236 (7.6%) | 140 (4.5%) |
| 40 to 44 Years | 108 (3.5%) | 316 (10.1%) |
| 45 to 49 Years | 235 (7.6%) | 214 (6.8%) |
| 50 to 54 Years | 227 (7.3%) | 106 (3.4%) |
| 55 to 59 Years | 135 (4.4%) | 164 (5.2%) |
| 60 to 64 Years | 127 (4.1%) | 151 (4.8%) |
| 65 to 69 Years | 135 (4.4%) | 170 (5.4%) |
| 70 to 74 Years | 51 (1.7%) | 159 (5.1%) |
| 75 to 79 Years | 44 (1.4%) | 82 (2.6%) |
| 80 to 84 Years | 65 (2.1%) | 113 (3.6%) |
| 85 Years and over | 52 (1.7%) | 54 (1.7%) |
| Total | 3,087 (100.0%) | 3,135 (100.0%) |
Families and Households in Jackson
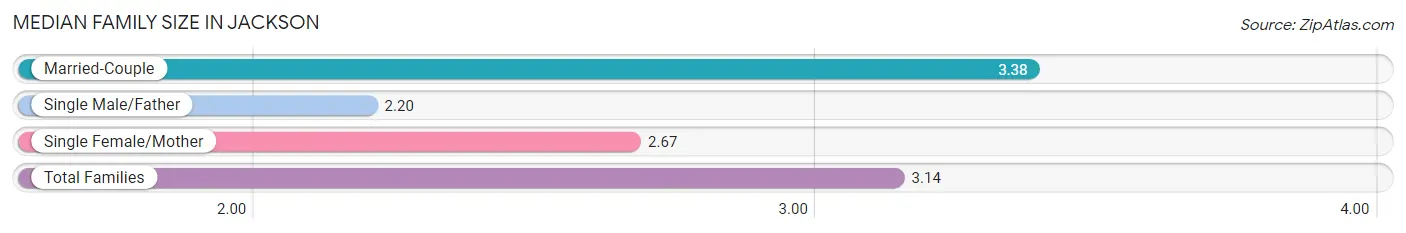
Median Family Size in Jackson
The median family size in Jackson is 3.14 persons per family, with married-couple families (1,071 | 70.1%) accounting for the largest median family size of 3.38 persons per family. On the other hand, single male/father families (89 | 5.8%) represent the smallest median family size with 2.20 persons per family.
| Family Type | # Families | Family Size |
| Married-Couple | 1,071 (70.1%) | 3.38 |
| Single Male/Father | 89 (5.8%) | 2.20 |
| Single Female/Mother | 369 (24.1%) | 2.67 |
| Total Families | 1,529 (100.0%) | 3.14 |
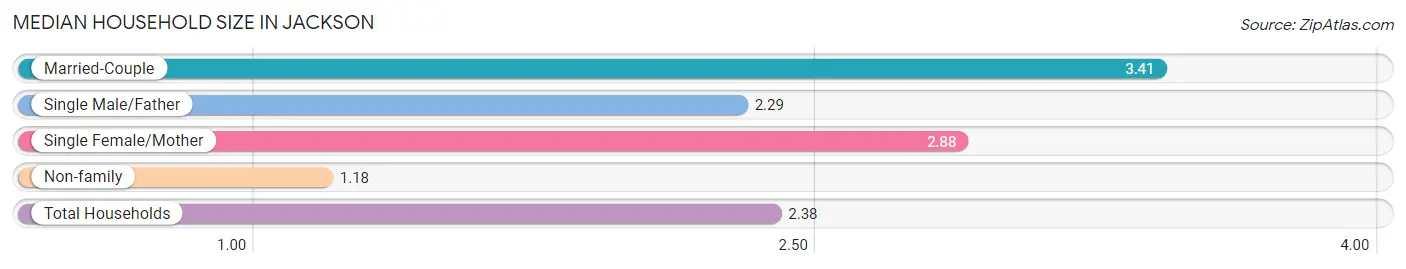
Median Household Size in Jackson
The median household size in Jackson is 2.38 persons per household, with married-couple households (1,071 | 41.4%) accounting for the largest median household size of 3.41 persons per household. non-family households (1,060 | 40.9%) represent the smallest median household size with 1.18 persons per household.
| Household Type | # Households | Household Size |
| Married-Couple | 1,071 (41.4%) | 3.41 |
| Single Male/Father | 89 (3.4%) | 2.29 |
| Single Female/Mother | 369 (14.2%) | 2.88 |
| Non-family | 1,060 (40.9%) | 1.18 |
| Total Households | 2,589 (100.0%) | 2.38 |
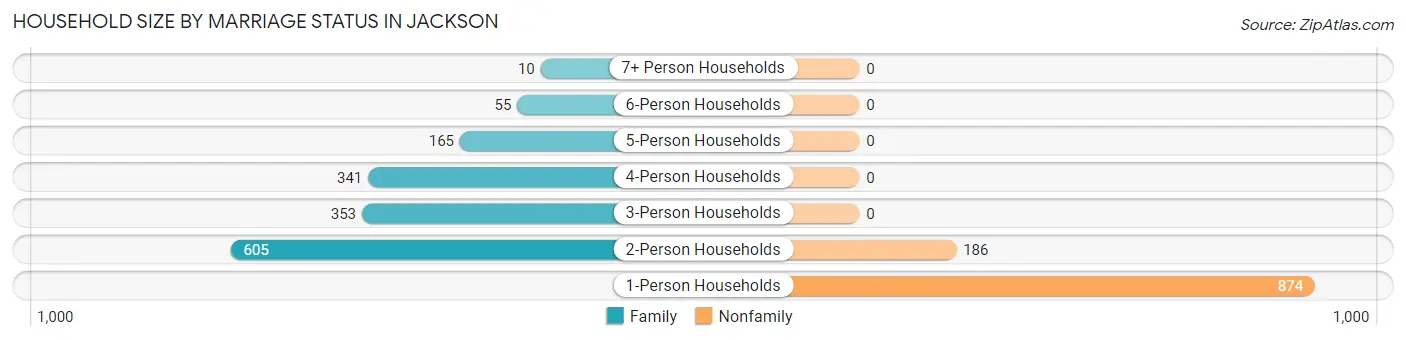
Household Size by Marriage Status in Jackson
Out of a total of 2,589 households in Jackson, 1,529 (59.1%) are family households, while 1,060 (40.9%) are nonfamily households. The most numerous type of family households are 2-person households, comprising 605, and the most common type of nonfamily households are 1-person households, comprising 874.
| Household Size | Family Households | Nonfamily Households |
| 1-Person Households | - | 874 (33.8%) |
| 2-Person Households | 605 (23.4%) | 186 (7.2%) |
| 3-Person Households | 353 (13.6%) | 0 (0.0%) |
| 4-Person Households | 341 (13.2%) | 0 (0.0%) |
| 5-Person Households | 165 (6.4%) | 0 (0.0%) |
| 6-Person Households | 55 (2.1%) | 0 (0.0%) |
| 7+ Person Households | 10 (0.4%) | 0 (0.0%) |
| Total | 1,529 (59.1%) | 1,060 (40.9%) |
Female Fertility in Jackson
Fertility by Age in Jackson
Average fertility rate in Jackson is 58.0 births per 1,000 women. Women in the age bracket of 35 to 50 years have the highest fertility rate with 94.0 births per 1,000 women. Women in the age bracket of 35 to 50 years acount for 71.4% of all women with births.
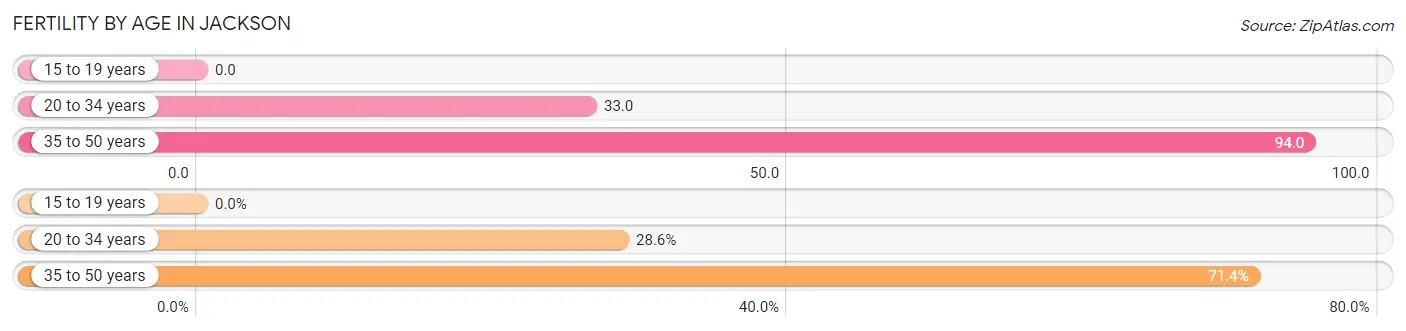
| Age Bracket | Women with Births | Births / 1,000 Women |
| 15 to 19 years | 0 (0.0%) | 0.0 |
| 20 to 34 years | 26 (28.6%) | 33.0 |
| 35 to 50 years | 65 (71.4%) | 94.0 |
| Total | 91 (100.0%) | 58.0 |
Fertility by Age by Marriage Status in Jackson
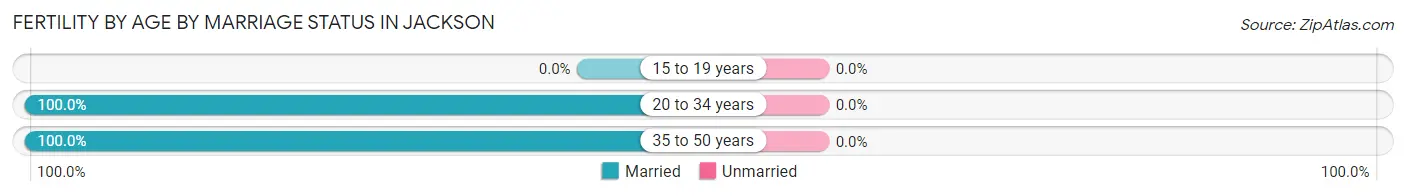
| Age Bracket | Married | Unmarried |
| 15 to 19 years | 0 (0.0%) | 0 (0.0%) |
| 20 to 34 years | 26 (100.0%) | 0 (0.0%) |
| 35 to 50 years | 65 (100.0%) | 0 (0.0%) |
| Total | 91 (100.0%) | 0 (0.0%) |
Fertility by Education in Jackson
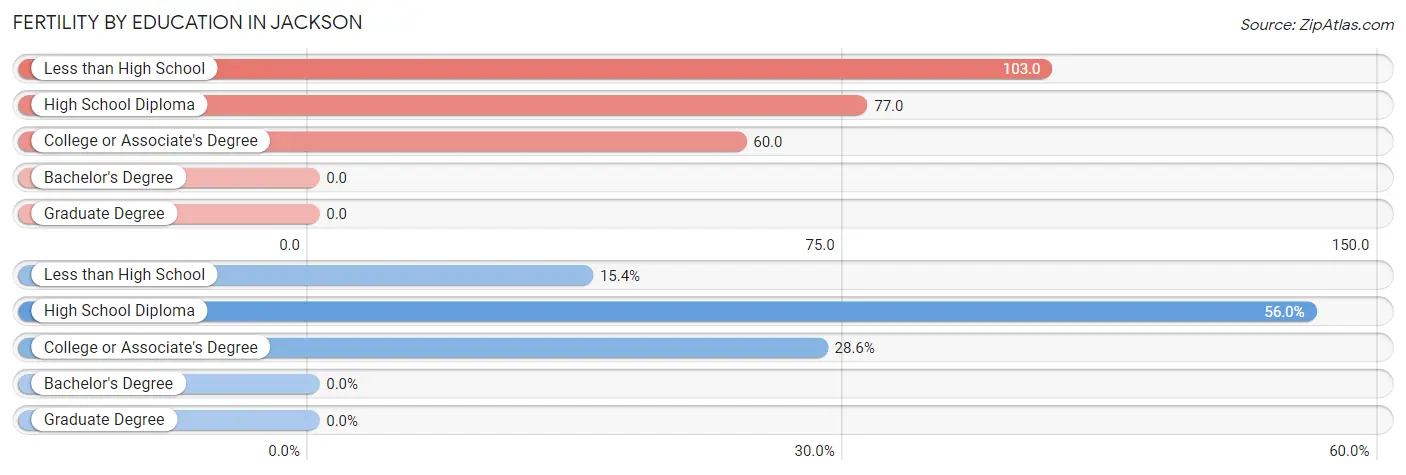
| Educational Attainment | Women with Births | Births / 1,000 Women |
| Less than High School | 14 (15.4%) | 103.0 |
| High School Diploma | 51 (56.0%) | 77.0 |
| College or Associate's Degree | 26 (28.6%) | 60.0 |
| Bachelor's Degree | 0 (0.0%) | 0.0 |
| Graduate Degree | 0 (0.0%) | 0.0 |
| Total | 91 (100.0%) | 58.0 |
Fertility by Education by Marriage Status in Jackson
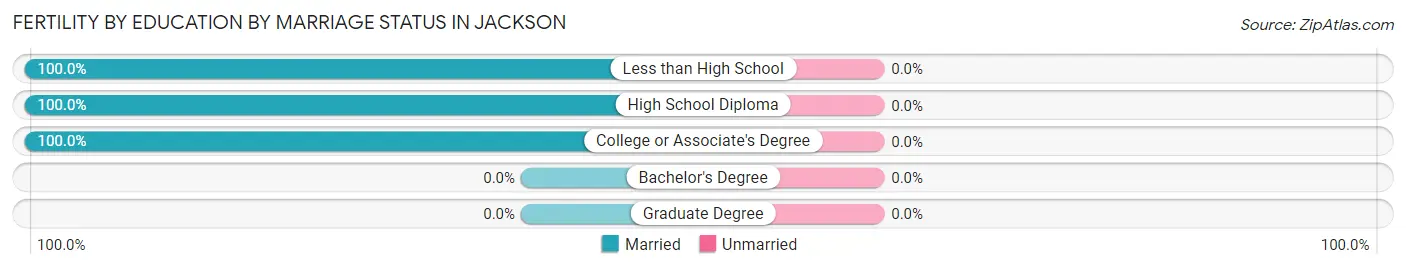
| Educational Attainment | Married | Unmarried |
| Less than High School | 14 (100.0%) | 0 (0.0%) |
| High School Diploma | 51 (100.0%) | 0 (0.0%) |
| College or Associate's Degree | 26 (100.0%) | 0 (0.0%) |
| Bachelor's Degree | 0 (0.0%) | 0 (0.0%) |
| Graduate Degree | 0 (0.0%) | 0 (0.0%) |
| Total | 91 (100.0%) | 0 (0.0%) |
Income in Jackson
Income Overview in Jackson
Per Capita Income in Jackson is $35,310, while median incomes of families and households are $71,865 and $51,864 respectively.
| Characteristic | Number | Measure |
| Per Capita Income | 6,222 | $35,310 |
| Median Family Income | 1,529 | $71,865 |
| Mean Family Income | 1,529 | $110,753 |
| Median Household Income | 2,589 | $51,864 |
| Mean Household Income | 2,589 | $84,600 |
| Income Deficit | 1,529 | $0 |
| Wage / Income Gap (%) | 6,222 | 32.31% |
| Wage / Income Gap ($) | 6,222 | 67.69¢ per $1 |
| Gini / Inequality Index | 6,222 | 0.56 |
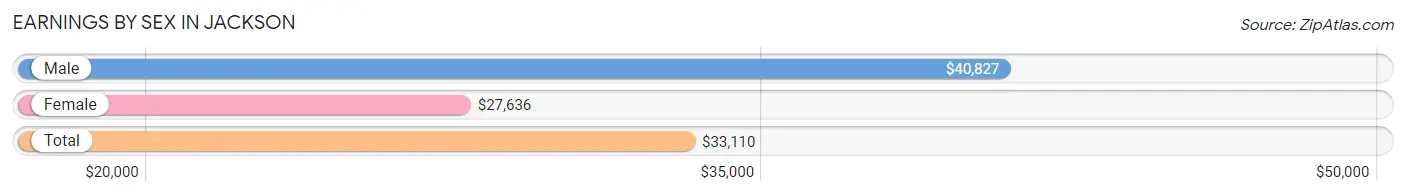
Earnings by Sex in Jackson
Average Earnings in Jackson are $33,110, $40,827 for men and $27,636 for women, a difference of 32.3%.
| Sex | Number | Average Earnings |
| Male | 1,621 (48.4%) | $40,827 |
| Female | 1,728 (51.6%) | $27,636 |
| Total | 3,349 (100.0%) | $33,110 |
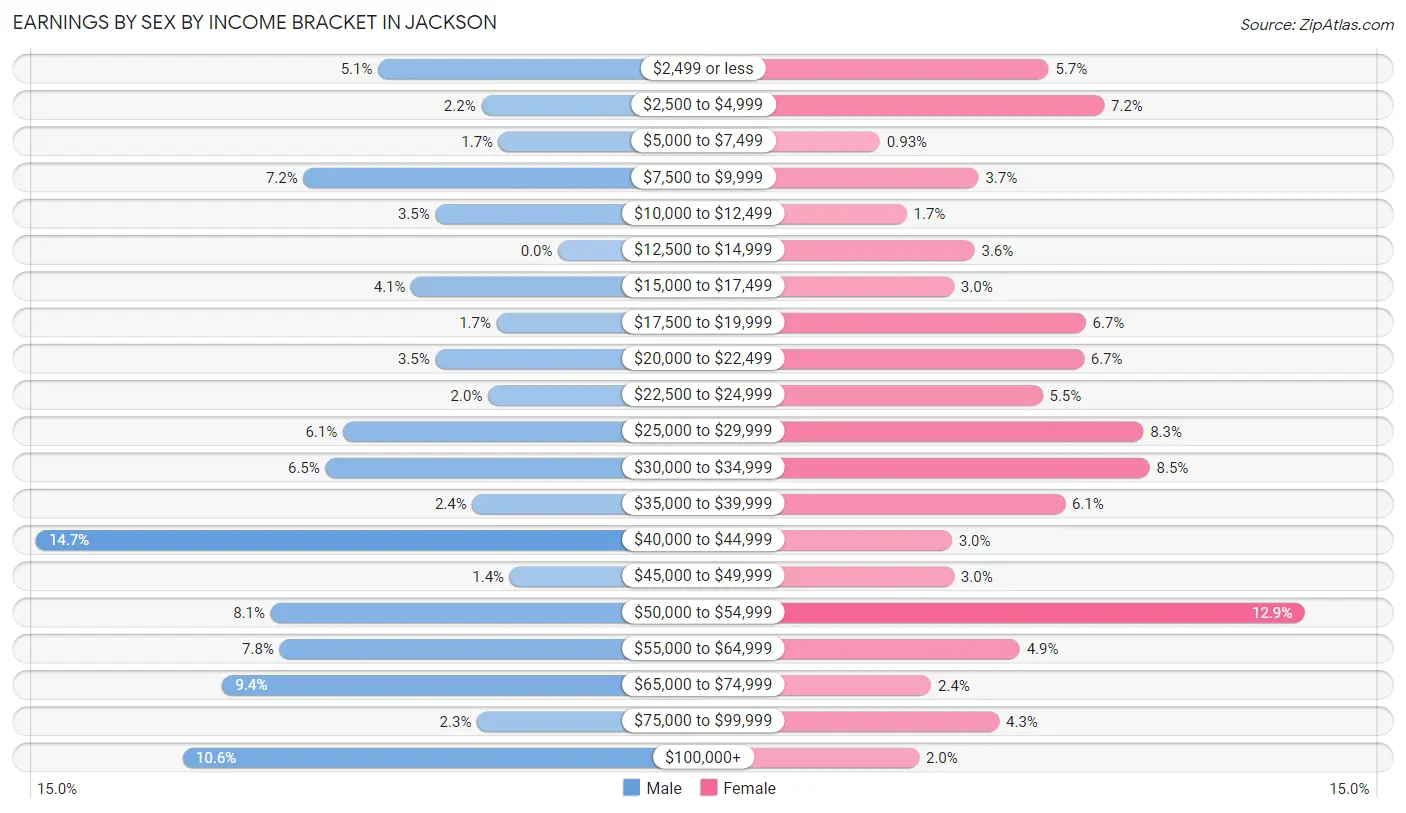
Earnings by Sex by Income Bracket in Jackson
The most common earnings brackets in Jackson are $40,000 to $44,999 for men (238 | 14.7%) and $50,000 to $54,999 for women (222 | 12.9%).
| Income | Male | Female |
| $2,499 or less | 82 (5.1%) | 98 (5.7%) |
| $2,500 to $4,999 | 35 (2.2%) | 125 (7.2%) |
| $5,000 to $7,499 | 27 (1.7%) | 16 (0.9%) |
| $7,500 to $9,999 | 116 (7.2%) | 64 (3.7%) |
| $10,000 to $12,499 | 56 (3.5%) | 29 (1.7%) |
| $12,500 to $14,999 | 0 (0.0%) | 62 (3.6%) |
| $15,000 to $17,499 | 67 (4.1%) | 52 (3.0%) |
| $17,500 to $19,999 | 28 (1.7%) | 116 (6.7%) |
| $20,000 to $22,499 | 56 (3.5%) | 115 (6.7%) |
| $22,500 to $24,999 | 32 (2.0%) | 95 (5.5%) |
| $25,000 to $29,999 | 98 (6.0%) | 144 (8.3%) |
| $30,000 to $34,999 | 106 (6.5%) | 147 (8.5%) |
| $35,000 to $39,999 | 39 (2.4%) | 106 (6.1%) |
| $40,000 to $44,999 | 238 (14.7%) | 51 (2.9%) |
| $45,000 to $49,999 | 22 (1.4%) | 52 (3.0%) |
| $50,000 to $54,999 | 131 (8.1%) | 222 (12.9%) |
| $55,000 to $64,999 | 127 (7.8%) | 84 (4.9%) |
| $65,000 to $74,999 | 153 (9.4%) | 41 (2.4%) |
| $75,000 to $99,999 | 37 (2.3%) | 74 (4.3%) |
| $100,000+ | 171 (10.5%) | 35 (2.0%) |
| Total | 1,621 (100.0%) | 1,728 (100.0%) |
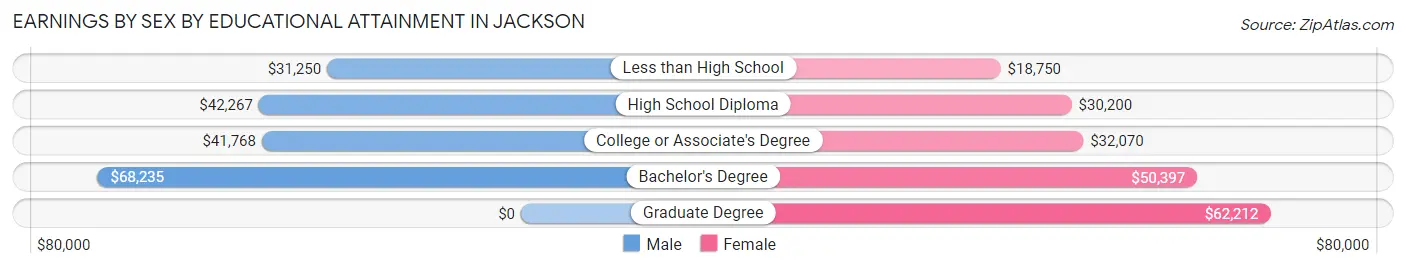
Earnings by Sex by Educational Attainment in Jackson
Average earnings in Jackson are $42,029 for men and $32,093 for women, a difference of 23.6%. Men with an educational attainment of bachelor's degree enjoy the highest average annual earnings of $68,235, while those with less than high school education earn the least with $31,250. Women with an educational attainment of graduate degree earn the most with the average annual earnings of $62,212, while those with less than high school education have the smallest earnings of $18,750.
| Educational Attainment | Male Income | Female Income |
| Less than High School | $31,250 | $18,750 |
| High School Diploma | $42,267 | $30,200 |
| College or Associate's Degree | $41,768 | $32,070 |
| Bachelor's Degree | $68,235 | $50,397 |
| Graduate Degree | - | - |
| Total | $42,029 | $32,093 |
Family Income in Jackson
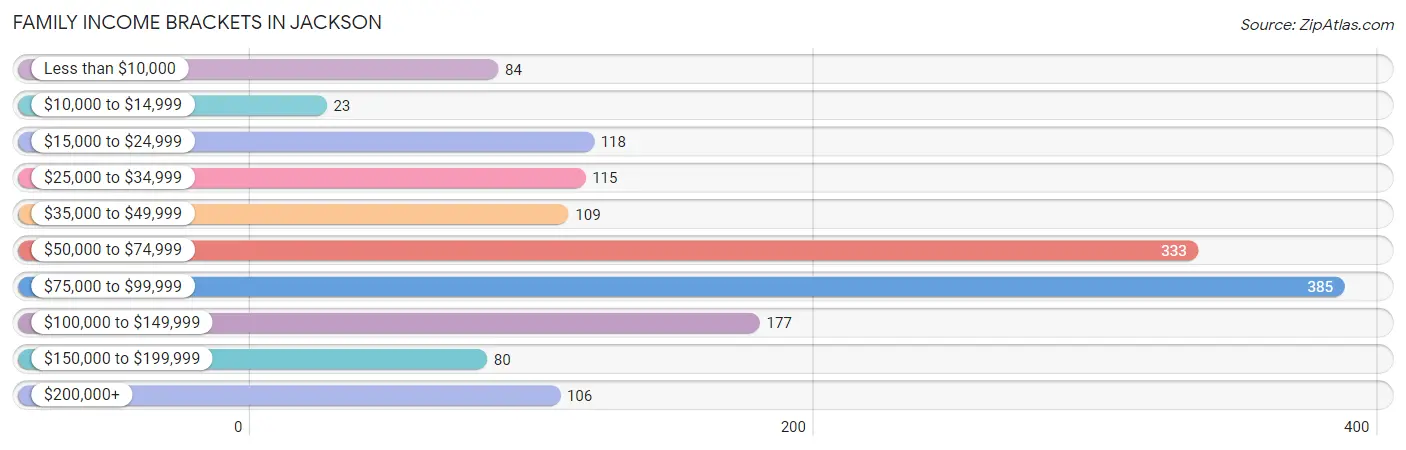
Family Income Brackets in Jackson
According to the Jackson family income data, there are 385 families falling into the $75,000 to $99,999 income range, which is the most common income bracket and makes up 25.2% of all families. Conversely, the $10,000 to $14,999 income bracket is the least frequent group with only 23 families (1.5%) belonging to this category.
| Income Bracket | # Families | % Families |
| Less than $10,000 | 84 | 5.5% |
| $10,000 to $14,999 | 23 | 1.5% |
| $15,000 to $24,999 | 118 | 7.7% |
| $25,000 to $34,999 | 115 | 7.5% |
| $35,000 to $49,999 | 109 | 7.1% |
| $50,000 to $74,999 | 333 | 21.8% |
| $75,000 to $99,999 | 385 | 25.2% |
| $100,000 to $149,999 | 177 | 11.6% |
| $150,000 to $199,999 | 80 | 5.2% |
| $200,000+ | 106 | 6.9% |
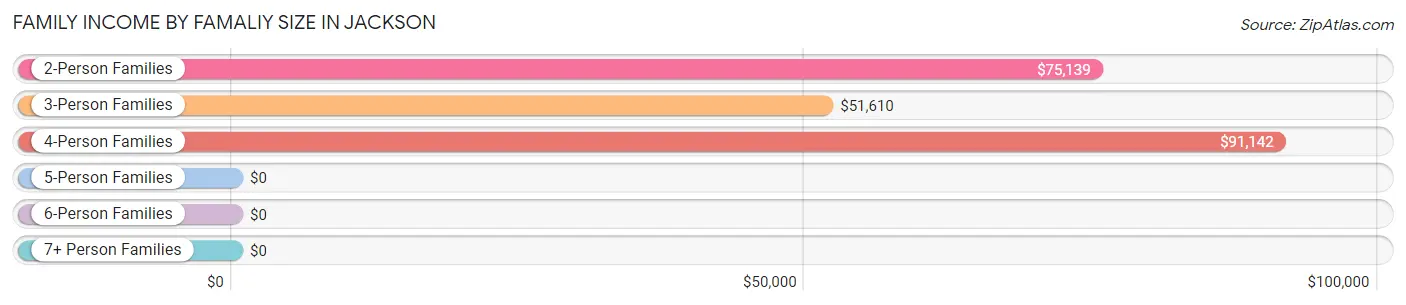
Family Income by Famaliy Size in Jackson
4-person families (305 | 20.0%) account for the highest median family income in Jackson with $91,142 per family, while 2-person families (605 | 39.6%) have the highest median income of $37,570 per family member.
| Income Bracket | # Families | Median Income |
| 2-Person Families | 605 (39.6%) | $75,139 |
| 3-Person Families | 420 (27.5%) | $51,610 |
| 4-Person Families | 305 (20.0%) | $91,142 |
| 5-Person Families | 146 (9.6%) | $0 |
| 6-Person Families | 43 (2.8%) | $0 |
| 7+ Person Families | 10 (0.6%) | $0 |
| Total | 1,529 (100.0%) | $71,865 |
Family Income by Number of Earners in Jackson
The median family income in Jackson is $71,865, with families comprising 3+ earners (284) having the highest median family income of $131,207, while families with 1 earner (495) have the lowest median family income of $32,171, accounting for 18.6% and 32.4% of families, respectively.
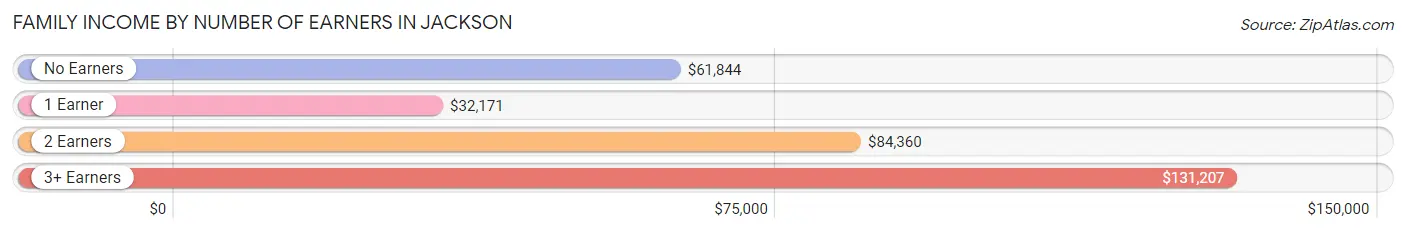
| Number of Earners | # Families | Median Income |
| No Earners | 223 (14.6%) | $61,844 |
| 1 Earner | 495 (32.4%) | $32,171 |
| 2 Earners | 527 (34.5%) | $84,360 |
| 3+ Earners | 284 (18.6%) | $131,207 |
| Total | 1,529 (100.0%) | $71,865 |
Household Income in Jackson
Household Income Brackets in Jackson
With 487 households falling in the category, the $75,000 to $99,999 income range is the most frequent in Jackson, accounting for 18.8% of all households. In contrast, only 80 households (3.1%) fall into the $150,000 to $199,999 income bracket, making it the least populous group.
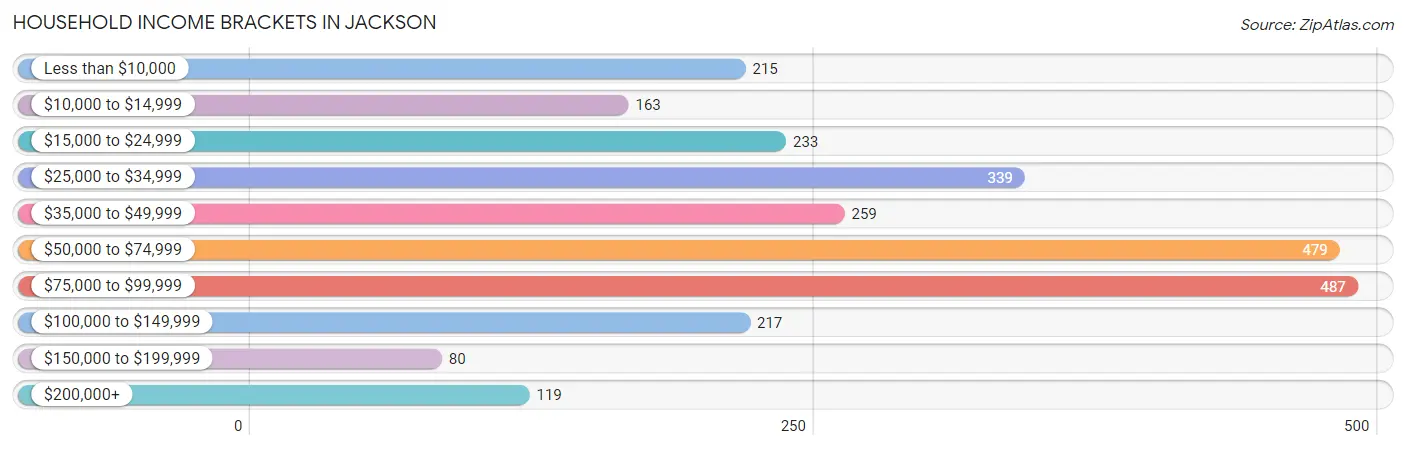
| Income Bracket | # Households | % Households |
| Less than $10,000 | 215 | 8.3% |
| $10,000 to $14,999 | 163 | 6.3% |
| $15,000 to $24,999 | 233 | 9.0% |
| $25,000 to $34,999 | 339 | 13.1% |
| $35,000 to $49,999 | 259 | 10.0% |
| $50,000 to $74,999 | 479 | 18.5% |
| $75,000 to $99,999 | 487 | 18.8% |
| $100,000 to $149,999 | 217 | 8.4% |
| $150,000 to $199,999 | 80 | 3.1% |
| $200,000+ | 119 | 4.6% |
Household Income by Householder Age in Jackson
The median household income in Jackson is $51,864, with the highest median household income of $56,957 found in the 25 to 44 years age bracket for the primary householder. A total of 881 households (34.0%) fall into this category. Meanwhile, the 15 to 24 years age bracket for the primary householder has the lowest median household income of $33,646, with 194 households (7.5%) in this group.
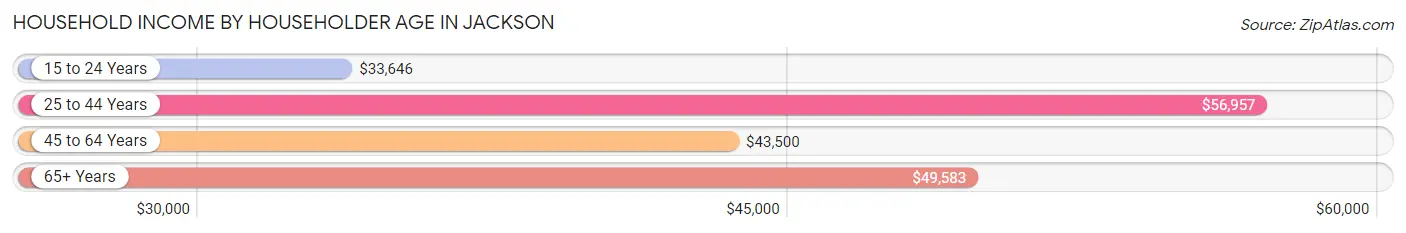
| Income Bracket | # Households | Median Income |
| 15 to 24 Years | 194 (7.5%) | $33,646 |
| 25 to 44 Years | 881 (34.0%) | $56,957 |
| 45 to 64 Years | 842 (32.5%) | $43,500 |
| 65+ Years | 672 (26.0%) | $49,583 |
| Total | 2,589 (100.0%) | $51,864 |
Poverty in Jackson
Income Below Poverty by Sex and Age in Jackson
With 21.2% poverty level for males and 22.9% for females among the residents of Jackson, 5 year old males and 12 to 14 year old females are the most vulnerable to poverty, with 53 males (100.0%) and 30 females (68.2%) in their respective age groups living below the poverty level.
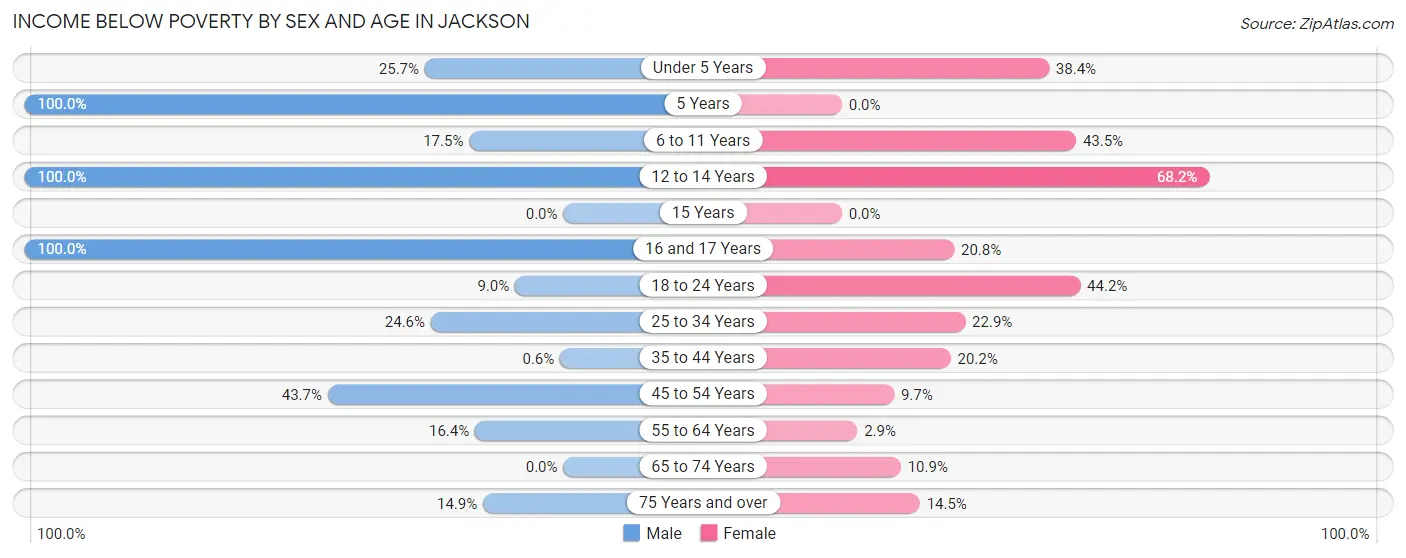
| Age Bracket | Male | Female |
| Under 5 Years | 54 (25.7%) | 118 (38.4%) |
| 5 Years | 53 (100.0%) | 0 (0.0%) |
| 6 to 11 Years | 47 (17.5%) | 93 (43.5%) |
| 12 to 14 Years | 13 (100.0%) | 30 (68.2%) |
| 15 Years | 0 (0.0%) | 0 (0.0%) |
| 16 and 17 Years | 28 (100.0%) | 10 (20.8%) |
| 18 to 24 Years | 29 (8.9%) | 146 (44.2%) |
| 25 to 34 Years | 150 (24.6%) | 117 (22.9%) |
| 35 to 44 Years | 2 (0.6%) | 92 (20.2%) |
| 45 to 54 Years | 202 (43.7%) | 31 (9.7%) |
| 55 to 64 Years | 40 (16.4%) | 9 (2.9%) |
| 65 to 74 Years | 0 (0.0%) | 36 (10.9%) |
| 75 Years and over | 24 (14.9%) | 36 (14.5%) |
| Total | 642 (21.2%) | 718 (22.9%) |
Income Above Poverty by Sex and Age in Jackson
According to the poverty statistics in Jackson, males aged 15 years and females aged 5 years are the age groups that are most secure financially, with 100.0% of males and 100.0% of females in these age groups living above the poverty line.
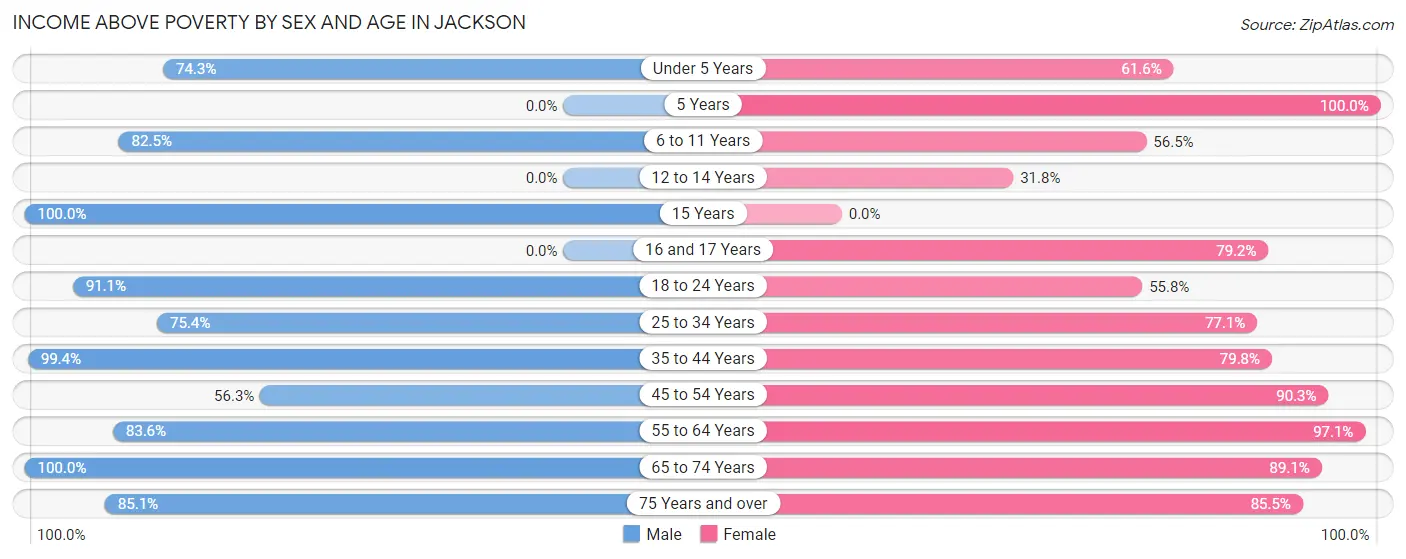
| Age Bracket | Male | Female |
| Under 5 Years | 156 (74.3%) | 189 (61.6%) |
| 5 Years | 0 (0.0%) | 12 (100.0%) |
| 6 to 11 Years | 222 (82.5%) | 121 (56.5%) |
| 12 to 14 Years | 0 (0.0%) | 14 (31.8%) |
| 15 Years | 136 (100.0%) | 0 (0.0%) |
| 16 and 17 Years | 0 (0.0%) | 38 (79.2%) |
| 18 to 24 Years | 295 (91.0%) | 184 (55.8%) |
| 25 to 34 Years | 460 (75.4%) | 394 (77.1%) |
| 35 to 44 Years | 334 (99.4%) | 364 (79.8%) |
| 45 to 54 Years | 260 (56.3%) | 289 (90.3%) |
| 55 to 64 Years | 204 (83.6%) | 306 (97.1%) |
| 65 to 74 Years | 186 (100.0%) | 293 (89.1%) |
| 75 Years and over | 137 (85.1%) | 213 (85.5%) |
| Total | 2,390 (78.8%) | 2,417 (77.1%) |
Income Below Poverty Among Married-Couple Families in Jackson
The poverty statistics for married-couple families in Jackson show that 13.2% or 141 of the total 1,071 families live below the poverty line. Families with 3 or 4 children have the highest poverty rate of 55.6%, comprising of 55 families. On the other hand, families with no children have the lowest poverty rate of 2.8%, which includes 17 families.
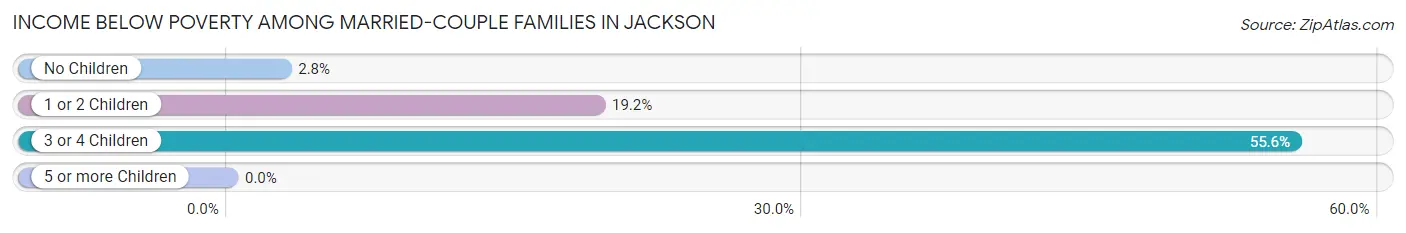
| Children | Above Poverty | Below Poverty |
| No Children | 595 (97.2%) | 17 (2.8%) |
| 1 or 2 Children | 291 (80.8%) | 69 (19.2%) |
| 3 or 4 Children | 44 (44.4%) | 55 (55.6%) |
| 5 or more Children | 0 (0.0%) | 0 (0.0%) |
| Total | 930 (86.8%) | 141 (13.2%) |
Income Below Poverty Among Single-Parent Households in Jackson
According to the poverty data in Jackson, 10.1% or 9 single-father households and 22.8% or 84 single-mother households are living below the poverty line. Among single-father households, those with 1 or 2 children have the highest poverty rate, with 9 households (23.1%) experiencing poverty. Likewise, among single-mother households, those with 3 or 4 children have the highest poverty rate, with 12 households (38.7%) falling below the poverty line.
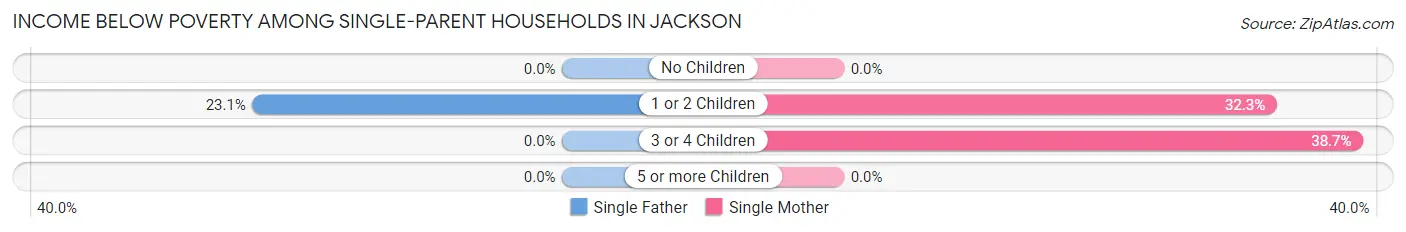
| Children | Single Father | Single Mother |
| No Children | 0 (0.0%) | 0 (0.0%) |
| 1 or 2 Children | 9 (23.1%) | 72 (32.3%) |
| 3 or 4 Children | 0 (0.0%) | 12 (38.7%) |
| 5 or more Children | 0 (0.0%) | 0 (0.0%) |
| Total | 9 (10.1%) | 84 (22.8%) |
Income Below Poverty Among Married-Couple vs Single-Parent Households in Jackson
The poverty data for Jackson shows that 141 of the married-couple family households (13.2%) and 93 of the single-parent households (20.3%) are living below the poverty level. Within the married-couple family households, those with 3 or 4 children have the highest poverty rate, with 55 households (55.6%) falling below the poverty line. Among the single-parent households, those with 3 or 4 children have the highest poverty rate, with 12 household (38.7%) living below poverty.
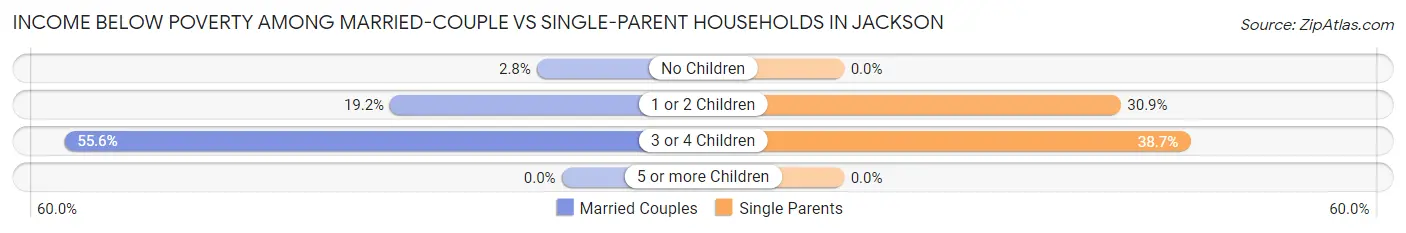
| Children | Married-Couple Families | Single-Parent Households |
| No Children | 17 (2.8%) | 0 (0.0%) |
| 1 or 2 Children | 69 (19.2%) | 81 (30.9%) |
| 3 or 4 Children | 55 (55.6%) | 12 (38.7%) |
| 5 or more Children | 0 (0.0%) | 0 (0.0%) |
| Total | 141 (13.2%) | 93 (20.3%) |
Employment Characteristics in Jackson
Employment by Class of Employer in Jackson
Among the 3,081 employed individuals in Jackson, private company employees (2,197 | 71.3%), not-for-profit organizations (334 | 10.8%), and local government employees (274 | 8.9%) make up the most common classes of employment.
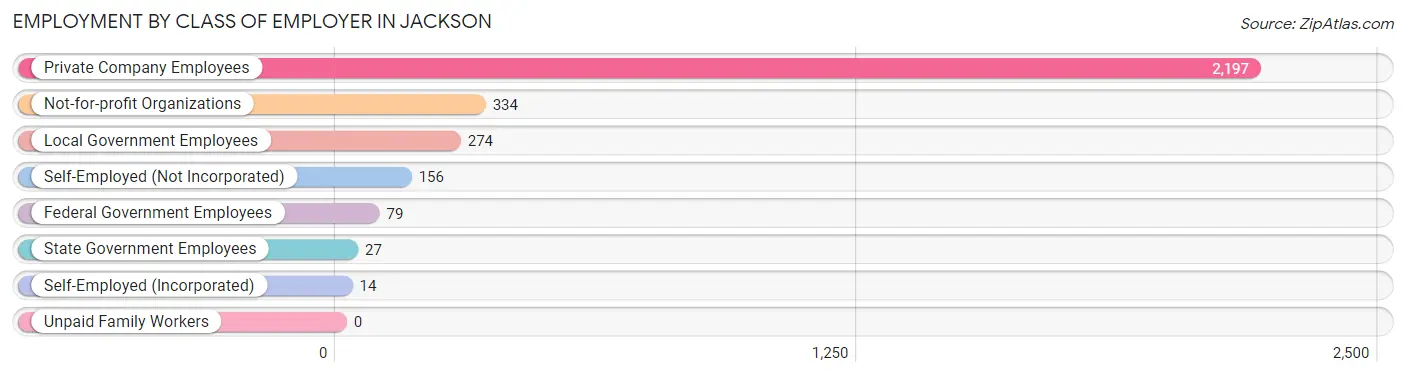
| Employer Class | # Employees | % Employees |
| Private Company Employees | 2,197 | 71.3% |
| Self-Employed (Incorporated) | 14 | 0.4% |
| Self-Employed (Not Incorporated) | 156 | 5.1% |
| Not-for-profit Organizations | 334 | 10.8% |
| Local Government Employees | 274 | 8.9% |
| State Government Employees | 27 | 0.9% |
| Federal Government Employees | 79 | 2.6% |
| Unpaid Family Workers | 0 | 0.0% |
| Total | 3,081 | 100.0% |
Employment Status by Age in Jackson
According to the labor force statistics for Jackson, out of the total population over 16 years of age (4,950), 65.4% or 3,237 individuals are in the labor force, with 4.8% or 155 of them unemployed. The age group with the highest labor force participation rate is 30 to 34 years, with 88.6% or 528 individuals in the labor force. Within the labor force, the 16 to 19 years age range has the highest percentage of unemployed individuals, with 19.0% or 27 of them being unemployed.
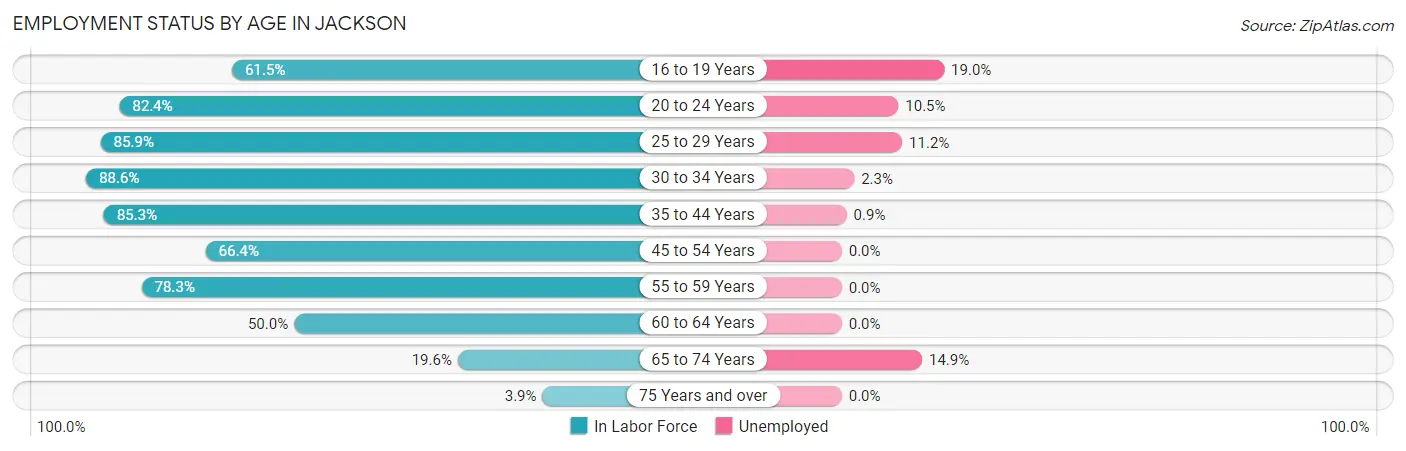
| Age Bracket | In Labor Force | Unemployed |
| 16 to 19 Years | 142 (61.5%) | 27 (19.0%) |
| 20 to 24 Years | 411 (82.4%) | 43 (10.5%) |
| 25 to 29 Years | 464 (85.9%) | 52 (11.2%) |
| 30 to 34 Years | 528 (88.6%) | 12 (2.3%) |
| 35 to 44 Years | 682 (85.3%) | 6 (0.9%) |
| 45 to 54 Years | 519 (66.4%) | 0 (0.0%) |
| 55 to 59 Years | 234 (78.3%) | 0 (0.0%) |
| 60 to 64 Years | 139 (50.0%) | 0 (0.0%) |
| 65 to 74 Years | 101 (19.6%) | 15 (14.9%) |
| 75 Years and over | 16 (3.9%) | 0 (0.0%) |
| Total | 3,237 (65.4%) | 155 (4.8%) |
Employment Status by Educational Attainment in Jackson
According to labor force statistics for Jackson, 77.9% of individuals (2,567) out of the total population between 25 and 64 years of age (3,295) are in the labor force, with 2.7% or 69 of them being unemployed. The group with the highest labor force participation rate are those with the educational attainment of bachelor's degree or higher, with 92.6% or 525 individuals in the labor force. Within the labor force, individuals with less than high school education have the highest percentage of unemployment, with 18.2% or 20 of them being unemployed.
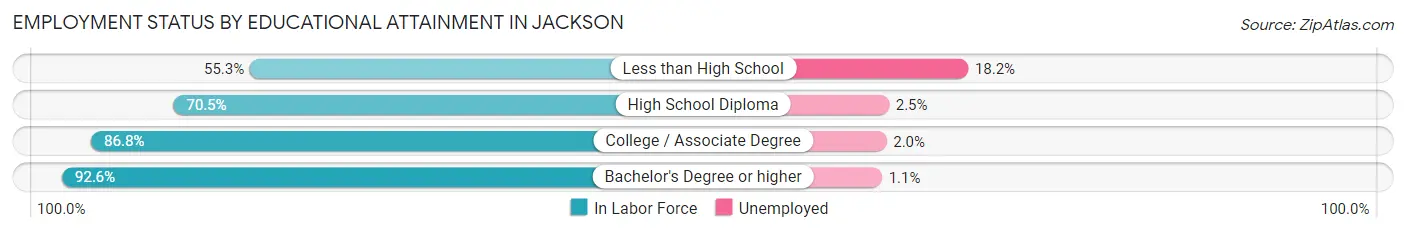
| Educational Attainment | In Labor Force | Unemployed |
| Less than High School | 110 (55.3%) | 36 (18.2%) |
| High School Diploma | 1,141 (70.5%) | 40 (2.5%) |
| College / Associate Degree | 791 (86.8%) | 18 (2.0%) |
| Bachelor's Degree or higher | 525 (92.6%) | 6 (1.1%) |
| Total | 2,567 (77.9%) | 89 (2.7%) |
Employment Occupations by Sex in Jackson
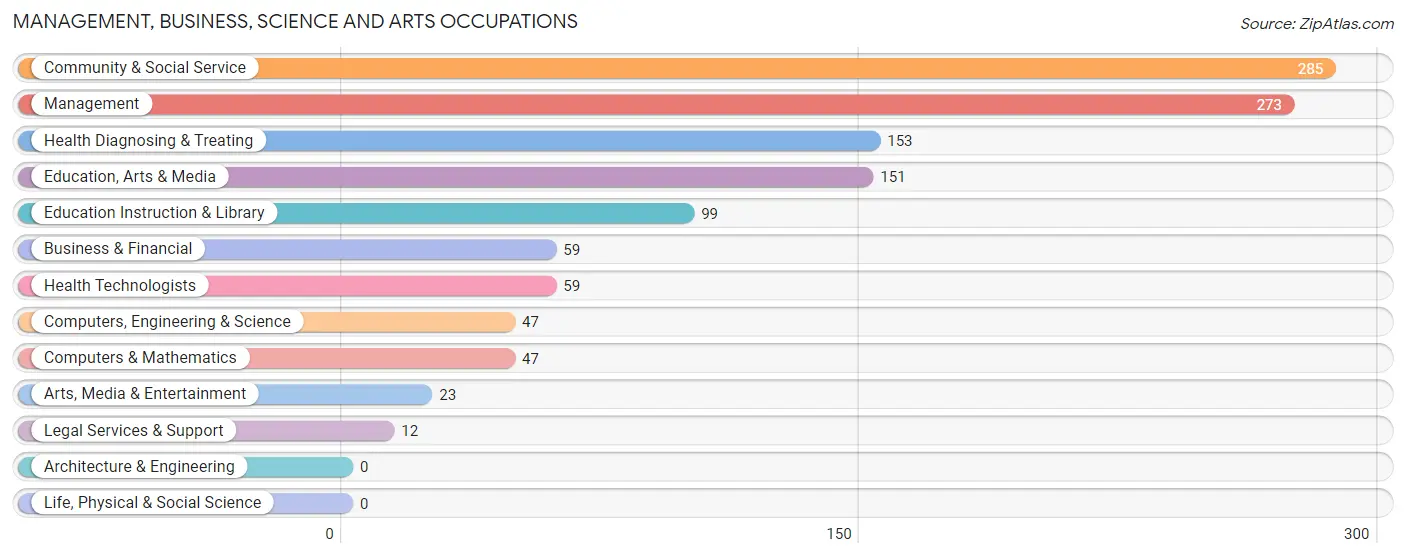
Management, Business, Science and Arts Occupations
The most common Management, Business, Science and Arts occupations in Jackson are Community & Social Service (285 | 9.2%), Management (273 | 8.9%), Health Diagnosing & Treating (153 | 5.0%), Education, Arts & Media (151 | 4.9%), and Education Instruction & Library (99 | 3.2%).
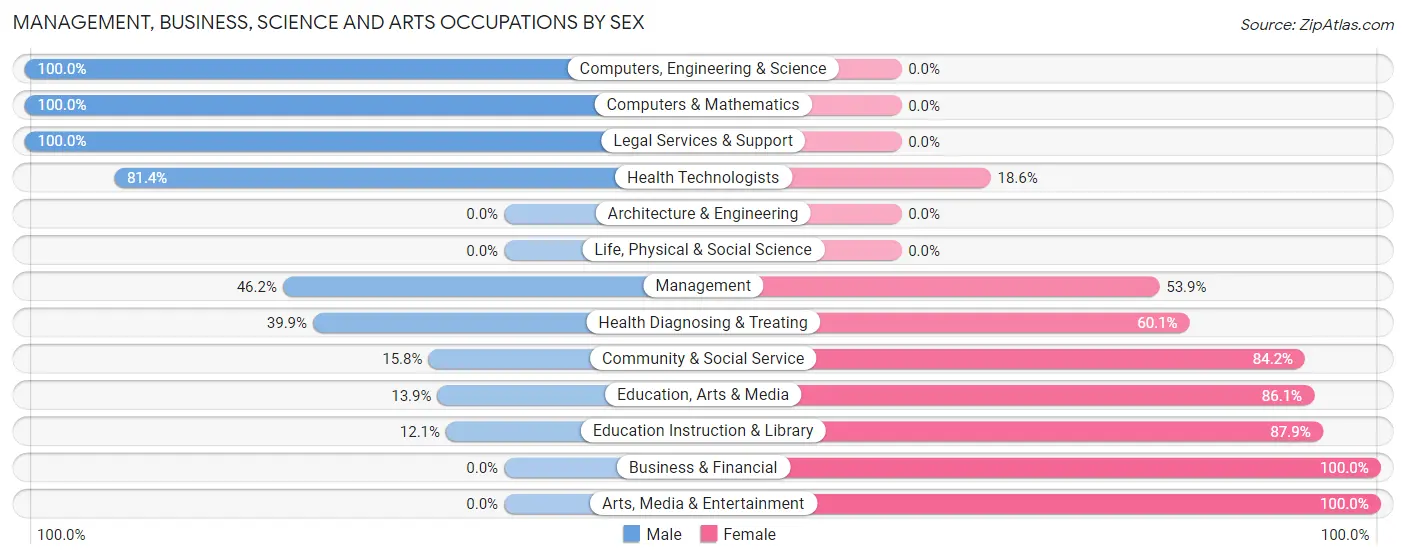
Management, Business, Science and Arts Occupations by Sex
Within the Management, Business, Science and Arts occupations in Jackson, the most male-oriented occupations are Computers, Engineering & Science (100.0%), Computers & Mathematics (100.0%), and Legal Services & Support (100.0%), while the most female-oriented occupations are Business & Financial (100.0%), Arts, Media & Entertainment (100.0%), and Education Instruction & Library (87.9%).
| Occupation | Male | Female |
| Management | 126 (46.2%) | 147 (53.8%) |
| Business & Financial | 0 (0.0%) | 59 (100.0%) |
| Computers, Engineering & Science | 47 (100.0%) | 0 (0.0%) |
| Computers & Mathematics | 47 (100.0%) | 0 (0.0%) |
| Architecture & Engineering | 0 (0.0%) | 0 (0.0%) |
| Life, Physical & Social Science | 0 (0.0%) | 0 (0.0%) |
| Community & Social Service | 45 (15.8%) | 240 (84.2%) |
| Education, Arts & Media | 21 (13.9%) | 130 (86.1%) |
| Legal Services & Support | 12 (100.0%) | 0 (0.0%) |
| Education Instruction & Library | 12 (12.1%) | 87 (87.9%) |
| Arts, Media & Entertainment | 0 (0.0%) | 23 (100.0%) |
| Health Diagnosing & Treating | 61 (39.9%) | 92 (60.1%) |
| Health Technologists | 48 (81.4%) | 11 (18.6%) |
| Total (Category) | 279 (34.2%) | 538 (65.8%) |
| Total (Overall) | 1,511 (49.0%) | 1,570 (51.0%) |
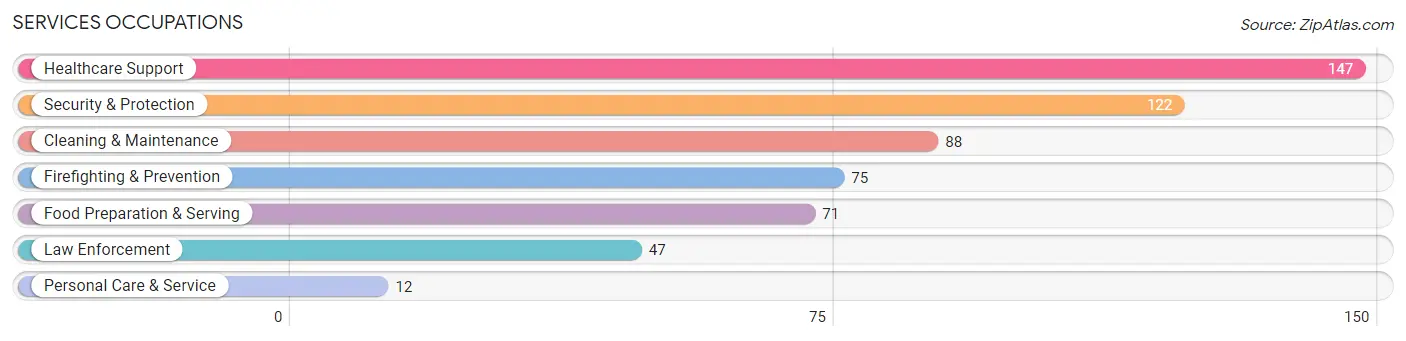
Services Occupations
The most common Services occupations in Jackson are Healthcare Support (147 | 4.8%), Security & Protection (122 | 4.0%), Cleaning & Maintenance (88 | 2.9%), Firefighting & Prevention (75 | 2.4%), and Food Preparation & Serving (71 | 2.3%).
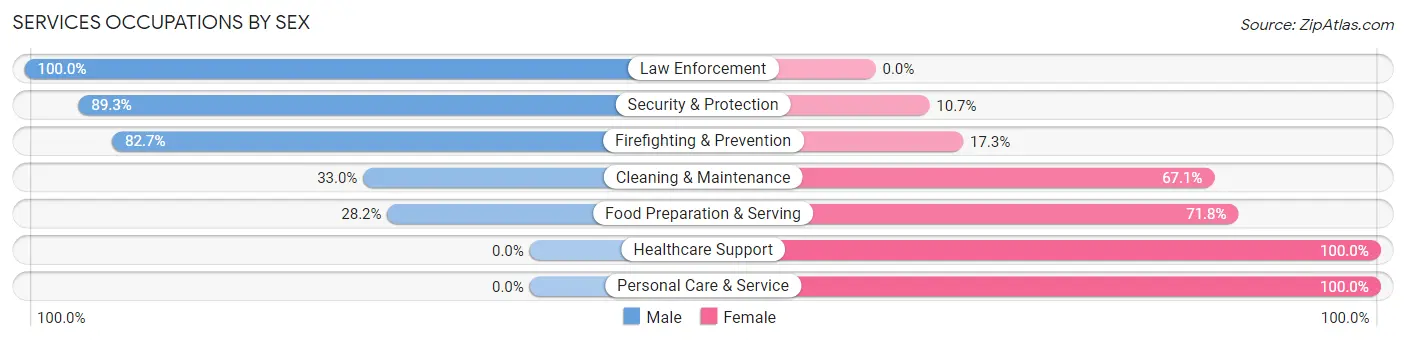
Services Occupations by Sex
Within the Services occupations in Jackson, the most male-oriented occupations are Law Enforcement (100.0%), Security & Protection (89.3%), and Firefighting & Prevention (82.7%), while the most female-oriented occupations are Healthcare Support (100.0%), Personal Care & Service (100.0%), and Food Preparation & Serving (71.8%).
| Occupation | Male | Female |
| Healthcare Support | 0 (0.0%) | 147 (100.0%) |
| Security & Protection | 109 (89.3%) | 13 (10.7%) |
| Firefighting & Prevention | 62 (82.7%) | 13 (17.3%) |
| Law Enforcement | 47 (100.0%) | 0 (0.0%) |
| Food Preparation & Serving | 20 (28.2%) | 51 (71.8%) |
| Cleaning & Maintenance | 29 (33.0%) | 59 (67.0%) |
| Personal Care & Service | 0 (0.0%) | 12 (100.0%) |
| Total (Category) | 158 (35.9%) | 282 (64.1%) |
| Total (Overall) | 1,511 (49.0%) | 1,570 (51.0%) |
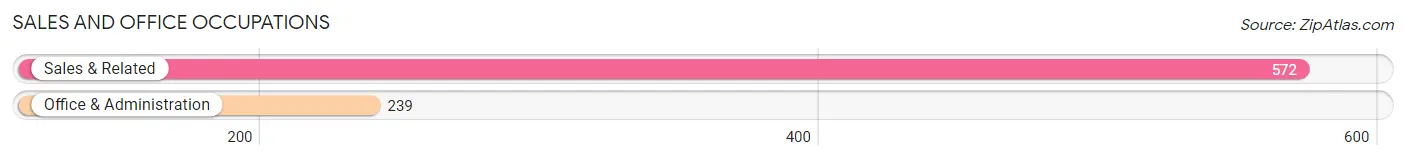
Sales and Office Occupations
The most common Sales and Office occupations in Jackson are Sales & Related (572 | 18.6%), and Office & Administration (239 | 7.8%).
Sales and Office Occupations by Sex
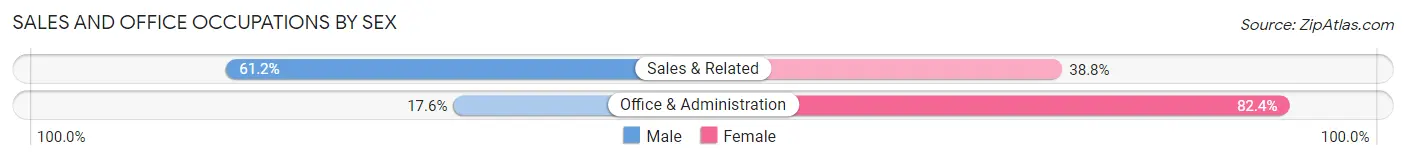
| Occupation | Male | Female |
| Sales & Related | 350 (61.2%) | 222 (38.8%) |
| Office & Administration | 42 (17.6%) | 197 (82.4%) |
| Total (Category) | 392 (48.3%) | 419 (51.7%) |
| Total (Overall) | 1,511 (49.0%) | 1,570 (51.0%) |
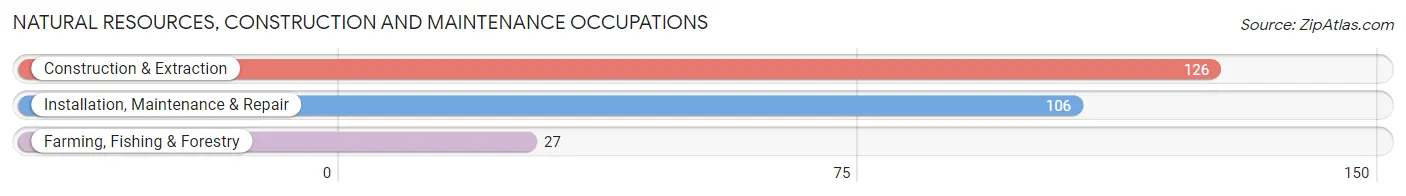
Natural Resources, Construction and Maintenance Occupations
The most common Natural Resources, Construction and Maintenance occupations in Jackson are Construction & Extraction (126 | 4.1%), Installation, Maintenance & Repair (106 | 3.4%), and Farming, Fishing & Forestry (27 | 0.9%).
Natural Resources, Construction and Maintenance Occupations by Sex
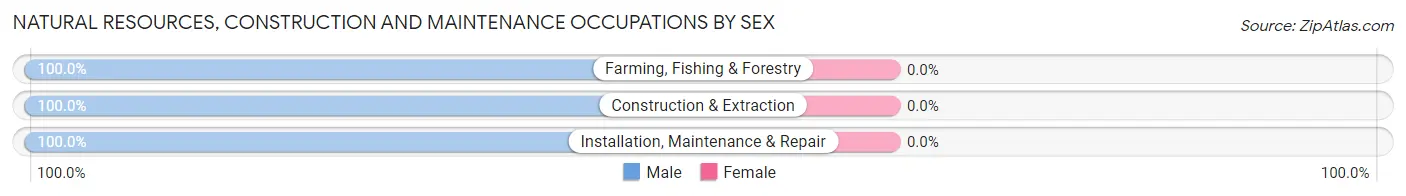
| Occupation | Male | Female |
| Farming, Fishing & Forestry | 27 (100.0%) | 0 (0.0%) |
| Construction & Extraction | 126 (100.0%) | 0 (0.0%) |
| Installation, Maintenance & Repair | 106 (100.0%) | 0 (0.0%) |
| Total (Category) | 259 (100.0%) | 0 (0.0%) |
| Total (Overall) | 1,511 (49.0%) | 1,570 (51.0%) |
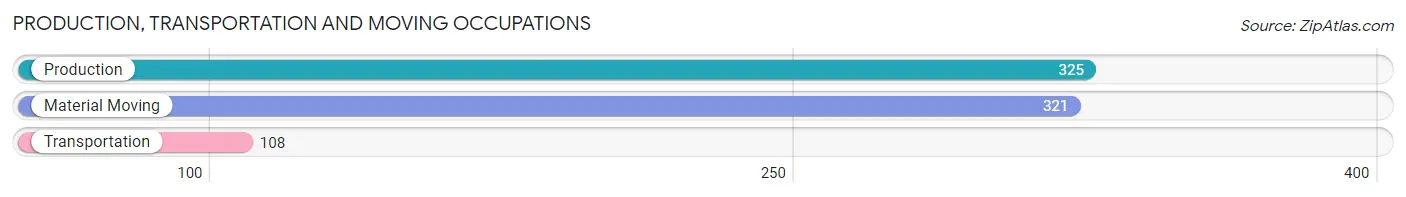
Production, Transportation and Moving Occupations
The most common Production, Transportation and Moving occupations in Jackson are Production (325 | 10.5%), Material Moving (321 | 10.4%), and Transportation (108 | 3.5%).
Production, Transportation and Moving Occupations by Sex
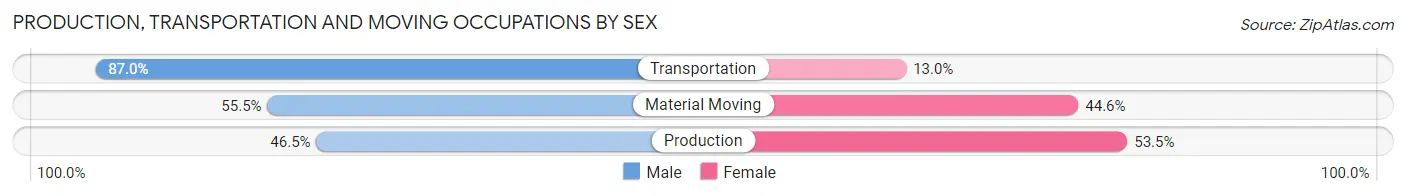
| Occupation | Male | Female |
| Production | 151 (46.5%) | 174 (53.5%) |
| Transportation | 94 (87.0%) | 14 (13.0%) |
| Material Moving | 178 (55.4%) | 143 (44.6%) |
| Total (Category) | 423 (56.1%) | 331 (43.9%) |
| Total (Overall) | 1,511 (49.0%) | 1,570 (51.0%) |
Employment Industries by Sex in Jackson
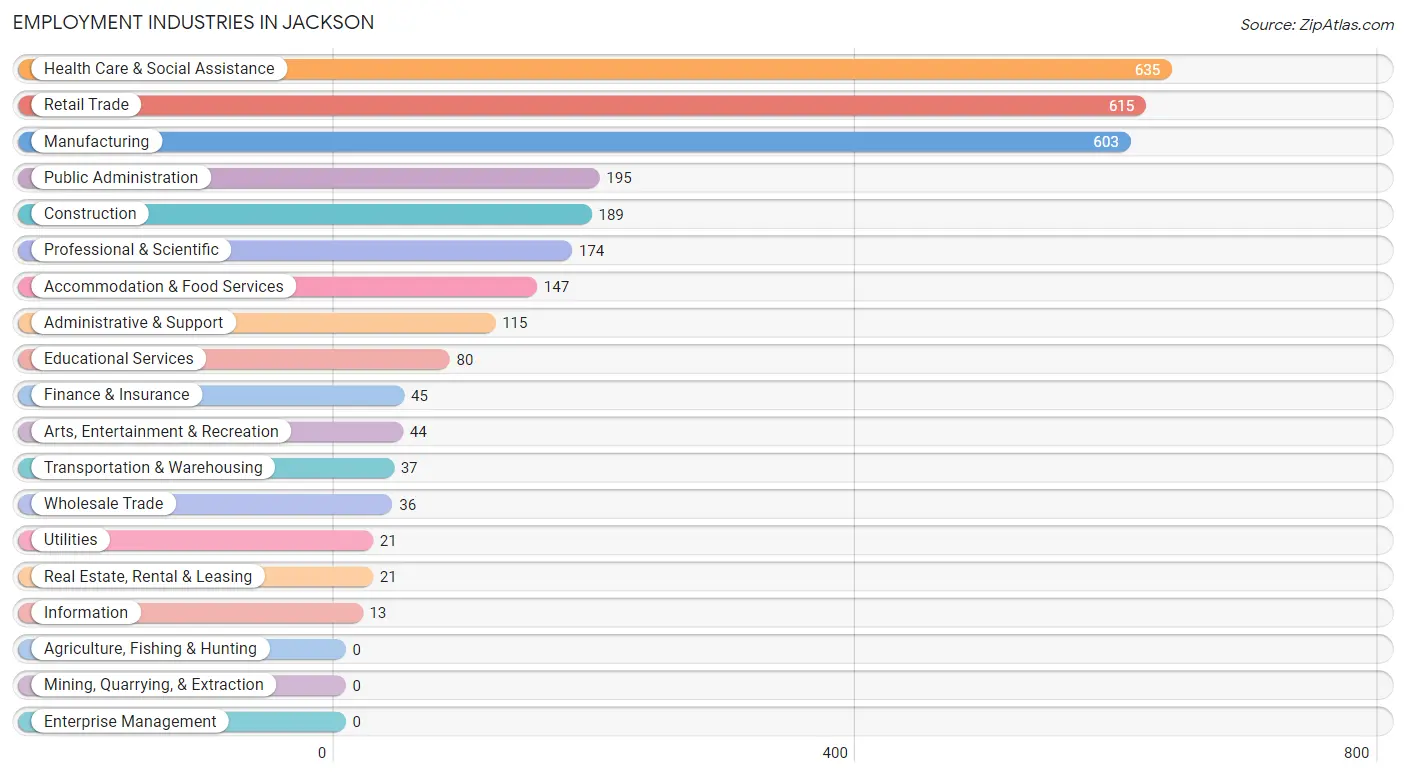
Employment Industries in Jackson
The major employment industries in Jackson include Health Care & Social Assistance (635 | 20.6%), Retail Trade (615 | 20.0%), Manufacturing (603 | 19.6%), Public Administration (195 | 6.3%), and Construction (189 | 6.1%).
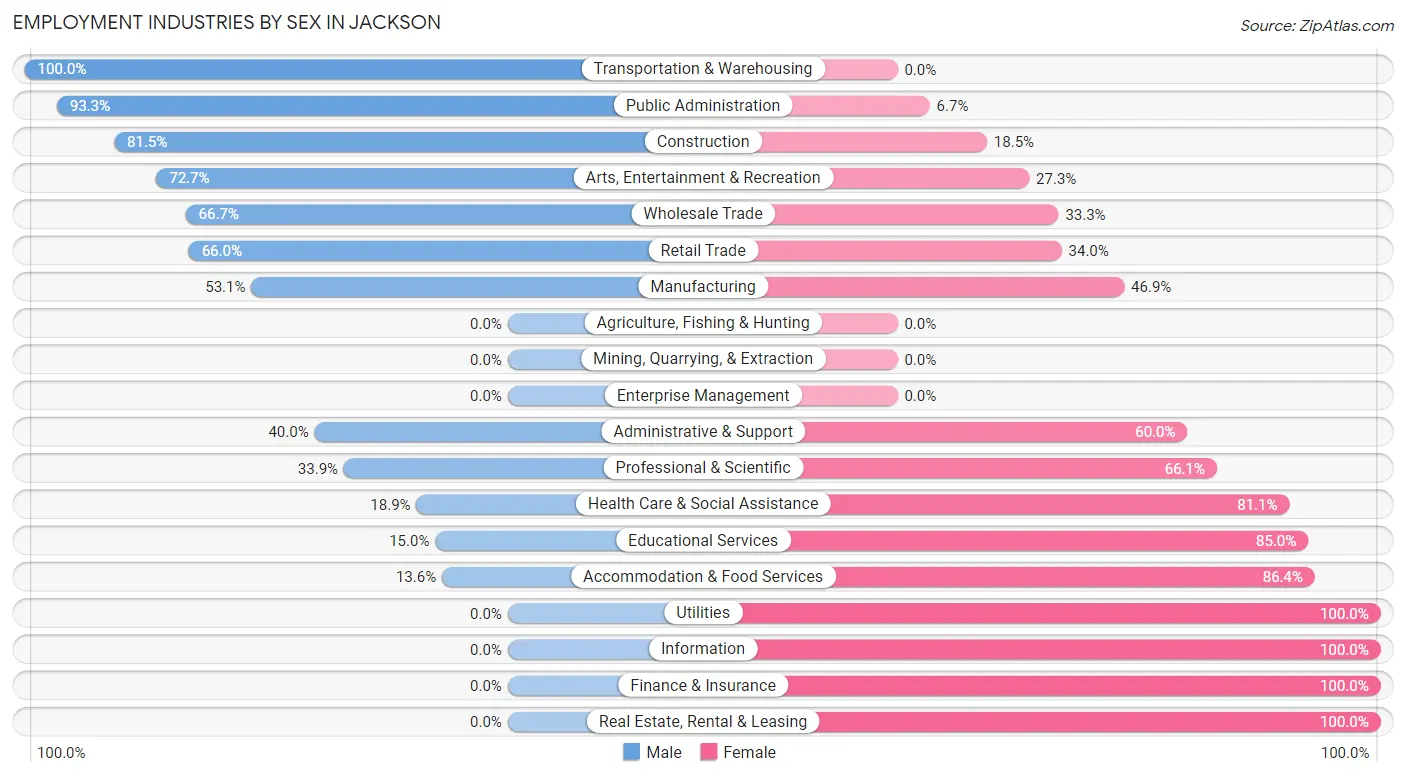
Employment Industries by Sex in Jackson
The Jackson industries that see more men than women are Transportation & Warehousing (100.0%), Public Administration (93.3%), and Construction (81.5%), whereas the industries that tend to have a higher number of women are Utilities (100.0%), Information (100.0%), and Finance & Insurance (100.0%).
| Industry | Male | Female |
| Agriculture, Fishing & Hunting | 0 (0.0%) | 0 (0.0%) |
| Mining, Quarrying, & Extraction | 0 (0.0%) | 0 (0.0%) |
| Construction | 154 (81.5%) | 35 (18.5%) |
| Manufacturing | 320 (53.1%) | 283 (46.9%) |
| Wholesale Trade | 24 (66.7%) | 12 (33.3%) |
| Retail Trade | 406 (66.0%) | 209 (34.0%) |
| Transportation & Warehousing | 37 (100.0%) | 0 (0.0%) |
| Utilities | 0 (0.0%) | 21 (100.0%) |
| Information | 0 (0.0%) | 13 (100.0%) |
| Finance & Insurance | 0 (0.0%) | 45 (100.0%) |
| Real Estate, Rental & Leasing | 0 (0.0%) | 21 (100.0%) |
| Professional & Scientific | 59 (33.9%) | 115 (66.1%) |
| Enterprise Management | 0 (0.0%) | 0 (0.0%) |
| Administrative & Support | 46 (40.0%) | 69 (60.0%) |
| Educational Services | 12 (15.0%) | 68 (85.0%) |
| Health Care & Social Assistance | 120 (18.9%) | 515 (81.1%) |
| Arts, Entertainment & Recreation | 32 (72.7%) | 12 (27.3%) |
| Accommodation & Food Services | 20 (13.6%) | 127 (86.4%) |
| Public Administration | 182 (93.3%) | 13 (6.7%) |
| Total | 1,511 (49.0%) | 1,570 (51.0%) |
Education in Jackson
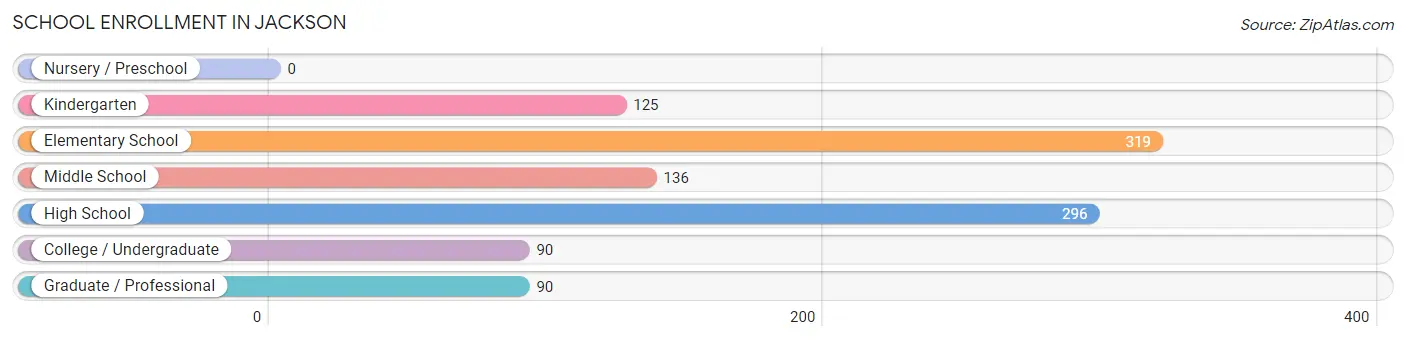
School Enrollment in Jackson
The most common levels of schooling among the 1,056 students in Jackson are elementary school (319 | 30.2%), high school (296 | 28.0%), and middle school (136 | 12.9%).
| School Level | # Students | % Students |
| Nursery / Preschool | 0 | 0.0% |
| Kindergarten | 125 | 11.8% |
| Elementary School | 319 | 30.2% |
| Middle School | 136 | 12.9% |
| High School | 296 | 28.0% |
| College / Undergraduate | 90 | 8.5% |
| Graduate / Professional | 90 | 8.5% |
| Total | 1,056 | 100.0% |
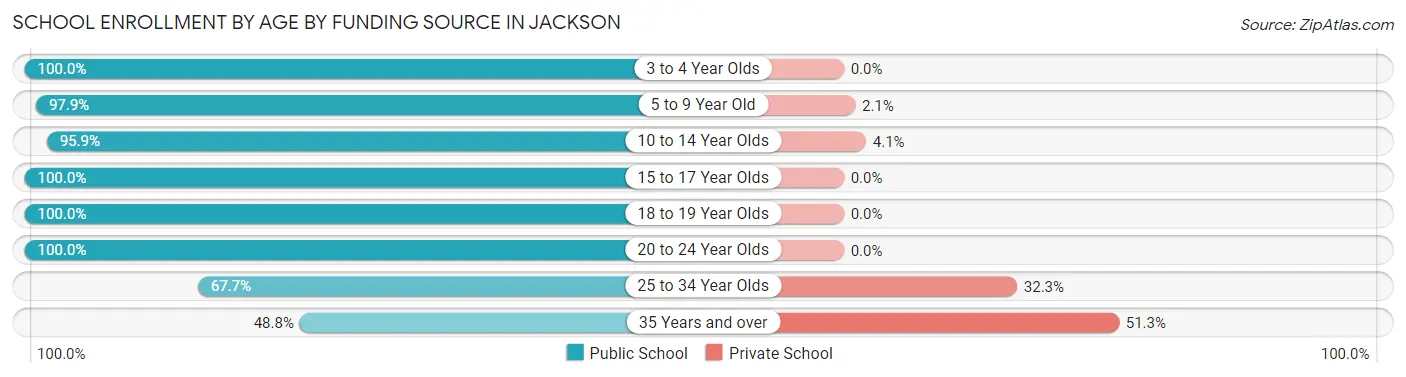
School Enrollment by Age by Funding Source in Jackson
Out of a total of 1,056 students who are enrolled in schools in Jackson, 78 (7.4%) attend a private institution, while the remaining 978 (92.6%) are enrolled in public schools. The age group of 35 years and over has the highest likelihood of being enrolled in private schools, with 41 (51.2% in the age bracket) enrolled. Conversely, the age group of 3 to 4 year olds has the lowest likelihood of being enrolled in a private school, with 14 (100.0% in the age bracket) attending a public institution.
| Age Bracket | Public School | Private School |
| 3 to 4 Year Olds | 14 (100.0%) | 0 (0.0%) |
| 5 to 9 Year Old | 370 (97.9%) | 8 (2.1%) |
| 10 to 14 Year Olds | 209 (95.9%) | 9 (4.1%) |
| 15 to 17 Year Olds | 212 (100.0%) | 0 (0.0%) |
| 18 to 19 Year Olds | 54 (100.0%) | 0 (0.0%) |
| 20 to 24 Year Olds | 38 (100.0%) | 0 (0.0%) |
| 25 to 34 Year Olds | 42 (67.7%) | 20 (32.3%) |
| 35 Years and over | 39 (48.7%) | 41 (51.2%) |
| Total | 978 (92.6%) | 78 (7.4%) |
Educational Attainment by Field of Study in Jackson
Science & technology (189 | 26.0%), education (144 | 19.8%), arts & humanities (104 | 14.3%), business (87 | 12.0%), and psychology (53 | 7.3%) are the most common fields of study among 726 individuals in Jackson who have obtained a bachelor's degree or higher.
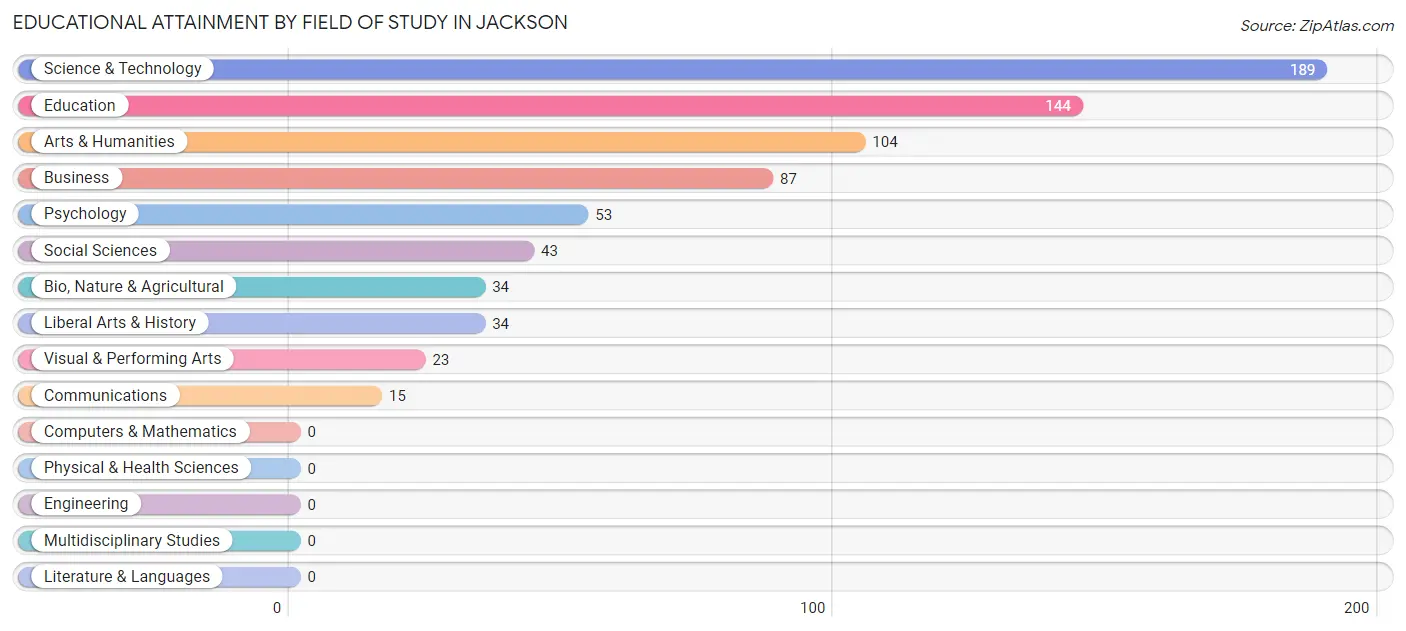
| Field of Study | # Graduates | % Graduates |
| Computers & Mathematics | 0 | 0.0% |
| Bio, Nature & Agricultural | 34 | 4.7% |
| Physical & Health Sciences | 0 | 0.0% |
| Psychology | 53 | 7.3% |
| Social Sciences | 43 | 5.9% |
| Engineering | 0 | 0.0% |
| Multidisciplinary Studies | 0 | 0.0% |
| Science & Technology | 189 | 26.0% |
| Business | 87 | 12.0% |
| Education | 144 | 19.8% |
| Literature & Languages | 0 | 0.0% |
| Liberal Arts & History | 34 | 4.7% |
| Visual & Performing Arts | 23 | 3.2% |
| Communications | 15 | 2.1% |
| Arts & Humanities | 104 | 14.3% |
| Total | 726 | 100.0% |
Transportation & Commute in Jackson
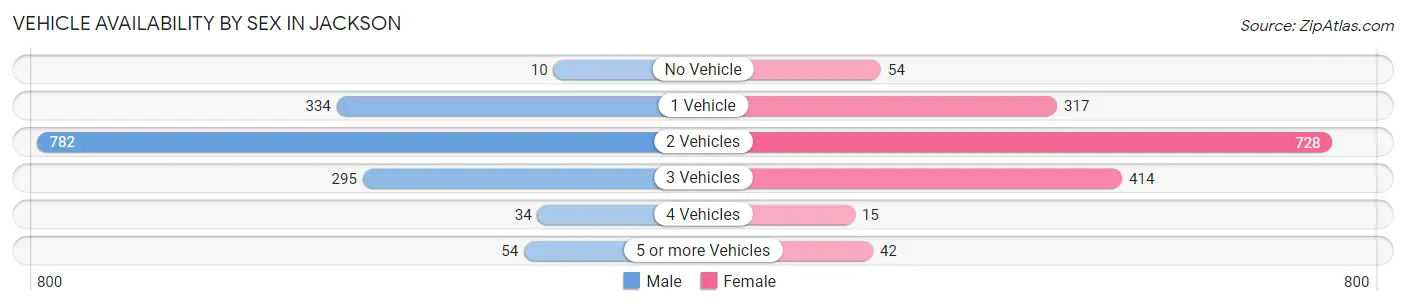
Vehicle Availability by Sex in Jackson
The most prevalent vehicle ownership categories in Jackson are males with 2 vehicles (782, accounting for 51.8%) and females with 2 vehicles (728, making up 49.8%).
| Vehicles Available | Male | Female |
| No Vehicle | 10 (0.7%) | 54 (3.4%) |
| 1 Vehicle | 334 (22.1%) | 317 (20.2%) |
| 2 Vehicles | 782 (51.8%) | 728 (46.4%) |
| 3 Vehicles | 295 (19.6%) | 414 (26.4%) |
| 4 Vehicles | 34 (2.2%) | 15 (1.0%) |
| 5 or more Vehicles | 54 (3.6%) | 42 (2.7%) |
| Total | 1,509 (100.0%) | 1,570 (100.0%) |
Commute Time in Jackson
The most frequently occuring commute durations in Jackson are 5 to 9 minutes (679 commuters, 23.0%), less than 5 minutes (531 commuters, 18.0%), and 10 to 14 minutes (345 commuters, 11.7%).
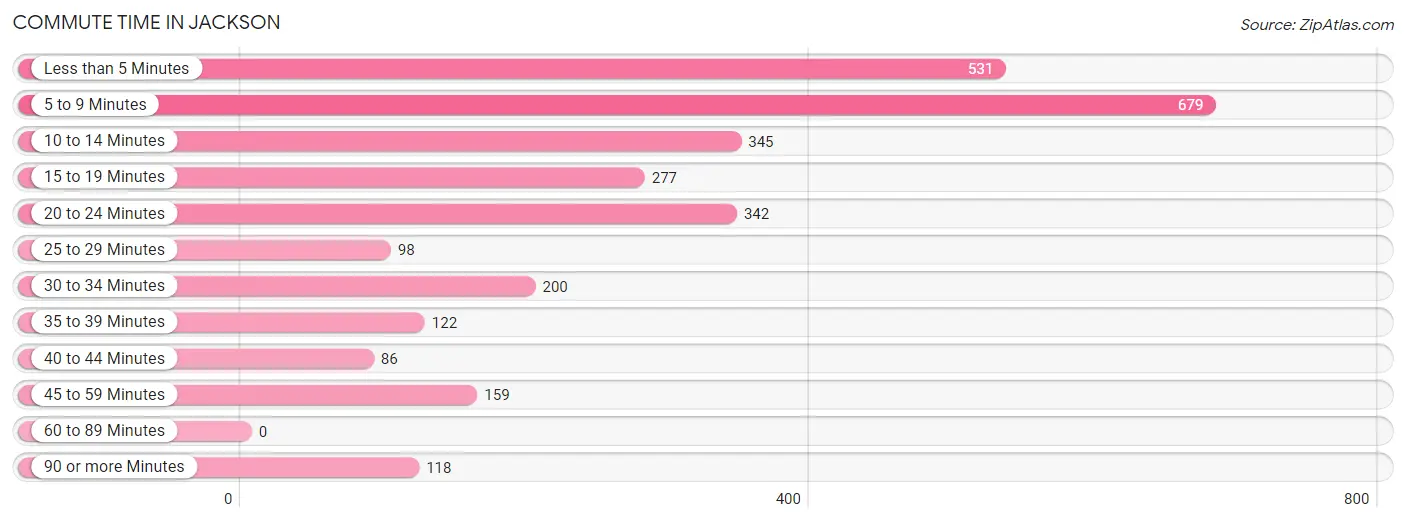
| Commute Time | # Commuters | % Commuters |
| Less than 5 Minutes | 531 | 18.0% |
| 5 to 9 Minutes | 679 | 23.0% |
| 10 to 14 Minutes | 345 | 11.7% |
| 15 to 19 Minutes | 277 | 9.4% |
| 20 to 24 Minutes | 342 | 11.6% |
| 25 to 29 Minutes | 98 | 3.3% |
| 30 to 34 Minutes | 200 | 6.8% |
| 35 to 39 Minutes | 122 | 4.1% |
| 40 to 44 Minutes | 86 | 2.9% |
| 45 to 59 Minutes | 159 | 5.4% |
| 60 to 89 Minutes | 0 | 0.0% |
| 90 or more Minutes | 118 | 4.0% |
Commute Time by Sex in Jackson
The most common commute times in Jackson are less than 5 minutes (325 commuters, 21.8%) for males and 5 to 9 minutes (391 commuters, 26.7%) for females.
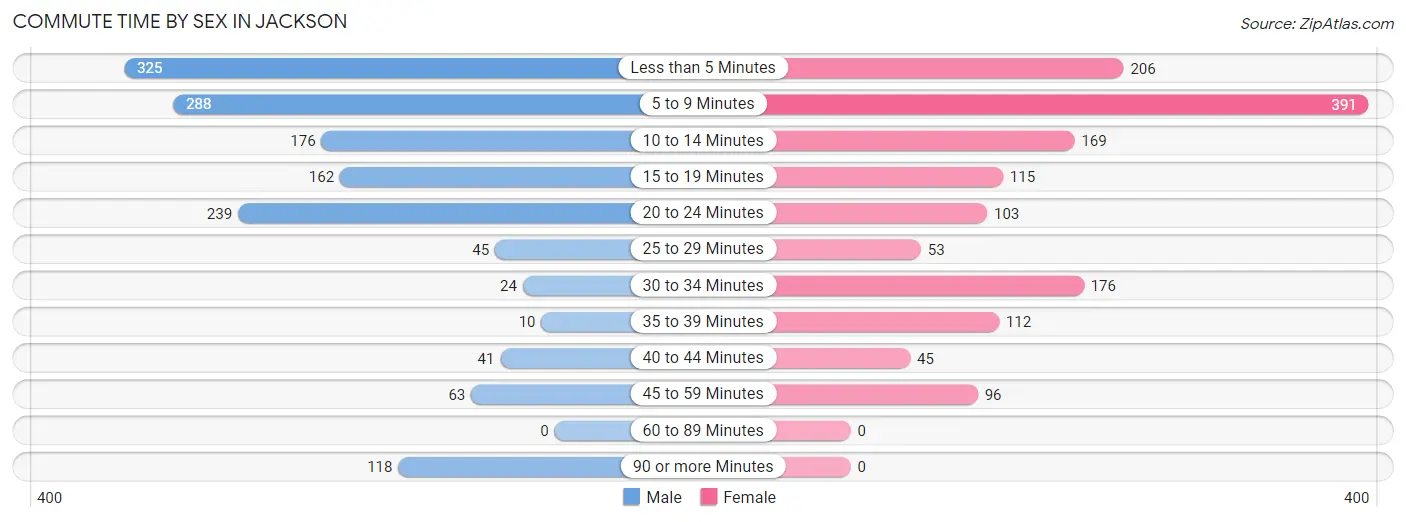
| Commute Time | Male | Female |
| Less than 5 Minutes | 325 (21.8%) | 206 (14.1%) |
| 5 to 9 Minutes | 288 (19.3%) | 391 (26.7%) |
| 10 to 14 Minutes | 176 (11.8%) | 169 (11.5%) |
| 15 to 19 Minutes | 162 (10.9%) | 115 (7.8%) |
| 20 to 24 Minutes | 239 (16.0%) | 103 (7.0%) |
| 25 to 29 Minutes | 45 (3.0%) | 53 (3.6%) |
| 30 to 34 Minutes | 24 (1.6%) | 176 (12.0%) |
| 35 to 39 Minutes | 10 (0.7%) | 112 (7.6%) |
| 40 to 44 Minutes | 41 (2.8%) | 45 (3.1%) |
| 45 to 59 Minutes | 63 (4.2%) | 96 (6.6%) |
| 60 to 89 Minutes | 0 (0.0%) | 0 (0.0%) |
| 90 or more Minutes | 118 (7.9%) | 0 (0.0%) |
Time of Departure to Work by Sex in Jackson
The most frequent times of departure to work in Jackson are 7:30 AM to 7:59 AM (272, 18.2%) for males and 7:30 AM to 7:59 AM (296, 20.2%) for females.
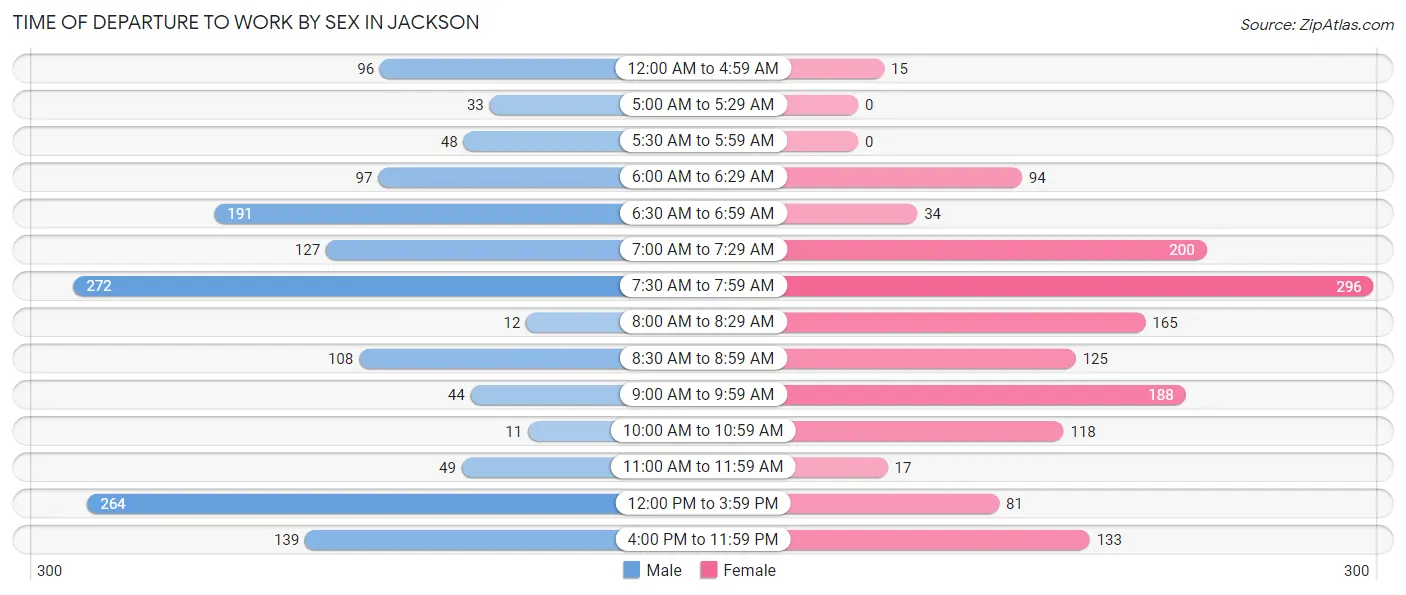
| Time of Departure | Male | Female |
| 12:00 AM to 4:59 AM | 96 (6.4%) | 15 (1.0%) |
| 5:00 AM to 5:29 AM | 33 (2.2%) | 0 (0.0%) |
| 5:30 AM to 5:59 AM | 48 (3.2%) | 0 (0.0%) |
| 6:00 AM to 6:29 AM | 97 (6.5%) | 94 (6.4%) |
| 6:30 AM to 6:59 AM | 191 (12.8%) | 34 (2.3%) |
| 7:00 AM to 7:29 AM | 127 (8.5%) | 200 (13.6%) |
| 7:30 AM to 7:59 AM | 272 (18.2%) | 296 (20.2%) |
| 8:00 AM to 8:29 AM | 12 (0.8%) | 165 (11.3%) |
| 8:30 AM to 8:59 AM | 108 (7.2%) | 125 (8.5%) |
| 9:00 AM to 9:59 AM | 44 (2.9%) | 188 (12.8%) |
| 10:00 AM to 10:59 AM | 11 (0.7%) | 118 (8.1%) |
| 11:00 AM to 11:59 AM | 49 (3.3%) | 17 (1.2%) |
| 12:00 PM to 3:59 PM | 264 (17.7%) | 81 (5.5%) |
| 4:00 PM to 11:59 PM | 139 (9.3%) | 133 (9.1%) |
| Total | 1,491 (100.0%) | 1,466 (100.0%) |
Housing Occupancy in Jackson
Occupancy by Ownership in Jackson
Of the total 2,589 dwellings in Jackson, owner-occupied units account for 1,378 (53.2%), while renter-occupied units make up 1,211 (46.8%).
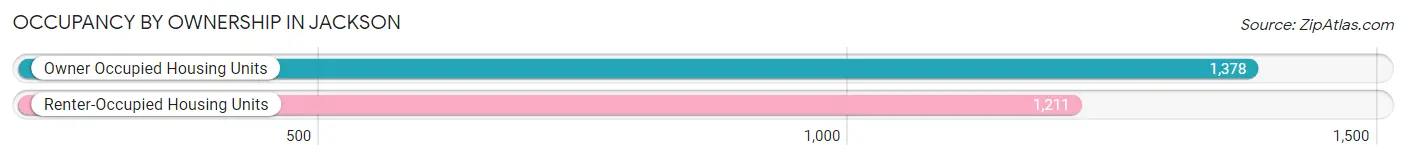
| Occupancy | # Housing Units | % Housing Units |
| Owner Occupied Housing Units | 1,378 | 53.2% |
| Renter-Occupied Housing Units | 1,211 | 46.8% |
| Total Occupied Housing Units | 2,589 | 100.0% |
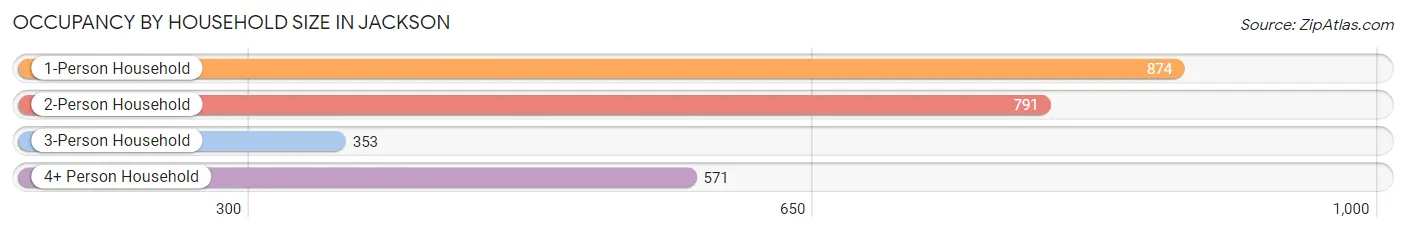
Occupancy by Household Size in Jackson
| Household Size | # Housing Units | % Housing Units |
| 1-Person Household | 874 | 33.8% |
| 2-Person Household | 791 | 30.5% |
| 3-Person Household | 353 | 13.6% |
| 4+ Person Household | 571 | 22.1% |
| Total Housing Units | 2,589 | 100.0% |
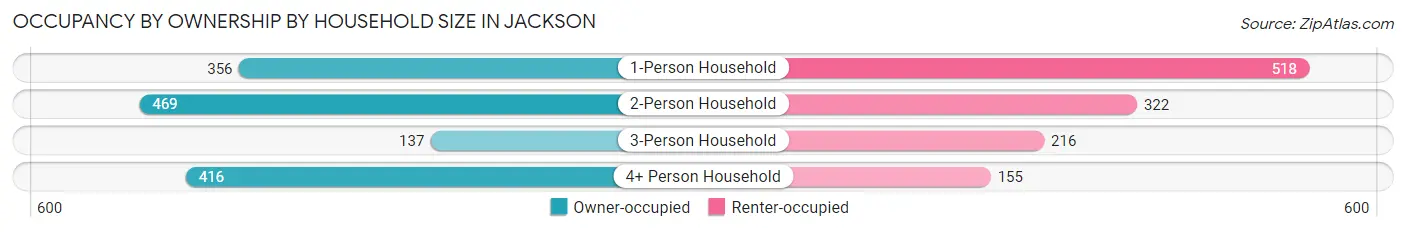
Occupancy by Ownership by Household Size in Jackson
| Household Size | Owner-occupied | Renter-occupied |
| 1-Person Household | 356 (40.7%) | 518 (59.3%) |
| 2-Person Household | 469 (59.3%) | 322 (40.7%) |
| 3-Person Household | 137 (38.8%) | 216 (61.2%) |
| 4+ Person Household | 416 (72.9%) | 155 (27.2%) |
| Total Housing Units | 1,378 (53.2%) | 1,211 (46.8%) |
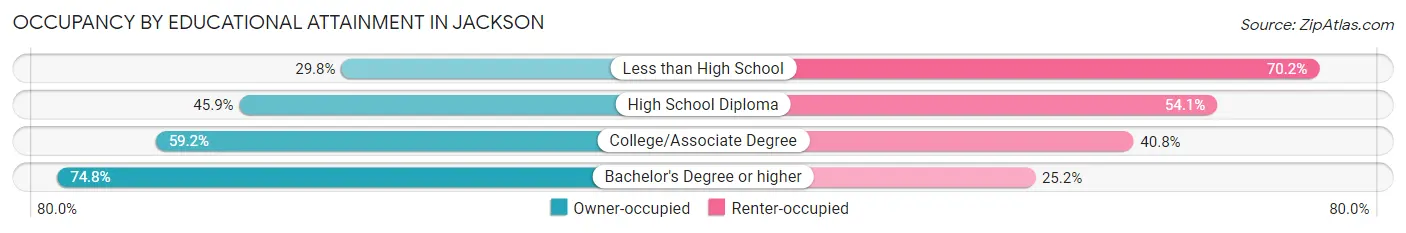
Occupancy by Educational Attainment in Jackson
| Household Size | Owner-occupied | Renter-occupied |
| Less than High School | 39 (29.8%) | 92 (70.2%) |
| High School Diploma | 621 (45.9%) | 731 (54.1%) |
| College/Associate Degree | 415 (59.2%) | 286 (40.8%) |
| Bachelor's Degree or higher | 303 (74.8%) | 102 (25.2%) |
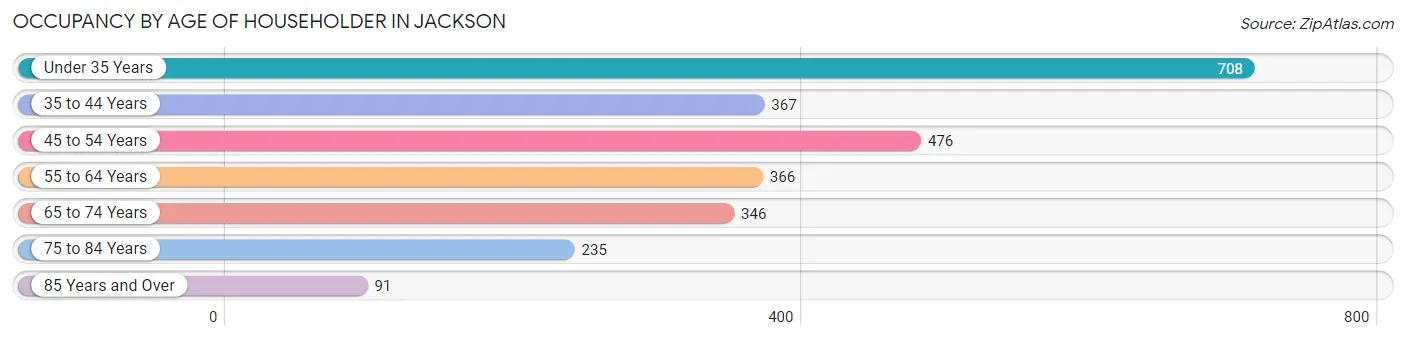
Occupancy by Age of Householder in Jackson
| Age Bracket | # Households | % Households |
| Under 35 Years | 708 | 27.4% |
| 35 to 44 Years | 367 | 14.2% |
| 45 to 54 Years | 476 | 18.4% |
| 55 to 64 Years | 366 | 14.1% |
| 65 to 74 Years | 346 | 13.4% |
| 75 to 84 Years | 235 | 9.1% |
| 85 Years and Over | 91 | 3.5% |
| Total | 2,589 | 100.0% |
Housing Finances in Jackson
Median Income by Occupancy in Jackson
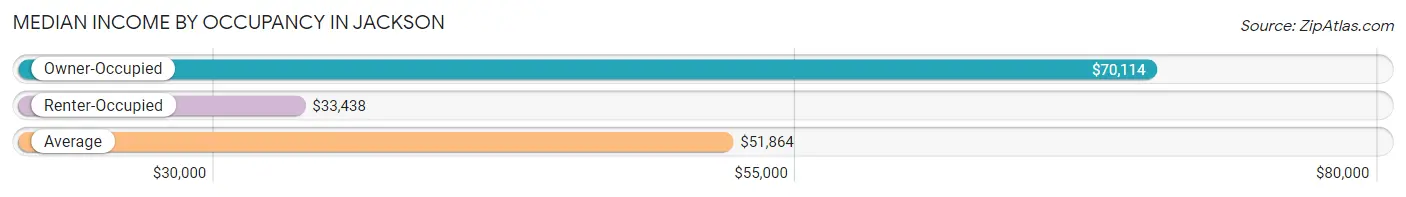
| Occupancy Type | # Households | Median Income |
| Owner-Occupied | 1,378 (53.2%) | $70,114 |
| Renter-Occupied | 1,211 (46.8%) | $33,438 |
| Average | 2,589 (100.0%) | $51,864 |
Occupancy by Householder Income Bracket in Jackson
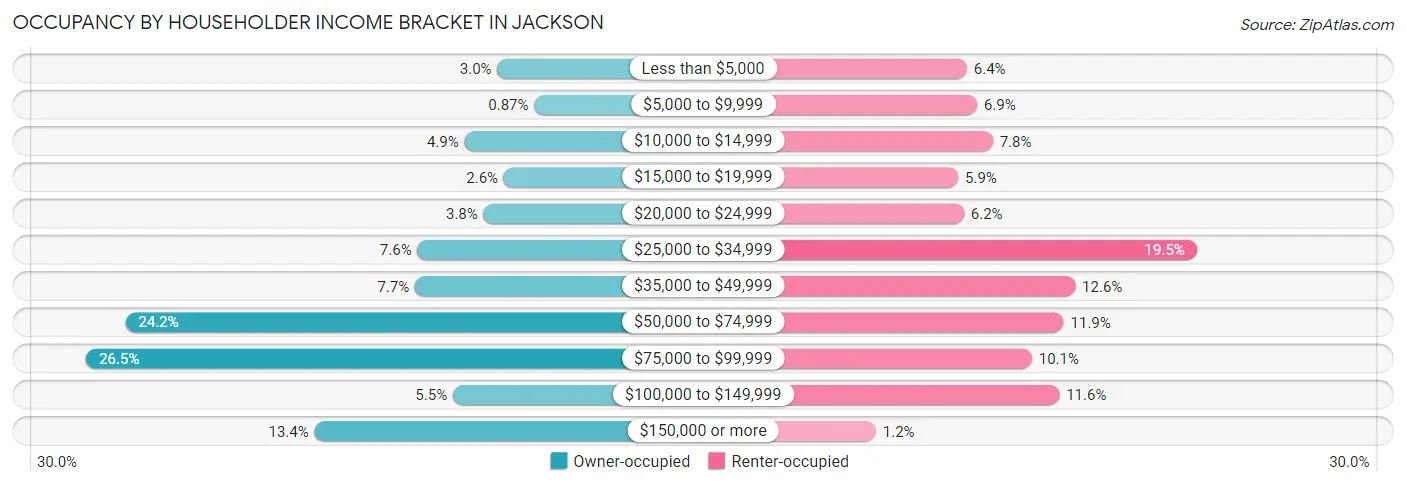
| Income Bracket | Owner-occupied | Renter-occupied |
| Less than $5,000 | 41 (3.0%) | 77 (6.4%) |
| $5,000 to $9,999 | 12 (0.9%) | 84 (6.9%) |
| $10,000 to $14,999 | 67 (4.9%) | 95 (7.8%) |
| $15,000 to $19,999 | 36 (2.6%) | 71 (5.9%) |
| $20,000 to $24,999 | 52 (3.8%) | 75 (6.2%) |
| $25,000 to $34,999 | 104 (7.5%) | 236 (19.5%) |
| $35,000 to $49,999 | 106 (7.7%) | 152 (12.6%) |
| $50,000 to $74,999 | 334 (24.2%) | 144 (11.9%) |
| $75,000 to $99,999 | 365 (26.5%) | 122 (10.1%) |
| $100,000 to $149,999 | 76 (5.5%) | 141 (11.6%) |
| $150,000 or more | 185 (13.4%) | 14 (1.2%) |
| Total | 1,378 (100.0%) | 1,211 (100.0%) |
Monthly Housing Cost Tiers in Jackson
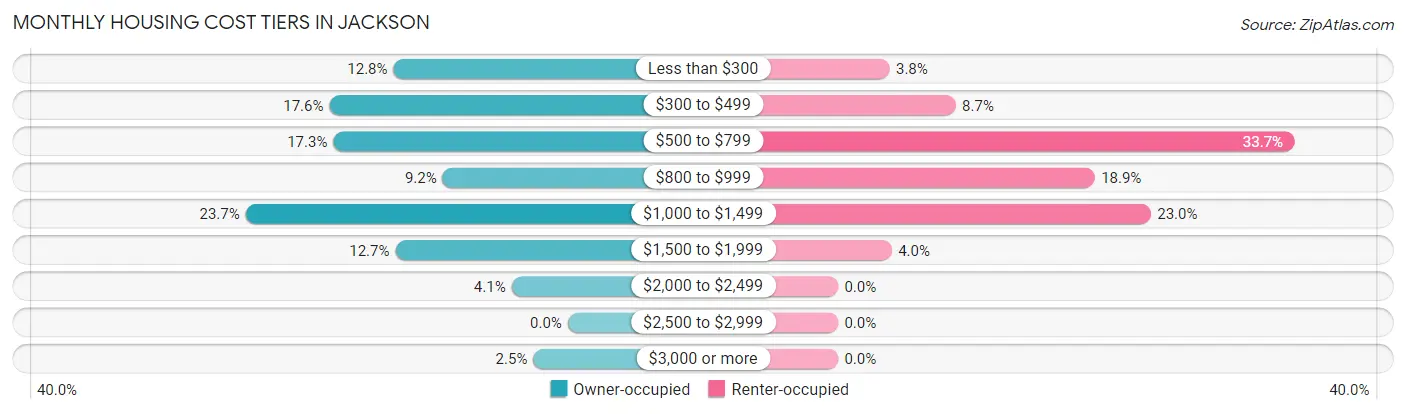
| Monthly Cost | Owner-occupied | Renter-occupied |
| Less than $300 | 177 (12.8%) | 46 (3.8%) |
| $300 to $499 | 242 (17.6%) | 105 (8.7%) |
| $500 to $799 | 238 (17.3%) | 408 (33.7%) |
| $800 to $999 | 127 (9.2%) | 229 (18.9%) |
| $1,000 to $1,499 | 327 (23.7%) | 279 (23.0%) |
| $1,500 to $1,999 | 175 (12.7%) | 48 (4.0%) |
| $2,000 to $2,499 | 57 (4.1%) | 0 (0.0%) |
| $2,500 to $2,999 | 0 (0.0%) | 0 (0.0%) |
| $3,000 or more | 35 (2.5%) | 0 (0.0%) |
| Total | 1,378 (100.0%) | 1,211 (100.0%) |
Physical Housing Characteristics in Jackson
Housing Structures in Jackson
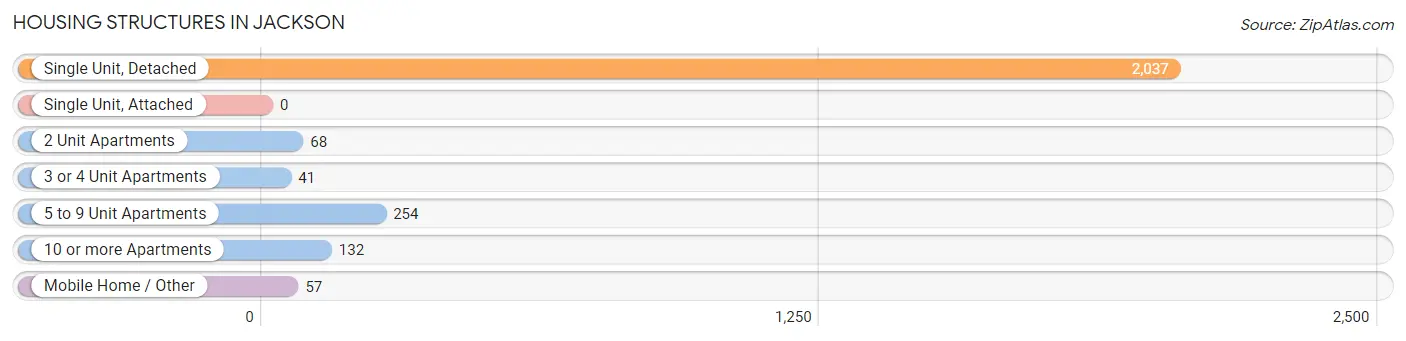
| Structure Type | # Housing Units | % Housing Units |
| Single Unit, Detached | 2,037 | 78.7% |
| Single Unit, Attached | 0 | 0.0% |
| 2 Unit Apartments | 68 | 2.6% |
| 3 or 4 Unit Apartments | 41 | 1.6% |
| 5 to 9 Unit Apartments | 254 | 9.8% |
| 10 or more Apartments | 132 | 5.1% |
| Mobile Home / Other | 57 | 2.2% |
| Total | 2,589 | 100.0% |
Housing Structures by Occupancy in Jackson
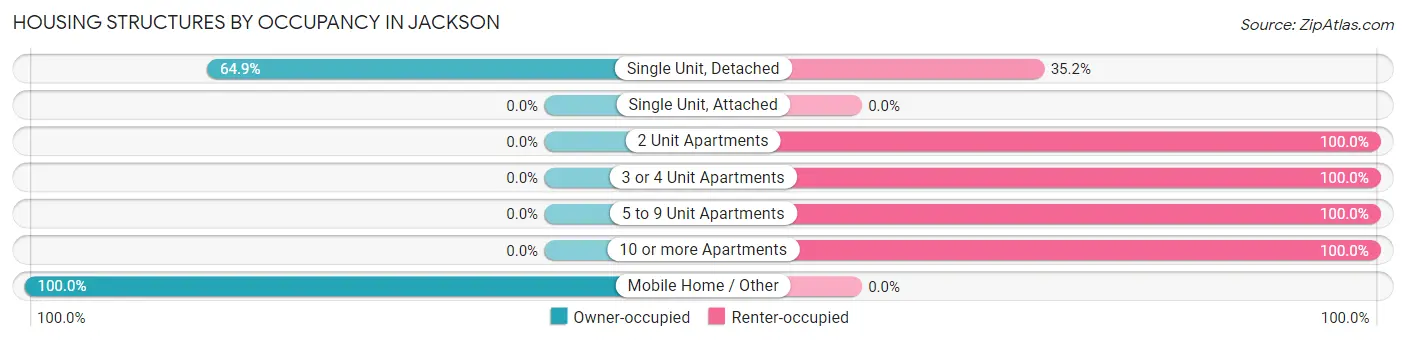
| Structure Type | Owner-occupied | Renter-occupied |
| Single Unit, Detached | 1,321 (64.8%) | 716 (35.1%) |
| Single Unit, Attached | 0 (0.0%) | 0 (0.0%) |
| 2 Unit Apartments | 0 (0.0%) | 68 (100.0%) |
| 3 or 4 Unit Apartments | 0 (0.0%) | 41 (100.0%) |
| 5 to 9 Unit Apartments | 0 (0.0%) | 254 (100.0%) |
| 10 or more Apartments | 0 (0.0%) | 132 (100.0%) |
| Mobile Home / Other | 57 (100.0%) | 0 (0.0%) |
| Total | 1,378 (53.2%) | 1,211 (46.8%) |
Housing Structures by Number of Rooms in Jackson
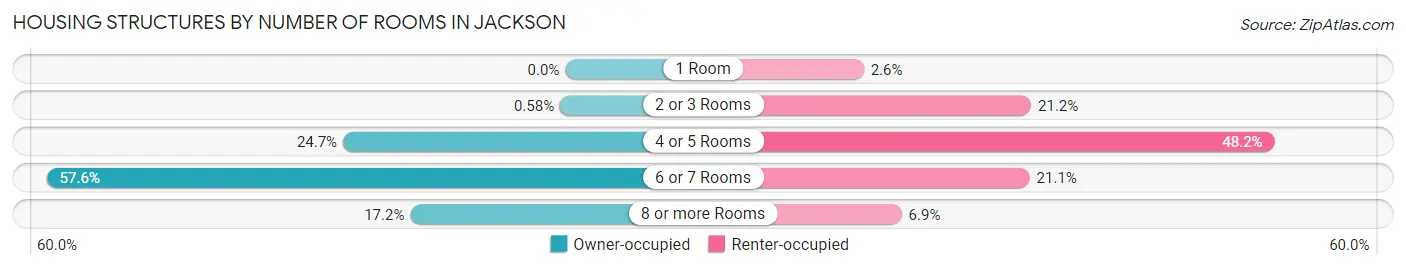
| Number of Rooms | Owner-occupied | Renter-occupied |
| 1 Room | 0 (0.0%) | 32 (2.6%) |
| 2 or 3 Rooms | 8 (0.6%) | 257 (21.2%) |
| 4 or 5 Rooms | 340 (24.7%) | 584 (48.2%) |
| 6 or 7 Rooms | 793 (57.6%) | 255 (21.1%) |
| 8 or more Rooms | 237 (17.2%) | 83 (6.9%) |
| Total | 1,378 (100.0%) | 1,211 (100.0%) |
Housing Structure by Heating Type in Jackson
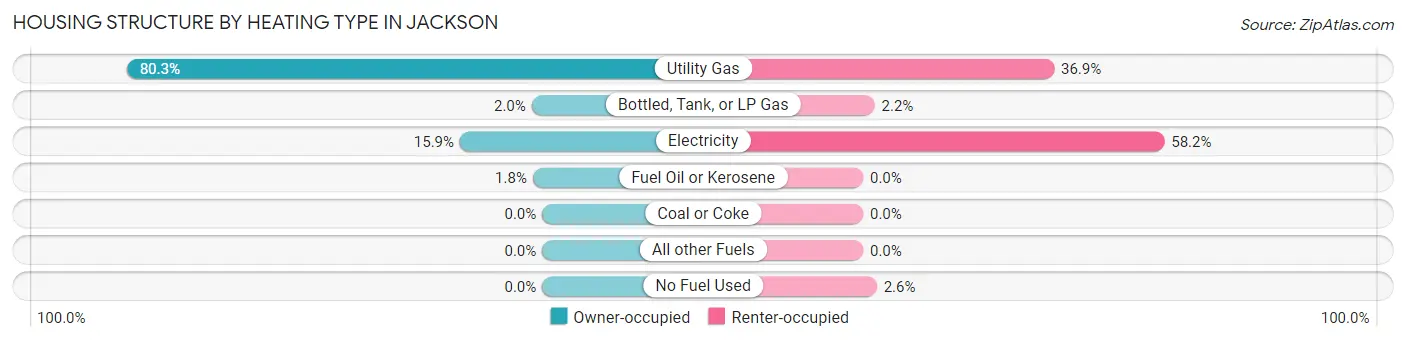
| Heating Type | Owner-occupied | Renter-occupied |
| Utility Gas | 1,106 (80.3%) | 447 (36.9%) |
| Bottled, Tank, or LP Gas | 28 (2.0%) | 27 (2.2%) |
| Electricity | 219 (15.9%) | 705 (58.2%) |
| Fuel Oil or Kerosene | 25 (1.8%) | 0 (0.0%) |
| Coal or Coke | 0 (0.0%) | 0 (0.0%) |
| All other Fuels | 0 (0.0%) | 0 (0.0%) |
| No Fuel Used | 0 (0.0%) | 32 (2.6%) |
| Total | 1,378 (100.0%) | 1,211 (100.0%) |
Household Vehicle Usage in Jackson
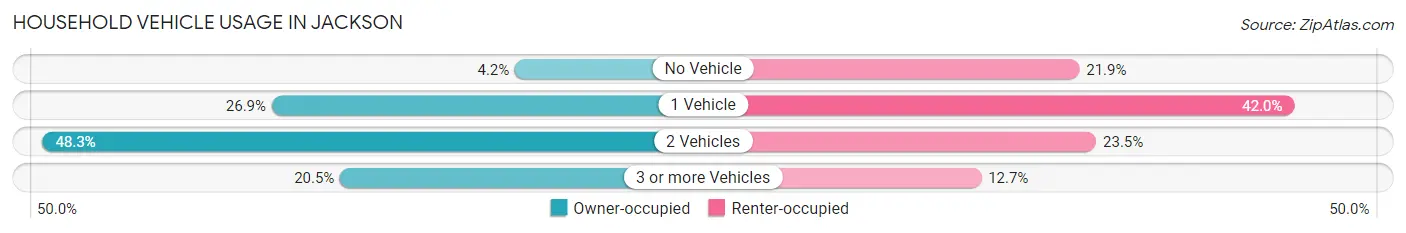
| Vehicles per Household | Owner-occupied | Renter-occupied |
| No Vehicle | 58 (4.2%) | 265 (21.9%) |
| 1 Vehicle | 371 (26.9%) | 508 (41.9%) |
| 2 Vehicles | 666 (48.3%) | 284 (23.4%) |
| 3 or more Vehicles | 283 (20.5%) | 154 (12.7%) |
| Total | 1,378 (100.0%) | 1,211 (100.0%) |
Real Estate & Mortgages in Jackson
Real Estate and Mortgage Overview in Jackson
| Characteristic | Without Mortgage | With Mortgage |
| Housing Units | 605 | 773 |
| Median Property Value | $98,500 | $142,100 |
| Median Household Income | $56,417 | $172 |
| Monthly Housing Costs | $425 | $35 |
| Real Estate Taxes | $1,016 | $36 |
Property Value by Mortgage Status in Jackson
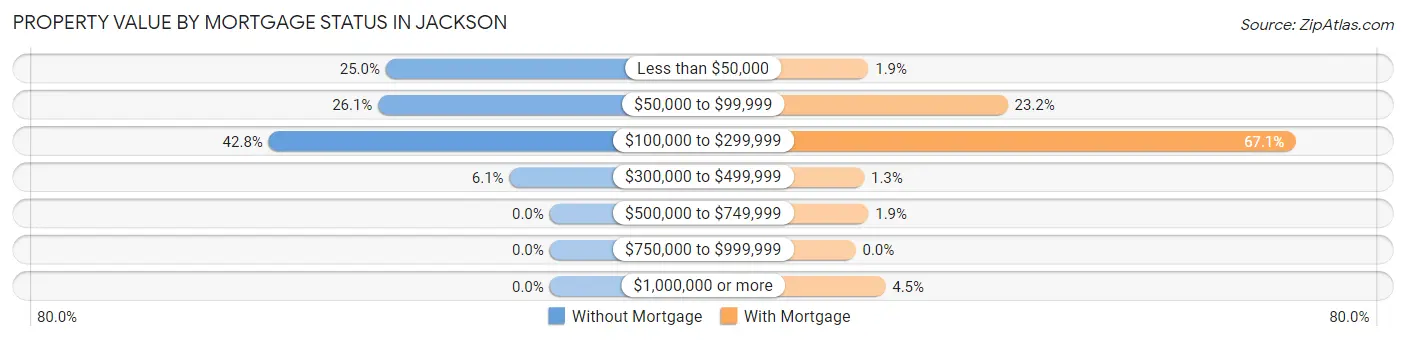
| Property Value | Without Mortgage | With Mortgage |
| Less than $50,000 | 151 (25.0%) | 15 (1.9%) |
| $50,000 to $99,999 | 158 (26.1%) | 179 (23.2%) |
| $100,000 to $299,999 | 259 (42.8%) | 519 (67.1%) |
| $300,000 to $499,999 | 37 (6.1%) | 10 (1.3%) |
| $500,000 to $749,999 | 0 (0.0%) | 15 (1.9%) |
| $750,000 to $999,999 | 0 (0.0%) | 0 (0.0%) |
| $1,000,000 or more | 0 (0.0%) | 35 (4.5%) |
| Total | 605 (100.0%) | 773 (100.0%) |
Household Income by Mortgage Status in Jackson
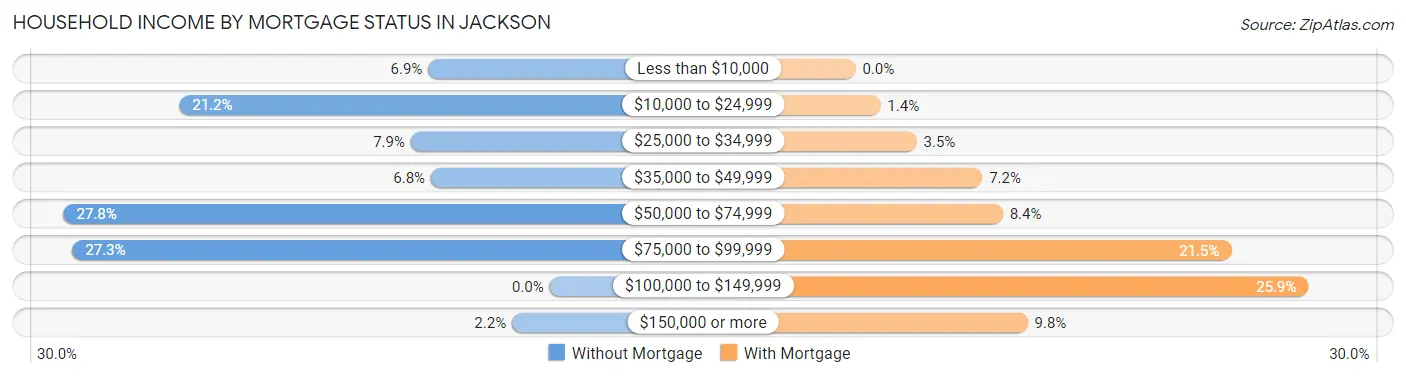
| Household Income | Without Mortgage | With Mortgage |
| Less than $10,000 | 42 (6.9%) | 0 (0.0%) |
| $10,000 to $24,999 | 128 (21.2%) | 11 (1.4%) |
| $25,000 to $34,999 | 48 (7.9%) | 27 (3.5%) |
| $35,000 to $49,999 | 41 (6.8%) | 56 (7.2%) |
| $50,000 to $74,999 | 168 (27.8%) | 65 (8.4%) |
| $75,000 to $99,999 | 165 (27.3%) | 166 (21.5%) |
| $100,000 to $149,999 | 0 (0.0%) | 200 (25.9%) |
| $150,000 or more | 13 (2.1%) | 76 (9.8%) |
| Total | 605 (100.0%) | 773 (100.0%) |
Property Value to Household Income Ratio in Jackson
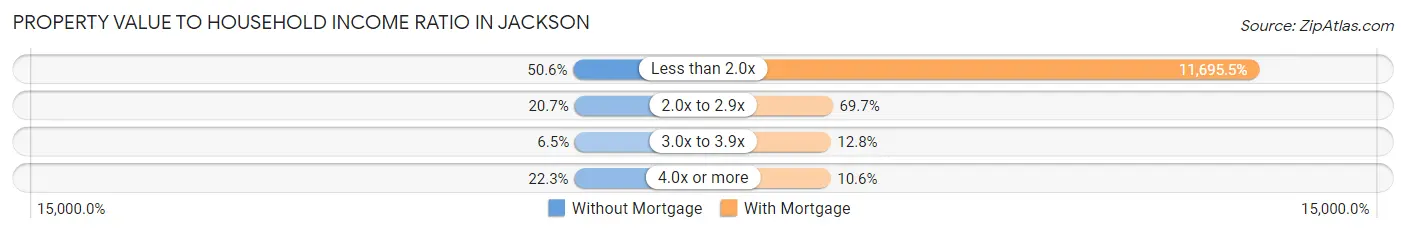
| Value-to-Income Ratio | Without Mortgage | With Mortgage |
| Less than 2.0x | 306 (50.6%) | 90,406 (11,695.5%) |
| 2.0x to 2.9x | 125 (20.7%) | 539 (69.7%) |
| 3.0x to 3.9x | 39 (6.5%) | 99 (12.8%) |
| 4.0x or more | 135 (22.3%) | 82 (10.6%) |
| Total | 605 (100.0%) | 773 (100.0%) |
Real Estate Taxes by Mortgage Status in Jackson
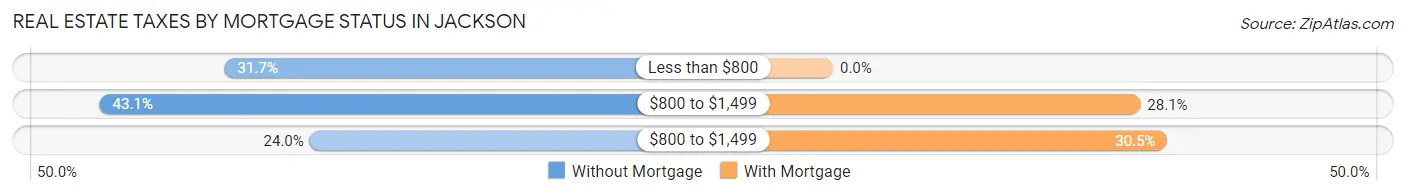
| Property Taxes | Without Mortgage | With Mortgage |
| Less than $800 | 192 (31.7%) | 0 (0.0%) |
| $800 to $1,499 | 261 (43.1%) | 217 (28.1%) |
| $800 to $1,499 | 145 (24.0%) | 236 (30.5%) |
| Total | 605 (100.0%) | 773 (100.0%) |
Health & Disability in Jackson
Health Insurance Coverage by Age in Jackson
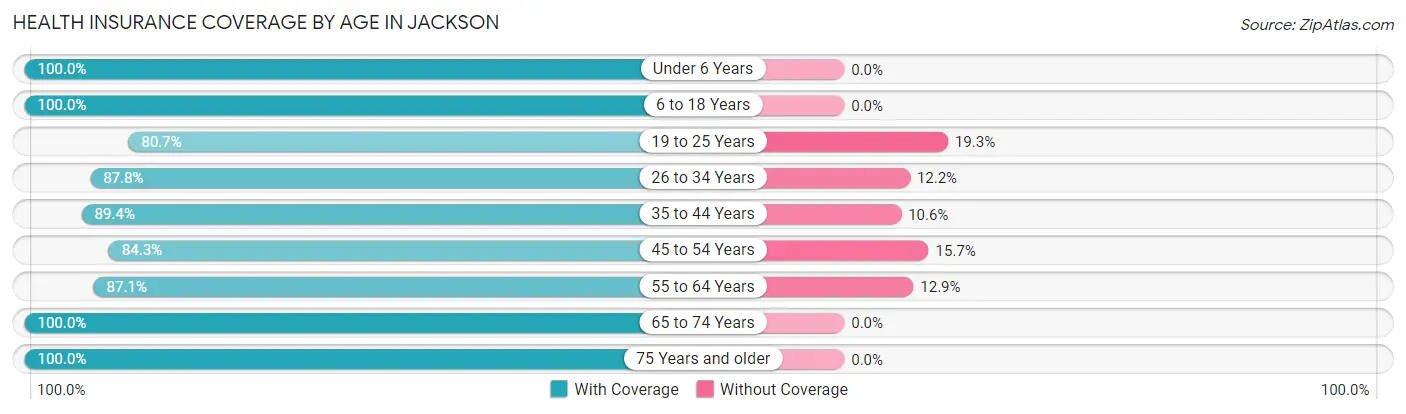
| Age Bracket | With Coverage | Without Coverage |
| Under 6 Years | 596 (100.0%) | 0 (0.0%) |
| 6 to 18 Years | 844 (100.0%) | 0 (0.0%) |
| 19 to 25 Years | 534 (80.7%) | 128 (19.3%) |
| 26 to 34 Years | 896 (87.8%) | 125 (12.2%) |
| 35 to 44 Years | 708 (89.4%) | 84 (10.6%) |
| 45 to 54 Years | 659 (84.3%) | 123 (15.7%) |
| 55 to 64 Years | 487 (87.1%) | 72 (12.9%) |
| 65 to 74 Years | 515 (100.0%) | 0 (0.0%) |
| 75 Years and older | 410 (100.0%) | 0 (0.0%) |
| Total | 5,649 (91.4%) | 532 (8.6%) |
Health Insurance Coverage by Citizenship Status in Jackson
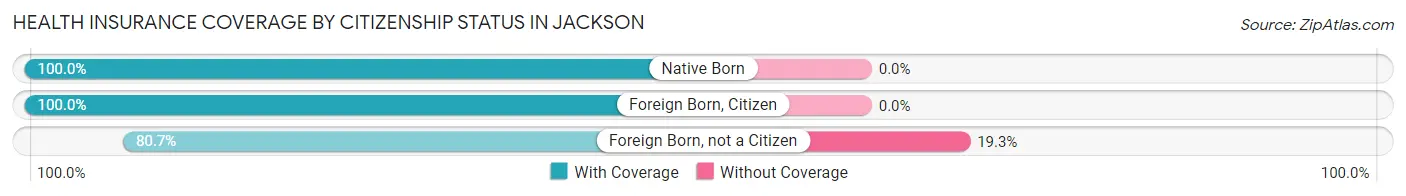
| Citizenship Status | With Coverage | Without Coverage |
| Native Born | 596 (100.0%) | 0 (0.0%) |
| Foreign Born, Citizen | 844 (100.0%) | 0 (0.0%) |
| Foreign Born, not a Citizen | 534 (80.7%) | 128 (19.3%) |
Health Insurance Coverage by Household Income in Jackson
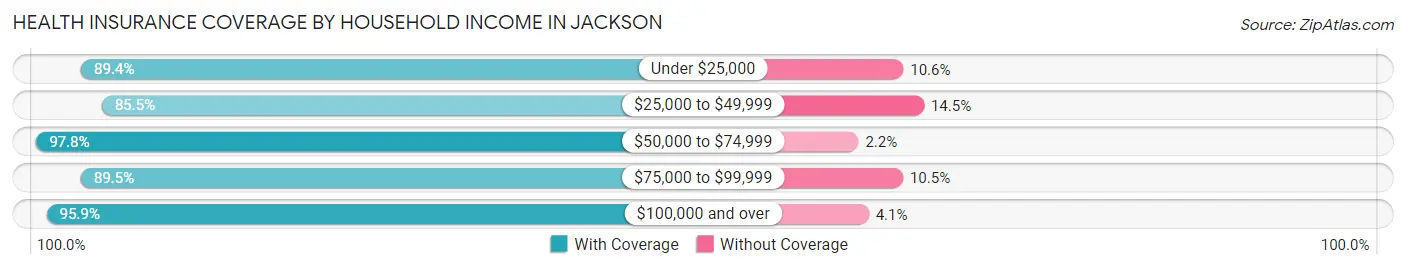
| Household Income | With Coverage | Without Coverage |
| Under $25,000 | 921 (89.4%) | 109 (10.6%) |
| $25,000 to $49,999 | 1,100 (85.5%) | 186 (14.5%) |
| $50,000 to $74,999 | 1,025 (97.8%) | 23 (2.2%) |
| $75,000 to $99,999 | 1,377 (89.5%) | 162 (10.5%) |
| $100,000 and over | 1,213 (95.9%) | 52 (4.1%) |
Public vs Private Health Insurance Coverage by Age in Jackson
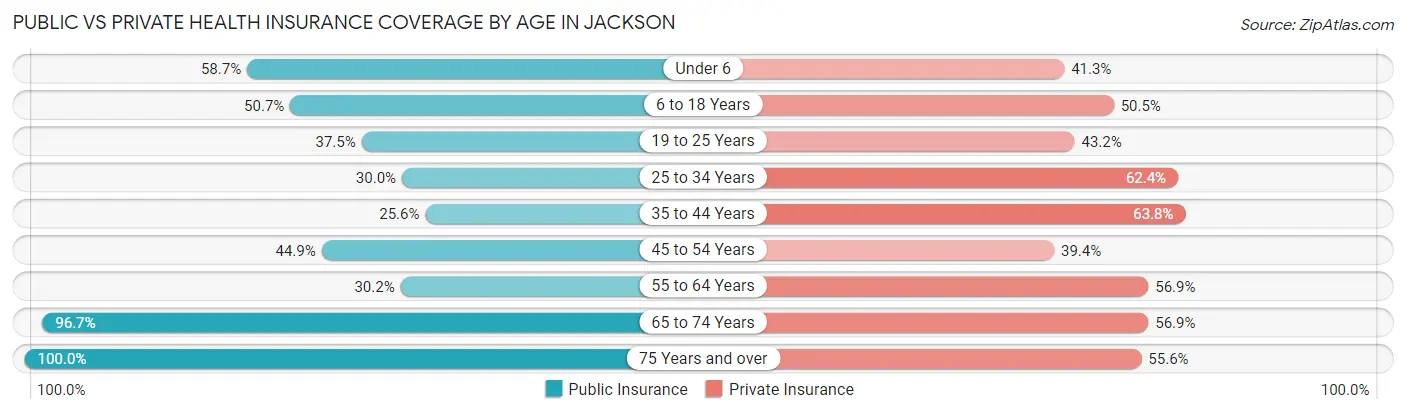
| Age Bracket | Public Insurance | Private Insurance |
| Under 6 | 350 (58.7%) | 246 (41.3%) |
| 6 to 18 Years | 428 (50.7%) | 426 (50.5%) |
| 19 to 25 Years | 248 (37.5%) | 286 (43.2%) |
| 25 to 34 Years | 306 (30.0%) | 637 (62.4%) |
| 35 to 44 Years | 203 (25.6%) | 505 (63.8%) |
| 45 to 54 Years | 351 (44.9%) | 308 (39.4%) |
| 55 to 64 Years | 169 (30.2%) | 318 (56.9%) |
| 65 to 74 Years | 498 (96.7%) | 293 (56.9%) |
| 75 Years and over | 410 (100.0%) | 228 (55.6%) |
| Total | 2,963 (47.9%) | 3,247 (52.5%) |
Disability Status by Sex by Age in Jackson
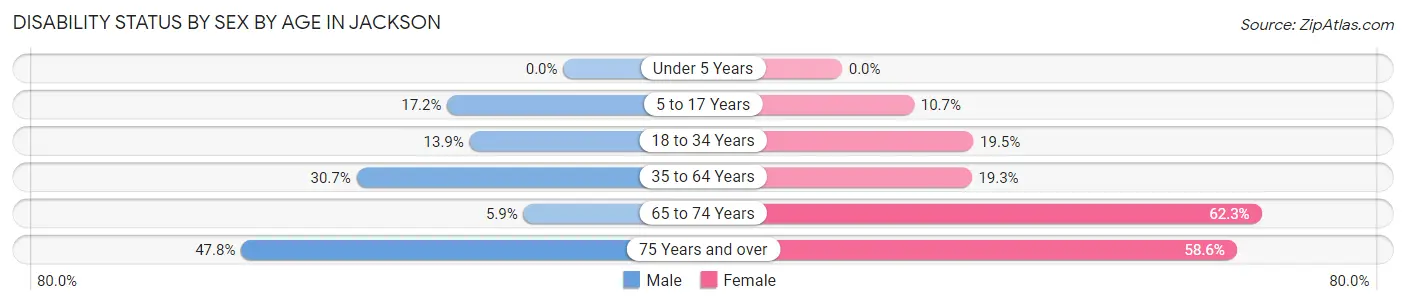
| Age Bracket | Male | Female |
| Under 5 Years | 0 (0.0%) | 0 (0.0%) |
| 5 to 17 Years | 86 (17.2%) | 34 (10.7%) |
| 18 to 34 Years | 130 (13.9%) | 164 (19.5%) |
| 35 to 64 Years | 320 (30.7%) | 210 (19.3%) |
| 65 to 74 Years | 11 (5.9%) | 205 (62.3%) |
| 75 Years and over | 77 (47.8%) | 146 (58.6%) |
Disability Class by Sex by Age in Jackson
Disability Class: Hearing Difficulty
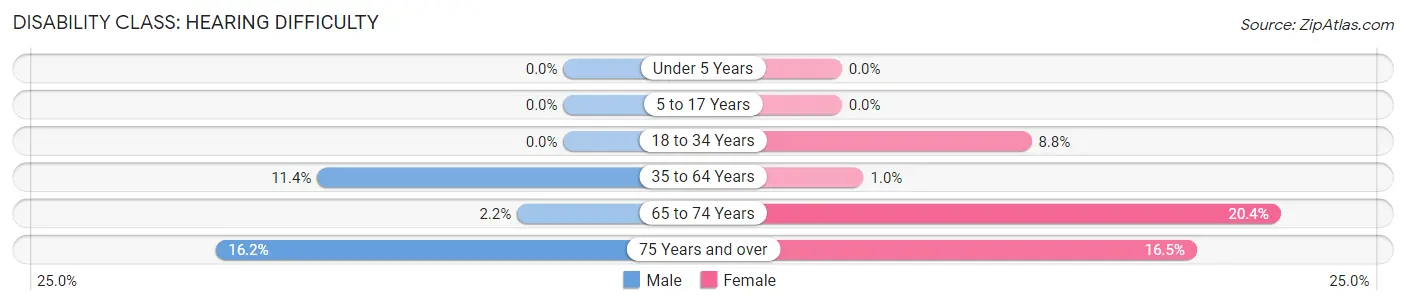
| Age Bracket | Male | Female |
| Under 5 Years | 0 (0.0%) | 0 (0.0%) |
| 5 to 17 Years | 0 (0.0%) | 0 (0.0%) |
| 18 to 34 Years | 0 (0.0%) | 74 (8.8%) |
| 35 to 64 Years | 119 (11.4%) | 11 (1.0%) |
| 65 to 74 Years | 4 (2.1%) | 67 (20.4%) |
| 75 Years and over | 26 (16.2%) | 41 (16.5%) |
Disability Class: Vision Difficulty
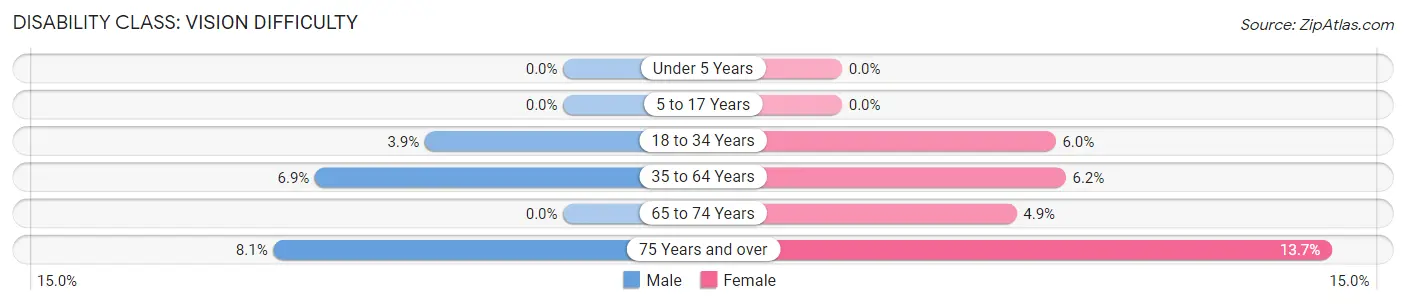
| Age Bracket | Male | Female |
| Under 5 Years | 0 (0.0%) | 0 (0.0%) |
| 5 to 17 Years | 0 (0.0%) | 0 (0.0%) |
| 18 to 34 Years | 36 (3.8%) | 50 (5.9%) |
| 35 to 64 Years | 72 (6.9%) | 68 (6.2%) |
| 65 to 74 Years | 0 (0.0%) | 16 (4.9%) |
| 75 Years and over | 13 (8.1%) | 34 (13.7%) |
Disability Class: Cognitive Difficulty
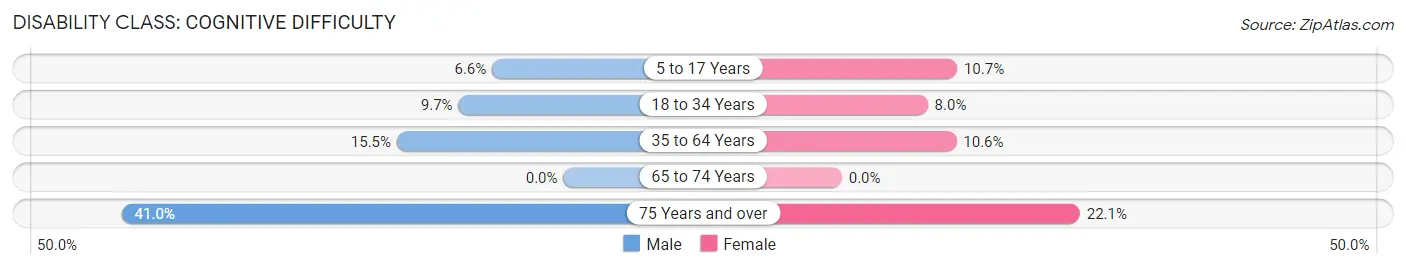
| Age Bracket | Male | Female |
| 5 to 17 Years | 33 (6.6%) | 34 (10.7%) |
| 18 to 34 Years | 91 (9.7%) | 67 (8.0%) |
| 35 to 64 Years | 161 (15.4%) | 116 (10.6%) |
| 65 to 74 Years | 0 (0.0%) | 0 (0.0%) |
| 75 Years and over | 66 (41.0%) | 55 (22.1%) |
Disability Class: Ambulatory Difficulty
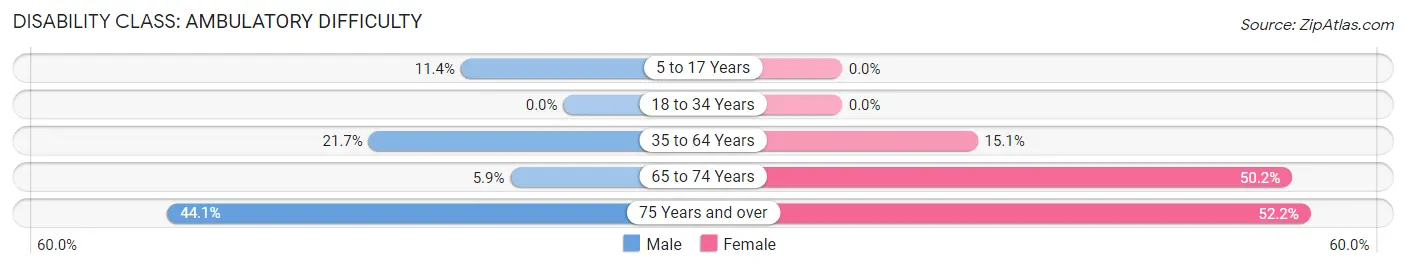
| Age Bracket | Male | Female |
| 5 to 17 Years | 57 (11.4%) | 0 (0.0%) |
| 18 to 34 Years | 0 (0.0%) | 0 (0.0%) |
| 35 to 64 Years | 226 (21.7%) | 165 (15.1%) |
| 65 to 74 Years | 11 (5.9%) | 165 (50.1%) |
| 75 Years and over | 71 (44.1%) | 130 (52.2%) |
Disability Class: Self-Care Difficulty
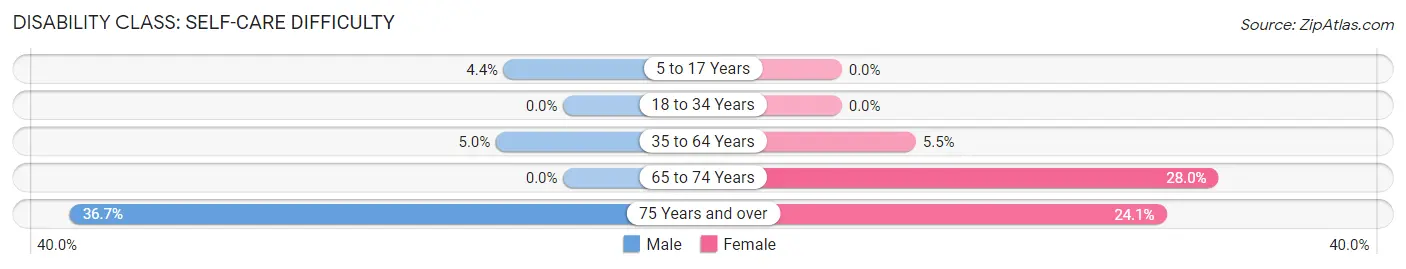
| Age Bracket | Male | Female |
| 5 to 17 Years | 22 (4.4%) | 0 (0.0%) |
| 18 to 34 Years | 0 (0.0%) | 0 (0.0%) |
| 35 to 64 Years | 52 (5.0%) | 60 (5.5%) |
| 65 to 74 Years | 0 (0.0%) | 92 (28.0%) |
| 75 Years and over | 59 (36.6%) | 60 (24.1%) |
Technology Access in Jackson
Computing Device Access in Jackson
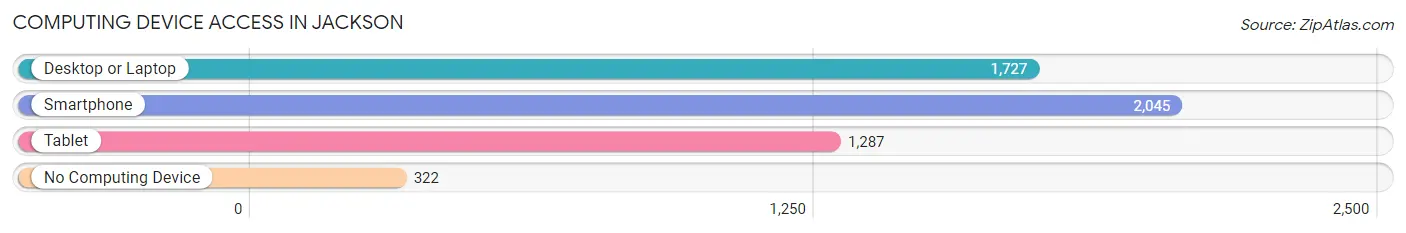
| Device Type | # Households | % Households |
| Desktop or Laptop | 1,727 | 66.7% |
| Smartphone | 2,045 | 79.0% |
| Tablet | 1,287 | 49.7% |
| No Computing Device | 322 | 12.4% |
| Total | 2,589 | 100.0% |
Internet Access in Jackson
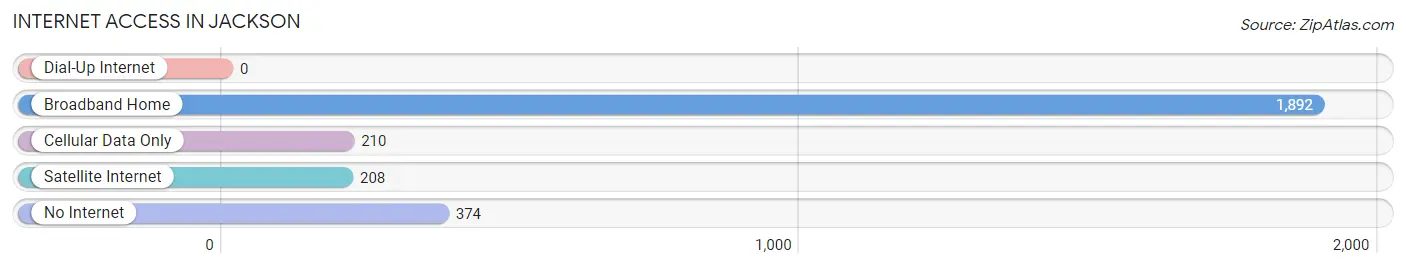
| Internet Type | # Households | % Households |
| Dial-Up Internet | 0 | 0.0% |
| Broadband Home | 1,892 | 73.1% |
| Cellular Data Only | 210 | 8.1% |
| Satellite Internet | 208 | 8.0% |
| No Internet | 374 | 14.4% |
| Total | 2,589 | 100.0% |
Jackson Summary
Jackson, Ohio is a city located in Jackson County, Ohio, United States. It is the county seat of Jackson County and is located along the Scioto River. The city has a population of 6,742 as of the 2010 census.
History
Jackson was founded in 1817 by John and Mary Jackson, who were among the first settlers in the area. The city was named after the Jacksons, and the county was named after the city. The city was incorporated in 1831 and has since grown to become the county seat of Jackson County.
The city was an important stop on the Underground Railroad, and many escaped slaves passed through the city on their way to freedom. The city was also home to the first African-American church in the county, the First African Methodist Episcopal Church, which was founded in 1845.
Geography
Jackson is located at 39°3'45"N 82°37'45"W (39.0625, -82.6292). The city is situated along the Scioto River, and is located in the Appalachian Plateau region of Ohio. The city has a total area of 4.2 square miles, all of which is land.
Economy
The economy of Jackson is largely based on manufacturing and agriculture. The city is home to several manufacturing companies, including Jackson Manufacturing, which produces automotive parts, and Jackson Tool and Die, which produces industrial tools. The city is also home to several agricultural businesses, including Jackson Farms, which produces corn, soybeans, and wheat.
The city is also home to several retail businesses, including several restaurants, grocery stores, and clothing stores. The city is also home to several banks, including First National Bank of Jackson and Jackson County Bank.
Demographics
As of the 2010 census, the population of Jackson was 6,742. The racial makeup of the city was 95.2% White, 1.3% African American, 0.3% Native American, 0.4% Asian, 0.1% Pacific Islander, 0.7% from other races, and 1.9% from two or more races. Hispanic or Latino of any race were 1.7% of the population.
The median income for a household in the city was $37,917, and the median income for a family was $45,917. The per capita income for the city was $18,917. About 11.2% of families and 14.2% of the population were below the poverty line, including 19.2% of those under age 18 and 8.2% of those age 65 or over.
Jackson is served by the Jackson City School District, which consists of four elementary schools, one middle school, and one high school. The city is also home to several private schools, including Jackson Christian Academy and Jackson Preparatory Academy.
Common Questions
What is the Total Population of Jackson?
Total Population of Jackson is 6,222.
What is the Total Male Population of Jackson?
Total Male Population of Jackson is 3,087.
What is the Total Female Population of Jackson?
Total Female Population of Jackson is 3,135.
What is the Ratio of Males per 100 Females in Jackson?
There are 98.47 Males per 100 Females in Jackson.
What is the Ratio of Females per 100 Males in Jackson?
There are 101.55 Females per 100 Males in Jackson.
What is the Median Population Age in Jackson?
Median Population Age in Jackson is 34.5 Years.
What is the Average Family Size in Jackson
Average Family Size in Jackson is 3.1 People.
What is the Average Household Size in Jackson
Average Household Size in Jackson is 2.4 People.
What is Per Capita Income in Jackson?
Per Capita income in Jackson is $35,310.
What is the Median Family Income in Jackson?
Median Family Income in Jackson is $71,865.
What is the Median Household income in Jackson?
Median Household Income in Jackson is $51,864.
What is Income or Wage Gap in Jackson?
Income or Wage Gap in Jackson is 32.3%.
Women in Jackson earn 67.7 cents for every dollar earned by a man.
What is Inequality or Gini Index in Jackson?
Inequality or Gini Index in Jackson is 0.56.
How Large is the Labor Force in Jackson?
There are 3,237 People in the Labor Forcein in Jackson.
What is the Percentage of People in the Labor Force in Jackson?
65.4% of People are in the Labor Force in Jackson.
What is the Unemployment Rate in Jackson?
Unemployment Rate in Jackson is 4.8%.