Groesbeck, OH
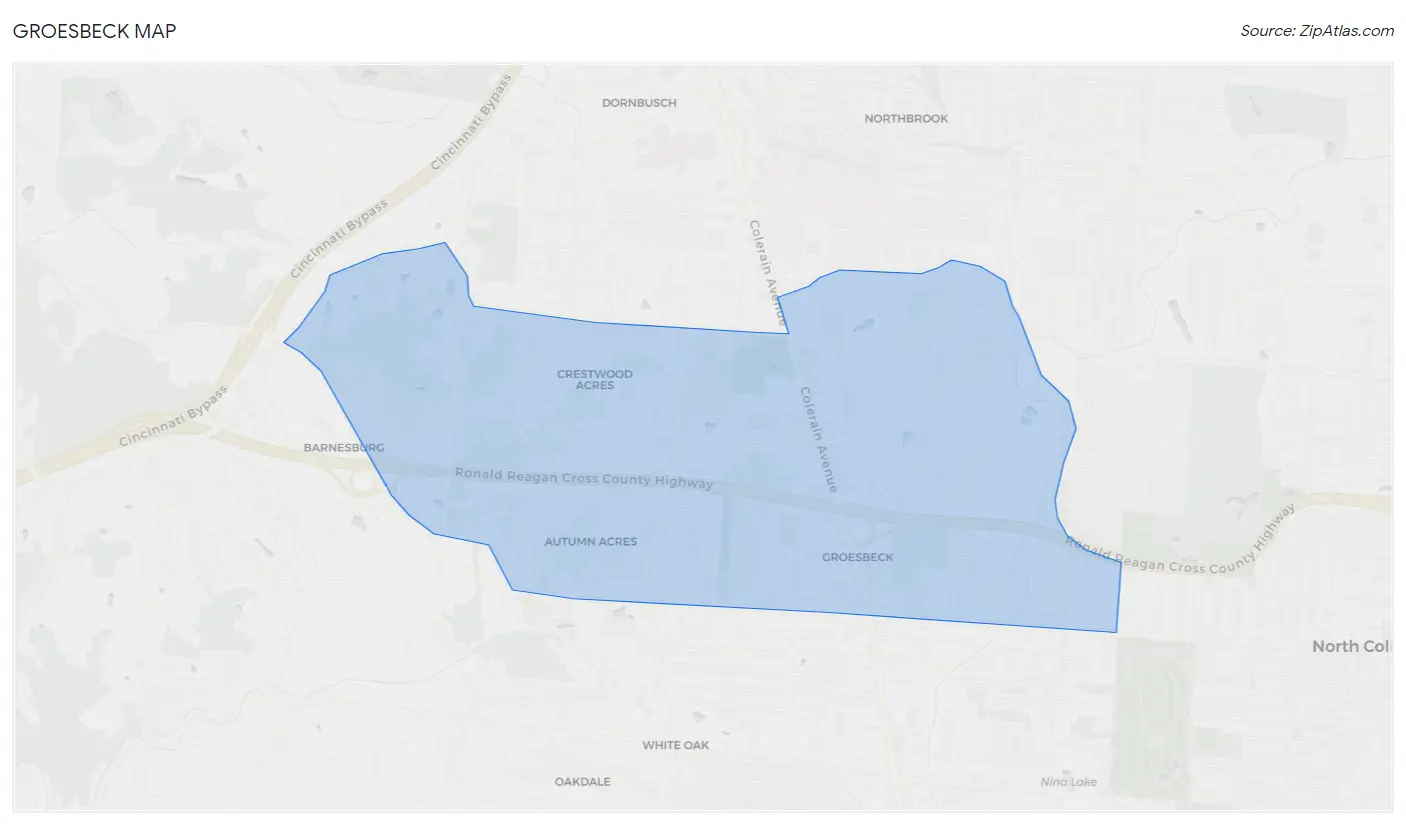
Groesbeck Map
Groesbeck Overview
8,379
TOTAL POPULATION
3,949
MALE POPULATION
4,430
FEMALE POPULATION
89.14
MALES / 100 FEMALES
112.18
FEMALES / 100 MALES
33.7
MEDIAN AGE
3.1
AVG FAMILY SIZE
2.5
AVG HOUSEHOLD SIZE
$32,010
PER CAPITA INCOME
$74,486
AVG FAMILY INCOME
$65,870
AVG HOUSEHOLD INCOME
17.8%
WAGE / INCOME GAP [ % ]
82.2¢/ $1
WAGE / INCOME GAP [ $ ]
0.37
INEQUALITY / GINI INDEX
4,631
LABOR FORCE [ PEOPLE ]
68.4%
PERCENT IN LABOR FORCE
2.9%
UNEMPLOYMENT RATE
Groesbeck Area Codes
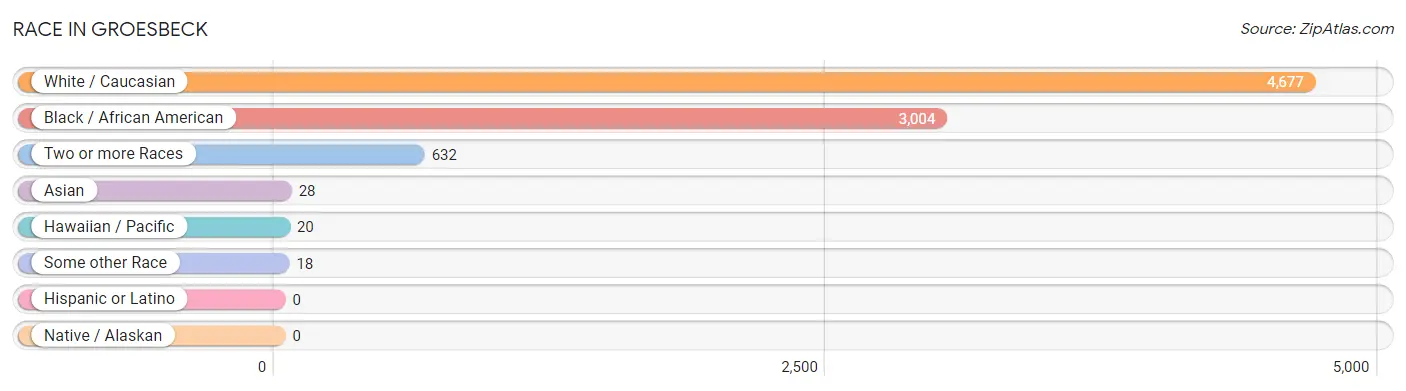
Race in Groesbeck
The most populous races in Groesbeck are White / Caucasian (4,677 | 55.8%), Black / African American (3,004 | 35.8%), and Two or more Races (632 | 7.5%).
| Race | # Population | % Population |
| Asian | 28 | 0.3% |
| Black / African American | 3,004 | 35.8% |
| Hawaiian / Pacific | 20 | 0.2% |
| Hispanic or Latino | 0 | 0.0% |
| Native / Alaskan | 0 | 0.0% |
| White / Caucasian | 4,677 | 55.8% |
| Two or more Races | 632 | 7.5% |
| Some other Race | 18 | 0.2% |
| Total | 8,379 | 100.0% |
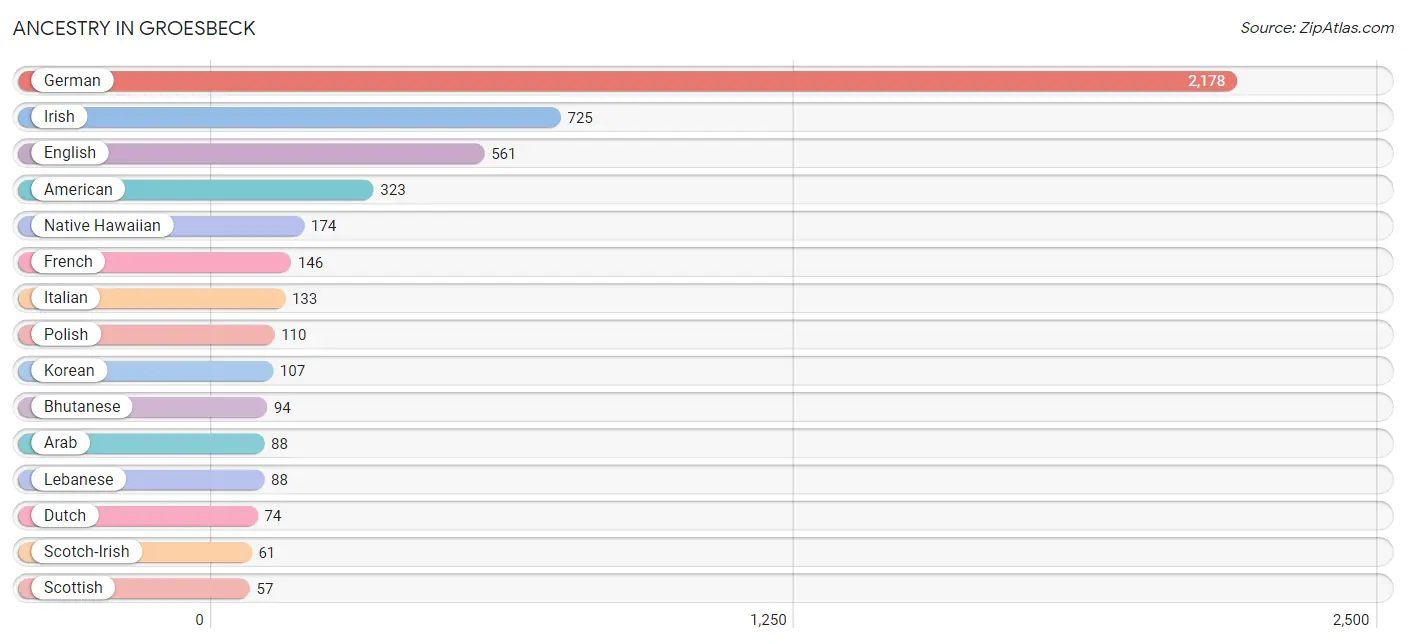
Ancestry in Groesbeck
The most populous ancestries reported in Groesbeck are German (2,178 | 26.0%), Irish (725 | 8.6%), English (561 | 6.7%), American (323 | 3.8%), and Native Hawaiian (174 | 2.1%), together accounting for 47.3% of all Groesbeck residents.
| Ancestry | # Population | % Population |
| American | 323 | 3.8% |
| Arab | 88 | 1.1% |
| Bhutanese | 94 | 1.1% |
| Canadian | 1 | 0.0% |
| Cherokee | 13 | 0.2% |
| Chippewa | 4 | 0.1% |
| Danish | 19 | 0.2% |
| Dutch | 74 | 0.9% |
| English | 561 | 6.7% |
| European | 41 | 0.5% |
| French | 146 | 1.7% |
| French Canadian | 11 | 0.1% |
| German | 2,178 | 26.0% |
| Guamanian / Chamorro | 6 | 0.1% |
| Hungarian | 20 | 0.2% |
| Irish | 725 | 8.6% |
| Italian | 133 | 1.6% |
| Japanese | 28 | 0.3% |
| Korean | 107 | 1.3% |
| Lebanese | 88 | 1.1% |
| Native Hawaiian | 174 | 2.1% |
| Polish | 110 | 1.3% |
| Romanian | 14 | 0.2% |
| Russian | 13 | 0.2% |
| Scotch-Irish | 61 | 0.7% |
| Scottish | 57 | 0.7% |
| Slovak | 16 | 0.2% |
| Welsh | 19 | 0.2% | View All 28 Rows |
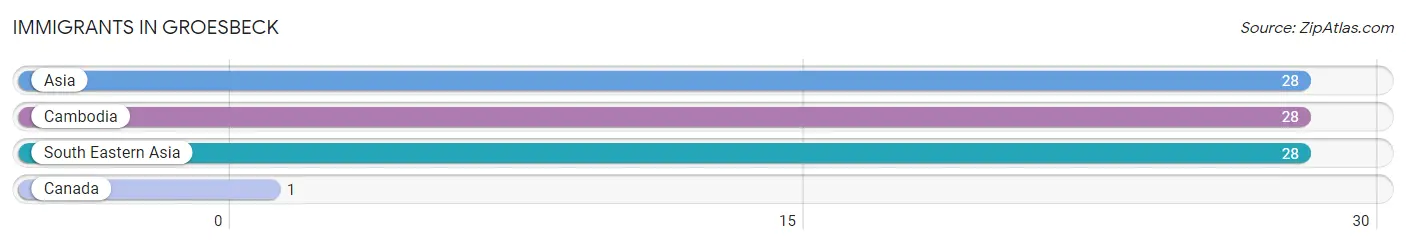
Immigrants in Groesbeck
The most numerous immigrant groups reported in Groesbeck came from Asia (28 | 0.3%), Cambodia (28 | 0.3%), South Eastern Asia (28 | 0.3%), and Canada (1 | 0.0%), together accounting for 1.0% of all Groesbeck residents.
| Immigration Origin | # Population | % Population |
| Asia | 28 | 0.3% |
| Cambodia | 28 | 0.3% |
| Canada | 1 | 0.0% |
| South Eastern Asia | 28 | 0.3% | View All 4 Rows |
Sex and Age in Groesbeck
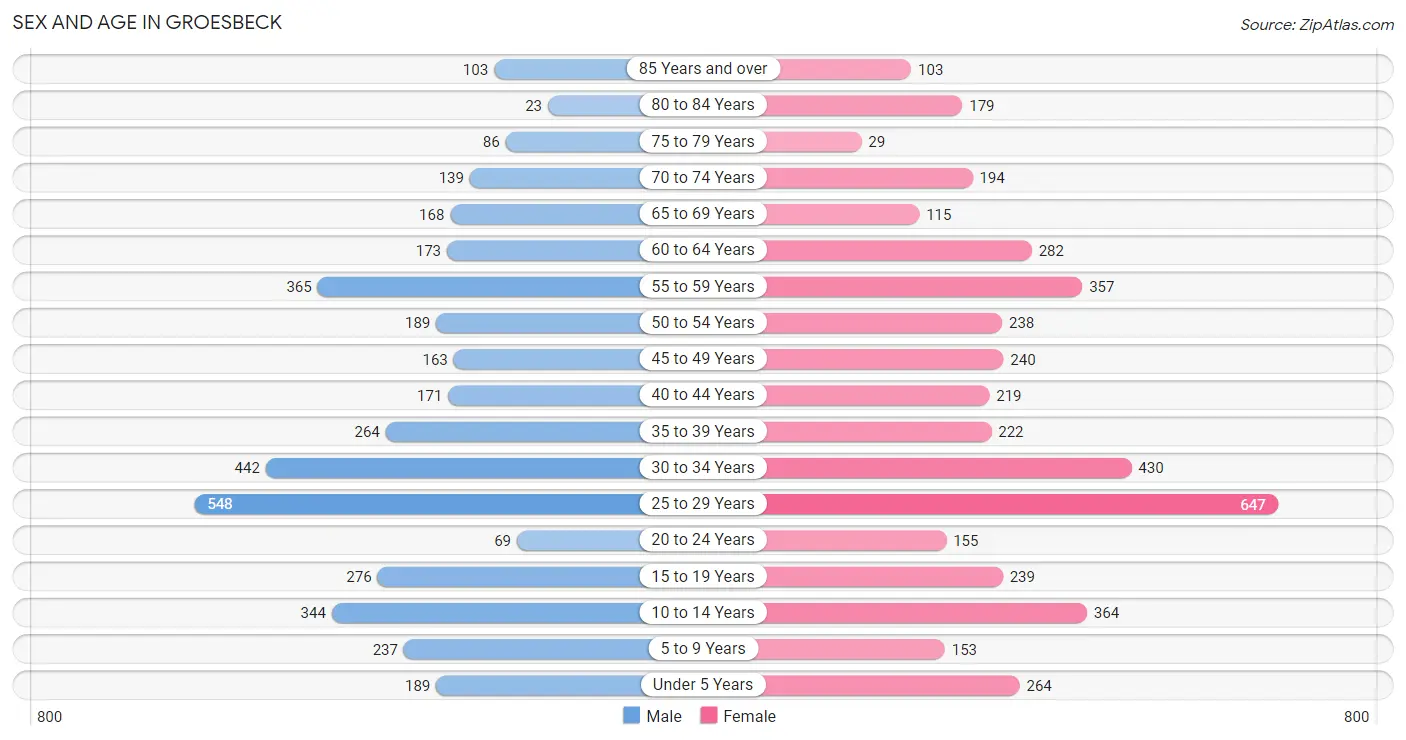
Sex and Age in Groesbeck
The most populous age groups in Groesbeck are 25 to 29 Years (548 | 13.9%) for men and 25 to 29 Years (647 | 14.6%) for women.
| Age Bracket | Male | Female |
| Under 5 Years | 189 (4.8%) | 264 (6.0%) |
| 5 to 9 Years | 237 (6.0%) | 153 (3.5%) |
| 10 to 14 Years | 344 (8.7%) | 364 (8.2%) |
| 15 to 19 Years | 276 (7.0%) | 239 (5.4%) |
| 20 to 24 Years | 69 (1.8%) | 155 (3.5%) |
| 25 to 29 Years | 548 (13.9%) | 647 (14.6%) |
| 30 to 34 Years | 442 (11.2%) | 430 (9.7%) |
| 35 to 39 Years | 264 (6.7%) | 222 (5.0%) |
| 40 to 44 Years | 171 (4.3%) | 219 (4.9%) |
| 45 to 49 Years | 163 (4.1%) | 240 (5.4%) |
| 50 to 54 Years | 189 (4.8%) | 238 (5.4%) |
| 55 to 59 Years | 365 (9.2%) | 357 (8.1%) |
| 60 to 64 Years | 173 (4.4%) | 282 (6.4%) |
| 65 to 69 Years | 168 (4.3%) | 115 (2.6%) |
| 70 to 74 Years | 139 (3.5%) | 194 (4.4%) |
| 75 to 79 Years | 86 (2.2%) | 29 (0.6%) |
| 80 to 84 Years | 23 (0.6%) | 179 (4.0%) |
| 85 Years and over | 103 (2.6%) | 103 (2.3%) |
| Total | 3,949 (100.0%) | 4,430 (100.0%) |
Families and Households in Groesbeck
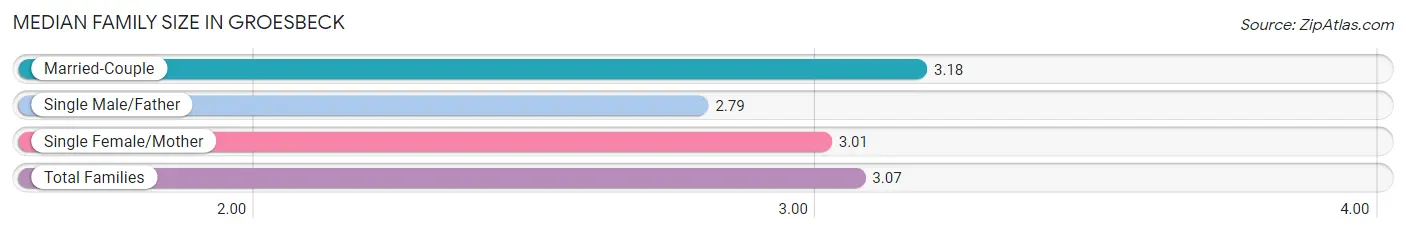
Median Family Size in Groesbeck
The median family size in Groesbeck is 3.07 persons per family, with married-couple families (1,347 | 61.4%) accounting for the largest median family size of 3.18 persons per family. On the other hand, single male/father families (437 | 19.9%) represent the smallest median family size with 2.79 persons per family.
| Family Type | # Families | Family Size |
| Married-Couple | 1,347 (61.4%) | 3.18 |
| Single Male/Father | 437 (19.9%) | 2.79 |
| Single Female/Mother | 410 (18.7%) | 3.01 |
| Total Families | 2,194 (100.0%) | 3.07 |
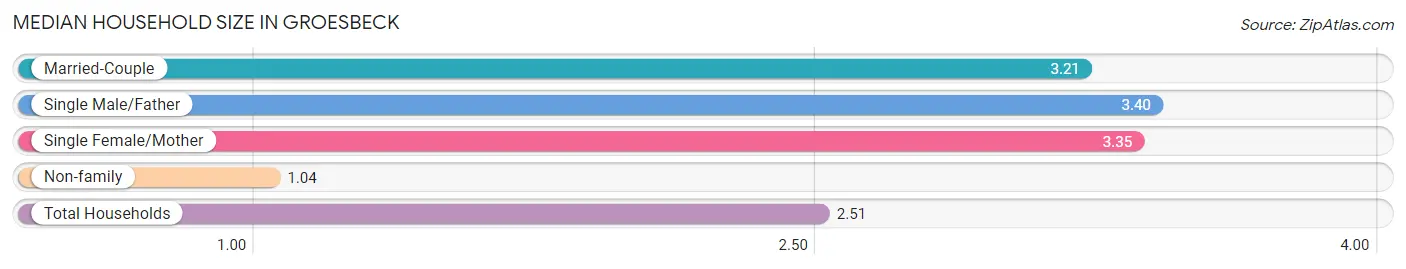
Median Household Size in Groesbeck
The median household size in Groesbeck is 2.51 persons per household, with single male/father households (437 | 13.2%) accounting for the largest median household size of 3.4 persons per household. non-family households (1,130 | 34.0%) represent the smallest median household size with 1.04 persons per household.
| Household Type | # Households | Household Size |
| Married-Couple | 1,347 (40.5%) | 3.21 |
| Single Male/Father | 437 (13.2%) | 3.40 |
| Single Female/Mother | 410 (12.3%) | 3.35 |
| Non-family | 1,130 (34.0%) | 1.04 |
| Total Households | 3,324 (100.0%) | 2.51 |
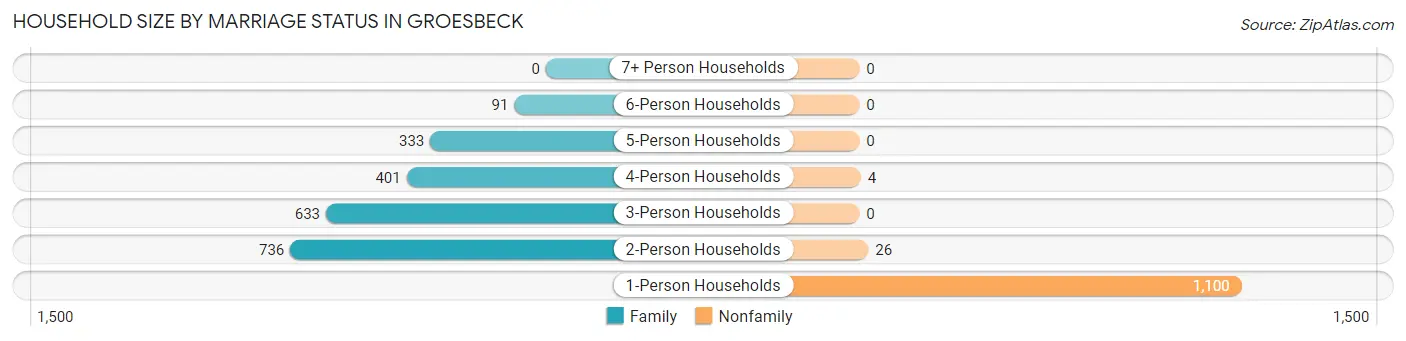
Household Size by Marriage Status in Groesbeck
Out of a total of 3,324 households in Groesbeck, 2,194 (66.0%) are family households, while 1,130 (34.0%) are nonfamily households. The most numerous type of family households are 2-person households, comprising 736, and the most common type of nonfamily households are 1-person households, comprising 1,100.
| Household Size | Family Households | Nonfamily Households |
| 1-Person Households | - | 1,100 (33.1%) |
| 2-Person Households | 736 (22.1%) | 26 (0.8%) |
| 3-Person Households | 633 (19.0%) | 0 (0.0%) |
| 4-Person Households | 401 (12.1%) | 4 (0.1%) |
| 5-Person Households | 333 (10.0%) | 0 (0.0%) |
| 6-Person Households | 91 (2.7%) | 0 (0.0%) |
| 7+ Person Households | 0 (0.0%) | 0 (0.0%) |
| Total | 2,194 (66.0%) | 1,130 (34.0%) |
Female Fertility in Groesbeck
Fertility by Age in Groesbeck
Average fertility rate in Groesbeck is 42.0 births per 1,000 women. Women in the age bracket of 20 to 34 years have the highest fertility rate with 47.0 births per 1,000 women. Women in the age bracket of 20 to 34 years acount for 62.4% of all women with births.
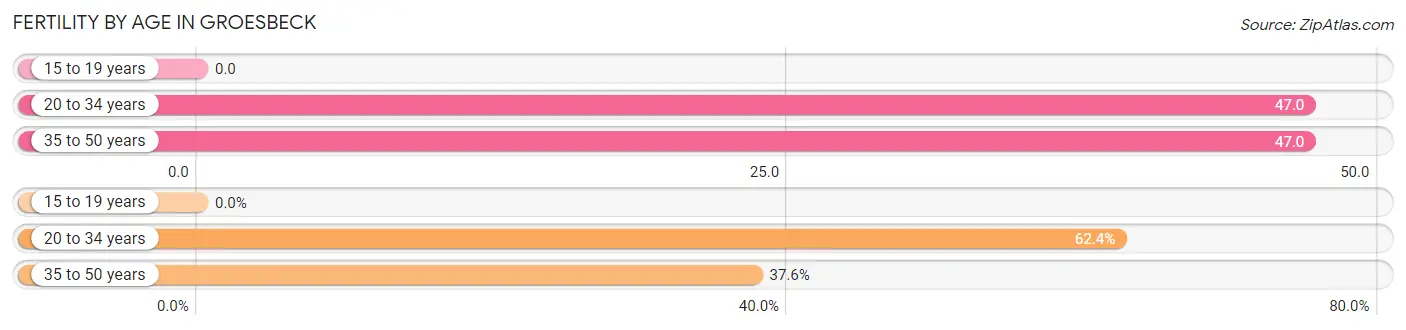
| Age Bracket | Women with Births | Births / 1,000 Women |
| 15 to 19 years | 0 (0.0%) | 0.0 |
| 20 to 34 years | 58 (62.4%) | 47.0 |
| 35 to 50 years | 35 (37.6%) | 47.0 |
| Total | 93 (100.0%) | 42.0 |
Fertility by Age by Marriage Status in Groesbeck
37.6% of women with births (93) in Groesbeck are married. The highest percentage of unmarried women with births falls into 20 to 34 years age bracket with 100.0% of them unmarried at the time of birth, while the lowest percentage of unmarried women with births belong to 35 to 50 years age bracket with 0.0% of them unmarried.
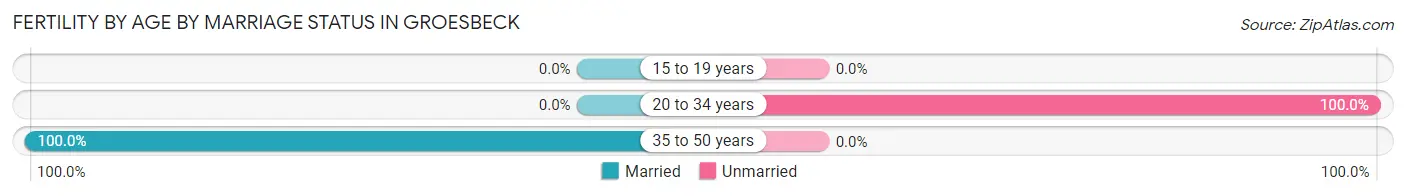
| Age Bracket | Married | Unmarried |
| 15 to 19 years | 0 (0.0%) | 0 (0.0%) |
| 20 to 34 years | 0 (0.0%) | 58 (100.0%) |
| 35 to 50 years | 35 (100.0%) | 0 (0.0%) |
| Total | 35 (37.6%) | 58 (62.4%) |
Fertility by Education in Groesbeck
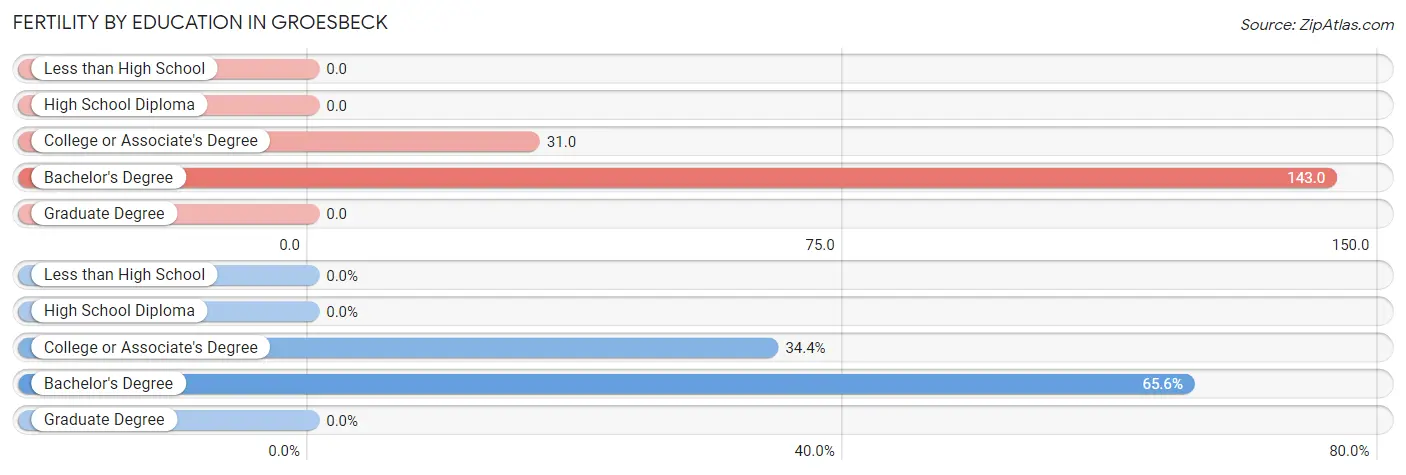
| Educational Attainment | Women with Births | Births / 1,000 Women |
| Less than High School | 0 (0.0%) | 0.0 |
| High School Diploma | 0 (0.0%) | 0.0 |
| College or Associate's Degree | 32 (34.4%) | 31.0 |
| Bachelor's Degree | 61 (65.6%) | 143.0 |
| Graduate Degree | 0 (0.0%) | 0.0 |
| Total | 93 (100.0%) | 42.0 |
Fertility by Education by Marriage Status in Groesbeck
62.4% of women with births in Groesbeck are unmarried. Women with the educational attainment of bachelor's degree are most likely to be married with 57.4% of them married at childbirth, while women with the educational attainment of college or associate's degree are least likely to be married with 100.0% of them unmarried at childbirth.
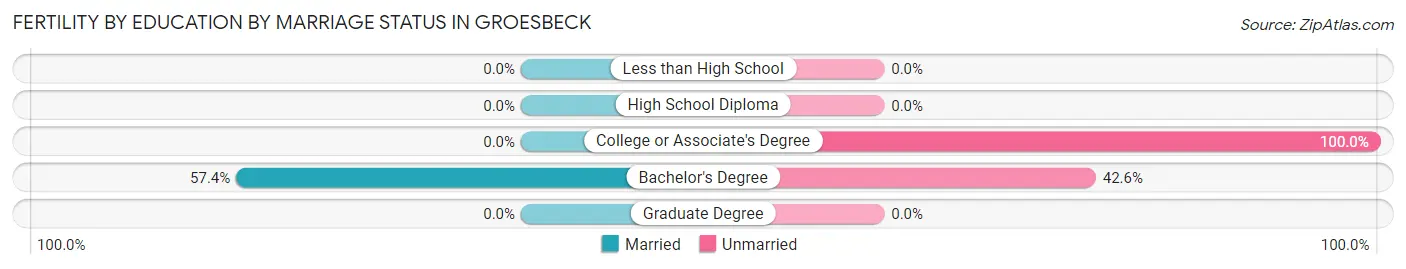
| Educational Attainment | Married | Unmarried |
| Less than High School | 0 (0.0%) | 0 (0.0%) |
| High School Diploma | 0 (0.0%) | 0 (0.0%) |
| College or Associate's Degree | 0 (0.0%) | 32 (100.0%) |
| Bachelor's Degree | 35 (57.4%) | 26 (42.6%) |
| Graduate Degree | 0 (0.0%) | 0 (0.0%) |
| Total | 35 (37.6%) | 58 (62.4%) |
Income in Groesbeck
Income Overview in Groesbeck
Per Capita Income in Groesbeck is $32,010, while median incomes of families and households are $74,486 and $65,870 respectively.
| Characteristic | Number | Measure |
| Per Capita Income | 8,379 | $32,010 |
| Median Family Income | 2,194 | $74,486 |
| Mean Family Income | 2,194 | $89,125 |
| Median Household Income | 3,324 | $65,870 |
| Mean Household Income | 3,324 | $79,702 |
| Income Deficit | 2,194 | $0 |
| Wage / Income Gap (%) | 8,379 | 17.77% |
| Wage / Income Gap ($) | 8,379 | 82.23¢ per $1 |
| Gini / Inequality Index | 8,379 | 0.37 |
Earnings by Sex in Groesbeck
Average Earnings in Groesbeck are $40,089, $46,472 for men and $38,216 for women, a difference of 17.8%.
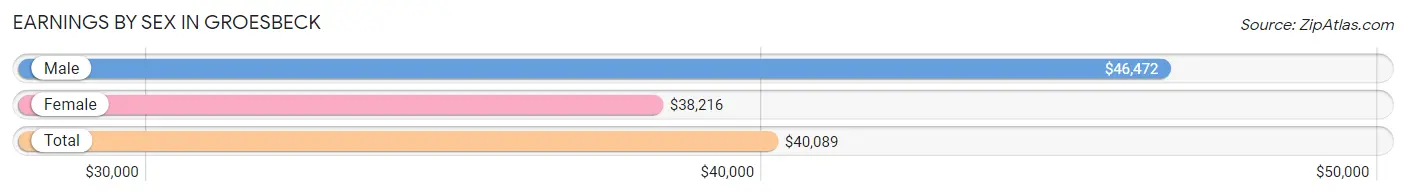
| Sex | Number | Average Earnings |
| Male | 2,197 (47.6%) | $46,472 |
| Female | 2,417 (52.4%) | $38,216 |
| Total | 4,614 (100.0%) | $40,089 |
Earnings by Sex by Income Bracket in Groesbeck
The most common earnings brackets in Groesbeck are $75,000 to $99,999 for men (426 | 19.4%) and $35,000 to $39,999 for women (488 | 20.2%).
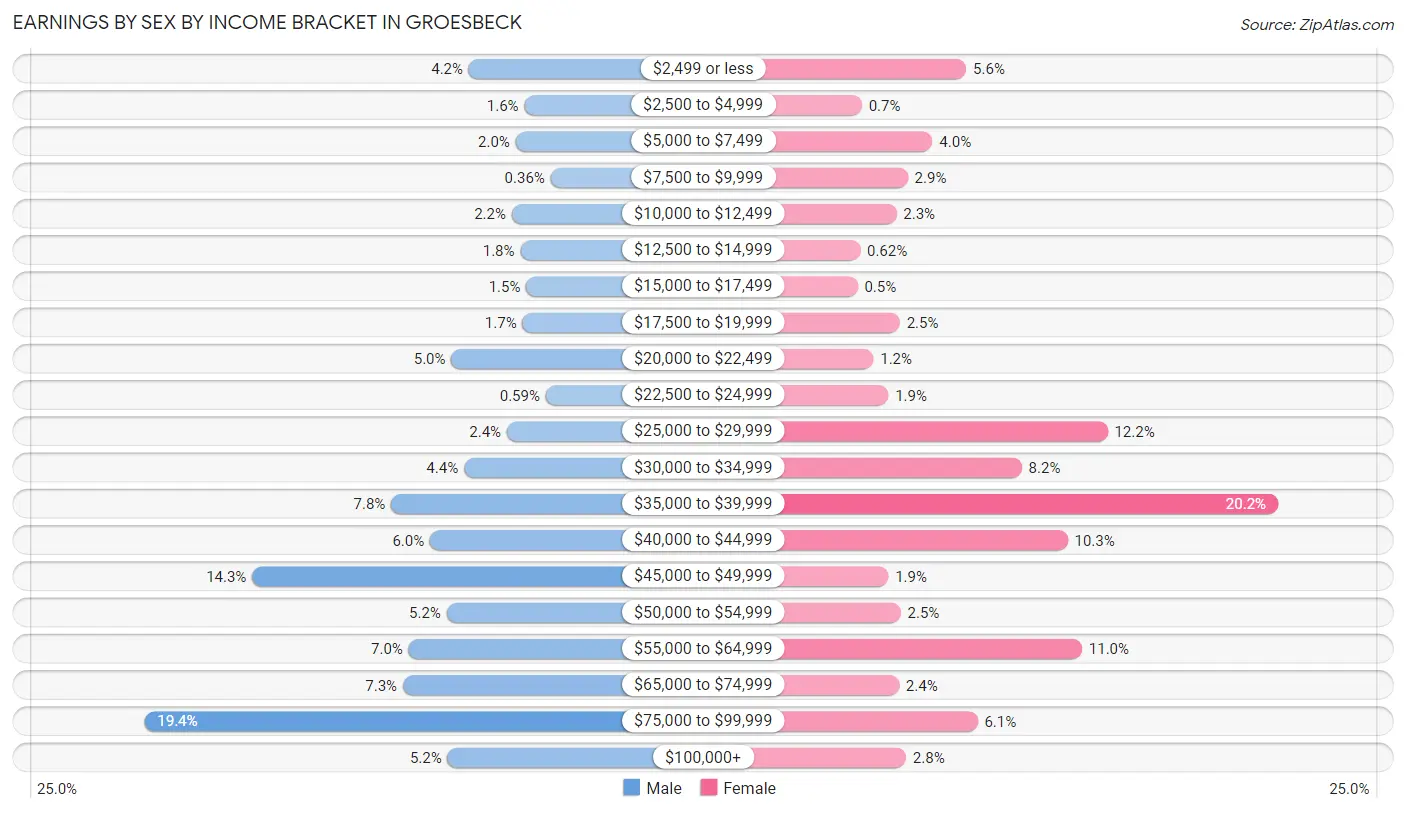
| Income | Male | Female |
| $2,499 or less | 92 (4.2%) | 135 (5.6%) |
| $2,500 to $4,999 | 35 (1.6%) | 17 (0.7%) |
| $5,000 to $7,499 | 44 (2.0%) | 97 (4.0%) |
| $7,500 to $9,999 | 8 (0.4%) | 69 (2.9%) |
| $10,000 to $12,499 | 48 (2.2%) | 56 (2.3%) |
| $12,500 to $14,999 | 39 (1.8%) | 15 (0.6%) |
| $15,000 to $17,499 | 33 (1.5%) | 12 (0.5%) |
| $17,500 to $19,999 | 37 (1.7%) | 60 (2.5%) |
| $20,000 to $22,499 | 110 (5.0%) | 30 (1.2%) |
| $22,500 to $24,999 | 13 (0.6%) | 47 (1.9%) |
| $25,000 to $29,999 | 53 (2.4%) | 295 (12.2%) |
| $30,000 to $34,999 | 97 (4.4%) | 198 (8.2%) |
| $35,000 to $39,999 | 172 (7.8%) | 488 (20.2%) |
| $40,000 to $44,999 | 132 (6.0%) | 250 (10.3%) |
| $45,000 to $49,999 | 315 (14.3%) | 47 (1.9%) |
| $50,000 to $54,999 | 115 (5.2%) | 61 (2.5%) |
| $55,000 to $64,999 | 154 (7.0%) | 266 (11.0%) |
| $65,000 to $74,999 | 160 (7.3%) | 59 (2.4%) |
| $75,000 to $99,999 | 426 (19.4%) | 148 (6.1%) |
| $100,000+ | 114 (5.2%) | 67 (2.8%) |
| Total | 2,197 (100.0%) | 2,417 (100.0%) |
Earnings by Sex by Educational Attainment in Groesbeck
Average earnings in Groesbeck are $47,206 for men and $38,994 for women, a difference of 17.4%. Men with an educational attainment of graduate degree enjoy the highest average annual earnings of $95,833, while those with high school diploma education earn the least with $36,646. Women with an educational attainment of graduate degree earn the most with the average annual earnings of $90,729, while those with less than high school education have the smallest earnings of $30,217.
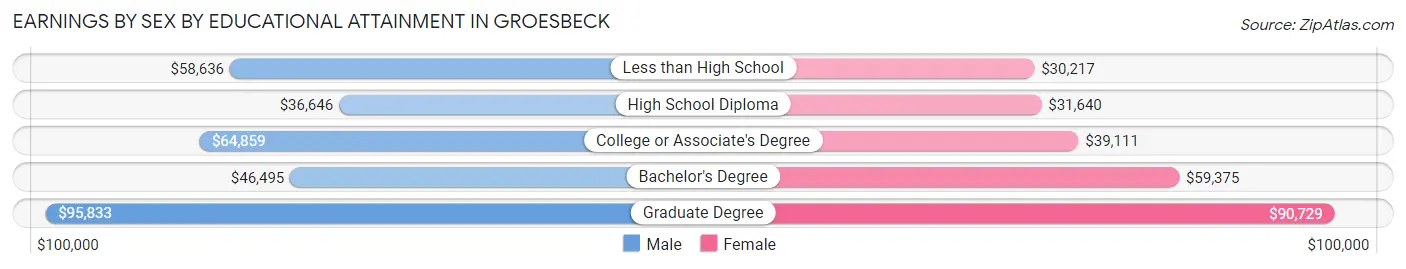
| Educational Attainment | Male Income | Female Income |
| Less than High School | $58,636 | $30,217 |
| High School Diploma | $36,646 | $31,640 |
| College or Associate's Degree | $64,859 | $39,111 |
| Bachelor's Degree | $46,495 | $59,375 |
| Graduate Degree | $95,833 | $90,729 |
| Total | $47,206 | $38,994 |
Family Income in Groesbeck
Family Income Brackets in Groesbeck
According to the Groesbeck family income data, there are 597 families falling into the $50,000 to $74,999 income range, which is the most common income bracket and makes up 27.2% of all families. Conversely, the $10,000 to $14,999 income bracket is the least frequent group with only 11 families (0.5%) belonging to this category.
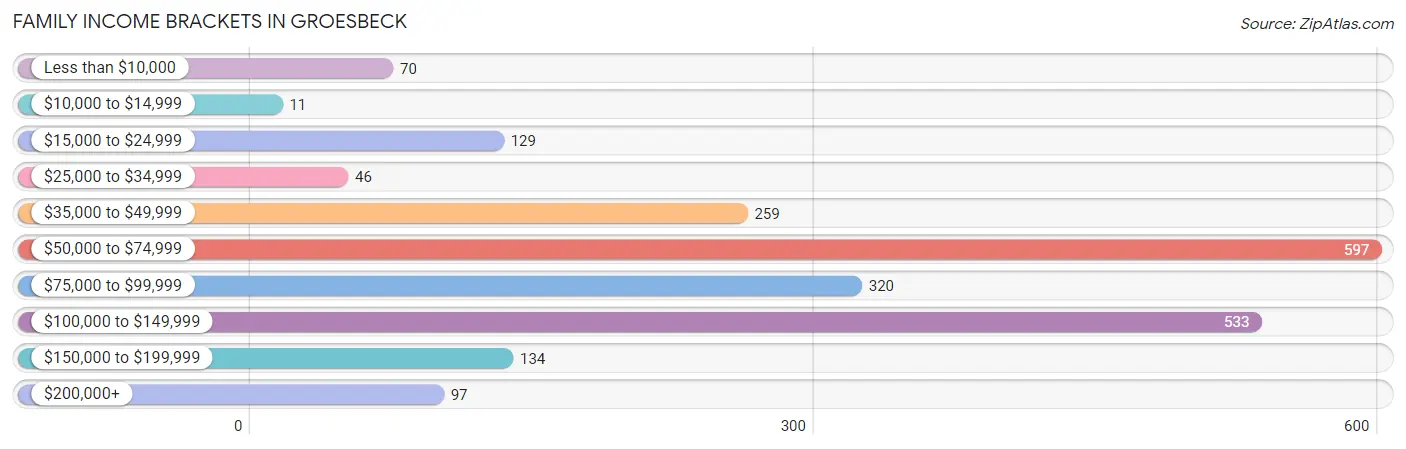
| Income Bracket | # Families | % Families |
| Less than $10,000 | 70 | 3.2% |
| $10,000 to $14,999 | 11 | 0.5% |
| $15,000 to $24,999 | 129 | 5.9% |
| $25,000 to $34,999 | 46 | 2.1% |
| $35,000 to $49,999 | 259 | 11.8% |
| $50,000 to $74,999 | 597 | 27.2% |
| $75,000 to $99,999 | 320 | 14.6% |
| $100,000 to $149,999 | 533 | 24.3% |
| $150,000 to $199,999 | 134 | 6.1% |
| $200,000+ | 97 | 4.4% |
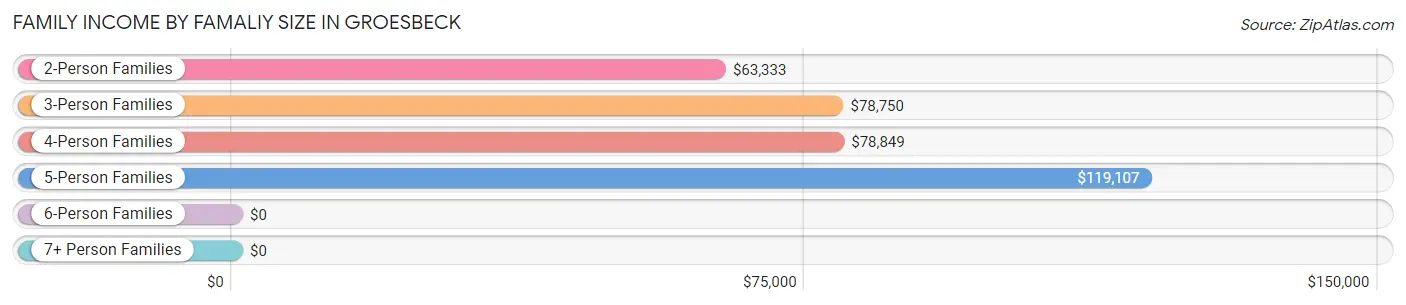
Family Income by Famaliy Size in Groesbeck
5-person families (285 | 13.0%) account for the highest median family income in Groesbeck with $119,107 per family, while 2-person families (894 | 40.7%) have the highest median income of $31,666 per family member.
| Income Bracket | # Families | Median Income |
| 2-Person Families | 894 (40.7%) | $63,333 |
| 3-Person Families | 572 (26.1%) | $78,750 |
| 4-Person Families | 443 (20.2%) | $78,849 |
| 5-Person Families | 285 (13.0%) | $119,107 |
| 6-Person Families | 0 (0.0%) | $0 |
| 7+ Person Families | 0 (0.0%) | $0 |
| Total | 2,194 (100.0%) | $74,486 |
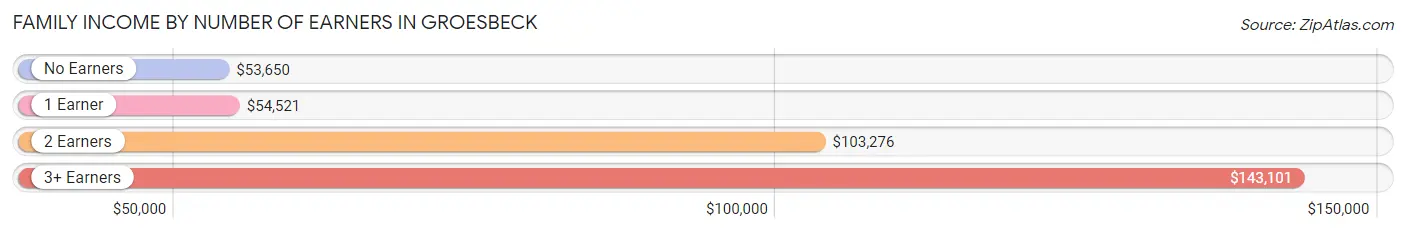
Family Income by Number of Earners in Groesbeck
The median family income in Groesbeck is $74,486, with families comprising 3+ earners (257) having the highest median family income of $143,101, while families with no earners (263) have the lowest median family income of $53,650, accounting for 11.7% and 12.0% of families, respectively.
| Number of Earners | # Families | Median Income |
| No Earners | 263 (12.0%) | $53,650 |
| 1 Earner | 864 (39.4%) | $54,521 |
| 2 Earners | 810 (36.9%) | $103,276 |
| 3+ Earners | 257 (11.7%) | $143,101 |
| Total | 2,194 (100.0%) | $74,486 |
Household Income in Groesbeck
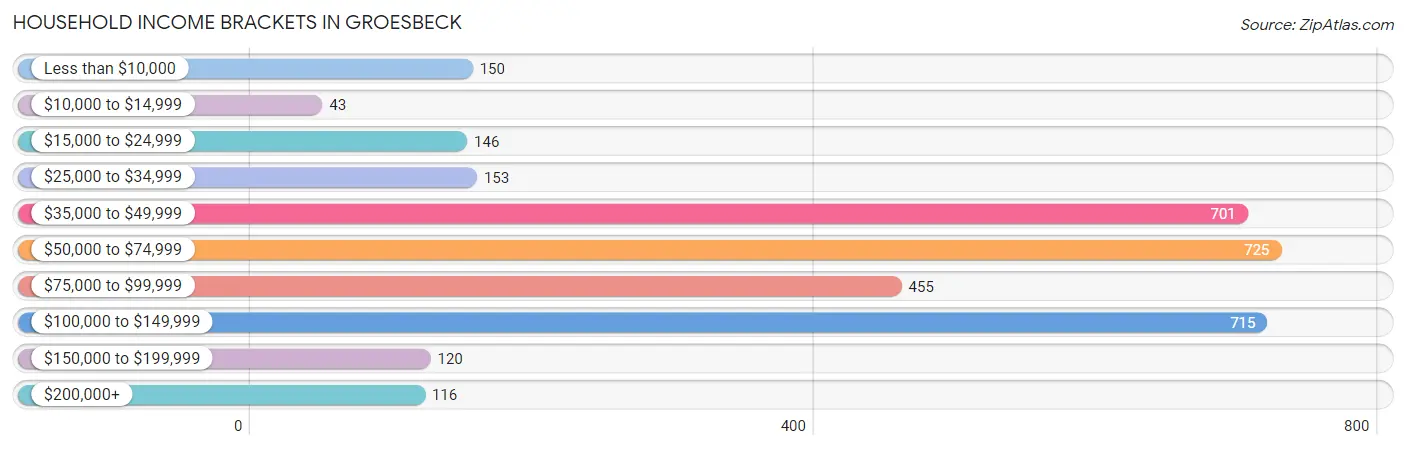
Household Income Brackets in Groesbeck
With 725 households falling in the category, the $50,000 to $74,999 income range is the most frequent in Groesbeck, accounting for 21.8% of all households. In contrast, only 43 households (1.3%) fall into the $10,000 to $14,999 income bracket, making it the least populous group.
| Income Bracket | # Households | % Households |
| Less than $10,000 | 150 | 4.5% |
| $10,000 to $14,999 | 43 | 1.3% |
| $15,000 to $24,999 | 146 | 4.4% |
| $25,000 to $34,999 | 153 | 4.6% |
| $35,000 to $49,999 | 701 | 21.1% |
| $50,000 to $74,999 | 725 | 21.8% |
| $75,000 to $99,999 | 455 | 13.7% |
| $100,000 to $149,999 | 715 | 21.5% |
| $150,000 to $199,999 | 120 | 3.6% |
| $200,000+ | 116 | 3.5% |
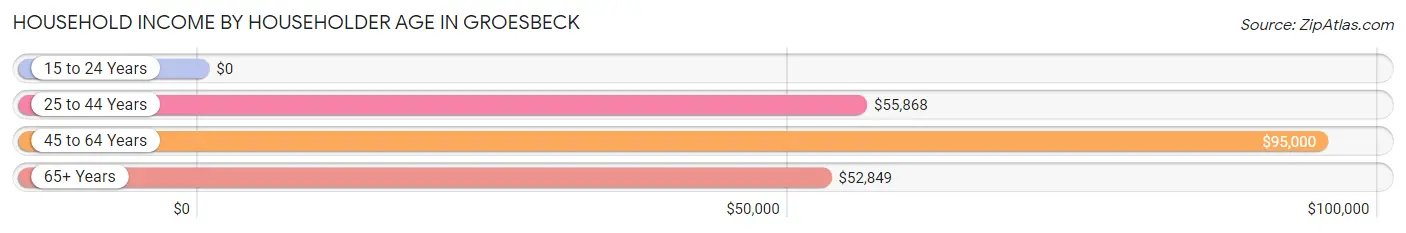
Household Income by Householder Age in Groesbeck
The median household income in Groesbeck is $65,870, with the highest median household income of $95,000 found in the 45 to 64 years age bracket for the primary householder. A total of 996 households (30.0%) fall into this category. Meanwhile, the 15 to 24 years age bracket for the primary householder has the lowest median household income of $0, with 23 households (0.7%) in this group.
| Income Bracket | # Households | Median Income |
| 15 to 24 Years | 23 (0.7%) | $0 |
| 25 to 44 Years | 1,549 (46.6%) | $55,868 |
| 45 to 64 Years | 996 (30.0%) | $95,000 |
| 65+ Years | 756 (22.7%) | $52,849 |
| Total | 3,324 (100.0%) | $65,870 |
Poverty in Groesbeck
Income Below Poverty by Sex and Age in Groesbeck
With 3.5% poverty level for males and 6.3% for females among the residents of Groesbeck, 25 to 34 year old males and 15 year old females are the most vulnerable to poverty, with 62 males (6.3%) and 6 females (35.3%) in their respective age groups living below the poverty level.
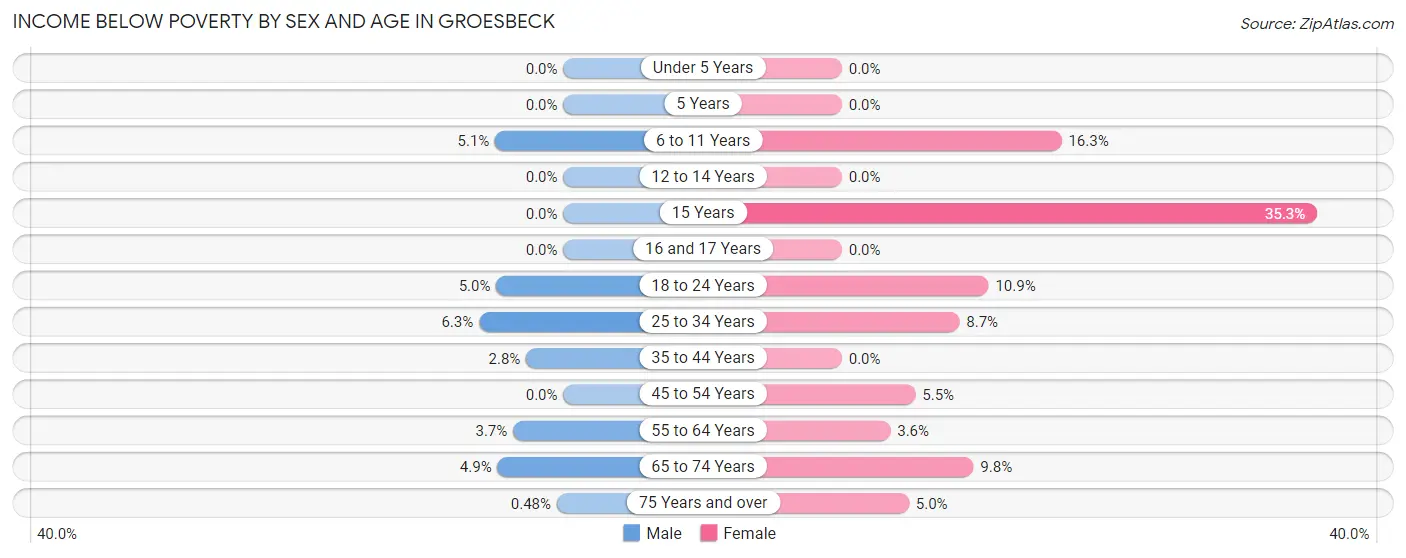
| Age Bracket | Male | Female |
| Under 5 Years | 0 (0.0%) | 0 (0.0%) |
| 5 Years | 0 (0.0%) | 0 (0.0%) |
| 6 to 11 Years | 17 (5.1%) | 53 (16.3%) |
| 12 to 14 Years | 0 (0.0%) | 0 (0.0%) |
| 15 Years | 0 (0.0%) | 6 (35.3%) |
| 16 and 17 Years | 0 (0.0%) | 0 (0.0%) |
| 18 to 24 Years | 11 (5.0%) | 28 (10.9%) |
| 25 to 34 Years | 62 (6.3%) | 94 (8.7%) |
| 35 to 44 Years | 12 (2.8%) | 0 (0.0%) |
| 45 to 54 Years | 0 (0.0%) | 26 (5.5%) |
| 55 to 64 Years | 20 (3.7%) | 23 (3.6%) |
| 65 to 74 Years | 15 (4.9%) | 30 (9.8%) |
| 75 Years and over | 1 (0.5%) | 15 (5.0%) |
| Total | 138 (3.5%) | 275 (6.3%) |
Income Above Poverty by Sex and Age in Groesbeck
According to the poverty statistics in Groesbeck, males aged under 5 years and females aged under 5 years are the age groups that are most secure financially, with 100.0% of males and 100.0% of females in these age groups living above the poverty line.
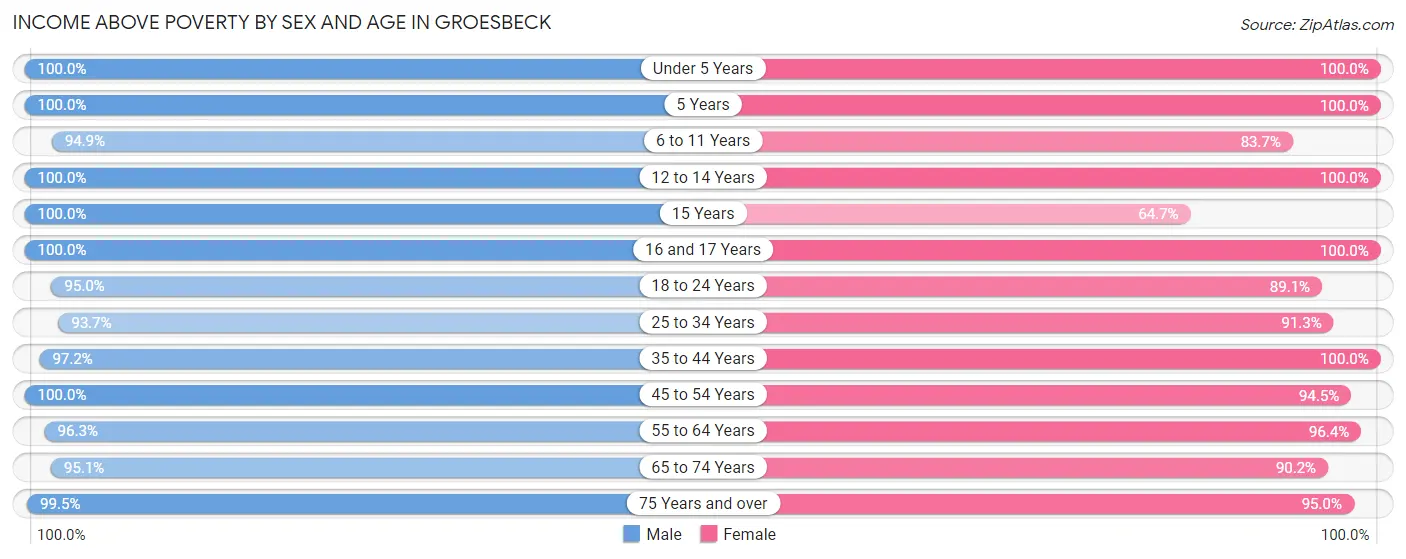
| Age Bracket | Male | Female |
| Under 5 Years | 189 (100.0%) | 264 (100.0%) |
| 5 Years | 23 (100.0%) | 5 (100.0%) |
| 6 to 11 Years | 319 (94.9%) | 272 (83.7%) |
| 12 to 14 Years | 197 (100.0%) | 146 (100.0%) |
| 15 Years | 41 (100.0%) | 11 (64.7%) |
| 16 and 17 Years | 83 (100.0%) | 120 (100.0%) |
| 18 to 24 Years | 210 (95.0%) | 229 (89.1%) |
| 25 to 34 Years | 928 (93.7%) | 983 (91.3%) |
| 35 to 44 Years | 423 (97.2%) | 441 (100.0%) |
| 45 to 54 Years | 350 (100.0%) | 450 (94.5%) |
| 55 to 64 Years | 516 (96.3%) | 616 (96.4%) |
| 65 to 74 Years | 292 (95.1%) | 277 (90.2%) |
| 75 Years and over | 209 (99.5%) | 286 (95.0%) |
| Total | 3,780 (96.5%) | 4,100 (93.7%) |
Income Below Poverty Among Married-Couple Families in Groesbeck
The poverty statistics for married-couple families in Groesbeck show that 2.3% or 31 of the total 1,347 families live below the poverty line. Families with no children have the highest poverty rate of 3.9%, comprising of 31 families. On the other hand, families with 1 or 2 children have the lowest poverty rate of 0.0%, which includes 0 families.
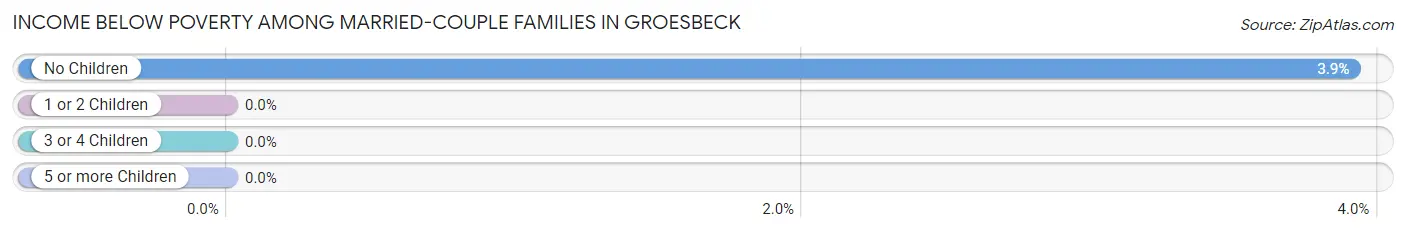
| Children | Above Poverty | Below Poverty |
| No Children | 761 (96.1%) | 31 (3.9%) |
| 1 or 2 Children | 391 (100.0%) | 0 (0.0%) |
| 3 or 4 Children | 164 (100.0%) | 0 (0.0%) |
| 5 or more Children | 0 (0.0%) | 0 (0.0%) |
| Total | 1,316 (97.7%) | 31 (2.3%) |
Income Below Poverty Among Single-Parent Households in Groesbeck
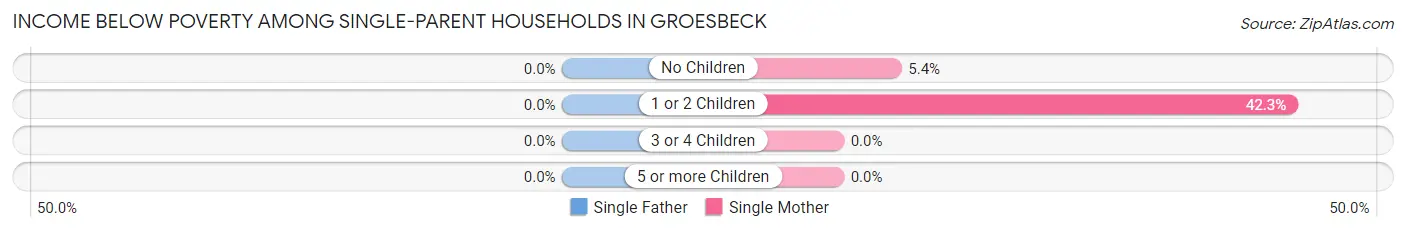
| Children | Single Father | Single Mother |
| No Children | 0 (0.0%) | 11 (5.4%) |
| 1 or 2 Children | 0 (0.0%) | 77 (42.3%) |
| 3 or 4 Children | 0 (0.0%) | 0 (0.0%) |
| 5 or more Children | 0 (0.0%) | 0 (0.0%) |
| Total | 0 (0.0%) | 88 (21.5%) |
Income Below Poverty Among Married-Couple vs Single-Parent Households in Groesbeck
The poverty data for Groesbeck shows that 31 of the married-couple family households (2.3%) and 88 of the single-parent households (10.4%) are living below the poverty level. Within the married-couple family households, those with no children have the highest poverty rate, with 31 households (3.9%) falling below the poverty line. Among the single-parent households, those with 1 or 2 children have the highest poverty rate, with 77 household (24.4%) living below poverty.
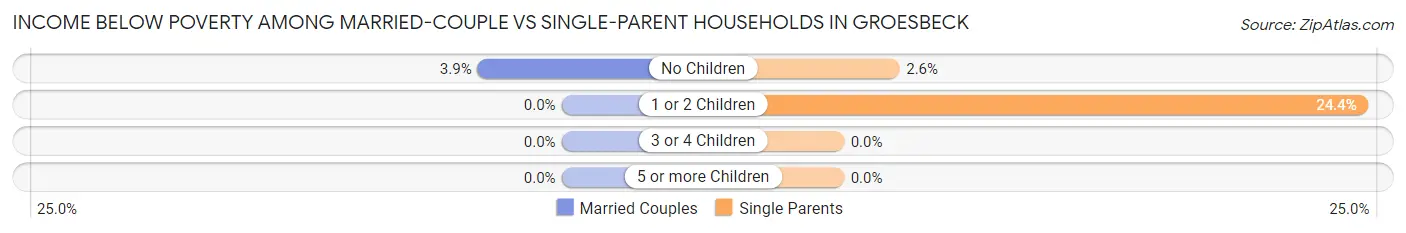
| Children | Married-Couple Families | Single-Parent Households |
| No Children | 31 (3.9%) | 11 (2.6%) |
| 1 or 2 Children | 0 (0.0%) | 77 (24.4%) |
| 3 or 4 Children | 0 (0.0%) | 0 (0.0%) |
| 5 or more Children | 0 (0.0%) | 0 (0.0%) |
| Total | 31 (2.3%) | 88 (10.4%) |
Employment Characteristics in Groesbeck
Employment by Class of Employer in Groesbeck
Among the 4,439 employed individuals in Groesbeck, private company employees (3,553 | 80.0%), local government employees (267 | 6.0%), and not-for-profit organizations (255 | 5.7%) make up the most common classes of employment.
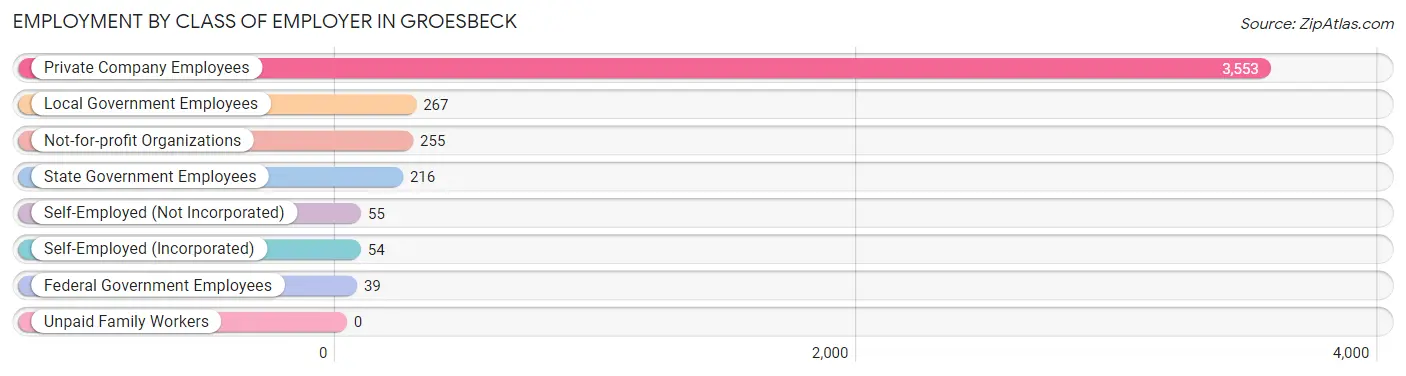
| Employer Class | # Employees | % Employees |
| Private Company Employees | 3,553 | 80.0% |
| Self-Employed (Incorporated) | 54 | 1.2% |
| Self-Employed (Not Incorporated) | 55 | 1.2% |
| Not-for-profit Organizations | 255 | 5.7% |
| Local Government Employees | 267 | 6.0% |
| State Government Employees | 216 | 4.9% |
| Federal Government Employees | 39 | 0.9% |
| Unpaid Family Workers | 0 | 0.0% |
| Total | 4,439 | 100.0% |
Employment Status by Age in Groesbeck
According to the labor force statistics for Groesbeck, out of the total population over 16 years of age (6,770), 68.4% or 4,631 individuals are in the labor force, with 2.9% or 134 of them unemployed. The age group with the highest labor force participation rate is 30 to 34 years, with 95.2% or 830 individuals in the labor force. Within the labor force, the 55 to 59 years age range has the highest percentage of unemployed individuals, with 19.4% or 127 of them being unemployed.
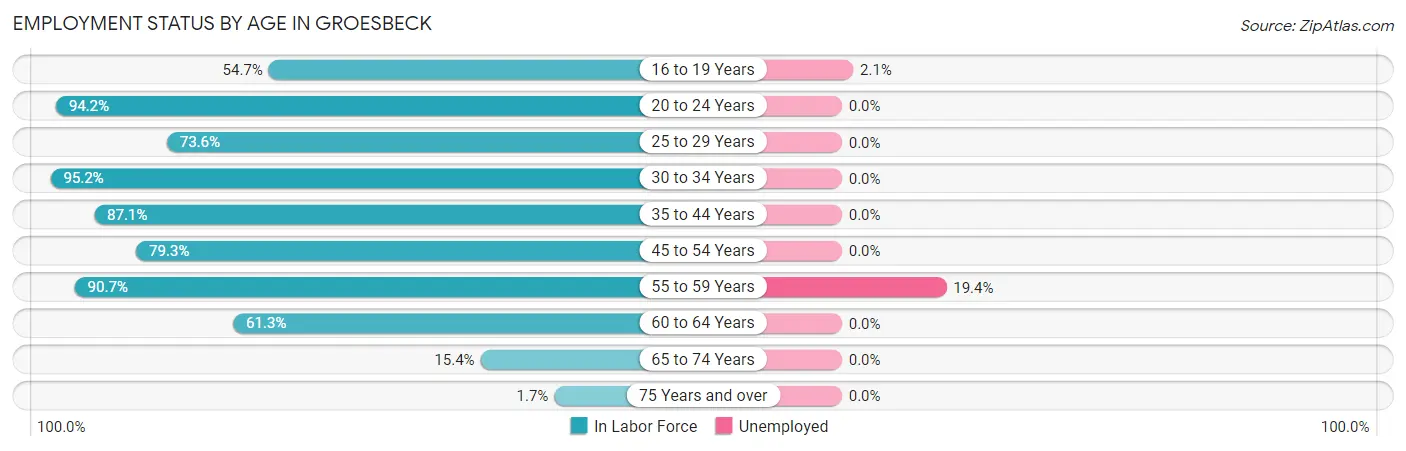
| Age Bracket | In Labor Force | Unemployed |
| 16 to 19 Years | 250 (54.7%) | 5 (2.1%) |
| 20 to 24 Years | 211 (94.2%) | 0 (0.0%) |
| 25 to 29 Years | 880 (73.6%) | 0 (0.0%) |
| 30 to 34 Years | 830 (95.2%) | 0 (0.0%) |
| 35 to 44 Years | 763 (87.1%) | 0 (0.0%) |
| 45 to 54 Years | 658 (79.3%) | 0 (0.0%) |
| 55 to 59 Years | 655 (90.7%) | 127 (19.4%) |
| 60 to 64 Years | 279 (61.3%) | 0 (0.0%) |
| 65 to 74 Years | 95 (15.4%) | 0 (0.0%) |
| 75 Years and over | 9 (1.7%) | 0 (0.0%) |
| Total | 4,631 (68.4%) | 134 (2.9%) |
Employment Status by Educational Attainment in Groesbeck
According to labor force statistics for Groesbeck, 82.1% of individuals (4,064) out of the total population between 25 and 64 years of age (4,950) are in the labor force, with 3.1% or 126 of them being unemployed. The group with the highest labor force participation rate are those with the educational attainment of college / associate degree, with 93.5% or 1,978 individuals in the labor force. Within the labor force, individuals with college / associate degree education have the highest percentage of unemployment, with 5.8% or 115 of them being unemployed.
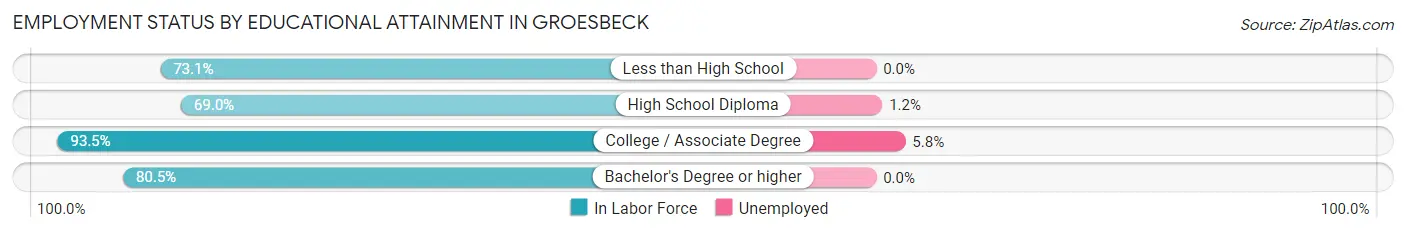
| Educational Attainment | In Labor Force | Unemployed |
| Less than High School | 128 (73.1%) | 0 (0.0%) |
| High School Diploma | 1,086 (69.0%) | 19 (1.2%) |
| College / Associate Degree | 1,978 (93.5%) | 123 (5.8%) |
| Bachelor's Degree or higher | 874 (80.5%) | 0 (0.0%) |
| Total | 4,064 (82.1%) | 153 (3.1%) |
Employment Occupations by Sex in Groesbeck
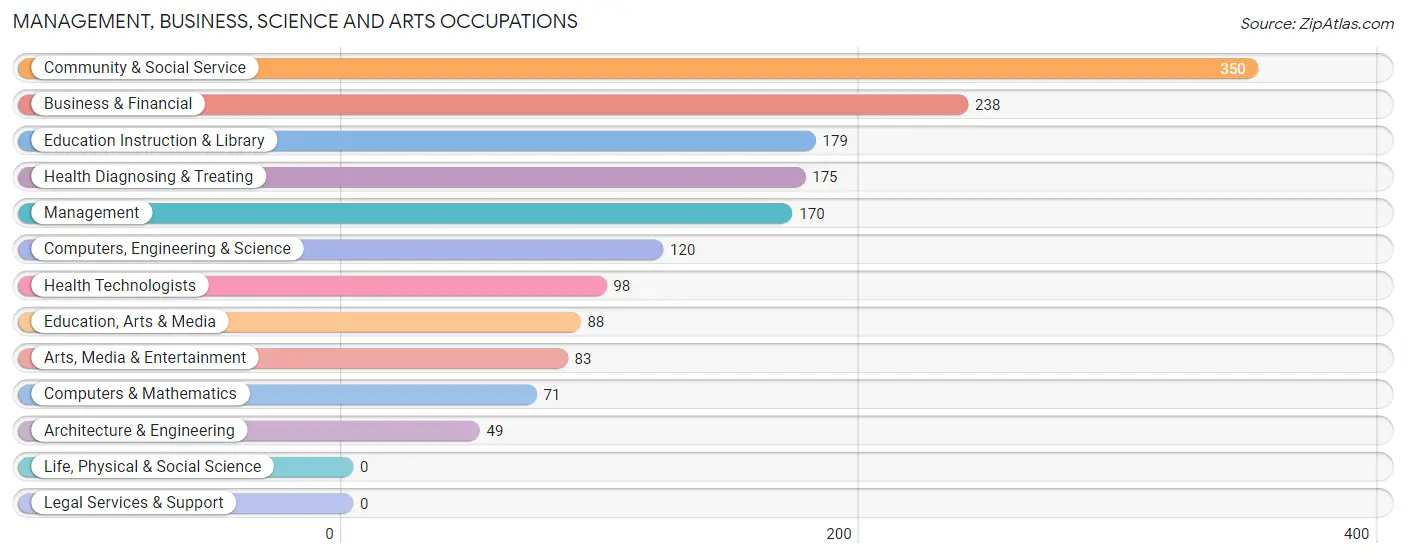
Management, Business, Science and Arts Occupations
The most common Management, Business, Science and Arts occupations in Groesbeck are Community & Social Service (350 | 7.8%), Business & Financial (238 | 5.3%), Education Instruction & Library (179 | 4.0%), Health Diagnosing & Treating (175 | 3.9%), and Management (170 | 3.8%).
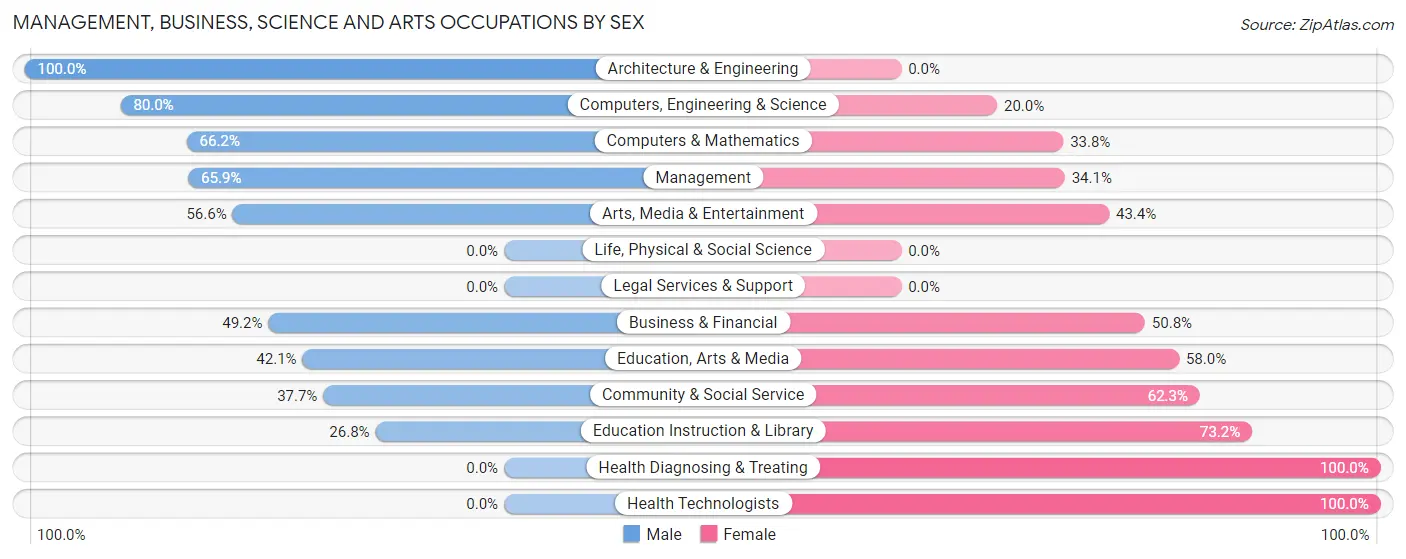
Management, Business, Science and Arts Occupations by Sex
Within the Management, Business, Science and Arts occupations in Groesbeck, the most male-oriented occupations are Architecture & Engineering (100.0%), Computers, Engineering & Science (80.0%), and Computers & Mathematics (66.2%), while the most female-oriented occupations are Health Diagnosing & Treating (100.0%), Health Technologists (100.0%), and Education Instruction & Library (73.2%).
| Occupation | Male | Female |
| Management | 112 (65.9%) | 58 (34.1%) |
| Business & Financial | 117 (49.2%) | 121 (50.8%) |
| Computers, Engineering & Science | 96 (80.0%) | 24 (20.0%) |
| Computers & Mathematics | 47 (66.2%) | 24 (33.8%) |
| Architecture & Engineering | 49 (100.0%) | 0 (0.0%) |
| Life, Physical & Social Science | 0 (0.0%) | 0 (0.0%) |
| Community & Social Service | 132 (37.7%) | 218 (62.3%) |
| Education, Arts & Media | 37 (42.0%) | 51 (58.0%) |
| Legal Services & Support | 0 (0.0%) | 0 (0.0%) |
| Education Instruction & Library | 48 (26.8%) | 131 (73.2%) |
| Arts, Media & Entertainment | 47 (56.6%) | 36 (43.4%) |
| Health Diagnosing & Treating | 0 (0.0%) | 175 (100.0%) |
| Health Technologists | 0 (0.0%) | 98 (100.0%) |
| Total (Category) | 457 (43.4%) | 596 (56.6%) |
| Total (Overall) | 2,099 (46.8%) | 2,389 (53.2%) |
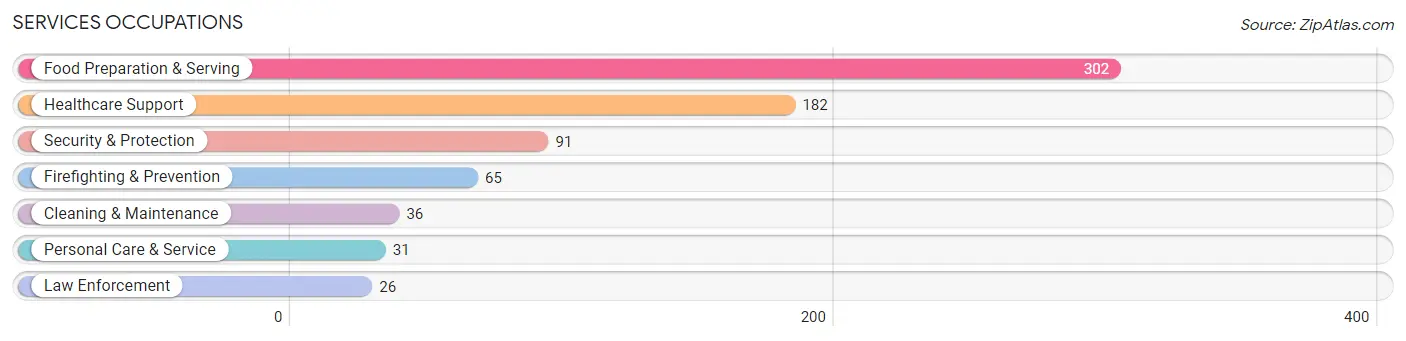
Services Occupations
The most common Services occupations in Groesbeck are Food Preparation & Serving (302 | 6.7%), Healthcare Support (182 | 4.1%), Security & Protection (91 | 2.0%), Firefighting & Prevention (65 | 1.5%), and Cleaning & Maintenance (36 | 0.8%).
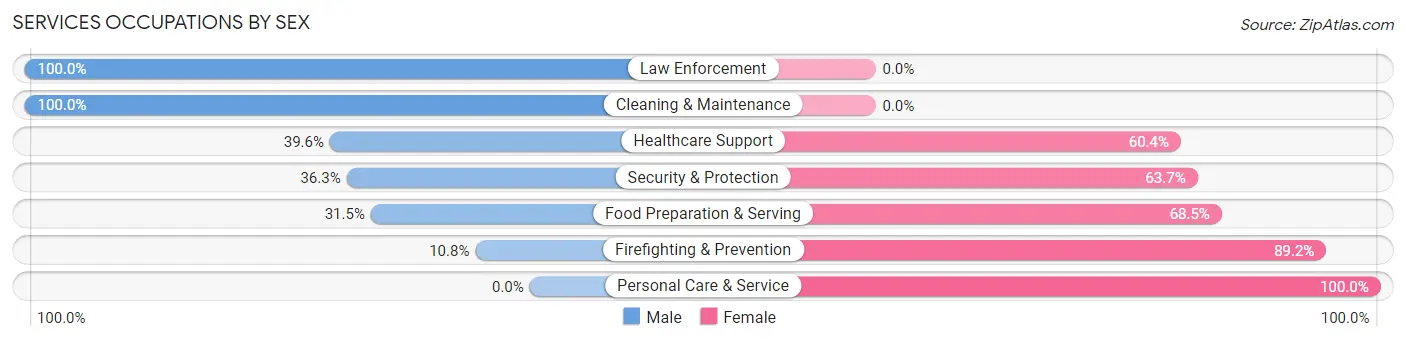
Services Occupations by Sex
Within the Services occupations in Groesbeck, the most male-oriented occupations are Law Enforcement (100.0%), Cleaning & Maintenance (100.0%), and Healthcare Support (39.6%), while the most female-oriented occupations are Personal Care & Service (100.0%), Firefighting & Prevention (89.2%), and Food Preparation & Serving (68.5%).
| Occupation | Male | Female |
| Healthcare Support | 72 (39.6%) | 110 (60.4%) |
| Security & Protection | 33 (36.3%) | 58 (63.7%) |
| Firefighting & Prevention | 7 (10.8%) | 58 (89.2%) |
| Law Enforcement | 26 (100.0%) | 0 (0.0%) |
| Food Preparation & Serving | 95 (31.5%) | 207 (68.5%) |
| Cleaning & Maintenance | 36 (100.0%) | 0 (0.0%) |
| Personal Care & Service | 0 (0.0%) | 31 (100.0%) |
| Total (Category) | 236 (36.8%) | 406 (63.2%) |
| Total (Overall) | 2,099 (46.8%) | 2,389 (53.2%) |
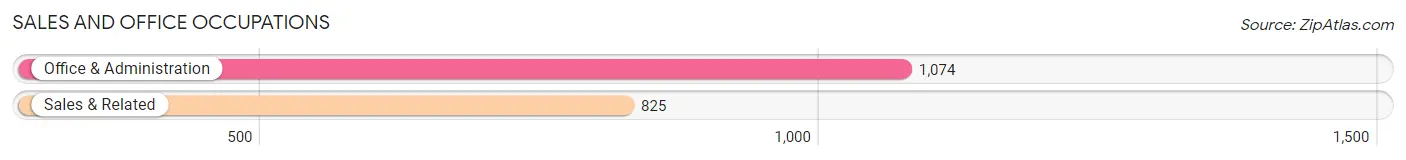
Sales and Office Occupations
The most common Sales and Office occupations in Groesbeck are Office & Administration (1,074 | 23.9%), and Sales & Related (825 | 18.4%).
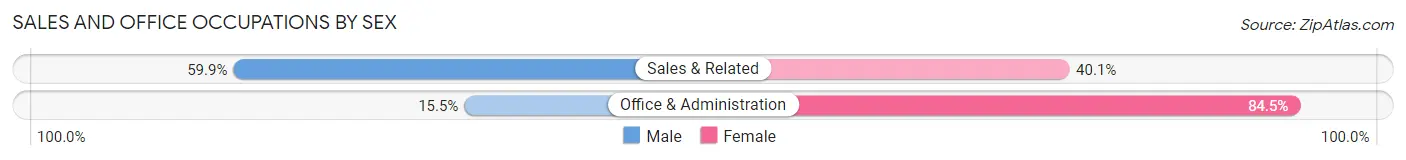
Sales and Office Occupations by Sex
| Occupation | Male | Female |
| Sales & Related | 494 (59.9%) | 331 (40.1%) |
| Office & Administration | 166 (15.5%) | 908 (84.5%) |
| Total (Category) | 660 (34.8%) | 1,239 (65.2%) |
| Total (Overall) | 2,099 (46.8%) | 2,389 (53.2%) |
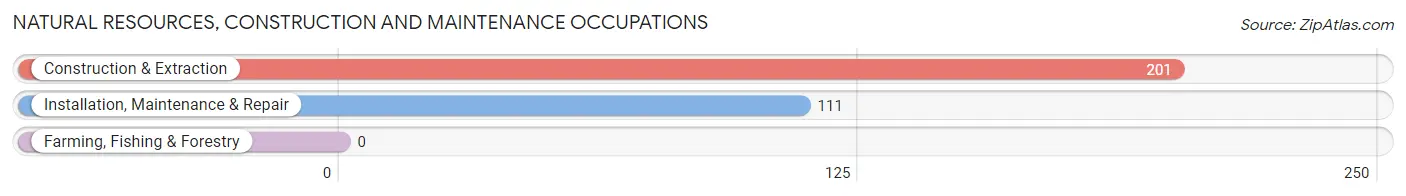
Natural Resources, Construction and Maintenance Occupations
The most common Natural Resources, Construction and Maintenance occupations in Groesbeck are Construction & Extraction (201 | 4.5%), and Installation, Maintenance & Repair (111 | 2.5%).
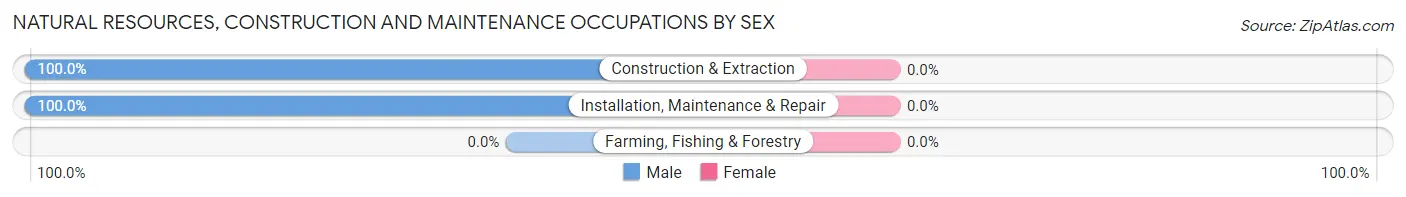
Natural Resources, Construction and Maintenance Occupations by Sex
| Occupation | Male | Female |
| Farming, Fishing & Forestry | 0 (0.0%) | 0 (0.0%) |
| Construction & Extraction | 201 (100.0%) | 0 (0.0%) |
| Installation, Maintenance & Repair | 111 (100.0%) | 0 (0.0%) |
| Total (Category) | 312 (100.0%) | 0 (0.0%) |
| Total (Overall) | 2,099 (46.8%) | 2,389 (53.2%) |
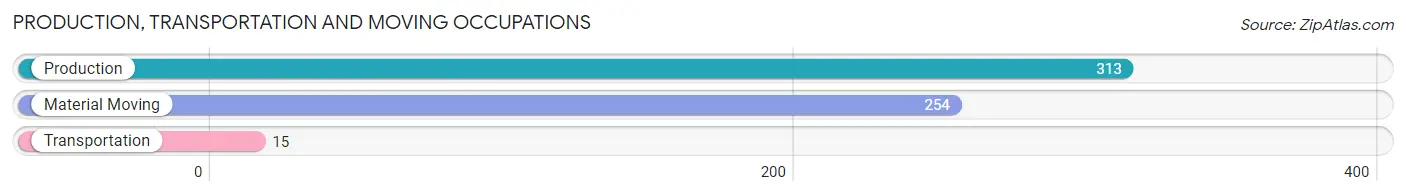
Production, Transportation and Moving Occupations
The most common Production, Transportation and Moving occupations in Groesbeck are Production (313 | 7.0%), Material Moving (254 | 5.7%), and Transportation (15 | 0.3%).
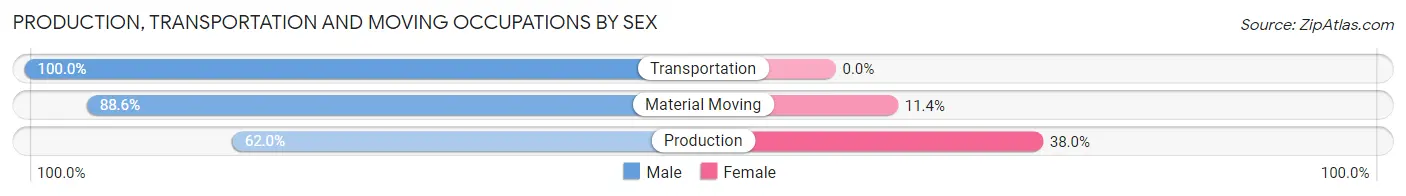
Production, Transportation and Moving Occupations by Sex
| Occupation | Male | Female |
| Production | 194 (62.0%) | 119 (38.0%) |
| Transportation | 15 (100.0%) | 0 (0.0%) |
| Material Moving | 225 (88.6%) | 29 (11.4%) |
| Total (Category) | 434 (74.6%) | 148 (25.4%) |
| Total (Overall) | 2,099 (46.8%) | 2,389 (53.2%) |
Employment Industries by Sex in Groesbeck
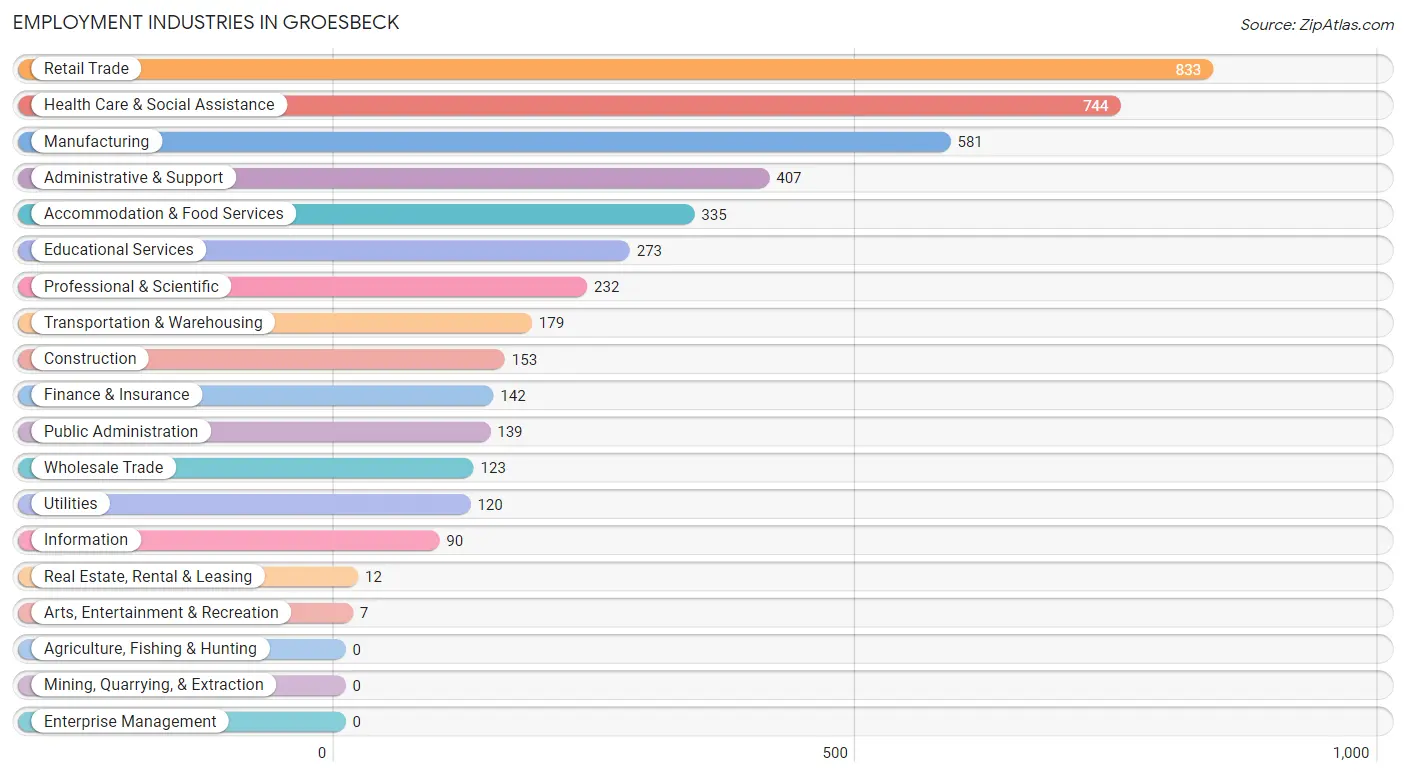
Employment Industries in Groesbeck
The major employment industries in Groesbeck include Retail Trade (833 | 18.6%), Health Care & Social Assistance (744 | 16.6%), Manufacturing (581 | 13.0%), Administrative & Support (407 | 9.1%), and Accommodation & Food Services (335 | 7.5%).
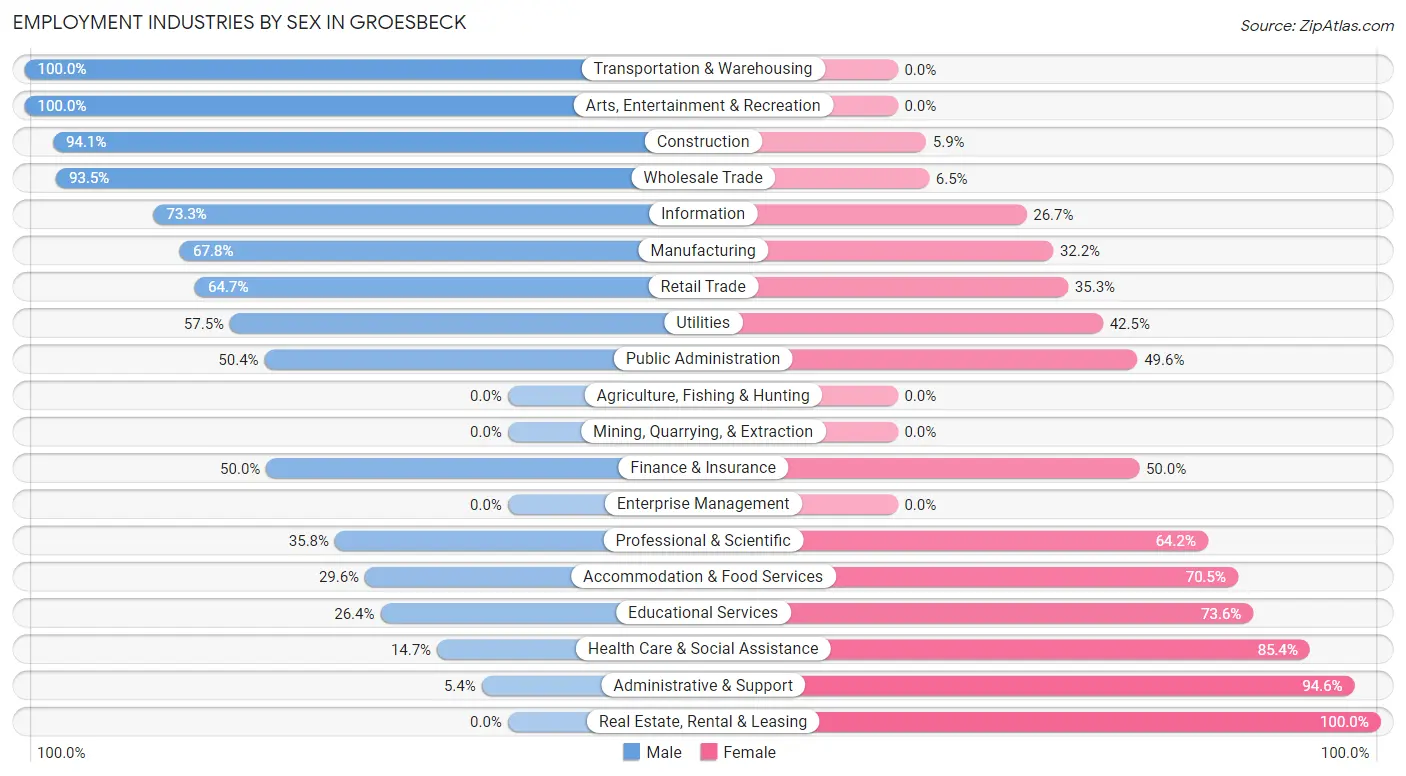
Employment Industries by Sex in Groesbeck
The Groesbeck industries that see more men than women are Transportation & Warehousing (100.0%), Arts, Entertainment & Recreation (100.0%), and Construction (94.1%), whereas the industries that tend to have a higher number of women are Real Estate, Rental & Leasing (100.0%), Administrative & Support (94.6%), and Health Care & Social Assistance (85.4%).
| Industry | Male | Female |
| Agriculture, Fishing & Hunting | 0 (0.0%) | 0 (0.0%) |
| Mining, Quarrying, & Extraction | 0 (0.0%) | 0 (0.0%) |
| Construction | 144 (94.1%) | 9 (5.9%) |
| Manufacturing | 394 (67.8%) | 187 (32.2%) |
| Wholesale Trade | 115 (93.5%) | 8 (6.5%) |
| Retail Trade | 539 (64.7%) | 294 (35.3%) |
| Transportation & Warehousing | 179 (100.0%) | 0 (0.0%) |
| Utilities | 69 (57.5%) | 51 (42.5%) |
| Information | 66 (73.3%) | 24 (26.7%) |
| Finance & Insurance | 71 (50.0%) | 71 (50.0%) |
| Real Estate, Rental & Leasing | 0 (0.0%) | 12 (100.0%) |
| Professional & Scientific | 83 (35.8%) | 149 (64.2%) |
| Enterprise Management | 0 (0.0%) | 0 (0.0%) |
| Administrative & Support | 22 (5.4%) | 385 (94.6%) |
| Educational Services | 72 (26.4%) | 201 (73.6%) |
| Health Care & Social Assistance | 109 (14.6%) | 635 (85.4%) |
| Arts, Entertainment & Recreation | 7 (100.0%) | 0 (0.0%) |
| Accommodation & Food Services | 99 (29.5%) | 236 (70.5%) |
| Public Administration | 70 (50.4%) | 69 (49.6%) |
| Total | 2,099 (46.8%) | 2,389 (53.2%) |
Education in Groesbeck
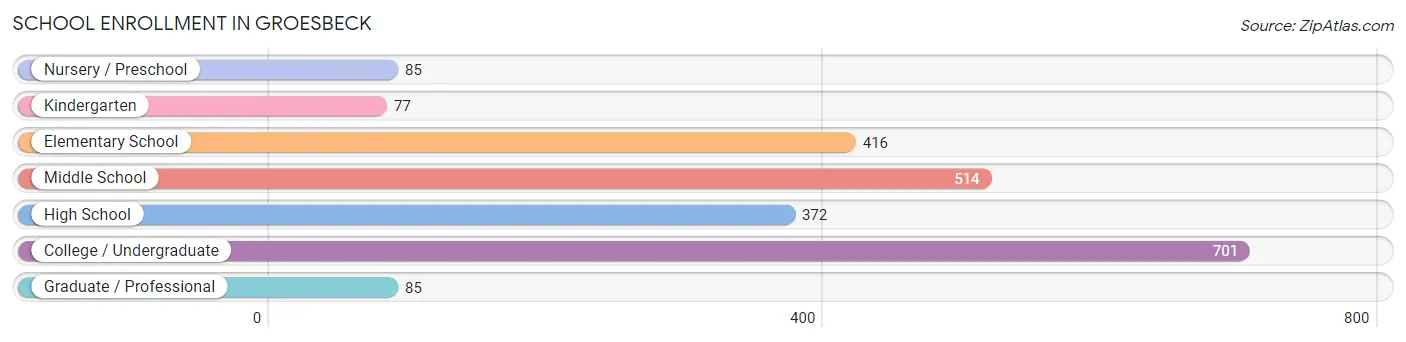
School Enrollment in Groesbeck
The most common levels of schooling among the 2,250 students in Groesbeck are college / undergraduate (701 | 31.2%), middle school (514 | 22.8%), and elementary school (416 | 18.5%).
| School Level | # Students | % Students |
| Nursery / Preschool | 85 | 3.8% |
| Kindergarten | 77 | 3.4% |
| Elementary School | 416 | 18.5% |
| Middle School | 514 | 22.8% |
| High School | 372 | 16.5% |
| College / Undergraduate | 701 | 31.2% |
| Graduate / Professional | 85 | 3.8% |
| Total | 2,250 | 100.0% |
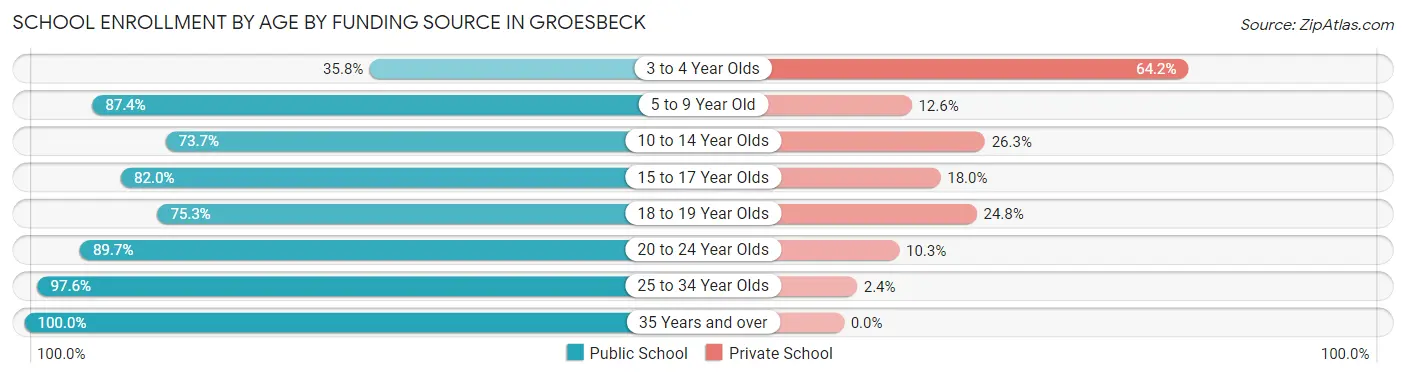
School Enrollment by Age by Funding Source in Groesbeck
Out of a total of 2,250 students who are enrolled in schools in Groesbeck, 394 (17.5%) attend a private institution, while the remaining 1,856 (82.5%) are enrolled in public schools. The age group of 3 to 4 year olds has the highest likelihood of being enrolled in private schools, with 43 (64.2% in the age bracket) enrolled. Conversely, the age group of 35 years and over has the lowest likelihood of being enrolled in a private school, with 82 (100.0% in the age bracket) attending a public institution.
| Age Bracket | Public School | Private School |
| 3 to 4 Year Olds | 24 (35.8%) | 43 (64.2%) |
| 5 to 9 Year Old | 332 (87.4%) | 48 (12.6%) |
| 10 to 14 Year Olds | 522 (73.7%) | 186 (26.3%) |
| 15 to 17 Year Olds | 196 (82.0%) | 43 (18.0%) |
| 18 to 19 Year Olds | 149 (75.2%) | 49 (24.7%) |
| 20 to 24 Year Olds | 113 (89.7%) | 13 (10.3%) |
| 25 to 34 Year Olds | 439 (97.6%) | 11 (2.4%) |
| 35 Years and over | 82 (100.0%) | 0 (0.0%) |
| Total | 1,856 (82.5%) | 394 (17.5%) |
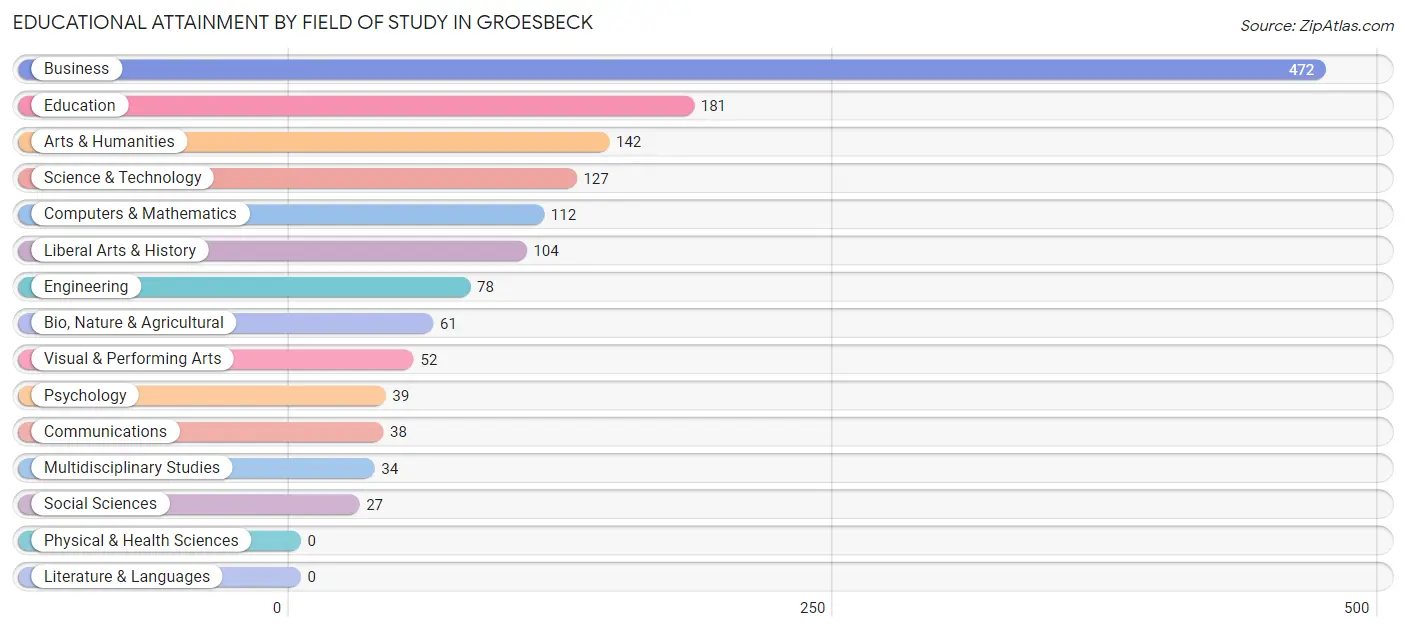
Educational Attainment by Field of Study in Groesbeck
Business (472 | 32.2%), education (181 | 12.3%), arts & humanities (142 | 9.7%), science & technology (127 | 8.7%), and computers & mathematics (112 | 7.6%) are the most common fields of study among 1,467 individuals in Groesbeck who have obtained a bachelor's degree or higher.
| Field of Study | # Graduates | % Graduates |
| Computers & Mathematics | 112 | 7.6% |
| Bio, Nature & Agricultural | 61 | 4.2% |
| Physical & Health Sciences | 0 | 0.0% |
| Psychology | 39 | 2.7% |
| Social Sciences | 27 | 1.8% |
| Engineering | 78 | 5.3% |
| Multidisciplinary Studies | 34 | 2.3% |
| Science & Technology | 127 | 8.7% |
| Business | 472 | 32.2% |
| Education | 181 | 12.3% |
| Literature & Languages | 0 | 0.0% |
| Liberal Arts & History | 104 | 7.1% |
| Visual & Performing Arts | 52 | 3.5% |
| Communications | 38 | 2.6% |
| Arts & Humanities | 142 | 9.7% |
| Total | 1,467 | 100.0% |
Transportation & Commute in Groesbeck
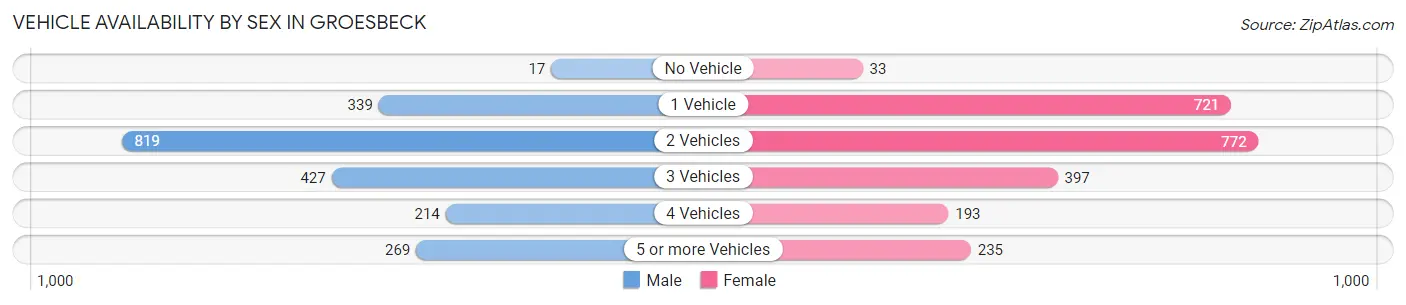
Vehicle Availability by Sex in Groesbeck
The most prevalent vehicle ownership categories in Groesbeck are males with 2 vehicles (819, accounting for 39.3%) and females with 2 vehicles (772, making up 34.8%).
| Vehicles Available | Male | Female |
| No Vehicle | 17 (0.8%) | 33 (1.4%) |
| 1 Vehicle | 339 (16.3%) | 721 (30.7%) |
| 2 Vehicles | 819 (39.3%) | 772 (32.8%) |
| 3 Vehicles | 427 (20.5%) | 397 (16.9%) |
| 4 Vehicles | 214 (10.3%) | 193 (8.2%) |
| 5 or more Vehicles | 269 (12.9%) | 235 (10.0%) |
| Total | 2,085 (100.0%) | 2,351 (100.0%) |
Commute Time in Groesbeck
The most frequently occuring commute durations in Groesbeck are 20 to 24 minutes (1,207 commuters, 28.6%), 30 to 34 minutes (535 commuters, 12.7%), and 25 to 29 minutes (530 commuters, 12.6%).
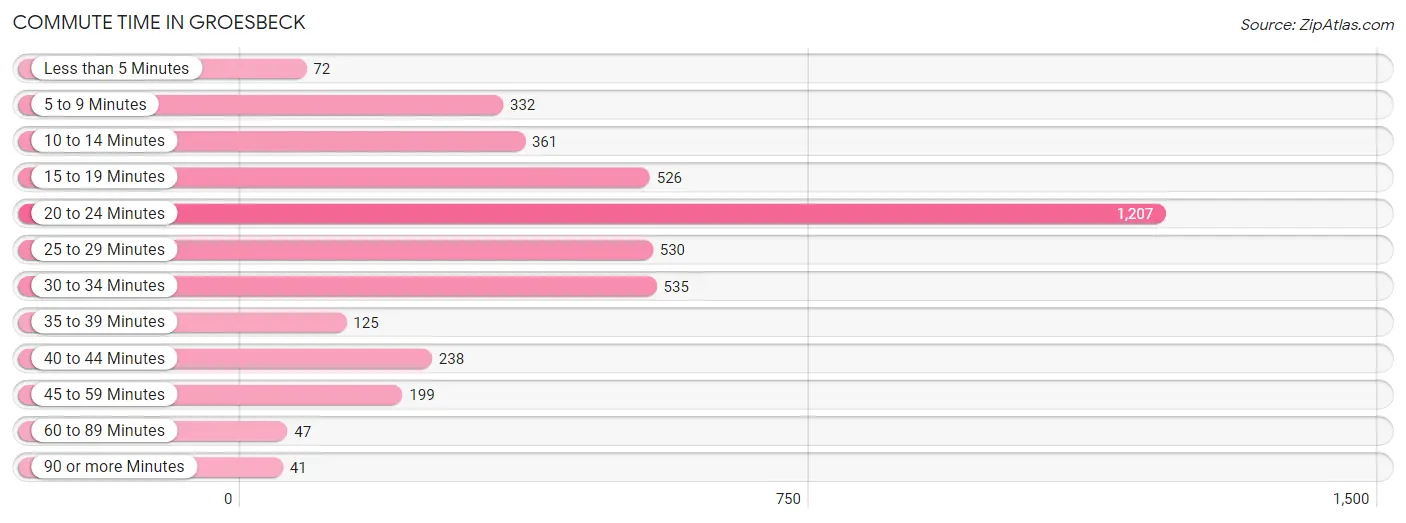
| Commute Time | # Commuters | % Commuters |
| Less than 5 Minutes | 72 | 1.7% |
| 5 to 9 Minutes | 332 | 7.9% |
| 10 to 14 Minutes | 361 | 8.6% |
| 15 to 19 Minutes | 526 | 12.5% |
| 20 to 24 Minutes | 1,207 | 28.6% |
| 25 to 29 Minutes | 530 | 12.6% |
| 30 to 34 Minutes | 535 | 12.7% |
| 35 to 39 Minutes | 125 | 3.0% |
| 40 to 44 Minutes | 238 | 5.7% |
| 45 to 59 Minutes | 199 | 4.7% |
| 60 to 89 Minutes | 47 | 1.1% |
| 90 or more Minutes | 41 | 1.0% |
Commute Time by Sex in Groesbeck
The most common commute times in Groesbeck are 30 to 34 minutes (300 commuters, 14.9%) for males and 20 to 24 minutes (933 commuters, 42.3%) for females.
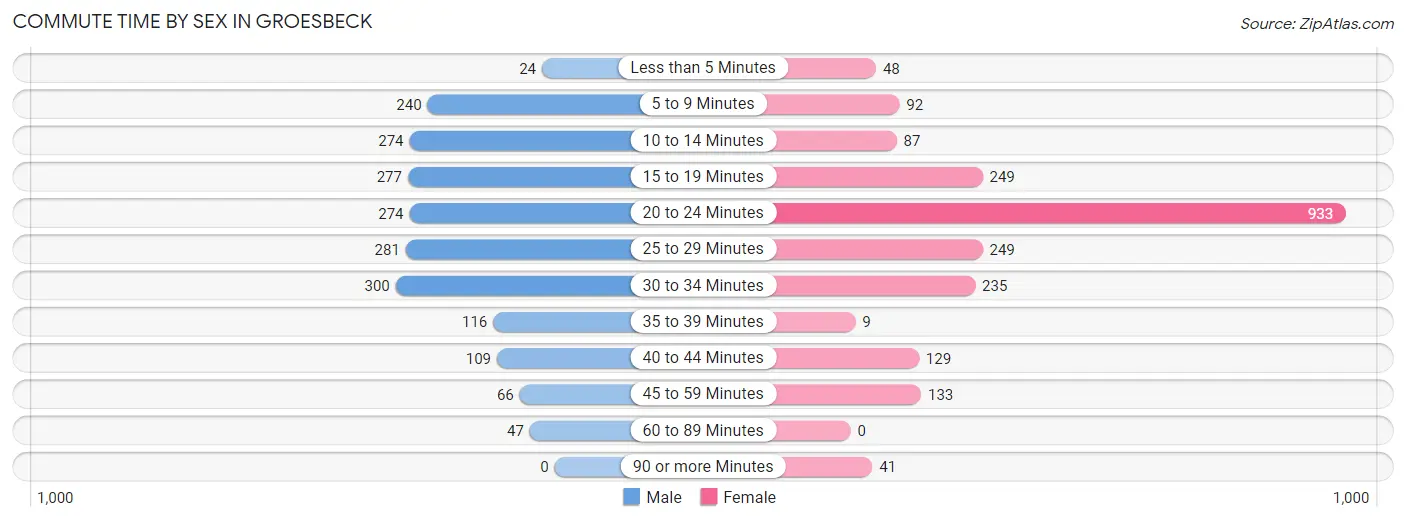
| Commute Time | Male | Female |
| Less than 5 Minutes | 24 (1.2%) | 48 (2.2%) |
| 5 to 9 Minutes | 240 (11.9%) | 92 (4.2%) |
| 10 to 14 Minutes | 274 (13.7%) | 87 (4.0%) |
| 15 to 19 Minutes | 277 (13.8%) | 249 (11.3%) |
| 20 to 24 Minutes | 274 (13.7%) | 933 (42.3%) |
| 25 to 29 Minutes | 281 (14.0%) | 249 (11.3%) |
| 30 to 34 Minutes | 300 (14.9%) | 235 (10.7%) |
| 35 to 39 Minutes | 116 (5.8%) | 9 (0.4%) |
| 40 to 44 Minutes | 109 (5.4%) | 129 (5.9%) |
| 45 to 59 Minutes | 66 (3.3%) | 133 (6.0%) |
| 60 to 89 Minutes | 47 (2.3%) | 0 (0.0%) |
| 90 or more Minutes | 0 (0.0%) | 41 (1.9%) |
Time of Departure to Work by Sex in Groesbeck
The most frequent times of departure to work in Groesbeck are 6:30 AM to 6:59 AM (319, 15.9%) for males and 7:00 AM to 7:29 AM (886, 40.2%) for females.
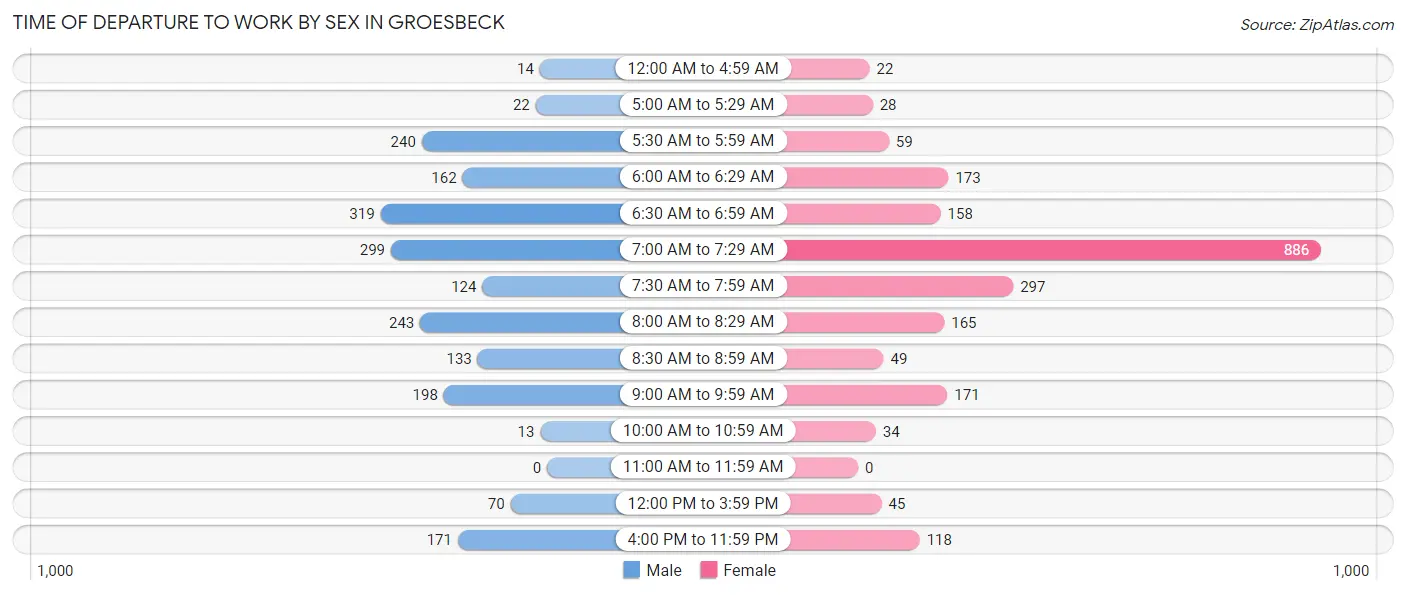
| Time of Departure | Male | Female |
| 12:00 AM to 4:59 AM | 14 (0.7%) | 22 (1.0%) |
| 5:00 AM to 5:29 AM | 22 (1.1%) | 28 (1.3%) |
| 5:30 AM to 5:59 AM | 240 (11.9%) | 59 (2.7%) |
| 6:00 AM to 6:29 AM | 162 (8.1%) | 173 (7.9%) |
| 6:30 AM to 6:59 AM | 319 (15.9%) | 158 (7.2%) |
| 7:00 AM to 7:29 AM | 299 (14.9%) | 886 (40.2%) |
| 7:30 AM to 7:59 AM | 124 (6.2%) | 297 (13.5%) |
| 8:00 AM to 8:29 AM | 243 (12.1%) | 165 (7.5%) |
| 8:30 AM to 8:59 AM | 133 (6.6%) | 49 (2.2%) |
| 9:00 AM to 9:59 AM | 198 (9.9%) | 171 (7.8%) |
| 10:00 AM to 10:59 AM | 13 (0.6%) | 34 (1.5%) |
| 11:00 AM to 11:59 AM | 0 (0.0%) | 0 (0.0%) |
| 12:00 PM to 3:59 PM | 70 (3.5%) | 45 (2.0%) |
| 4:00 PM to 11:59 PM | 171 (8.5%) | 118 (5.3%) |
| Total | 2,008 (100.0%) | 2,205 (100.0%) |
Housing Occupancy in Groesbeck
Occupancy by Ownership in Groesbeck
Of the total 3,324 dwellings in Groesbeck, owner-occupied units account for 2,120 (63.8%), while renter-occupied units make up 1,204 (36.2%).
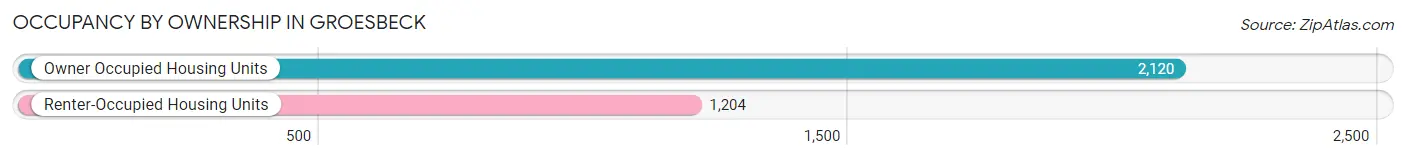
| Occupancy | # Housing Units | % Housing Units |
| Owner Occupied Housing Units | 2,120 | 63.8% |
| Renter-Occupied Housing Units | 1,204 | 36.2% |
| Total Occupied Housing Units | 3,324 | 100.0% |
Occupancy by Household Size in Groesbeck
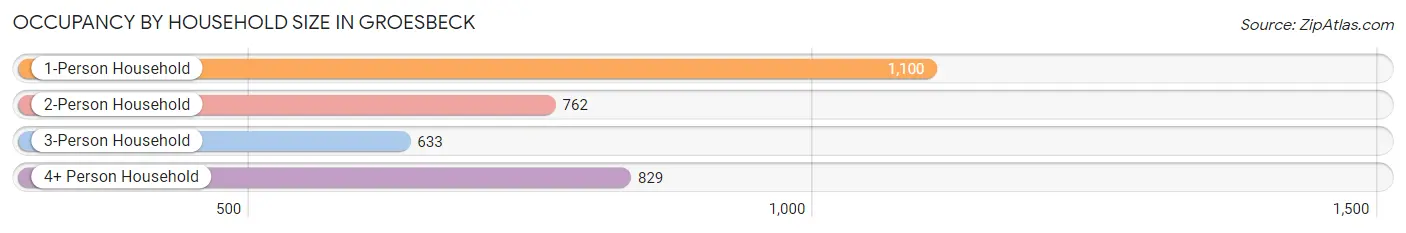
| Household Size | # Housing Units | % Housing Units |
| 1-Person Household | 1,100 | 33.1% |
| 2-Person Household | 762 | 22.9% |
| 3-Person Household | 633 | 19.0% |
| 4+ Person Household | 829 | 24.9% |
| Total Housing Units | 3,324 | 100.0% |
Occupancy by Ownership by Household Size in Groesbeck
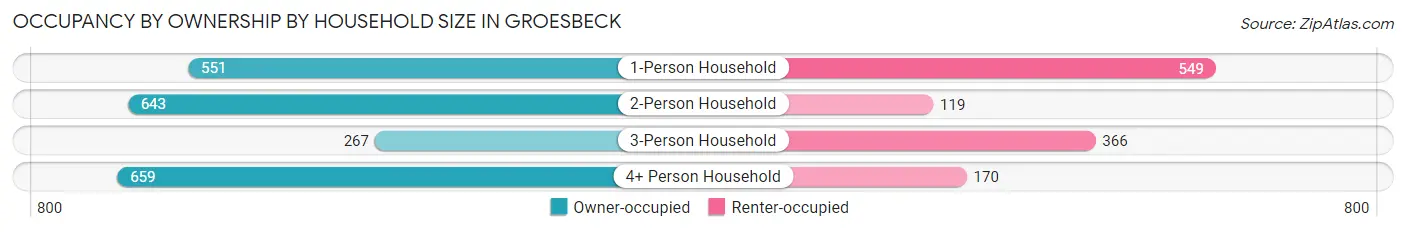
| Household Size | Owner-occupied | Renter-occupied |
| 1-Person Household | 551 (50.1%) | 549 (49.9%) |
| 2-Person Household | 643 (84.4%) | 119 (15.6%) |
| 3-Person Household | 267 (42.2%) | 366 (57.8%) |
| 4+ Person Household | 659 (79.5%) | 170 (20.5%) |
| Total Housing Units | 2,120 (63.8%) | 1,204 (36.2%) |
Occupancy by Educational Attainment in Groesbeck
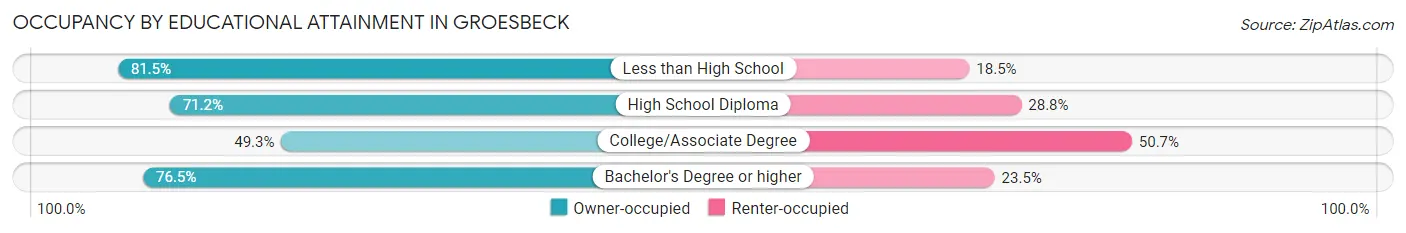
| Household Size | Owner-occupied | Renter-occupied |
| Less than High School | 119 (81.5%) | 27 (18.5%) |
| High School Diploma | 579 (71.2%) | 234 (28.8%) |
| College/Associate Degree | 702 (49.3%) | 722 (50.7%) |
| Bachelor's Degree or higher | 720 (76.5%) | 221 (23.5%) |
Occupancy by Age of Householder in Groesbeck
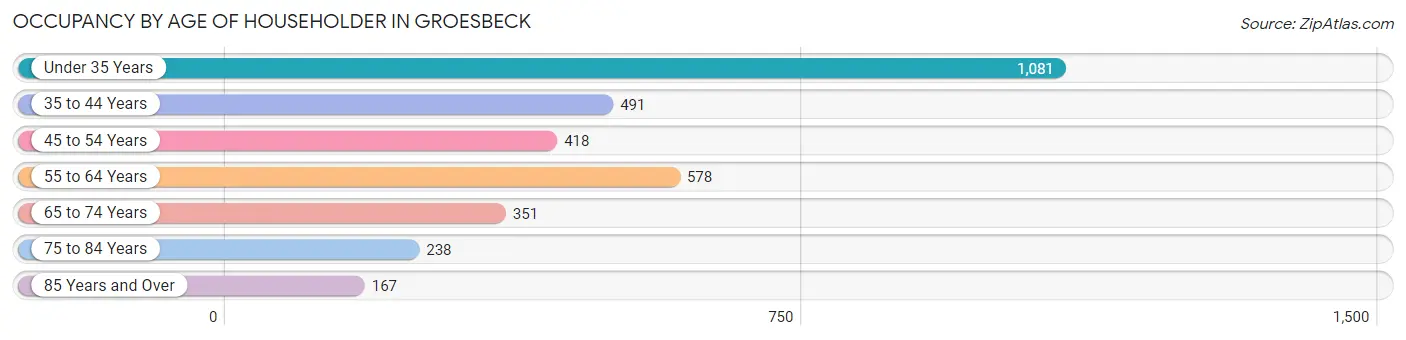
| Age Bracket | # Households | % Households |
| Under 35 Years | 1,081 | 32.5% |
| 35 to 44 Years | 491 | 14.8% |
| 45 to 54 Years | 418 | 12.6% |
| 55 to 64 Years | 578 | 17.4% |
| 65 to 74 Years | 351 | 10.6% |
| 75 to 84 Years | 238 | 7.2% |
| 85 Years and Over | 167 | 5.0% |
| Total | 3,324 | 100.0% |
Housing Finances in Groesbeck
Median Income by Occupancy in Groesbeck
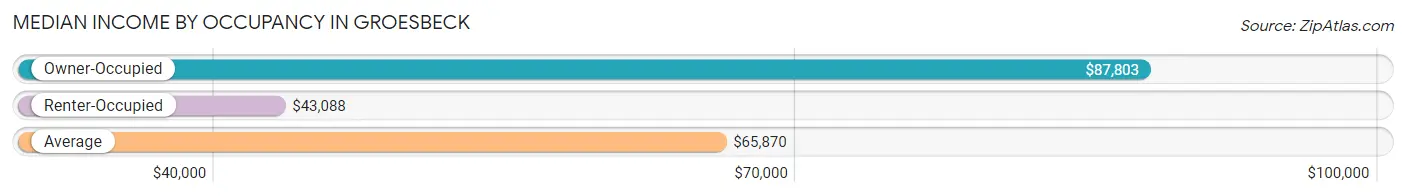
| Occupancy Type | # Households | Median Income |
| Owner-Occupied | 2,120 (63.8%) | $87,803 |
| Renter-Occupied | 1,204 (36.2%) | $43,088 |
| Average | 3,324 (100.0%) | $65,870 |
Occupancy by Householder Income Bracket in Groesbeck
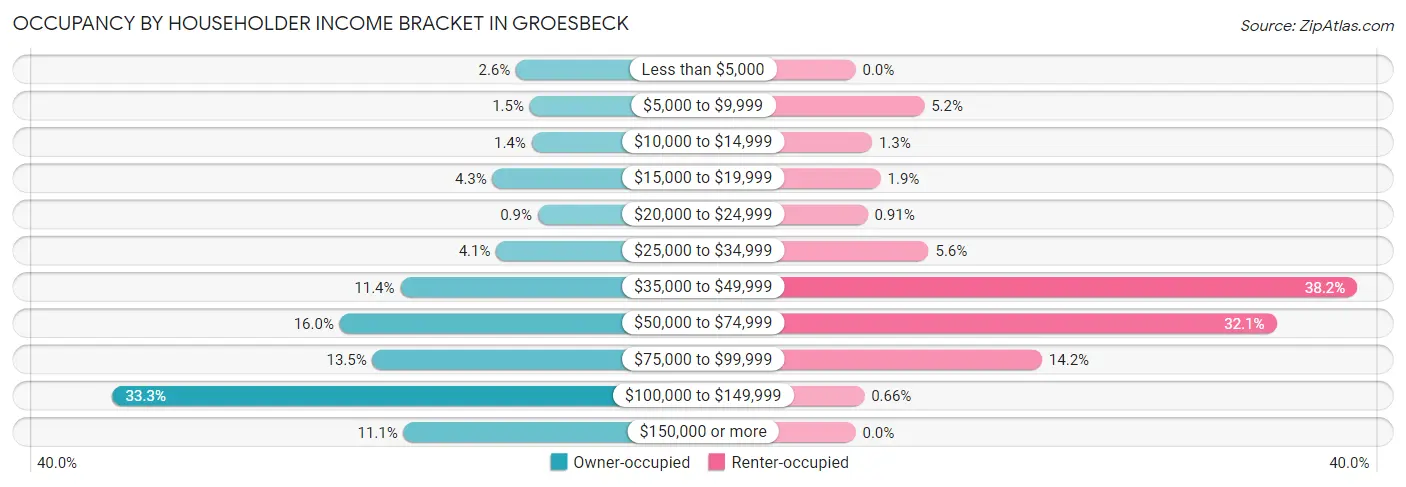
| Income Bracket | Owner-occupied | Renter-occupied |
| Less than $5,000 | 54 (2.5%) | 0 (0.0%) |
| $5,000 to $9,999 | 32 (1.5%) | 63 (5.2%) |
| $10,000 to $14,999 | 29 (1.4%) | 15 (1.3%) |
| $15,000 to $19,999 | 92 (4.3%) | 23 (1.9%) |
| $20,000 to $24,999 | 19 (0.9%) | 11 (0.9%) |
| $25,000 to $34,999 | 86 (4.1%) | 67 (5.6%) |
| $35,000 to $49,999 | 241 (11.4%) | 460 (38.2%) |
| $50,000 to $74,999 | 339 (16.0%) | 386 (32.1%) |
| $75,000 to $99,999 | 286 (13.5%) | 171 (14.2%) |
| $100,000 to $149,999 | 706 (33.3%) | 8 (0.7%) |
| $150,000 or more | 236 (11.1%) | 0 (0.0%) |
| Total | 2,120 (100.0%) | 1,204 (100.0%) |
Monthly Housing Cost Tiers in Groesbeck
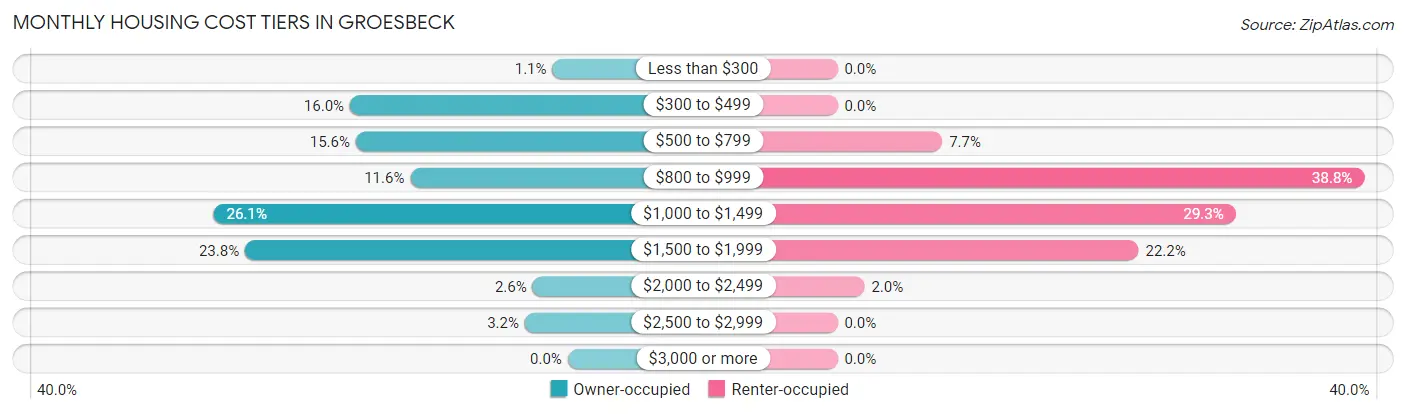
| Monthly Cost | Owner-occupied | Renter-occupied |
| Less than $300 | 24 (1.1%) | 0 (0.0%) |
| $300 to $499 | 340 (16.0%) | 0 (0.0%) |
| $500 to $799 | 331 (15.6%) | 93 (7.7%) |
| $800 to $999 | 246 (11.6%) | 467 (38.8%) |
| $1,000 to $1,499 | 553 (26.1%) | 353 (29.3%) |
| $1,500 to $1,999 | 504 (23.8%) | 267 (22.2%) |
| $2,000 to $2,499 | 55 (2.6%) | 24 (2.0%) |
| $2,500 to $2,999 | 67 (3.2%) | 0 (0.0%) |
| $3,000 or more | 0 (0.0%) | 0 (0.0%) |
| Total | 2,120 (100.0%) | 1,204 (100.0%) |
Physical Housing Characteristics in Groesbeck
Housing Structures in Groesbeck
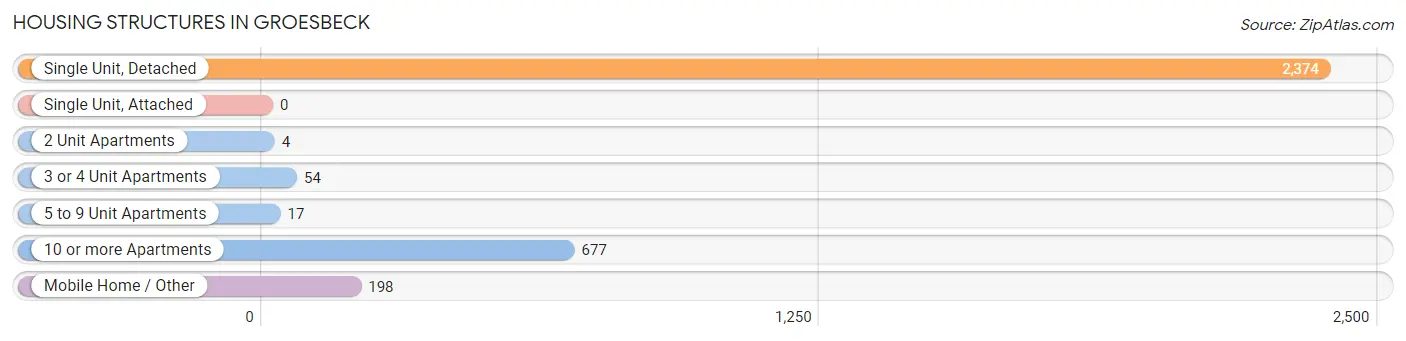
| Structure Type | # Housing Units | % Housing Units |
| Single Unit, Detached | 2,374 | 71.4% |
| Single Unit, Attached | 0 | 0.0% |
| 2 Unit Apartments | 4 | 0.1% |
| 3 or 4 Unit Apartments | 54 | 1.6% |
| 5 to 9 Unit Apartments | 17 | 0.5% |
| 10 or more Apartments | 677 | 20.4% |
| Mobile Home / Other | 198 | 6.0% |
| Total | 3,324 | 100.0% |
Housing Structures by Occupancy in Groesbeck
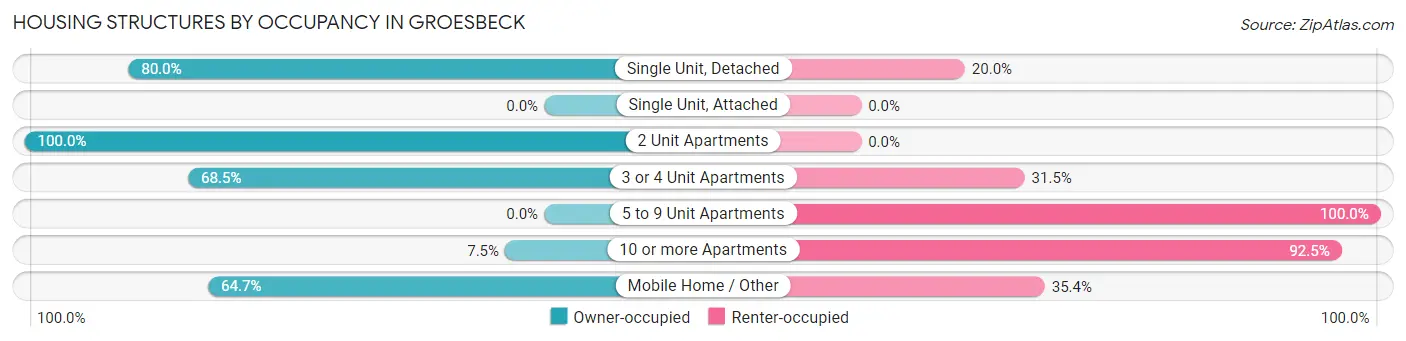
| Structure Type | Owner-occupied | Renter-occupied |
| Single Unit, Detached | 1,900 (80.0%) | 474 (20.0%) |
| Single Unit, Attached | 0 (0.0%) | 0 (0.0%) |
| 2 Unit Apartments | 4 (100.0%) | 0 (0.0%) |
| 3 or 4 Unit Apartments | 37 (68.5%) | 17 (31.5%) |
| 5 to 9 Unit Apartments | 0 (0.0%) | 17 (100.0%) |
| 10 or more Apartments | 51 (7.5%) | 626 (92.5%) |
| Mobile Home / Other | 128 (64.6%) | 70 (35.3%) |
| Total | 2,120 (63.8%) | 1,204 (36.2%) |
Housing Structures by Number of Rooms in Groesbeck
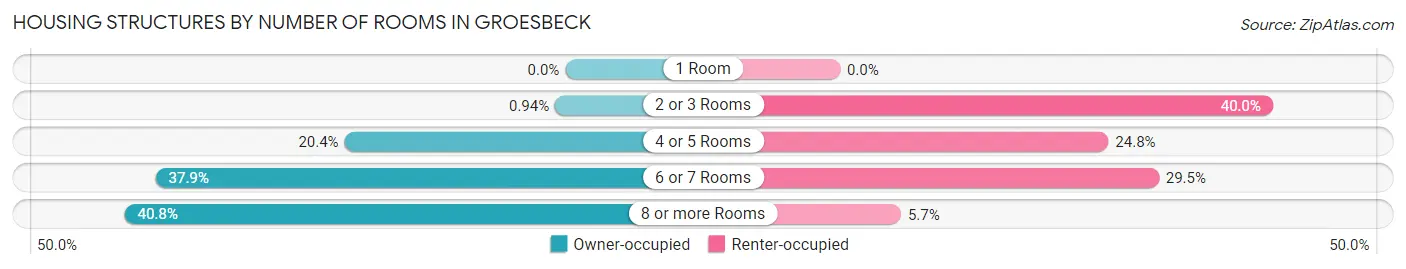
| Number of Rooms | Owner-occupied | Renter-occupied |
| 1 Room | 0 (0.0%) | 0 (0.0%) |
| 2 or 3 Rooms | 20 (0.9%) | 482 (40.0%) |
| 4 or 5 Rooms | 433 (20.4%) | 299 (24.8%) |
| 6 or 7 Rooms | 803 (37.9%) | 355 (29.5%) |
| 8 or more Rooms | 864 (40.7%) | 68 (5.7%) |
| Total | 2,120 (100.0%) | 1,204 (100.0%) |
Housing Structure by Heating Type in Groesbeck
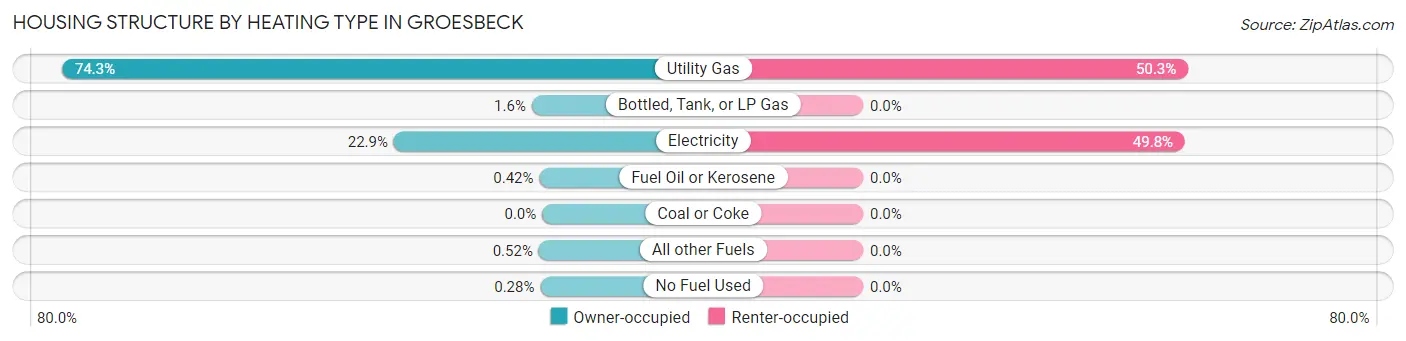
| Heating Type | Owner-occupied | Renter-occupied |
| Utility Gas | 1,574 (74.3%) | 605 (50.2%) |
| Bottled, Tank, or LP Gas | 34 (1.6%) | 0 (0.0%) |
| Electricity | 486 (22.9%) | 599 (49.7%) |
| Fuel Oil or Kerosene | 9 (0.4%) | 0 (0.0%) |
| Coal or Coke | 0 (0.0%) | 0 (0.0%) |
| All other Fuels | 11 (0.5%) | 0 (0.0%) |
| No Fuel Used | 6 (0.3%) | 0 (0.0%) |
| Total | 2,120 (100.0%) | 1,204 (100.0%) |
Household Vehicle Usage in Groesbeck
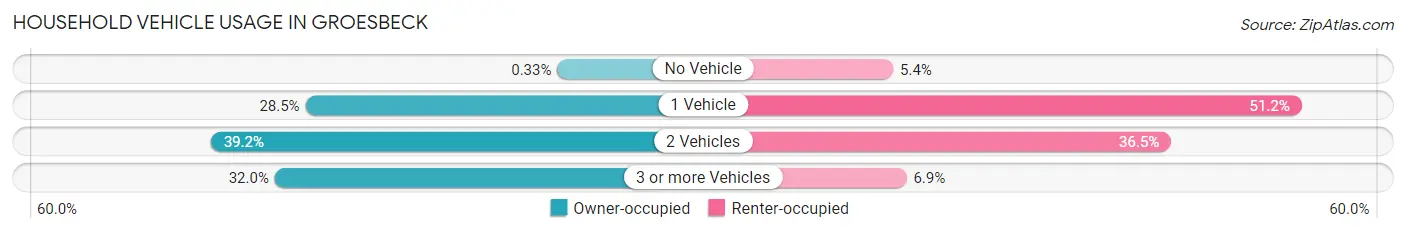
| Vehicles per Household | Owner-occupied | Renter-occupied |
| No Vehicle | 7 (0.3%) | 65 (5.4%) |
| 1 Vehicle | 605 (28.5%) | 616 (51.2%) |
| 2 Vehicles | 830 (39.2%) | 440 (36.5%) |
| 3 or more Vehicles | 678 (32.0%) | 83 (6.9%) |
| Total | 2,120 (100.0%) | 1,204 (100.0%) |
Real Estate & Mortgages in Groesbeck
Real Estate and Mortgage Overview in Groesbeck
| Characteristic | Without Mortgage | With Mortgage |
| Housing Units | 839 | 1,281 |
| Median Property Value | $149,300 | $208,900 |
| Median Household Income | $54,256 | $140 |
| Monthly Housing Costs | $565 | $0 |
| Real Estate Taxes | $2,612 | $26 |
Property Value by Mortgage Status in Groesbeck
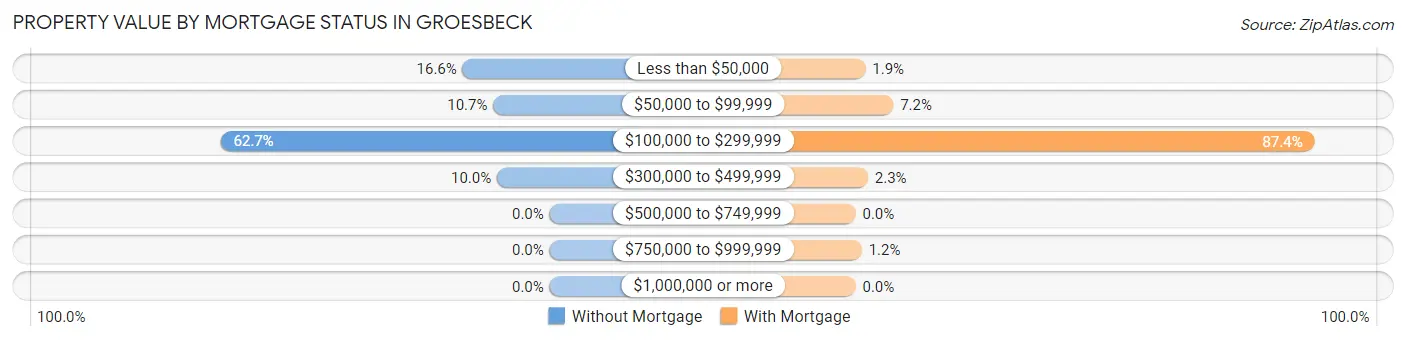
| Property Value | Without Mortgage | With Mortgage |
| Less than $50,000 | 139 (16.6%) | 24 (1.9%) |
| $50,000 to $99,999 | 90 (10.7%) | 92 (7.2%) |
| $100,000 to $299,999 | 526 (62.7%) | 1,120 (87.4%) |
| $300,000 to $499,999 | 84 (10.0%) | 30 (2.3%) |
| $500,000 to $749,999 | 0 (0.0%) | 0 (0.0%) |
| $750,000 to $999,999 | 0 (0.0%) | 15 (1.2%) |
| $1,000,000 or more | 0 (0.0%) | 0 (0.0%) |
| Total | 839 (100.0%) | 1,281 (100.0%) |
Household Income by Mortgage Status in Groesbeck
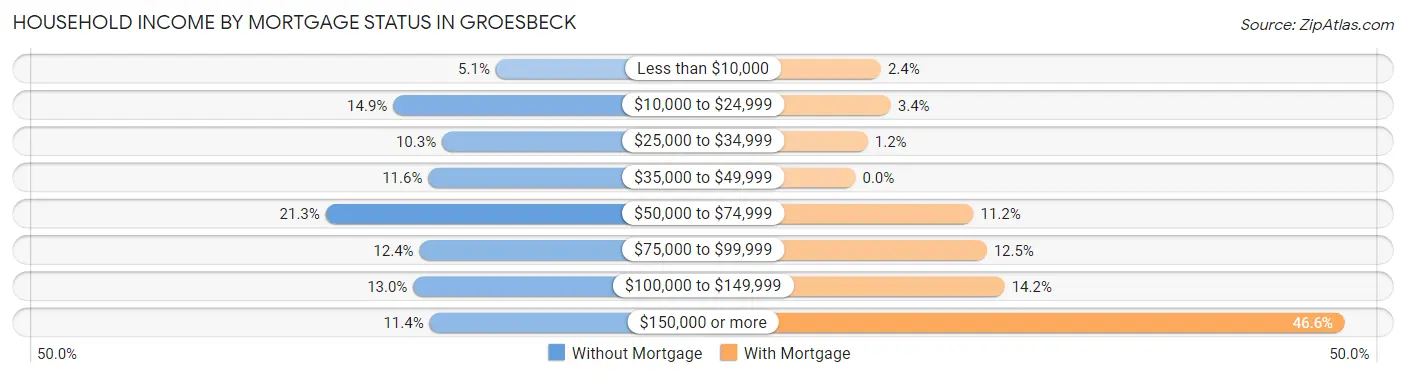
| Household Income | Without Mortgage | With Mortgage |
| Less than $10,000 | 43 (5.1%) | 31 (2.4%) |
| $10,000 to $24,999 | 125 (14.9%) | 43 (3.4%) |
| $25,000 to $34,999 | 86 (10.2%) | 15 (1.2%) |
| $35,000 to $49,999 | 97 (11.6%) | 0 (0.0%) |
| $50,000 to $74,999 | 179 (21.3%) | 144 (11.2%) |
| $75,000 to $99,999 | 104 (12.4%) | 160 (12.5%) |
| $100,000 to $149,999 | 109 (13.0%) | 182 (14.2%) |
| $150,000 or more | 96 (11.4%) | 597 (46.6%) |
| Total | 839 (100.0%) | 1,281 (100.0%) |
Property Value to Household Income Ratio in Groesbeck
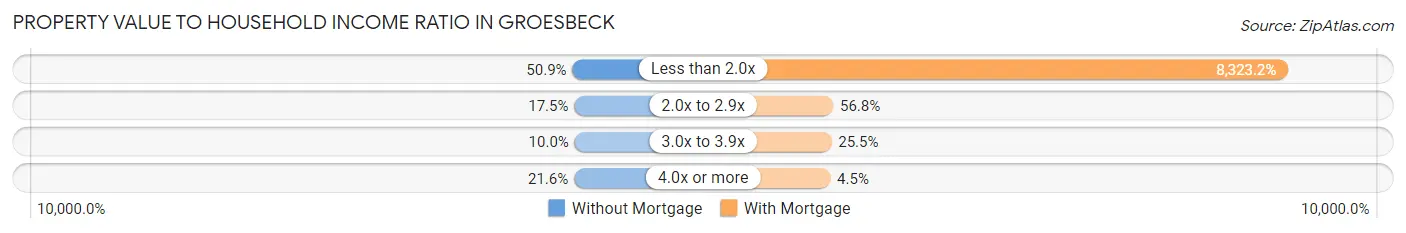
| Value-to-Income Ratio | Without Mortgage | With Mortgage |
| Less than 2.0x | 427 (50.9%) | 106,620 (8,323.2%) |
| 2.0x to 2.9x | 147 (17.5%) | 727 (56.8%) |
| 3.0x to 3.9x | 84 (10.0%) | 327 (25.5%) |
| 4.0x or more | 181 (21.6%) | 58 (4.5%) |
| Total | 839 (100.0%) | 1,281 (100.0%) |
Real Estate Taxes by Mortgage Status in Groesbeck
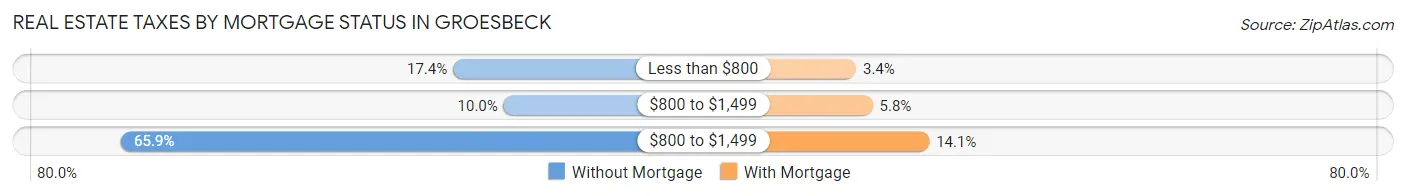
| Property Taxes | Without Mortgage | With Mortgage |
| Less than $800 | 146 (17.4%) | 43 (3.4%) |
| $800 to $1,499 | 84 (10.0%) | 74 (5.8%) |
| $800 to $1,499 | 553 (65.9%) | 180 (14.1%) |
| Total | 839 (100.0%) | 1,281 (100.0%) |
Health & Disability in Groesbeck
Health Insurance Coverage by Age in Groesbeck
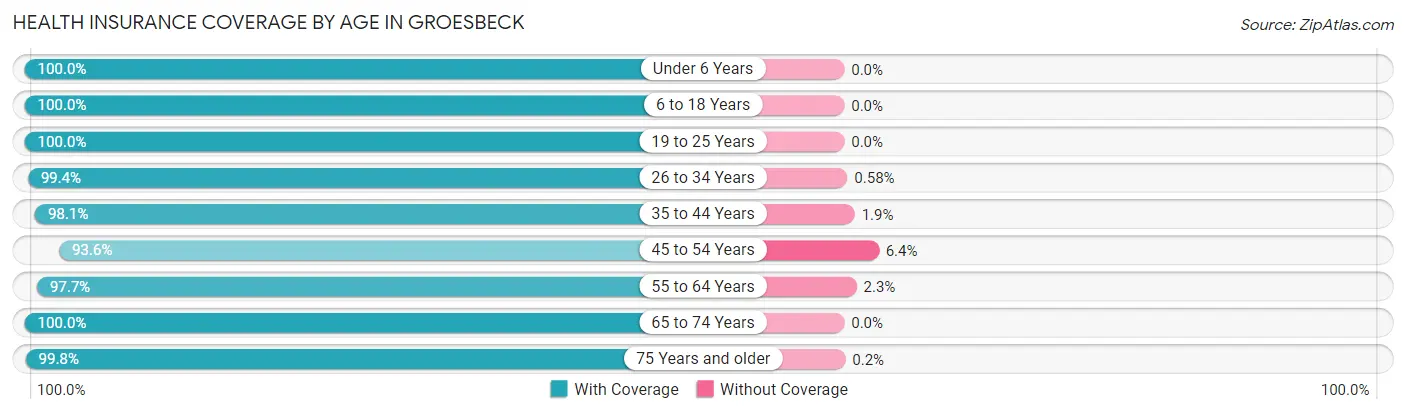
| Age Bracket | With Coverage | Without Coverage |
| Under 6 Years | 481 (100.0%) | 0 (0.0%) |
| 6 to 18 Years | 1,465 (100.0%) | 0 (0.0%) |
| 19 to 25 Years | 859 (100.0%) | 0 (0.0%) |
| 26 to 34 Years | 1,533 (99.4%) | 9 (0.6%) |
| 35 to 44 Years | 859 (98.1%) | 17 (1.9%) |
| 45 to 54 Years | 773 (93.6%) | 53 (6.4%) |
| 55 to 64 Years | 1,148 (97.7%) | 27 (2.3%) |
| 65 to 74 Years | 614 (100.0%) | 0 (0.0%) |
| 75 Years and older | 510 (99.8%) | 1 (0.2%) |
| Total | 8,242 (98.7%) | 107 (1.3%) |
Health Insurance Coverage by Citizenship Status in Groesbeck
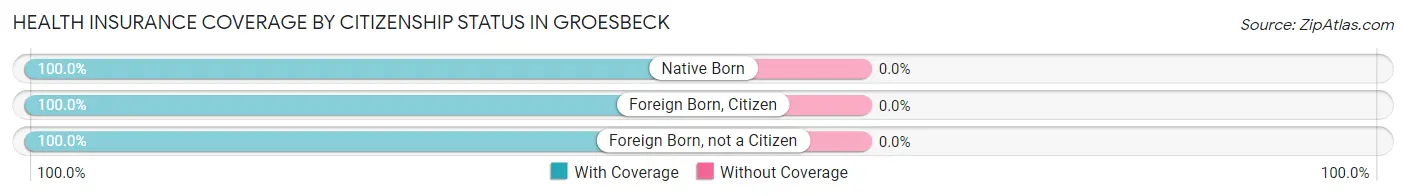
| Citizenship Status | With Coverage | Without Coverage |
| Native Born | 481 (100.0%) | 0 (0.0%) |
| Foreign Born, Citizen | 1,465 (100.0%) | 0 (0.0%) |
| Foreign Born, not a Citizen | 859 (100.0%) | 0 (0.0%) |
Health Insurance Coverage by Household Income in Groesbeck
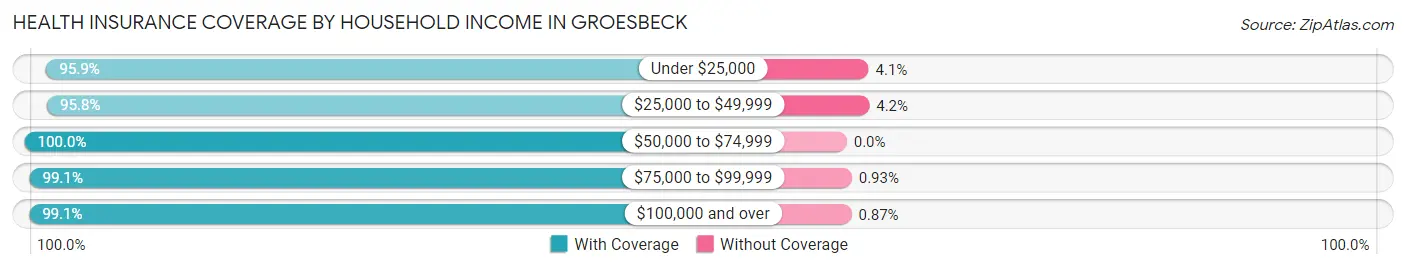
| Household Income | With Coverage | Without Coverage |
| Under $25,000 | 445 (95.9%) | 19 (4.1%) |
| $25,000 to $49,999 | 1,046 (95.8%) | 46 (4.2%) |
| $50,000 to $74,999 | 2,185 (100.0%) | 0 (0.0%) |
| $75,000 to $99,999 | 1,381 (99.1%) | 13 (0.9%) |
| $100,000 and over | 3,181 (99.1%) | 28 (0.9%) |
Public vs Private Health Insurance Coverage by Age in Groesbeck
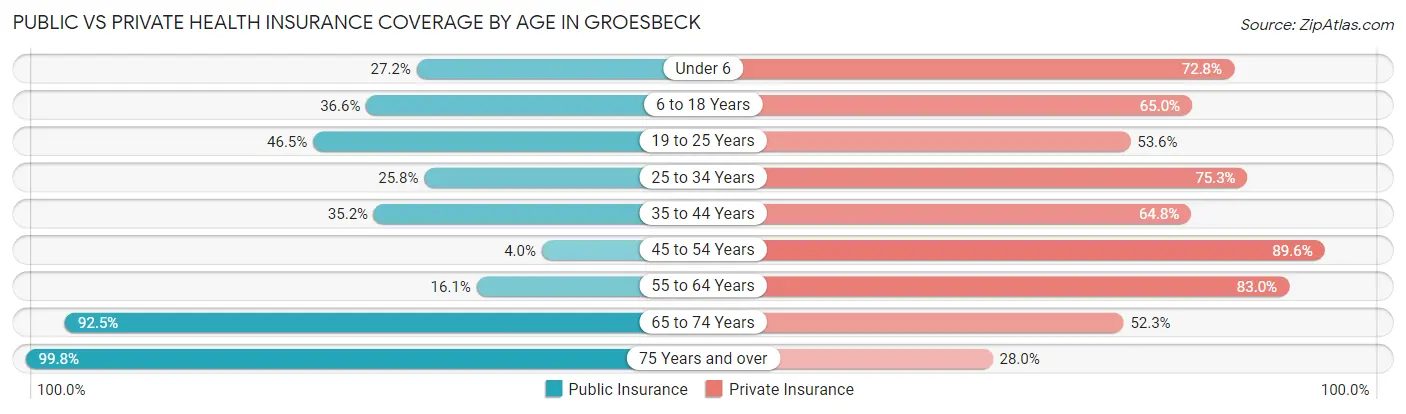
| Age Bracket | Public Insurance | Private Insurance |
| Under 6 | 131 (27.2%) | 350 (72.8%) |
| 6 to 18 Years | 536 (36.6%) | 952 (65.0%) |
| 19 to 25 Years | 399 (46.5%) | 460 (53.5%) |
| 25 to 34 Years | 398 (25.8%) | 1,161 (75.3%) |
| 35 to 44 Years | 308 (35.2%) | 568 (64.8%) |
| 45 to 54 Years | 33 (4.0%) | 740 (89.6%) |
| 55 to 64 Years | 189 (16.1%) | 975 (83.0%) |
| 65 to 74 Years | 568 (92.5%) | 321 (52.3%) |
| 75 Years and over | 510 (99.8%) | 143 (28.0%) |
| Total | 3,072 (36.8%) | 5,670 (67.9%) |
Disability Status by Sex by Age in Groesbeck
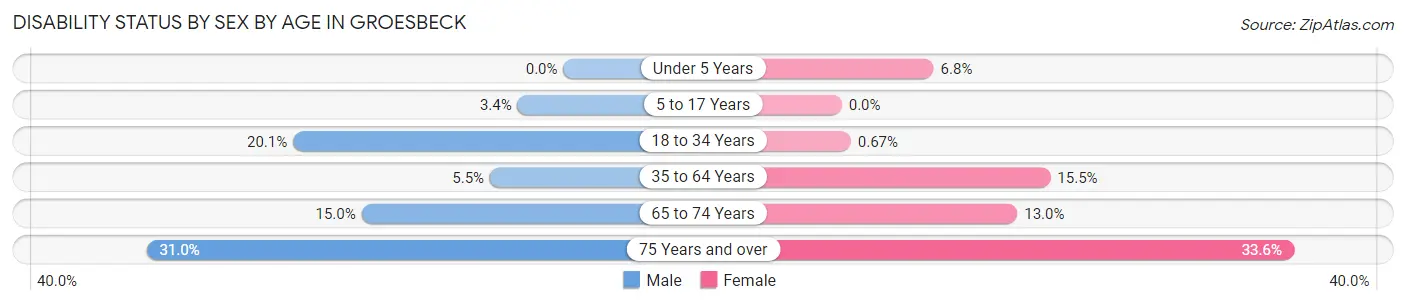
| Age Bracket | Male | Female |
| Under 5 Years | 0 (0.0%) | 18 (6.8%) |
| 5 to 17 Years | 24 (3.4%) | 0 (0.0%) |
| 18 to 34 Years | 241 (20.1%) | 9 (0.7%) |
| 35 to 64 Years | 72 (5.4%) | 241 (15.5%) |
| 65 to 74 Years | 46 (15.0%) | 40 (13.0%) |
| 75 Years and over | 65 (30.9%) | 101 (33.6%) |
Disability Class by Sex by Age in Groesbeck
Disability Class: Hearing Difficulty
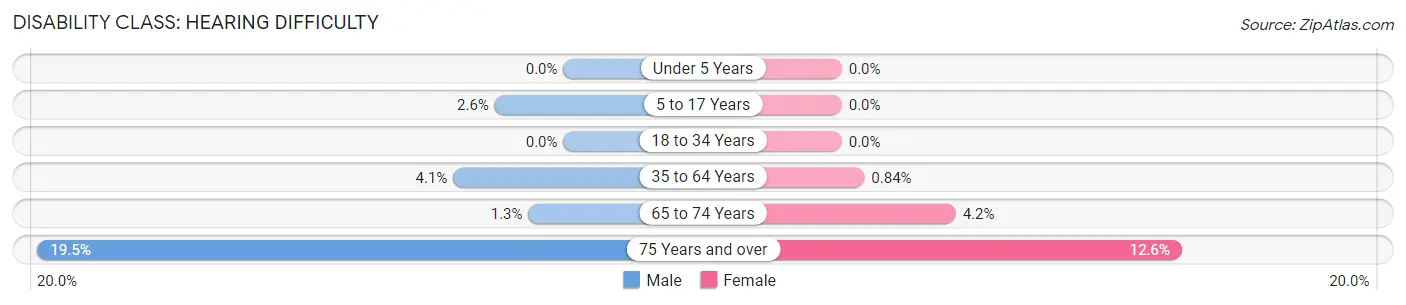
| Age Bracket | Male | Female |
| Under 5 Years | 0 (0.0%) | 0 (0.0%) |
| 5 to 17 Years | 18 (2.5%) | 0 (0.0%) |
| 18 to 34 Years | 0 (0.0%) | 0 (0.0%) |
| 35 to 64 Years | 54 (4.1%) | 13 (0.8%) |
| 65 to 74 Years | 4 (1.3%) | 13 (4.2%) |
| 75 Years and over | 41 (19.5%) | 38 (12.6%) |
Disability Class: Vision Difficulty
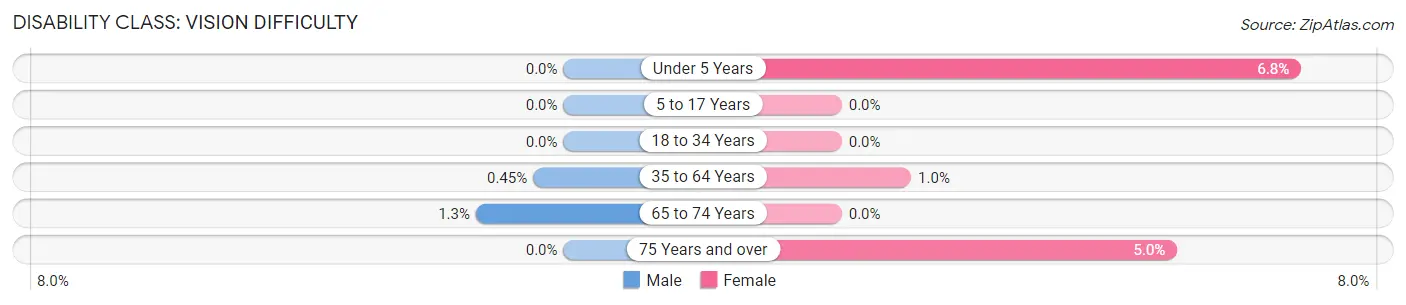
| Age Bracket | Male | Female |
| Under 5 Years | 0 (0.0%) | 18 (6.8%) |
| 5 to 17 Years | 0 (0.0%) | 0 (0.0%) |
| 18 to 34 Years | 0 (0.0%) | 0 (0.0%) |
| 35 to 64 Years | 6 (0.4%) | 16 (1.0%) |
| 65 to 74 Years | 4 (1.3%) | 0 (0.0%) |
| 75 Years and over | 0 (0.0%) | 15 (5.0%) |
Disability Class: Cognitive Difficulty
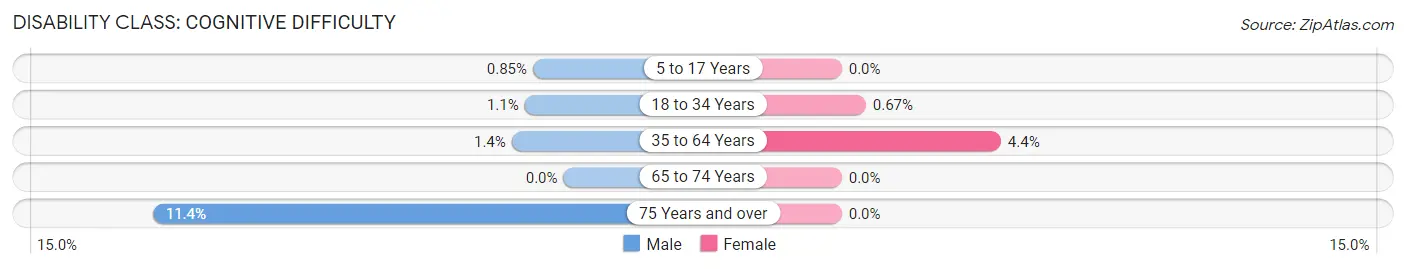
| Age Bracket | Male | Female |
| 5 to 17 Years | 6 (0.9%) | 0 (0.0%) |
| 18 to 34 Years | 13 (1.1%) | 9 (0.7%) |
| 35 to 64 Years | 19 (1.4%) | 69 (4.4%) |
| 65 to 74 Years | 0 (0.0%) | 0 (0.0%) |
| 75 Years and over | 24 (11.4%) | 0 (0.0%) |
Disability Class: Ambulatory Difficulty
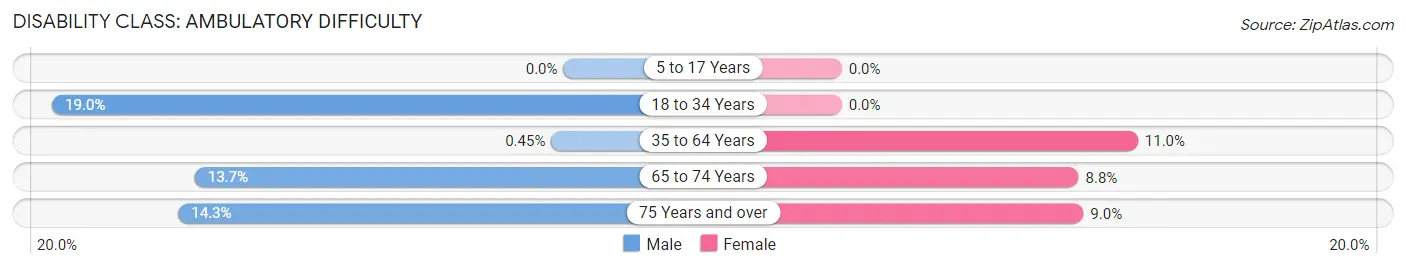
| Age Bracket | Male | Female |
| 5 to 17 Years | 0 (0.0%) | 0 (0.0%) |
| 18 to 34 Years | 228 (19.0%) | 0 (0.0%) |
| 35 to 64 Years | 6 (0.4%) | 171 (11.0%) |
| 65 to 74 Years | 42 (13.7%) | 27 (8.8%) |
| 75 Years and over | 30 (14.3%) | 27 (9.0%) |
Disability Class: Self-Care Difficulty
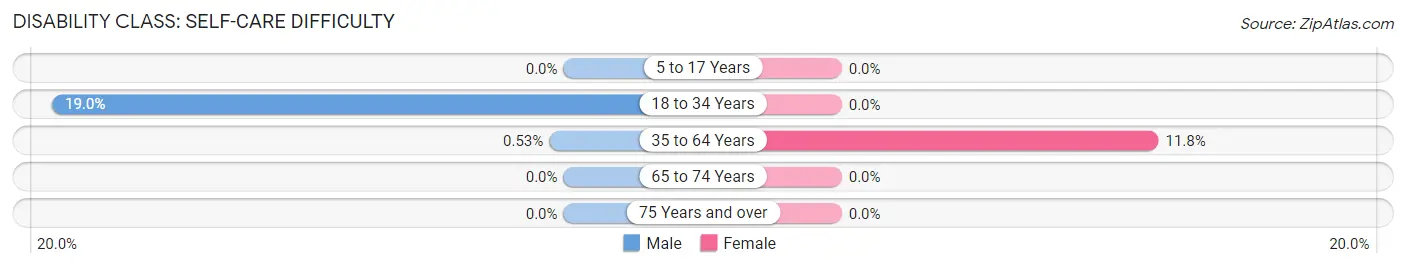
| Age Bracket | Male | Female |
| 5 to 17 Years | 0 (0.0%) | 0 (0.0%) |
| 18 to 34 Years | 228 (19.0%) | 0 (0.0%) |
| 35 to 64 Years | 7 (0.5%) | 183 (11.8%) |
| 65 to 74 Years | 0 (0.0%) | 0 (0.0%) |
| 75 Years and over | 0 (0.0%) | 0 (0.0%) |
Technology Access in Groesbeck
Computing Device Access in Groesbeck
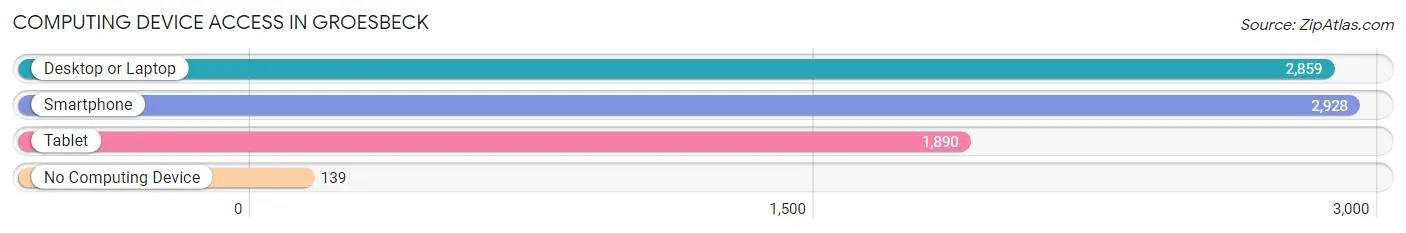
| Device Type | # Households | % Households |
| Desktop or Laptop | 2,859 | 86.0% |
| Smartphone | 2,928 | 88.1% |
| Tablet | 1,890 | 56.9% |
| No Computing Device | 139 | 4.2% |
| Total | 3,324 | 100.0% |
Internet Access in Groesbeck
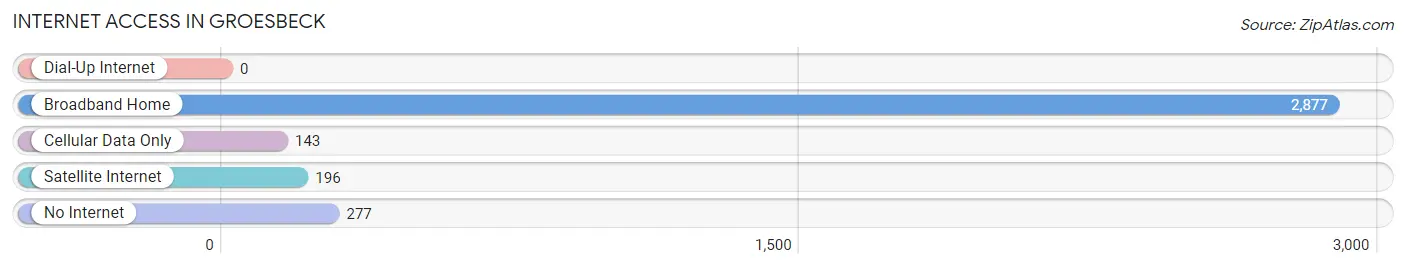
| Internet Type | # Households | % Households |
| Dial-Up Internet | 0 | 0.0% |
| Broadband Home | 2,877 | 86.6% |
| Cellular Data Only | 143 | 4.3% |
| Satellite Internet | 196 | 5.9% |
| No Internet | 277 | 8.3% |
| Total | 3,324 | 100.0% |
Groesbeck Summary
Groesbeck, Ohio is a small village located in the southeastern corner of Clinton County, Ohio. It is situated on the banks of the Little Miami River, and is part of the Cincinnati metropolitan area. The village has a population of approximately 1,400 people, and is home to a variety of businesses, including a grocery store, a hardware store, and a few restaurants.
Geography
Groesbeck is located in the southeastern corner of Clinton County, Ohio, and is situated on the banks of the Little Miami River. The village is located approximately 25 miles east of Cincinnati, and is part of the Cincinnati metropolitan area. The village is surrounded by rolling hills and farmland, and is home to a variety of wildlife, including deer, foxes, and wild turkeys.
The village is served by two major highways, State Route 73 and State Route 350. The village is also served by a number of local roads, including Groesbeck Road, which runs through the center of the village.
Economy
The economy of Groesbeck is largely based on agriculture and small businesses. The village is home to a variety of businesses, including a grocery store, a hardware store, and a few restaurants. The village also has a number of small manufacturing businesses, including a furniture factory and a printing company.
The village is also home to a number of small farms, which produce a variety of crops, including corn, soybeans, and wheat. The village is also home to a number of horse farms, which raise and train horses for racing and show purposes.
Demographics
As of the 2010 census, the population of Groesbeck was 1,400 people. The village is predominantly white, with approximately 95% of the population being white. The remaining 5% of the population is made up of African Americans, Hispanics, and other ethnicities.
The median household income in Groesbeck is $45,000, and the median home value is $125,000. The village has a low unemployment rate, and the majority of the population is employed in either agriculture or small businesses.
The village is served by the Clinton County School District, which includes two elementary schools, one middle school, and one high school. The village is also home to a number of churches, including the Groesbeck United Methodist Church and the Groesbeck Baptist Church.
Conclusion
Groesbeck, Ohio is a small village located in the southeastern corner of Clinton County, Ohio. It is situated on the banks of the Little Miami River, and is part of the Cincinnati metropolitan area. The village has a population of approximately 1,400 people, and is home to a variety of businesses, including a grocery store, a hardware store, and a few restaurants. The economy of Groesbeck is largely based on agriculture and small businesses, and the village is served by the Clinton County School District. The village is predominantly white, with a median household income of $45,000 and a median home value of $125,000.
Common Questions
What is the Total Population of Groesbeck?
Total Population of Groesbeck is 8,379.
What is the Total Male Population of Groesbeck?
Total Male Population of Groesbeck is 3,949.
What is the Total Female Population of Groesbeck?
Total Female Population of Groesbeck is 4,430.
What is the Ratio of Males per 100 Females in Groesbeck?
There are 89.14 Males per 100 Females in Groesbeck.
What is the Ratio of Females per 100 Males in Groesbeck?
There are 112.18 Females per 100 Males in Groesbeck.
What is the Median Population Age in Groesbeck?
Median Population Age in Groesbeck is 33.7 Years.
What is the Average Family Size in Groesbeck
Average Family Size in Groesbeck is 3.1 People.
What is the Average Household Size in Groesbeck
Average Household Size in Groesbeck is 2.5 People.
What is Per Capita Income in Groesbeck?
Per Capita income in Groesbeck is $32,010.
What is the Median Family Income in Groesbeck?
Median Family Income in Groesbeck is $74,486.
What is the Median Household income in Groesbeck?
Median Household Income in Groesbeck is $65,870.
What is Income or Wage Gap in Groesbeck?
Income or Wage Gap in Groesbeck is 17.8%.
Women in Groesbeck earn 82.2 cents for every dollar earned by a man.
What is Inequality or Gini Index in Groesbeck?
Inequality or Gini Index in Groesbeck is 0.37.
How Large is the Labor Force in Groesbeck?
There are 4,631 People in the Labor Forcein in Groesbeck.
What is the Percentage of People in the Labor Force in Groesbeck?
68.4% of People are in the Labor Force in Groesbeck.
What is the Unemployment Rate in Groesbeck?
Unemployment Rate in Groesbeck is 2.9%.