Ross, OH
Ross Map
Ross Overview
2,823
TOTAL POPULATION
1,300
MALE POPULATION
1,523
FEMALE POPULATION
85.36
MALES / 100 FEMALES
117.15
FEMALES / 100 MALES
39.6
MEDIAN AGE
3.4
AVG FAMILY SIZE
2.8
AVG HOUSEHOLD SIZE
$31,922
PER CAPITA INCOME
$93,287
AVG FAMILY INCOME
$62,121
AVG HOUSEHOLD INCOME
25.9%
WAGE / INCOME GAP [ % ]
74.1¢/ $1
WAGE / INCOME GAP [ $ ]
$11,559
FAMILY INCOME DEFICIT
0.45
INEQUALITY / GINI INDEX
1,289
LABOR FORCE [ PEOPLE ]
60.1%
PERCENT IN LABOR FORCE
2.8%
UNEMPLOYMENT RATE
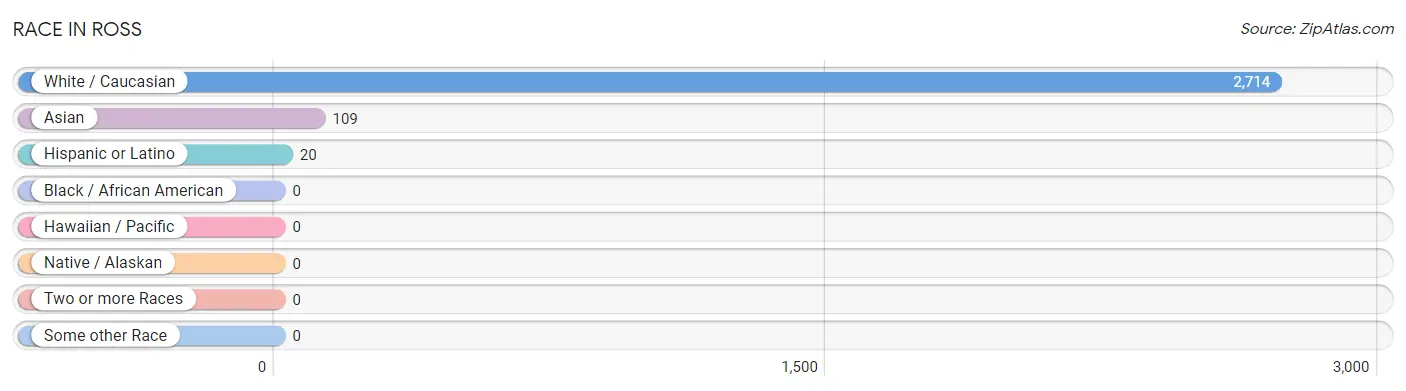
Race in Ross
The most populous races in Ross are White / Caucasian (2,714 | 96.1%), Asian (109 | 3.9%), and Hispanic or Latino (20 | 0.7%).
| Race | # Population | % Population |
| Asian | 109 | 3.9% |
| Black / African American | 0 | 0.0% |
| Hawaiian / Pacific | 0 | 0.0% |
| Hispanic or Latino | 20 | 0.7% |
| Native / Alaskan | 0 | 0.0% |
| White / Caucasian | 2,714 | 96.1% |
| Two or more Races | 0 | 0.0% |
| Some other Race | 0 | 0.0% |
| Total | 2,823 | 100.0% |
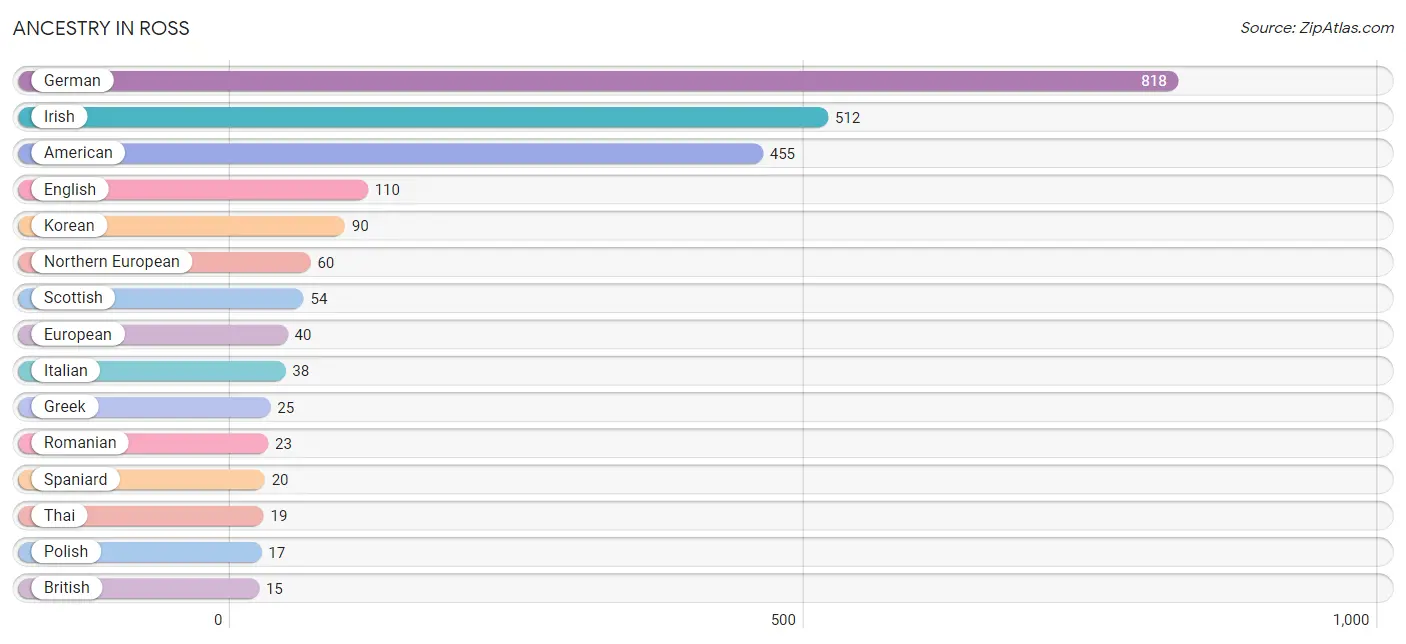
Ancestry in Ross
The most populous ancestries reported in Ross are German (818 | 29.0%), Irish (512 | 18.1%), American (455 | 16.1%), English (110 | 3.9%), and Korean (90 | 3.2%), together accounting for 70.3% of all Ross residents.
| Ancestry | # Population | % Population |
| American | 455 | 16.1% |
| British | 15 | 0.5% |
| Dutch | 11 | 0.4% |
| English | 110 | 3.9% |
| European | 40 | 1.4% |
| French | 11 | 0.4% |
| German | 818 | 29.0% |
| Greek | 25 | 0.9% |
| Irish | 512 | 18.1% |
| Italian | 38 | 1.3% |
| Korean | 90 | 3.2% |
| Northern European | 60 | 2.1% |
| Polish | 17 | 0.6% |
| Romanian | 23 | 0.8% |
| Scotch-Irish | 11 | 0.4% |
| Scottish | 54 | 1.9% |
| Spaniard | 20 | 0.7% |
| Thai | 19 | 0.7% | View All 18 Rows |
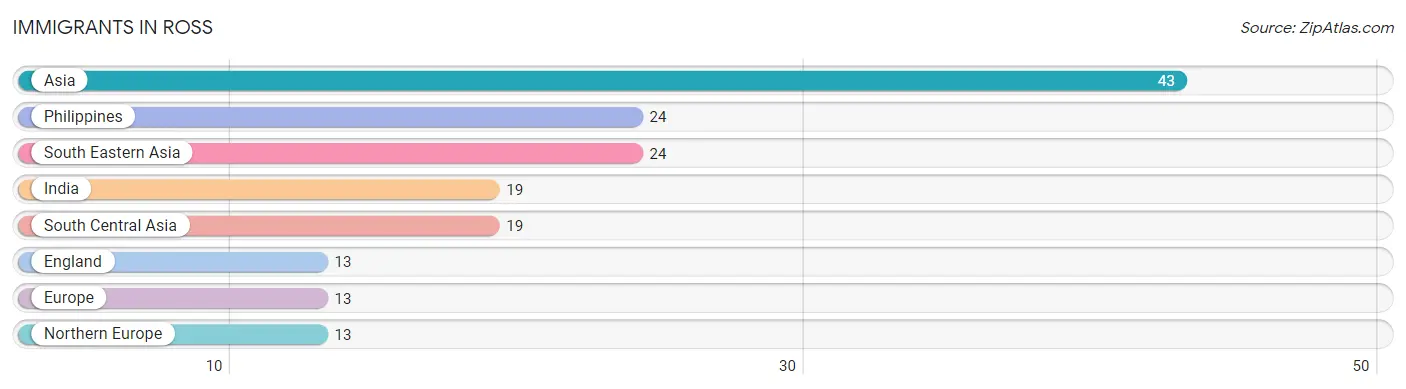
Immigrants in Ross
The most numerous immigrant groups reported in Ross came from Asia (43 | 1.5%), Philippines (24 | 0.9%), South Eastern Asia (24 | 0.9%), India (19 | 0.7%), and South Central Asia (19 | 0.7%), together accounting for 4.6% of all Ross residents.
| Immigration Origin | # Population | % Population |
| Asia | 43 | 1.5% |
| England | 13 | 0.5% |
| Europe | 13 | 0.5% |
| India | 19 | 0.7% |
| Northern Europe | 13 | 0.5% |
| Philippines | 24 | 0.9% |
| South Central Asia | 19 | 0.7% |
| South Eastern Asia | 24 | 0.9% | View All 8 Rows |
Sex and Age in Ross
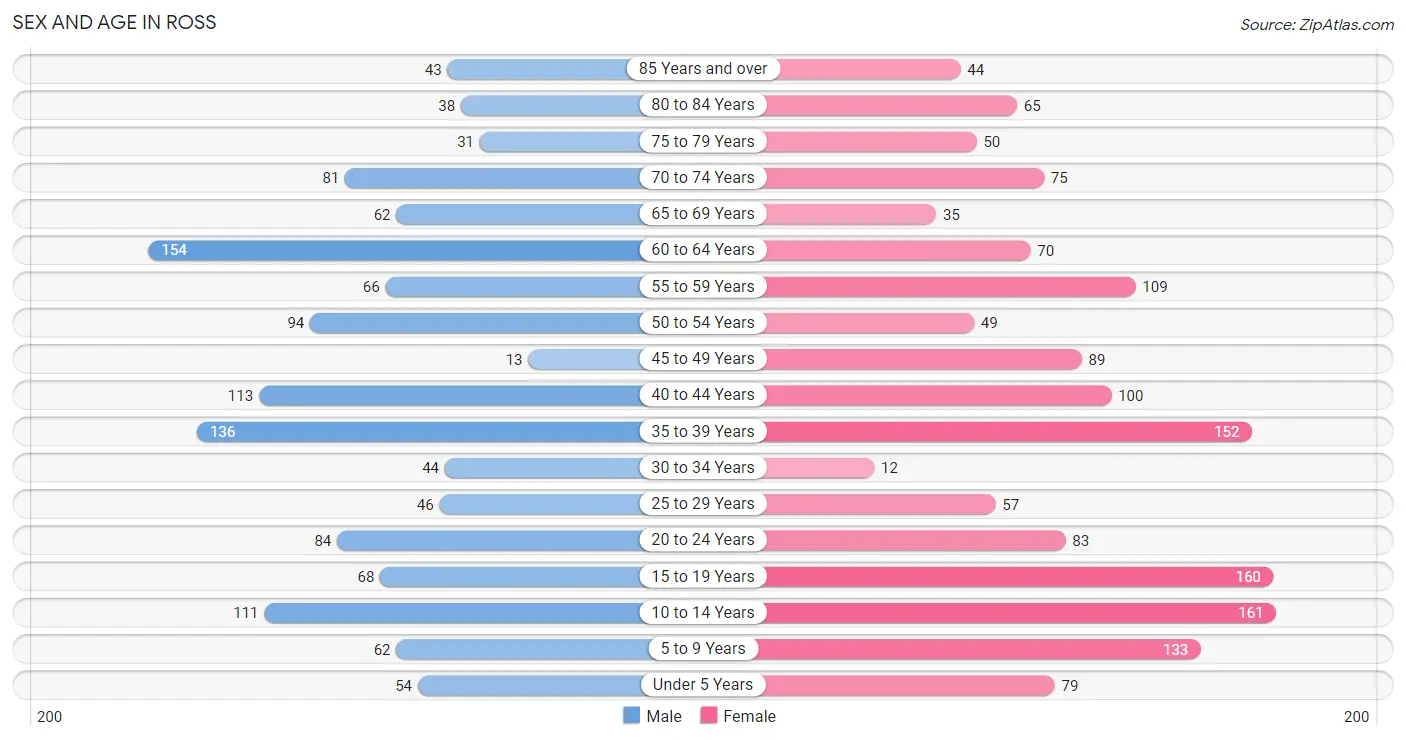
Sex and Age in Ross
The most populous age groups in Ross are 60 to 64 Years (154 | 11.8%) for men and 10 to 14 Years (161 | 10.6%) for women.
| Age Bracket | Male | Female |
| Under 5 Years | 54 (4.2%) | 79 (5.2%) |
| 5 to 9 Years | 62 (4.8%) | 133 (8.7%) |
| 10 to 14 Years | 111 (8.5%) | 161 (10.6%) |
| 15 to 19 Years | 68 (5.2%) | 160 (10.5%) |
| 20 to 24 Years | 84 (6.5%) | 83 (5.4%) |
| 25 to 29 Years | 46 (3.5%) | 57 (3.7%) |
| 30 to 34 Years | 44 (3.4%) | 12 (0.8%) |
| 35 to 39 Years | 136 (10.5%) | 152 (10.0%) |
| 40 to 44 Years | 113 (8.7%) | 100 (6.6%) |
| 45 to 49 Years | 13 (1.0%) | 89 (5.8%) |
| 50 to 54 Years | 94 (7.2%) | 49 (3.2%) |
| 55 to 59 Years | 66 (5.1%) | 109 (7.2%) |
| 60 to 64 Years | 154 (11.8%) | 70 (4.6%) |
| 65 to 69 Years | 62 (4.8%) | 35 (2.3%) |
| 70 to 74 Years | 81 (6.2%) | 75 (4.9%) |
| 75 to 79 Years | 31 (2.4%) | 50 (3.3%) |
| 80 to 84 Years | 38 (2.9%) | 65 (4.3%) |
| 85 Years and over | 43 (3.3%) | 44 (2.9%) |
| Total | 1,300 (100.0%) | 1,523 (100.0%) |
Families and Households in Ross
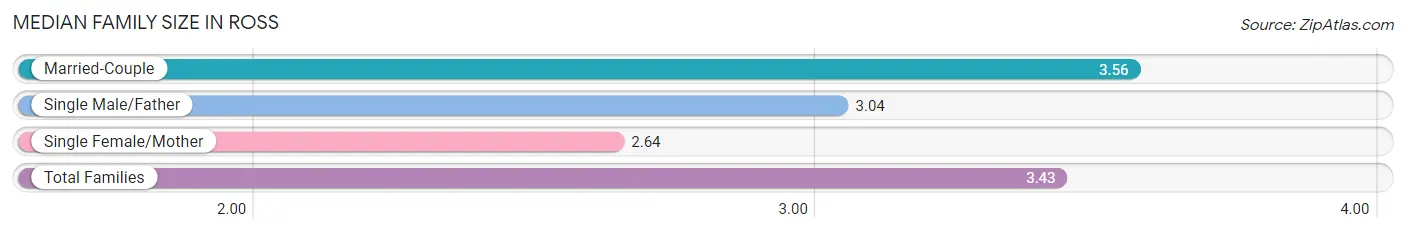
Median Family Size in Ross
The median family size in Ross is 3.43 persons per family, with married-couple families (582 | 84.5%) accounting for the largest median family size of 3.56 persons per family. On the other hand, single female/mother families (83 | 12.0%) represent the smallest median family size with 2.64 persons per family.
| Family Type | # Families | Family Size |
| Married-Couple | 582 (84.5%) | 3.56 |
| Single Male/Father | 24 (3.5%) | 3.04 |
| Single Female/Mother | 83 (12.0%) | 2.64 |
| Total Families | 689 (100.0%) | 3.43 |
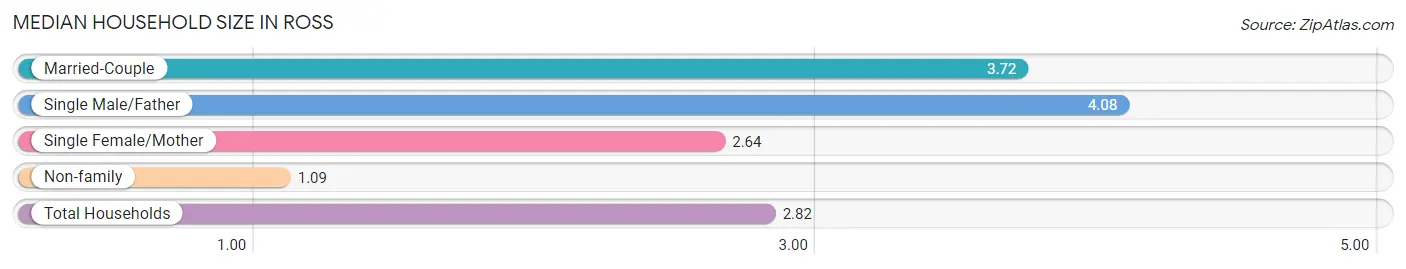
Median Household Size in Ross
The median household size in Ross is 2.82 persons per household, with single male/father households (24 | 2.4%) accounting for the largest median household size of 4.08 persons per household. non-family households (311 | 31.1%) represent the smallest median household size with 1.09 persons per household.
| Household Type | # Households | Household Size |
| Married-Couple | 582 (58.2%) | 3.72 |
| Single Male/Father | 24 (2.4%) | 4.08 |
| Single Female/Mother | 83 (8.3%) | 2.64 |
| Non-family | 311 (31.1%) | 1.09 |
| Total Households | 1,000 (100.0%) | 2.82 |
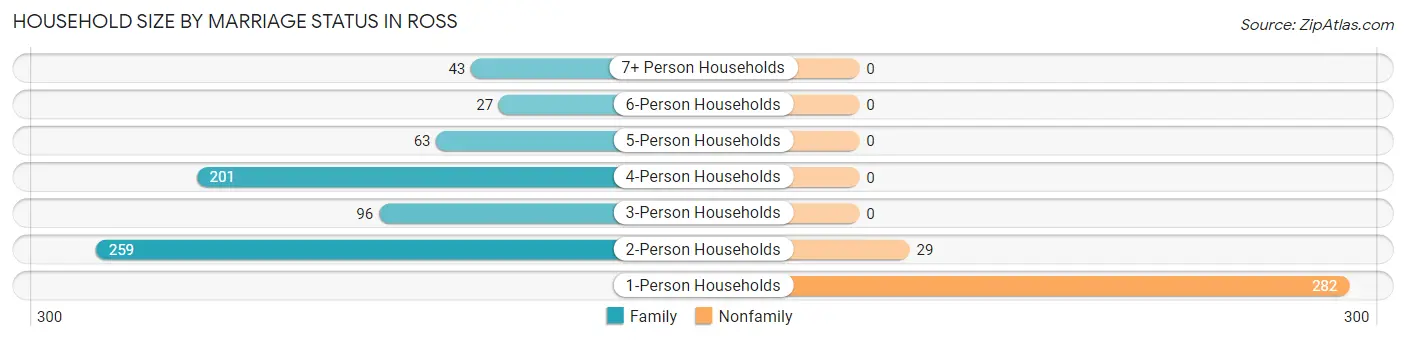
Household Size by Marriage Status in Ross
Out of a total of 1,000 households in Ross, 689 (68.9%) are family households, while 311 (31.1%) are nonfamily households. The most numerous type of family households are 2-person households, comprising 259, and the most common type of nonfamily households are 1-person households, comprising 282.
| Household Size | Family Households | Nonfamily Households |
| 1-Person Households | - | 282 (28.2%) |
| 2-Person Households | 259 (25.9%) | 29 (2.9%) |
| 3-Person Households | 96 (9.6%) | 0 (0.0%) |
| 4-Person Households | 201 (20.1%) | 0 (0.0%) |
| 5-Person Households | 63 (6.3%) | 0 (0.0%) |
| 6-Person Households | 27 (2.7%) | 0 (0.0%) |
| 7+ Person Households | 43 (4.3%) | 0 (0.0%) |
| Total | 689 (68.9%) | 311 (31.1%) |
Female Fertility in Ross
Fertility by Age in Ross
Average fertility rate in Ross is 37.0 births per 1,000 women. Women in the age bracket of 35 to 50 years have the highest fertility rate with 70.0 births per 1,000 women. Women in the age bracket of 35 to 50 years acount for 100.0% of all women with births.
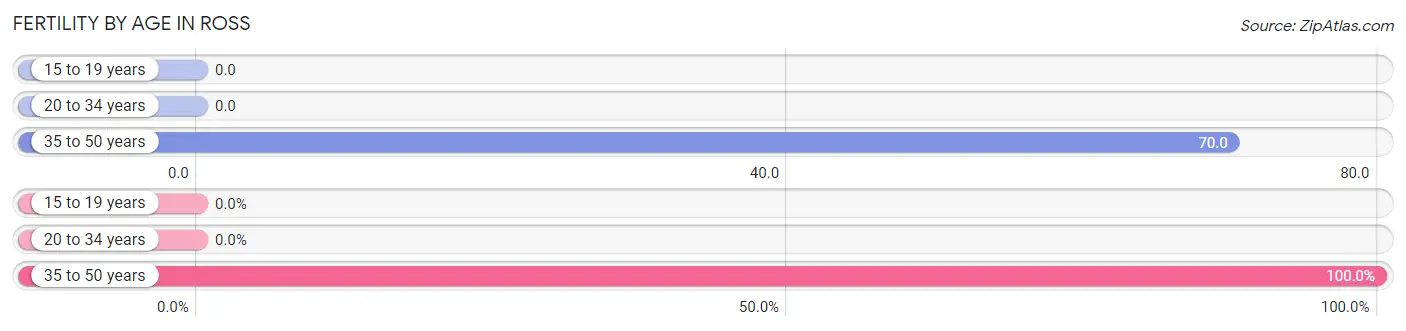
| Age Bracket | Women with Births | Births / 1,000 Women |
| 15 to 19 years | 0 (0.0%) | 0.0 |
| 20 to 34 years | 0 (0.0%) | 0.0 |
| 35 to 50 years | 24 (100.0%) | 70.0 |
| Total | 24 (100.0%) | 37.0 |
Fertility by Age by Marriage Status in Ross
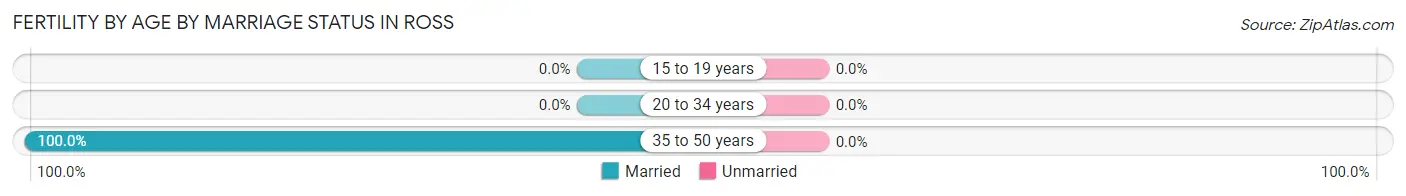
| Age Bracket | Married | Unmarried |
| 15 to 19 years | 0 (0.0%) | 0 (0.0%) |
| 20 to 34 years | 0 (0.0%) | 0 (0.0%) |
| 35 to 50 years | 24 (100.0%) | 0 (0.0%) |
| Total | 24 (100.0%) | 0 (0.0%) |
Fertility by Education in Ross
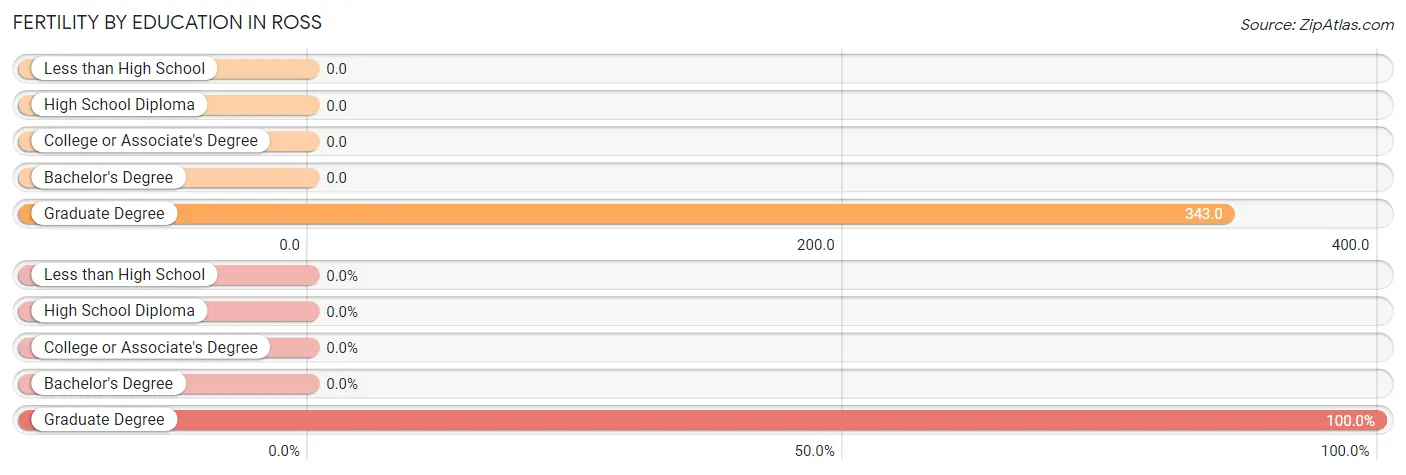
| Educational Attainment | Women with Births | Births / 1,000 Women |
| Less than High School | 0 (0.0%) | 0.0 |
| High School Diploma | 0 (0.0%) | 0.0 |
| College or Associate's Degree | 0 (0.0%) | 0.0 |
| Bachelor's Degree | 0 (0.0%) | 0.0 |
| Graduate Degree | 24 (100.0%) | 343.0 |
| Total | 24 (100.0%) | 37.0 |
Fertility by Education by Marriage Status in Ross
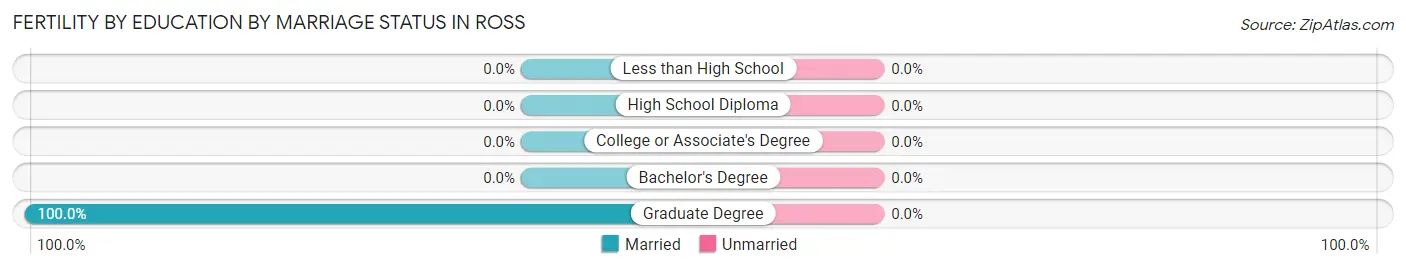
| Educational Attainment | Married | Unmarried |
| Less than High School | 0 (0.0%) | 0 (0.0%) |
| High School Diploma | 0 (0.0%) | 0 (0.0%) |
| College or Associate's Degree | 0 (0.0%) | 0 (0.0%) |
| Bachelor's Degree | 0 (0.0%) | 0 (0.0%) |
| Graduate Degree | 24 (100.0%) | 0 (0.0%) |
| Total | 24 (100.0%) | 0 (0.0%) |
Income in Ross
Income Overview in Ross
Per Capita Income in Ross is $31,922, while median incomes of families and households are $93,287 and $62,121 respectively.
| Characteristic | Number | Measure |
| Per Capita Income | 2,823 | $31,922 |
| Median Family Income | 689 | $93,287 |
| Mean Family Income | 689 | $108,501 |
| Median Household Income | 1,000 | $62,121 |
| Mean Household Income | 1,000 | $87,994 |
| Income Deficit | 689 | $11,559 |
| Wage / Income Gap (%) | 2,823 | 25.89% |
| Wage / Income Gap ($) | 2,823 | 74.11¢ per $1 |
| Gini / Inequality Index | 2,823 | 0.45 |
Earnings by Sex in Ross
Average Earnings in Ross are $32,227, $30,848 for men and $41,622 for women, a difference of 25.9%.
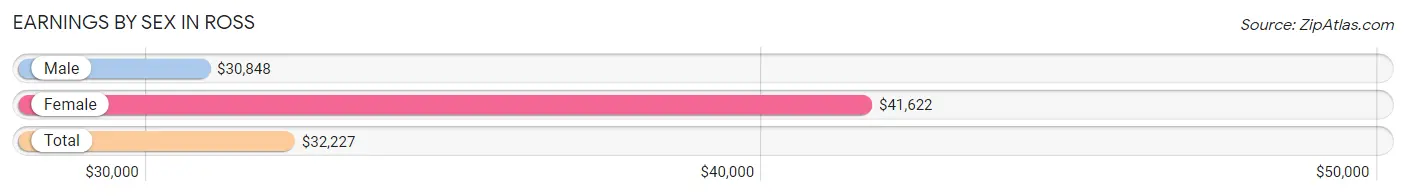
| Sex | Number | Average Earnings |
| Male | 769 (56.7%) | $30,848 |
| Female | 588 (43.3%) | $41,622 |
| Total | 1,357 (100.0%) | $32,227 |
Earnings by Sex by Income Bracket in Ross
The most common earnings brackets in Ross are $100,000+ for men (127 | 16.5%) and $40,000 to $44,999 for women (74 | 12.6%).
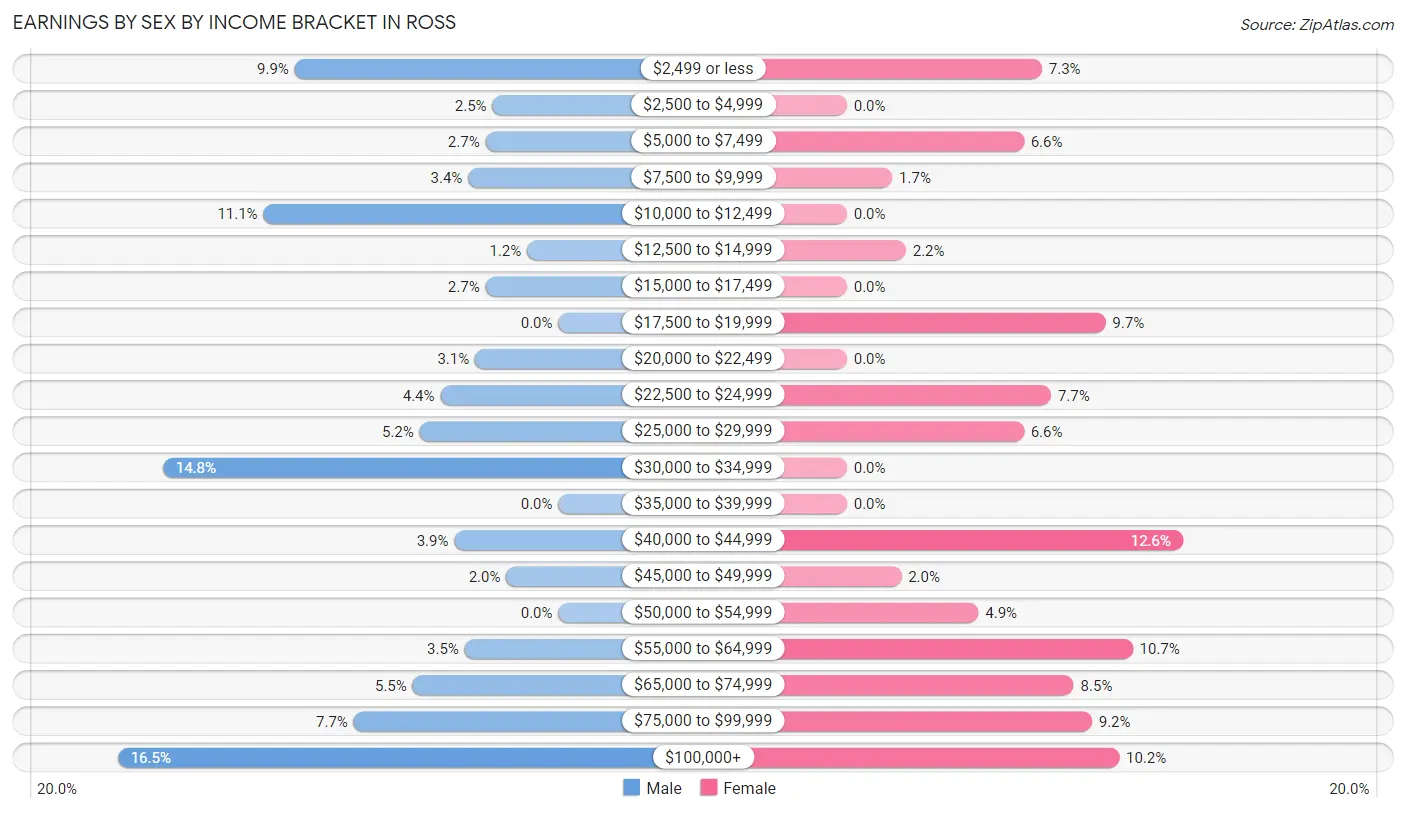
| Income | Male | Female |
| $2,499 or less | 76 (9.9%) | 43 (7.3%) |
| $2,500 to $4,999 | 19 (2.5%) | 0 (0.0%) |
| $5,000 to $7,499 | 21 (2.7%) | 39 (6.6%) |
| $7,500 to $9,999 | 26 (3.4%) | 10 (1.7%) |
| $10,000 to $12,499 | 85 (11.1%) | 0 (0.0%) |
| $12,500 to $14,999 | 9 (1.2%) | 13 (2.2%) |
| $15,000 to $17,499 | 21 (2.7%) | 0 (0.0%) |
| $17,500 to $19,999 | 0 (0.0%) | 57 (9.7%) |
| $20,000 to $22,499 | 24 (3.1%) | 0 (0.0%) |
| $22,500 to $24,999 | 34 (4.4%) | 45 (7.6%) |
| $25,000 to $29,999 | 40 (5.2%) | 39 (6.6%) |
| $30,000 to $34,999 | 114 (14.8%) | 0 (0.0%) |
| $35,000 to $39,999 | 0 (0.0%) | 0 (0.0%) |
| $40,000 to $44,999 | 30 (3.9%) | 74 (12.6%) |
| $45,000 to $49,999 | 15 (1.9%) | 12 (2.0%) |
| $50,000 to $54,999 | 0 (0.0%) | 29 (4.9%) |
| $55,000 to $64,999 | 27 (3.5%) | 63 (10.7%) |
| $65,000 to $74,999 | 42 (5.5%) | 50 (8.5%) |
| $75,000 to $99,999 | 59 (7.7%) | 54 (9.2%) |
| $100,000+ | 127 (16.5%) | 60 (10.2%) |
| Total | 769 (100.0%) | 588 (100.0%) |
Earnings by Sex by Educational Attainment in Ross
Average earnings in Ross are $33,056 for men and $50,302 for women, a difference of 34.3%. Men with an educational attainment of graduate degree enjoy the highest average annual earnings of $127,100, while those with bachelor's degree education earn the least with $31,313. Women with an educational attainment of graduate degree earn the most with the average annual earnings of $93,542, while those with college or associate's degree education have the smallest earnings of $40,101.
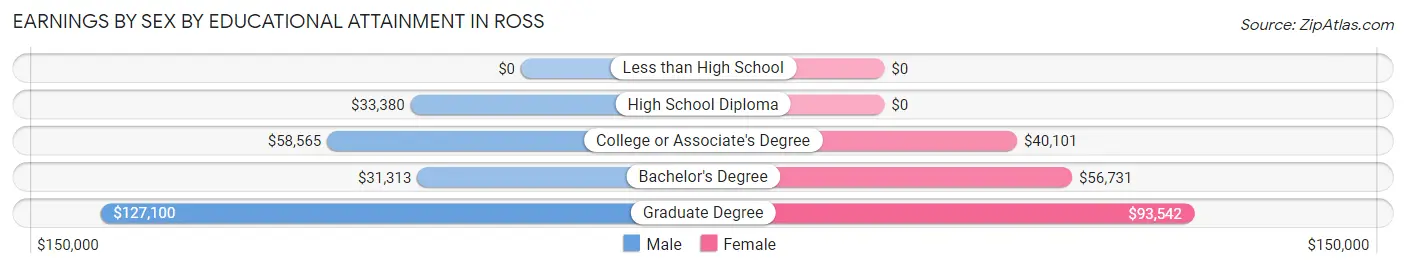
| Educational Attainment | Male Income | Female Income |
| Less than High School | - | - |
| High School Diploma | $33,380 | $0 |
| College or Associate's Degree | $58,565 | $40,101 |
| Bachelor's Degree | $31,313 | $56,731 |
| Graduate Degree | $127,100 | $93,542 |
| Total | $33,056 | $50,302 |
Family Income in Ross
Family Income Brackets in Ross
According to the Ross family income data, there are 134 families falling into the $100,000 to $149,999 income range, which is the most common income bracket and makes up 19.5% of all families.
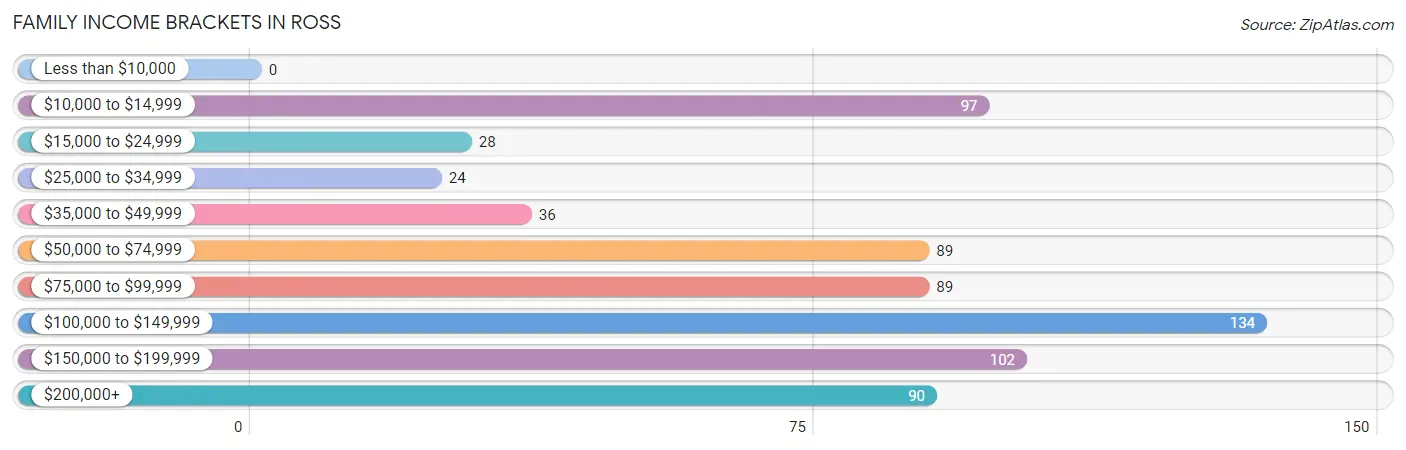
| Income Bracket | # Families | % Families |
| Less than $10,000 | 0 | 0.0% |
| $10,000 to $14,999 | 97 | 14.1% |
| $15,000 to $24,999 | 28 | 4.1% |
| $25,000 to $34,999 | 24 | 3.5% |
| $35,000 to $49,999 | 36 | 5.2% |
| $50,000 to $74,999 | 89 | 12.9% |
| $75,000 to $99,999 | 89 | 12.9% |
| $100,000 to $149,999 | 134 | 19.4% |
| $150,000 to $199,999 | 102 | 14.8% |
| $200,000+ | 90 | 13.1% |
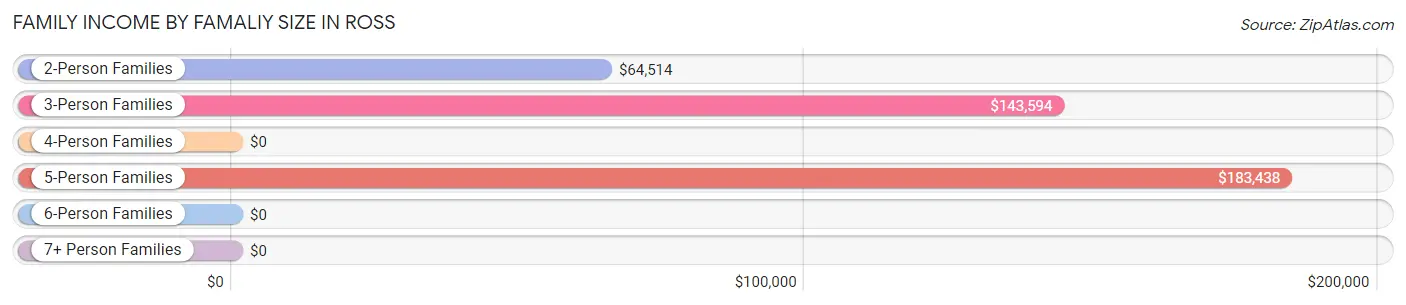
Family Income by Famaliy Size in Ross
5-person families (63 | 9.1%) account for the highest median family income in Ross with $183,438 per family, while 3-person families (100 | 14.5%) have the highest median income of $47,865 per family member.
| Income Bracket | # Families | Median Income |
| 2-Person Families | 279 (40.5%) | $64,514 |
| 3-Person Families | 100 (14.5%) | $143,594 |
| 4-Person Families | 196 (28.4%) | $0 |
| 5-Person Families | 63 (9.1%) | $183,438 |
| 6-Person Families | 27 (3.9%) | $0 |
| 7+ Person Families | 24 (3.5%) | $0 |
| Total | 689 (100.0%) | $93,287 |
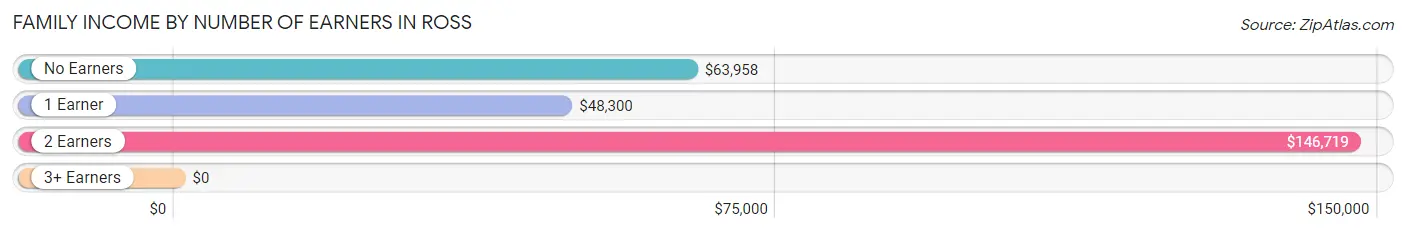
Family Income by Number of Earners in Ross
| Number of Earners | # Families | Median Income |
| No Earners | 119 (17.3%) | $63,958 |
| 1 Earner | 190 (27.6%) | $48,300 |
| 2 Earners | 289 (41.9%) | $146,719 |
| 3+ Earners | 91 (13.2%) | $0 |
| Total | 689 (100.0%) | $93,287 |
Household Income in Ross
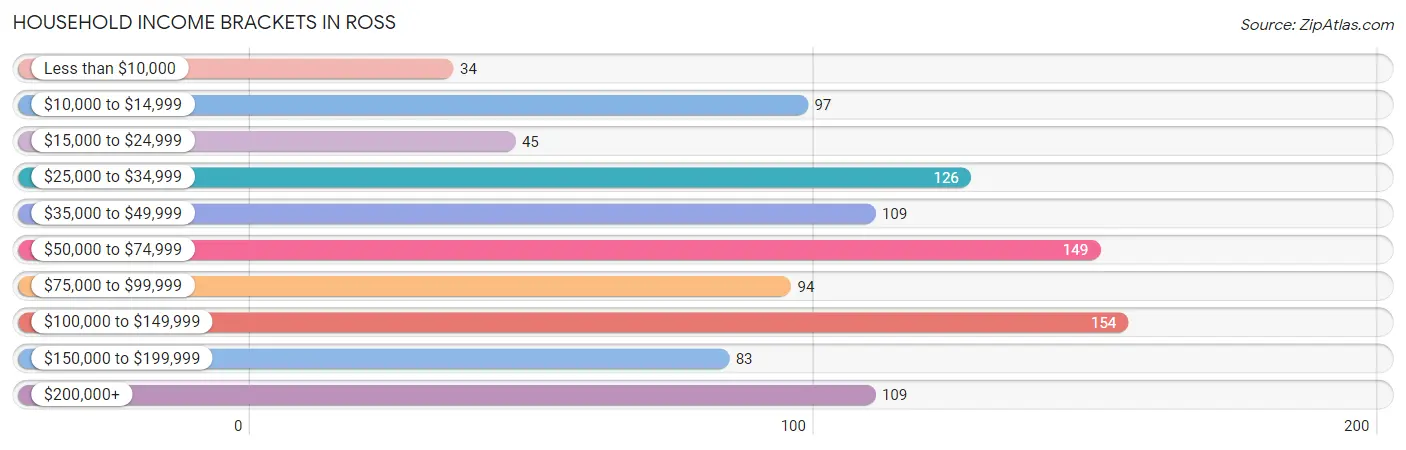
Household Income Brackets in Ross
With 154 households falling in the category, the $100,000 to $149,999 income range is the most frequent in Ross, accounting for 15.4% of all households. In contrast, only 34 households (3.4%) fall into the less than $10,000 income bracket, making it the least populous group.
| Income Bracket | # Households | % Households |
| Less than $10,000 | 34 | 3.4% |
| $10,000 to $14,999 | 97 | 9.7% |
| $15,000 to $24,999 | 45 | 4.5% |
| $25,000 to $34,999 | 126 | 12.6% |
| $35,000 to $49,999 | 109 | 10.9% |
| $50,000 to $74,999 | 149 | 14.9% |
| $75,000 to $99,999 | 94 | 9.4% |
| $100,000 to $149,999 | 154 | 15.4% |
| $150,000 to $199,999 | 83 | 8.3% |
| $200,000+ | 109 | 10.9% |
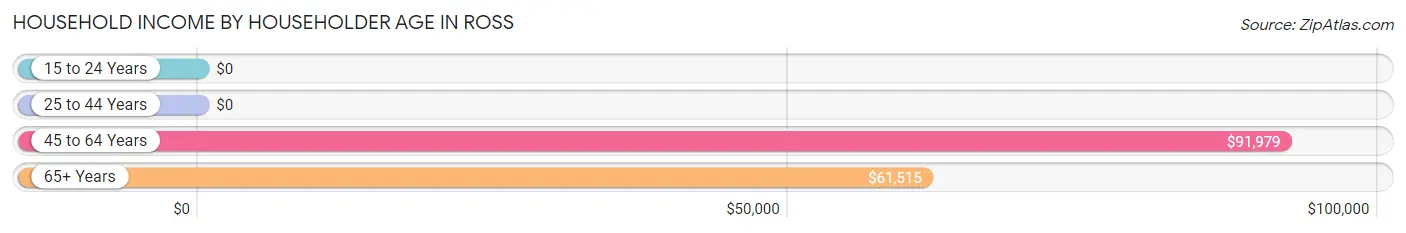
Household Income by Householder Age in Ross
The median household income in Ross is $62,121, with the highest median household income of $91,979 found in the 45 to 64 years age bracket for the primary householder. A total of 299 households (29.9%) fall into this category. Meanwhile, the 15 to 24 years age bracket for the primary householder has the lowest median household income of $0, with 29 households (2.9%) in this group.
| Income Bracket | # Households | Median Income |
| 15 to 24 Years | 29 (2.9%) | $0 |
| 25 to 44 Years | 324 (32.4%) | $0 |
| 45 to 64 Years | 299 (29.9%) | $91,979 |
| 65+ Years | 348 (34.8%) | $61,515 |
| Total | 1,000 (100.0%) | $62,121 |
Poverty in Ross
Income Below Poverty by Sex and Age in Ross
With 21.4% poverty level for males and 22.1% for females among the residents of Ross, 15 year old males and 15 year old females are the most vulnerable to poverty, with 25 males (100.0%) and 54 females (100.0%) in their respective age groups living below the poverty level.
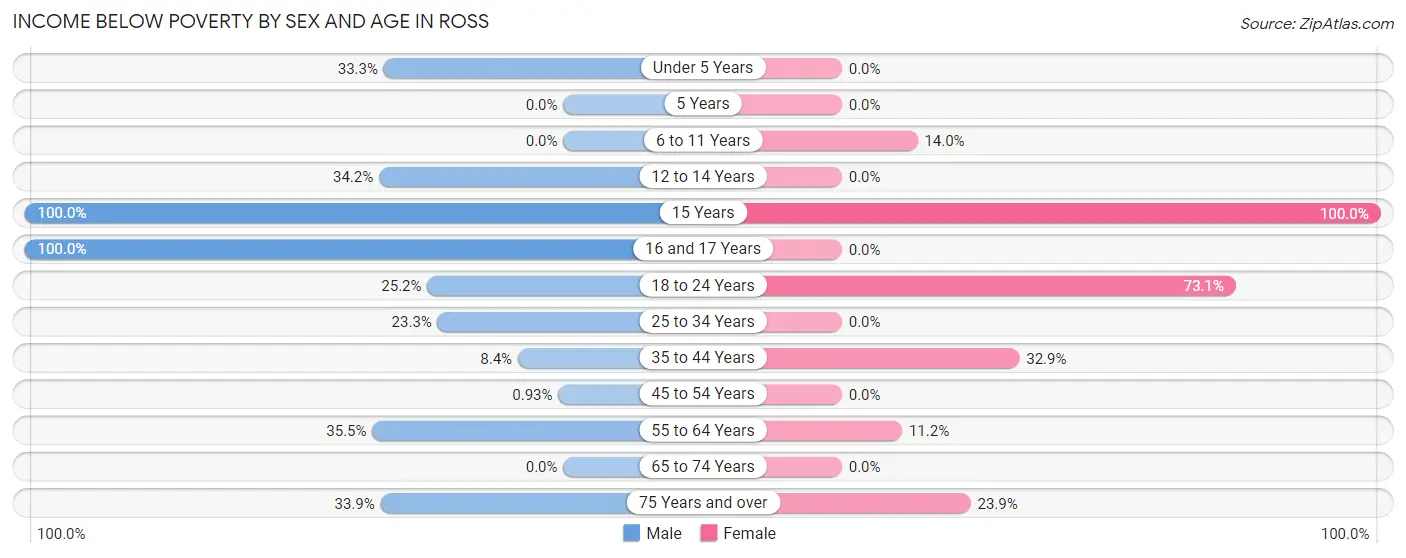
| Age Bracket | Male | Female |
| Under 5 Years | 18 (33.3%) | 0 (0.0%) |
| 5 Years | 0 (0.0%) | 0 (0.0%) |
| 6 to 11 Years | 0 (0.0%) | 24 (14.0%) |
| 12 to 14 Years | 26 (34.2%) | 0 (0.0%) |
| 15 Years | 25 (100.0%) | 54 (100.0%) |
| 16 and 17 Years | 24 (100.0%) | 0 (0.0%) |
| 18 to 24 Years | 26 (25.2%) | 117 (73.1%) |
| 25 to 34 Years | 21 (23.3%) | 0 (0.0%) |
| 35 to 44 Years | 21 (8.4%) | 83 (32.9%) |
| 45 to 54 Years | 1 (0.9%) | 0 (0.0%) |
| 55 to 64 Years | 78 (35.4%) | 20 (11.2%) |
| 65 to 74 Years | 0 (0.0%) | 0 (0.0%) |
| 75 Years and over | 38 (33.9%) | 38 (23.9%) |
| Total | 278 (21.4%) | 336 (22.1%) |
Income Above Poverty by Sex and Age in Ross
According to the poverty statistics in Ross, males aged 6 to 11 years and females aged under 5 years are the age groups that are most secure financially, with 100.0% of males and 100.0% of females in these age groups living above the poverty line.
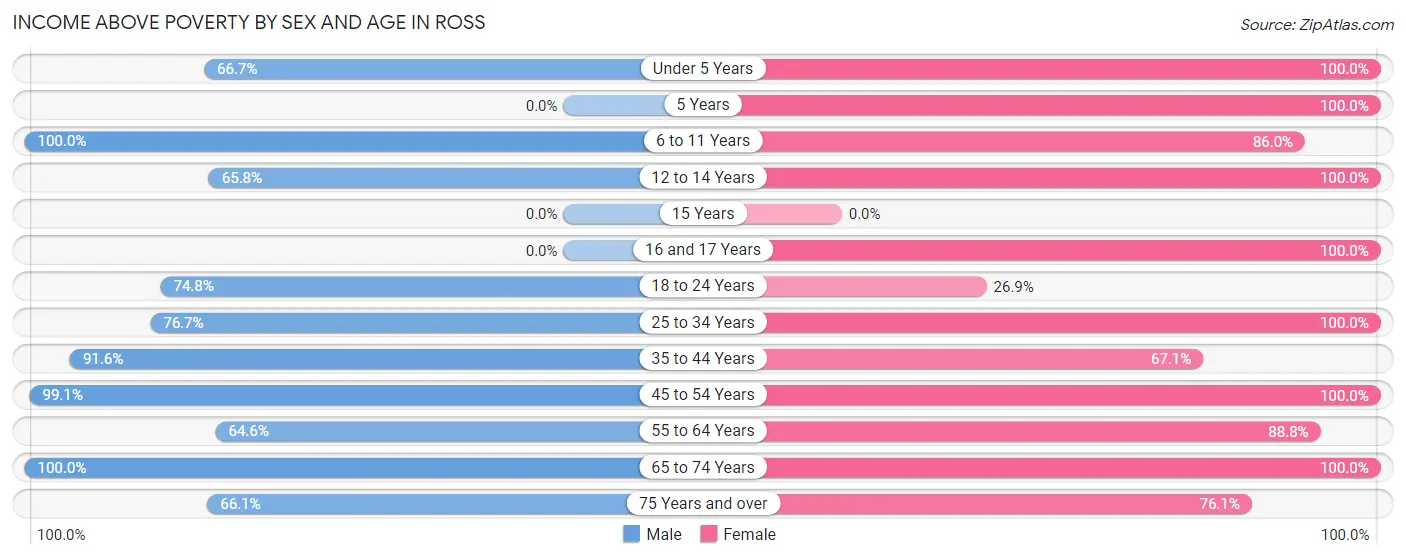
| Age Bracket | Male | Female |
| Under 5 Years | 36 (66.7%) | 79 (100.0%) |
| 5 Years | 0 (0.0%) | 13 (100.0%) |
| 6 to 11 Years | 97 (100.0%) | 147 (86.0%) |
| 12 to 14 Years | 50 (65.8%) | 110 (100.0%) |
| 15 Years | 0 (0.0%) | 0 (0.0%) |
| 16 and 17 Years | 0 (0.0%) | 29 (100.0%) |
| 18 to 24 Years | 77 (74.8%) | 43 (26.9%) |
| 25 to 34 Years | 69 (76.7%) | 69 (100.0%) |
| 35 to 44 Years | 228 (91.6%) | 169 (67.1%) |
| 45 to 54 Years | 106 (99.1%) | 138 (100.0%) |
| 55 to 64 Years | 142 (64.5%) | 159 (88.8%) |
| 65 to 74 Years | 143 (100.0%) | 110 (100.0%) |
| 75 Years and over | 74 (66.1%) | 121 (76.1%) |
| Total | 1,022 (78.6%) | 1,187 (77.9%) |
Income Below Poverty Among Married-Couple Families in Ross
The poverty statistics for married-couple families in Ross show that 20.8% or 121 of the total 582 families live below the poverty line. Families with 1 or 2 children have the highest poverty rate of 28.9%, comprising of 59 families. On the other hand, families with no children have the lowest poverty rate of 13.6%, which includes 38 families.
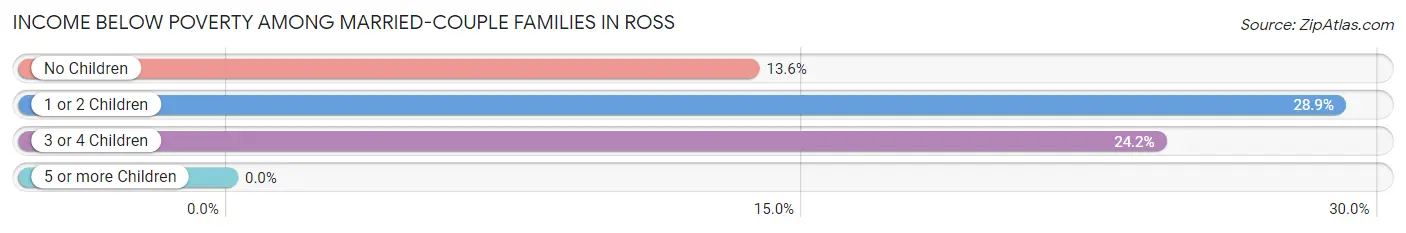
| Children | Above Poverty | Below Poverty |
| No Children | 241 (86.4%) | 38 (13.6%) |
| 1 or 2 Children | 145 (71.1%) | 59 (28.9%) |
| 3 or 4 Children | 75 (75.8%) | 24 (24.2%) |
| 5 or more Children | 0 (0.0%) | 0 (0.0%) |
| Total | 461 (79.2%) | 121 (20.8%) |
Income Below Poverty Among Single-Parent Households in Ross
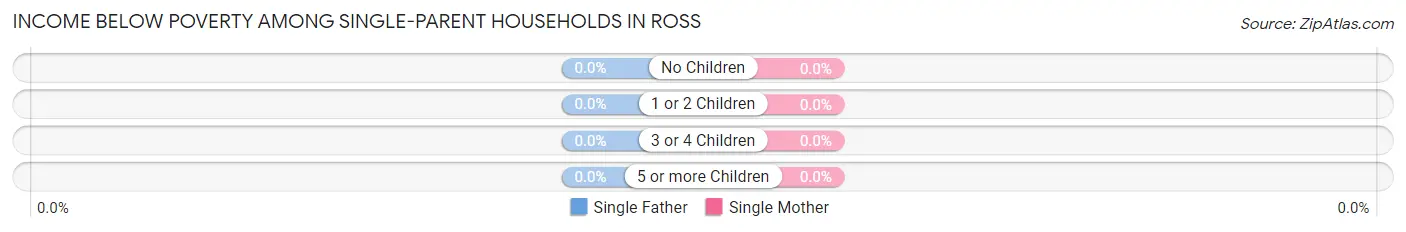
| Children | Single Father | Single Mother |
| No Children | 0 (0.0%) | 0 (0.0%) |
| 1 or 2 Children | 0 (0.0%) | 0 (0.0%) |
| 3 or 4 Children | 0 (0.0%) | 0 (0.0%) |
| 5 or more Children | 0 (0.0%) | 0 (0.0%) |
| Total | 0 (0.0%) | 0 (0.0%) |
Income Below Poverty Among Married-Couple vs Single-Parent Households in Ross
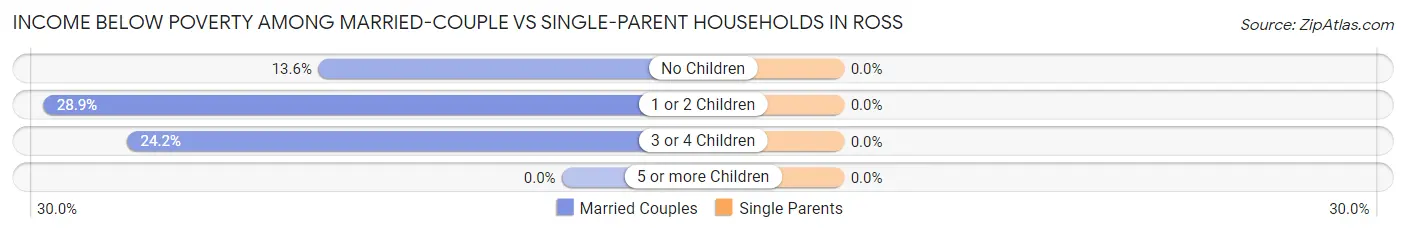
| Children | Married-Couple Families | Single-Parent Households |
| No Children | 38 (13.6%) | 0 (0.0%) |
| 1 or 2 Children | 59 (28.9%) | 0 (0.0%) |
| 3 or 4 Children | 24 (24.2%) | 0 (0.0%) |
| 5 or more Children | 0 (0.0%) | 0 (0.0%) |
| Total | 121 (20.8%) | 0 (0.0%) |
Employment Characteristics in Ross
Employment by Class of Employer in Ross
Among the 1,071 employed individuals in Ross, private company employees (686 | 64.0%), local government employees (140 | 13.1%), and not-for-profit organizations (89 | 8.3%) make up the most common classes of employment.
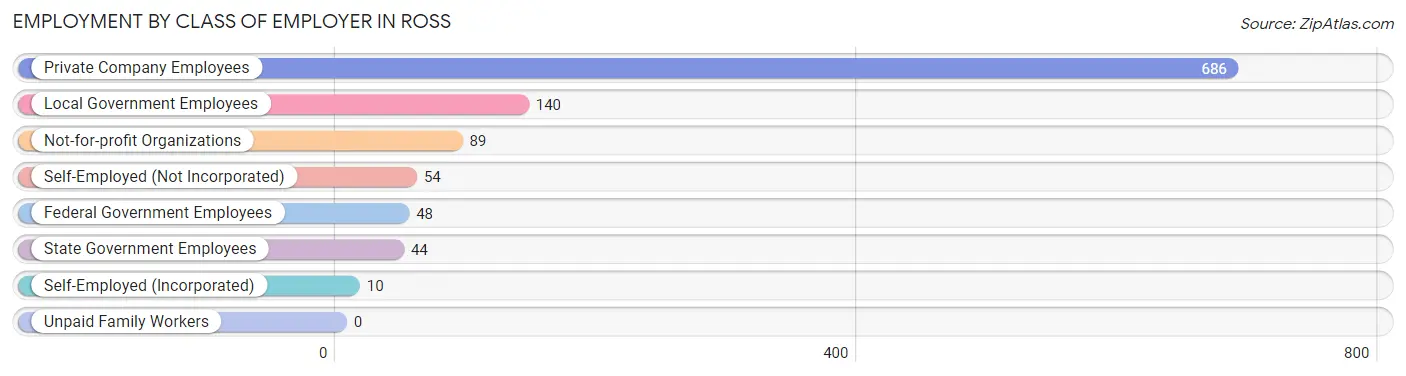
| Employer Class | # Employees | % Employees |
| Private Company Employees | 686 | 64.0% |
| Self-Employed (Incorporated) | 10 | 0.9% |
| Self-Employed (Not Incorporated) | 54 | 5.0% |
| Not-for-profit Organizations | 89 | 8.3% |
| Local Government Employees | 140 | 13.1% |
| State Government Employees | 44 | 4.1% |
| Federal Government Employees | 48 | 4.5% |
| Unpaid Family Workers | 0 | 0.0% |
| Total | 1,071 | 100.0% |
Employment Status by Age in Ross
According to the labor force statistics for Ross, out of the total population over 16 years of age (2,144), 60.1% or 1,289 individuals are in the labor force, with 2.8% or 36 of them unemployed. The age group with the highest labor force participation rate is 25 to 29 years, with 100.0% or 103 individuals in the labor force. Within the labor force, the 75 years and over age range has the highest percentage of unemployed individuals, with 56.5% or 26 of them being unemployed.
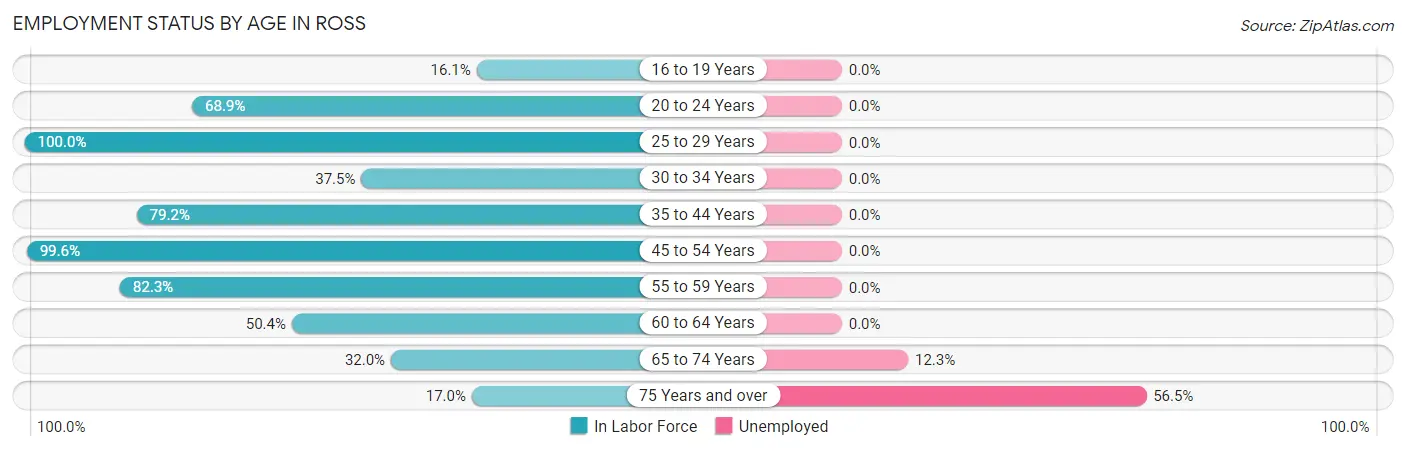
| Age Bracket | In Labor Force | Unemployed |
| 16 to 19 Years | 24 (16.1%) | 0 (0.0%) |
| 20 to 24 Years | 115 (68.9%) | 0 (0.0%) |
| 25 to 29 Years | 103 (100.0%) | 0 (0.0%) |
| 30 to 34 Years | 21 (37.5%) | 0 (0.0%) |
| 35 to 44 Years | 397 (79.2%) | 0 (0.0%) |
| 45 to 54 Years | 244 (99.6%) | 0 (0.0%) |
| 55 to 59 Years | 144 (82.3%) | 0 (0.0%) |
| 60 to 64 Years | 113 (50.4%) | 0 (0.0%) |
| 65 to 74 Years | 81 (32.0%) | 10 (12.3%) |
| 75 Years and over | 46 (17.0%) | 26 (56.5%) |
| Total | 1,289 (60.1%) | 36 (2.8%) |
Employment Status by Educational Attainment in Ross
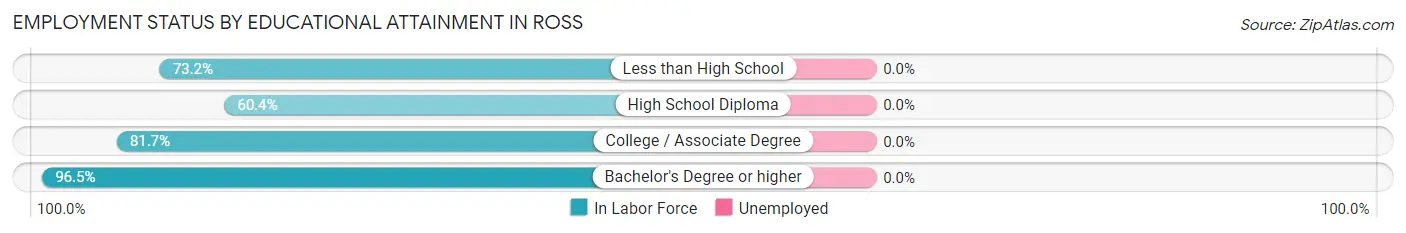
| Educational Attainment | In Labor Force | Unemployed |
| Less than High School | 120 (73.2%) | 0 (0.0%) |
| High School Diploma | 249 (60.4%) | 0 (0.0%) |
| College / Associate Degree | 272 (81.7%) | 0 (0.0%) |
| Bachelor's Degree or higher | 381 (96.5%) | 0 (0.0%) |
| Total | 1,022 (78.4%) | 0 (0.0%) |
Employment Occupations by Sex in Ross
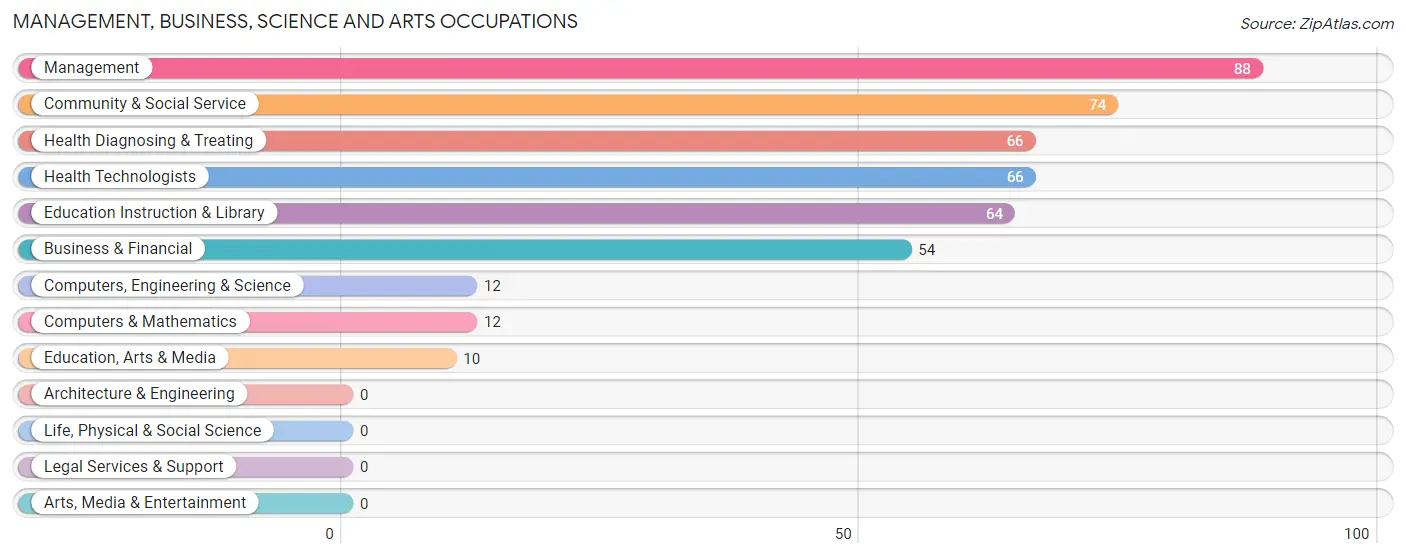
Management, Business, Science and Arts Occupations
The most common Management, Business, Science and Arts occupations in Ross are Management (88 | 7.0%), Community & Social Service (74 | 5.9%), Health Diagnosing & Treating (66 | 5.3%), Health Technologists (66 | 5.3%), and Education Instruction & Library (64 | 5.1%).
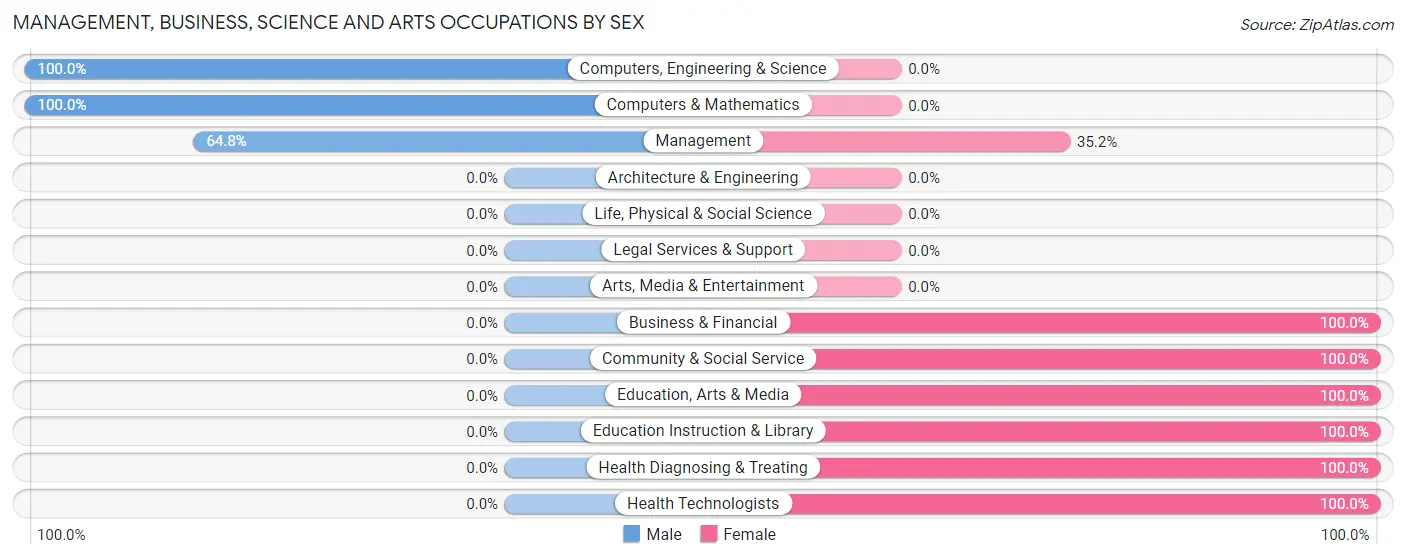
Management, Business, Science and Arts Occupations by Sex
Within the Management, Business, Science and Arts occupations in Ross, the most male-oriented occupations are Computers, Engineering & Science (100.0%), Computers & Mathematics (100.0%), and Management (64.8%), while the most female-oriented occupations are Business & Financial (100.0%), Community & Social Service (100.0%), and Education, Arts & Media (100.0%).
| Occupation | Male | Female |
| Management | 57 (64.8%) | 31 (35.2%) |
| Business & Financial | 0 (0.0%) | 54 (100.0%) |
| Computers, Engineering & Science | 12 (100.0%) | 0 (0.0%) |
| Computers & Mathematics | 12 (100.0%) | 0 (0.0%) |
| Architecture & Engineering | 0 (0.0%) | 0 (0.0%) |
| Life, Physical & Social Science | 0 (0.0%) | 0 (0.0%) |
| Community & Social Service | 0 (0.0%) | 74 (100.0%) |
| Education, Arts & Media | 0 (0.0%) | 10 (100.0%) |
| Legal Services & Support | 0 (0.0%) | 0 (0.0%) |
| Education Instruction & Library | 0 (0.0%) | 64 (100.0%) |
| Arts, Media & Entertainment | 0 (0.0%) | 0 (0.0%) |
| Health Diagnosing & Treating | 0 (0.0%) | 66 (100.0%) |
| Health Technologists | 0 (0.0%) | 66 (100.0%) |
| Total (Category) | 69 (23.5%) | 225 (76.5%) |
| Total (Overall) | 703 (56.1%) | 549 (43.9%) |
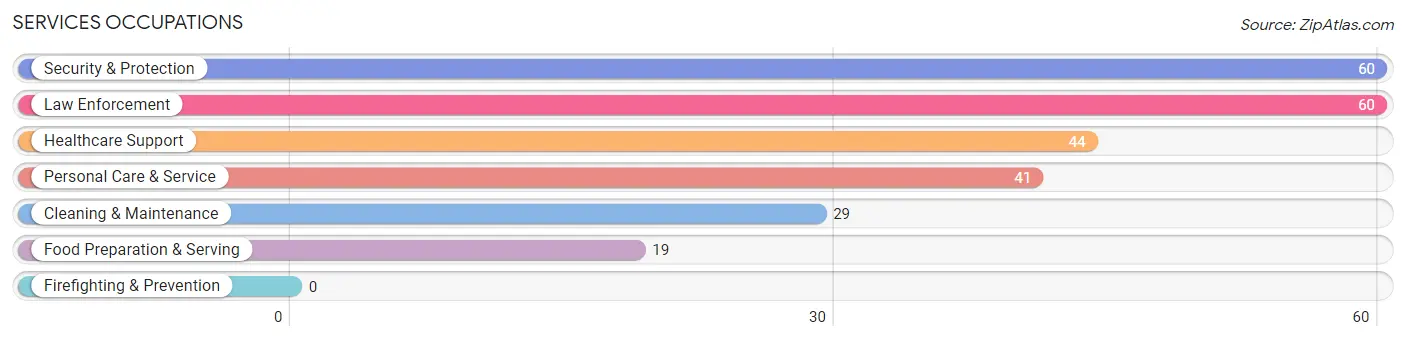
Services Occupations
The most common Services occupations in Ross are Security & Protection (60 | 4.8%), Law Enforcement (60 | 4.8%), Healthcare Support (44 | 3.5%), Personal Care & Service (41 | 3.3%), and Cleaning & Maintenance (29 | 2.3%).
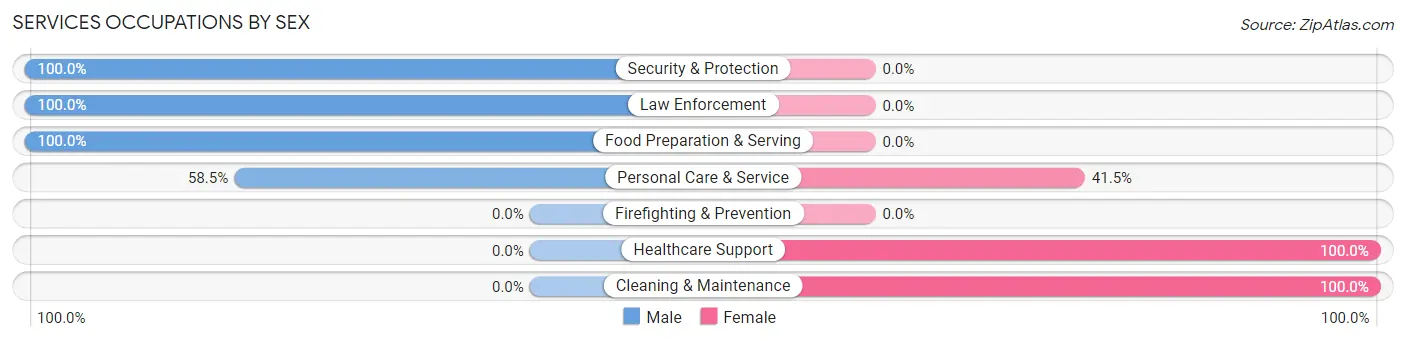
Services Occupations by Sex
Within the Services occupations in Ross, the most male-oriented occupations are Security & Protection (100.0%), Law Enforcement (100.0%), and Food Preparation & Serving (100.0%), while the most female-oriented occupations are Healthcare Support (100.0%), Cleaning & Maintenance (100.0%), and Personal Care & Service (41.5%).
| Occupation | Male | Female |
| Healthcare Support | 0 (0.0%) | 44 (100.0%) |
| Security & Protection | 60 (100.0%) | 0 (0.0%) |
| Firefighting & Prevention | 0 (0.0%) | 0 (0.0%) |
| Law Enforcement | 60 (100.0%) | 0 (0.0%) |
| Food Preparation & Serving | 19 (100.0%) | 0 (0.0%) |
| Cleaning & Maintenance | 0 (0.0%) | 29 (100.0%) |
| Personal Care & Service | 24 (58.5%) | 17 (41.5%) |
| Total (Category) | 103 (53.4%) | 90 (46.6%) |
| Total (Overall) | 703 (56.1%) | 549 (43.9%) |
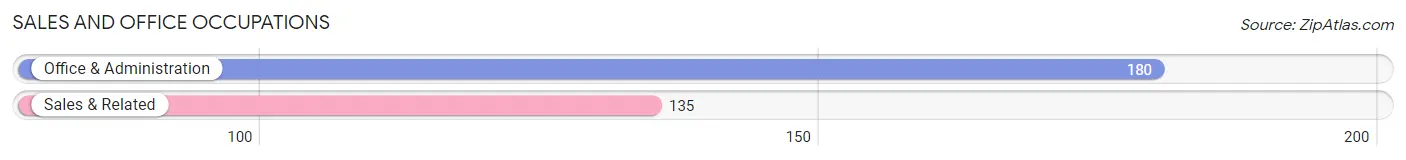
Sales and Office Occupations
The most common Sales and Office occupations in Ross are Office & Administration (180 | 14.4%), and Sales & Related (135 | 10.8%).
Sales and Office Occupations by Sex
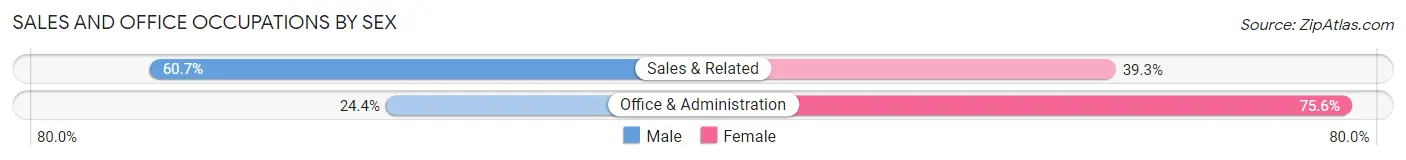
| Occupation | Male | Female |
| Sales & Related | 82 (60.7%) | 53 (39.3%) |
| Office & Administration | 44 (24.4%) | 136 (75.6%) |
| Total (Category) | 126 (40.0%) | 189 (60.0%) |
| Total (Overall) | 703 (56.1%) | 549 (43.9%) |
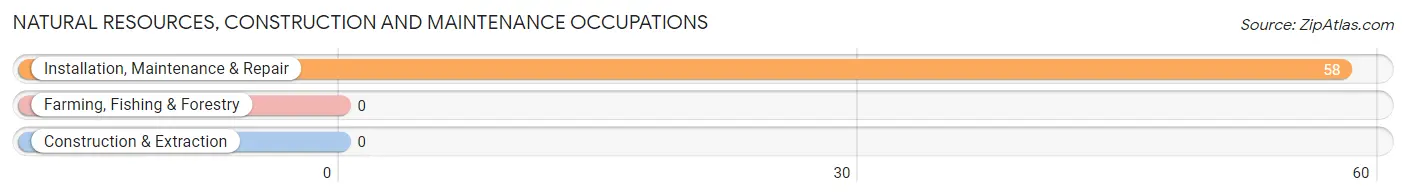
Natural Resources, Construction and Maintenance Occupations
The most common Natural Resources, Construction and Maintenance occupations in Ross are , and Installation, Maintenance & Repair (58 | 4.6%).
Natural Resources, Construction and Maintenance Occupations by Sex
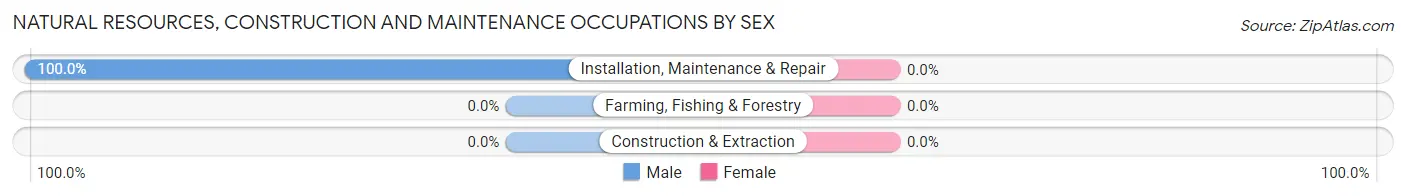
| Occupation | Male | Female |
| Farming, Fishing & Forestry | 0 (0.0%) | 0 (0.0%) |
| Construction & Extraction | 0 (0.0%) | 0 (0.0%) |
| Installation, Maintenance & Repair | 58 (100.0%) | 0 (0.0%) |
| Total (Category) | 58 (100.0%) | 0 (0.0%) |
| Total (Overall) | 703 (56.1%) | 549 (43.9%) |
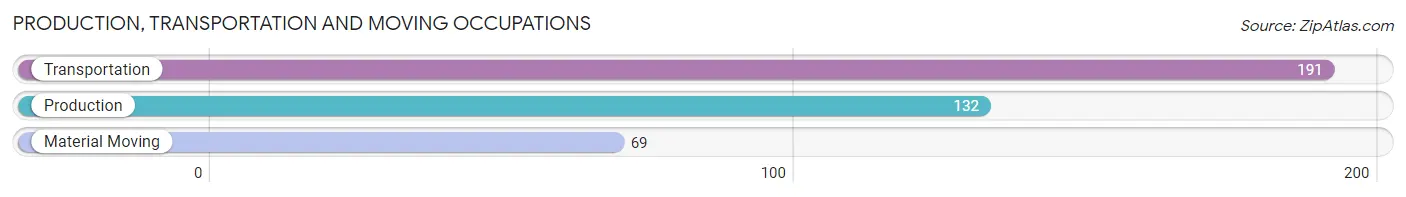
Production, Transportation and Moving Occupations
The most common Production, Transportation and Moving occupations in Ross are Transportation (191 | 15.3%), Production (132 | 10.5%), and Material Moving (69 | 5.5%).
Production, Transportation and Moving Occupations by Sex
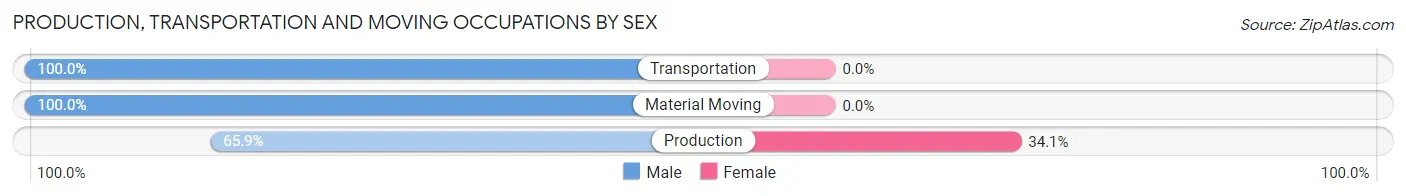
| Occupation | Male | Female |
| Production | 87 (65.9%) | 45 (34.1%) |
| Transportation | 191 (100.0%) | 0 (0.0%) |
| Material Moving | 69 (100.0%) | 0 (0.0%) |
| Total (Category) | 347 (88.5%) | 45 (11.5%) |
| Total (Overall) | 703 (56.1%) | 549 (43.9%) |
Employment Industries by Sex in Ross
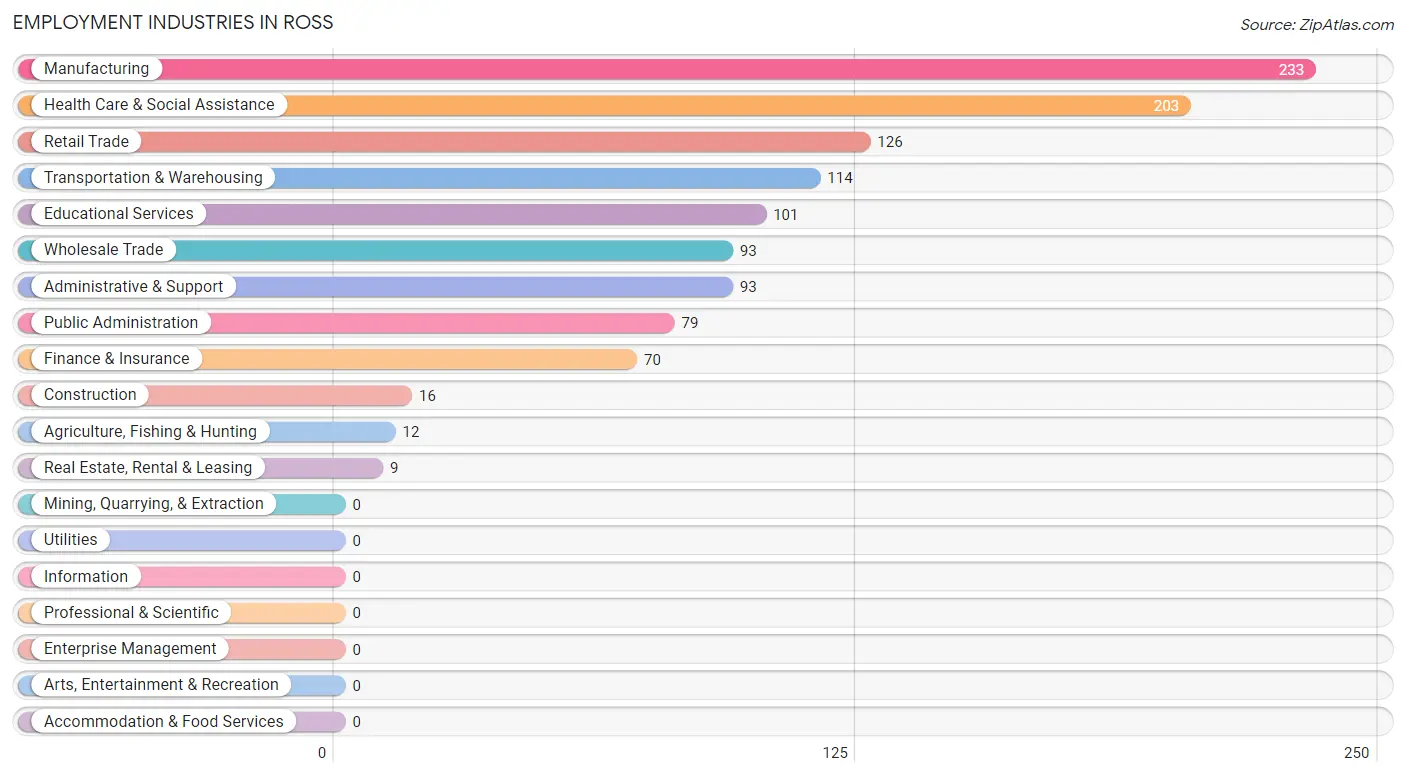
Employment Industries in Ross
The major employment industries in Ross include Manufacturing (233 | 18.6%), Health Care & Social Assistance (203 | 16.2%), Retail Trade (126 | 10.1%), Transportation & Warehousing (114 | 9.1%), and Educational Services (101 | 8.1%).
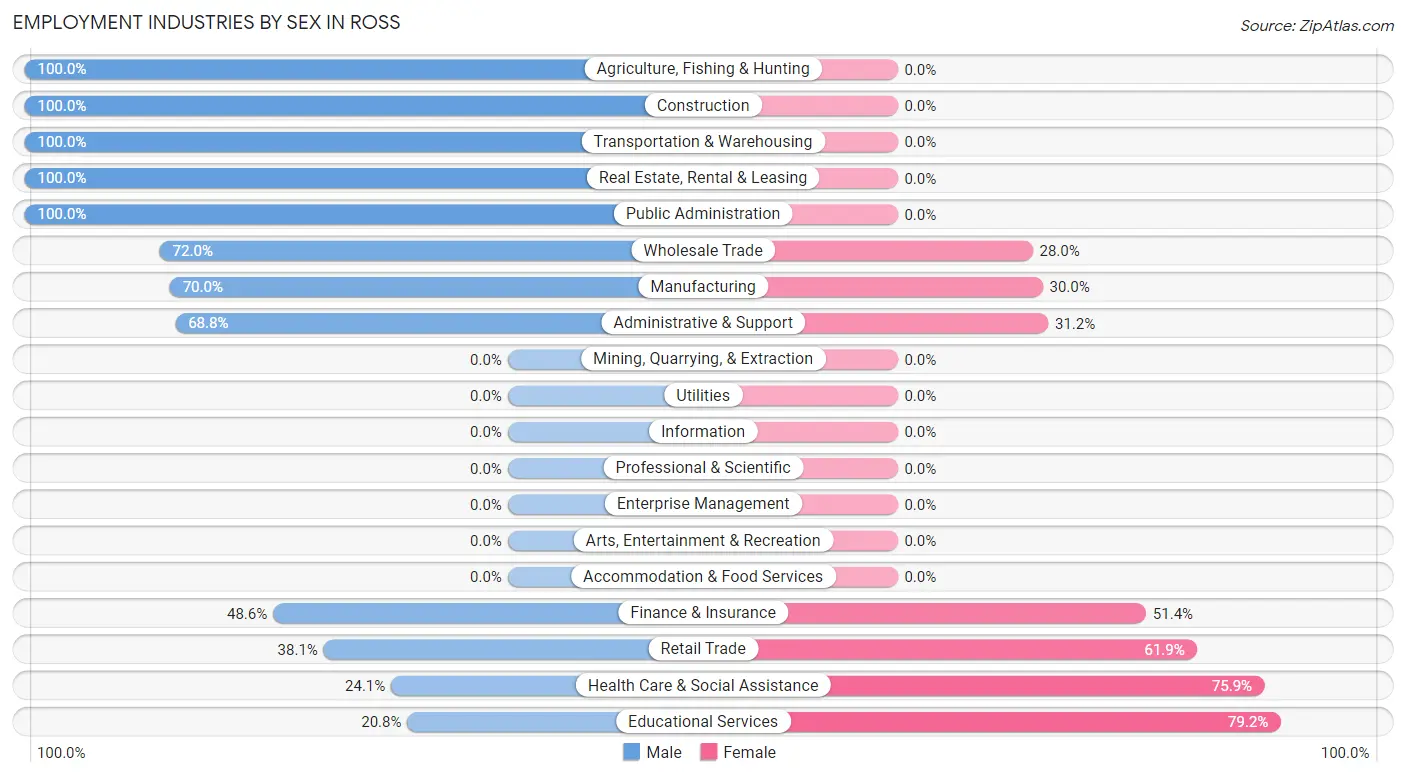
Employment Industries by Sex in Ross
The Ross industries that see more men than women are Agriculture, Fishing & Hunting (100.0%), Construction (100.0%), and Transportation & Warehousing (100.0%), whereas the industries that tend to have a higher number of women are Educational Services (79.2%), Health Care & Social Assistance (75.9%), and Retail Trade (61.9%).
| Industry | Male | Female |
| Agriculture, Fishing & Hunting | 12 (100.0%) | 0 (0.0%) |
| Mining, Quarrying, & Extraction | 0 (0.0%) | 0 (0.0%) |
| Construction | 16 (100.0%) | 0 (0.0%) |
| Manufacturing | 163 (70.0%) | 70 (30.0%) |
| Wholesale Trade | 67 (72.0%) | 26 (28.0%) |
| Retail Trade | 48 (38.1%) | 78 (61.9%) |
| Transportation & Warehousing | 114 (100.0%) | 0 (0.0%) |
| Utilities | 0 (0.0%) | 0 (0.0%) |
| Information | 0 (0.0%) | 0 (0.0%) |
| Finance & Insurance | 34 (48.6%) | 36 (51.4%) |
| Real Estate, Rental & Leasing | 9 (100.0%) | 0 (0.0%) |
| Professional & Scientific | 0 (0.0%) | 0 (0.0%) |
| Enterprise Management | 0 (0.0%) | 0 (0.0%) |
| Administrative & Support | 64 (68.8%) | 29 (31.2%) |
| Educational Services | 21 (20.8%) | 80 (79.2%) |
| Health Care & Social Assistance | 49 (24.1%) | 154 (75.9%) |
| Arts, Entertainment & Recreation | 0 (0.0%) | 0 (0.0%) |
| Accommodation & Food Services | 0 (0.0%) | 0 (0.0%) |
| Public Administration | 79 (100.0%) | 0 (0.0%) |
| Total | 703 (56.1%) | 549 (43.9%) |
Education in Ross
School Enrollment in Ross
The most common levels of schooling among the 752 students in Ross are middle school (217 | 28.9%), elementary school (182 | 24.2%), and high school (181 | 24.1%).
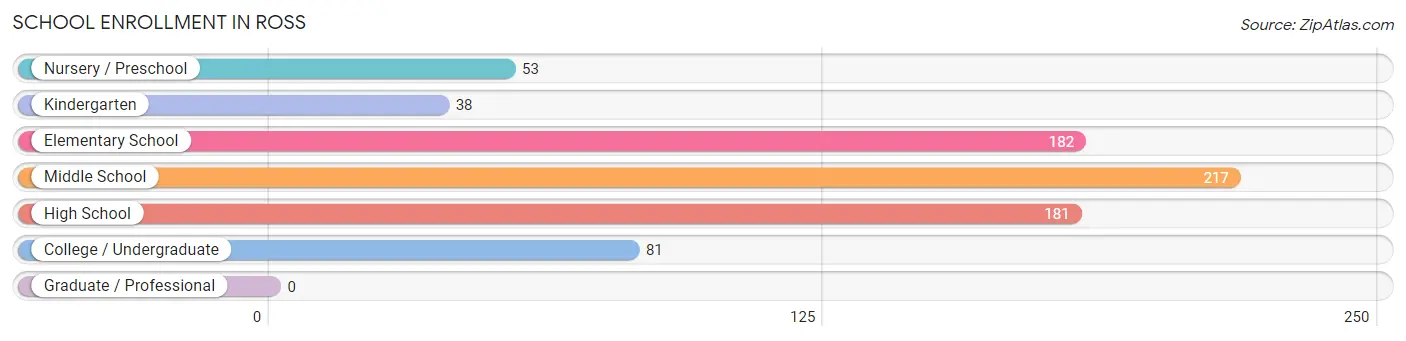
| School Level | # Students | % Students |
| Nursery / Preschool | 53 | 7.0% |
| Kindergarten | 38 | 5.1% |
| Elementary School | 182 | 24.2% |
| Middle School | 217 | 28.9% |
| High School | 181 | 24.1% |
| College / Undergraduate | 81 | 10.8% |
| Graduate / Professional | 0 | 0.0% |
| Total | 752 | 100.0% |
School Enrollment by Age by Funding Source in Ross
Out of a total of 752 students who are enrolled in schools in Ross, 118 (15.7%) attend a private institution, while the remaining 634 (84.3%) are enrolled in public schools. The age group of 15 to 17 year olds has the highest likelihood of being enrolled in private schools, with 91 (68.9% in the age bracket) enrolled. Conversely, the age group of 3 to 4 year olds has the lowest likelihood of being enrolled in a private school, with 53 (100.0% in the age bracket) attending a public institution.
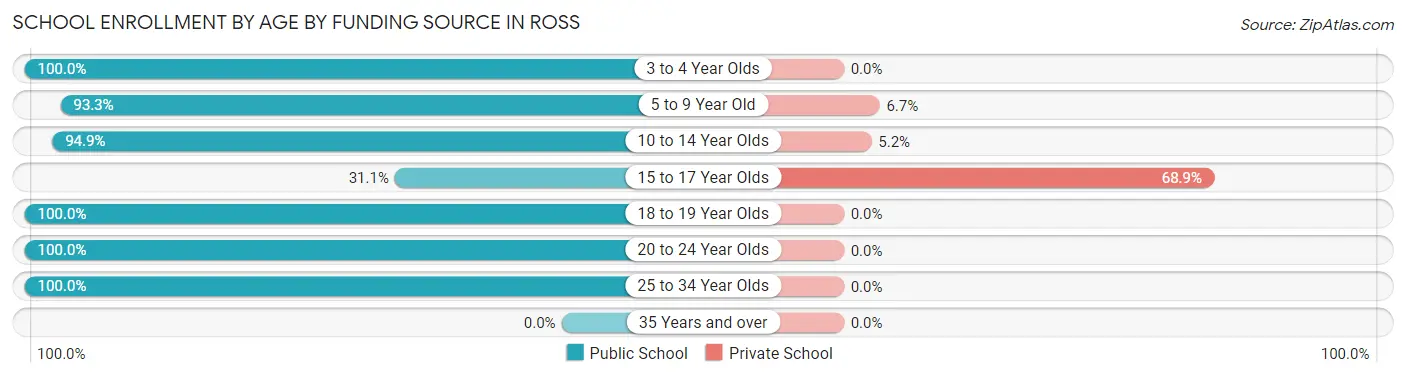
| Age Bracket | Public School | Private School |
| 3 to 4 Year Olds | 53 (100.0%) | 0 (0.0%) |
| 5 to 9 Year Old | 182 (93.3%) | 13 (6.7%) |
| 10 to 14 Year Olds | 258 (94.9%) | 14 (5.1%) |
| 15 to 17 Year Olds | 41 (31.1%) | 91 (68.9%) |
| 18 to 19 Year Olds | 19 (100.0%) | 0 (0.0%) |
| 20 to 24 Year Olds | 26 (100.0%) | 0 (0.0%) |
| 25 to 34 Year Olds | 55 (100.0%) | 0 (0.0%) |
| 35 Years and over | 0 (0.0%) | 0 (0.0%) |
| Total | 634 (84.3%) | 118 (15.7%) |
Educational Attainment by Field of Study in Ross
Business (135 | 25.4%), science & technology (115 | 21.6%), education (102 | 19.2%), social sciences (60 | 11.3%), and arts & humanities (39 | 7.3%) are the most common fields of study among 532 individuals in Ross who have obtained a bachelor's degree or higher.
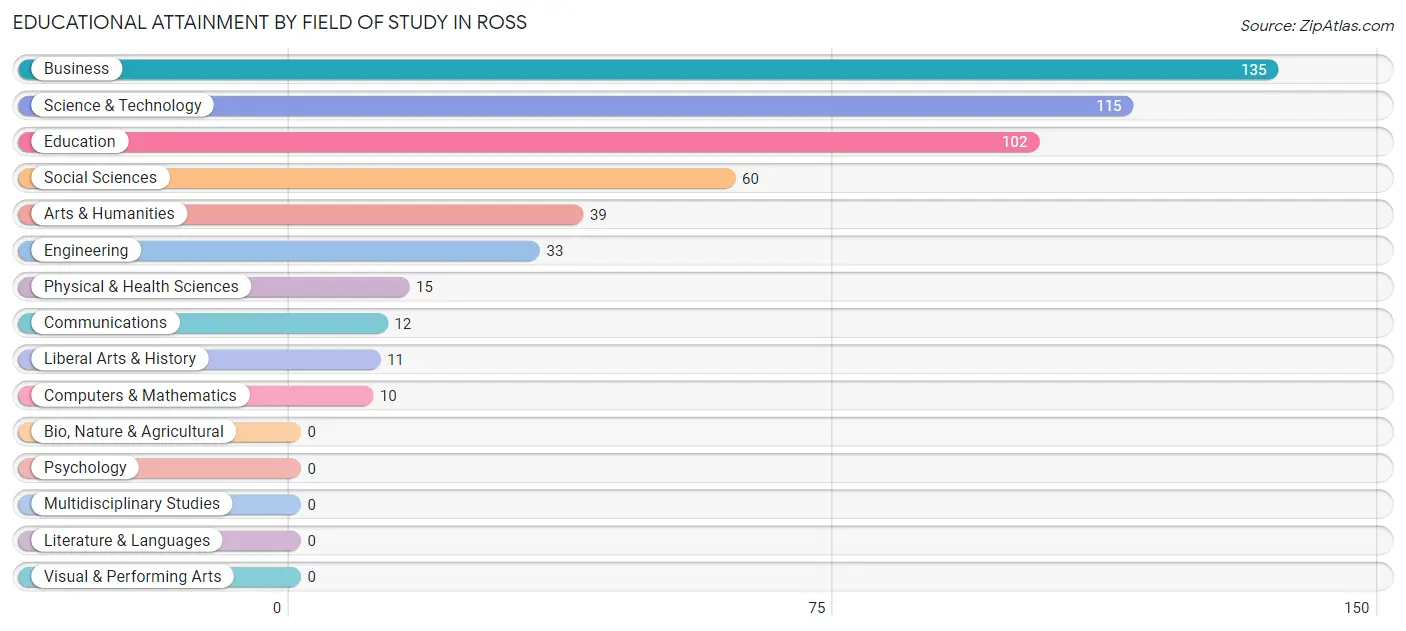
| Field of Study | # Graduates | % Graduates |
| Computers & Mathematics | 10 | 1.9% |
| Bio, Nature & Agricultural | 0 | 0.0% |
| Physical & Health Sciences | 15 | 2.8% |
| Psychology | 0 | 0.0% |
| Social Sciences | 60 | 11.3% |
| Engineering | 33 | 6.2% |
| Multidisciplinary Studies | 0 | 0.0% |
| Science & Technology | 115 | 21.6% |
| Business | 135 | 25.4% |
| Education | 102 | 19.2% |
| Literature & Languages | 0 | 0.0% |
| Liberal Arts & History | 11 | 2.1% |
| Visual & Performing Arts | 0 | 0.0% |
| Communications | 12 | 2.3% |
| Arts & Humanities | 39 | 7.3% |
| Total | 532 | 100.0% |
Transportation & Commute in Ross
Vehicle Availability by Sex in Ross
The most prevalent vehicle ownership categories in Ross are males with 4 vehicles (178, accounting for 32.7%) and females with 4 vehicles (132, making up 33.9%).
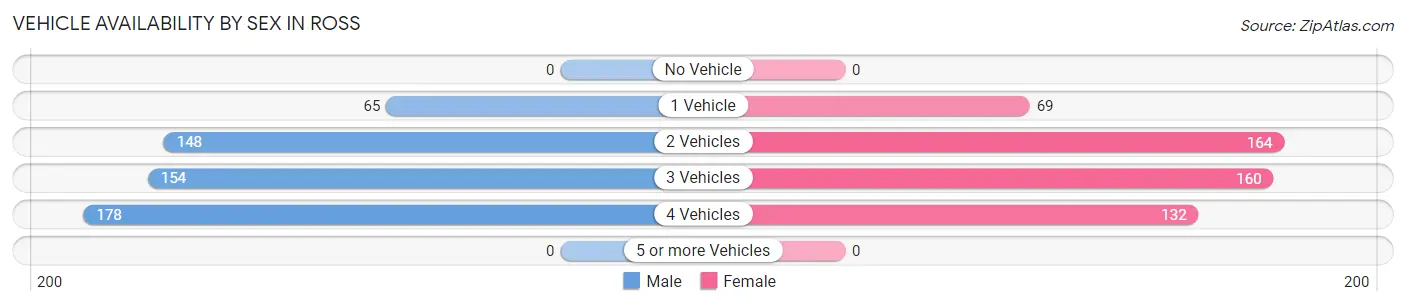
| Vehicles Available | Male | Female |
| No Vehicle | 0 (0.0%) | 0 (0.0%) |
| 1 Vehicle | 65 (11.9%) | 69 (13.1%) |
| 2 Vehicles | 148 (27.2%) | 164 (31.2%) |
| 3 Vehicles | 154 (28.3%) | 160 (30.5%) |
| 4 Vehicles | 178 (32.7%) | 132 (25.1%) |
| 5 or more Vehicles | 0 (0.0%) | 0 (0.0%) |
| Total | 545 (100.0%) | 525 (100.0%) |
Commute Time in Ross
The most frequently occuring commute durations in Ross are 15 to 19 minutes (202 commuters, 20.5%), 25 to 29 minutes (191 commuters, 19.4%), and 30 to 34 minutes (186 commuters, 18.9%).
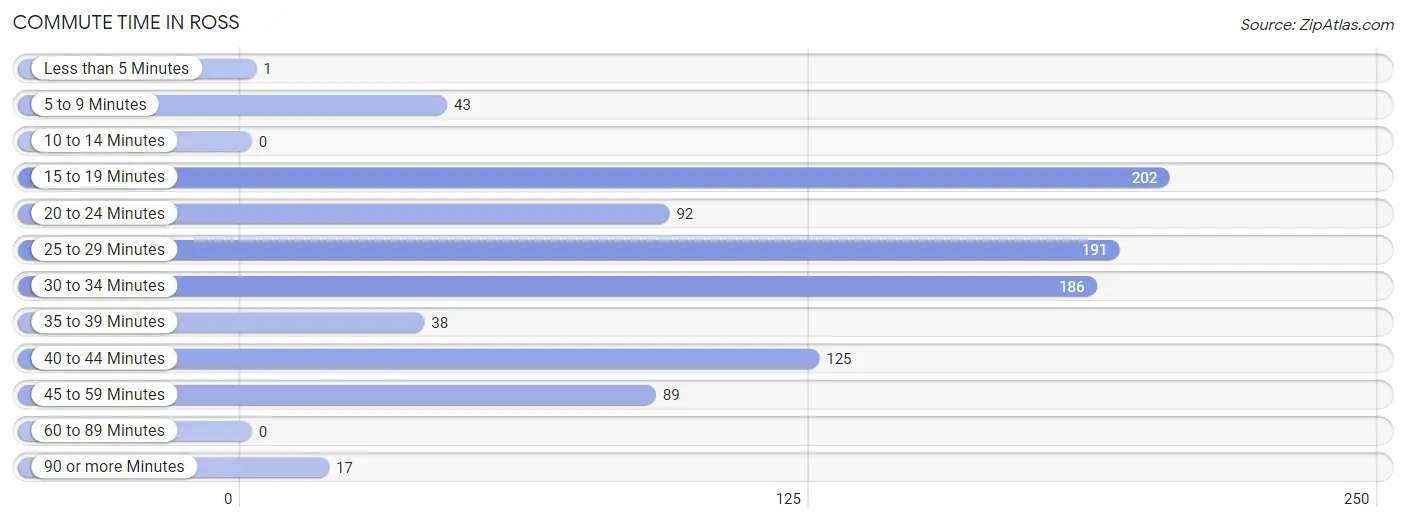
| Commute Time | # Commuters | % Commuters |
| Less than 5 Minutes | 1 | 0.1% |
| 5 to 9 Minutes | 43 | 4.4% |
| 10 to 14 Minutes | 0 | 0.0% |
| 15 to 19 Minutes | 202 | 20.5% |
| 20 to 24 Minutes | 92 | 9.3% |
| 25 to 29 Minutes | 191 | 19.4% |
| 30 to 34 Minutes | 186 | 18.9% |
| 35 to 39 Minutes | 38 | 3.9% |
| 40 to 44 Minutes | 125 | 12.7% |
| 45 to 59 Minutes | 89 | 9.0% |
| 60 to 89 Minutes | 0 | 0.0% |
| 90 or more Minutes | 17 | 1.7% |
Commute Time by Sex in Ross
The most common commute times in Ross are 30 to 34 minutes (124 commuters, 24.0%) for males and 15 to 19 minutes (124 commuters, 26.6%) for females.
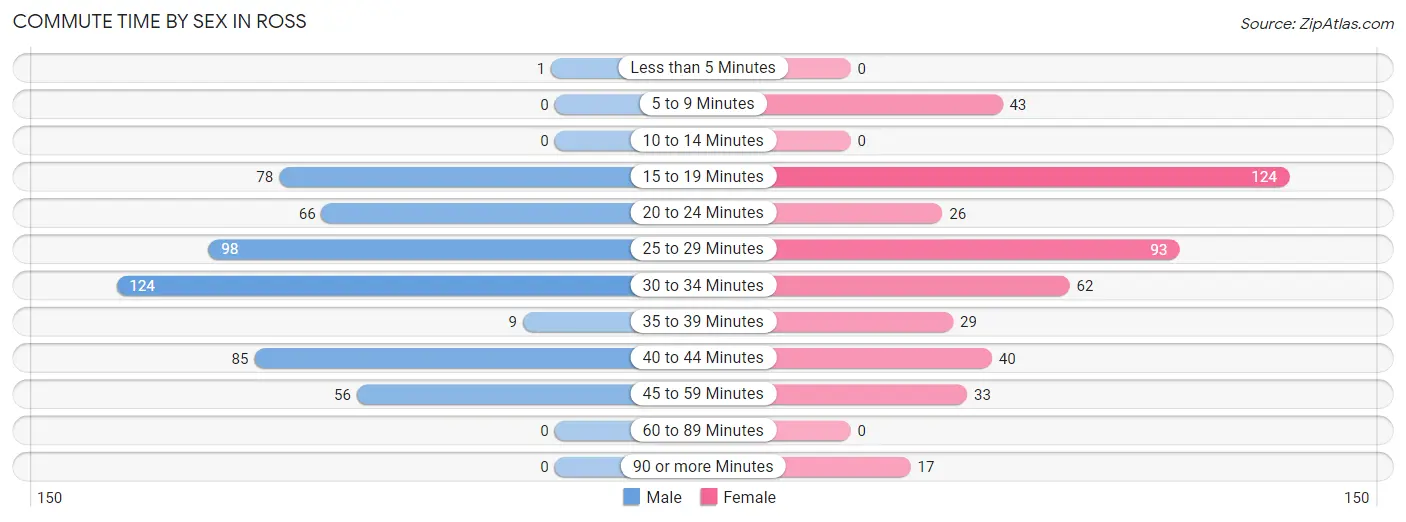
| Commute Time | Male | Female |
| Less than 5 Minutes | 1 (0.2%) | 0 (0.0%) |
| 5 to 9 Minutes | 0 (0.0%) | 43 (9.2%) |
| 10 to 14 Minutes | 0 (0.0%) | 0 (0.0%) |
| 15 to 19 Minutes | 78 (15.1%) | 124 (26.6%) |
| 20 to 24 Minutes | 66 (12.8%) | 26 (5.6%) |
| 25 to 29 Minutes | 98 (19.0%) | 93 (19.9%) |
| 30 to 34 Minutes | 124 (24.0%) | 62 (13.3%) |
| 35 to 39 Minutes | 9 (1.7%) | 29 (6.2%) |
| 40 to 44 Minutes | 85 (16.4%) | 40 (8.6%) |
| 45 to 59 Minutes | 56 (10.8%) | 33 (7.1%) |
| 60 to 89 Minutes | 0 (0.0%) | 0 (0.0%) |
| 90 or more Minutes | 0 (0.0%) | 17 (3.6%) |
Time of Departure to Work by Sex in Ross
The most frequent times of departure to work in Ross are 12:00 AM to 4:59 AM (158, 30.6%) for males and 7:00 AM to 7:29 AM (93, 19.9%) for females.
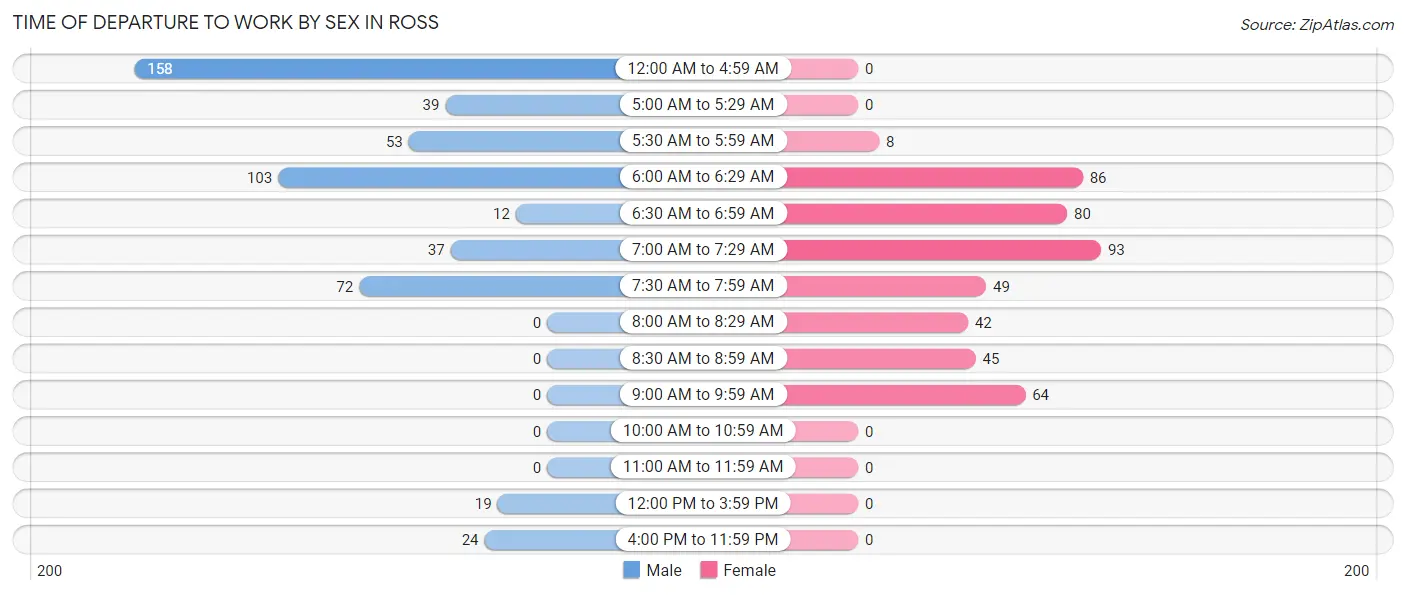
| Time of Departure | Male | Female |
| 12:00 AM to 4:59 AM | 158 (30.6%) | 0 (0.0%) |
| 5:00 AM to 5:29 AM | 39 (7.5%) | 0 (0.0%) |
| 5:30 AM to 5:59 AM | 53 (10.2%) | 8 (1.7%) |
| 6:00 AM to 6:29 AM | 103 (19.9%) | 86 (18.4%) |
| 6:30 AM to 6:59 AM | 12 (2.3%) | 80 (17.1%) |
| 7:00 AM to 7:29 AM | 37 (7.2%) | 93 (19.9%) |
| 7:30 AM to 7:59 AM | 72 (13.9%) | 49 (10.5%) |
| 8:00 AM to 8:29 AM | 0 (0.0%) | 42 (9.0%) |
| 8:30 AM to 8:59 AM | 0 (0.0%) | 45 (9.6%) |
| 9:00 AM to 9:59 AM | 0 (0.0%) | 64 (13.7%) |
| 10:00 AM to 10:59 AM | 0 (0.0%) | 0 (0.0%) |
| 11:00 AM to 11:59 AM | 0 (0.0%) | 0 (0.0%) |
| 12:00 PM to 3:59 PM | 19 (3.7%) | 0 (0.0%) |
| 4:00 PM to 11:59 PM | 24 (4.6%) | 0 (0.0%) |
| Total | 517 (100.0%) | 467 (100.0%) |
Housing Occupancy in Ross
Occupancy by Ownership in Ross
Of the total 1,000 dwellings in Ross, owner-occupied units account for 667 (66.7%), while renter-occupied units make up 333 (33.3%).
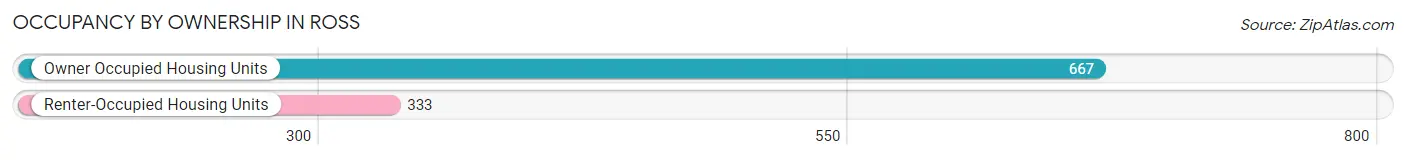
| Occupancy | # Housing Units | % Housing Units |
| Owner Occupied Housing Units | 667 | 66.7% |
| Renter-Occupied Housing Units | 333 | 33.3% |
| Total Occupied Housing Units | 1,000 | 100.0% |
Occupancy by Household Size in Ross
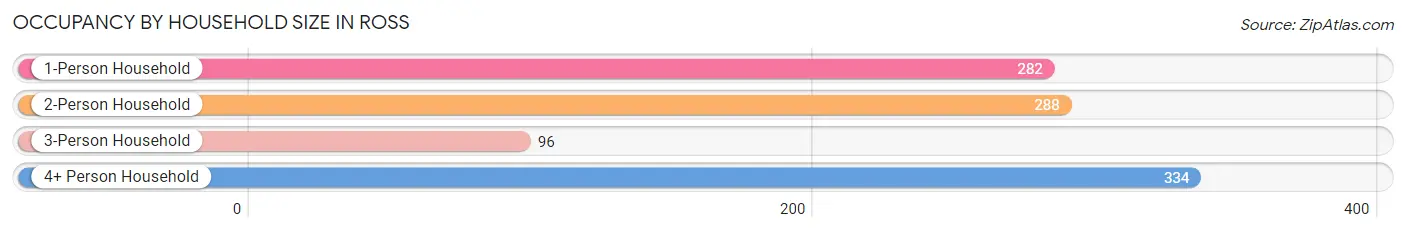
| Household Size | # Housing Units | % Housing Units |
| 1-Person Household | 282 | 28.2% |
| 2-Person Household | 288 | 28.8% |
| 3-Person Household | 96 | 9.6% |
| 4+ Person Household | 334 | 33.4% |
| Total Housing Units | 1,000 | 100.0% |
Occupancy by Ownership by Household Size in Ross
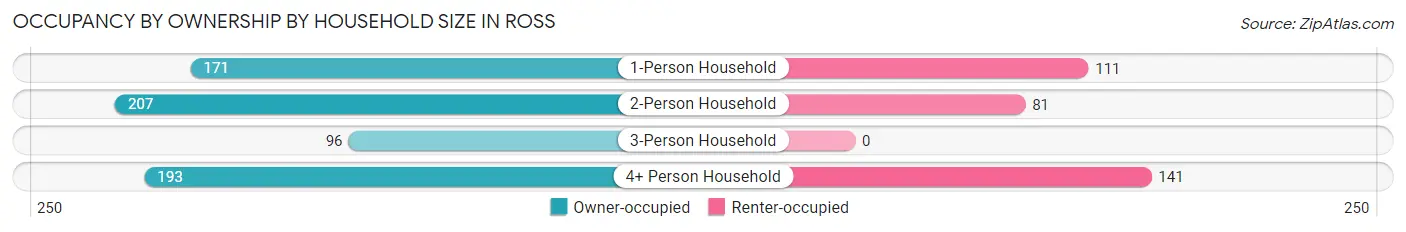
| Household Size | Owner-occupied | Renter-occupied |
| 1-Person Household | 171 (60.6%) | 111 (39.4%) |
| 2-Person Household | 207 (71.9%) | 81 (28.1%) |
| 3-Person Household | 96 (100.0%) | 0 (0.0%) |
| 4+ Person Household | 193 (57.8%) | 141 (42.2%) |
| Total Housing Units | 667 (66.7%) | 333 (33.3%) |
Occupancy by Educational Attainment in Ross
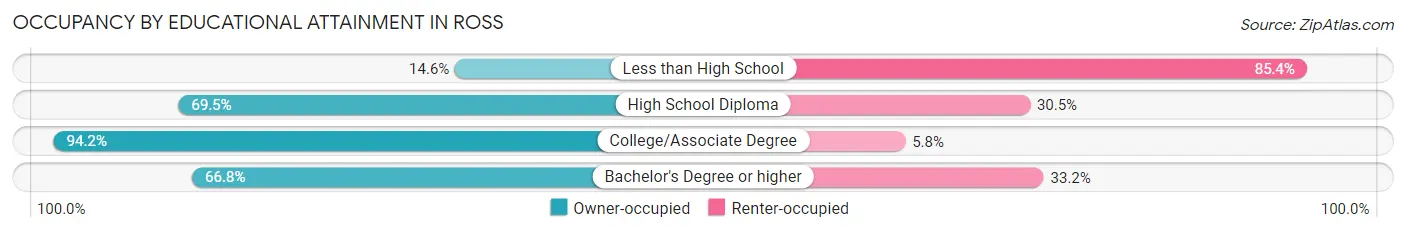
| Household Size | Owner-occupied | Renter-occupied |
| Less than High School | 24 (14.6%) | 140 (85.4%) |
| High School Diploma | 212 (69.5%) | 93 (30.5%) |
| College/Associate Degree | 262 (94.2%) | 16 (5.8%) |
| Bachelor's Degree or higher | 169 (66.8%) | 84 (33.2%) |
Occupancy by Age of Householder in Ross
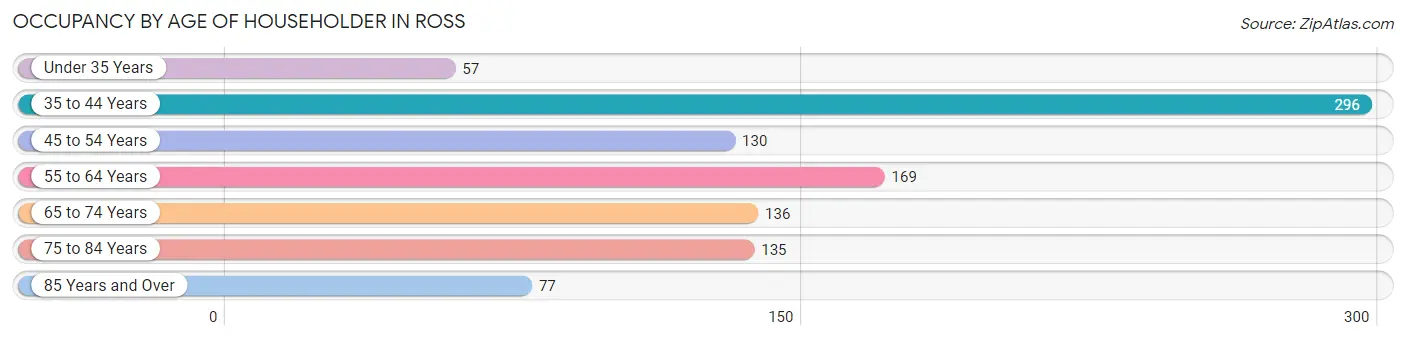
| Age Bracket | # Households | % Households |
| Under 35 Years | 57 | 5.7% |
| 35 to 44 Years | 296 | 29.6% |
| 45 to 54 Years | 130 | 13.0% |
| 55 to 64 Years | 169 | 16.9% |
| 65 to 74 Years | 136 | 13.6% |
| 75 to 84 Years | 135 | 13.5% |
| 85 Years and Over | 77 | 7.7% |
| Total | 1,000 | 100.0% |
Housing Finances in Ross
Median Income by Occupancy in Ross
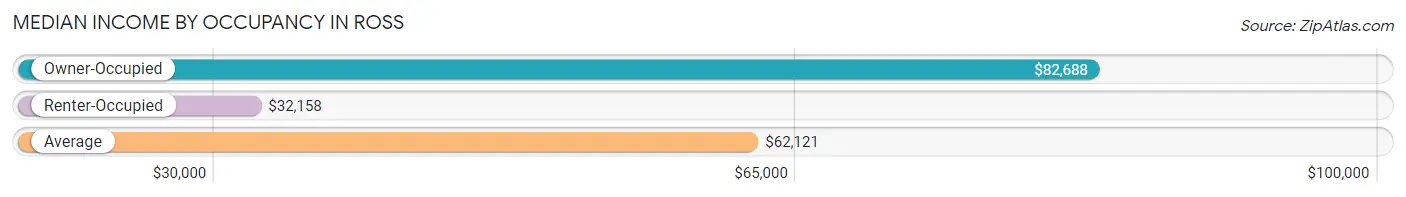
| Occupancy Type | # Households | Median Income |
| Owner-Occupied | 667 (66.7%) | $82,688 |
| Renter-Occupied | 333 (33.3%) | $32,158 |
| Average | 1,000 (100.0%) | $62,121 |
Occupancy by Householder Income Bracket in Ross
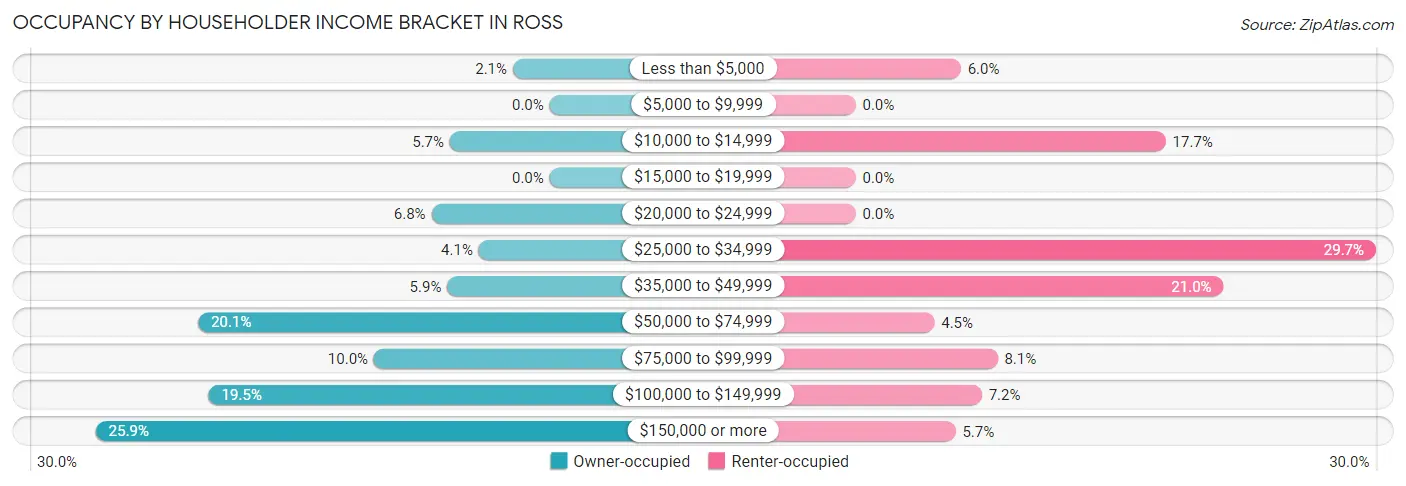
| Income Bracket | Owner-occupied | Renter-occupied |
| Less than $5,000 | 14 (2.1%) | 20 (6.0%) |
| $5,000 to $9,999 | 0 (0.0%) | 0 (0.0%) |
| $10,000 to $14,999 | 38 (5.7%) | 59 (17.7%) |
| $15,000 to $19,999 | 0 (0.0%) | 0 (0.0%) |
| $20,000 to $24,999 | 45 (6.8%) | 0 (0.0%) |
| $25,000 to $34,999 | 27 (4.1%) | 99 (29.7%) |
| $35,000 to $49,999 | 39 (5.9%) | 70 (21.0%) |
| $50,000 to $74,999 | 134 (20.1%) | 15 (4.5%) |
| $75,000 to $99,999 | 67 (10.0%) | 27 (8.1%) |
| $100,000 to $149,999 | 130 (19.5%) | 24 (7.2%) |
| $150,000 or more | 173 (25.9%) | 19 (5.7%) |
| Total | 667 (100.0%) | 333 (100.0%) |
Monthly Housing Cost Tiers in Ross
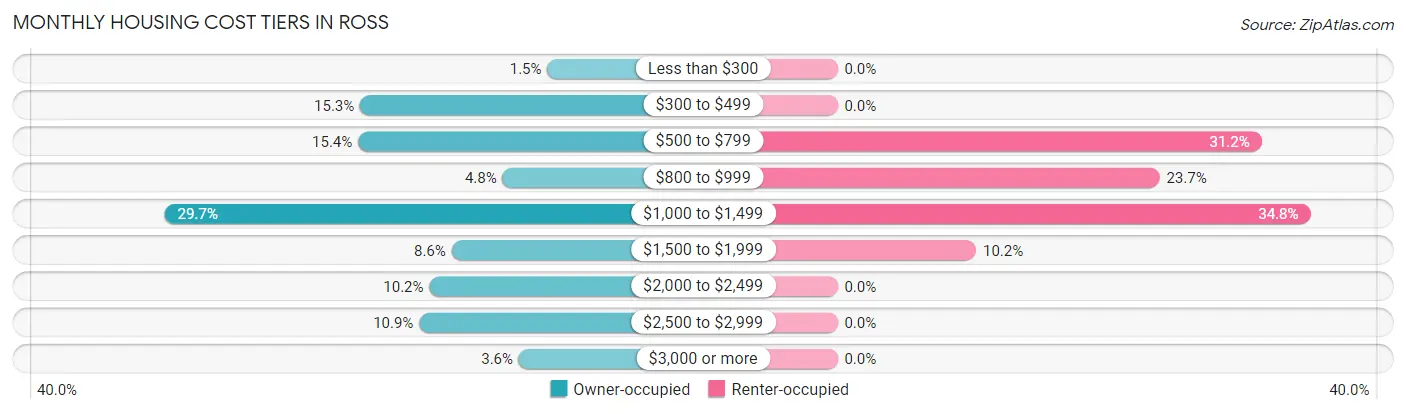
| Monthly Cost | Owner-occupied | Renter-occupied |
| Less than $300 | 10 (1.5%) | 0 (0.0%) |
| $300 to $499 | 102 (15.3%) | 0 (0.0%) |
| $500 to $799 | 103 (15.4%) | 104 (31.2%) |
| $800 to $999 | 32 (4.8%) | 79 (23.7%) |
| $1,000 to $1,499 | 198 (29.7%) | 116 (34.8%) |
| $1,500 to $1,999 | 57 (8.6%) | 34 (10.2%) |
| $2,000 to $2,499 | 68 (10.2%) | 0 (0.0%) |
| $2,500 to $2,999 | 73 (10.9%) | 0 (0.0%) |
| $3,000 or more | 24 (3.6%) | 0 (0.0%) |
| Total | 667 (100.0%) | 333 (100.0%) |
Physical Housing Characteristics in Ross
Housing Structures in Ross
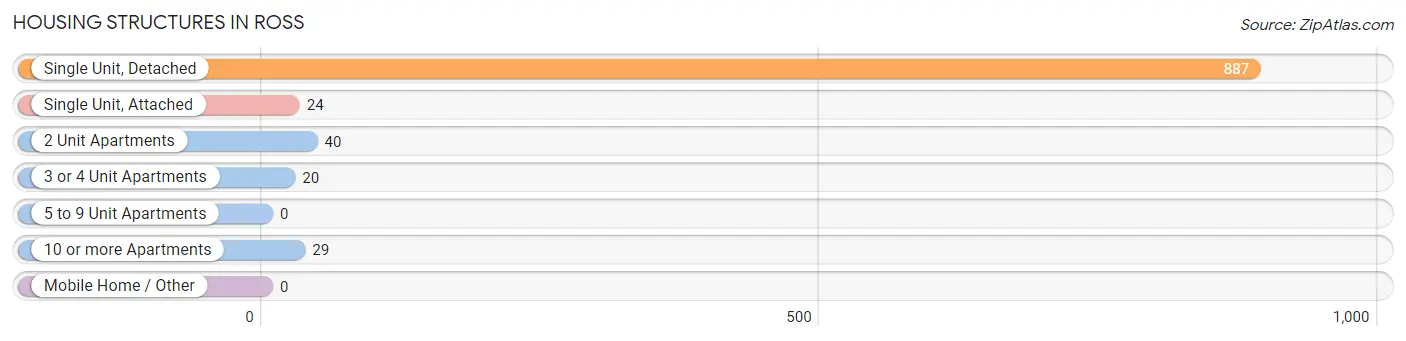
| Structure Type | # Housing Units | % Housing Units |
| Single Unit, Detached | 887 | 88.7% |
| Single Unit, Attached | 24 | 2.4% |
| 2 Unit Apartments | 40 | 4.0% |
| 3 or 4 Unit Apartments | 20 | 2.0% |
| 5 to 9 Unit Apartments | 0 | 0.0% |
| 10 or more Apartments | 29 | 2.9% |
| Mobile Home / Other | 0 | 0.0% |
| Total | 1,000 | 100.0% |
Housing Structures by Occupancy in Ross
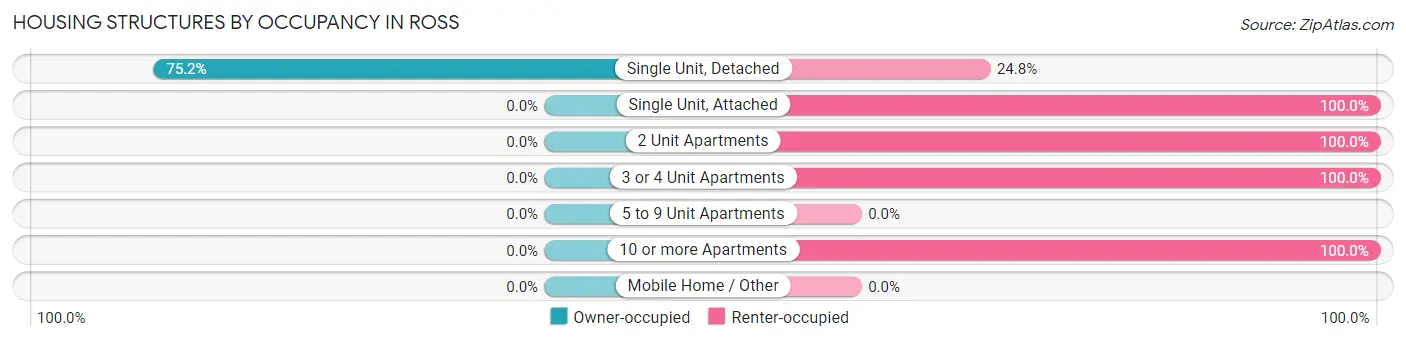
| Structure Type | Owner-occupied | Renter-occupied |
| Single Unit, Detached | 667 (75.2%) | 220 (24.8%) |
| Single Unit, Attached | 0 (0.0%) | 24 (100.0%) |
| 2 Unit Apartments | 0 (0.0%) | 40 (100.0%) |
| 3 or 4 Unit Apartments | 0 (0.0%) | 20 (100.0%) |
| 5 to 9 Unit Apartments | 0 (0.0%) | 0 (0.0%) |
| 10 or more Apartments | 0 (0.0%) | 29 (100.0%) |
| Mobile Home / Other | 0 (0.0%) | 0 (0.0%) |
| Total | 667 (66.7%) | 333 (33.3%) |
Housing Structures by Number of Rooms in Ross
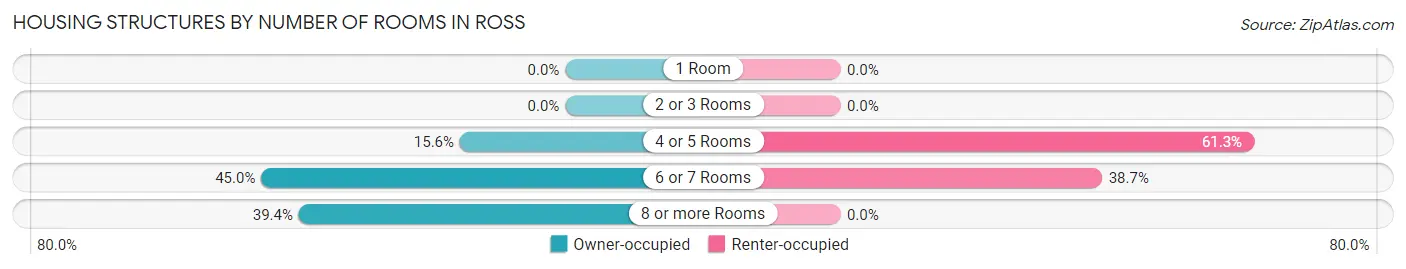
| Number of Rooms | Owner-occupied | Renter-occupied |
| 1 Room | 0 (0.0%) | 0 (0.0%) |
| 2 or 3 Rooms | 0 (0.0%) | 0 (0.0%) |
| 4 or 5 Rooms | 104 (15.6%) | 204 (61.3%) |
| 6 or 7 Rooms | 300 (45.0%) | 129 (38.7%) |
| 8 or more Rooms | 263 (39.4%) | 0 (0.0%) |
| Total | 667 (100.0%) | 333 (100.0%) |
Housing Structure by Heating Type in Ross
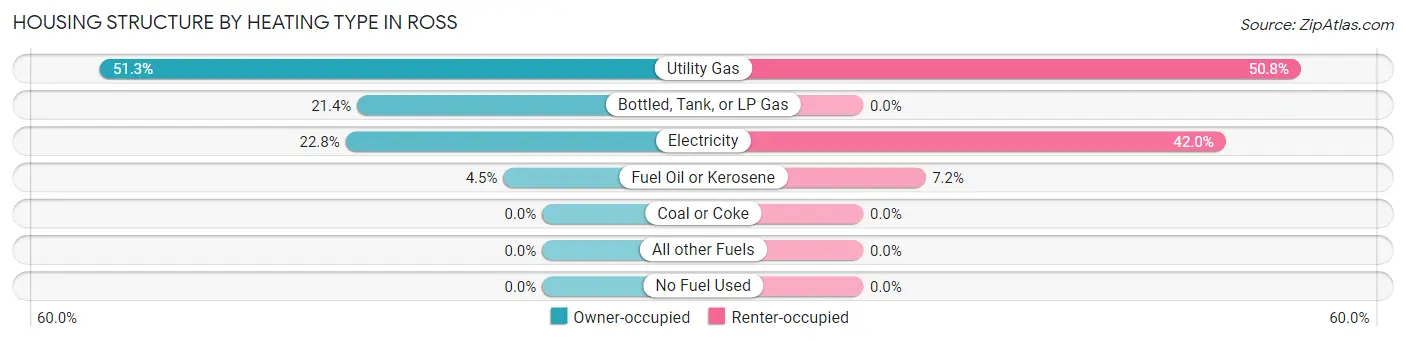
| Heating Type | Owner-occupied | Renter-occupied |
| Utility Gas | 342 (51.3%) | 169 (50.7%) |
| Bottled, Tank, or LP Gas | 143 (21.4%) | 0 (0.0%) |
| Electricity | 152 (22.8%) | 140 (42.0%) |
| Fuel Oil or Kerosene | 30 (4.5%) | 24 (7.2%) |
| Coal or Coke | 0 (0.0%) | 0 (0.0%) |
| All other Fuels | 0 (0.0%) | 0 (0.0%) |
| No Fuel Used | 0 (0.0%) | 0 (0.0%) |
| Total | 667 (100.0%) | 333 (100.0%) |
Household Vehicle Usage in Ross
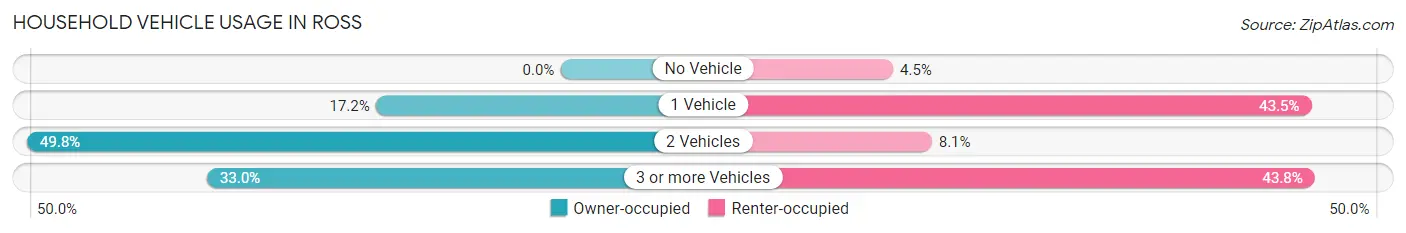
| Vehicles per Household | Owner-occupied | Renter-occupied |
| No Vehicle | 0 (0.0%) | 15 (4.5%) |
| 1 Vehicle | 115 (17.2%) | 145 (43.5%) |
| 2 Vehicles | 332 (49.8%) | 27 (8.1%) |
| 3 or more Vehicles | 220 (33.0%) | 146 (43.8%) |
| Total | 667 (100.0%) | 333 (100.0%) |
Real Estate & Mortgages in Ross
Real Estate and Mortgage Overview in Ross
| Characteristic | Without Mortgage | With Mortgage |
| Housing Units | 239 | 428 |
| Median Property Value | $262,500 | $242,600 |
| Median Household Income | $58,625 | $134 |
| Monthly Housing Costs | $517 | $24 |
| Real Estate Taxes | $3,322 | $0 |
Property Value by Mortgage Status in Ross
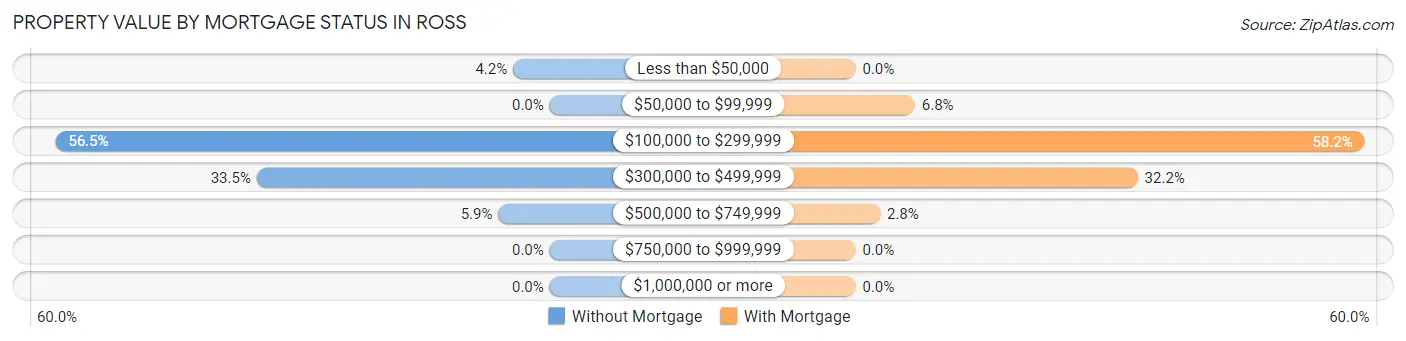
| Property Value | Without Mortgage | With Mortgage |
| Less than $50,000 | 10 (4.2%) | 0 (0.0%) |
| $50,000 to $99,999 | 0 (0.0%) | 29 (6.8%) |
| $100,000 to $299,999 | 135 (56.5%) | 249 (58.2%) |
| $300,000 to $499,999 | 80 (33.5%) | 138 (32.2%) |
| $500,000 to $749,999 | 14 (5.9%) | 12 (2.8%) |
| $750,000 to $999,999 | 0 (0.0%) | 0 (0.0%) |
| $1,000,000 or more | 0 (0.0%) | 0 (0.0%) |
| Total | 239 (100.0%) | 428 (100.0%) |
Household Income by Mortgage Status in Ross
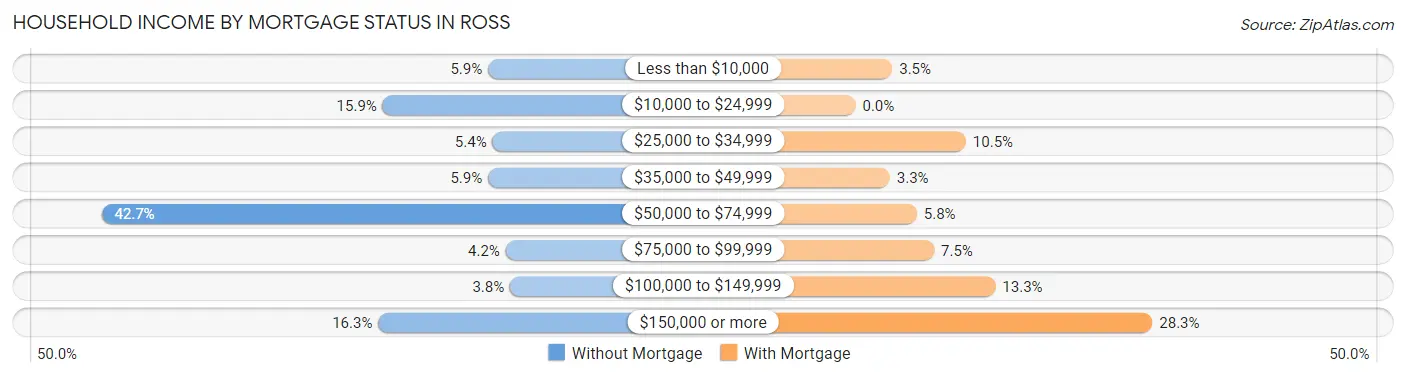
| Household Income | Without Mortgage | With Mortgage |
| Less than $10,000 | 14 (5.9%) | 15 (3.5%) |
| $10,000 to $24,999 | 38 (15.9%) | 0 (0.0%) |
| $25,000 to $34,999 | 13 (5.4%) | 45 (10.5%) |
| $35,000 to $49,999 | 14 (5.9%) | 14 (3.3%) |
| $50,000 to $74,999 | 102 (42.7%) | 25 (5.8%) |
| $75,000 to $99,999 | 10 (4.2%) | 32 (7.5%) |
| $100,000 to $149,999 | 9 (3.8%) | 57 (13.3%) |
| $150,000 or more | 39 (16.3%) | 121 (28.3%) |
| Total | 239 (100.0%) | 428 (100.0%) |
Property Value to Household Income Ratio in Ross
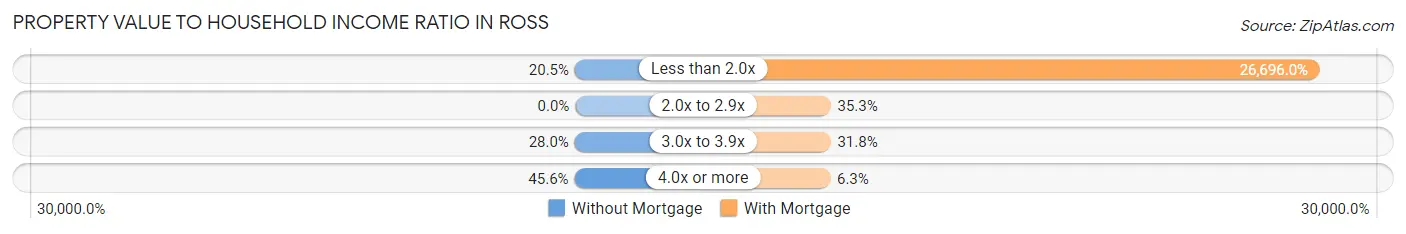
| Value-to-Income Ratio | Without Mortgage | With Mortgage |
| Less than 2.0x | 49 (20.5%) | 114,259 (26,696.0%) |
| 2.0x to 2.9x | 0 (0.0%) | 151 (35.3%) |
| 3.0x to 3.9x | 67 (28.0%) | 136 (31.8%) |
| 4.0x or more | 109 (45.6%) | 27 (6.3%) |
| Total | 239 (100.0%) | 428 (100.0%) |
Real Estate Taxes by Mortgage Status in Ross
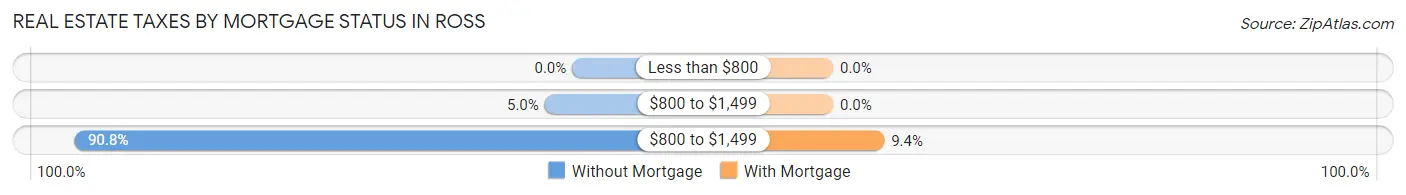
| Property Taxes | Without Mortgage | With Mortgage |
| Less than $800 | 0 (0.0%) | 0 (0.0%) |
| $800 to $1,499 | 12 (5.0%) | 0 (0.0%) |
| $800 to $1,499 | 217 (90.8%) | 40 (9.3%) |
| Total | 239 (100.0%) | 428 (100.0%) |
Health & Disability in Ross
Health Insurance Coverage by Age in Ross
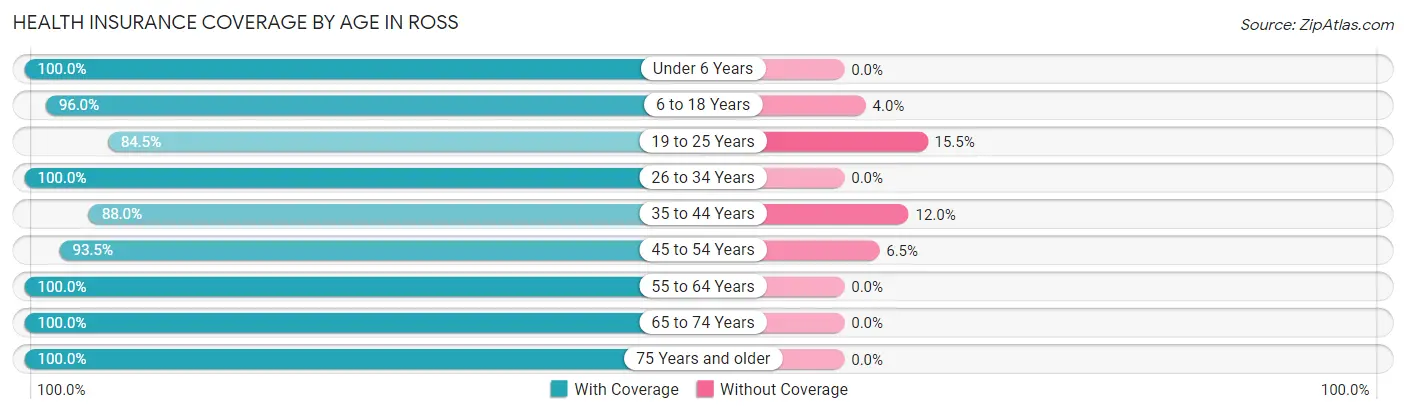
| Age Bracket | With Coverage | Without Coverage |
| Under 6 Years | 146 (100.0%) | 0 (0.0%) |
| 6 to 18 Years | 581 (96.0%) | 24 (4.0%) |
| 19 to 25 Years | 245 (84.5%) | 45 (15.5%) |
| 26 to 34 Years | 113 (100.0%) | 0 (0.0%) |
| 35 to 44 Years | 441 (88.0%) | 60 (12.0%) |
| 45 to 54 Years | 229 (93.5%) | 16 (6.5%) |
| 55 to 64 Years | 399 (100.0%) | 0 (0.0%) |
| 65 to 74 Years | 253 (100.0%) | 0 (0.0%) |
| 75 Years and older | 271 (100.0%) | 0 (0.0%) |
| Total | 2,678 (94.9%) | 145 (5.1%) |
Health Insurance Coverage by Citizenship Status in Ross
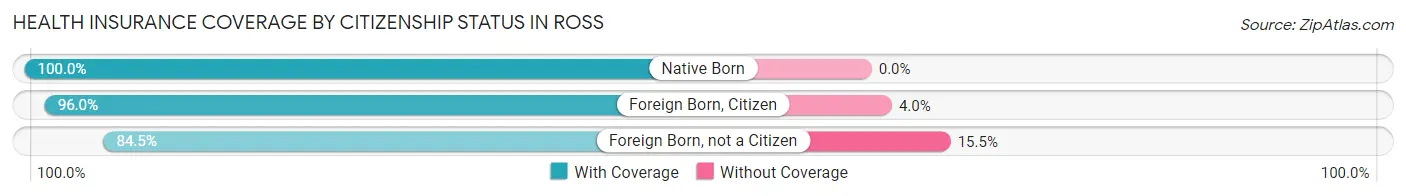
| Citizenship Status | With Coverage | Without Coverage |
| Native Born | 146 (100.0%) | 0 (0.0%) |
| Foreign Born, Citizen | 581 (96.0%) | 24 (4.0%) |
| Foreign Born, not a Citizen | 245 (84.5%) | 45 (15.5%) |
Health Insurance Coverage by Household Income in Ross
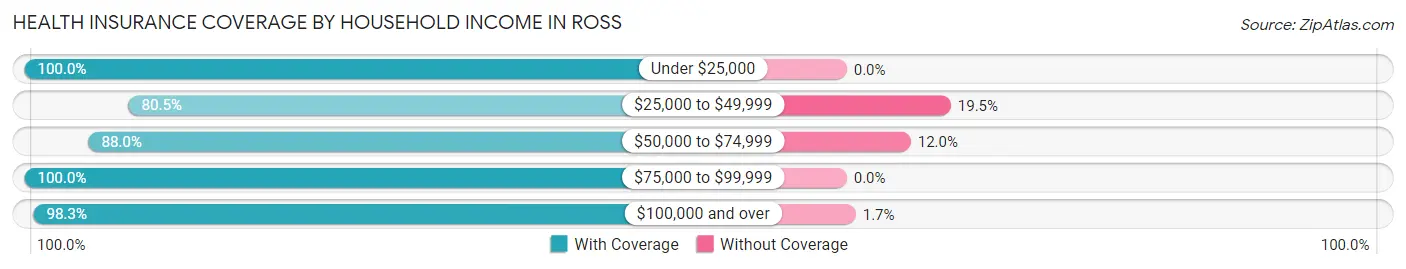
| Household Income | With Coverage | Without Coverage |
| Under $25,000 | 418 (100.0%) | 0 (0.0%) |
| $25,000 to $49,999 | 355 (80.5%) | 86 (19.5%) |
| $50,000 to $74,999 | 257 (88.0%) | 35 (12.0%) |
| $75,000 to $99,999 | 240 (100.0%) | 0 (0.0%) |
| $100,000 and over | 1,404 (98.3%) | 24 (1.7%) |
Public vs Private Health Insurance Coverage by Age in Ross
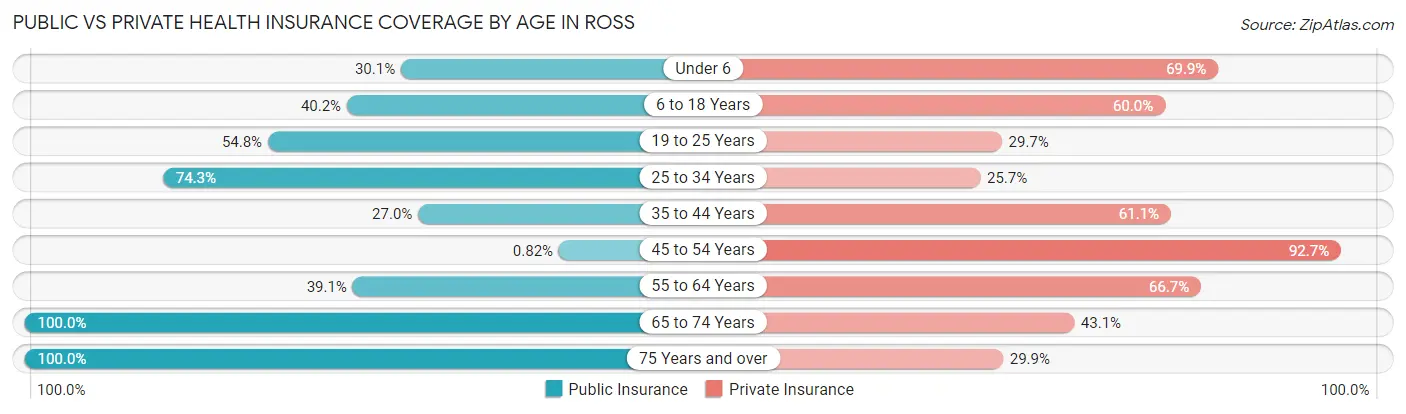
| Age Bracket | Public Insurance | Private Insurance |
| Under 6 | 44 (30.1%) | 102 (69.9%) |
| 6 to 18 Years | 243 (40.2%) | 363 (60.0%) |
| 19 to 25 Years | 159 (54.8%) | 86 (29.7%) |
| 25 to 34 Years | 84 (74.3%) | 29 (25.7%) |
| 35 to 44 Years | 135 (27.0%) | 306 (61.1%) |
| 45 to 54 Years | 2 (0.8%) | 227 (92.6%) |
| 55 to 64 Years | 156 (39.1%) | 266 (66.7%) |
| 65 to 74 Years | 253 (100.0%) | 109 (43.1%) |
| 75 Years and over | 271 (100.0%) | 81 (29.9%) |
| Total | 1,347 (47.7%) | 1,569 (55.6%) |
Disability Status by Sex by Age in Ross
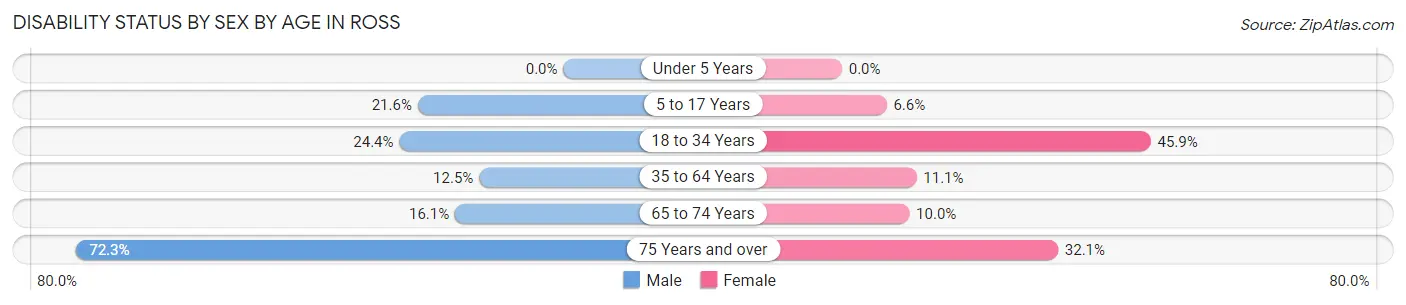
| Age Bracket | Male | Female |
| Under 5 Years | 0 (0.0%) | 0 (0.0%) |
| 5 to 17 Years | 48 (21.6%) | 25 (6.6%) |
| 18 to 34 Years | 47 (24.3%) | 105 (45.9%) |
| 35 to 64 Years | 72 (12.5%) | 63 (11.1%) |
| 65 to 74 Years | 23 (16.1%) | 11 (10.0%) |
| 75 Years and over | 81 (72.3%) | 51 (32.1%) |
Disability Class by Sex by Age in Ross
Disability Class: Hearing Difficulty
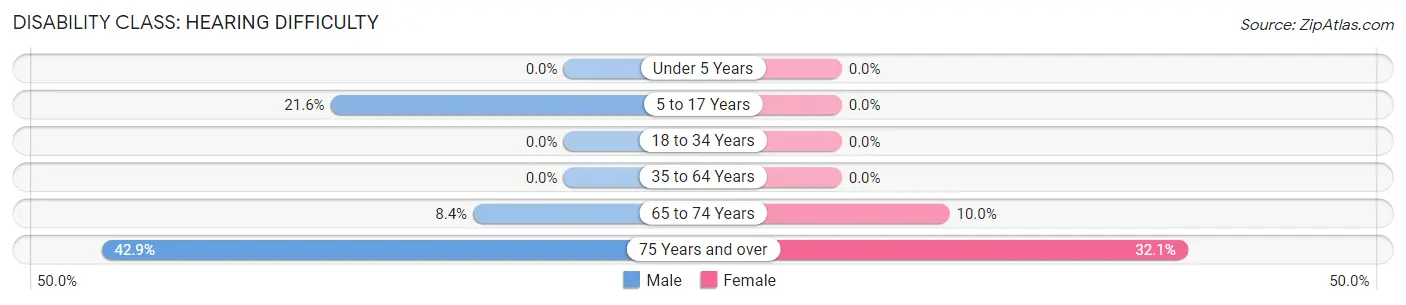
| Age Bracket | Male | Female |
| Under 5 Years | 0 (0.0%) | 0 (0.0%) |
| 5 to 17 Years | 48 (21.6%) | 0 (0.0%) |
| 18 to 34 Years | 0 (0.0%) | 0 (0.0%) |
| 35 to 64 Years | 0 (0.0%) | 0 (0.0%) |
| 65 to 74 Years | 12 (8.4%) | 11 (10.0%) |
| 75 Years and over | 48 (42.9%) | 51 (32.1%) |
Disability Class: Vision Difficulty
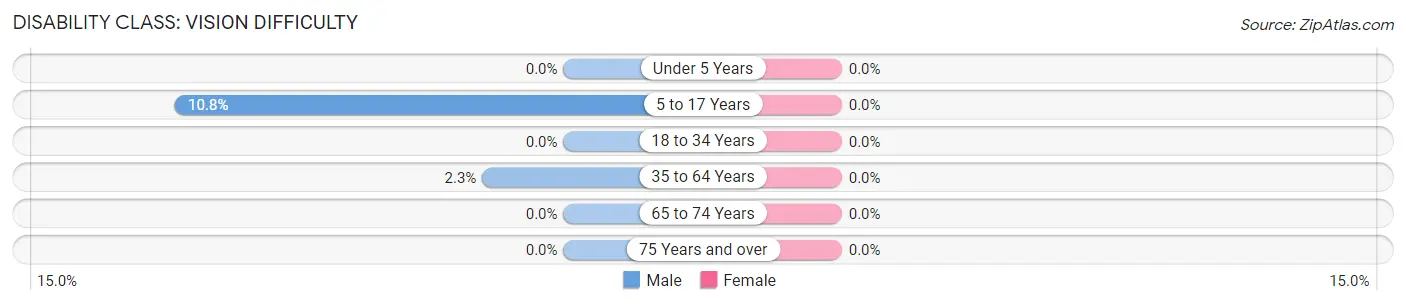
| Age Bracket | Male | Female |
| Under 5 Years | 0 (0.0%) | 0 (0.0%) |
| 5 to 17 Years | 24 (10.8%) | 0 (0.0%) |
| 18 to 34 Years | 0 (0.0%) | 0 (0.0%) |
| 35 to 64 Years | 13 (2.3%) | 0 (0.0%) |
| 65 to 74 Years | 0 (0.0%) | 0 (0.0%) |
| 75 Years and over | 0 (0.0%) | 0 (0.0%) |
Disability Class: Cognitive Difficulty
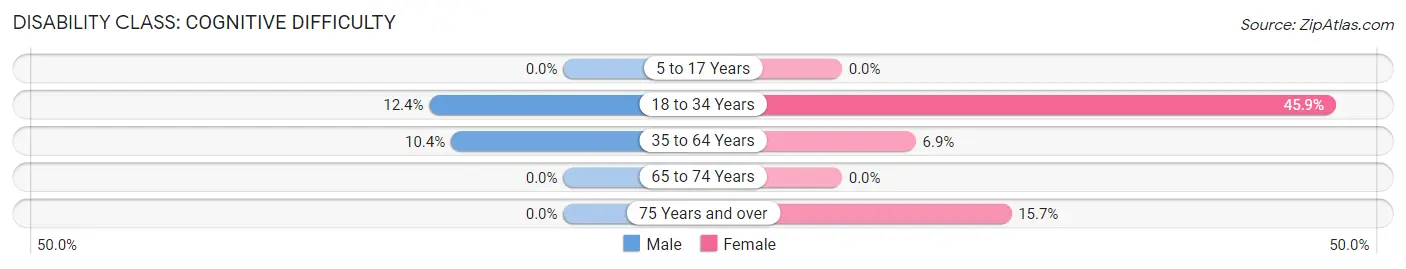
| Age Bracket | Male | Female |
| 5 to 17 Years | 0 (0.0%) | 0 (0.0%) |
| 18 to 34 Years | 24 (12.4%) | 105 (45.9%) |
| 35 to 64 Years | 60 (10.4%) | 39 (6.9%) |
| 65 to 74 Years | 0 (0.0%) | 0 (0.0%) |
| 75 Years and over | 0 (0.0%) | 25 (15.7%) |
Disability Class: Ambulatory Difficulty
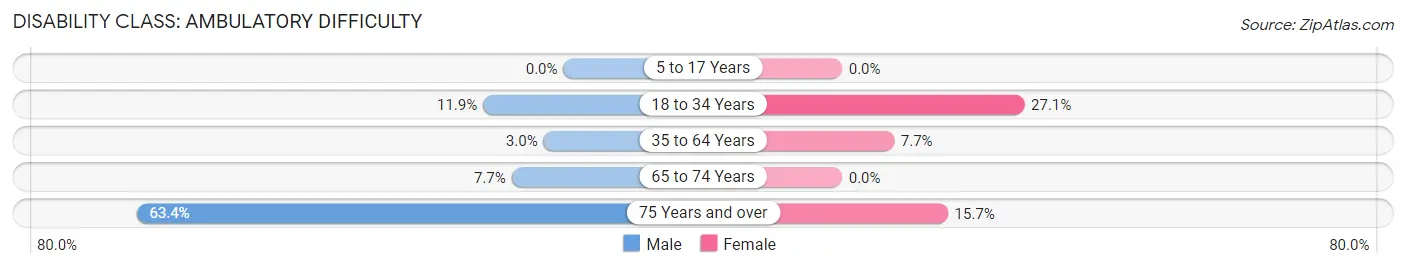
| Age Bracket | Male | Female |
| 5 to 17 Years | 0 (0.0%) | 0 (0.0%) |
| 18 to 34 Years | 23 (11.9%) | 62 (27.1%) |
| 35 to 64 Years | 17 (2.9%) | 44 (7.7%) |
| 65 to 74 Years | 11 (7.7%) | 0 (0.0%) |
| 75 Years and over | 71 (63.4%) | 25 (15.7%) |
Disability Class: Self-Care Difficulty
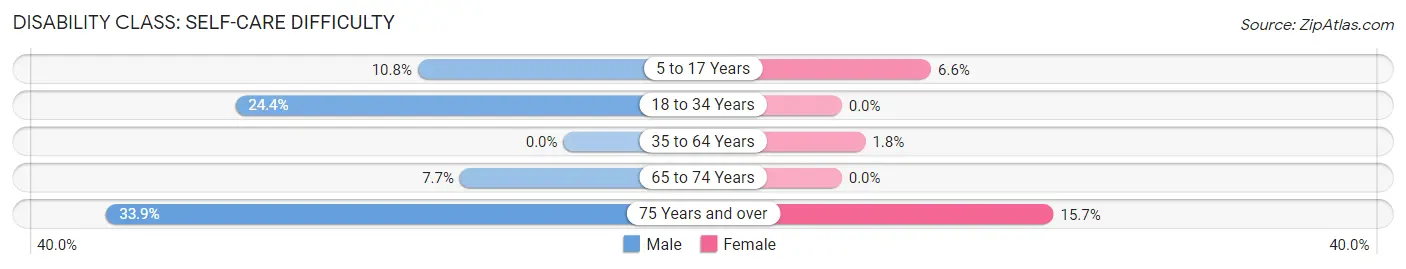
| Age Bracket | Male | Female |
| 5 to 17 Years | 24 (10.8%) | 25 (6.6%) |
| 18 to 34 Years | 47 (24.3%) | 0 (0.0%) |
| 35 to 64 Years | 0 (0.0%) | 10 (1.8%) |
| 65 to 74 Years | 11 (7.7%) | 0 (0.0%) |
| 75 Years and over | 38 (33.9%) | 25 (15.7%) |
Technology Access in Ross
Computing Device Access in Ross
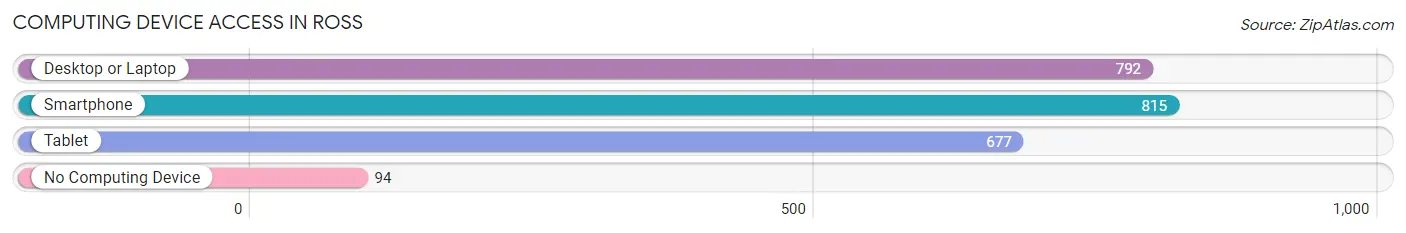
| Device Type | # Households | % Households |
| Desktop or Laptop | 792 | 79.2% |
| Smartphone | 815 | 81.5% |
| Tablet | 677 | 67.7% |
| No Computing Device | 94 | 9.4% |
| Total | 1,000 | 100.0% |
Internet Access in Ross
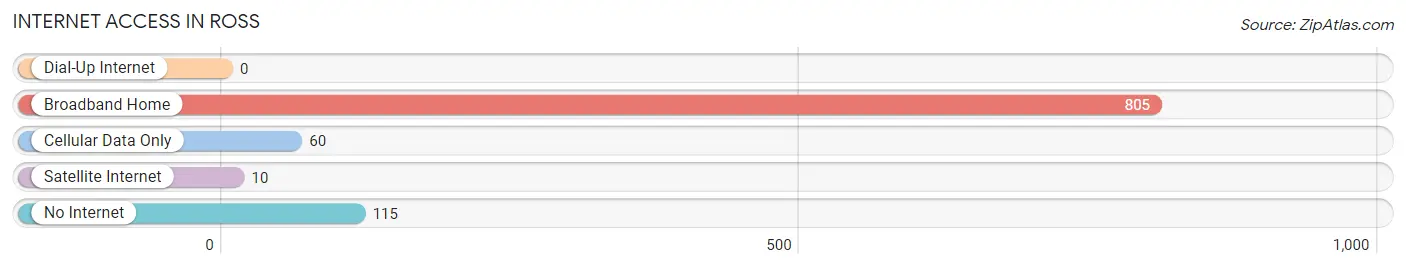
| Internet Type | # Households | % Households |
| Dial-Up Internet | 0 | 0.0% |
| Broadband Home | 805 | 80.5% |
| Cellular Data Only | 60 | 6.0% |
| Satellite Internet | 10 | 1.0% |
| No Internet | 115 | 11.5% |
| Total | 1,000 | 100.0% |
Ross Summary
Ross, Ohio is a small city located in Butler County, Ohio. It is situated approximately 20 miles north of Cincinnati and is part of the Cincinnati metropolitan area. The city has a population of approximately 8,000 people and is known for its small-town charm and friendly atmosphere.
Geography
Ross is located in the southwestern corner of Butler County, Ohio. It is situated on the banks of the Great Miami River and is bordered by the cities of Hamilton, Middletown, and Monroe. The city covers an area of 4.2 square miles and has an elevation of 845 feet. The terrain is mostly flat with some rolling hills. The climate is humid continental with hot summers and cold winters.
Economy
Ross is a small city with a diverse economy. The city is home to several manufacturing companies, including the Ross Tool and Die Company, which produces precision tools and dies for the automotive industry. Other major employers in the city include the Ross Community Hospital, Ross Community College, and the Ross Public Library. The city also has a thriving retail sector, with several shopping centers and restaurants.
Demographics
As of the 2010 census, the population of Ross was 8,074. The racial makeup of the city was 90.2% White, 4.2% African American, 0.3% Native American, 1.2% Asian, and 3.1% from other races. The median household income was $45,945 and the median family income was $54,945. The per capita income was $21,945.
History
Ross was founded in 1817 by William Ross, a Revolutionary War veteran. The city was originally known as Rossville and was incorporated in 1854. The city was named after William Ross and was originally a farming community. In the late 19th century, the city began to industrialize and the population began to grow. The city was home to several factories, including the Ross Tool and Die Company, which was founded in 1891. The city continued to grow throughout the 20th century and today is a thriving small city with a diverse economy.
Common Questions
What is the Total Population of Ross?
Total Population of Ross is 2,823.
What is the Total Male Population of Ross?
Total Male Population of Ross is 1,300.
What is the Total Female Population of Ross?
Total Female Population of Ross is 1,523.
What is the Ratio of Males per 100 Females in Ross?
There are 85.36 Males per 100 Females in Ross.
What is the Ratio of Females per 100 Males in Ross?
There are 117.15 Females per 100 Males in Ross.
What is the Median Population Age in Ross?
Median Population Age in Ross is 39.6 Years.
What is the Average Family Size in Ross
Average Family Size in Ross is 3.4 People.
What is the Average Household Size in Ross
Average Household Size in Ross is 2.8 People.
What is Per Capita Income in Ross?
Per Capita income in Ross is $31,922.
What is the Median Family Income in Ross?
Median Family Income in Ross is $93,287.
What is the Median Household income in Ross?
Median Household Income in Ross is $62,121.
What is Income or Wage Gap in Ross?
Income or Wage Gap in Ross is 25.9%.
Women in Ross earn 74.1 cents for every dollar earned by a man.
What is Family Income Deficit in Ross?
Family Income Deficit in Ross is $11,559.
Families that are below poverty line in Ross earn $11,559 less on average than the poverty threshold level.
What is Inequality or Gini Index in Ross?
Inequality or Gini Index in Ross is 0.45.
How Large is the Labor Force in Ross?
There are 1,289 People in the Labor Forcein in Ross.
What is the Percentage of People in the Labor Force in Ross?
60.1% of People are in the Labor Force in Ross.
What is the Unemployment Rate in Ross?
Unemployment Rate in Ross is 2.8%.