Park Layne, OH
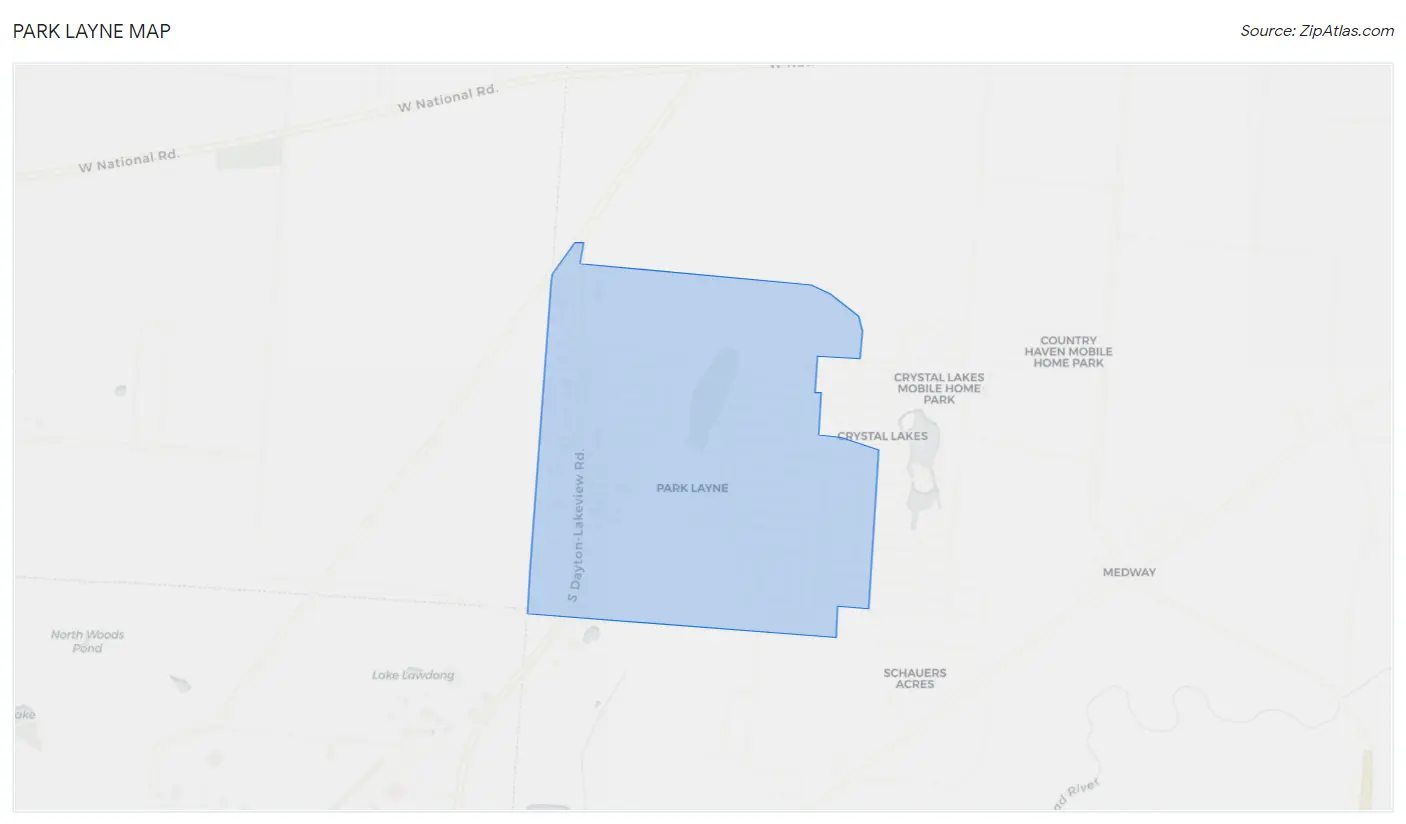
Park Layne Map
Park Layne Overview
3,974
TOTAL POPULATION
1,913
MALE POPULATION
2,061
FEMALE POPULATION
92.82
MALES / 100 FEMALES
107.74
FEMALES / 100 MALES
41.0
MEDIAN AGE
2.8
AVG FAMILY SIZE
2.5
AVG HOUSEHOLD SIZE
$27,984
PER CAPITA INCOME
$62,885
AVG FAMILY INCOME
$61,406
AVG HOUSEHOLD INCOME
28.5%
WAGE / INCOME GAP [ % ]
71.5¢/ $1
WAGE / INCOME GAP [ $ ]
0.37
INEQUALITY / GINI INDEX
2,035
LABOR FORCE [ PEOPLE ]
64.3%
PERCENT IN LABOR FORCE
1.4%
UNEMPLOYMENT RATE
Race in Park Layne
The most populous races in Park Layne are White / Caucasian (3,815 | 96.0%), Hispanic or Latino (177 | 4.4%), and Two or more Races (93 | 2.3%).
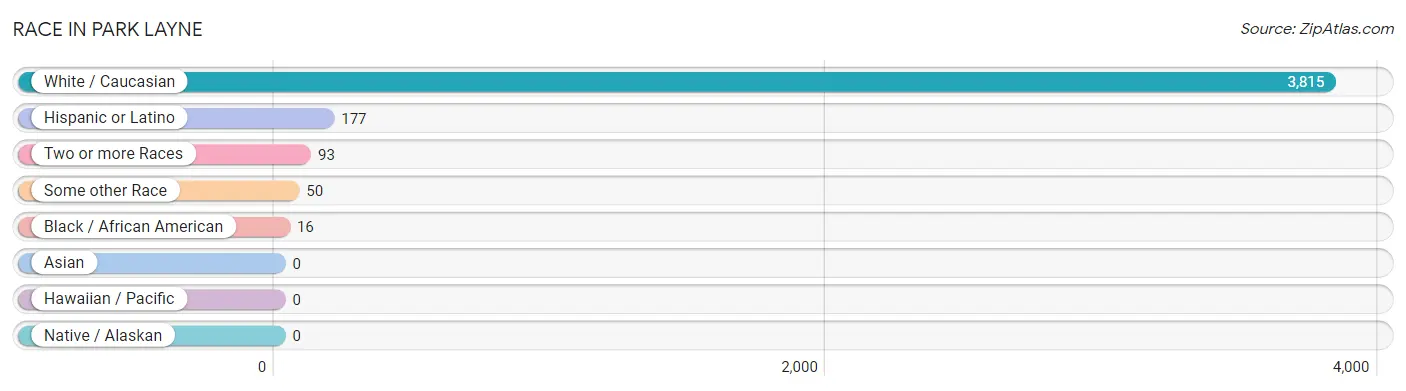
| Race | # Population | % Population |
| Asian | 0 | 0.0% |
| Black / African American | 16 | 0.4% |
| Hawaiian / Pacific | 0 | 0.0% |
| Hispanic or Latino | 177 | 4.4% |
| Native / Alaskan | 0 | 0.0% |
| White / Caucasian | 3,815 | 96.0% |
| Two or more Races | 93 | 2.3% |
| Some other Race | 50 | 1.3% |
| Total | 3,974 | 100.0% |
Ancestry in Park Layne
The most populous ancestries reported in Park Layne are Irish (885 | 22.3%), German (864 | 21.7%), American (533 | 13.4%), English (419 | 10.5%), and Mexican (177 | 4.4%), together accounting for 72.4% of all Park Layne residents.
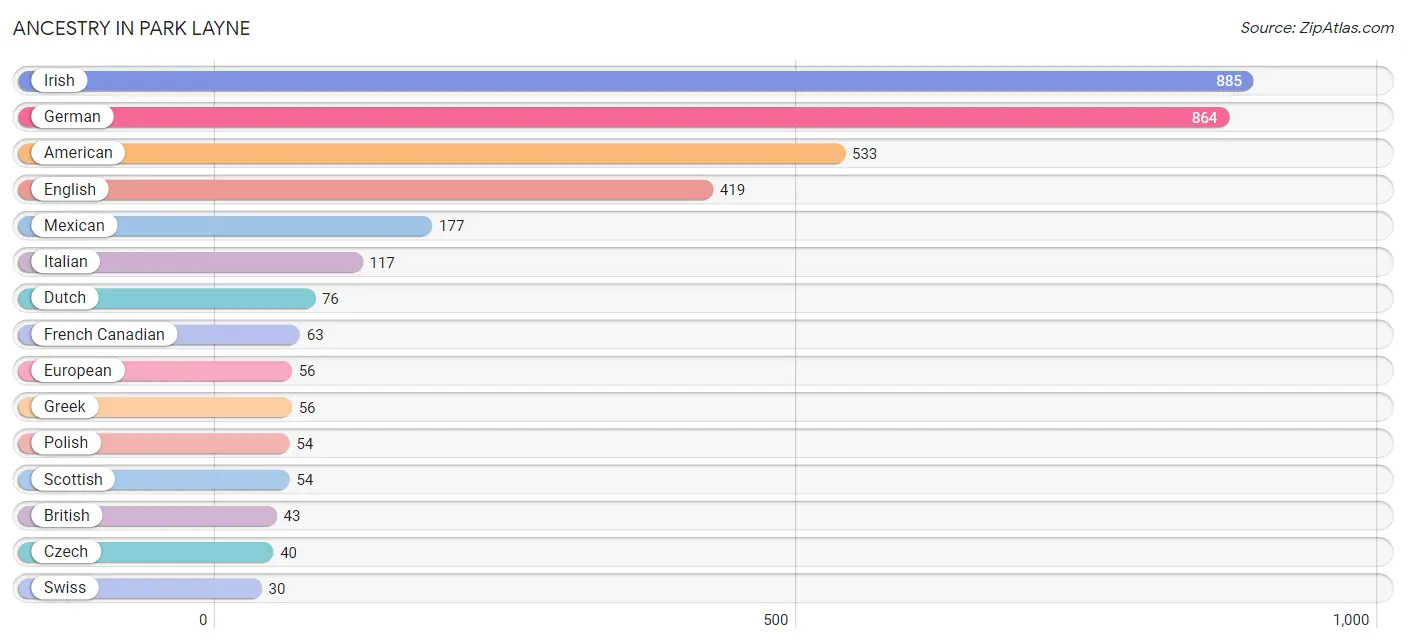
| Ancestry | # Population | % Population |
| American | 533 | 13.4% |
| Bhutanese | 14 | 0.4% |
| Blackfeet | 11 | 0.3% |
| British | 43 | 1.1% |
| Canadian | 8 | 0.2% |
| Cherokee | 11 | 0.3% |
| Czech | 40 | 1.0% |
| Dutch | 76 | 1.9% |
| English | 419 | 10.5% |
| European | 56 | 1.4% |
| French | 23 | 0.6% |
| French Canadian | 63 | 1.6% |
| German | 864 | 21.7% |
| Greek | 56 | 1.4% |
| Hungarian | 7 | 0.2% |
| Irish | 885 | 22.3% |
| Italian | 117 | 2.9% |
| Lithuanian | 8 | 0.2% |
| Mexican | 177 | 4.4% |
| Polish | 54 | 1.4% |
| Portuguese | 9 | 0.2% |
| Scotch-Irish | 13 | 0.3% |
| Scottish | 54 | 1.4% |
| Swiss | 30 | 0.7% |
| Welsh | 13 | 0.3% | View All 25 Rows |
Immigrants in Park Layne
The most numerous immigrant groups reported in Park Layne came from Central America (47 | 1.2%), Latin America (47 | 1.2%), Mexico (47 | 1.2%), Canada (9 | 0.2%), and Europe (9 | 0.2%), together accounting for 4.0% of all Park Layne residents.

| Immigration Origin | # Population | % Population |
| Canada | 9 | 0.2% |
| Central America | 47 | 1.2% |
| Europe | 9 | 0.2% |
| Italy | 9 | 0.2% |
| Latin America | 47 | 1.2% |
| Mexico | 47 | 1.2% |
| Southern Europe | 9 | 0.2% | View All 7 Rows |
Sex and Age in Park Layne
Sex and Age in Park Layne
The most populous age groups in Park Layne are 25 to 29 Years (253 | 13.2%) for men and Under 5 Years (259 | 12.6%) for women.
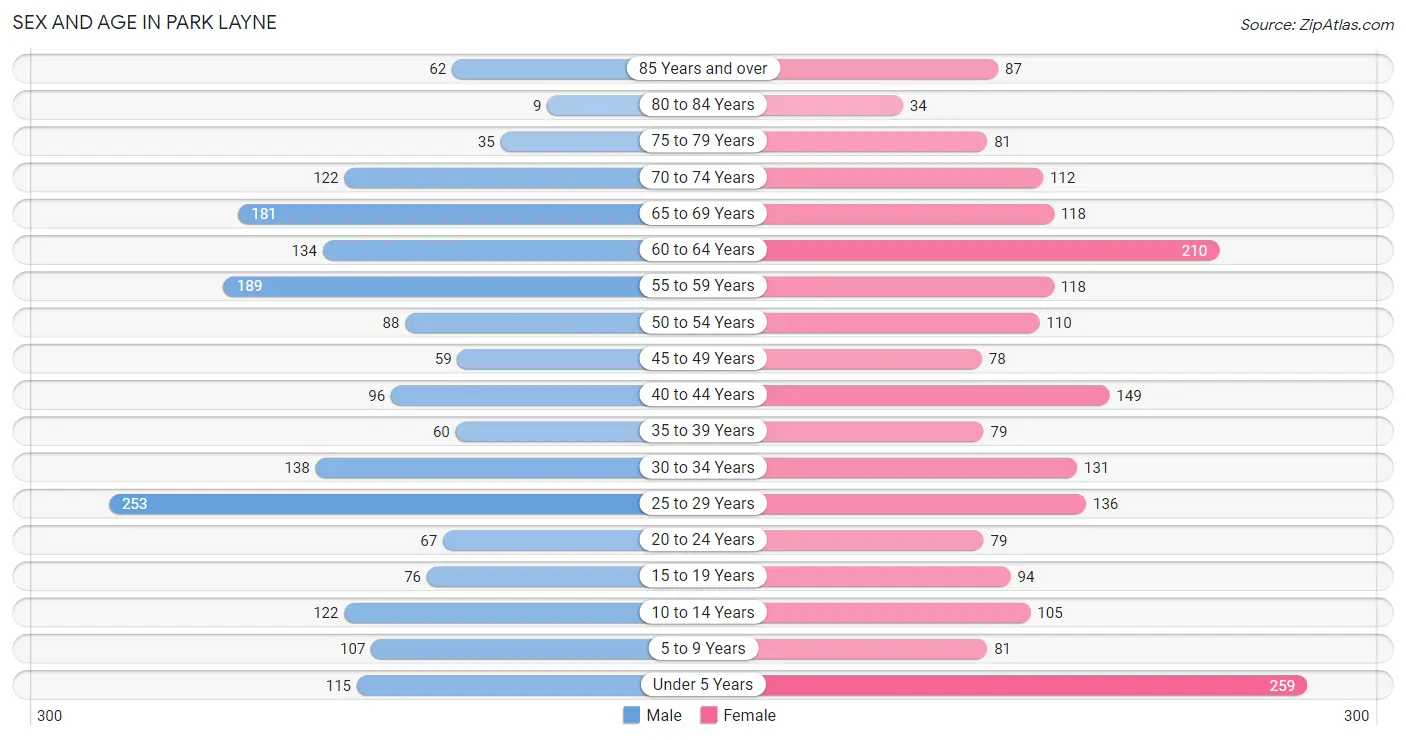
| Age Bracket | Male | Female |
| Under 5 Years | 115 (6.0%) | 259 (12.6%) |
| 5 to 9 Years | 107 (5.6%) | 81 (3.9%) |
| 10 to 14 Years | 122 (6.4%) | 105 (5.1%) |
| 15 to 19 Years | 76 (4.0%) | 94 (4.6%) |
| 20 to 24 Years | 67 (3.5%) | 79 (3.8%) |
| 25 to 29 Years | 253 (13.2%) | 136 (6.6%) |
| 30 to 34 Years | 138 (7.2%) | 131 (6.4%) |
| 35 to 39 Years | 60 (3.1%) | 79 (3.8%) |
| 40 to 44 Years | 96 (5.0%) | 149 (7.2%) |
| 45 to 49 Years | 59 (3.1%) | 78 (3.8%) |
| 50 to 54 Years | 88 (4.6%) | 110 (5.3%) |
| 55 to 59 Years | 189 (9.9%) | 118 (5.7%) |
| 60 to 64 Years | 134 (7.0%) | 210 (10.2%) |
| 65 to 69 Years | 181 (9.5%) | 118 (5.7%) |
| 70 to 74 Years | 122 (6.4%) | 112 (5.4%) |
| 75 to 79 Years | 35 (1.8%) | 81 (3.9%) |
| 80 to 84 Years | 9 (0.5%) | 34 (1.7%) |
| 85 Years and over | 62 (3.2%) | 87 (4.2%) |
| Total | 1,913 (100.0%) | 2,061 (100.0%) |
Families and Households in Park Layne
Median Family Size in Park Layne
The median family size in Park Layne is 2.81 persons per family, with single male/father families (94 | 7.6%) accounting for the largest median family size of 3.15 persons per family. On the other hand, married-couple families (855 | 69.6%) represent the smallest median family size with 2.69 persons per family.
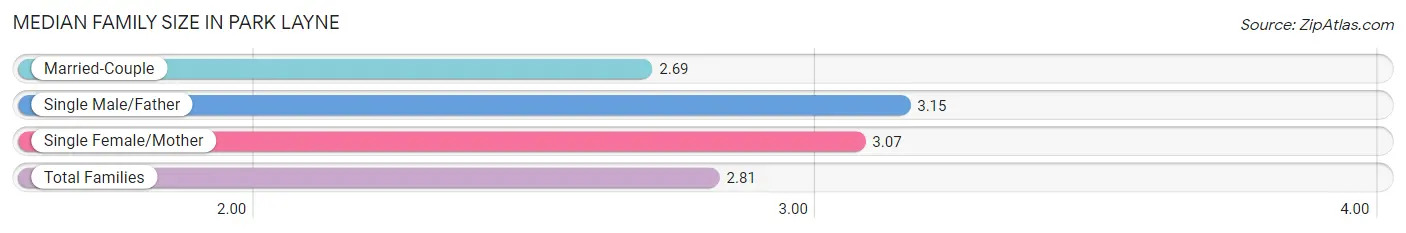
| Family Type | # Families | Family Size |
| Married-Couple | 855 (69.6%) | 2.69 |
| Single Male/Father | 94 (7.6%) | 3.15 |
| Single Female/Mother | 279 (22.7%) | 3.07 |
| Total Families | 1,228 (100.0%) | 2.81 |
Median Household Size in Park Layne
The median household size in Park Layne is 2.51 persons per household, with single male/father households (94 | 5.9%) accounting for the largest median household size of 3.6 persons per household. non-family households (356 | 22.5%) represent the smallest median household size with 1.13 persons per household.
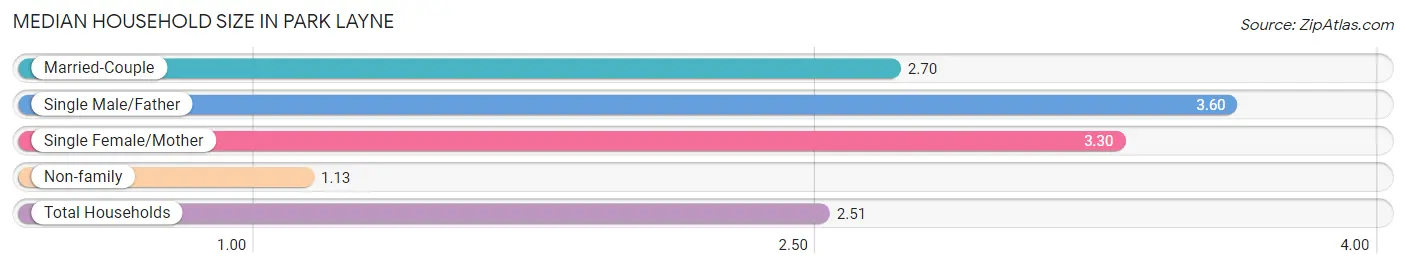
| Household Type | # Households | Household Size |
| Married-Couple | 855 (54.0%) | 2.70 |
| Single Male/Father | 94 (5.9%) | 3.60 |
| Single Female/Mother | 279 (17.6%) | 3.30 |
| Non-family | 356 (22.5%) | 1.13 |
| Total Households | 1,584 (100.0%) | 2.51 |
Household Size by Marriage Status in Park Layne
Out of a total of 1,584 households in Park Layne, 1,228 (77.5%) are family households, while 356 (22.5%) are nonfamily households. The most numerous type of family households are 2-person households, comprising 639, and the most common type of nonfamily households are 1-person households, comprising 311.
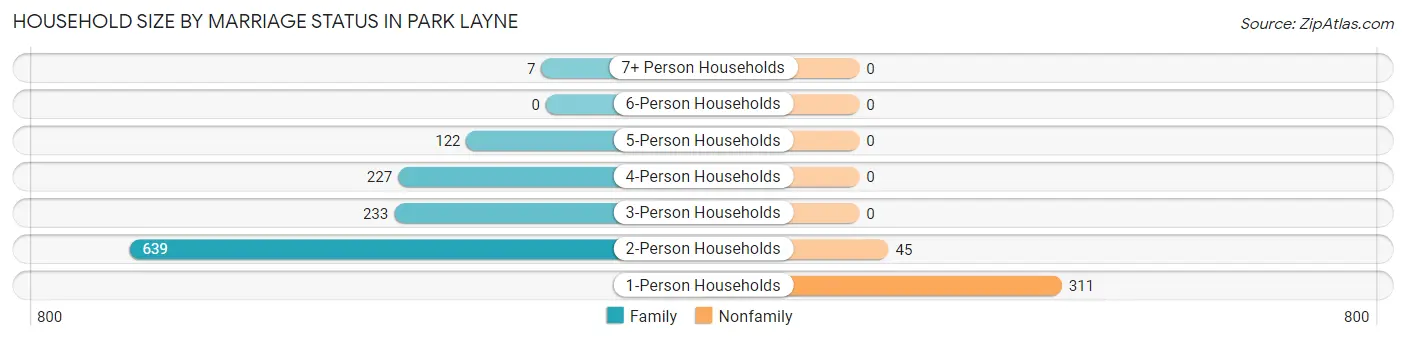
| Household Size | Family Households | Nonfamily Households |
| 1-Person Households | - | 311 (19.6%) |
| 2-Person Households | 639 (40.3%) | 45 (2.8%) |
| 3-Person Households | 233 (14.7%) | 0 (0.0%) |
| 4-Person Households | 227 (14.3%) | 0 (0.0%) |
| 5-Person Households | 122 (7.7%) | 0 (0.0%) |
| 6-Person Households | 0 (0.0%) | 0 (0.0%) |
| 7+ Person Households | 7 (0.4%) | 0 (0.0%) |
| Total | 1,228 (77.5%) | 356 (22.5%) |
Female Fertility in Park Layne
Fertility by Age in Park Layne
Average fertility rate in Park Layne is 24.0 births per 1,000 women. Women in the age bracket of 20 to 34 years have the highest fertility rate with 52.0 births per 1,000 women. Women in the age bracket of 20 to 34 years acount for 100.0% of all women with births.
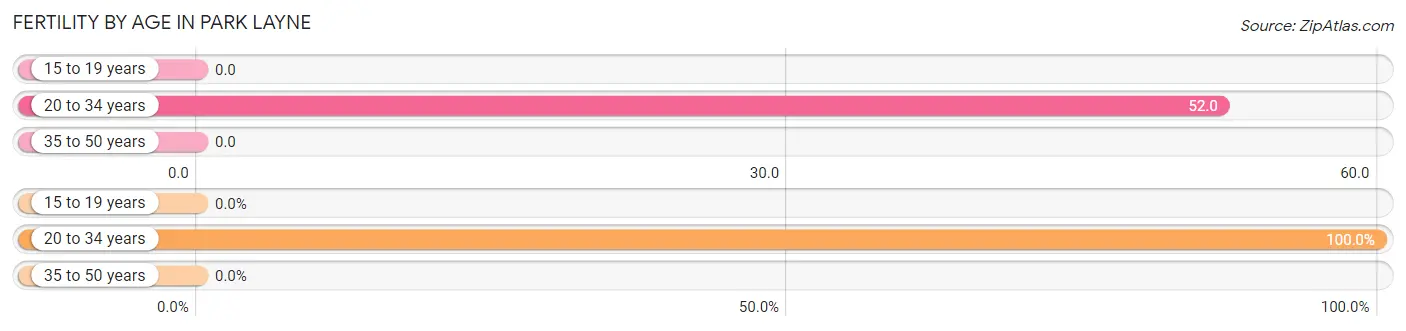
| Age Bracket | Women with Births | Births / 1,000 Women |
| 15 to 19 years | 0 (0.0%) | 0.0 |
| 20 to 34 years | 18 (100.0%) | 52.0 |
| 35 to 50 years | 0 (0.0%) | 0.0 |
| Total | 18 (100.0%) | 24.0 |
Fertility by Age by Marriage Status in Park Layne
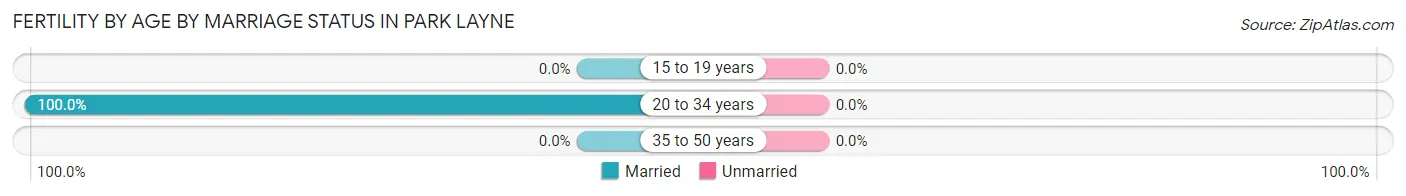
| Age Bracket | Married | Unmarried |
| 15 to 19 years | 0 (0.0%) | 0 (0.0%) |
| 20 to 34 years | 18 (100.0%) | 0 (0.0%) |
| 35 to 50 years | 0 (0.0%) | 0 (0.0%) |
| Total | 18 (100.0%) | 0 (0.0%) |
Fertility by Education in Park Layne
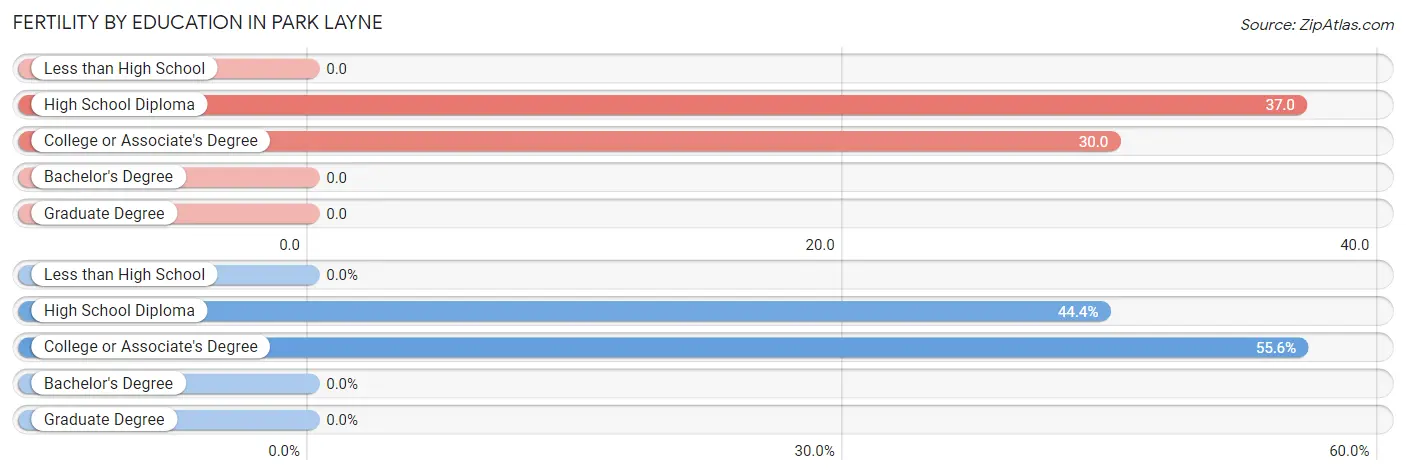
| Educational Attainment | Women with Births | Births / 1,000 Women |
| Less than High School | 0 (0.0%) | 0.0 |
| High School Diploma | 8 (44.4%) | 37.0 |
| College or Associate's Degree | 10 (55.6%) | 30.0 |
| Bachelor's Degree | 0 (0.0%) | 0.0 |
| Graduate Degree | 0 (0.0%) | 0.0 |
| Total | 18 (100.0%) | 24.0 |
Fertility by Education by Marriage Status in Park Layne
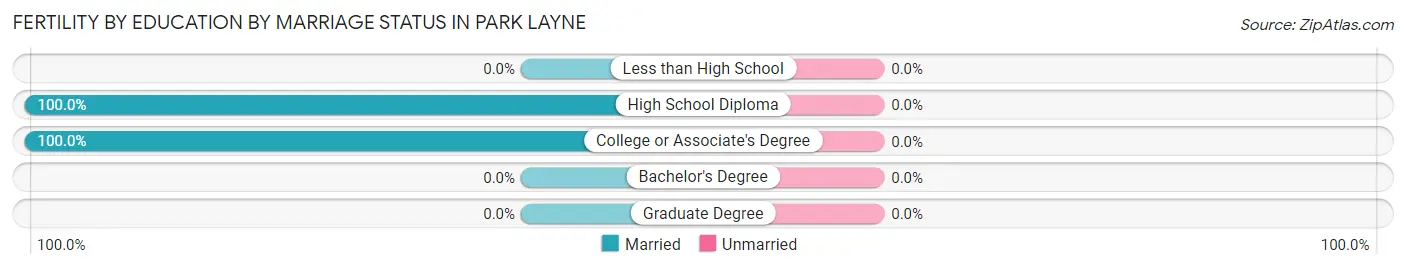
| Educational Attainment | Married | Unmarried |
| Less than High School | 0 (0.0%) | 0 (0.0%) |
| High School Diploma | 8 (100.0%) | 0 (0.0%) |
| College or Associate's Degree | 10 (100.0%) | 0 (0.0%) |
| Bachelor's Degree | 0 (0.0%) | 0 (0.0%) |
| Graduate Degree | 0 (0.0%) | 0 (0.0%) |
| Total | 18 (100.0%) | 0 (0.0%) |
Income in Park Layne
Income Overview in Park Layne
Per Capita Income in Park Layne is $27,984, while median incomes of families and households are $62,885 and $61,406 respectively.
| Characteristic | Number | Measure |
| Per Capita Income | 3,974 | $27,984 |
| Median Family Income | 1,228 | $62,885 |
| Mean Family Income | 1,228 | $73,500 |
| Median Household Income | 1,584 | $61,406 |
| Mean Household Income | 1,584 | $71,388 |
| Income Deficit | 1,228 | $0 |
| Wage / Income Gap (%) | 3,974 | 28.46% |
| Wage / Income Gap ($) | 3,974 | 71.54¢ per $1 |
| Gini / Inequality Index | 3,974 | 0.37 |
Earnings by Sex in Park Layne
Average Earnings in Park Layne are $35,531, $41,159 for men and $29,444 for women, a difference of 28.5%.
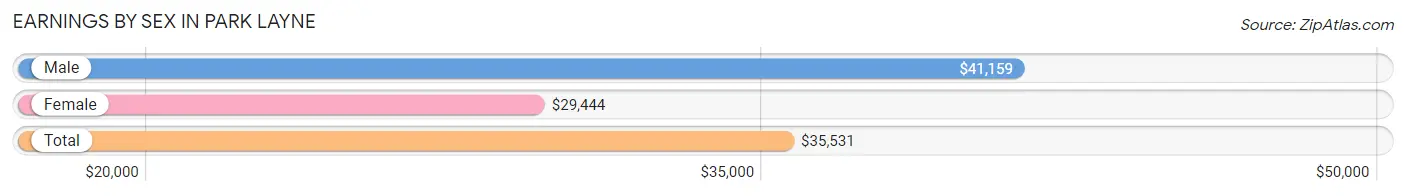
| Sex | Number | Average Earnings |
| Male | 1,113 (53.8%) | $41,159 |
| Female | 956 (46.2%) | $29,444 |
| Total | 2,069 (100.0%) | $35,531 |
Earnings by Sex by Income Bracket in Park Layne
The most common earnings brackets in Park Layne are $50,000 to $54,999 for men (153 | 13.8%) and $55,000 to $64,999 for women (175 | 18.3%).
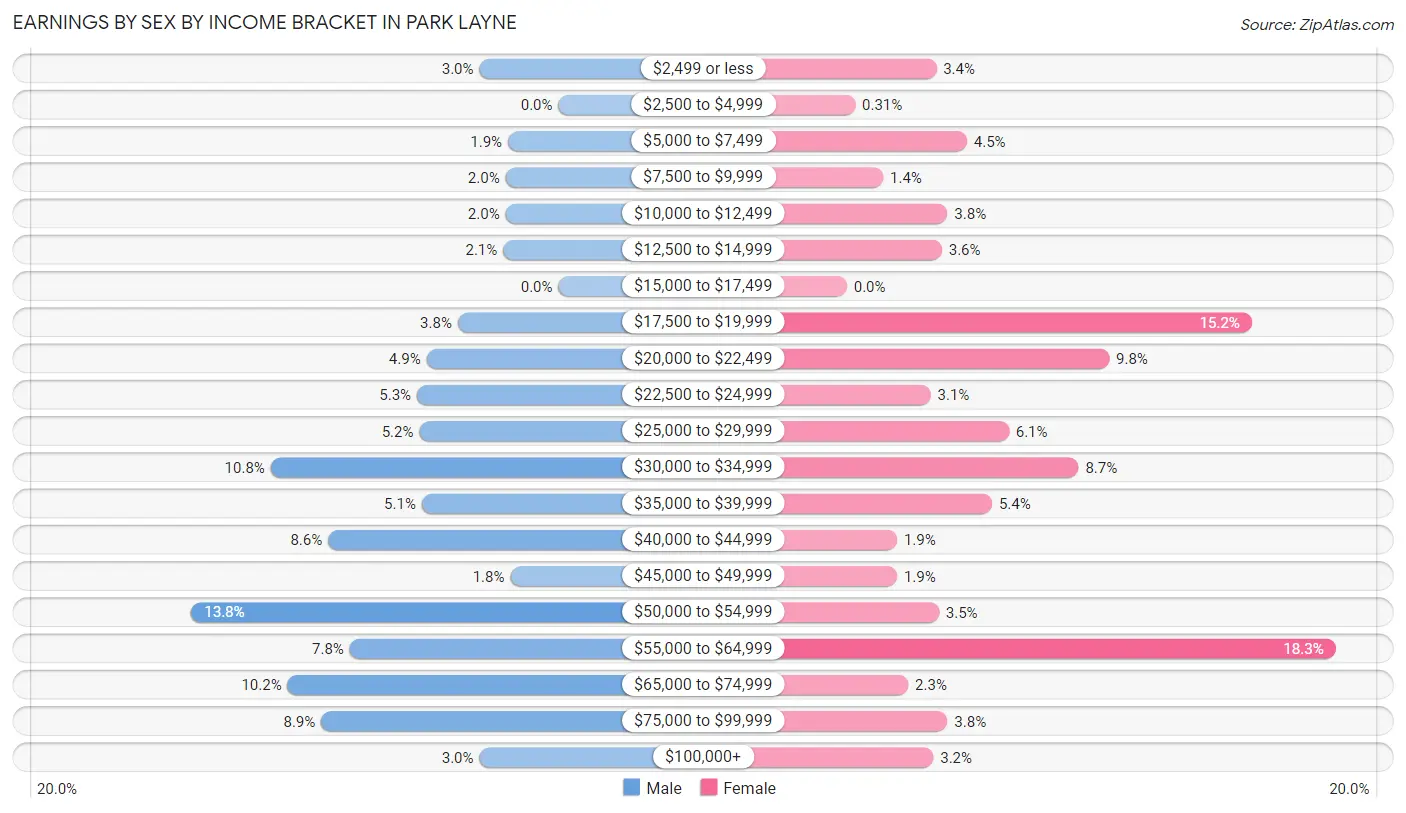
| Income | Male | Female |
| $2,499 or less | 33 (3.0%) | 32 (3.4%) |
| $2,500 to $4,999 | 0 (0.0%) | 3 (0.3%) |
| $5,000 to $7,499 | 21 (1.9%) | 43 (4.5%) |
| $7,500 to $9,999 | 22 (2.0%) | 13 (1.4%) |
| $10,000 to $12,499 | 22 (2.0%) | 36 (3.8%) |
| $12,500 to $14,999 | 23 (2.1%) | 34 (3.6%) |
| $15,000 to $17,499 | 0 (0.0%) | 0 (0.0%) |
| $17,500 to $19,999 | 42 (3.8%) | 145 (15.2%) |
| $20,000 to $22,499 | 55 (4.9%) | 94 (9.8%) |
| $22,500 to $24,999 | 59 (5.3%) | 30 (3.1%) |
| $25,000 to $29,999 | 58 (5.2%) | 58 (6.1%) |
| $30,000 to $34,999 | 120 (10.8%) | 83 (8.7%) |
| $35,000 to $39,999 | 57 (5.1%) | 52 (5.4%) |
| $40,000 to $44,999 | 96 (8.6%) | 18 (1.9%) |
| $45,000 to $49,999 | 20 (1.8%) | 18 (1.9%) |
| $50,000 to $54,999 | 153 (13.8%) | 33 (3.5%) |
| $55,000 to $64,999 | 87 (7.8%) | 175 (18.3%) |
| $65,000 to $74,999 | 113 (10.2%) | 22 (2.3%) |
| $75,000 to $99,999 | 99 (8.9%) | 36 (3.8%) |
| $100,000+ | 33 (3.0%) | 31 (3.2%) |
| Total | 1,113 (100.0%) | 956 (100.0%) |
Earnings by Sex by Educational Attainment in Park Layne
Average earnings in Park Layne are $42,201 for men and $32,332 for women, a difference of 23.4%. Men with an educational attainment of high school diploma enjoy the highest average annual earnings of $50,808, while those with less than high school education earn the least with $33,807. Women with an educational attainment of bachelor's degree earn the most with the average annual earnings of $62,083, while those with less than high school education have the smallest earnings of $23,036.
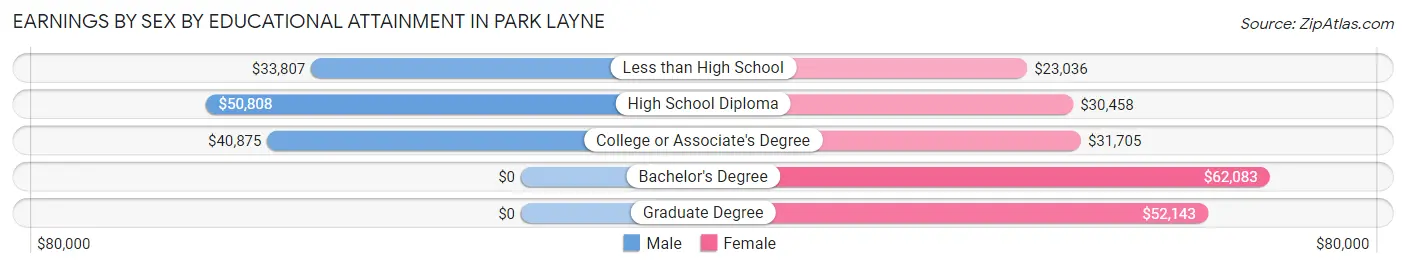
| Educational Attainment | Male Income | Female Income |
| Less than High School | $33,807 | $23,036 |
| High School Diploma | $50,808 | $30,458 |
| College or Associate's Degree | $40,875 | $31,705 |
| Bachelor's Degree | - | - |
| Graduate Degree | - | - |
| Total | $42,201 | $32,332 |
Family Income in Park Layne
Family Income Brackets in Park Layne
According to the Park Layne family income data, there are 296 families falling into the $100,000 to $149,999 income range, which is the most common income bracket and makes up 24.1% of all families.
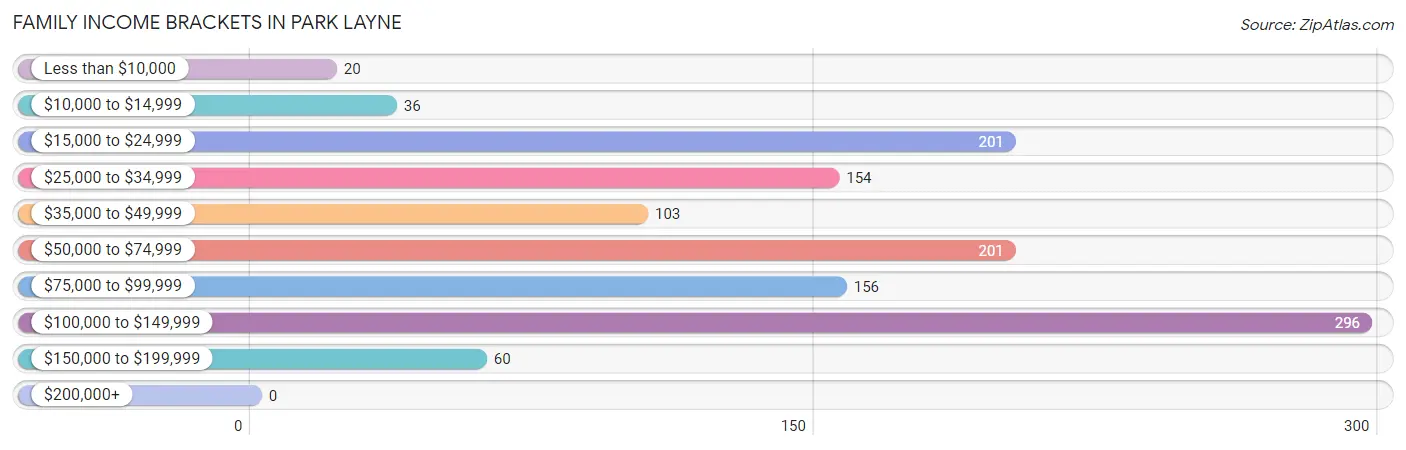
| Income Bracket | # Families | % Families |
| Less than $10,000 | 20 | 1.6% |
| $10,000 to $14,999 | 36 | 2.9% |
| $15,000 to $24,999 | 201 | 16.4% |
| $25,000 to $34,999 | 154 | 12.5% |
| $35,000 to $49,999 | 103 | 8.4% |
| $50,000 to $74,999 | 201 | 16.4% |
| $75,000 to $99,999 | 156 | 12.7% |
| $100,000 to $149,999 | 296 | 24.1% |
| $150,000 to $199,999 | 60 | 4.9% |
| $200,000+ | 0 | 0.0% |
Family Income by Famaliy Size in Park Layne
5-person families (90 | 7.3%) account for the highest median family income in Park Layne with $128,348 per family, while 2-person families (674 | 54.9%) have the highest median income of $30,278 per family member.
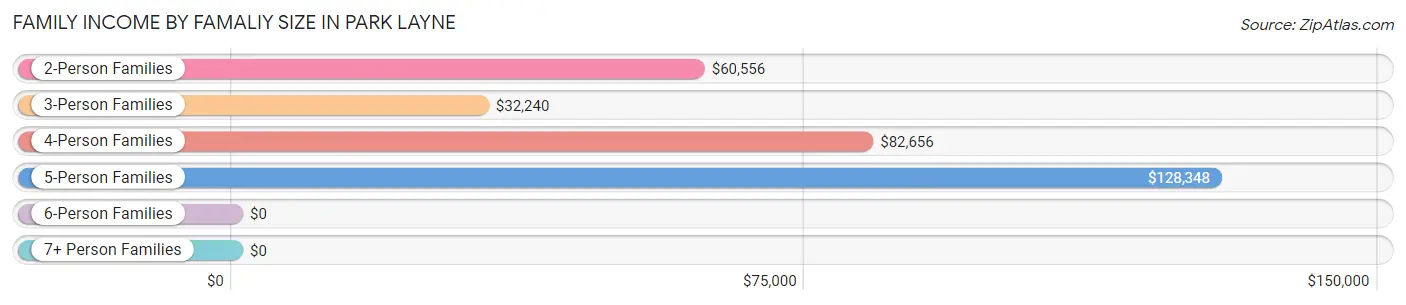
| Income Bracket | # Families | Median Income |
| 2-Person Families | 674 (54.9%) | $60,556 |
| 3-Person Families | 250 (20.4%) | $32,240 |
| 4-Person Families | 207 (16.9%) | $82,656 |
| 5-Person Families | 90 (7.3%) | $128,348 |
| 6-Person Families | 0 (0.0%) | $0 |
| 7+ Person Families | 7 (0.6%) | $0 |
| Total | 1,228 (100.0%) | $62,885 |
Family Income by Number of Earners in Park Layne
The median family income in Park Layne is $62,885, with families comprising 3+ earners (163) having the highest median family income of $135,184, while families with no earners (273) have the lowest median family income of $21,797, accounting for 13.3% and 22.2% of families, respectively.
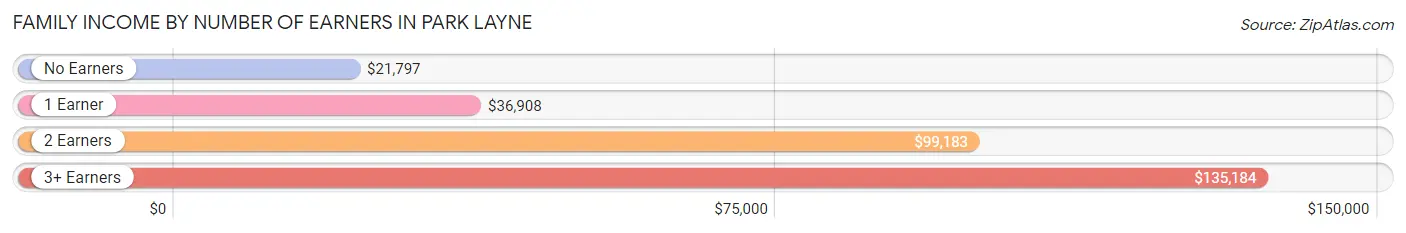
| Number of Earners | # Families | Median Income |
| No Earners | 273 (22.2%) | $21,797 |
| 1 Earner | 381 (31.0%) | $36,908 |
| 2 Earners | 411 (33.5%) | $99,183 |
| 3+ Earners | 163 (13.3%) | $135,184 |
| Total | 1,228 (100.0%) | $62,885 |
Household Income in Park Layne
Household Income Brackets in Park Layne
With 382 households falling in the category, the $100,000 to $149,999 income range is the most frequent in Park Layne, accounting for 24.1% of all households.
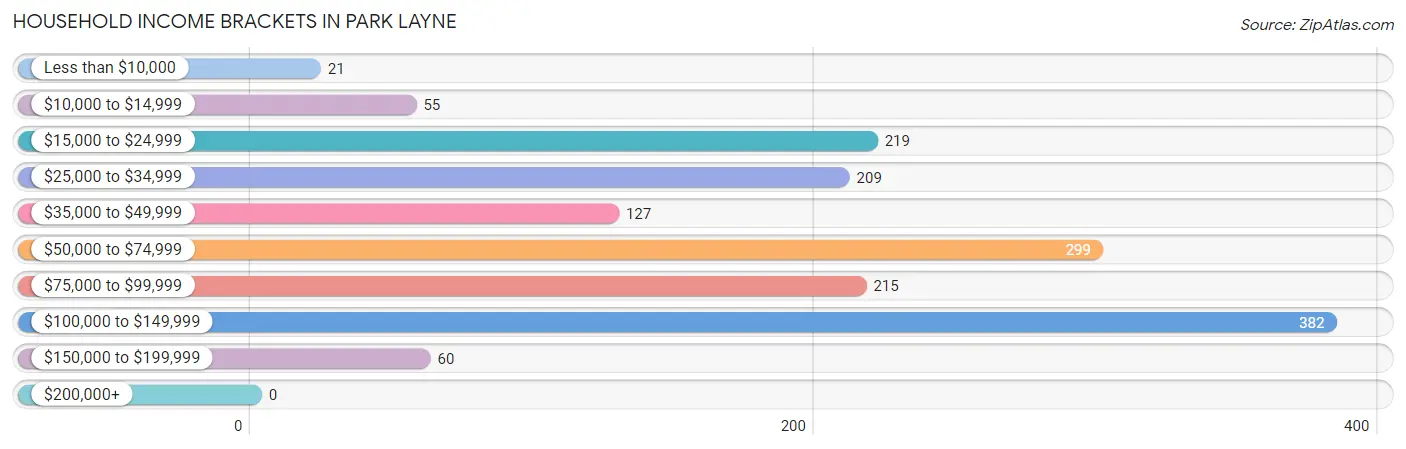
| Income Bracket | # Households | % Households |
| Less than $10,000 | 21 | 1.3% |
| $10,000 to $14,999 | 55 | 3.5% |
| $15,000 to $24,999 | 219 | 13.8% |
| $25,000 to $34,999 | 209 | 13.2% |
| $35,000 to $49,999 | 127 | 8.0% |
| $50,000 to $74,999 | 299 | 18.9% |
| $75,000 to $99,999 | 215 | 13.6% |
| $100,000 to $149,999 | 382 | 24.1% |
| $150,000 to $199,999 | 60 | 3.8% |
| $200,000+ | 0 | 0.0% |
Household Income by Householder Age in Park Layne
The median household income in Park Layne is $61,406, with the highest median household income of $78,403 found in the 25 to 44 years age bracket for the primary householder. A total of 419 households (26.5%) fall into this category. Meanwhile, the 15 to 24 years age bracket for the primary householder has the lowest median household income of $0, with 28 households (1.8%) in this group.
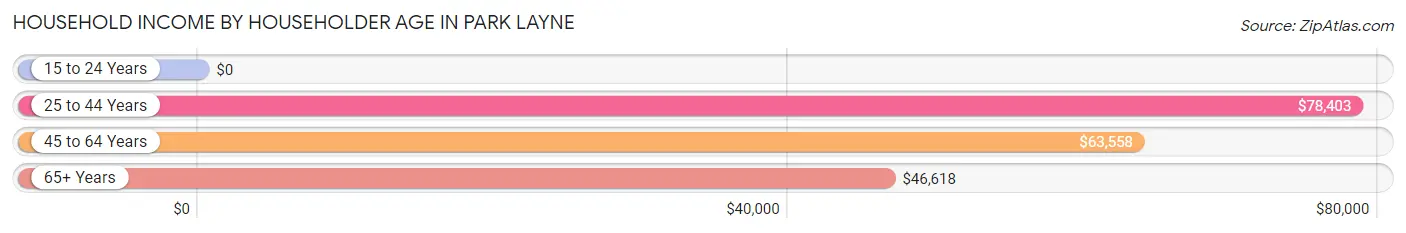
| Income Bracket | # Households | Median Income |
| 15 to 24 Years | 28 (1.8%) | $0 |
| 25 to 44 Years | 419 (26.5%) | $78,403 |
| 45 to 64 Years | 531 (33.5%) | $63,558 |
| 65+ Years | 606 (38.3%) | $46,618 |
| Total | 1,584 (100.0%) | $61,406 |
Poverty in Park Layne
Income Below Poverty by Sex and Age in Park Layne
With 12.1% poverty level for males and 18.0% for females among the residents of Park Layne, 12 to 14 year old males and 5 year old females are the most vulnerable to poverty, with 50 males (64.9%) and 34 females (100.0%) in their respective age groups living below the poverty level.
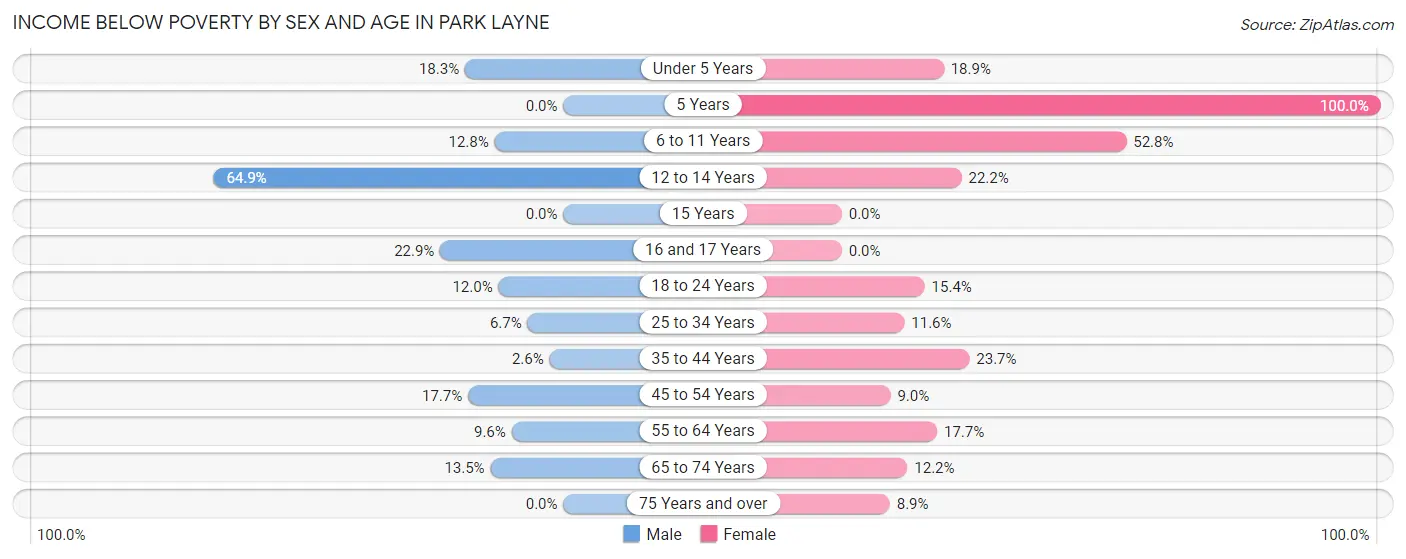
| Age Bracket | Male | Female |
| Under 5 Years | 21 (18.3%) | 49 (18.9%) |
| 5 Years | 0 (0.0%) | 34 (100.0%) |
| 6 to 11 Years | 12 (12.8%) | 47 (52.8%) |
| 12 to 14 Years | 50 (64.9%) | 14 (22.2%) |
| 15 Years | 0 (0.0%) | 0 (0.0%) |
| 16 and 17 Years | 8 (22.9%) | 0 (0.0%) |
| 18 to 24 Years | 13 (12.0%) | 22 (15.4%) |
| 25 to 34 Years | 26 (6.7%) | 31 (11.6%) |
| 35 to 44 Years | 4 (2.6%) | 54 (23.7%) |
| 45 to 54 Years | 26 (17.7%) | 17 (9.0%) |
| 55 to 64 Years | 31 (9.6%) | 58 (17.7%) |
| 65 to 74 Years | 41 (13.5%) | 28 (12.2%) |
| 75 Years and over | 0 (0.0%) | 18 (8.9%) |
| Total | 232 (12.1%) | 372 (18.0%) |
Income Above Poverty by Sex and Age in Park Layne
According to the poverty statistics in Park Layne, males aged 5 years and females aged 15 years are the age groups that are most secure financially, with 100.0% of males and 100.0% of females in these age groups living above the poverty line.
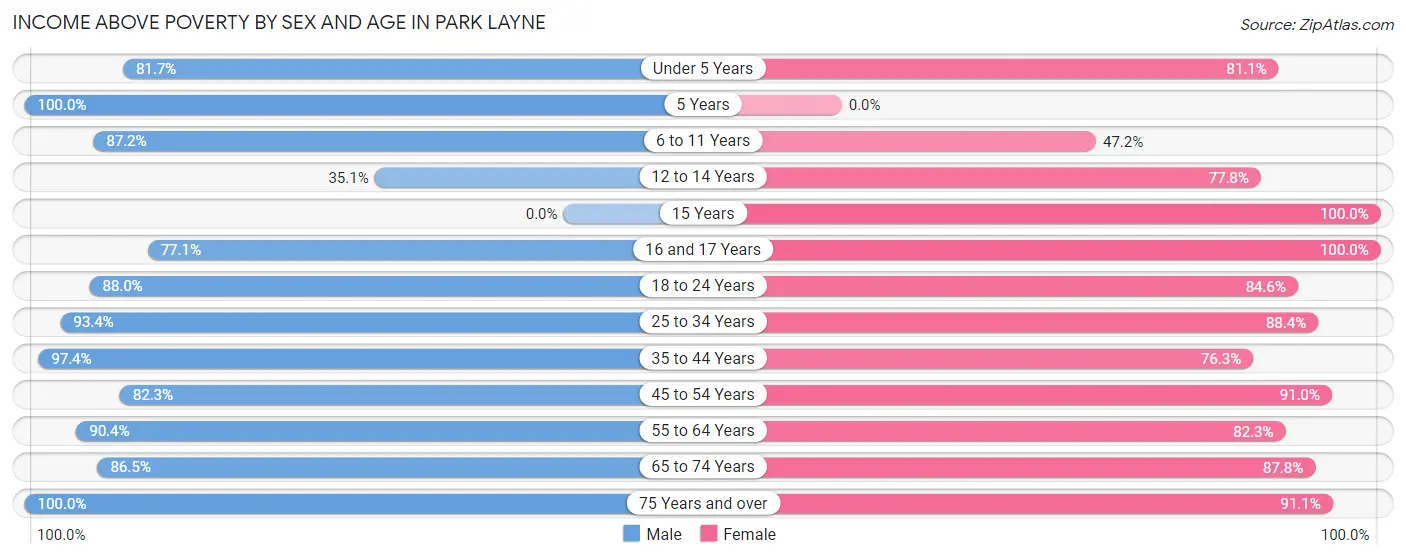
| Age Bracket | Male | Female |
| Under 5 Years | 94 (81.7%) | 210 (81.1%) |
| 5 Years | 58 (100.0%) | 0 (0.0%) |
| 6 to 11 Years | 82 (87.2%) | 42 (47.2%) |
| 12 to 14 Years | 27 (35.1%) | 49 (77.8%) |
| 15 Years | 0 (0.0%) | 20 (100.0%) |
| 16 and 17 Years | 27 (77.1%) | 10 (100.0%) |
| 18 to 24 Years | 95 (88.0%) | 121 (84.6%) |
| 25 to 34 Years | 365 (93.3%) | 236 (88.4%) |
| 35 to 44 Years | 152 (97.4%) | 174 (76.3%) |
| 45 to 54 Years | 121 (82.3%) | 171 (91.0%) |
| 55 to 64 Years | 292 (90.4%) | 270 (82.3%) |
| 65 to 74 Years | 262 (86.5%) | 202 (87.8%) |
| 75 Years and over | 106 (100.0%) | 184 (91.1%) |
| Total | 1,681 (87.9%) | 1,689 (82.0%) |
Income Below Poverty Among Married-Couple Families in Park Layne
The poverty statistics for married-couple families in Park Layne show that 5.1% or 44 of the total 855 families live below the poverty line. Families with 1 or 2 children have the highest poverty rate of 8.3%, comprising of 16 families. On the other hand, families with 3 or 4 children have the lowest poverty rate of 0.0%, which includes 0 families.
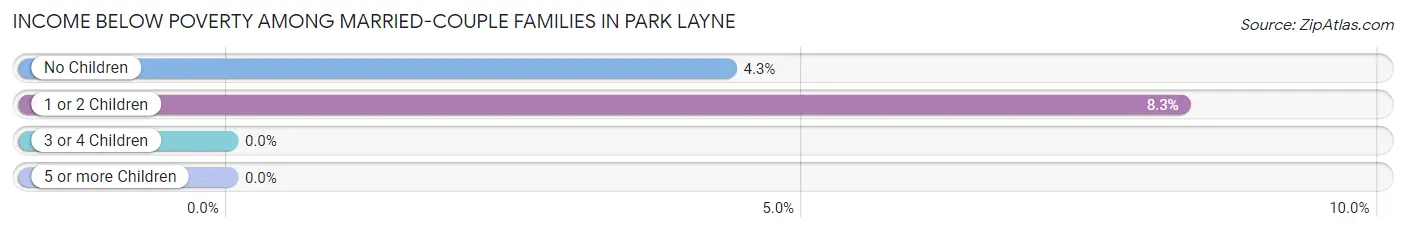
| Children | Above Poverty | Below Poverty |
| No Children | 617 (95.7%) | 28 (4.3%) |
| 1 or 2 Children | 177 (91.7%) | 16 (8.3%) |
| 3 or 4 Children | 10 (100.0%) | 0 (0.0%) |
| 5 or more Children | 7 (100.0%) | 0 (0.0%) |
| Total | 811 (94.9%) | 44 (5.1%) |
Income Below Poverty Among Single-Parent Households in Park Layne
According to the poverty data in Park Layne, 19.2% or 18 single-father households and 48.7% or 136 single-mother households are living below the poverty line. Among single-father households, those with no children have the highest poverty rate, with 10 households (26.3%) experiencing poverty. Likewise, among single-mother households, those with 3 or 4 children have the highest poverty rate, with 21 households (65.6%) falling below the poverty line.
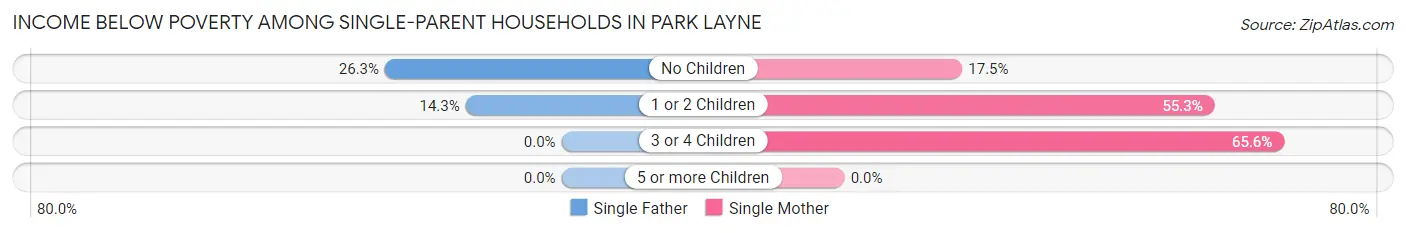
| Children | Single Father | Single Mother |
| No Children | 10 (26.3%) | 10 (17.5%) |
| 1 or 2 Children | 8 (14.3%) | 105 (55.3%) |
| 3 or 4 Children | 0 (0.0%) | 21 (65.6%) |
| 5 or more Children | 0 (0.0%) | 0 (0.0%) |
| Total | 18 (19.2%) | 136 (48.7%) |
Income Below Poverty Among Married-Couple vs Single-Parent Households in Park Layne
The poverty data for Park Layne shows that 44 of the married-couple family households (5.1%) and 154 of the single-parent households (41.3%) are living below the poverty level. Within the married-couple family households, those with 1 or 2 children have the highest poverty rate, with 16 households (8.3%) falling below the poverty line. Among the single-parent households, those with 3 or 4 children have the highest poverty rate, with 21 household (65.6%) living below poverty.
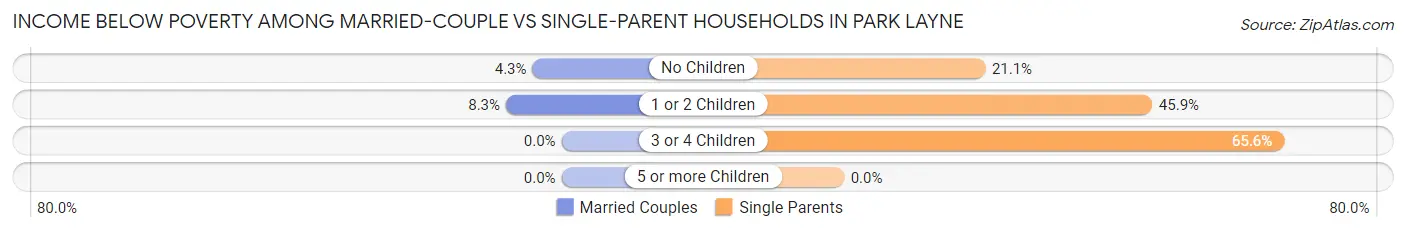
| Children | Married-Couple Families | Single-Parent Households |
| No Children | 28 (4.3%) | 20 (21.0%) |
| 1 or 2 Children | 16 (8.3%) | 113 (45.9%) |
| 3 or 4 Children | 0 (0.0%) | 21 (65.6%) |
| 5 or more Children | 0 (0.0%) | 0 (0.0%) |
| Total | 44 (5.1%) | 154 (41.3%) |
Employment Characteristics in Park Layne
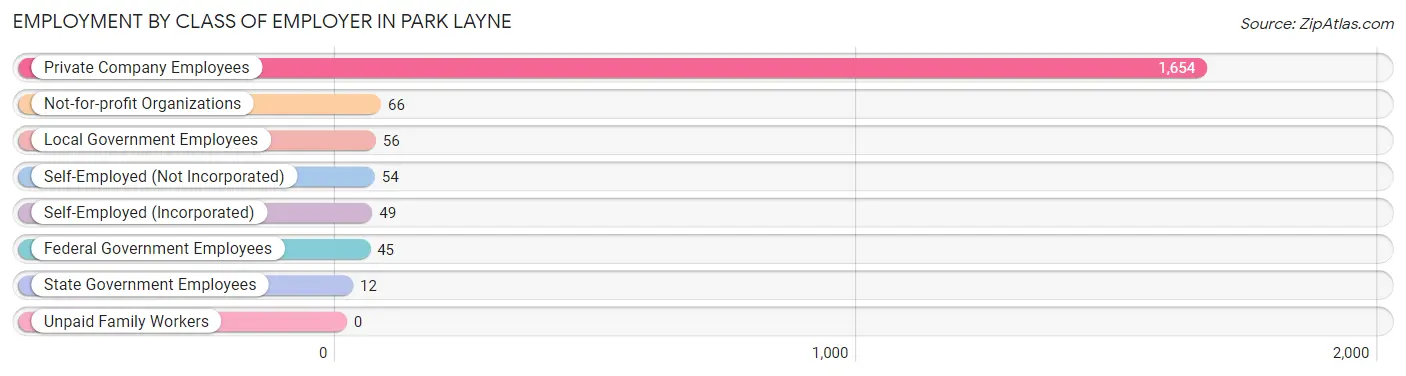
Employment by Class of Employer in Park Layne
Among the 1,936 employed individuals in Park Layne, private company employees (1,654 | 85.4%), not-for-profit organizations (66 | 3.4%), and local government employees (56 | 2.9%) make up the most common classes of employment.
| Employer Class | # Employees | % Employees |
| Private Company Employees | 1,654 | 85.4% |
| Self-Employed (Incorporated) | 49 | 2.5% |
| Self-Employed (Not Incorporated) | 54 | 2.8% |
| Not-for-profit Organizations | 66 | 3.4% |
| Local Government Employees | 56 | 2.9% |
| State Government Employees | 12 | 0.6% |
| Federal Government Employees | 45 | 2.3% |
| Unpaid Family Workers | 0 | 0.0% |
| Total | 1,936 | 100.0% |
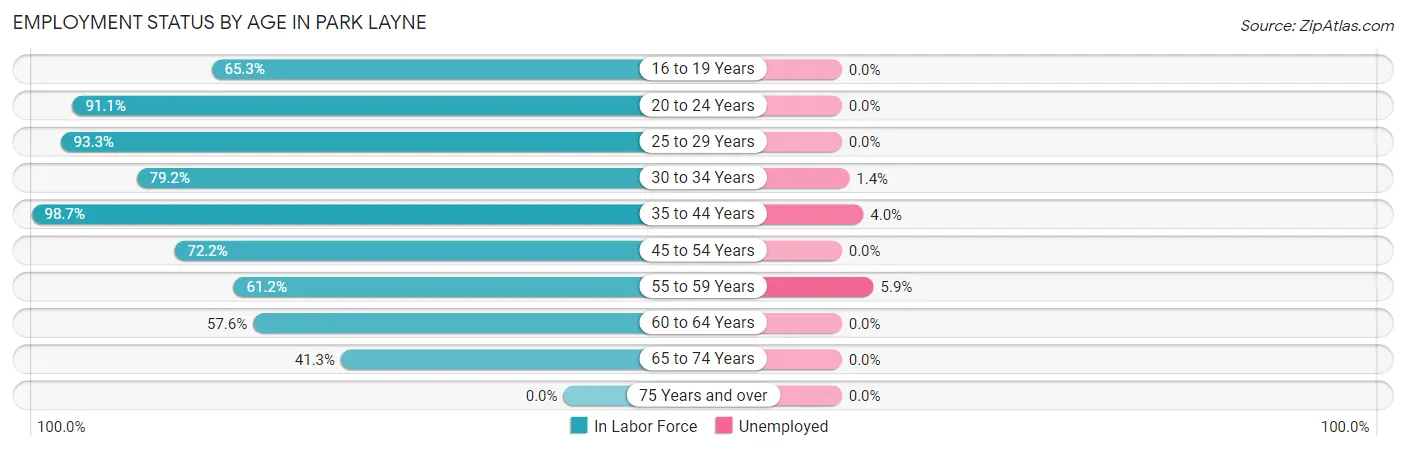
Employment Status by Age in Park Layne
According to the labor force statistics for Park Layne, out of the total population over 16 years of age (3,165), 64.3% or 2,035 individuals are in the labor force, with 1.4% or 28 of them unemployed. The age group with the highest labor force participation rate is 35 to 44 years, with 98.7% or 379 individuals in the labor force. Within the labor force, the 55 to 59 years age range has the highest percentage of unemployed individuals, with 5.9% or 11 of them being unemployed.
| Age Bracket | In Labor Force | Unemployed |
| 16 to 19 Years | 98 (65.3%) | 0 (0.0%) |
| 20 to 24 Years | 133 (91.1%) | 0 (0.0%) |
| 25 to 29 Years | 363 (93.3%) | 0 (0.0%) |
| 30 to 34 Years | 213 (79.2%) | 3 (1.4%) |
| 35 to 44 Years | 379 (98.7%) | 15 (4.0%) |
| 45 to 54 Years | 242 (72.2%) | 0 (0.0%) |
| 55 to 59 Years | 188 (61.2%) | 11 (5.9%) |
| 60 to 64 Years | 198 (57.6%) | 0 (0.0%) |
| 65 to 74 Years | 220 (41.3%) | 0 (0.0%) |
| 75 Years and over | 0 (0.0%) | 0 (0.0%) |
| Total | 2,035 (64.3%) | 28 (1.4%) |
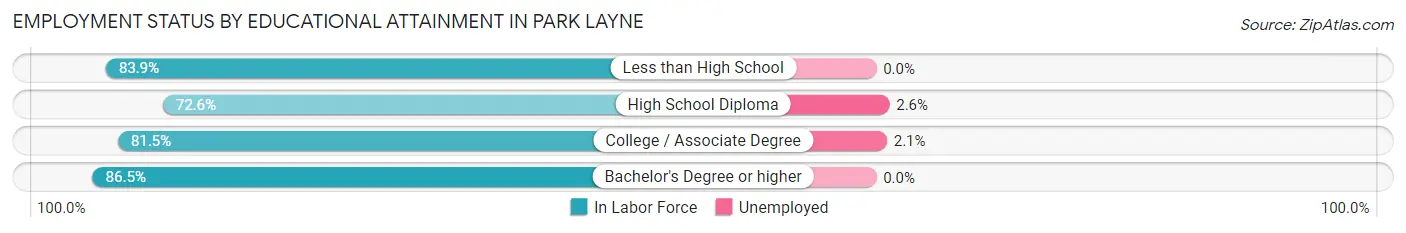
Employment Status by Educational Attainment in Park Layne
According to labor force statistics for Park Layne, 78.1% of individuals (1,584) out of the total population between 25 and 64 years of age (2,028) are in the labor force, with 1.8% or 29 of them being unemployed. The group with the highest labor force participation rate are those with the educational attainment of bachelor's degree or higher, with 86.5% or 180 individuals in the labor force. Within the labor force, individuals with high school diploma education have the highest percentage of unemployment, with 2.6% or 18 of them being unemployed.
| Educational Attainment | In Labor Force | Unemployed |
| Less than High School | 167 (83.9%) | 0 (0.0%) |
| High School Diploma | 694 (72.6%) | 25 (2.6%) |
| College / Associate Degree | 542 (81.5%) | 14 (2.1%) |
| Bachelor's Degree or higher | 180 (86.5%) | 0 (0.0%) |
| Total | 1,584 (78.1%) | 37 (1.8%) |
Employment Occupations by Sex in Park Layne
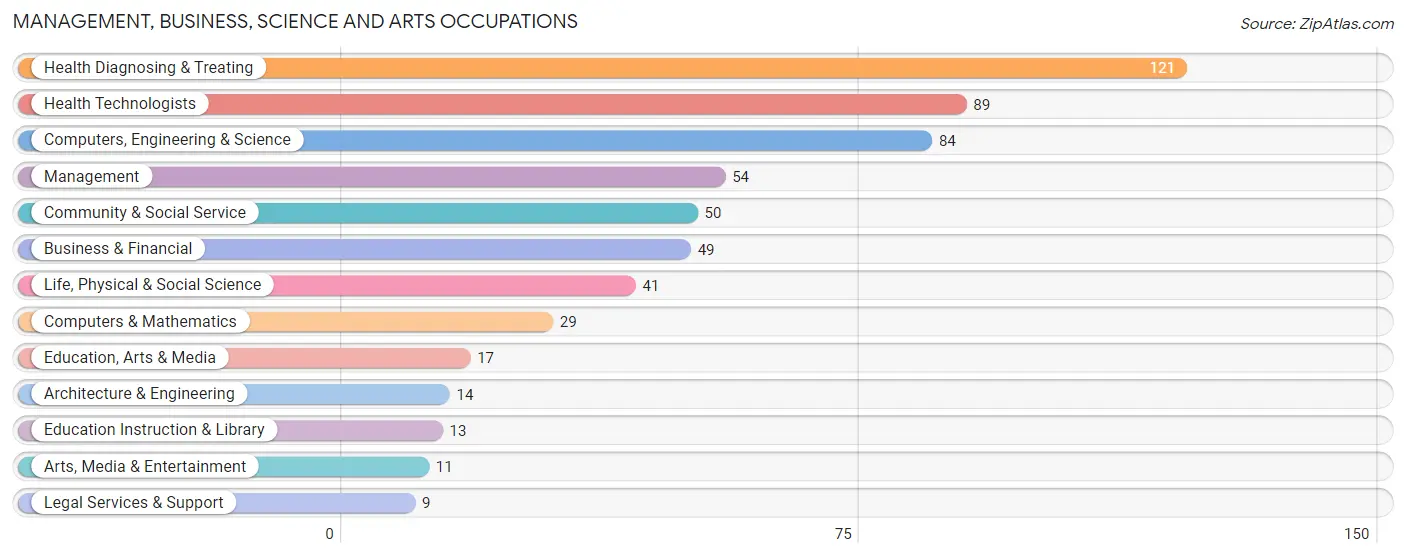
Management, Business, Science and Arts Occupations
The most common Management, Business, Science and Arts occupations in Park Layne are Health Diagnosing & Treating (121 | 6.1%), Health Technologists (89 | 4.5%), Computers, Engineering & Science (84 | 4.2%), Management (54 | 2.7%), and Community & Social Service (50 | 2.5%).
Management, Business, Science and Arts Occupations by Sex
Within the Management, Business, Science and Arts occupations in Park Layne, the most male-oriented occupations are Architecture & Engineering (100.0%), Life, Physical & Social Science (100.0%), and Legal Services & Support (100.0%), while the most female-oriented occupations are Education, Arts & Media (100.0%), Education Instruction & Library (100.0%), and Arts, Media & Entertainment (100.0%).
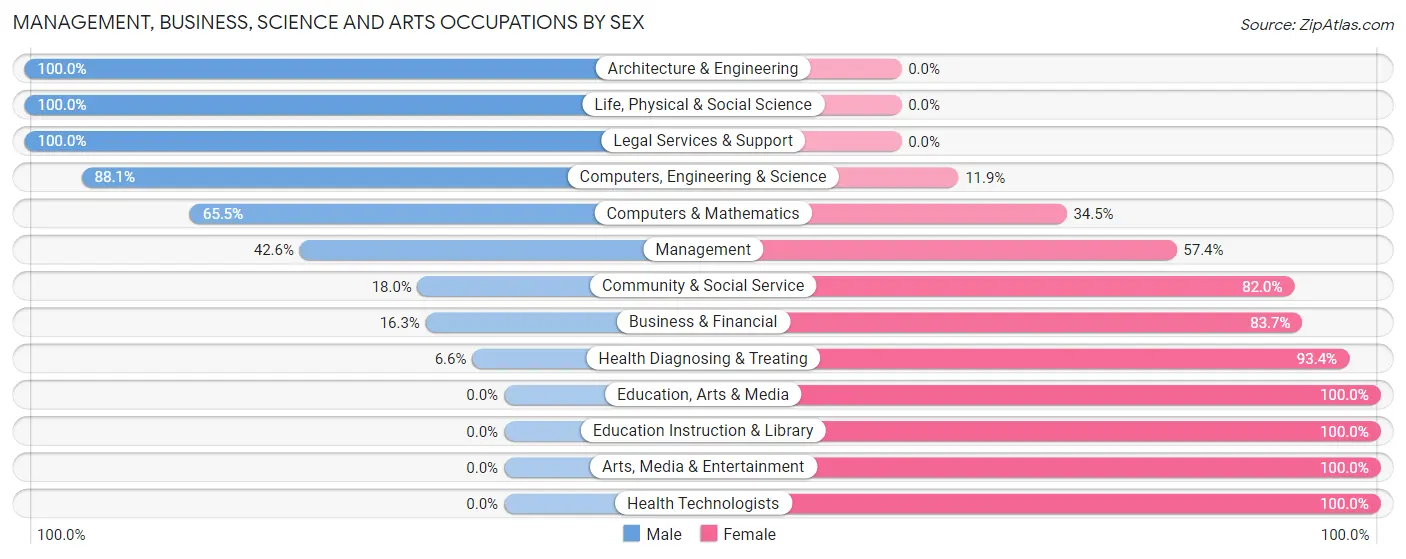
| Occupation | Male | Female |
| Management | 23 (42.6%) | 31 (57.4%) |
| Business & Financial | 8 (16.3%) | 41 (83.7%) |
| Computers, Engineering & Science | 74 (88.1%) | 10 (11.9%) |
| Computers & Mathematics | 19 (65.5%) | 10 (34.5%) |
| Architecture & Engineering | 14 (100.0%) | 0 (0.0%) |
| Life, Physical & Social Science | 41 (100.0%) | 0 (0.0%) |
| Community & Social Service | 9 (18.0%) | 41 (82.0%) |
| Education, Arts & Media | 0 (0.0%) | 17 (100.0%) |
| Legal Services & Support | 9 (100.0%) | 0 (0.0%) |
| Education Instruction & Library | 0 (0.0%) | 13 (100.0%) |
| Arts, Media & Entertainment | 0 (0.0%) | 11 (100.0%) |
| Health Diagnosing & Treating | 8 (6.6%) | 113 (93.4%) |
| Health Technologists | 0 (0.0%) | 89 (100.0%) |
| Total (Category) | 122 (34.1%) | 236 (65.9%) |
| Total (Overall) | 1,092 (54.9%) | 898 (45.1%) |
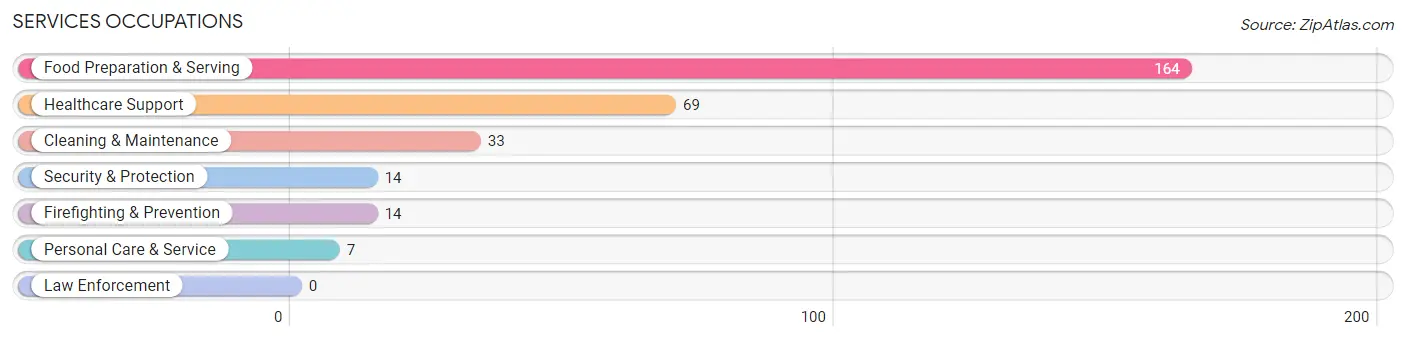
Services Occupations
The most common Services occupations in Park Layne are Food Preparation & Serving (164 | 8.2%), Healthcare Support (69 | 3.5%), Cleaning & Maintenance (33 | 1.7%), Security & Protection (14 | 0.7%), and Firefighting & Prevention (14 | 0.7%).
Services Occupations by Sex
Within the Services occupations in Park Layne, the most male-oriented occupations are Security & Protection (100.0%), Firefighting & Prevention (100.0%), and Personal Care & Service (100.0%), while the most female-oriented occupations are Healthcare Support (100.0%), Cleaning & Maintenance (48.5%), and Food Preparation & Serving (48.2%).
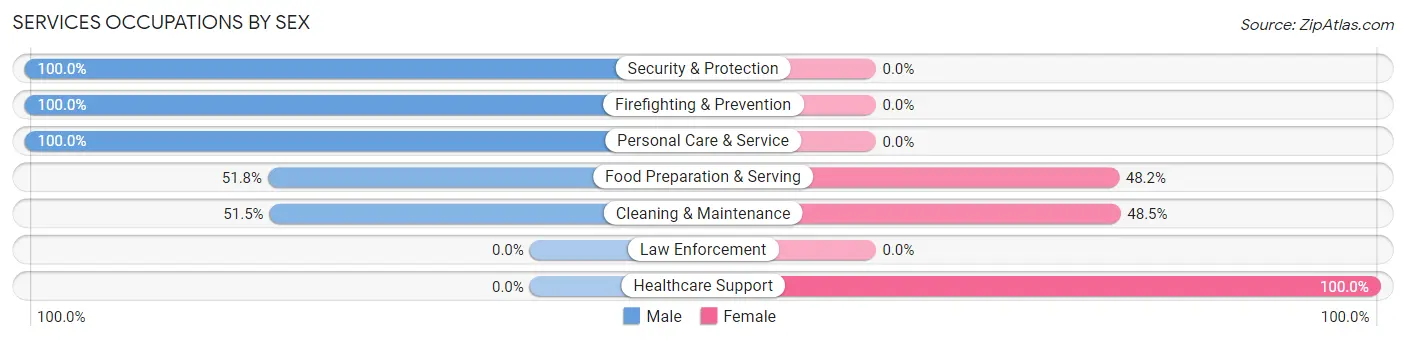
| Occupation | Male | Female |
| Healthcare Support | 0 (0.0%) | 69 (100.0%) |
| Security & Protection | 14 (100.0%) | 0 (0.0%) |
| Firefighting & Prevention | 14 (100.0%) | 0 (0.0%) |
| Law Enforcement | 0 (0.0%) | 0 (0.0%) |
| Food Preparation & Serving | 85 (51.8%) | 79 (48.2%) |
| Cleaning & Maintenance | 17 (51.5%) | 16 (48.5%) |
| Personal Care & Service | 7 (100.0%) | 0 (0.0%) |
| Total (Category) | 123 (42.9%) | 164 (57.1%) |
| Total (Overall) | 1,092 (54.9%) | 898 (45.1%) |
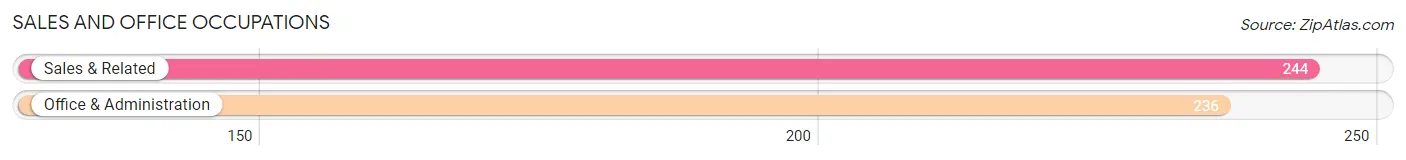
Sales and Office Occupations
The most common Sales and Office occupations in Park Layne are Sales & Related (244 | 12.3%), and Office & Administration (236 | 11.9%).
Sales and Office Occupations by Sex
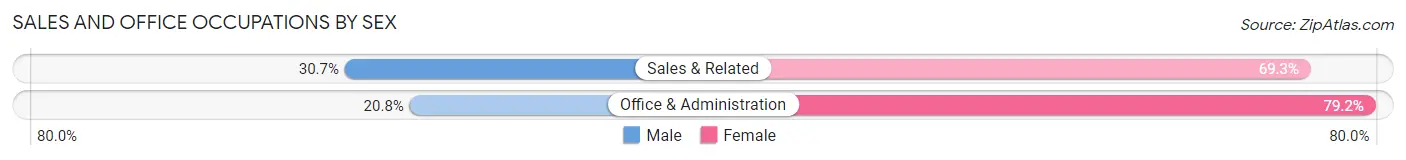
| Occupation | Male | Female |
| Sales & Related | 75 (30.7%) | 169 (69.3%) |
| Office & Administration | 49 (20.8%) | 187 (79.2%) |
| Total (Category) | 124 (25.8%) | 356 (74.2%) |
| Total (Overall) | 1,092 (54.9%) | 898 (45.1%) |
Natural Resources, Construction and Maintenance Occupations
The most common Natural Resources, Construction and Maintenance occupations in Park Layne are Construction & Extraction (92 | 4.6%), and Installation, Maintenance & Repair (67 | 3.4%).
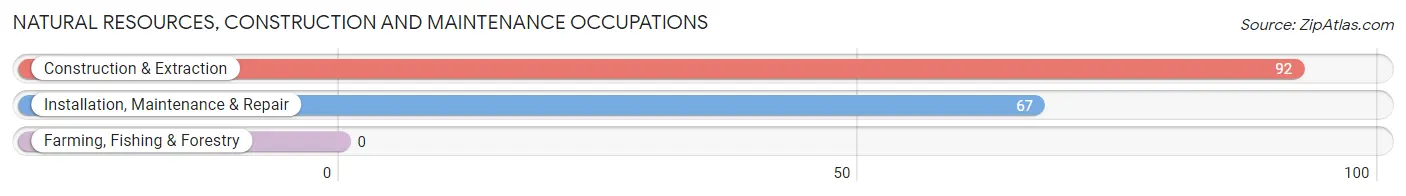
Natural Resources, Construction and Maintenance Occupations by Sex
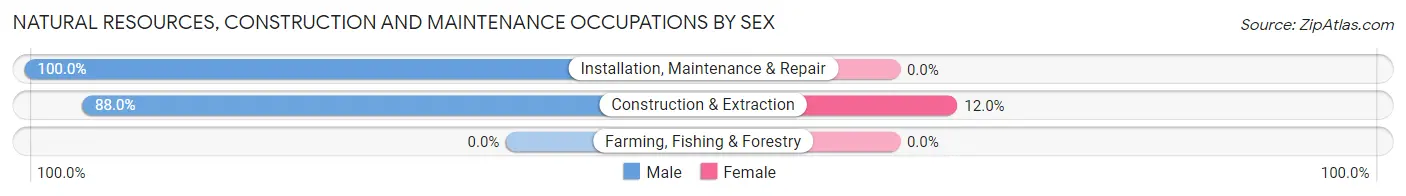
| Occupation | Male | Female |
| Farming, Fishing & Forestry | 0 (0.0%) | 0 (0.0%) |
| Construction & Extraction | 81 (88.0%) | 11 (12.0%) |
| Installation, Maintenance & Repair | 67 (100.0%) | 0 (0.0%) |
| Total (Category) | 148 (93.1%) | 11 (6.9%) |
| Total (Overall) | 1,092 (54.9%) | 898 (45.1%) |
Production, Transportation and Moving Occupations
The most common Production, Transportation and Moving occupations in Park Layne are Transportation (305 | 15.3%), Production (260 | 13.1%), and Material Moving (141 | 7.1%).
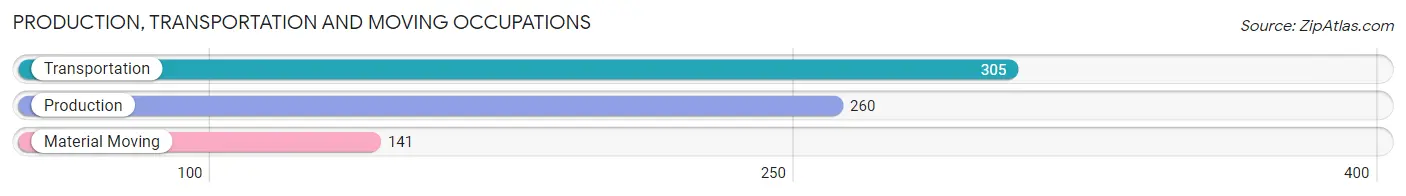
Production, Transportation and Moving Occupations by Sex
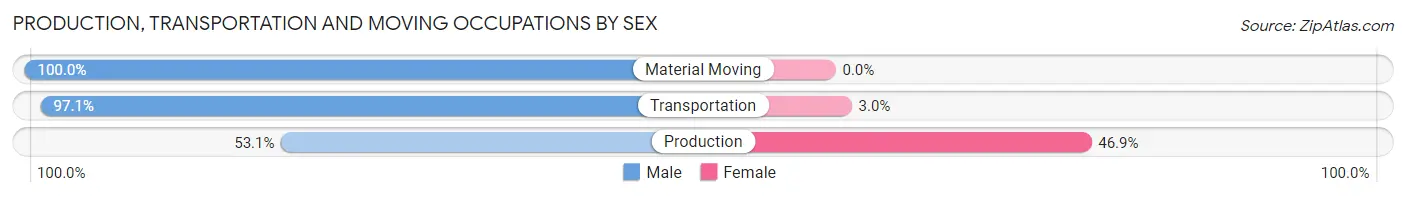
| Occupation | Male | Female |
| Production | 138 (53.1%) | 122 (46.9%) |
| Transportation | 296 (97.1%) | 9 (2.9%) |
| Material Moving | 141 (100.0%) | 0 (0.0%) |
| Total (Category) | 575 (81.4%) | 131 (18.6%) |
| Total (Overall) | 1,092 (54.9%) | 898 (45.1%) |
Employment Industries by Sex in Park Layne
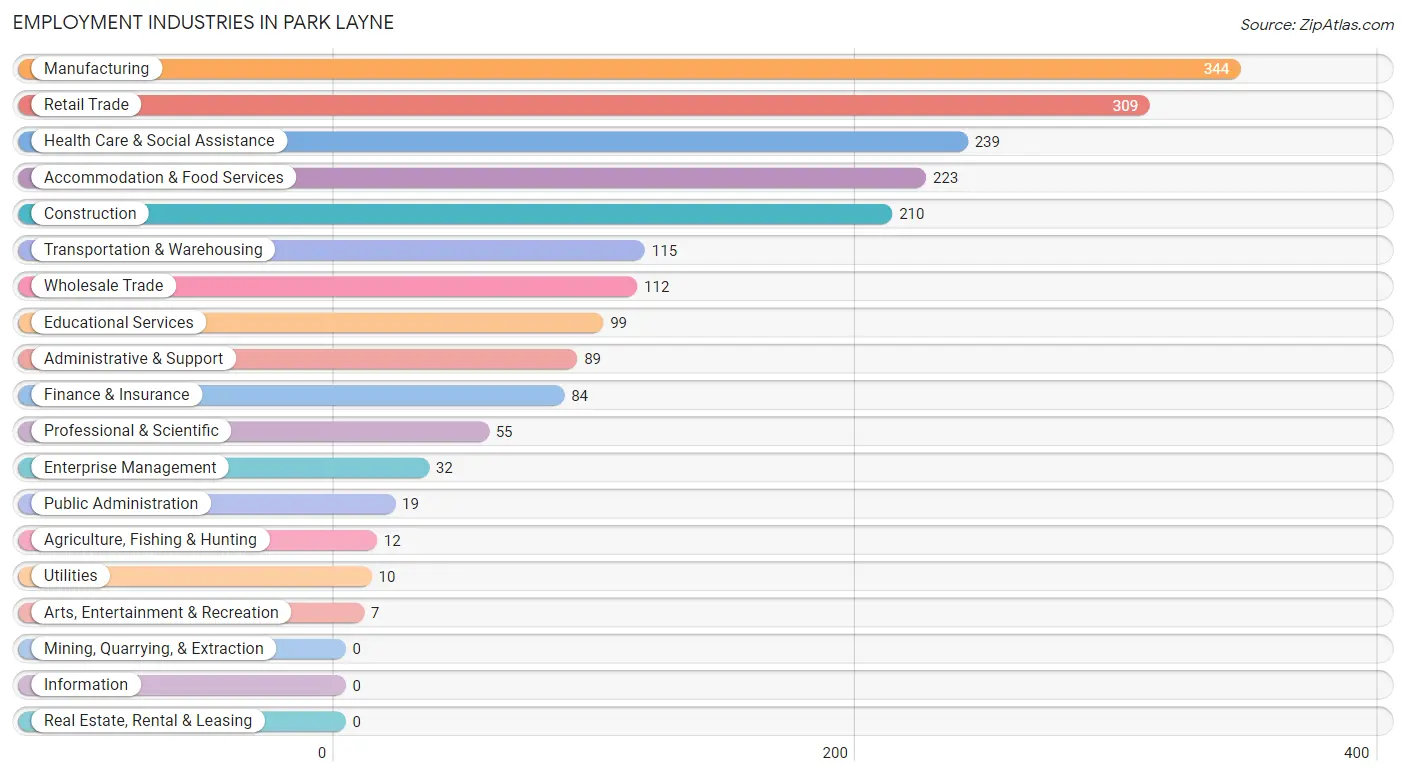
Employment Industries in Park Layne
The major employment industries in Park Layne include Manufacturing (344 | 17.3%), Retail Trade (309 | 15.5%), Health Care & Social Assistance (239 | 12.0%), Accommodation & Food Services (223 | 11.2%), and Construction (210 | 10.5%).
Employment Industries by Sex in Park Layne
The Park Layne industries that see more men than women are Agriculture, Fishing & Hunting (100.0%), Construction (100.0%), and Wholesale Trade (100.0%), whereas the industries that tend to have a higher number of women are Enterprise Management (100.0%), Health Care & Social Assistance (96.7%), and Finance & Insurance (88.1%).
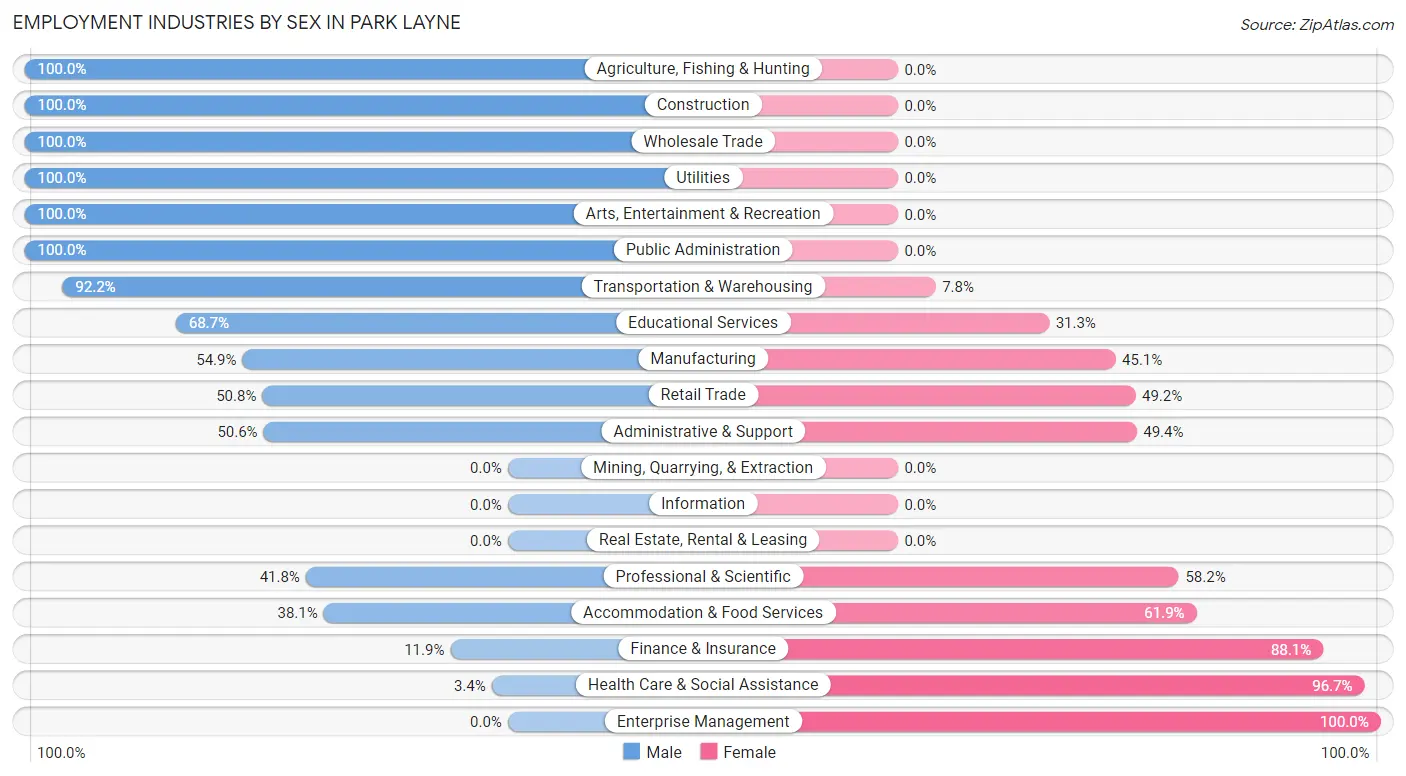
| Industry | Male | Female |
| Agriculture, Fishing & Hunting | 12 (100.0%) | 0 (0.0%) |
| Mining, Quarrying, & Extraction | 0 (0.0%) | 0 (0.0%) |
| Construction | 210 (100.0%) | 0 (0.0%) |
| Manufacturing | 189 (54.9%) | 155 (45.1%) |
| Wholesale Trade | 112 (100.0%) | 0 (0.0%) |
| Retail Trade | 157 (50.8%) | 152 (49.2%) |
| Transportation & Warehousing | 106 (92.2%) | 9 (7.8%) |
| Utilities | 10 (100.0%) | 0 (0.0%) |
| Information | 0 (0.0%) | 0 (0.0%) |
| Finance & Insurance | 10 (11.9%) | 74 (88.1%) |
| Real Estate, Rental & Leasing | 0 (0.0%) | 0 (0.0%) |
| Professional & Scientific | 23 (41.8%) | 32 (58.2%) |
| Enterprise Management | 0 (0.0%) | 32 (100.0%) |
| Administrative & Support | 45 (50.6%) | 44 (49.4%) |
| Educational Services | 68 (68.7%) | 31 (31.3%) |
| Health Care & Social Assistance | 8 (3.4%) | 231 (96.7%) |
| Arts, Entertainment & Recreation | 7 (100.0%) | 0 (0.0%) |
| Accommodation & Food Services | 85 (38.1%) | 138 (61.9%) |
| Public Administration | 19 (100.0%) | 0 (0.0%) |
| Total | 1,092 (54.9%) | 898 (45.1%) |
Education in Park Layne
School Enrollment in Park Layne
The most common levels of schooling among the 676 students in Park Layne are middle school (195 | 28.8%), kindergarten (107 | 15.8%), and college / undergraduate (102 | 15.1%).
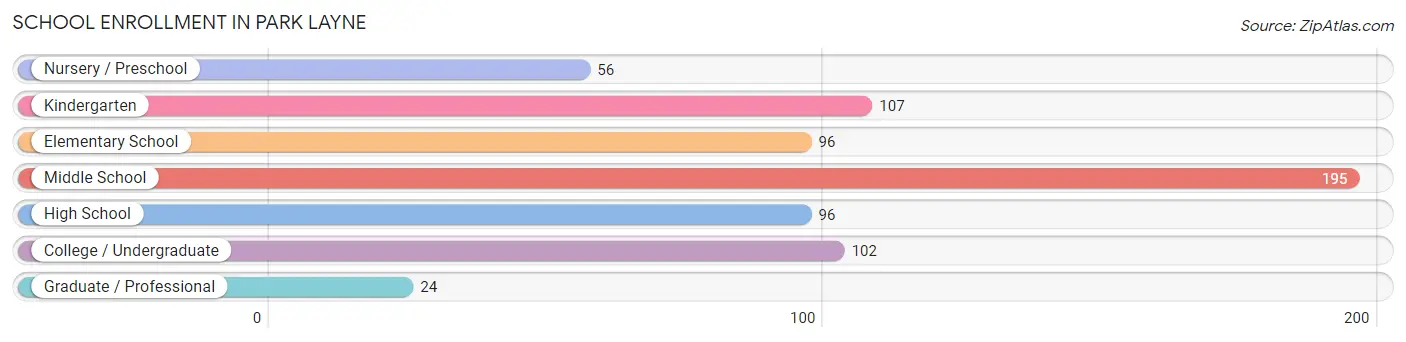
| School Level | # Students | % Students |
| Nursery / Preschool | 56 | 8.3% |
| Kindergarten | 107 | 15.8% |
| Elementary School | 96 | 14.2% |
| Middle School | 195 | 28.8% |
| High School | 96 | 14.2% |
| College / Undergraduate | 102 | 15.1% |
| Graduate / Professional | 24 | 3.5% |
| Total | 676 | 100.0% |
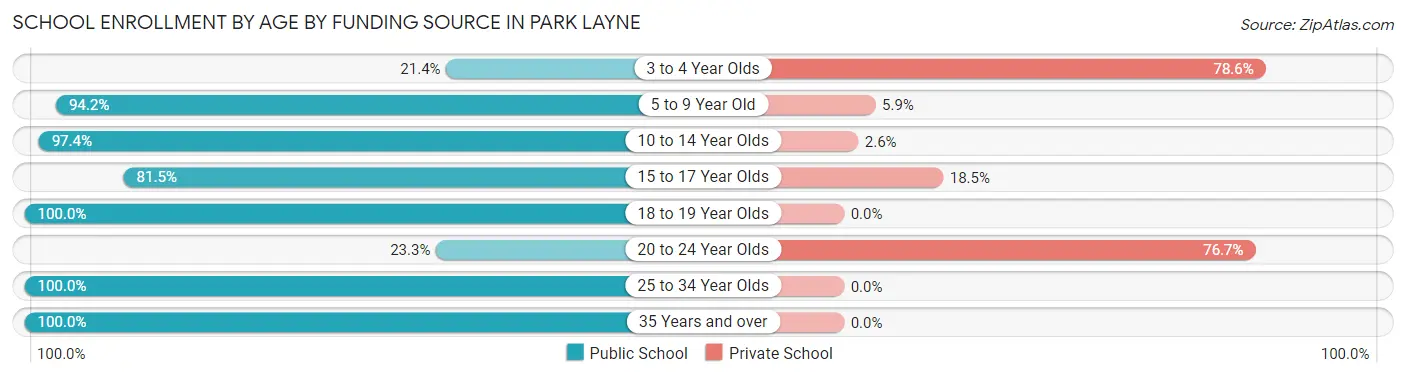
School Enrollment by Age by Funding Source in Park Layne
Out of a total of 676 students who are enrolled in schools in Park Layne, 119 (17.6%) attend a private institution, while the remaining 557 (82.4%) are enrolled in public schools. The age group of 3 to 4 year olds has the highest likelihood of being enrolled in private schools, with 44 (78.6% in the age bracket) enrolled. Conversely, the age group of 18 to 19 year olds has the lowest likelihood of being enrolled in a private school, with 25 (100.0% in the age bracket) attending a public institution.
| Age Bracket | Public School | Private School |
| 3 to 4 Year Olds | 12 (21.4%) | 44 (78.6%) |
| 5 to 9 Year Old | 177 (94.2%) | 11 (5.9%) |
| 10 to 14 Year Olds | 221 (97.4%) | 6 (2.6%) |
| 15 to 17 Year Olds | 53 (81.5%) | 12 (18.5%) |
| 18 to 19 Year Olds | 25 (100.0%) | 0 (0.0%) |
| 20 to 24 Year Olds | 14 (23.3%) | 46 (76.7%) |
| 25 to 34 Year Olds | 35 (100.0%) | 0 (0.0%) |
| 35 Years and over | 20 (100.0%) | 0 (0.0%) |
| Total | 557 (82.4%) | 119 (17.6%) |
Educational Attainment by Field of Study in Park Layne
Science & technology (72 | 26.9%), liberal arts & history (54 | 20.2%), arts & humanities (26 | 9.7%), social sciences (22 | 8.2%), and bio, nature & agricultural (21 | 7.8%) are the most common fields of study among 268 individuals in Park Layne who have obtained a bachelor's degree or higher.
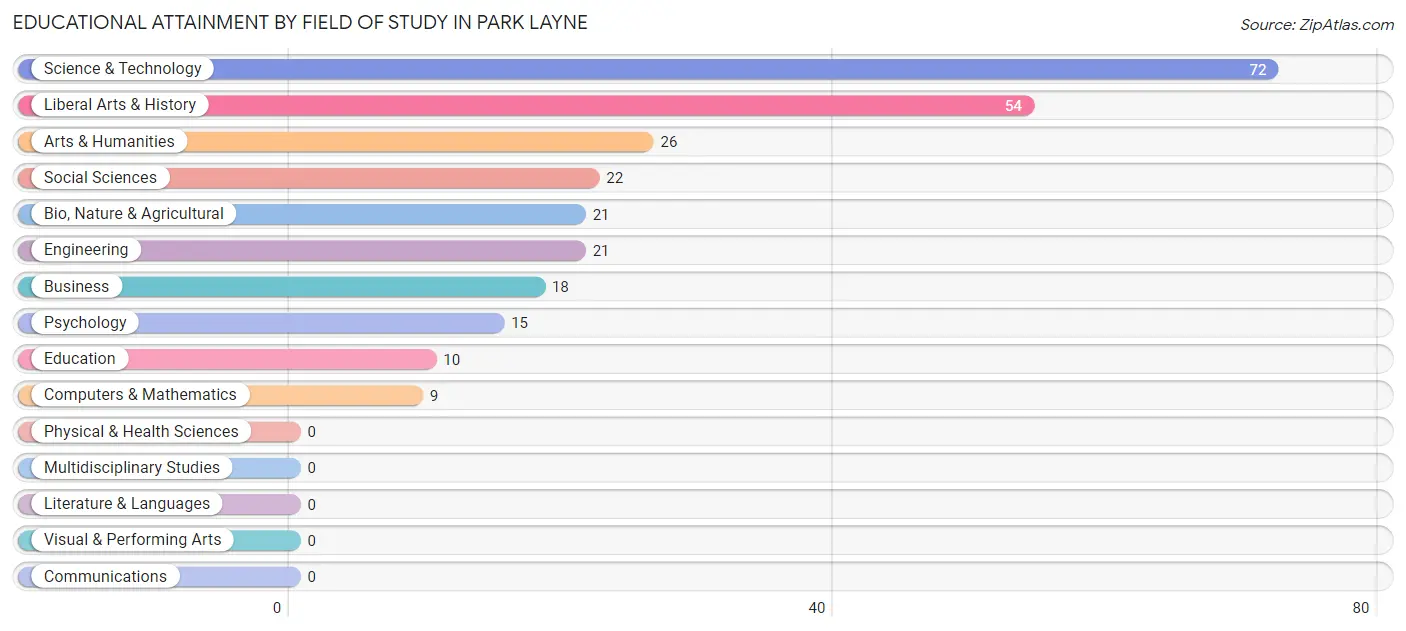
| Field of Study | # Graduates | % Graduates |
| Computers & Mathematics | 9 | 3.4% |
| Bio, Nature & Agricultural | 21 | 7.8% |
| Physical & Health Sciences | 0 | 0.0% |
| Psychology | 15 | 5.6% |
| Social Sciences | 22 | 8.2% |
| Engineering | 21 | 7.8% |
| Multidisciplinary Studies | 0 | 0.0% |
| Science & Technology | 72 | 26.9% |
| Business | 18 | 6.7% |
| Education | 10 | 3.7% |
| Literature & Languages | 0 | 0.0% |
| Liberal Arts & History | 54 | 20.2% |
| Visual & Performing Arts | 0 | 0.0% |
| Communications | 0 | 0.0% |
| Arts & Humanities | 26 | 9.7% |
| Total | 268 | 100.0% |
Transportation & Commute in Park Layne
Vehicle Availability by Sex in Park Layne
The most prevalent vehicle ownership categories in Park Layne are males with 2 vehicles (504, accounting for 49.3%) and females with 2 vehicles (469, making up 55.2%).
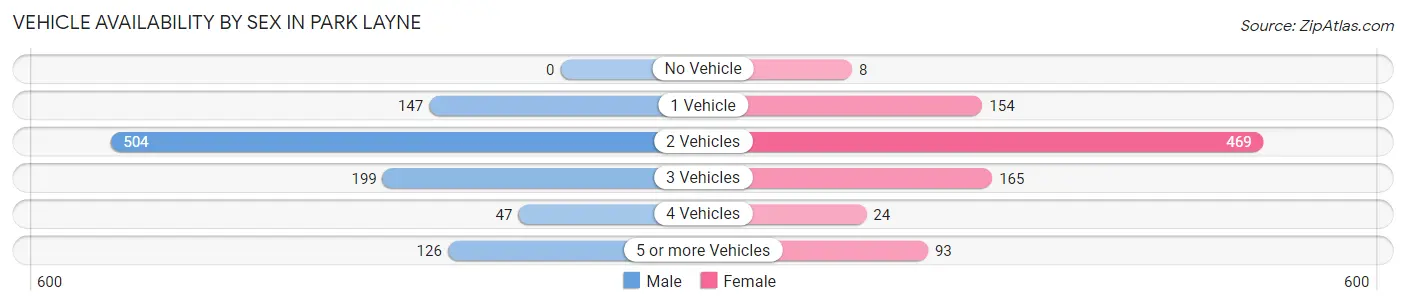
| Vehicles Available | Male | Female |
| No Vehicle | 0 (0.0%) | 8 (0.9%) |
| 1 Vehicle | 147 (14.4%) | 154 (16.9%) |
| 2 Vehicles | 504 (49.3%) | 469 (51.4%) |
| 3 Vehicles | 199 (19.5%) | 165 (18.1%) |
| 4 Vehicles | 47 (4.6%) | 24 (2.6%) |
| 5 or more Vehicles | 126 (12.3%) | 93 (10.2%) |
| Total | 1,023 (100.0%) | 913 (100.0%) |
Commute Time in Park Layne
The most frequently occuring commute durations in Park Layne are 15 to 19 minutes (490 commuters, 25.7%), 20 to 24 minutes (382 commuters, 20.0%), and less than 5 minutes (180 commuters, 9.4%).
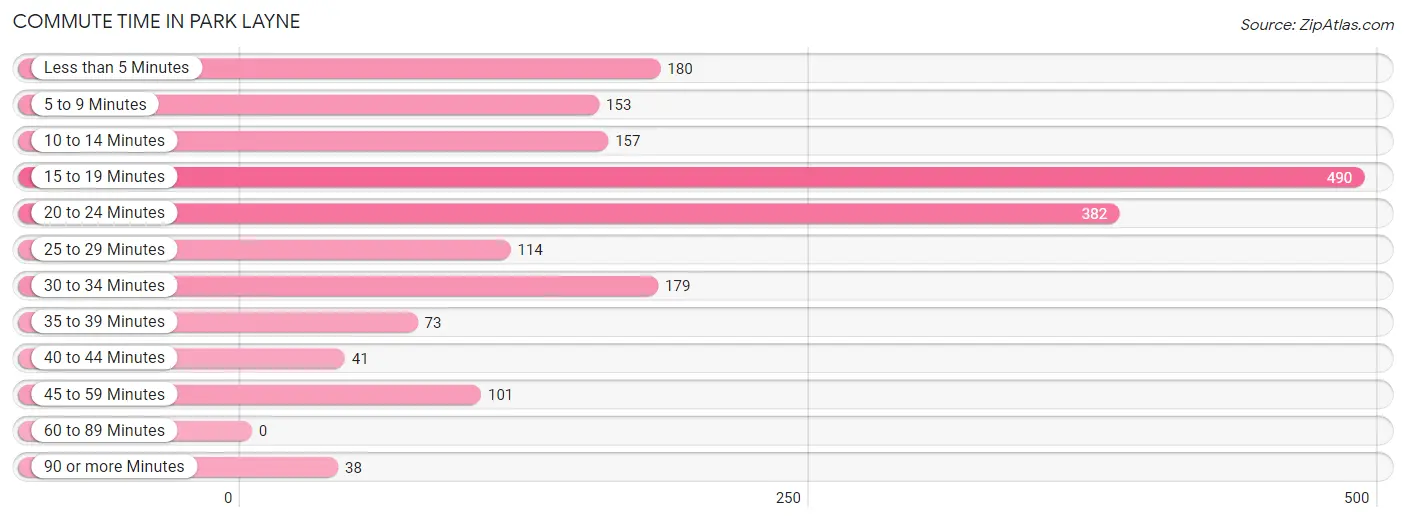
| Commute Time | # Commuters | % Commuters |
| Less than 5 Minutes | 180 | 9.4% |
| 5 to 9 Minutes | 153 | 8.0% |
| 10 to 14 Minutes | 157 | 8.2% |
| 15 to 19 Minutes | 490 | 25.7% |
| 20 to 24 Minutes | 382 | 20.0% |
| 25 to 29 Minutes | 114 | 6.0% |
| 30 to 34 Minutes | 179 | 9.4% |
| 35 to 39 Minutes | 73 | 3.8% |
| 40 to 44 Minutes | 41 | 2.1% |
| 45 to 59 Minutes | 101 | 5.3% |
| 60 to 89 Minutes | 0 | 0.0% |
| 90 or more Minutes | 38 | 2.0% |
Commute Time by Sex in Park Layne
The most common commute times in Park Layne are 15 to 19 minutes (403 commuters, 39.8%) for males and 20 to 24 minutes (206 commuters, 23.0%) for females.
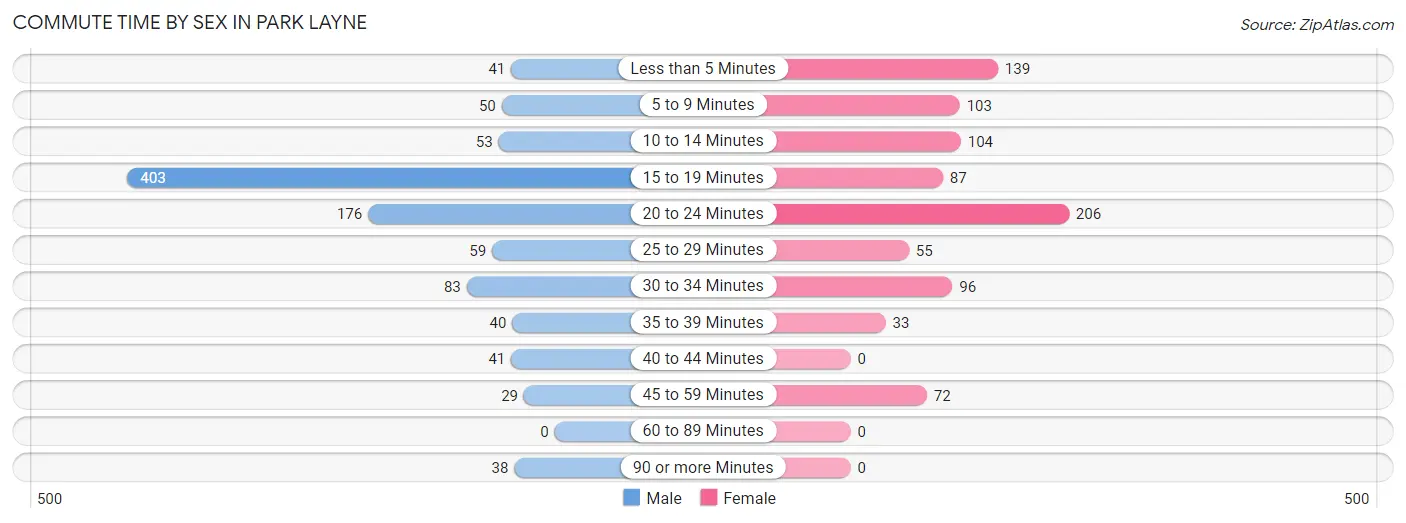
| Commute Time | Male | Female |
| Less than 5 Minutes | 41 (4.1%) | 139 (15.5%) |
| 5 to 9 Minutes | 50 (4.9%) | 103 (11.5%) |
| 10 to 14 Minutes | 53 (5.2%) | 104 (11.6%) |
| 15 to 19 Minutes | 403 (39.8%) | 87 (9.7%) |
| 20 to 24 Minutes | 176 (17.4%) | 206 (23.0%) |
| 25 to 29 Minutes | 59 (5.8%) | 55 (6.1%) |
| 30 to 34 Minutes | 83 (8.2%) | 96 (10.7%) |
| 35 to 39 Minutes | 40 (4.0%) | 33 (3.7%) |
| 40 to 44 Minutes | 41 (4.1%) | 0 (0.0%) |
| 45 to 59 Minutes | 29 (2.9%) | 72 (8.0%) |
| 60 to 89 Minutes | 0 (0.0%) | 0 (0.0%) |
| 90 or more Minutes | 38 (3.7%) | 0 (0.0%) |
Time of Departure to Work by Sex in Park Layne
The most frequent times of departure to work in Park Layne are 9:00 AM to 9:59 AM (232, 22.9%) for males and 4:00 PM to 11:59 PM (190, 21.2%) for females.
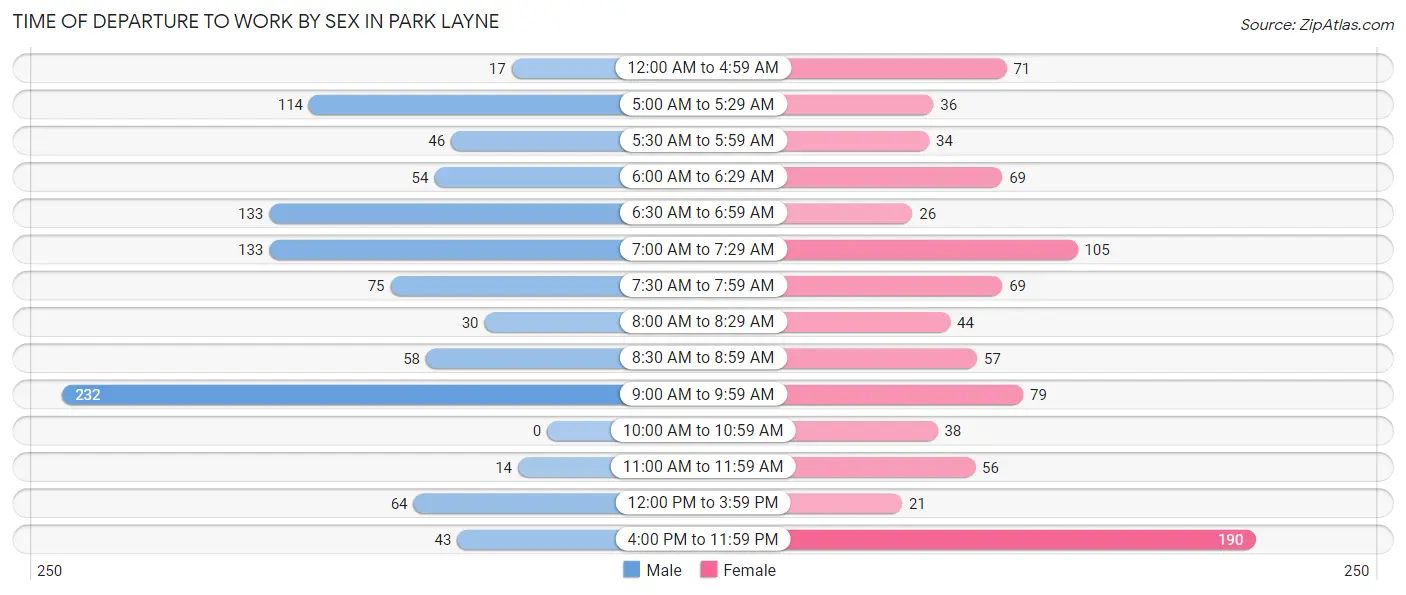
| Time of Departure | Male | Female |
| 12:00 AM to 4:59 AM | 17 (1.7%) | 71 (7.9%) |
| 5:00 AM to 5:29 AM | 114 (11.3%) | 36 (4.0%) |
| 5:30 AM to 5:59 AM | 46 (4.5%) | 34 (3.8%) |
| 6:00 AM to 6:29 AM | 54 (5.3%) | 69 (7.7%) |
| 6:30 AM to 6:59 AM | 133 (13.1%) | 26 (2.9%) |
| 7:00 AM to 7:29 AM | 133 (13.1%) | 105 (11.7%) |
| 7:30 AM to 7:59 AM | 75 (7.4%) | 69 (7.7%) |
| 8:00 AM to 8:29 AM | 30 (3.0%) | 44 (4.9%) |
| 8:30 AM to 8:59 AM | 58 (5.7%) | 57 (6.4%) |
| 9:00 AM to 9:59 AM | 232 (22.9%) | 79 (8.8%) |
| 10:00 AM to 10:59 AM | 0 (0.0%) | 38 (4.3%) |
| 11:00 AM to 11:59 AM | 14 (1.4%) | 56 (6.3%) |
| 12:00 PM to 3:59 PM | 64 (6.3%) | 21 (2.4%) |
| 4:00 PM to 11:59 PM | 43 (4.2%) | 190 (21.2%) |
| Total | 1,013 (100.0%) | 895 (100.0%) |
Housing Occupancy in Park Layne
Occupancy by Ownership in Park Layne
Of the total 1,584 dwellings in Park Layne, owner-occupied units account for 1,257 (79.4%), while renter-occupied units make up 327 (20.6%).
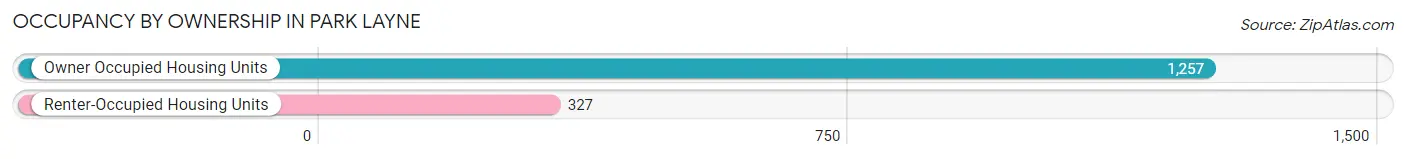
| Occupancy | # Housing Units | % Housing Units |
| Owner Occupied Housing Units | 1,257 | 79.4% |
| Renter-Occupied Housing Units | 327 | 20.6% |
| Total Occupied Housing Units | 1,584 | 100.0% |
Occupancy by Household Size in Park Layne
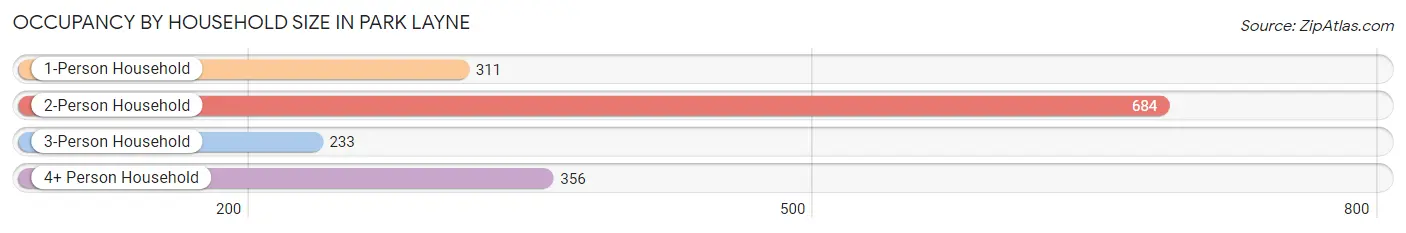
| Household Size | # Housing Units | % Housing Units |
| 1-Person Household | 311 | 19.6% |
| 2-Person Household | 684 | 43.2% |
| 3-Person Household | 233 | 14.7% |
| 4+ Person Household | 356 | 22.5% |
| Total Housing Units | 1,584 | 100.0% |
Occupancy by Ownership by Household Size in Park Layne
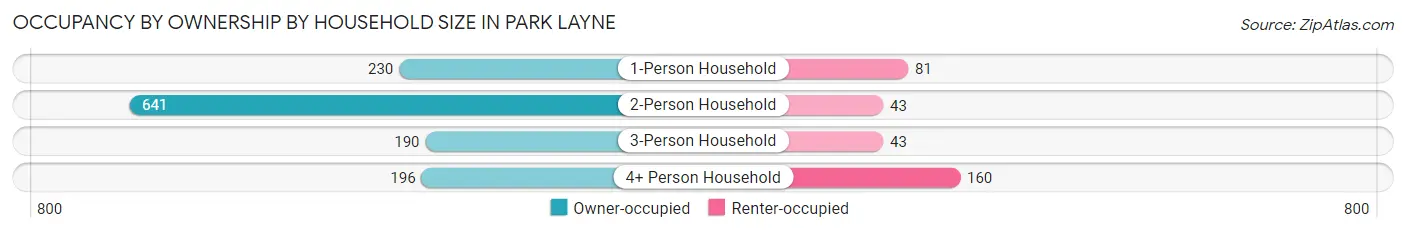
| Household Size | Owner-occupied | Renter-occupied |
| 1-Person Household | 230 (74.0%) | 81 (26.1%) |
| 2-Person Household | 641 (93.7%) | 43 (6.3%) |
| 3-Person Household | 190 (81.6%) | 43 (18.4%) |
| 4+ Person Household | 196 (55.1%) | 160 (44.9%) |
| Total Housing Units | 1,257 (79.4%) | 327 (20.6%) |
Occupancy by Educational Attainment in Park Layne
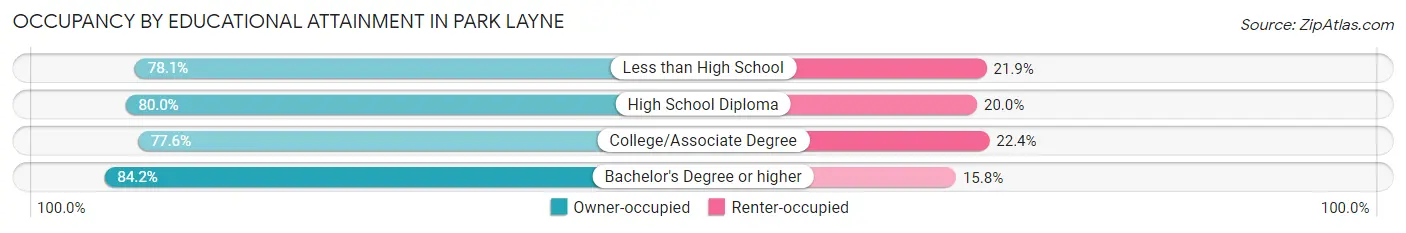
| Household Size | Owner-occupied | Renter-occupied |
| Less than High School | 175 (78.1%) | 49 (21.9%) |
| High School Diploma | 632 (80.0%) | 158 (20.0%) |
| College/Associate Degree | 349 (77.6%) | 101 (22.4%) |
| Bachelor's Degree or higher | 101 (84.2%) | 19 (15.8%) |
Occupancy by Age of Householder in Park Layne
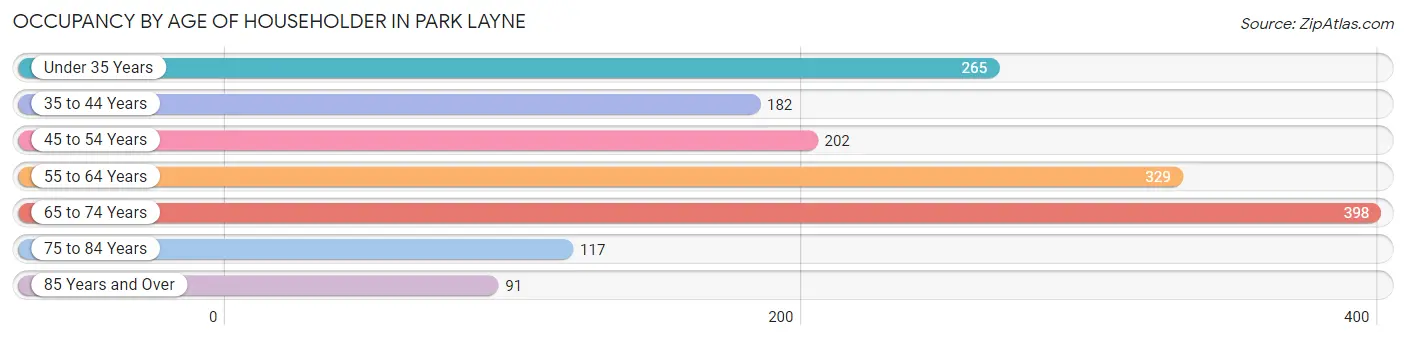
| Age Bracket | # Households | % Households |
| Under 35 Years | 265 | 16.7% |
| 35 to 44 Years | 182 | 11.5% |
| 45 to 54 Years | 202 | 12.8% |
| 55 to 64 Years | 329 | 20.8% |
| 65 to 74 Years | 398 | 25.1% |
| 75 to 84 Years | 117 | 7.4% |
| 85 Years and Over | 91 | 5.7% |
| Total | 1,584 | 100.0% |
Housing Finances in Park Layne
Median Income by Occupancy in Park Layne
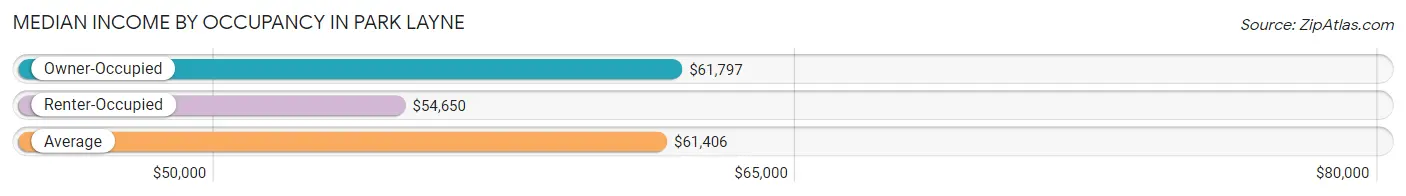
| Occupancy Type | # Households | Median Income |
| Owner-Occupied | 1,257 (79.4%) | $61,797 |
| Renter-Occupied | 327 (20.6%) | $54,650 |
| Average | 1,584 (100.0%) | $61,406 |
Occupancy by Householder Income Bracket in Park Layne
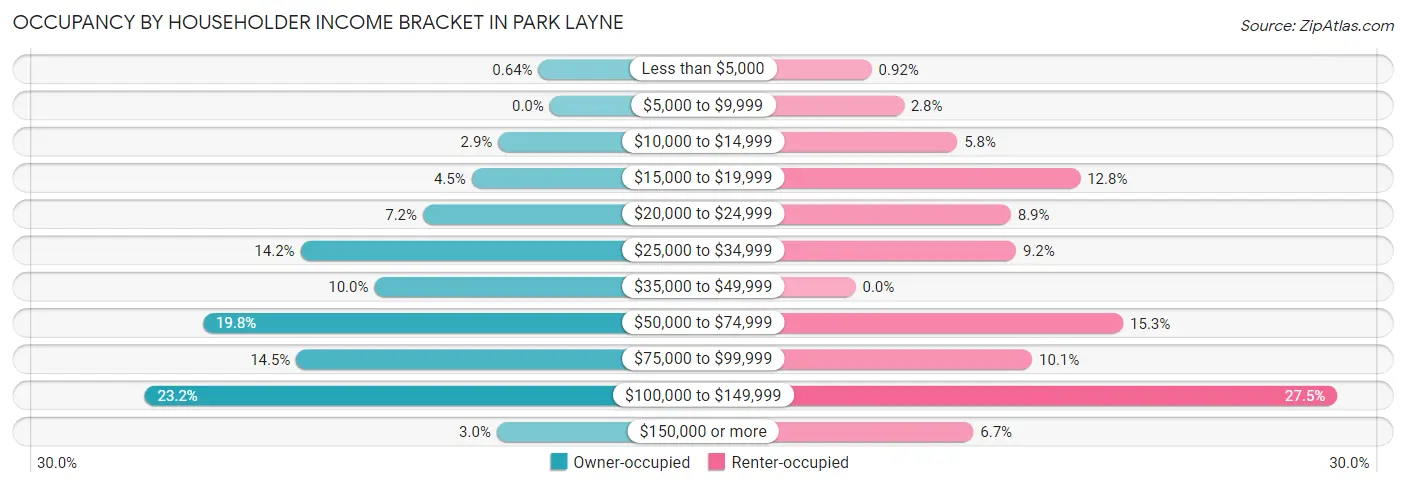
| Income Bracket | Owner-occupied | Renter-occupied |
| Less than $5,000 | 8 (0.6%) | 3 (0.9%) |
| $5,000 to $9,999 | 0 (0.0%) | 9 (2.8%) |
| $10,000 to $14,999 | 37 (2.9%) | 19 (5.8%) |
| $15,000 to $19,999 | 56 (4.5%) | 42 (12.8%) |
| $20,000 to $24,999 | 91 (7.2%) | 29 (8.9%) |
| $25,000 to $34,999 | 179 (14.2%) | 30 (9.2%) |
| $35,000 to $49,999 | 126 (10.0%) | 0 (0.0%) |
| $50,000 to $74,999 | 249 (19.8%) | 50 (15.3%) |
| $75,000 to $99,999 | 182 (14.5%) | 33 (10.1%) |
| $100,000 to $149,999 | 291 (23.2%) | 90 (27.5%) |
| $150,000 or more | 38 (3.0%) | 22 (6.7%) |
| Total | 1,257 (100.0%) | 327 (100.0%) |
Monthly Housing Cost Tiers in Park Layne
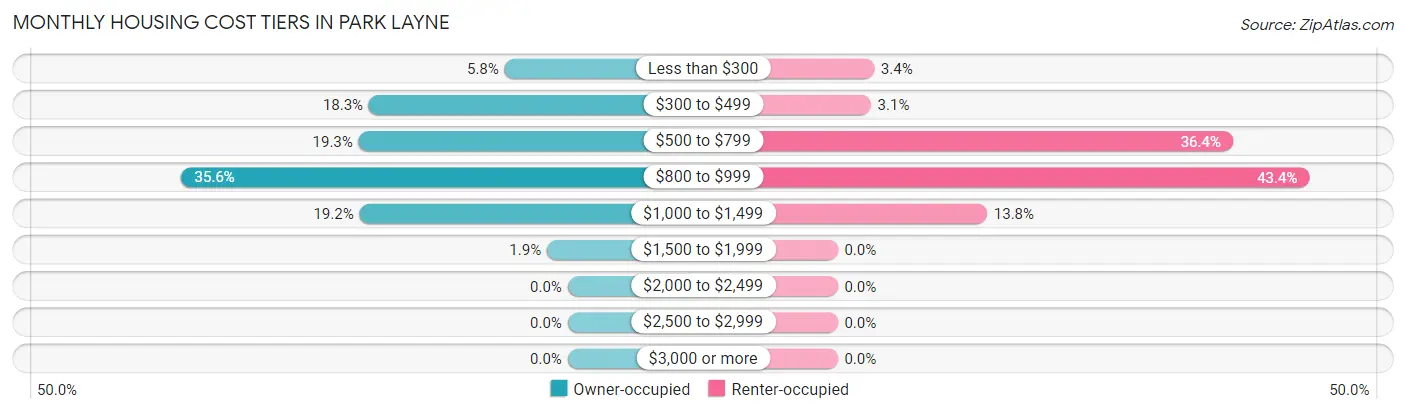
| Monthly Cost | Owner-occupied | Renter-occupied |
| Less than $300 | 73 (5.8%) | 11 (3.4%) |
| $300 to $499 | 230 (18.3%) | 10 (3.1%) |
| $500 to $799 | 242 (19.3%) | 119 (36.4%) |
| $800 to $999 | 447 (35.6%) | 142 (43.4%) |
| $1,000 to $1,499 | 241 (19.2%) | 45 (13.8%) |
| $1,500 to $1,999 | 24 (1.9%) | 0 (0.0%) |
| $2,000 to $2,499 | 0 (0.0%) | 0 (0.0%) |
| $2,500 to $2,999 | 0 (0.0%) | 0 (0.0%) |
| $3,000 or more | 0 (0.0%) | 0 (0.0%) |
| Total | 1,257 (100.0%) | 327 (100.0%) |
Physical Housing Characteristics in Park Layne
Housing Structures in Park Layne
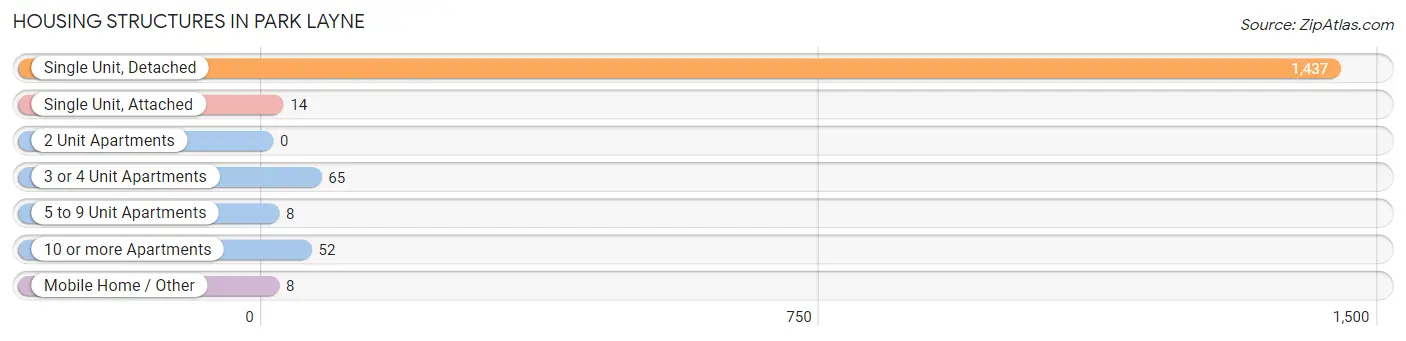
| Structure Type | # Housing Units | % Housing Units |
| Single Unit, Detached | 1,437 | 90.7% |
| Single Unit, Attached | 14 | 0.9% |
| 2 Unit Apartments | 0 | 0.0% |
| 3 or 4 Unit Apartments | 65 | 4.1% |
| 5 to 9 Unit Apartments | 8 | 0.5% |
| 10 or more Apartments | 52 | 3.3% |
| Mobile Home / Other | 8 | 0.5% |
| Total | 1,584 | 100.0% |
Housing Structures by Occupancy in Park Layne
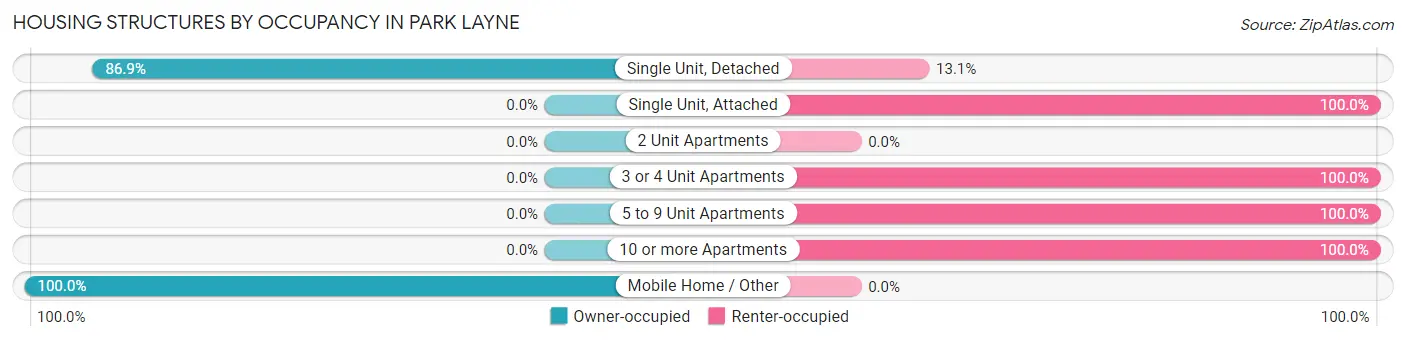
| Structure Type | Owner-occupied | Renter-occupied |
| Single Unit, Detached | 1,249 (86.9%) | 188 (13.1%) |
| Single Unit, Attached | 0 (0.0%) | 14 (100.0%) |
| 2 Unit Apartments | 0 (0.0%) | 0 (0.0%) |
| 3 or 4 Unit Apartments | 0 (0.0%) | 65 (100.0%) |
| 5 to 9 Unit Apartments | 0 (0.0%) | 8 (100.0%) |
| 10 or more Apartments | 0 (0.0%) | 52 (100.0%) |
| Mobile Home / Other | 8 (100.0%) | 0 (0.0%) |
| Total | 1,257 (79.4%) | 327 (20.6%) |
Housing Structures by Number of Rooms in Park Layne
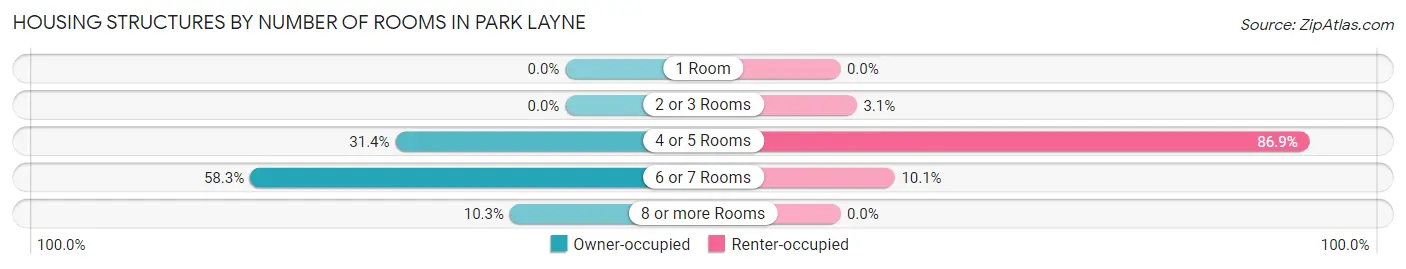
| Number of Rooms | Owner-occupied | Renter-occupied |
| 1 Room | 0 (0.0%) | 0 (0.0%) |
| 2 or 3 Rooms | 0 (0.0%) | 10 (3.1%) |
| 4 or 5 Rooms | 395 (31.4%) | 284 (86.9%) |
| 6 or 7 Rooms | 733 (58.3%) | 33 (10.1%) |
| 8 or more Rooms | 129 (10.3%) | 0 (0.0%) |
| Total | 1,257 (100.0%) | 327 (100.0%) |
Housing Structure by Heating Type in Park Layne
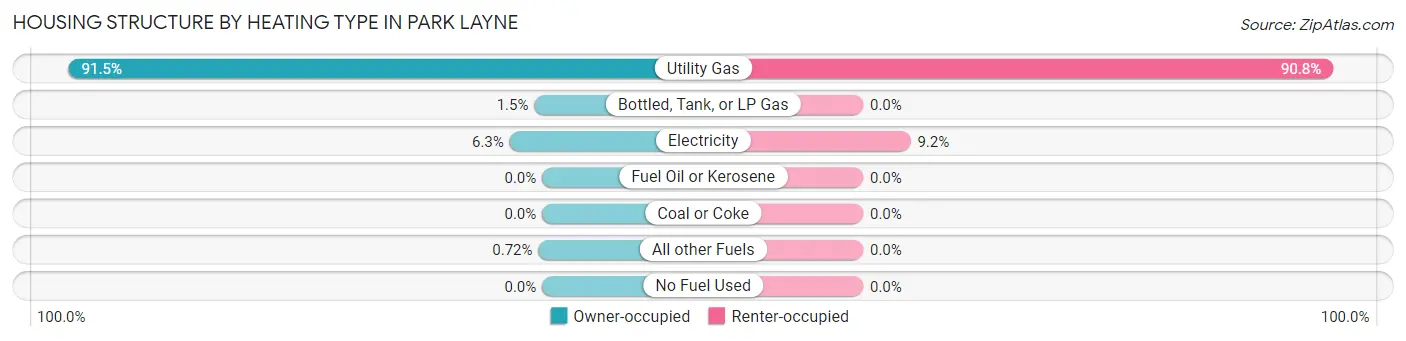
| Heating Type | Owner-occupied | Renter-occupied |
| Utility Gas | 1,150 (91.5%) | 297 (90.8%) |
| Bottled, Tank, or LP Gas | 19 (1.5%) | 0 (0.0%) |
| Electricity | 79 (6.3%) | 30 (9.2%) |
| Fuel Oil or Kerosene | 0 (0.0%) | 0 (0.0%) |
| Coal or Coke | 0 (0.0%) | 0 (0.0%) |
| All other Fuels | 9 (0.7%) | 0 (0.0%) |
| No Fuel Used | 0 (0.0%) | 0 (0.0%) |
| Total | 1,257 (100.0%) | 327 (100.0%) |
Household Vehicle Usage in Park Layne
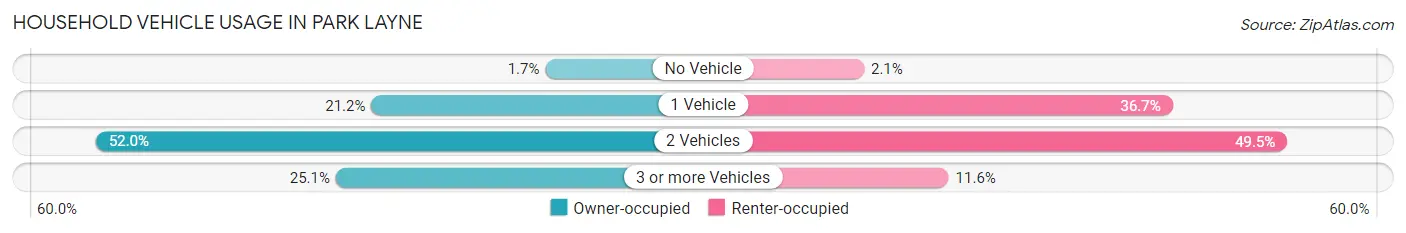
| Vehicles per Household | Owner-occupied | Renter-occupied |
| No Vehicle | 21 (1.7%) | 7 (2.1%) |
| 1 Vehicle | 266 (21.2%) | 120 (36.7%) |
| 2 Vehicles | 654 (52.0%) | 162 (49.5%) |
| 3 or more Vehicles | 316 (25.1%) | 38 (11.6%) |
| Total | 1,257 (100.0%) | 327 (100.0%) |
Real Estate & Mortgages in Park Layne
Real Estate and Mortgage Overview in Park Layne
| Characteristic | Without Mortgage | With Mortgage |
| Housing Units | 396 | 861 |
| Median Property Value | $95,900 | $107,100 |
| Median Household Income | $55,303 | $17 |
| Monthly Housing Costs | $382 | $0 |
| Real Estate Taxes | $1,234 | $11 |
Property Value by Mortgage Status in Park Layne
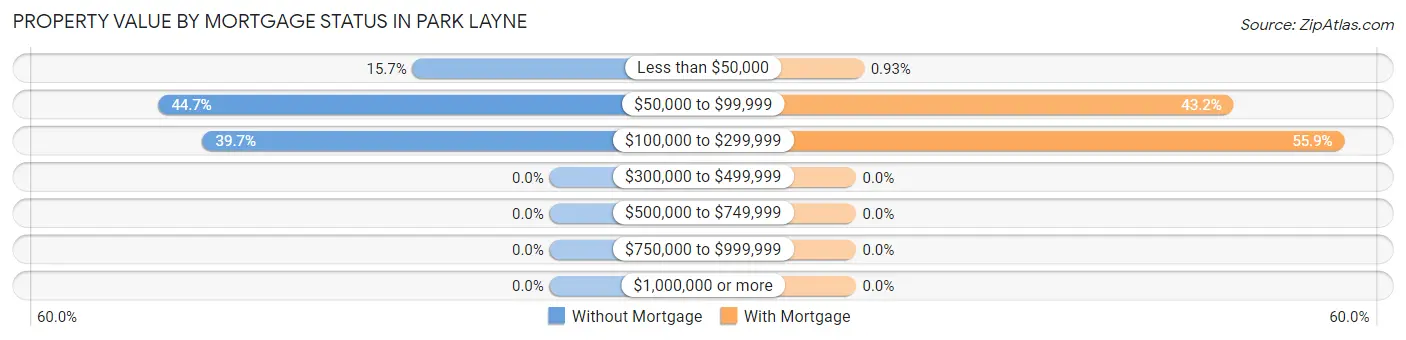
| Property Value | Without Mortgage | With Mortgage |
| Less than $50,000 | 62 (15.7%) | 8 (0.9%) |
| $50,000 to $99,999 | 177 (44.7%) | 372 (43.2%) |
| $100,000 to $299,999 | 157 (39.7%) | 481 (55.9%) |
| $300,000 to $499,999 | 0 (0.0%) | 0 (0.0%) |
| $500,000 to $749,999 | 0 (0.0%) | 0 (0.0%) |
| $750,000 to $999,999 | 0 (0.0%) | 0 (0.0%) |
| $1,000,000 or more | 0 (0.0%) | 0 (0.0%) |
| Total | 396 (100.0%) | 861 (100.0%) |
Household Income by Mortgage Status in Park Layne
| Household Income | Without Mortgage | With Mortgage |
| Less than $10,000 | 0 (0.0%) | 0 (0.0%) |
| $10,000 to $24,999 | 48 (12.1%) | 8 (0.9%) |
| $25,000 to $34,999 | 103 (26.0%) | 136 (15.8%) |
| $35,000 to $49,999 | 43 (10.9%) | 76 (8.8%) |
| $50,000 to $74,999 | 97 (24.5%) | 83 (9.6%) |
| $75,000 to $99,999 | 74 (18.7%) | 152 (17.6%) |
| $100,000 to $149,999 | 10 (2.5%) | 108 (12.5%) |
| $150,000 or more | 21 (5.3%) | 281 (32.6%) |
| Total | 396 (100.0%) | 861 (100.0%) |
Property Value to Household Income Ratio in Park Layne
| Value-to-Income Ratio | Without Mortgage | With Mortgage |
| Less than 2.0x | 252 (63.6%) | 67,344 (7,821.6%) |
| 2.0x to 2.9x | 48 (12.1%) | 512 (59.5%) |
| 3.0x to 3.9x | 48 (12.1%) | 121 (14.1%) |
| 4.0x or more | 48 (12.1%) | 65 (7.5%) |
| Total | 396 (100.0%) | 861 (100.0%) |
Real Estate Taxes by Mortgage Status in Park Layne
| Property Taxes | Without Mortgage | With Mortgage |
| Less than $800 | 43 (10.9%) | 0 (0.0%) |
| $800 to $1,499 | 196 (49.5%) | 36 (4.2%) |
| $800 to $1,499 | 141 (35.6%) | 393 (45.6%) |
| Total | 396 (100.0%) | 861 (100.0%) |
Health & Disability in Park Layne
Health Insurance Coverage by Age in Park Layne
| Age Bracket | With Coverage | Without Coverage |
| Under 6 Years | 388 (83.3%) | 78 (16.7%) |
| 6 to 18 Years | 449 (100.0%) | 0 (0.0%) |
| 19 to 25 Years | 207 (85.5%) | 35 (14.5%) |
| 26 to 34 Years | 512 (86.6%) | 79 (13.4%) |
| 35 to 44 Years | 339 (88.3%) | 45 (11.7%) |
| 45 to 54 Years | 262 (78.2%) | 73 (21.8%) |
| 55 to 64 Years | 568 (87.3%) | 83 (12.8%) |
| 65 to 74 Years | 533 (100.0%) | 0 (0.0%) |
| 75 Years and older | 308 (100.0%) | 0 (0.0%) |
| Total | 3,566 (90.1%) | 393 (9.9%) |
Health Insurance Coverage by Citizenship Status in Park Layne
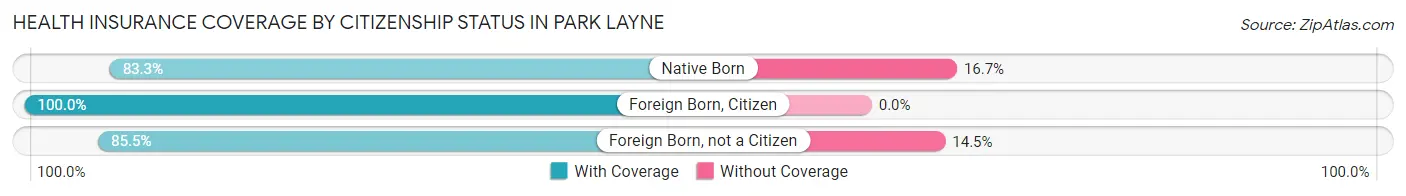
| Citizenship Status | With Coverage | Without Coverage |
| Native Born | 388 (83.3%) | 78 (16.7%) |
| Foreign Born, Citizen | 449 (100.0%) | 0 (0.0%) |
| Foreign Born, not a Citizen | 207 (85.5%) | 35 (14.5%) |
Health Insurance Coverage by Household Income in Park Layne
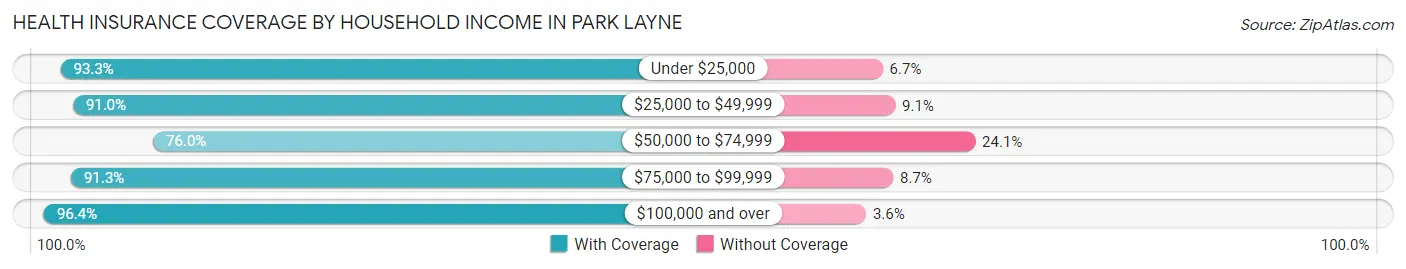
| Household Income | With Coverage | Without Coverage |
| Under $25,000 | 611 (93.3%) | 44 (6.7%) |
| $25,000 to $49,999 | 653 (90.9%) | 65 (9.0%) |
| $50,000 to $74,999 | 622 (75.9%) | 197 (24.0%) |
| $75,000 to $99,999 | 421 (91.3%) | 40 (8.7%) |
| $100,000 and over | 1,259 (96.4%) | 47 (3.6%) |
Public vs Private Health Insurance Coverage by Age in Park Layne
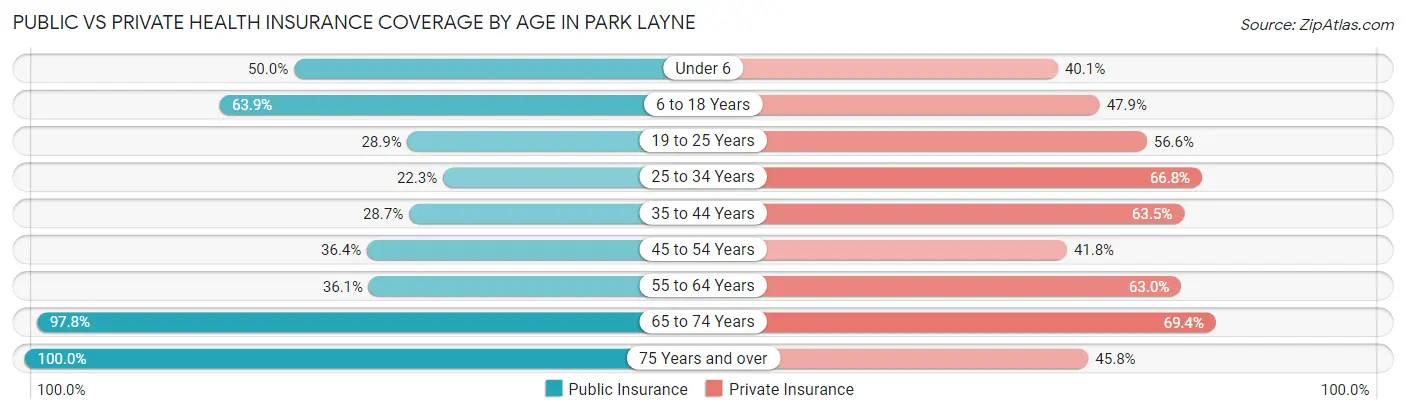
| Age Bracket | Public Insurance | Private Insurance |
| Under 6 | 233 (50.0%) | 187 (40.1%) |
| 6 to 18 Years | 287 (63.9%) | 215 (47.9%) |
| 19 to 25 Years | 70 (28.9%) | 137 (56.6%) |
| 25 to 34 Years | 132 (22.3%) | 395 (66.8%) |
| 35 to 44 Years | 110 (28.6%) | 244 (63.5%) |
| 45 to 54 Years | 122 (36.4%) | 140 (41.8%) |
| 55 to 64 Years | 235 (36.1%) | 410 (63.0%) |
| 65 to 74 Years | 521 (97.8%) | 370 (69.4%) |
| 75 Years and over | 308 (100.0%) | 141 (45.8%) |
| Total | 2,018 (51.0%) | 2,239 (56.6%) |
Disability Status by Sex by Age in Park Layne
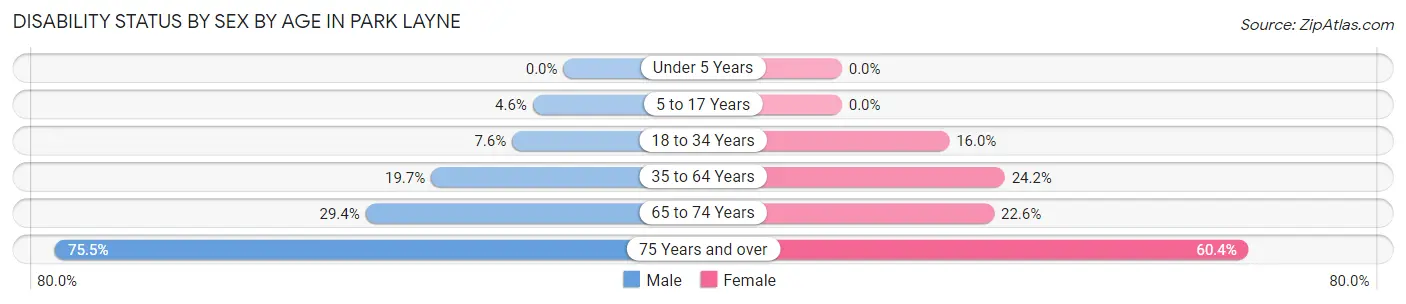
| Age Bracket | Male | Female |
| Under 5 Years | 0 (0.0%) | 0 (0.0%) |
| 5 to 17 Years | 12 (4.5%) | 0 (0.0%) |
| 18 to 34 Years | 38 (7.6%) | 63 (16.0%) |
| 35 to 64 Years | 123 (19.7%) | 180 (24.2%) |
| 65 to 74 Years | 89 (29.4%) | 52 (22.6%) |
| 75 Years and over | 80 (75.5%) | 122 (60.4%) |
Disability Class by Sex by Age in Park Layne
Disability Class: Hearing Difficulty
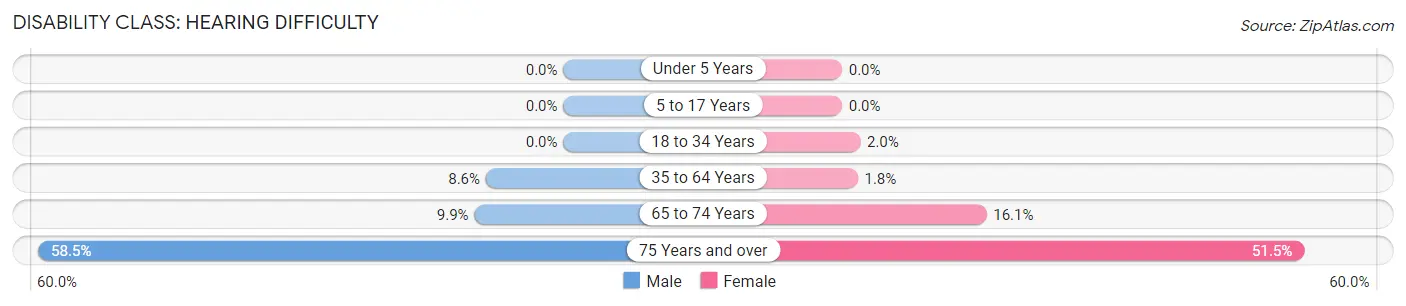
| Age Bracket | Male | Female |
| Under 5 Years | 0 (0.0%) | 0 (0.0%) |
| 5 to 17 Years | 0 (0.0%) | 0 (0.0%) |
| 18 to 34 Years | 0 (0.0%) | 8 (2.0%) |
| 35 to 64 Years | 54 (8.6%) | 13 (1.8%) |
| 65 to 74 Years | 30 (9.9%) | 37 (16.1%) |
| 75 Years and over | 62 (58.5%) | 104 (51.5%) |
Disability Class: Vision Difficulty
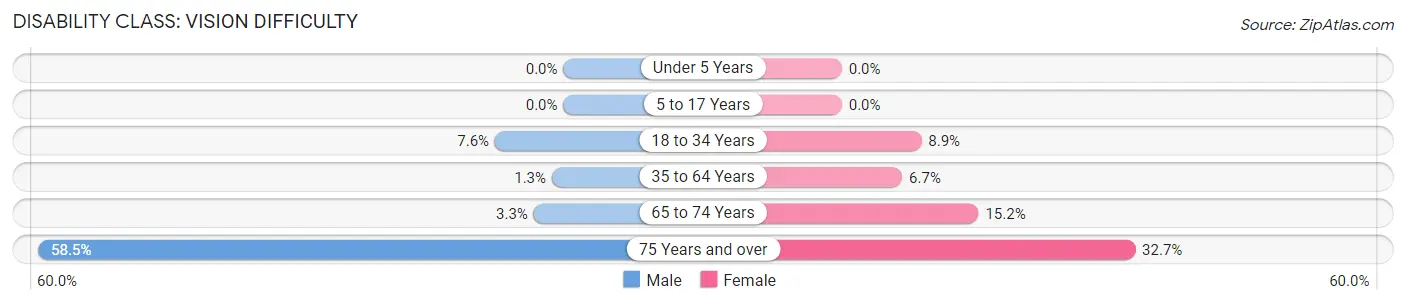
| Age Bracket | Male | Female |
| Under 5 Years | 0 (0.0%) | 0 (0.0%) |
| 5 to 17 Years | 0 (0.0%) | 0 (0.0%) |
| 18 to 34 Years | 38 (7.6%) | 35 (8.9%) |
| 35 to 64 Years | 8 (1.3%) | 50 (6.7%) |
| 65 to 74 Years | 10 (3.3%) | 35 (15.2%) |
| 75 Years and over | 62 (58.5%) | 66 (32.7%) |
Disability Class: Cognitive Difficulty
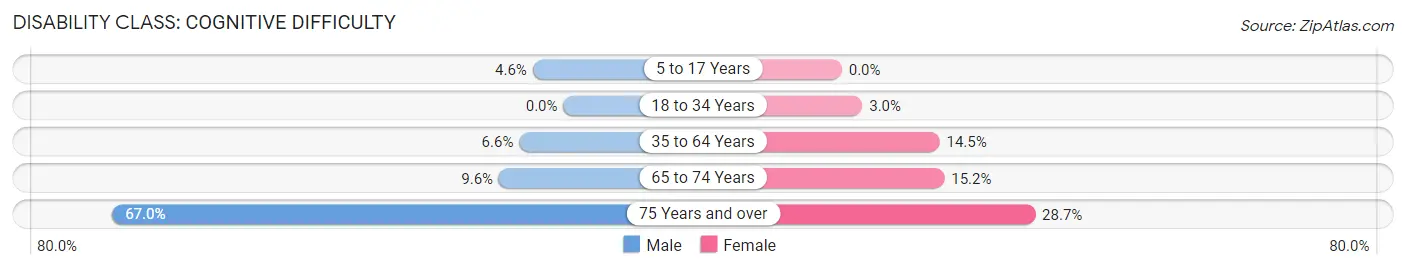
| Age Bracket | Male | Female |
| 5 to 17 Years | 12 (4.5%) | 0 (0.0%) |
| 18 to 34 Years | 0 (0.0%) | 12 (3.0%) |
| 35 to 64 Years | 41 (6.6%) | 108 (14.5%) |
| 65 to 74 Years | 29 (9.6%) | 35 (15.2%) |
| 75 Years and over | 71 (67.0%) | 58 (28.7%) |
Disability Class: Ambulatory Difficulty
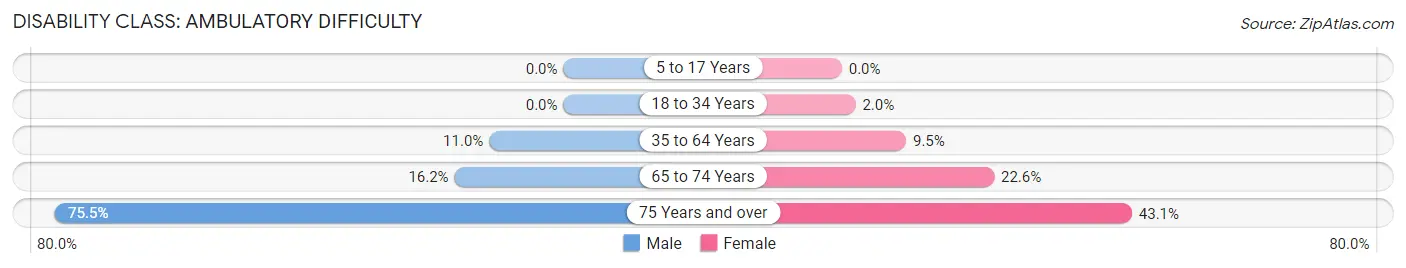
| Age Bracket | Male | Female |
| 5 to 17 Years | 0 (0.0%) | 0 (0.0%) |
| 18 to 34 Years | 0 (0.0%) | 8 (2.0%) |
| 35 to 64 Years | 69 (11.0%) | 71 (9.5%) |
| 65 to 74 Years | 49 (16.2%) | 52 (22.6%) |
| 75 Years and over | 80 (75.5%) | 87 (43.1%) |
Disability Class: Self-Care Difficulty
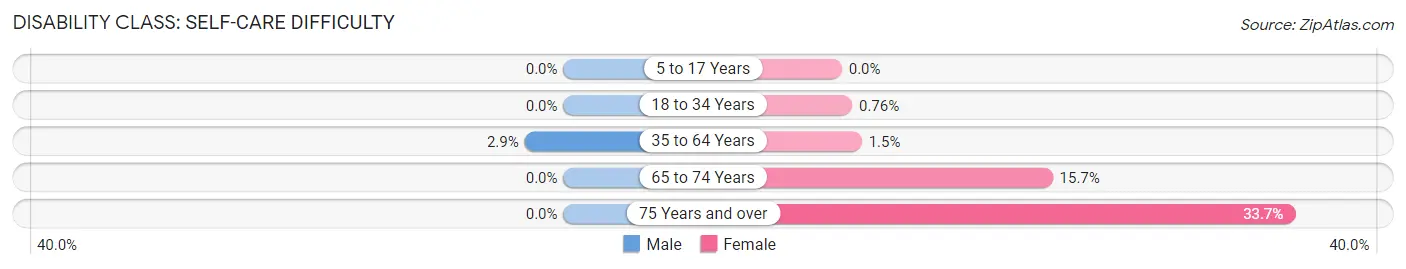
| Age Bracket | Male | Female |
| 5 to 17 Years | 0 (0.0%) | 0 (0.0%) |
| 18 to 34 Years | 0 (0.0%) | 3 (0.8%) |
| 35 to 64 Years | 18 (2.9%) | 11 (1.5%) |
| 65 to 74 Years | 0 (0.0%) | 36 (15.7%) |
| 75 Years and over | 0 (0.0%) | 68 (33.7%) |
Technology Access in Park Layne
Computing Device Access in Park Layne
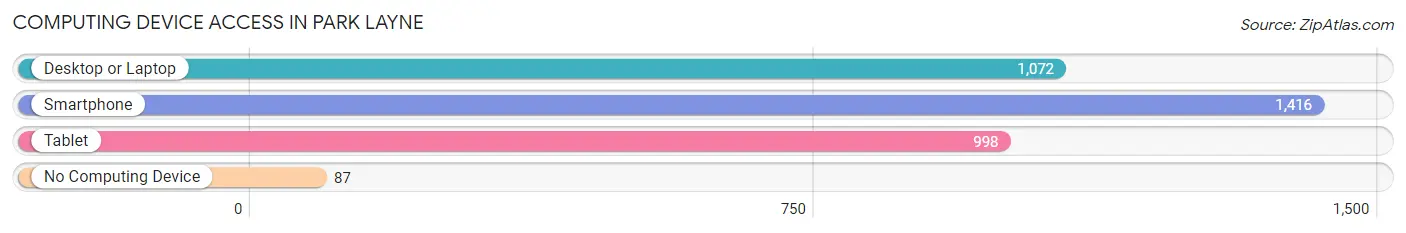
| Device Type | # Households | % Households |
| Desktop or Laptop | 1,072 | 67.7% |
| Smartphone | 1,416 | 89.4% |
| Tablet | 998 | 63.0% |
| No Computing Device | 87 | 5.5% |
| Total | 1,584 | 100.0% |
Internet Access in Park Layne
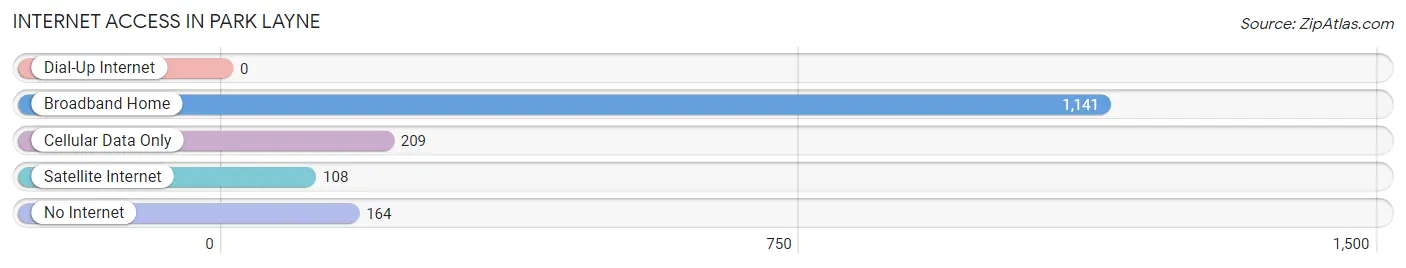
| Internet Type | # Households | % Households |
| Dial-Up Internet | 0 | 0.0% |
| Broadband Home | 1,141 | 72.0% |
| Cellular Data Only | 209 | 13.2% |
| Satellite Internet | 108 | 6.8% |
| No Internet | 164 | 10.3% |
| Total | 1,584 | 100.0% |
Park Layne Summary
History
The small village of Park Layne, Ohio is located in the southwestern part of the state, in the county of Clark. It is situated on the banks of the Mad River, and is part of the Dayton Metropolitan Statistical Area. The village was first settled in 1817 by a group of settlers from Pennsylvania, who were looking for a place to call home. The village was originally known as “Layne’s Park”, after the first settler, John Layne. The name was eventually shortened to Park Layne.
The village was incorporated in 1837, and the first mayor was elected in 1838. The village was a small farming community, and the main crops were corn, wheat, and oats. The village also had a few small businesses, such as a general store, a blacksmith, and a sawmill.
In the late 1800s, the village began to grow and develop. The railroad came to Park Layne in 1881, and the village was connected to the larger cities of Dayton and Springfield. This allowed for the growth of industry in the area, and the village began to attract more people.
The village continued to grow and develop throughout the 20th century. In the 1950s, the village was home to a number of small businesses, including a grocery store, a hardware store, and a gas station. The village also had a post office, a bank, and a library.
Geography
Park Layne is located in the southwestern part of the state of Ohio, in the county of Clark. It is situated on the banks of the Mad River, and is part of the Dayton Metropolitan Statistical Area. The village is located approximately 25 miles from the city of Dayton, and is about 10 miles from the city of Springfield.
The village is situated in a rural area, and is surrounded by farmland. The terrain is mostly flat, with some rolling hills. The climate is temperate, with hot summers and cold winters. The average annual temperature is around 50 degrees Fahrenheit.
Economy
The economy of Park Layne is largely based on agriculture. The village is home to a number of small farms, which produce corn, wheat, and oats. The village also has a few small businesses, such as a grocery store, a hardware store, and a gas station.
The village is also home to a number of manufacturing companies, which produce a variety of products, such as furniture, clothing, and automotive parts. The village is also home to a number of service-based businesses, such as restaurants, hotels, and auto repair shops.
Demographics
As of the 2010 census, the population of Park Layne was 1,845. The population is mostly white (94.3%), with a small percentage of African Americans (2.3%), Hispanics (1.7%), and Asians (1.2%). The median household income is $45,000, and the median age is 40.
The village is home to a number of churches, including the Park Layne United Methodist Church, the Park Layne Baptist Church, and the Park Layne Christian Church. The village also has a public library, a post office, and a bank.
Conclusion
Park Layne is a small village located in the southwestern part of the state of Ohio. It is situated on the banks of the Mad River, and is part of the Dayton Metropolitan Statistical Area. The village was first settled in 1817, and has since grown and developed into a small farming community. The village is home to a number of small businesses, and is also home to a number of manufacturing companies. The population of Park Layne is mostly white, with a small percentage of African Americans, Hispanics, and Asians. The median household income is $45,000, and the median age is 40.
Common Questions
What is the Total Population of Park Layne?
Total Population of Park Layne is 3,974.
What is the Total Male Population of Park Layne?
Total Male Population of Park Layne is 1,913.
What is the Total Female Population of Park Layne?
Total Female Population of Park Layne is 2,061.
What is the Ratio of Males per 100 Females in Park Layne?
There are 92.82 Males per 100 Females in Park Layne.
What is the Ratio of Females per 100 Males in Park Layne?
There are 107.74 Females per 100 Males in Park Layne.
What is the Median Population Age in Park Layne?
Median Population Age in Park Layne is 41.0 Years.
What is the Average Family Size in Park Layne
Average Family Size in Park Layne is 2.8 People.
What is the Average Household Size in Park Layne
Average Household Size in Park Layne is 2.5 People.
What is Per Capita Income in Park Layne?
Per Capita income in Park Layne is $27,984.
What is the Median Family Income in Park Layne?
Median Family Income in Park Layne is $62,885.
What is the Median Household income in Park Layne?
Median Household Income in Park Layne is $61,406.
What is Income or Wage Gap in Park Layne?
Income or Wage Gap in Park Layne is 28.5%.
Women in Park Layne earn 71.5 cents for every dollar earned by a man.
What is Inequality or Gini Index in Park Layne?
Inequality or Gini Index in Park Layne is 0.37.
How Large is the Labor Force in Park Layne?
There are 2,035 People in the Labor Forcein in Park Layne.
What is the Percentage of People in the Labor Force in Park Layne?
64.3% of People are in the Labor Force in Park Layne.
What is the Unemployment Rate in Park Layne?
Unemployment Rate in Park Layne is 1.4%.